Embed Size (px)
Citation preview

Neural Response Correlates of Detectionof Monaurally and Binaurally CreatedPitches in Humans
Maria Chait1, David Poeppel1,2,3 and Jonathan Z. Simon1,3,4
1Neuroscience and Cognitive Science Program, University of
Maryland, College Park, MD, USA, 2Department of Linguistics,
University of Maryland, College Park, MD, USA, 3Department of
Biology, University of Maryland, College Park, MD, USA and4Department of Electrical and Computer Engineering,
University of Maryland, College Park, MD, USA
Recent magnetoencephalography (MEG) and functional magneticresonance imaging studies of human auditory cortex are pointing tobrain areas on lateral Heschl’s gyrus as the ‘pitch-processing center’.Here we describe results of a combined MEG-psychophysicalstudy designed to investigate the timing of the formation of thepercept of pitch and the generality of the hypothesized ‘pitch-center’. We compared the cortical and behavioral responses toHuggins pitch (HP), a stimulus requiring binaural processing to elicita pitch percept, with responses to tones embedded in noise(TN)—perceptually similar but physically very different signals.The stimuli were crafted to separate the electrophysiologicalresponses to onset of the pitch percept from the onset of theinitial stimulus. Our results demonstrate that responses to monauralpitch stimuli are affected by cross-correlational processes in thebinaural pathway. Additionally, we show that MEG illuminatesprocesses not simply observable in behavior. Crucially, the MEGdata show that, although physically disparate, both HP and TN aremapped onto similar representations by 150 ms post-onset, andprovide critical new evidence that the ‘pitch onset response’reflects central pitch mechanisms, in agreement with modelspostulating a single, central pitch extractor.
Keywords: auditory cortex, auditory evoked response, binaural system,dichotic pitch, M100, MEG
Introduction
Pitch, one of the most salient features evoked by sound, is
crucial to our ability to process voiced speech, segregate
auditory streams, and enjoy music. Despite the importance of
pitch, the mechanisms responsible for its extraction, as well as
their location in the brain, are a matter of debate. The
information necessary for the computation of pitch of some
signals is available as early as the auditory nerve of either ear
(Cariani and Delgutte, 1996; Moore, 1997). Others require
combination of information from both ears within a central
pitch processor. Houtsma and Goldstein (1971) demonstrated
that the ‘missing fundamental’ effect (a harmonic complex tone
has a pitch determined by its repetition rate even if a sinusoidal
component at that frequency — the fundamental — is not
physically present in the signal) can occur even when harmon-
ics are played to different ears. This suggests that the ‘pitch
extractor’ for such stimuli resides at or above the level of the
superior olivary complex (SOC), where the information from
the two ears is first combined. On the other hand, binaural
interaction is not required for other stimuli and it has been
suggested that both monaural and binaural pitch mechanisms
might exist (e.g. Carlyon et al., 2001; see reviews in Moore,
1997; de Cheveigne, 2005).
Pitch processing in humans has primarily been studied via
psychophysics (see Moore, 1997; Plack et al., 2005). These
studies have been augmented by brain imaging research carried
out with functional magnetic resonance imaging (fMRI)/posi-
tron emission tomography (PET) (Griffiths et al., 1998a;
Patterson et al., 2002; Penagos et al., 2004) and electroenceph-
alography (EEG)/magnetoencephalography (MEG) (Pantev
et al., 1996; Fujioka et al., 2003; Krumbholz et al., 2003;
Gutschalk et al., 2004; Ritter et al., 2005). Evidence from
several studies (Patterson et al., 2002; Penagos et al., 2004;
Ritter et al., 2005) points to an area immediately antero-lateral
to primary auditory cortex (PAC) as the area where pitch
extraction-related processes may operate. These have recently
been complemented by similar findings in animal electrophys-
iology (Bendor and Wang, 2005).
Whereas fMRI and PET are well suited to address questions
related to where processing occurs, MEG excels in the in-
vestigation of the time course of processing. In the present
study we combine a crafted auditory stimulus, Huggins pitch
(HP), with the high temporal resolution of MEG recording, to
investigate aspects of the processing of pitch information in
cortex. Specifically, we investigate the timing of the response to
tonal targets within background noise. Huggins pitch (Cramer
and Huggins, 1958) is the auditory counterpart of the more
famous ‘random dot stereogram’ (RDS) effect in vision (Julesz,
1971). An RDS is a binocularly presented pair of images with
randomly distributed dots. Each image appears featureless when
viewed individually but together they evoke a coherent 3D
percept when displayed simultaneously, one to each eye. The
illusion is created by presenting identical RDSs to the two eyes
except that one image contains a group of dots that are slightly
shifted relative to the other. The visual system fuses the shifted
and non-shifted dots to create a 3D percept of an image
(corresponding to the shifted dots) floating above the back-
ground (of the unshifted dots). Similarly in audition, if a random
broadband noise signal is presented to one ear, and the same
random noise — but with a phase shift of p over a narrow
frequency band — is presented to the other ear, this results in
the perception of a faint tonal object with a pure tone quality
(with a pitch that matches the center frequency of the phase-
shifted band), embedded in noise (Fig. 1). It is crucial that the
input to either ear alone is just white noise, completely lacking
any spectral or temporal cues to pitch. The fact that we are
nevertheless able to perceive pitch when the two signals are
presented dichotically implies that the HP percept is created by
a central mechanism that receives the inputs from the two ears,
collates them, and derives from the correspondence the
percept of a tone. Here we compare the cortical auditory
evoked responses to HP to a stimulus that is physically different
� The Author 2005. Published by Oxford University Press. All rights reserved.
For permissions, please e-mail: [email protected]
Cerebral Cortex June 2006;16:835--848
doi:10.1093/cercor/bhj027
Advance Access publication September 8, 2005

but nonetheless elicits a very similar percept: a pure tone
embedded in noise (TN).
For our tonal stimuli, we chose four frequencies, ranging from
200 to 1000 Hz. The HP signals were generated by inverting
a narrow spectral region of a noise sample in one ear, centered
about the tonal frequency, while the original sample is delivered
to the other. The corresponding TN signals were produced by
adding a pure tone (with amplitude chosen to match the
perceived tone loudness of the corresponding HP stimulus) to
the original noise signal. Matched TN and HP stimuli result in
a very similar perceptual experience.
Experimentally it is important to isolate the processing that is
specific to the detection of the onset of a tonal stimulus from
that associated with generic stimulus onset. Typically this
involves comparing responses to noise and tone-like stimuli.
However, the large onset component common to both reduces
the sensitivity to the tone-specific component. To attenuate this
problem, noise was prepended to the TN and HP signals, so that
the tonal response can be measured at the transition from noise
to TN or HP, after the stimulus onset response has subsided.
Conceptually, the transition response can be seen as evoked by
the emergence of a tone-like target within a noise background.
In order to investigate the degree to which binaural mecha-
nisms affect the cortical response, the prepended noise was
interaurally correlated in experiment 1 (Exp1) and interaurally
uncorrelated in experiment 2 (Exp2; Fig. 2).
The physical differences between HP and TN are explained in
Figure 3. Whereas the TN stimuli evoke patterns that can be
detected monaurally as early as the auditory nerve (Fig. 3B), the
HP stimuli are indistinguishable from white noise (Fig. 3C) up to
the level of the medial superior olive (MSO), where phase and
timing information from the two ears are first compared (Carr,
1993; Joris et al., 1998). Because HP stimuli are totally devoid of
any spectral structure at each ear, they rule out the possibility
that their pitch results from spectral processing at the level of
the cochlea, auditory nerve or cochlear nucleus. Several studies
(Griffiths et al., 1998a, 2001; Patterson et al., 2002; Krumbholz
et al., 2003; Ritter et al., 2005) used a monaural stimulus with
characteristics that resemble white noise, iterated rippled noise
(IRN), to identify a hypothesized ‘pitch center’ in Heschl’s gyrus
(HG) whose activation increased with the degree of temporal
regularity in the signal. Noise-like IRN stimuli are intended to
reduce the likelihood that the response is related to changes of
a tonotopic representation of the stimulus. However, this is true
only if the iteration frequency is sufficiently low, or the stimulus
is high-pass filtered to avoid resolution of spectral components
within the cochlea. HP has no such constraint, and offers the
advantage over IRN that spectral cues can be avoided over
a range of parameters more typical of salient and musical pitch
(Akeroyd et al., 2001).
The requirement for binaural processing before pitch extrac-
tion puts constraints on the available mechanisms, as processing
can occur no earlier than the site of binaural convergence. By
ruling out cues in the periphery, HP stimuli can be used to
investigate the generality of the ‘pitch center’, as proposed by
accumulating literature, as well as to refine our interpretation of
auditory evoked responses. The M100 or N1 peak (for MEG and
EEG, respectively) is the most prominent auditory evoked
response. It occurs ~100 ms after the onset of a stimulus and
is thought to originate from the planum temporale (PT;
Lutkenhoner and Steinstrater,1998). The latency and localiza-
tion of the M100 have been shown to vary with stimulus
parameters that determine pitch (Pantev et al., 1989, 1996;
Ragot and Lepaul-Ercole, 1996; Roberts and Poeppel, 1996;
Fujioka et al., 2003) and it has been hypothesized to reflect
stimulus encoding (Salajegheh et al., 2004). Recently, Krumb-
holz et al. (2003) identified a magnetic deflection (the ‘pitch
onset response’, POR) which shares some neural generators
with the M100 (Seither-Priesler et al., 2004) and is evoked by
a transition from noise to iterated rippled noise (IRN). The
latency and amplitude of the POR were found to be dependent
on the strength and pitch of the IRN stimulus, similarly to
Figure 1. Generation of the Huggins pitch stimuli. (A) The signals were created byintroducing a constant phase shift of p in a narrow spectral region of the noise sampledelivered to the right ear, while the original sample was delivered to the left ear (notethat the particular ear that received the phase shifted noise is of no significance).(B) Schematic of the phase and magnitude responses of the all pass filter. The pitch ofthe perceived tonal object corresponds to the center of the phase-shifted band.
Figure 2. Schema of the stimuli used in the two experiments. (A) Stimuli for Exp1consisted of 1500 ms of correlated wide-band noise (dark grey) with a 500 ms fainttonal object (HP/TN; black line) appearing at 1000 ms post-onset. Control stimuli were1500 ms long correlated wide-band noise. (B) Stimuli for Exp2 consisted of 1000 mslong uncorrelated wide-band noise (light grey) followed by a 500 ms long correlatednoise segment which either contained a tonal object (target condition) or did not(control condition). Crucially, the last 500 ms of the stimuli of Exp1 and Exp2 wereidentical.
836 MEG of Monaural and Binaural Pitch d Chait et al.
findings discussed extensively in the M100 literature. The
latency of the M100 onset response to pure tones varies with
the tone’s frequency such that low frequencies evoke field
responses ~30 ms later than high frequencies (Roberts et al.,
2000; Lutkenhoner et al., 2001). The period-dependency of
latency has been attributed to differences in cochlear traveling
wave delays (Greenberg et al., 1998; Borgmann et al., 2001) or
latency differences between neural channels with different
characteristic frequencies. By this account HP should not
exhibit the same trends. Thus comparisons of auditory evoked
responses to HP and TN stimuli enable us to test predictions
about the architecture of the processing up to and including
auditory cortex, and to determine at which point the percep-
tually similar but physically different stimuli converge on a single
representation.
In our experimental paradigm subjects performed a pitch
detection task while their brain activity was being recorded.
The simultaneous recording of behavioral reaction times and
MEG response latencies enables the investigation of the
dynamics of the construction of perceptual representations
and the degree of correspondence between behavioral and
electrophysiological measures. The results reported here have
important implications in several domains: in addition to posing
new constraints for models of pitch and revealing neural
processes associated with the extraction of tonal objects from
noise, our data have specific and new implications for binaural
processing mechanisms. Importantly, we also demonstrate that,
even in humans, electrophysiological tools can measure pro-
cesses not observable by behavioral, psychophysical means.
Materials and Methods
SubjectsTwenty subjects (mean age 24.6 years), took part in Exp1. Sixteen
subjects (mean age 23.8 years) took part in Exp2. Twelve listeners
participated in both experiments. Five subjects (from Exp1; mean age
26.6 years) took part in the control experiment for Exp1. All subjects
were right handed (Oldfield, 1971), reported normal hearing and had no
history of neurological disorder. The experimental procedures were
approved by the University of Maryland institutional review board and
written informed consent was obtained from each participant. Subjects
were paid for their participation.
StimuliWe chose four center frequencies (200, 400, 600, 1000 Hz) that span
the frequency region for which HP is salient. A 1000 ms sample of
‘frozen’ noise was generated for each of these four conditions. The
signals were created by choosing Gaussian distributed numbers (sam-
pling frequency = 16 kHz, bandwidth = 8 kHz). The HP signals were
generated by introducing a constant phase shift of p in a particular
spectral region of the noise sample delivered to the right ear, while the
original sample was delivered to the left ear (Yost et al., 1987). The
width of the phase-shifted band was set to ±6% of its center frequency
(Klein and Hartmann, 1981). The corresponding TN signals were
produced by adding a pure tone (with one of the above frequencies)
to the same noise samples used to create the HP stimuli. Listeners
are able to match the HP signal to the pitch evoked by a pure tone
Figure 3. Physical properties of HP and TN. Power spectral density (L5 left ear; R5 right ear) was computed for (A) 1000 ms correlated noise stimulus; (B) 500 ms 1000 Hz TNstimulus; (C) 500 ms 1000 Hz HP stimulus; and (D) 1000 ms uncorrelated noise stimulus. Pitch information for the TN (but not HP) stimuli is available monaurally at the input to thecochlea (see red circles in B). Physiological evidence indicates that MSO neurons may act as interaural cross-correlators (Joris et al., 1998). (E--H) Binaural cross-correlograms forthe stimuli in (A--D), which model MSO activation as a neural array arranged by best frequency and best interaural delay (from �3500 to þ3500 ls). The plots illustrate the long-term time average of the activity within such an array that would be evoked by our stimuli. The neuronal activation due to correlated noise is shown in (E): peaks at certain delays(main peak at zero ITD with side peaks spaced according to the neuronal best frequency) and troughs at others: some cells respond strongly to this stimulus (peaks) while othersrespond weakly (troughs). Activation due to TN1000 (F) is very similar to the correlated noise activation, except for mildly increased activation of already active neurons with bestfrequency of 1000 Hz (see arrow). In contrast, the HP1000 activation (G) differs sharply from the correlated noise activation—many neurons inactive under correlated noise becomeactive under HP, due to the interaural phase shift in HP (see arrow). The uncorrelated noise stimulus (H) does not activate the MSO as strongly as correlated noise (cf. Polyakov andPratt, 1998) and the activation is effectively random. The correlograms were generated using the ‘binaural toolbox’ (Akeroyd, 2001). The signal is fed through a filter-bank (100--2000 Hz with filter spacing 2/ERB) and half wave rectified. Left and right filter outputs are cross-multiplied and normalized by the average power in the two filter outputs.
Cerebral Cortex June 2006, V 16 N 6 837

(with a frequency that corresponds to the center of the phase-shifted
band) with a standard error of ~3% (Klein and Hartmann, 1981). Three
versions of each TN stimulus were created: (i) TNcenter — perceived in
the center of the head (same amplitude of pure tone to both ears); (ii)
TNright — lateralized to the right (amplitude in the right ear higher than
the left ear by ~5 dB); and (iii) TNleft — lateralized to the left (amplitude
in the left ear higher than the right ear by ~5 dB). The amplitude of the
pure tone signal was separately adjusted by two listeners to match the
‘perceived tone’ loudness of the corresponding HP stimulus, resulting in
a signal to noise ratio (SNR) of ~10 dB (see Fig. 3A--D). The match was
verified for each subject in the beginning of the experiment.
The stimuli in Exp1 were 1500 ms long, consisting of 1000 ms
interaurally correlated white noise followed by either HP or TN, as
described above, or interaurally correlated noise (control). The stimuli of
Exp2 were identical to those of Exp1 except that the first 1000 ms of all
stimuli were replaced by interaurally uncorrelated noise (Fig. 2). The
stimuli of the control experiment consisted of 1000 ms interaurally
correlated white noise followed by the same noise used to generate the
HP stimuli butwithone (narrow)band amplified (noise band stimuli, BN).
The amplified bands have the same bandwidth as the phase shifted region
in the correspondingHP stimulus, but no interaural phase difference. The
loudness of the pitch in the BN stimuli was separately adjusted by two
listeners to match the perceived loudness of the TN stimuli.
When HP is perceived, the background noise is always lateralized to
the center of the head but the tonal object may be reported as being at
a lateral position away from the midline. It is lateralized to the left or to
the right by some listeners but mostly evokes an inconsistent (ambig-
uous) lateralization, especially by inexperienced listeners (Yost et al.,
1987; Zhang and Hartmann, 2004). For the purpose of making the TN
and HP stimuli as perceptually similar as possible, prior to the beginning
of the MEG experiment proper, each listener’s lateralization of HP was
assessed. HP stimuli as well as TNcenter, TNleft, and TNright stimuli of the
different frequencies were presented in a random order (all stimuli
were preceded by correlated or uncorrelated noise, in Exp1 and 2
respectively). Each condition was presented five times (giving a total of
80 trials). For each stimulus, the subjects were asked to indicate the
perceived location of the tonal object. In cases when subjects were
consistent at lateralizing the HP stimuli to the left (three subjects in
Exp1, 5 in Exp2) or right (one in Exp1, three in Exp2), the correspond-
ing TNleft or TNright stimuli were chosen for the MEG experiment. If the
subjects were inconsistent or indicated that HP was heard in the center,
TNcenter was chosen. Lateralization could also have been obtained by
introducing an interaural time difference (ITD), but this would have
engaged binaural masking level difference (BMLD) mechanisms similar
to those that occur for HP (see discussion). We decided to introduce an
interaural level difference (ILD) instead so as to simplify the interpre-
tation of HP/TN differences.
The stimuli were created offline, gated on and off using 15 ms cosine-
squared ramps (with no gating in the transition at 1000 ms post-onset),
and saved in 16-bit stereo WAV format at a sampling rate of 16 kHz. The
signals were delivered to the subjects’ ears with a tubephone (E-A-
RTONE 3A 50 X, Etymotic Research, Inc), attached to E-A-RLINK foam
plugs inserted into the ear-canal and presented at ~75 dB SPL, to ensure
a salient pitch. HP saliency increases with increasing noise level
(Durlach, 1962).
In total each subject heard 100 presentations of each of the eight
pitch conditions (HP 200, 400, 600, 1000 Hz; TN 200, 400, 600, 1000 Hz)
and 800 (50% of all) presentations of the control stimulus. The order of
presentations was randomized, with the inter-stimulus interval (ISI)
semi-randomized between 500 and 2000 ms (depending on the
subject’s RT).
ProcedureSubjects lay supine inside a magnetically shielded room. Before the
recording began, each subject’s HP lateralization was assessed as
described above and the appropriate stimuli were selected. The
recording (~1.5 h) consisted of two parts. First (pre-experiment)
subjects listened to 200 repetitions of a 1 kHz 50 ms sinusoidal tone
(ISI randomized between 750 and 1550 ms). These responses were used
to verify that signals from auditory cortex had a satisfactory SNR. In the
second part of the experiment, subjects, who were not informed about
the existence of different types (HP versus TN) of tonal stimuli,
performed a pitch detection task (50% of the trials) by pressing a button,
held in the right hand, as soon as they heard a tone popping out of the
noise. Reaction times (RT) and accuracy scores were stored and
analyzed. Exit interviews showed that subjects were unaware of the
existence of different (HP versus TN) tonal stimuli.
For the purposes of relative (i.e. no MR overlay) source localization,
five electromagnetic coils were attached to the head of 14 participants
in Exp1 prior to the MEG measurement. The locations of the coils were
calculated with respect to anatomical landmarks on the scalp using 3D
digitizer software (Source Signal Imaging, Inc.) and digitizing hardware
(Polhemus, Inc.). In order to transform the MEG measurements into
each participant’s individual head coordinate system, the coils were also
localized with respect to the MEG sensors. A 3D head-shape, used to
estimate a spherical head model for each participant, was also acquired
during digitization.
Neuromagnetic Recording and Data AnalysisThe magnetic signals were recorded using a 160-channel, whole-head
axial gradiometer system (KIT, Kanazawa, Japan). The data for the pre-
experiment were acquired with a sampling rate of 1000 Hz, filtered
online between 1 and 58.8 Hz, baseline corrected to the 100 ms pre-
onset interval and stored in 500 ms (100 ms pre-onset) stimulus-related
epochs. The data for Exp1, Exp2 and the control experiment were
acquired continuously with a sampling rate of 1 kHz, filtered online
between 1 and 200 Hz, with a notch at 60 Hz, and stored for later
analysis. Effects of environmental magnetic fields were reduced based
on several sensors distant from the head using the CALM algorithm
(Adachi et al., 2001), and responses were then smoothed by low pass
filtering with cutoff at 55 Hz.
In the pre-experiment, auditory evoked responses to the onset of the
pure tones were examined and the M100 response was identified for
each subject as a dipole-like pattern (i.e. a source/sink pair) in the
magnetic field contour plots distributed over the temporal region of
each hemisphere. For each subject, the 20 strongest channels at the
peak of the M100 (five in each sink and source, yielding 10 in each
hemisphere) were considered to best reflect activity in the auditory
cortex and thus chosen for the analysis of the experimental data (Fig. 4).
In Exp1 and 2, 1500 ms long epochs (50 ms pre onset) were created
for each of the nine stimulus conditions. Epochs with amplitudes >3 pT
(~10%) were considered artifactual and discarded. The rest were
averaged, low-pass filtered at 20 Hz and baseline corrected to the full
range of the epoch. In each hemisphere, the root mean square (RMS) of
the field strength across the 10 channels, selected in the pre-experi-
ment, was calculated for each sample point. Eighteen RMS time series,
one for each condition and each hemisphere, were thus created for
each subject. To evaluate congruity across subjects, the individual RMS
time series were combined into 18 group-RMS (RMS of individual RMSs)
time series. Consistency of peaks in each group-RMS was automatically
assessed with the Bootstrap method (1000 iterations; balanced; Efron
Figure 4. Channel selection from the pre-experiment. Different channels were chosenfor each individual subject depending on their M100 response; The figure showsa sagittal view (A 5 anterior, P 5 posterior) of the LH and axial view (L 5 left, R 5right) of the digitized head-shape of a representative subject, the dipole-like pattern inthe iso-field maps distributed over the temporal region (red: sink; green: source), andthe locations of the 20 chosen channels (yellow circles).
838 MEG of Monaural and Binaural Pitch d Chait et al.

and Tibshirani, 1993), a computationally intensive resampling method
that allows the treatment of situations in which the exact sampling
distribution of the statistic of interest is unknown. Source locations
were estimated at the RMS peak latency using the model of an
equivalent current dipole with the best-fit sphere for each subject’s
head. A single dipole model was applied for each hemisphere and all
channels over that hemisphere were used for the computation.
Since response latencies, which are the major experimental param-
eter in this study, are naturally characterized by positive skew and the
prevalence of outliers, assuming a normal distribution may be mis-
leading. For that reason, for each statistical test presented here, we
performed the applicable standard parametric test as well as a form of
bootstrapped hypothesis testing (see Efron and Tibshirani, 1993). The
twomethods yielded very similar results so only the standard parametric
test results are reported here. The a level was set a priori to 0.05. The
lower-bound correction was applied where applicable.
Results
The stimuli of Exp1 (Fig. 2A) sound like a 1500 ms continuous
noise located in the center of the head with a faint tonal object
appearing at 1000 ms post-onset. The initial portion of the
stimuli of Exp2 sounds like a diffused noise (the binaural stimuli
are not fused to a unitary auditory object). At 1000 ms the noise
changes from diffused to centered, and at the same time a faint
tonal object appears (Fig. 2B). This description applies only to
binaurally presented stimuli. When listening with only one ear,
the stimuli of Exp1 and the corresponding stimuli of Exp2 sound
the same (1500ms of noise in the case of the control stimulus or
the HP stimuli and 1500 ms of noise with a tonal object
appearing at 1000 ms post-onset in the case of TN stimuli).
Experiment 1
Behavioral Data
Subjects were generally accurate at detecting the auditory
targets. In Exp1, the mean miss rate was 2% of the pitch trials
and the mean false positive count was 2% of the control (noise)
trials resulting in d9 = 4.12. The response time (RT) data are
summarized in Figure 5A. An analysis of variance (ANOVA)
with type (HP,TN) and frequency as factors showed significant
main effects for both factors [F(1,19) = 107.456, P < 0.001;
F(1,19) = 33.167, P < 0.001] as well as a significant interaction
[F(1,19) = 30.788, P < 0.001]. In Exp1, subjects responded faster
to HP stimuli than to TN stimuli, regardless of frequency tested.
This effect was significant for all but the 600 Hz stimuli (paired
t tests, df = 19: 200 Hz, t = –7.35, P < 0.01; 400 Hz, t = –8.26,
P < 0.01; 1000 Hz, t = –11.83, P < 0.01).
Electrophysiological Data
Waveform analysis reveals that all participants had comparable
response trajectories. Figure 6A shows the group-RMS (RMS of
the individual-subject RMSs) of the auditory evoked response
for each of the conditions in the left and right hemispheres (LH
and RH, respectively). The responses contained a two-peaked
‘noise onset response’ at ~70 ms and ~150 ms post-stimulus
onset (both with a characteristic M50 spatial distribution) and a
POR (with a characteristicM100 spatial distribution) at ~1160ms,
i.e. ~160 ms after onset of TN/HP. The POR (nomenclature
introduced by Krumbholz et al., 2003) was modulated in
latency by perceived pitch. The dipolar patterns observed in
the iso-contour maps for a representative subject are displayed
in Figure 6B. Interestingly, the initial ‘noise onset response’
lacks the usual M100 evoked by stimulus onset. It is likely that
the lack of an M100 peak is a consequence of the task
performed by the subjects that led them to attend to the later
part of the stimulus and regard the former part as a noise
background. This is discussed in detail elsewhere (Chait et al.,
2004).
Figure 5. Behavioral versus electrophysiological responses. (A) Average behavioralRT for the different conditions in Exp1 (solid bars) and Exp2 (striped bars). (B)Electrophysiological peak latency of responses in the LH for the different conditions inExp1 (solid bars) and Exp2 (striped bars). The time scales are different in the two plotsbut both show a 200 ms interval to facilitate the visual comparison. (C) Averageresponse time differences (collapsed over frequencies) between Exp2 and Exp1 forelectrophysiology and behavior for the 12 subjects common to both experiments.Positive values indicate responses in Exp2 that were delayed relative to Exp1.Electrophysiological responses to TN were earlier in Exp2 than Exp1, opposite to thebehavioral pattern and both types of responses to HP. All error bars (in A, B, C)represent 1 SE.
Cerebral Cortex June 2006, V 16 N 6 839

By adding a stretch of noise before the onset of the HP/TN
portions of the stimulus, we were able to isolate the brain
response to the onset of the stimulus from the response to the
onset of the tonal signal. Figure 6A shows that the transient
response due to the onset of the noise has faded by ~600ms. The
onset of the pitch corresponds to a prominent increase of
activity at ~160ms post-pitch onset (~1160 post-stimulus onset)
and shares important characteristics with the standard M100
response, including its spatial distribution (reflected in the
contour plot) and its dependence on perceived pitch (for a
review, see Roberts et al. 2000). The existence of such a vigorous
response is surprising, as it contrasts with the relatively weak
perceived loudness of the tonal signals. Repeated measurers
ANOVA with hemisphere, type (HP, TN) and frequency (200,
400, 600, 1000 Hz) as factors showed main effects of type
[F(1,19) = 65.445, P < 0.001] and frequency [F(1,19) = 15.194
P < 0.001]. The latency of the POR is affected both by the fre-
quency and the type (HP versusTN)of the signal. HP stimuli elicit
a response with a peak latency that is ~30 ms earlier than the
corresponding TN condition. The observed POR in this study
is similar to the POR reported by Krumbholz et al. (2003) in
both its spatial distribution and dependency of latency on pitch.
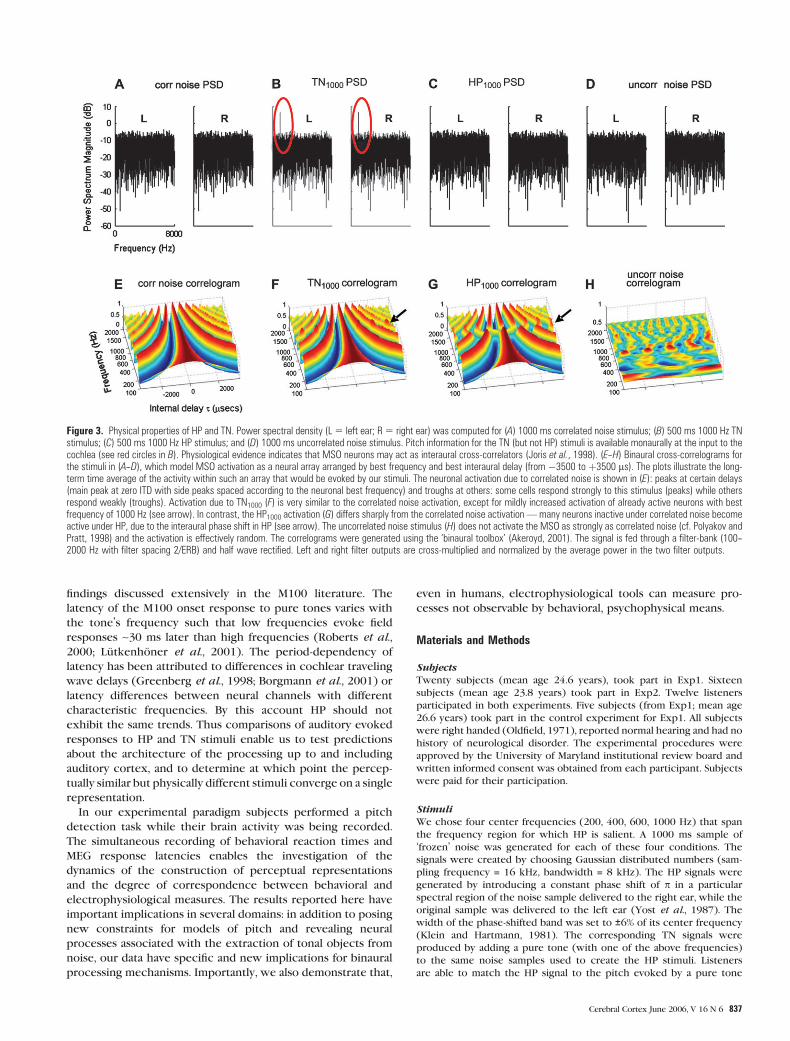
Figure 7A shows the average peak latency in the LH as
a function of frequency. The latency of the peak of the POR for
each of the eight conditions was determined automatically for
each listener by choosing the maximum value of the RMS in the
interval 1100--1300 ms post-pitch onset. Note that the peak
latency for the lowest frequency is longer, i.e. the 200 Hz signals
are associated with significant latency delays, a finding that has
been reported and discussed extensively in the context of the
M100 literature (Roberts et al., 2000; Lutkenhoner et al., 2001).
To estimate the latency differences between TN and HP, for
each listener and each frequency, the latency of the peak of TN
was subtracted from that of HP (Fig. 7B). The response to HP
stimuli is consistently earlier than the response to TN stimuli,
30 ms on average. The amplitude difference between HP and
TN peaks was not statistically significant.
The observed latency differences might conceivably be
attributed to the difference in bandwidth of the tonal parts of
TN and HP stimuli. The EC model of Durlach (1962, 1963),
suggests that the internal representation of the HP stimulus
resembles that of a narrow band of noise, whereas the TN
stimulus is a pure tone. In order to investigate this possibility,
a control experiment was run with five subjects to compare the
TN stimuli used in Exp1 with noise band stimuli (BN; see
Materials and Methods). The experimental parameters and
procedure were as in Exp1. The data (not shown) demonstrate
no significant latency difference between BN and TN for any
frequency. In contrast, the same five subjects showed a signif-
icant effect in Exp1. Thus, the different activation patterns
observed in Exp1 cannot be attributed to a bandwidth differ-
ence between the HP and TN stimuli. In the Discussion we
argue that they may instead reflect the mechanisms that process
binaural stimuli.
A striking finding is that the POR had significantly larger
amplitudes in the LH compared with the RH. This effect is found
Figure 6. Summary of the electrophysiological data from Exp1. (A) The group-RMS in the LH and RH for all tested conditions. The control condition (noise) is lower because it iscomputed by averaging over many more (800 vs. 100) repetitions. The response is characterized by a two-peaked noise onset response, and a pitch onset response at ~160 mspost-HP/TN onset, modulated by frequency. (B) Contour maps from a representative subject at the critical time periods (10 fT/iso-contour). Source 5 red; sink 5 green.
840 MEG of Monaural and Binaural Pitch d Chait et al.
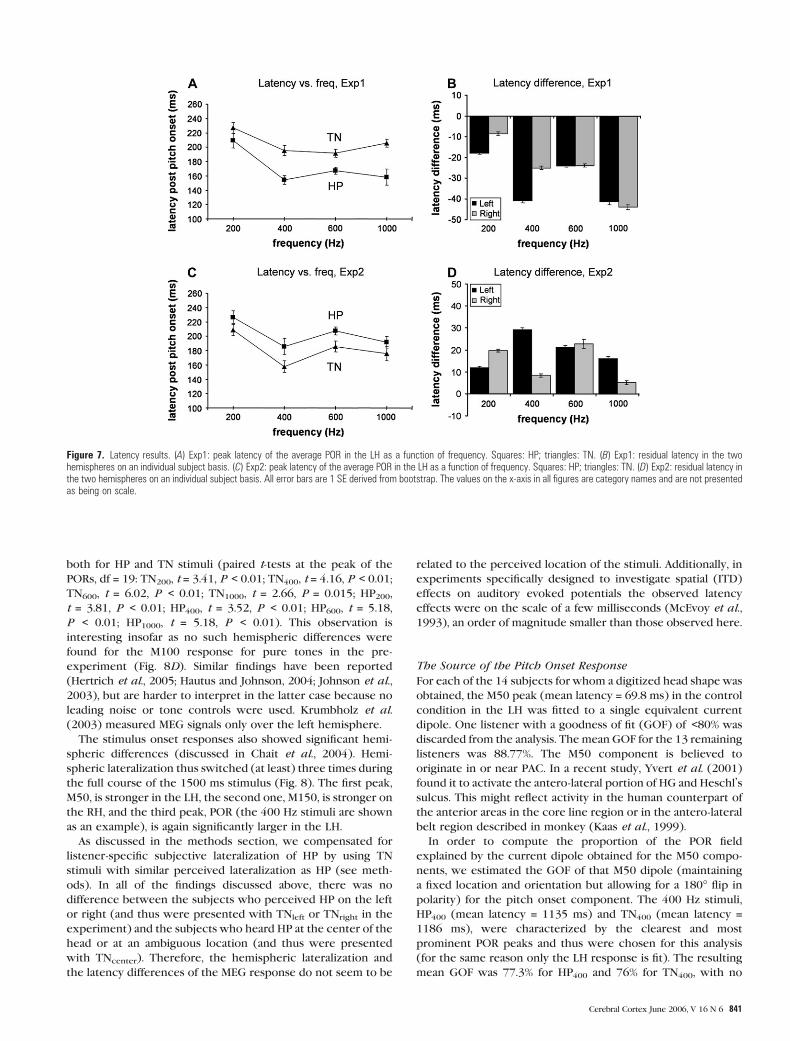
both for HP and TN stimuli (paired t-tests at the peak of the
PORs, df = 19: TN200, t = 3.41, P < 0.01; TN400, t = 4.16, P < 0.01;
TN600, t = 6.02, P < 0.01; TN1000, t = 2.66, P = 0.015; HP200,
t = 3.81, P < 0.01; HP400, t = 3.52, P < 0.01; HP600, t = 5.18,
P < 0.01; HP1000, t = 5.18, P < 0.01). This observation is
interesting insofar as no such hemispheric differences were
found for the M100 response for pure tones in the pre-
experiment (Fig. 8D). Similar findings have been reported
(Hertrich et al., 2005; Hautus and Johnson, 2004; Johnson et al.,
2003), but are harder to interpret in the latter case because no
leading noise or tone controls were used. Krumbholz et al.
(2003) measured MEG signals only over the left hemisphere.
The stimulus onset responses also showed significant hemi-
spheric differences (discussed in Chait et al., 2004). Hemi-
spheric lateralization thus switched (at least) three times during
the full course of the 1500 ms stimulus (Fig. 8). The first peak,
M50, is stronger in the LH, the second one, M150, is stronger on
the RH, and the third peak, POR (the 400 Hz stimuli are shown
as an example), is again significantly larger in the LH.
As discussed in the methods section, we compensated for
listener-specific subjective lateralization of HP by using TN
stimuli with similar perceived lateralization as HP (see meth-
ods). In all of the findings discussed above, there was no
difference between the subjects who perceived HP on the left
or right (and thus were presented with TNleft or TNright in the
experiment) and the subjects who heard HP at the center of the
head or at an ambiguous location (and thus were presented
with TNcenter). Therefore, the hemispheric lateralization and
the latency differences of the MEG response do not seem to be
related to the perceived location of the stimuli. Additionally, in
experiments specifically designed to investigate spatial (ITD)
effects on auditory evoked potentials the observed latency
effects were on the scale of a few milliseconds (McEvoy et al.,
1993), an order of magnitude smaller than those observed here.
The Source of the Pitch Onset Response
For each of the 14 subjects for whom a digitized head shape was
obtained, the M50 peak (mean latency = 69.8 ms) in the control
condition in the LH was fitted to a single equivalent current
dipole. One listener with a goodness of fit (GOF) of <80% was
discarded from the analysis. The mean GOF for the 13 remaining
listeners was 88.77%. The M50 component is believed to
originate in or near PAC. In a recent study, Yvert et al. (2001)
found it to activate the antero-lateral portion of HG and Heschl’s
sulcus. This might reflect activity in the human counterpart of
the anterior areas in the core line region or in the antero-lateral
belt region described in monkey (Kaas et al., 1999).
In order to compute the proportion of the POR field
explained by the current dipole obtained for the M50 compo-
nents, we estimated the GOF of that M50 dipole (maintaining
a fixed location and orientation but allowing for a 180� flip in
polarity) for the pitch onset component. The 400 Hz stimuli,
HP400 (mean latency = 1135 ms) and TN400 (mean latency =1186 ms), were characterized by the clearest and most
prominent POR peaks and thus were chosen for this analysis
(for the same reason only the LH response is fit). The resulting
mean GOF was 77.3% for HP400 and 76% for TN400, with no
Figure 7. Latency results. (A) Exp1: peak latency of the average POR in the LH as a function of frequency. Squares: HP; triangles: TN. (B) Exp1: residual latency in the twohemispheres on an individual subject basis. (C) Exp2: peak latency of the average POR in the LH as a function of frequency. Squares: HP; triangles: TN. (D) Exp2: residual latency inthe two hemispheres on an individual subject basis. All error bars are 1 SE derived from bootstrap. The values on the x-axis in all figures are category names and are not presentedas being on scale.
Cerebral Cortex June 2006, V 16 N 6 841
significant difference between conditions. These findings in-
dicate that the M50 dipole produces a good fit to the field of the
POR. The M50 and the POR have opposite polarities, so the two
processes cannot originate from identical neuronal populations.
The good negative fit suggests at least one possible explanation:
that the sources of the activity lie in close proximity in auditory
cortex, though perhaps on opposite sides of a cortical fold.
When looking at the proportion of the field explained by the
M50 dipole in the time range 0--1400 ms, the time windows
with the highest GOF are around the onset of the stimulus (M50
time window) and the onset of the pitch. The average GOF of
the remainder, including, crucially, the time window around
100 and 150 ms post-noise onset, is below 40%, suggesting
a different source and further affirming the specificity of the
relation between the M50 component and the POR. These
findings (that the POR originates in an area not in PAC but very
close to it) are consistent with recent fMRI studies: Penagos
et al. (2004) report that a region immediately anterolateral to
PAC exhibits sensitivity to pitch salience. In Patterson et al.
(2002), the contrast between noise and pitch eliciting iterated
rippled noise activated a relatively small, bilateral region, lateral
to PAC on HG, which the authors suggest might correspond to
the R or RT region of core auditory cortex.
The small number of repetitions per condition, in combina-
tion with the spatial resolution of the MEG system and inter-
subject variability prevent us from making any further spatial
conclusions with a reasonable degree of certainty.
Experiment 2
The only respect in which Exp2 differed from Exp1 was that the
initial 1000 ms of all stimuli (including controls) were un-
correlated instead of correlated noise. Crucially, the last 500 ms
(HP, TN, or noise for the control stimuli) remained exactly the
same as in Exp1. In particular, the noise in these segments was
correlated, and thus switched from uncorrelated to correlated
at 1000 ms post-onset (see Fig. 2).
Behavioral Data
Performance in Exp2 was slightly worse than in Exp1. Those
subjects that participated in both experiments (n = 12)
observed that Exp2 was more difficult. They reported that in
addition to the change in the noise that occurred simulta-
neously with the appearance of pitch and hindered the de-
tection, the quality of the noise (as two unfused objects at each
ear) in the first 1000 ms of the stimulus made it harder to detect
the tonal object. This was reflected in the moderately increased
error rate in Exp2: the mean miss rate was 7% of the tonal trials
and the mean false positives count was 4% of the control (noise)
trials resulting in d9 = 3.23.
A repeated-measures ANOVA with type (HP, TN) and fre-
quency as factors revealed main effects of both [F(1,15) = 29.044,
P < 0.001; F(1,15) = 52.77, P < 0.001]. In contrast to Exp1, in
Exp2 subjects responded faster to TN stimuli than to HP
stimuli (paired t-tests, df = 15: 200 Hz, t = 5.45, P < 0.01; 400 Hz,
t = 6.13, P < 0.01; 600 Hz, t = 4.11, P = 0.01; 1000 Hz, t = 2.12, P =0.051; Fig. 5A).
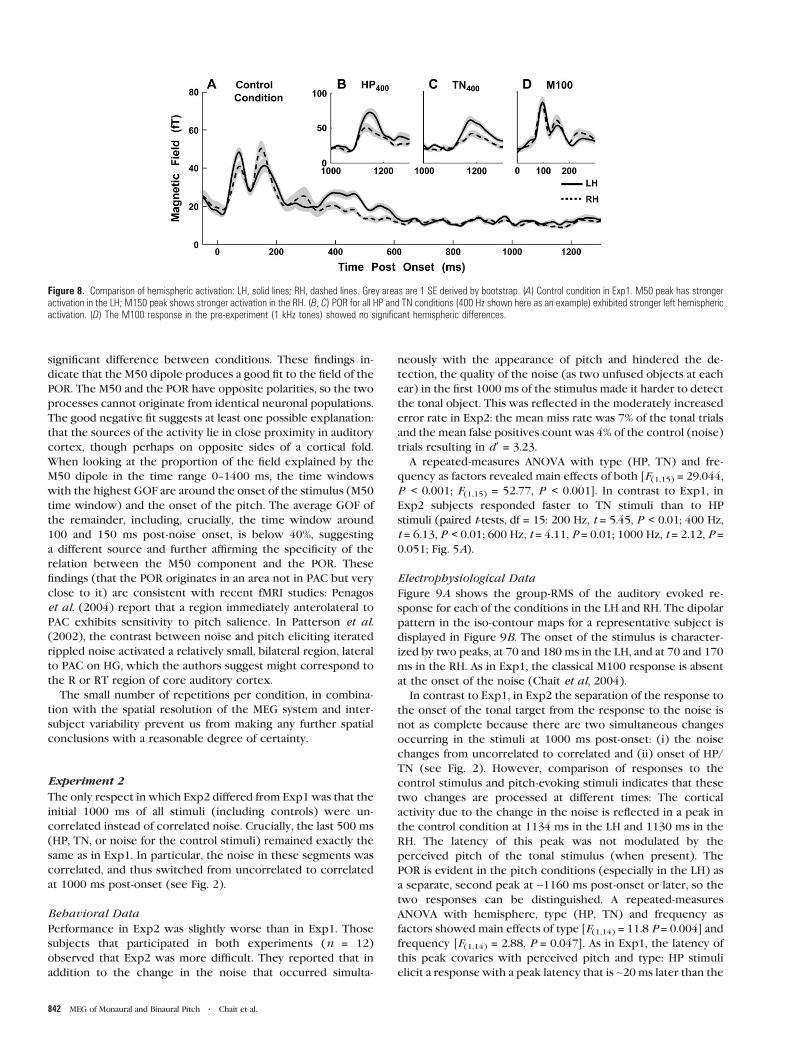
Electrophysiological Data
Figure 9A shows the group-RMS of the auditory evoked re-
sponse for each of the conditions in the LH and RH. The dipolar
pattern in the iso-contour maps for a representative subject is
displayed in Figure 9B. The onset of the stimulus is character-
ized by two peaks, at 70 and 180 ms in the LH, and at 70 and 170
ms in the RH. As in Exp1, the classical M100 response is absent
at the onset of the noise (Chait et al, 2004).
In contrast to Exp1, in Exp2 the separation of the response to
the onset of the tonal target from the response to the noise is
not as complete because there are two simultaneous changes
occurring in the stimuli at 1000 ms post-onset: (i) the noise
changes from uncorrelated to correlated and (ii) onset of HP/
TN (see Fig. 2). However, comparison of responses to the
control stimulus and pitch-evoking stimuli indicates that these
two changes are processed at different times: The cortical
activity due to the change in the noise is reflected in a peak in
the control condition at 1134 ms in the LH and 1130 ms in the
RH. The latency of this peak was not modulated by the
perceived pitch of the tonal stimulus (when present). The
POR is evident in the pitch conditions (especially in the LH) as
a separate, second peak at ~1160 ms post-onset or later, so the
two responses can be distinguished. A repeated-measures
ANOVA with hemisphere, type (HP, TN) and frequency as
factors showed main effects of type [F(1,14) = 11.8 P = 0.004] and
frequency [F(1,14) = 2.88, P = 0.047]. As in Exp1, the latency of
this peak covaries with perceived pitch and type: HP stimuli
elicit a response with a peak latency that is ~20 ms later than the
Figure 8. Comparison of hemispheric activation: LH, solid lines; RH, dashed lines. Grey areas are 1 SE derived by bootstrap. (A) Control condition in Exp1. M50 peak has strongeractivation in the LH; M150 peak shows stronger activation in the RH. (B, C) POR for all HP and TN conditions (400 Hz shown here as an example) exhibited stronger left hemisphericactivation. (D) The M100 response in the pre-experiment (1 kHz tones) showed no significant hemispheric differences.
842 MEG of Monaural and Binaural Pitch d Chait et al.

corresponding TN condition. The difference between the
amplitude of the peaks of HP and corresponding TN stimuli is
not significant.
Figure 7C shows the average peak latency in the LH as
a function of the frequency of the perceived tonal object. The
latency of the peak of the POR for each of the eight conditions
was automatically determined for each listener by choosing the
maximum value of the RMS in the interval 1100--1300 ms post-
pitch onset. The data in the 200 Hz condition were noisy and
peaks were not found in the data of two subjects. For five
additional participants, the maximum value of the RMS was at
the peak associated with the change in noise, in those cases the
POR was defined as the second highest peak in the above
specified interval. In order to estimate the latency differences,
for each listener and each frequency the latency of the peak of
TN was subtracted from that of HP (Fig. 7D). Positive values
reveal that the response to HP stimuli is consistently later than
the response to TN stimuli by ~20 ms.
The physiological data from Exp2 were noisier than the data
from Exp1. However, the main difference with Exp1, the switch
in latency between TN and HP stimuli, is robust across
frequencies and listeners (see Fig. 7) and cannot be attributed
solely to a decrease in SNR.
Hemispheric comparisons do not yield significant differences
in Exp2, possibly as a consequence of the noisier nature of the
data, but the trend is in the same direction as Exp1. Interest-
ingly, the peak at ~1130 ms, associated with the change in the
perception of the noise, had higher amplitude in the RH (not
statistically significant, but approaching significance). This
might be related to fMRI reports of stronger activation in the
RH when subjects were listening to changes in binaural timing
(Griffiths et al., 1998b). The higher amplitude in the RH is
probably masking more of the pitch onset signal, which in turn
might explain the noisier results in the RH (see Fig. 9).
As in Exp1, the hemispheric lateralization or the latency
differences between the stimuli were not related to the per-
ceived location of the stimuli.
Comparison between Experiment 1 and Experiment 2
Behavioral Data
When comparing the results of the two experiments (three-way
repeated-measures ANOVA for the 12 subjects who participated
in both experiments; corrected) there is a main effect of ex-
periment [F(1,11) = 13.33 P < 0.01] and frequency [F(1,11) = 45.61
P < 0.01], as well the interactions experiment 3 frequency
[F(1,11)=12.12P <0.01], stimulus type3 frequency [F(1,11)=11.91P < 0.01], experiment 3 stimulus type [HP/TN, F(1,11) = 48.15
P < 0.01] and experiment 3 stimulus type 3 frequency
[F(1,11) = 9.96 P < 0.01], indicating that RTs for both HP and TN
were longer in Exp2 than in Exp1. Despite the three-way
interaction, effects at all frequencies are similar. When col-
lapsed across frequencies (Fig. 5C) a paired sample t-test
showed that RTs for both HP and TN stimuli were greater in
Exp2 relative to Exp1 (df = 47; HP: t = –9.837, P < 0.01; TN:
t = –2.261, P < 0.028), corresponding to subjects’ reports that
Figure 9. Summary of the electrophysiological data from Exp2. (A) The group-RMS of in the LH and RH for all tested conditions. The control condition (noise) is lower because it iscomputed by averaging over many more (800 vs. 100) repetitions. The responses contain a two peaked noise onset response, a peak that corresponds to the change in noise at~1130 ms post-onset, and a pitch onset response at ~160 ms post-HP/TN onset, modulated by perceived frequency. (B) Contour maps from a representative subject at the criticaltime periods (10 fT/iso-contour). Source 5 red; sink 5 green.
Cerebral Cortex June 2006, V 16 N 6 843
Exp2 was harder; individual frequency results are similar but
noisier.
Electrophysiological Data
We compared POR peak latencies of the two experiments using
a three-way repeated-measures ANOVA (with experiment,
hemisphere, type and frequency as factors) for the 12 subjects
that participated in both experiments. Unlike for the behavioral
data, there were no main effects of experiment or stimulus type
(due to the latency reversal in the two experiments) but there is
a main effect of frequency [F(1,10) = 5.82, P = 0.037], as well as
an interaction between experiment 3 stimulus type [HP/TN,
F(1,10) = 34.732 P < 0.01].
Figure 5B summarizes the latency data of the PORs from the
two experiments (we report results for the LH; RH results are
similar but noisier). When collapsed across frequencies (Fig. 5C)
a paired sample t-test showed a significantly greater latency in
Exp2 relative to Exp1 for HP stimuli, but smaller latency to TN
stimuli (df = 47; HP: t = –2.789, P < 0.01; TN: t = 3.17, P < 0.01);
the amplitude of the POR in the LH did not show a significant
change between the stimuli of Exp1 and those of Exp2. We
argue in the discussion that the different peak latencies of
responses to HP and TN in the two experiments may be
attributable to the different activation that they produce in
the binaural system.
When performing the pitch detection task, subjects pressed
a button held in their right hand. It could be argued that this
might have influenced the amplitude and left lateralization of
the pitch onset peak. Such an effect can be dismissed by
comparing the data from the two experiments: the experimen-
tal procedure was identical in both experiments, accuracy of
pressing the button was comparable (see above), but the
latency, amplitude and lateralization of the peaks differed
significantly. This suggests that these characteristics of the
responses reflect the processing of the acoustic stimuli and not
the motor event.
Discussion
The primary objective of this whole-head auditory MEG study
was to investigate the timing of the formation of the percept of
tone in two physically very different signals that elicit a very
similar pitch percept — Huggins pitch (HP) and a pure tone in
noise (TN). Several aspects of the data, as well as new un-
resolved issues, are discussed in turn below.
Implications for Pitch
In this study we observed a prominent cortical response to the
onset of both HP and TN stimuli, occurring at ~150--200 ms
post-tonal onset. By prepending noise to the HP/TN stimuli we
are able to separate the response to the tonal onset from other
processing associated with the onset of an acoustic stimulus.
Unlike other studies that used the M100 response at the onset
of a tonal stimulus to probe brain processes that handle pitch,
we measured the response to the transition from a noise to
a pitch-like stimulus embedded in noise (as in Krumbholz et al,
2003). The latency of the M100 response at the onset of a tonal
stimulus is known to covary with pitch, but this response
confounds stimulus-onset-related computation with pitch com-
putation. In contrast, the response to the transition from noise
to a pitch-like stimulus (POR) allows pitch computation to be
isolated. Additional evidence for the fact that the POR truly
reflects tonal processing and not just general change in the
input come from Exp2 where the deflection corresponding to
the change in noise from uncorrelated to correlated occurs ~30ms earlier than the response to the onset of the tonal targets,
even though both changes occurred simultaneously in the
signal (see Fig. 2). If the POR were just a detector of change in
the ongoing stimulation (e.g. Jones et al., 1991), we would
expect to see a single peak rather than the two peaks observed
in Exp2, each with distinct temporal and spatial properties: POR
stronger on the LH, response to change in noise stronger on the
RH, indicating distinct neural generators.
The POR peaked at 160 ms post-tonal onset, ~60 ms later than
a classic M100, although M100 latencies to near-threshold tonal
signals are comparably delayed (Stufflebeam et al., 1998). The
early sensory processing of HP differs from TN and the other
diotic stimuli that were investigated in previous experiments
(regular interval noise in Patterson et al., 2002, Krumholtz et al.,
2003; Ritter et al., 2005; stimuli with and without resolved
harmonic in Penagos et al., 2004). The comparison of the
activation evoked by HP and TN stimuli therefore affords an
opportunity to distinguish neural processing common to these
pitch-like stimuli from those specific to early sensory process-
ing. The responses to both (TN and HP) were localized to the
same cortical area and exhibited similar frequency dependence.
For both, low frequency stimuli elicited longer latencies than
high frequency ones, similar to the ‘classic’ M100 response
(Roberts et al., 2000). Since HP showed this effect, an inevitable
conclusion is that the dependence on frequency originates from
central mechanisms (beyond the stage where binaural informa-
tion is combined); explanations based solely on the cochlear
traveling wave delay (Greenberg et al., 1998; see also Borgmann
et al., 2001) must therefore be reassessed. Crucially, these data
indicate that by ~150 ms post-onset both types of tonal objects
are mapped to very similar representations in cortex. The
similarity of the MEG responses is consistent with behavioral
data indicating that HP generates pitch and timbre percepts that
are like those of monaural tones (Bilsen, 1977) and suggests that
these signals are processed similarly, despite their physical
differences.
Our data provide new evidence that the processes that give
rise to the POR reflect central pitch mechanisms. An fMRI study
(Patterson et al., 2002) and a MEG study (Krumbholz et al.,
2003), using monaural IRN stimuli, identified a hypothesized
‘pitch center’ in HG, whose activation increased with the
degree of temporal regularity in the signal. Since the pitch-
evoking structure of IRN is present in the stimulus at both ears,
its processing could begin as early as the cochlear nucleus (as
suggested by Griffiths et al., 2001). Such is not the case for HP.
According to generic models of auditory processing (McFadden,
1975; Colburn and Durlach, 1978; Stern and Trahiotis, 1995),
auditory information is processed via monaural and binaural
analyzers. Huggins pitch requires binaural presentation, and
thus cannot be extracted by low-level processors within
a monaural pathway that precedes binaural interaction. The
pitch of the TN stimulus (like IRN) can, in theory, be detected
monaurally, and consequently could be extracted peripherally
or at some low-level stage (cf. Cariani and Delgutte, 1996).
Parsimony, and the fact that TN varies with frequency similarly
to HP suggests that both stimuli are processed beyond the stage
of binaural convergence, and argues against the hypothesis of
separate pathways for monaural and binaural pitch phenomena.
Different latencies for TN and HP responses might be taken as
evidence for separate processing levels, but the fact that HP
844 MEG of Monaural and Binaural Pitch d Chait et al.

MEG responses preceded TN responses in Exp1 would imply
processing of the binaural HP stimulus occurs at an earlier stage
than that of the monaural TN stimulus, which seems unlikely.
Instead, we propose the latency differences arise as a result of
binaural processing that both signals undergo (see below).
Interestingly, Carlyon et al. (2001), using dichotic pulse trains
with no place information, were led to conclude that temporal
pitch mechanisms operate on the input to each ear alone rather
than on the output of the binaural system (combination of the
information from the two ears). That conclusion was obtained
using unresolved stimuli. Our study suggests the opposite
conclusion (not only for HP, but also for TN), but as we used
resolved stimuli (in the sense that the tonal components are
isolated sinusoids) we do not know whether our conclusion
applies to spectral (place) or temporal pitch mechanisms or both.
Our results are consistent with a pitch processor that is
driven by a central spectrum, computed from all available
information irrespective of it being monaural or binaural in
nature. The EC model of Durlach (1962, 1963), for example,
suggests that the central representation of HP has a similar time
and place profile to that of TN. In this study we have only used
pure tones (TN) and ‘pure tone’-like stimuli (HP). Nevertheless,
the data reported here are a significant first step and constitute
a generalizable paradigm for use with richer pitch stimuli. An
intriguing next step is comparing brain responses to complex
tones with a missing fundamental with response to missing
fundamental HP complexes (Bilsen, 1977). The ‘Bilsen multiple
phase shift pitch’ has phase shifts at several harmonics, and
therefore is the counterpart of the pitch of harmonic complex
tones. HP and its generalizations are ideal tools to study ‘missing
fundamental’ effects because combination-tones resulting from
cochlear non-linearities (Pantev et al., 1989) do not exist.
The LH advantage at the peak of the POR is unexpected. No
hemispheric difference is reported in studies involving de-
tection or discrimination of pure tones (Papanicolaou et al.,
1999; Shtyrov et al., 2000; Johnsrude et al., 2000; but see Devlin
et al., 2003), or in studies with IRN stimuli (Patterson et al.,
2002; though see Griffiths et al., 1998a). In fact, pitch-related
tasks are usually reported to produce stronger responses from
the RH (Zatorre, 2001). One possible explanation is that the
pitch onset peak does not reflect the extraction of pitch per se,
but the segregation of the tonal object within the auditory
scene and its separation from the noise background, which
might incur more significant involvement of LH mechanisms.
The onset of the pitch-evoking stimulus activates pitch sensitive
mechanisms that produce a pitch-like percept, but also segre-
gation (or pop-out-of-background) mechanisms that produce
the perception of a pitched object. The PORmay be tapping into
the latter stage. Alain et al. (2002; see also Dyson and Alain
2004), in EEG studies of concurrent sound segregation, re-
ported that the perception of a mistuned harmonic as a separate
sound is associated with a negative wave peaking at ~150 ms
after sound onset. In their stimuli the onset of mistuning
coincides with that of the stimulus, so the response compo-
nents of the two cannot be isolated, but the properties of the
wave (referred to as object-related negativity) are very similar to
those of the POR (see also Hautus and Johnson, 2004). This
alternative interpretation, which could equally be applied to the
results of the other fMRI/MEG studies cited here (e.g. Pantev
et al., 1996; Patterson et al., 2002; Fujioka et al., 2003;
Krumbholz et al., 2003; Penagos et al., 2004), still allows the
responses to be interpreted in terms of pitch processing.
Extraction of the pitch ‘feature’ must precede object emer-
gence, and indeed the cortical response latency showed a de-
pendence on the pitch of the tonal object. This study cannot
disambiguate between an interpretation in terms of a pitch-
specific response and this alternative. A more systematic and
detailed examination of this question is warranted.
Binaural Processing
Models of auditory processing are often discussed in terms of
‘monaural’ and ‘binaural’ pathways (McFadden, 1975; Colburn
and Durlach, 1978). The former are invoked to account for
phenomena involving monaural (or diotic) stimulation, the
latter for phenomena that arise only from dichotic stimulation.
The pitch evoked by HP must arise in the latter, but that evoked
by TN might conceivably arise in a monaural pathway. We do
not see evidence of such a division in the present study. As
discussed above, when presented monaurally the stimuli of
Exp1 and Exp2 are indistinguishable; consequently any differ-
ences between the two experiments must be due to binaural
mechanisms. In particular, the latency differences observed
between Exp1 and Exp2 for TN (Fig. 5C) must result from the
binaural processing of correlated versus uncorrelated noise.
The change in the interaural configuration of the leading noise
caused an earlier brain response to TN in Exp2 relative to Exp1.
Note that a difference of the opposite sign would have been
compatible with the hypothesis of monaural processing of the
pitch of TN with subsequent interference from the result of
binaural processing at a later stage. The fact that the responses
in Exp2 were earlier indicates that binaural processing aided the
detection of TN, and thus that detection occurred within
a binaural rather than monaural pathway. HP is commonly
hypothesized to be mediated by the mechanism of binaural
unmasking (Raatgever and Bilsen 1986; Culling et al., 1998):
a target that is just masked by binaurally correlated noise can be
made easier to detect by inverting the noise or the target in one
ear. Unmasking depends on mechanisms that are sensitive to
the similarity of the signals at the two ears. Cells exhibiting
these properties are found in the MSO, and in animal studies, the
inferior colliculus (IC), the projection target of the MSO,
exhibits correlates of binaural unmasking (Jiang et al., 1997a,b;
Palmer et al., 2000).
The auditory-evoked magnetic fields, measured outside the
head by MEG, are generated by neuronal currents flowing in
tens of thousands of cortical pyramidal cells on the supra-
temporal gyrus (Hamalainen et al., 1993), but the observed
response latency differences might originate as early as the SOC.
One possibility is that the latency disparity reflects constraints
of processing within the MSO itself. The MSO has been likened
to an array of cross-correlators fed from both ears (Jeffress,
1948; Joris et al., 1998). Figure 3E--H illustrates the long-term
time average of the activity within such an array that would be
evoked by our stimuli. Correlated noise (Fig. 3E) evokes an
orderly arrangement of ‘valleys’ and ‘peaks’ (resulting from each
cell’s sensitivity to a particular relative phase between the two
ears at its best frequency; cf. Yin and Chan, 1990). TN stimuli
(Fig. 3F) evoke the same pattern with slightly higher amplitude
at the frequency of the tone, whereas HP stimuli (Fig. 3G)
produce a more complex pattern, with a crossover between
ridges at the frequency of the phase transition. Uncorrelated
noise (Fig. 3H) evokes an irregular pattern with low amplitude.
The frequency-local features of target stimuli (TN or HP)
Cerebral Cortex June 2006, V 16 N 6 845
distinguish them from non-target correlated noise. The in-
fluence of the preceding context (correlated or uncorrelated
noise) on their detection might explain the latency differences
observed between Exp1 and Exp2. In Exp1, the onset from
correlated noise to HP activates neurons, within the frequency
region of the phase transition, that were previously inactive
(compare Figs 3E and 3G). In Exp2 the onset from uncorrelated
noise to HP also increments activity, but in this case it is
distributed across the frequency axis. Easier detection of tonal
HP targets in the former case might explain the smaller la-
tencies of brain responses observed in Exp1. For TN, in Exp1 the
onset of the tonal target causes a local increment in the activity
of neurons that were already strongly activated by the corre-
lated noise (compare Figs 3E and 3F). In Exp2 the same neurons
were less strongly activated by the uncorrelated noise (compare
Figs 3F and 3G). Easier detection of tonal TN targets in the latter
case might explain the smaller latencies observed in Exp2 for
brain (but not behavioral) responses. The patterns illustrated in
Figure 3 reflect the generic cross-correlation model of Jeffress,
but a similar account could be applied to the recent model of
McAlpine and colleagues (McAlpine and Grothe, 2003). Thus,
latency differences may result from constraints of binaural
processing as early as the MSO, but it is not clear how they
would result in the relatively large latency differences observed.
It is also not clear whether they arise at the MSO itself, or in
subsequent stages that interpret its output. To the best of our
knowledge, no physiological studies have tried to measure the
latency of responses to such stimulus events at the level of MSO
or IC. Several different models of unmasking (and HP) have been
suggested to account for the available psychophysical, physio-
logical and electrophysiological data (Durlach, 1963; Raatgever
and Bilsen, 1986). Physiological measurement of the latency of
responses to signals such as those used here might greatly
clarify our understanding of the processing of these events.
Behavior versus Electrophysiology
Although behavioral and electrophysiological responses mostly
follow similar directions, there is also a striking difference
between them (Fig. 5C). In the behavioral data, the average RT
for HP was significantly greater in Exp2 than in Exp1. Similarly
RTs for TNwere either equal or greater in Exp2 relative to Exp1.
In contrast, in the electrophysiological data responses to TN
stimuli are faster in Exp2 than Exp1 (negative values in Fig. 5C),
while the responses to HP stimuli are slower in Exp2 than Exp1
(positive values in Fig. 5C). Thus, although HP responses follow
the same pattern as behavior, brain responses to TN in Exp2
(where changing binaural cues are present) are earlier than
those to TN in Exp1 (no changing binaural cues). The difference
between behavior and brain response patterns can be un-
derstood by supposing that the transition from correlated to
uncorrelated background in Exp2 introduced an additional
difficulty (reported by the subjects) that caused RTs to be
overall longer in Exp2 than in Exp1. The fact that it was not
apparent in the POR brain responses suggests that it affected
a different pathway (or a stage subsequent) to that which
produced those responses.
Behavior and electrophysiology, studied separately, might
lead to different conclusions about the nature of the processing
involved. The simultaneous acquisition of both MEG and
behavioral data puts stronger constraints on the interpretation,
revealing a multi staged process where early (~150 ms post-
onset) cortical responses (POR) reflect the operation of
low-level mechanisms but behavior is affected by additional
mechanisms. For example, these mechanisms might incorpo-
rate the outputs from the POR generating system as well as the
outputs from a separate system sensitive to the change in the
background noise into some decision variable, in this manner
making the conscious detection of the tone onsets in Exp2
slower than in Exp1.
The incongruence between behavior and electrophysiology
observed here demonstrates that there is a limitation on what
can be learned from behavioral or electrophysiological measure
alone. In the study of the processes that underlie the construc-
tion of perceptual experiences, electrophysiological measures
can usefully supplement the wealth of data that have accumu-
lated over the (relatively) long history of behavioral research.
Notes
We are grateful to Alain de Cheveigne, Catherine Carr, Shihab Shamma
and Barbara Shinn-Cunningham for insightful comments and discussion,
and to Jeff Walker for excellent technical support. M.C. and D.P. are
supported by NIH R01DC05660. During the preparation of this
manuscript M.C. was visiting at the ‘Audition’ lab, DEC-ENS, France
and DP was a fellow at the Wissenschaftskolleg zu Berlin and the
American Academy Berlin.
Address correspondence to Maria Chait, Cognitive Neuroscience of
Language Laboratory, 1401 Marie Mount Hall, College Park, MD 20742-
7505, USA. Email: [email protected]
References
Adachi Y, Shimogawara M, Higuchi M, Haruta Y, Ochiai M (2001)
Reduction of non-periodic environmental magnetic noise in MEG
measurement by continuously adjusted least squares method. IEEE
Trans Appl Superconduct 11:669--672.
Akeroyd MA (2001) A binaural cross-correlogram toolbox for MATLAB.
Software package available at http://www.ihr.gla.ac.uk/.
Akeroyd MA, Moore BC, Moore GA (2001) Melody recognition using
three types of dichotic-pitch stimulus. J Acoust Soc Am
110:1498--1504.
Alain C, Schuler BM, McDonald KL (2002) Neural activity associated
with distinguishing concurrent auditory objects. J Acoust Soc Am
111: 990--995.
Bendor D, Wang X (2005) The neuronal representation of pitch in
primate auditory cortex. Nature 436:1161--1165.
Bilsen F (1977) Pitch of noise signals: evidence for a ‘central spectrum’.
J Acoust SocAm 61:150--161.
Borgmann C, Roß B, Draganova R, Pantev C (2001) Human auditory
middle latency responses: influence of stimulus type and intensity.
Hear Res 158:57--64.
Cariani PA, Delgutte B (1996) Neural correlates of the pitch of complex
tones. I. Pitch and pitch salience. J Neurophysiol 76:1698--1716.
Carlyon RP, Demany L, Deeks J (2001) Temporal pitch perception and
the binaural system. J Acoust Soc Am 109:686--700.
Carr CE (1993) Processing of temporal information in the brain. Annu
Rev Neurosci 16:223--243.
Chait M, Simon JZ, Poeppel D (2004) Auditory M50 and M100 responses
to broadband noise: functional implications. Neuroreport
15:2455--2458.
Colburn HS, Durlach NI (1978) Models of binaural interaction. In:
Handbook of perception, Vol. IV (Carterette EC, Friedman, M, eds),
pp. 467--518. New York: Academic Press.
Cramer E, Huggins WH (1958) Creation of pitch through binaural
interaction. J Acoust Soc Am 30:413--417.
Culling J, Marshall D, Summerfield Q (1998) Dichotic pitches as illusions
of binaural masking release. I. Huggins’ pitch and the binaural edge
pitch. J Acoust Soc Am 103:3509--3526.
846 MEG of Monaural and Binaural Pitch d Chait et al.
de Cheveigne A (2005) Pitch perception models. In: Pitch — neural
coding and perception (Plack C, Oxenham A, Fay, RR, Popper AN,
eds), pp. 169--233. New York: Springer Verlag.
Devlin JT, Raley J, Tunbridge E, Lanary K, Floyer-Lea A, Narain C, Cohen I,
Behrens T, Jezzard P, Matthews PM, Moore DR (2003) Functional
asymmetry for auditory processing in human primary auditory
cortex. J Neurosci 23:11516--11522.
Durlach NI (1962) Note on the creation of pitch through binaural
interaction. J Acoust Soc Am 34:1096--1099.
Durlach NI (1963) Equalization and cancellation theory of binaural
masking-level differences. J Acoust Soc Am 35:1206--1218.
Dyson BJ, Alain C (2004) Representation of concurrent acoustic objects
in primary auditory cortex. J Acoust Soc Am. 115:280--8.
Efron B, Tibshirani RJ (1993) An introduction to the bootstrap. New
York: Chapman & Hall.
Fujioka T, Ross B, Okamoto H, Takeshima Y, Kakigi R, Pantev C (2003)
Tonotopic representation of missing fundamental complex sounds
in the human auditory cortex. Eur J Neurosci. 18:432--440.
Greenberg S, Poeppel D, Roberts T (1998) A space--time theory of
pitch and timbre based on cortical expansion of the cochlear
traveling wave delay. In: Psychophysical and physiological advances
in hearing (Palmer AR, Rees A, Summerfield AQ and Meddis R, eds),
pp. 293--300. London: Whurr Publishers.
Griffiths TD, Buchel C, Frackowiak RSJ, Patterson RD (1998a) Analysis of
temporal structure in sound by the human brain. Nat Neurosci
1:422--427.
Griffiths TD, Rees G, Rees D, Green GGR, Witton C, Rowe D, Buchel C,
Turner R, Frackowiak RSJ (1998b) Right parietal cortex is involved in
the perception of sound movement in humans. Nat. Neurscience
1:74--79.
Griffiths TD, Uppenkamp S, Johnsrude I, Josephs O, Patterson RD (2001)
Encoding of the temporal regularity of sound in the human
brainstem. Nat Neurosci 4:633--637.
Gutschalk A, Patterson RD, Scherg M, Uppenkamp S, Rupp A (2004)
Temporal dynamics of pitch in human auditory cortex. Neuroimage.
22:755--766.
Hamalainen M, Hari R, Ilmoniemi RJ, Knuutila J, Lounamaa OV (1993)
Magnetoencephalography — theory, instrumentation, and applica-
tions to noninvasive studies of the working human brain. Rev Mod
Phys 65:413--497.
Hautus MJ, Johnson BW (2004) Object-related brain potentials associ-
ated with the perceptual segregation of dichotically embedded
pitch. J Acoust Soc Am 117:275--280.
Hertrich I, Mathiak K, Menning H, Lutzenberger W, Ackermann H
(2005) MEG responses to rippled noise and Huggins pitch reveal
similar cortical representations. Neuroreport 16:193--196.
Houtsma AJM, Goldstein JL (1971) The central origin of the pitch of
complex tones: evidence from musical interval recognition. J Acoust
Soc Am 51:520--529.
Jeffress LA (1948) A place theory of sound localization. J Comp Physiol
Psychol 41:35--39.
Jiang D, McAlpine D, Palmer AR (1997a) Responses of neurons in the
inferior colliculus to binaural masking level difference stimuli
measured by rate-versus-level functions. J Neurophysiol 77:
3085--3106.
Jiang D, McAlpine D Palmer AR (1997b) Detectability index measures of
binaural masking level difference across populations of inferior
colliculus neurons. J Neurophysiol 17:9331--9339.
Johnson BW, Hautus M, ClappWC (2003) Neural activity associated with
binaural processes for the perceptual segregation of pitch. Clin
Neurophysiol 114:2245--2250.
Johnsrude IS, Penhune VB, Zatorre RJ (2000) Functional specificity in
the right human auditory cortex for perceiving pitch direction. Brain
123:155--163.
Jones SJ, Pitman JR, Halliday AM (1991) Scalp potentials following
sudden coherence and discoherence of binaural noise and change in
the inter-aural time difference: a specific binaural evoked potential
or a ‘mismatch’ response? Electroencephalogr Clin Neurophysiol
80:146--154.
Joris PX, Smith PH, Yin TC (1998) Coincidence detection in the auditory
system: 50 years after Jeffress. Neuron 21:1235--1238.
Julesz B (1971) Foundations of Cyclopean perception. Chicago, IL:
University of Chicago Press.
Kaas JH, Hackett TA, Tramo MJ (1999) Auditory processing in primate
cerebral cortex. Curr Opin Neurobiol 9:164--170.
Klein MA, Hartmann WM (1981) Binaural edge pitch. J Acoust Soc Am
70:51--59.
Krumbholz K, Patterson RD, Seither-Preisler A, Lammertmann C,
Lutkenhoner B (2003) Neuromagnetic evidence for a pitch process-
ing center in Heschl’s gyrus. Cereb Cortex 13:765--772.
Lutkenhoner B, Steinstrater O (1998) High-precision neuromagnetic
study of the functional organization of the human auditory cortex.
Audiol Neurootol 3:191--213.
Lutkenhoner B, Lammertmann C, Knecht S (2001) Latency of auditory
evoked field deflection N100m ruled by pitch or spectrum? Audiol
Neurootol 6:263--278.
McAlpine D, Grothe B (2003) Sound localization and delay lines — do
mammals fit the model? Trends Neurosci 26:347--350.
McEvoy L, Hari R, Imada T, Sams M (1993) Human auditory cortical
mechanisms of sound lateralization. II. Interaural time differences at
sound onset. Hear Res 67:98--109.
McFadden D (1975) Masking and the binaural system. In: The nervous
system, Vol. 3. Human communication and its disorders (Tower DB,
ed.), pp. 137--146. New York: Raven Press.
Moore BCJ (1997) An introduction to the psychology of hearing, 4th
edn. London: Academic Press.
Oldfield RC (1971) The assessment and analysis of handedness: the
Edinburgh inventory. Neuropsychologia 9:97--113.
Palmer AR, Jiang D, McAlpine D (2000) Neural responses in the Inferior
colliculus to binaural masking level differences created by inverting
the noise in one ear. J Neurophysiol 84:844--852.
Pantev C, Hoke M, Lutkenhoner B, Lehnertz K (1989) Tonotopic
organization of the auditory cortex: pitch versus frequency repre-
sentation. Science 246:486--488.
Pantev C, Elbert T, Ross B, Eulitz C, Terhardt E (1996) Binaural fusion
and the representation of virtual pitch in the human auditory cortex.
Hear Res 100:164--170.
Papanicolaou AC, Panagiotis SG, Breier JI, Zouridakis G, Willmore J,
Wheless JW, Constantinou JEC, Maggio W, Gormley WB (1999)
Magnetoencephalographic mapping of the language-specific cortex.
J Neurosurg 90:85--93.
Patterson RD, Uppenkamp S, Johnsrude IS, Griffiths TD (2002) The
processing of temporal pitch and melody information in auditory
cortex. Neuron 36:767--776.
Penagos H, Melcher JR, Oxenham AJ (2004) A neural representation
of pitch salience in nonprimary human auditory cortex revealed
with functional magnetic resonance imaging. J Neurosci 24:
6810--6815.
Plack CJ, Oxenham A, Fay RR, Popper AN (2005). Pitch — neural coding
and perception. New York: Springer.
Polyakov A, Pratt H (1998) The effect of binaural masking noise disparity
on human auditory brainstem binaural interaction components.
Audiology 37:17--26.
Raatgever J, Bilsen F (1986) A central spectrum theory of binaural
processing — evidence from dichotic pitch. J Acoust Soc Am
80:429--441.
Ragot R, Lepaul-Ercole R (1996) Brain potentials as objective indexes of
auditory pitch extraction from harmonics. Neuroreport 7:905--909.
Ritter S, Gunter Dosch H, Specht HJ, Rupp A (2005) Neuromagnetic
responses reflect the temporal pitch change of regular interval
sounds. Neuroimage 27:533--543.
Roberts T, Poeppel D (1996) Latency of auditory evoked M100 as
a function of tone frequency. Neuroreport 7:1138--1140.
Roberts T, Ferrari P, Stufflebeam S, Poeppel D (2000) Latency of the
auditory evoked neuromagnetic field components: stimulus depen-
dence and insights towards perception. J Clin Neurophysiol
17:114--129.
Salajegheh A, Link A, Elster C, Burghoff M, Sander T, Trahms L, Poeppel D
(2004) Systematic latency variation of the auditory evoked M100:
from average to single-trial data. Neuroimage 23:288--295.
Seither-Preisler A, Krumbholz K, Patterson R, Seither S, Lutkenhoner B
(2004) Interaction between the neuromagnetic responses to sound
Cerebral Cortex June 2006, V 16 N 6 847

energy onset and pitch onset suggests common generators. Eur J
Neurosci. 19:3073--3080.
Shtyrov Y, Kujala T, Lyytinen H, Ilmoniemi RJ, Naatanen R (2000)
Auditory cortex evoked magnetic fields and lateralization of speech
processing. Neuroreport 11:2893--2896.
Stern RM, Trahiotis C (1995) Models of binaural interaction. In: Hearing:
handbook of perception and cognition, 2nd edn (Moore BCJ, ed.),
pp. 347--386. San Diego, CA: Academic Press.
Stufflebeam SM, Poeppel D, Rowley HA, Roberts TP (1998) Peri-
threshold encoding of stimulus frequency and intensity in the
M100 latency. Neuroreport 9:91--94.
Yin TC, Chan JC (1990) Interaural time sensitivity in medial superior
olive of cat. J Neurophysiol 64:465--488.
Yost WA, Harder PJ, Dye RH (1987) Complex spectral patterns with
interaural differences: dichotic pitch and the ‘central spectrum’. In:
Auditory processing of complex sounds (Yost WA, Watson SC, eds.),
pp. 190--201. Hillsdale, NJ: Erlbaum.
Yvert B, Crouzeix A, Bertrand O, Seither-Preisler A, Pantev C (2001)
Multiple supratemporal sources of magnetic and electric auditory
evoked middle latency components in humans. Cereb Cortex
11:411--423.
Zatorre RJ (2001) Neural specializations for tonal processing. Ann N Y
Acad Sci 930:193--210.
Zhang PX, Hartmann WM (2004) On the lateralization of Huggins
pitches. J Acoust Soc Am 115:2534.
848 MEG of Monaural and Binaural Pitch d Chait et al.


![[SfN 2013] Neural correlates of flow](https://img.pdfslide.us/doc/110x75/5564e56bd8b42afb268b4978/sfn-2013-neural-correlates-of-flow.jpg)