Embed Size (px)
Citation preview
Adult life experiences and health in early old age inGreat Britain
Emily Grundy*, Gemma Holt
Centre for Population Studies, London School of Hygiene and Tropical Medicine, 49±51 Bedford Square, London WC1B 3DP, UK
Abstract
In Britain and other developed countries older people comprise a large majority of all those reporting long termillness or disability. However, most studies of socio-demographic variations in health have focussed on those inyounger age groups. Moreover approaches to the study of health variations are often fragmented. In this study we
have adopted a life course approach to analyse di�erentials in health in early old age.The data comes from the Retirement and Retirement Plans Survey and follow-up, a two-wave study of persons
aged 55±69 in 1988/9. As well as information on current circumstances, the data set includes occupational, marital,
and fertility history information. At baseline a nationally representative sample of the population of Great Britainwere interviewed at home by trained interviewers (n = 3543). The sample was followed up and in 1994, 2247survivors were re-interviewed, a response rate of 70% (of survivors). The data were weighted to adjust for non-
response bias.Two outcome measures were used: self rated health and presence or absence of disability assessed from a scale
derived from detailed questions on thirteen domains of disability. The severity score used was that developed for the1985/6 ONS Surveys of Disability.
The ®ndings indicate that health and disability status at baseline and at follow up were associated with socio-economic and geographic variables, such as proportion of adult life spent unemployed and residence outside theSoutheast of England; demographic factors, such as early age at marriage and high parity; and experience of
adverse events, such as the death of a child and being dismissed from work.The results show that socio-economic, demographic, and geographical and `life events' factors are all associated
with health status in early old age and that integrated, rather than bifurcated, approaches to the study of health
di�erentials are needed. 7 2000 Elsevier Science Ltd. All rights reserved.
Keywords: Socio-economic status inequality; Life events; Elderly; Disability; Social class; Great Britain
Introduction
Socio-economic di�erentials in indicators of health
status have long been a focus of enquiry in Britain and
have recently returned to the forefront of the policyarena (Department of Health, 1999; Acheson, 1998).
In 1997 83% of all deaths in England and Wales were
Social Science & Medicine 51 (2000) 1061±1074
0277-9536/00/$ - see front matter 7 2000 Elsevier Science Ltd. All rights reserved.
PII: S0277-9536(00 )00023-X
www.elsevier.com/locate/socscimed
* Corresponding author. Tel: +44-0-20-7299-4668; fax:
+44-0-20-7299-4637.
E-mail address: [email protected] (E. Grundy).
of people aged 65 years and over, with a further 8%
occurring among people aged 55±64 (ONS, 1999).Those aged 55 years and over also account for 68% ofthe population with a limiting long-term illness or dis-
ability and 58% of those who consider their healthbad or very bad (Bennett, Dodd, Flatley, Freeth &Bolling, 1995).
It necessarily follows from this demographic contextthat much of the overall variation in health re¯ects
di�erentials among those in older age groups. Despitethis, studies of health variations in the elderly popu-lation are sparse relative to research on younger people
(Medical Research Council, 1994).The relative neglect of variations in the health status
of older adults stems in part from the historical predo-minance of studies of socio-economic factors and geo-graphic mortality di�erentials based on the decennial
supplements produced by the Registrar General. Thedi�culties involved in assigning occupationally de®nedSocial Class to those who have long left the labour
market and numerator±denominator bias in the esti-mation of mortality rates make these sources in-
adequate for studying socio-economic variations inmortality at older ages. As a result such di�erencesreceived little attention in the Black report and other
in¯uential publications (Townsend and Davidson,1982; Wilkinson, 1996, Kunst, 1997). The availabilityof better data sets, particularly the ONS Longitudinal
Study (Fox, Goldblatt & Jones, 1985) has shown de®-nitively that socio-economic variations in mortality
persist beyond the age of 65.Analyses of General Household Survey data have
also shown variations in elderly age groups in indi-
cators of health, such as self reported long-standing ill-ness and recent restricted activity (Grundy, 1987;
Victor, 1989; Arber & Ginn, 1993), as have studies ofparticular cohorts (Marmot & Shipley, 1996).Apart from studies of socio-economic di�erences in
health status, there is a substantial literature on vari-ations according to family and household character-istics, particularly marital status. Unravelling causal
associations is complex because of the need to allowfor health related selection between relevant status
groups, but in general the currently married have beenfound to have better health than the unmarried, par-ticularly the divorced (Goldman, Korenman & Wein-
stein, 1995; Murphy, Glaser & Grundy, 1997; Glaser,Murphy & Grundy, 1997; Grundy, 1993). A few stu-dies have investigated links between reproductive his-
tory and mortality and found a J shaped relationshipwith nulliparous and high parity women having above
average risks (Green, Beral & Moser, 1988; Lund,Arnesen & Borgan, 1990). An association betweenhigh parity (six or more births) and worse health was
also found in an analysis of women aged 50 and overincluded in the US Panel Study of Income Dynamics
(Kington, Lillard & Rogouski, 1997). Related to
research on associations between family and householdstatus and health, is a burgeoning body of research onlinks between indicators of social support and health
(see Grundy, Bowling & Farquhar, 1996 for a recentreview). This latter research ®eld has included con-sideration of the possible protective e�ect that social
ties may have in times of adversity and so overlaps tosome extent with the literature on the e�ects of stress-
ful life events on health (Markides & Cooper, 1989;Kivela, Kongas-Saviaro, Laippala, Pahkala & Kesti,1996).
There is an obvious need to integrate theseapproaches to the study of variations in health and
consider the contribution of socio-economic factors,socio-demographic circumstances and exposure toadverse life events together. However, many research
approaches to the study of health variations in laterlife are highly fragmented; Preston and Taubman(1994), for example, draw attention to the `bifurcation
of literatures' on socio-economic di�erences in mor-tality and health on the one hand and social±psycho-
logical studies on the other.Recently new approaches, which have emphasised
the role of life course factors as a whole, have led to
some integration of di�erent conceptual approaches tothe study of health (Wunsch, Duchene, Thiltges &Salhi, 1996; Davey Smith, Hart, Blane, Gillis &
Hawthorne, 1997; Wadsworth, 1997). Forsdahl (1977)and more recently Barker (1992) has emphasised the
importance of very early life environments on sub-sequent risk of speci®ed diseases and have proposedparticular etiological pathways which could explain
some observed variations. Other analysts have empha-sised the importance of accumulated risk over the lifecourse (Vagero & Lundberg, 1995; Bartley, Blane &
Montgomery, 1997) and it is this approach whichunderlies the research reported here.
In this paper we analyse variations in indicators ofhealth and disability at two points in time in a rela-tively large, and nationally representative, study of
British adults in late middle and early old age. This isan important group to study as it is in these age
groups that much chronic morbidity and prematuremortality is manifest. In previous analyses (Grundy &Glaser, 1998, 2000) we have shown that the extent of
disability, and of change in disability, in the samplestudied varied considerably according to a number ofsocio-economic indicators, such as housing tenure and
social class. Here our focus is on variations in healthand disability status according to socio-economic and
demographic history throughout adult life.Two recent studies have also considered those in this
age group and have adopted a lifecourse approach to
analysis and so merit particular consideration here.Blane, Berney, Davey Smith, Gunnell & Holland,
E. Grundy, G. Holt / Social Science & Medicine 51 (2000) 1061±10741062
(1999) followed up a sample of some 300 65±74 yearolds who as children had been included in the Boyd±
Orr 1937±39 survey of families. They used a lifegridmethod to gather retrospective information on the oc-cupational and residential histories of survivors from
the original survey whom they re-interviewed in 1995.This study has the advantage of including indicators ofchildhood circumstances and also physiological and
anthropometric measurements taken in childhood andin early old age. Preliminary results suggest that,although the sample is not a random one, its charac-
teristics are similar to those of the national populationof the same age, work on analysing the data are inprogress. Davey Smith et al. (1997) also used a lifecourse approach to analyse variations in the morbidity
and mortality of workers screened in 1970±73, whenthey were aged 35±64, as part of a workplace study inthe west of Scotland. Deaths of study members were
followed up and analysed in relation to social class inchildhood, at entry to the labour market (informationgathered retrospectively) and at the time of screening.
The authors reported a cumulative e�ect of these threeindicators (although their results show little e�ect ofsocial class at age 25) and concluded that studies with
data on socio-economic circumstances at only onestage of life `are inadequate for fully elucidating thecontribution of socio-economic factors to health'.The research reported here is based on analyses of a
data set that does not include any information onchildhood circumstances (apart from educational quali-®cations) or any physiological measures of health.
However, unlike the two studies referred to above, it isbased on a nationally representative sample (and asample some ten times larger than the Boyd±Orr
cohort) and includes detailed retrospectively gatheredinformation on both work and marital and fertility his-tories. Generally associations between these domainsof life and health have been analysed separately, here
we take account of both.
Data and methods
This analysis is based on data from the baseline and
follow up rounds of the Retirement and RetirementPlans Survey conducted in 1988/9 and 1994. The sur-
vey was commissioned by the Department of SocialSecurity and carried out by the O�ce for NationalStatistics. The baseline survey, described in detail else-
where (Bone, Gregory, Gill & Lader, 1992), compriseda nationally representative sample of 3543 adults aged55±69 who answered a detailed interviewer-adminis-
tered questionnaire including extensive questions onoccupational history, ®nancial circumstances, disabil-ity, and marital and fertility history. As there is no
comprehensive list by age of the population of GreatBritain, obtaining the sample required a prior sift of arandom sample of addresses in order to identify house-holds including 55±69 year olds. Through this method,
2717 households containing an eligible person wereidenti®ed and survey interviews were achieved at 88%of these households. All household members within the
age range were recruited to the study so the sampleincludes a high proportion of couples. In this analysiswe have excluded those spouses whose age was outside
the target range, although they were included in thesurvey. Five and a half years after baseline, survivingrespondents were traced and re-interviewed (Disney,
Grundy & Johnson, 1997). By the time of the follow-up, 11% of the original sample were known to havedied and a further 26% could either not be traced orrefused, so the response rate was 70% (of those known
to have survived). Unfortunately, although not unex-pectedly, response rates at follow-up were lower in lessadvantaged social groups and varied by age and mari-
tal and health status. In order to minimise the biasarising from these variations in response, a re-weight-ing procedure was used which, in essence, adjusts the
numbers in speci®ed categories upwards or downwardsin order to allow for under or over representation inthe sample rising from di�erential response. The pro-gramme used to undertake this was the CALMAR
macro developed by the French national statisticsagency INSEE which is also used by the Departmentof Social Security (Deville, Sarndal & Sautory, 1993).
The re-weighting used for the Retirement Surveys,which is more fully detailed in the survey report (Dis-ney et al., 1997), involved adjustment for di�erential
loss to follow-up by social class, income quartile, agegroup, gender, marital status and presence/absence ofdisability. While this method corrects for under/over
representation of certain groups, the possibility offurther unknown di�erences between respondents andthose lost to follow-up cannot be allowed for, we havetherefore erred on the side of caution in the presen-
tation and interpretation of results.1
Measures of disability and health
Two indicators of health status were available. The
1 Extensive comparisons of raw (unweighted) and weighted
data were undertaken. These showed that di�erences in results
were in fact very slight, largely because the numbers in cat-
egories with response rates that di�ered substantially from
average were very small. The weighted data have been used in
preference to the raw data in accordance with statistical
advice and common practice as they do mean that some com-
ponents of bias are adjusted for. The derivation of weights
was undertaken by colleagues in the Institute of Fiscal Studies
and the Department of Social Security.
E. Grundy, G. Holt / Social Science & Medicine 51 (2000) 1061±1074 1063
®rst came from responses to a simple question on self-perceived health in the preceding 12 months. Respon-
dents were asked ``Over the last 12 months would yousay that on the whole your health has been: good;fairly good; or not good?'' The question has been used
widely in surveys, including the British General House-hold Survey. Numerous studies have shown associ-ations between self rated health and other health
indicators including use of health services, functionaldisability, and mortality (Blaxter, 1985; Idler & Kasl,1995; Idler & Benyamini, 1997; Manderbacka, Lund-
berg & Martikainen, 1999). Information on the disabil-ity status of respondents was collected using the scalesdeveloped for the ONS Disability Surveys carried outin 1985/6 (Martin, Meltzer & Elliot, 1988). A detailed
set of questions was asked on thirteen domains of dis-ability in order to rate the respondent's degree of dis-ability in each. A weighted score derived from
responses to these thirteen sub-scales was then assignedto a severity category ranging from 0 (no disability) to10 (most severe). In this paper, we have dichotomised
the severity of disability score distinguishing those withsome disability (scores of 1 or more) from those withnone.
Health and disability status are not equivalent con-cepts. Disability involves some limitation of functionarising from impairment. Such impairments may bethe result of congenital abnormality or trauma, but in
the age groups considered here will most usually be theconsequence of acquired chronic disease. Conceptuallyself-perceived health status may be an indicator of
impairment (albeit a rather imperfect one), and disabil-ity an indicator of the sequelae of impairment. In rec-ognition of this we have included baseline health status
as a co-variate in models of disability status at follow-up, but not disability in 1988/9 as a `precursor' ofhealth status in 1994.
Variables used in the analysis
The employment history data available were used
to construct a range of indicators of social class[based on the OPCS Classi®cations of Occupations,(OPCS, 1980)] at key points in adult life and
throughout adult life. These included social class atage 25 (approximately)2, social class of last or currentoccupation, and `average' lifetime social class. This last
was derived by summing the social class value relatingto each of the respondent's jobs and dividing by the
total number of jobs that that respondent had held.
Additionally a variable indicating the proportion ofworking life (since ®rst job) spent unemployed wasconstructed. A number of `dummy' variables relating
to employment related experiences, including whetherrespondents had ever been unemployed, been dismissedor made redundant were also created. Married women
were assigned to social class groups on the basis oftheir own occupations, rather than that of their hus-
bands. Four per cent of women (40) and 1% of men(11) had never been employed, and had to be excludedfrom analyses using occupationally based variables.
Other indicators of socio-economic status usedincluded educational quali®cation level, housing tenure
and income quartile. We distinguished between foureducational quali®cation groups: those with A'level(exams taken at ages 17±19) equivalent or higher quali-
®cations; those with O'level (exams taken at age 16)or equivalent quali®cations; those with trade, clericalor commercial quali®cations and those with no quali-
®cations. In most of the analyses we have simplydichotomised between those with some and those
with no quali®cations (women) or, for men, thosewith academic quali®cations (O'level and equivalentor higher) and those with other or no quali®cations.
Housing tenure, which has been shown to be associ-ated with health status in a wide range of studies(Arber & Ginn, 1993; Fox et al., 1985), was grouped
into three categories; owner occupiers; local authorityor housing association tenants, and a residual cat-
egory largely comprising private sector tenants. Grossincome from all sources was included in the calcu-lation of income quartile. In the case of couples, indi-
vidual income was set at 80% of the joint income, inaccordance with the scale devised by McClements(1978).
The demographic variables used in the analysisincluded age, measured in single years and treated
as a continuous variable, and a range of indicatorsbased on marital and fertility history. These datawere collected from all women and from unmarried
men. Men in ®rst marriages were assigned the samehistory as that of their wife, but obviously this
would not have been appropriate for the 10% in asecond or later marriage, so fertility history datafor this group are not available. Co-variates used in
the analysis included: current marital status, dichot-omised into married and not married; the pro-
portion of adult life (16+) spent married; whetherrespondents had been married more than once, ex-perience of divorce or death of a spouse; experience
of the death of a child; young age at marriage(under 21 years for women and under 25 years formen); number of children borne; and age at ®rst
and last birth. Additionally, those living in theSoutheast of England, the most prosperous region
2 A number of male respondents were in the armed
forces at the age of 25 (1944±58) In these cases social
class either immediately prior to enlistment or directly
after demobilisation, whichever was closest to age 25, was
used.
E. Grundy, G. Holt / Social Science & Medicine 51 (2000) 1061±10741064
of Great Britain, were distinguished from those liv-ing elsewhere.
All covariates used in the analysis refer to status atbaseline in 1988/9. The analysis was carried out usingSAS version 6.12.
Results
Characteristics of the study population
The vast majority of sample members had married(93%) and had had at least one child (79%). Twelveper cent had experienced divorce; 16% had been
widowed and 6% had experienced the death of a child.
A quarter of respondents lived in the Southeast. Some
60% of respondents were owner-occupiers, 22% had
an academic quali®cation (O'level or equivalent orhigher) and 60% no quali®cations (a proportion which
was higher among women than men). A third had ex-
perienced redundancy, a third unemployment and 6%
had at some time been dismissed from a job. Higherproportions of men compared with women had been
unemployed and had ever been dismissed or made
redundant. On the basis of last or current occupation,
just over half of all respondents were assigned to amanual social class group. Men were most likely to
have been employed in skilled manual jobs (IIIm)
throughout their working lives, while women were
more likely to have been employed in skilled non-man-
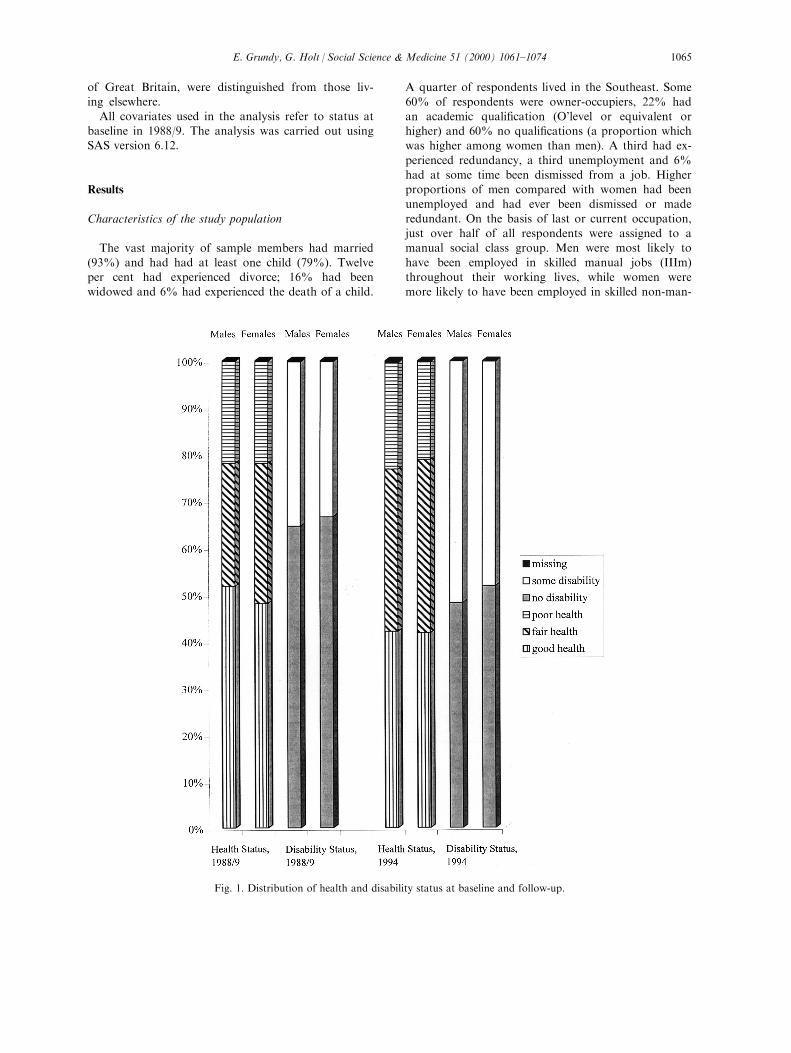
Fig. 1. Distribution of health and disability status at baseline and follow-up.
E. Grundy, G. Holt / Social Science & Medicine 51 (2000) 1061±1074 1065
ual jobs (IIIn). The distribution of the sample by mari-tal status, housing tenure and self reported health at
baseline and at follow-up was very similar to thatfound in the General Household Surveys for 1988 and1994 respectively (Bennett, Jarvis, Rowlands, Singleton
& Haselden, 1996 and Foster, Wilmot & Dobbs,1990). More detailed information on the distributionof respondents by demographic and socio-economic
characteristics is available on request from the authors.
Health and disability status
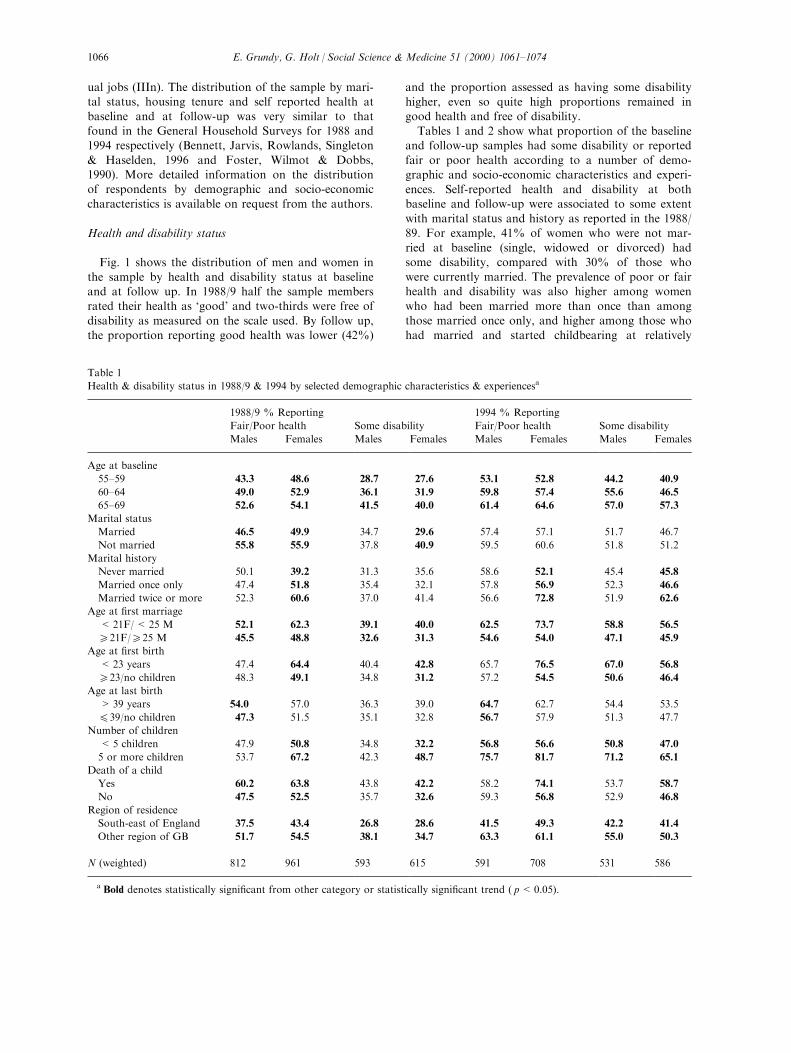
Fig. 1 shows the distribution of men and women inthe sample by health and disability status at baselineand at follow up. In 1988/9 half the sample membersrated their health as `good' and two-thirds were free of
disability as measured on the scale used. By follow up,the proportion reporting good health was lower (42%)
and the proportion assessed as having some disability
higher, even so quite high proportions remained ingood health and free of disability.
Tables 1 and 2 show what proportion of the baselineand follow-up samples had some disability or reported
fair or poor health according to a number of demo-graphic and socio-economic characteristics and experi-
ences. Self-reported health and disability at bothbaseline and follow-up were associated to some extent
with marital status and history as reported in the 1988/89. For example, 41% of women who were not mar-
ried at baseline (single, widowed or divorced) hadsome disability, compared with 30% of those who
were currently married. The prevalence of poor or fairhealth and disability was also higher among women
who had been married more than once than amongthose married once only, and higher among those who
had married and started childbearing at relatively
Table 1
Health & disability status in 1988/9 & 1994 by selected demographic characteristics & experiencesa
1988/9 % Reporting 1994 % Reporting
Fair/Poor health Some disability Fair/Poor health Some disability
Males Females Males Females Males Females Males Females
Age at baseline
55±59 43.3 48.6 28.7 27.6 53.1 52.8 44.2 40.9
60±64 49.0 52.9 36.1 31.9 59.8 57.4 55.6 46.5
65±69 52.6 54.1 41.5 40.0 61.4 64.6 57.0 57.3
Marital status
Married 46.5 49.9 34.7 29.6 57.4 57.1 51.7 46.7
Not married 55.8 55.9 37.8 40.9 59.5 60.6 51.8 51.2
Marital history
Never married 50.1 39.2 31.3 35.6 58.6 52.1 45.4 45.8
Married once only 47.4 51.8 35.4 32.1 57.8 56.9 52.3 46.6
Married twice or more 52.3 60.6 37.0 41.4 56.6 72.8 51.9 62.6
Age at ®rst marriage
< 21F/< 25 M 52.1 62.3 39.1 40.0 62.5 73.7 58.8 56.5
e21F/e25 M 45.5 48.8 32.6 31.3 54.6 54.0 47.1 45.9
Age at ®rst birth
< 23 years 47.4 64.4 40.4 42.8 65.7 76.5 67.0 56.8
e23/no children 48.3 49.1 34.8 31.2 57.2 54.5 50.6 46.4
Age at last birth
> 39 years 54.0 57.0 36.3 39.0 64.7 62.7 54.4 53.5
E39/no children 47.3 51.5 35.1 32.8 56.7 57.9 51.3 47.7
Number of children
< 5 children 47.9 50.8 34.8 32.2 56.8 56.6 50.8 47.0
5 or more children 53.7 67.2 42.3 48.7 75.7 81.7 71.2 65.1
Death of a child
Yes 60.2 63.8 43.8 42.2 58.2 74.1 53.7 58.7
No 47.5 52.5 35.7 32.6 59.3 56.8 52.9 46.8
Region of residence
South-east of England 37.5 43.4 26.8 28.6 41.5 49.3 42.2 41.4
Other region of GB 51.7 54.5 38.1 34.7 63.3 61.1 55.0 50.3
N (weighted) 812 961 593 615 591 708 531 586
a Bold denotes statistically signi®cant from other category or statistically signi®cant trend ( p<0.05).
E. Grundy, G. Holt / Social Science & Medicine 51 (2000) 1061±10741066
young ages. In 1994, for example, 77% of women who
had had their ®rst child before the age of 23 had somedisability, compared with 55% of other women. Rates
of disability and poor or fair health were also higher
among women who had had ®ve or more children andthose who had experienced the death of a child. Men
and women who lived in the South East of England
had lower rates of fair/poor health or disability thandid those living elsewhere in Britain. In assessing the
importance of these bi-variate associations, the relativesize of the groups with the characteristic in question
should be borne in mind. For example, only 6% of the
sample had experienced the death of a child whereas
25% were not currently married.
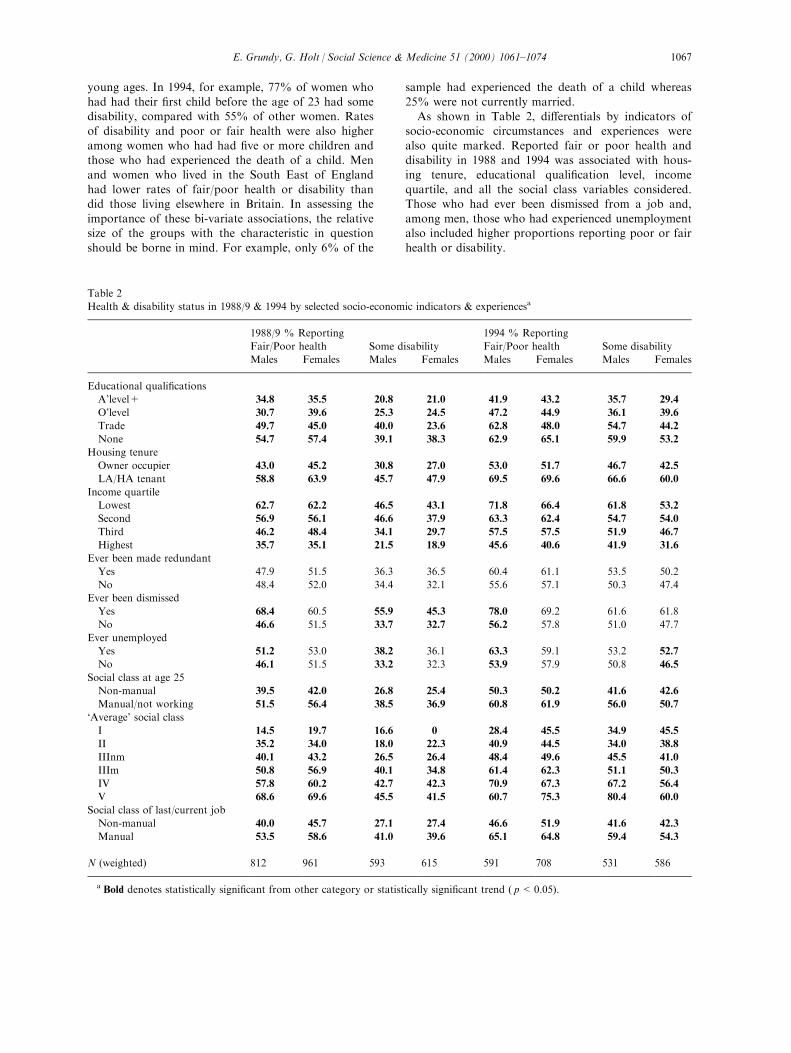
As shown in Table 2, di�erentials by indicators ofsocio-economic circumstances and experiences were
also quite marked. Reported fair or poor health anddisability in 1988 and 1994 was associated with hous-
ing tenure, educational quali®cation level, income
quartile, and all the social class variables considered.Those who had ever been dismissed from a job and,
among men, those who had experienced unemploymentalso included higher proportions reporting poor or fair
health or disability.
Table 2
Health & disability status in 1988/9 & 1994 by selected socio-economic indicators & experiencesa
1988/9 % Reporting 1994 % Reporting
Fair/Poor health Some disability Fair/Poor health Some disability
Males Females Males Females Males Females Males Females
Educational quali®cations
A'level+ 34.8 35.5 20.8 21.0 41.9 43.2 35.7 29.4
O'level 30.7 39.6 25.3 24.5 47.2 44.9 36.1 39.6
Trade 49.7 45.0 40.0 23.6 62.8 48.0 54.7 44.2
None 54.7 57.4 39.1 38.3 62.9 65.1 59.9 53.2
Housing tenure
Owner occupier 43.0 45.2 30.8 27.0 53.0 51.7 46.7 42.5
LA/HA tenant 58.8 63.9 45.7 47.9 69.5 69.6 66.6 60.0
Income quartile
Lowest 62.7 62.2 46.5 43.1 71.8 66.4 61.8 53.2
Second 56.9 56.1 46.6 37.9 63.3 62.4 54.7 54.0
Third 46.2 48.4 34.1 29.7 57.5 57.5 51.9 46.7
Highest 35.7 35.1 21.5 18.9 45.6 40.6 41.9 31.6
Ever been made redundant
Yes 47.9 51.5 36.3 36.5 60.4 61.1 53.5 50.2
No 48.4 52.0 34.4 32.1 55.6 57.1 50.3 47.4
Ever been dismissed
Yes 68.4 60.5 55.9 45.3 78.0 69.2 61.6 61.8
No 46.6 51.5 33.7 32.7 56.2 57.8 51.0 47.7
Ever unemployed
Yes 51.2 53.0 38.2 36.1 63.3 59.1 53.2 52.7
No 46.1 51.5 33.2 32.3 53.9 57.9 50.8 46.5
Social class at age 25
Non-manual 39.5 42.0 26.8 25.4 50.3 50.2 41.6 42.6
Manual/not working 51.5 56.4 38.5 36.9 60.8 61.9 56.0 50.7
`Average' social class
I 14.5 19.7 16.6 0 28.4 45.5 34.9 45.5
II 35.2 34.0 18.0 22.3 40.9 44.5 34.0 38.8
IIInm 40.1 43.2 26.5 26.4 48.4 49.6 45.5 41.0
IIIm 50.8 56.9 40.1 34.8 61.4 62.3 51.1 50.3
IV 57.8 60.2 42.7 42.3 70.9 67.3 67.2 56.4
V 68.6 69.6 45.5 41.5 60.7 75.3 80.4 60.0
Social class of last/current job
Non-manual 40.0 45.7 27.1 27.4 46.6 51.9 41.6 42.3
Manual 53.5 58.6 41.0 39.6 65.1 64.8 59.4 54.3
N (weighted) 812 961 593 615 591 708 531 586
a Bold denotes statistically signi®cant from other category or statistically signi®cant trend ( p<0.05).
E. Grundy, G. Holt / Social Science & Medicine 51 (2000) 1061±1074 1067
These bi-variate analyses suggest health at bothbaseline and follow-up was associated with a range of
indicators of demographic history, socio-economic cir-cumstances and experiences and life events. Clearlymany of these factors are interrelated so multivariate
analyses are needed in order to disentangle the e�ectsof the variables considered. Tables 3±6 present theresults of best-®t models of self reported health and
disability in 1988 and in 1994 for men and women re-spectively.
Multivariate analysis
The outcomes modelled were proportion in fair/poor
health and proportion with any disability. Several ofthe variables used in our initial analyses, for examplethose relating to social class, were highly interrelated.
In such cases our strategy was to select for inclusion inthe ®nal models presented below the variable mostconsistently, and strongly, associated with the outcome
variables. Of the variables included, a number werecontinuous, or could be treated as continuous, (age;proportion of adult life spent married; proportion of
adult life spent unemployed; average social class), theremainder were dichotomised. Overall the models
accounted for some 7±16% of variation in the out-come measures. Although statistically highly signi®-
cant, such values indicate that factors other than thosewhich could be examined in this analysis are importantin explaining the observed variation in self-rated health
and disability. Odds ratios presented are adjusted forall the co-variates shown in the relevant part of thetable.
Self-perceived health status
Tables 3 and 4 show for men and women respect-ively the results from ®tting logistic regression modelsto the data on reported health status at baseline in1988/9 and follow-up in 1994. The odds of poor or
fair health increased with age, although this was notsigni®cant for women at baseline, and were consider-ably higher for those living outside the Southeast, par-
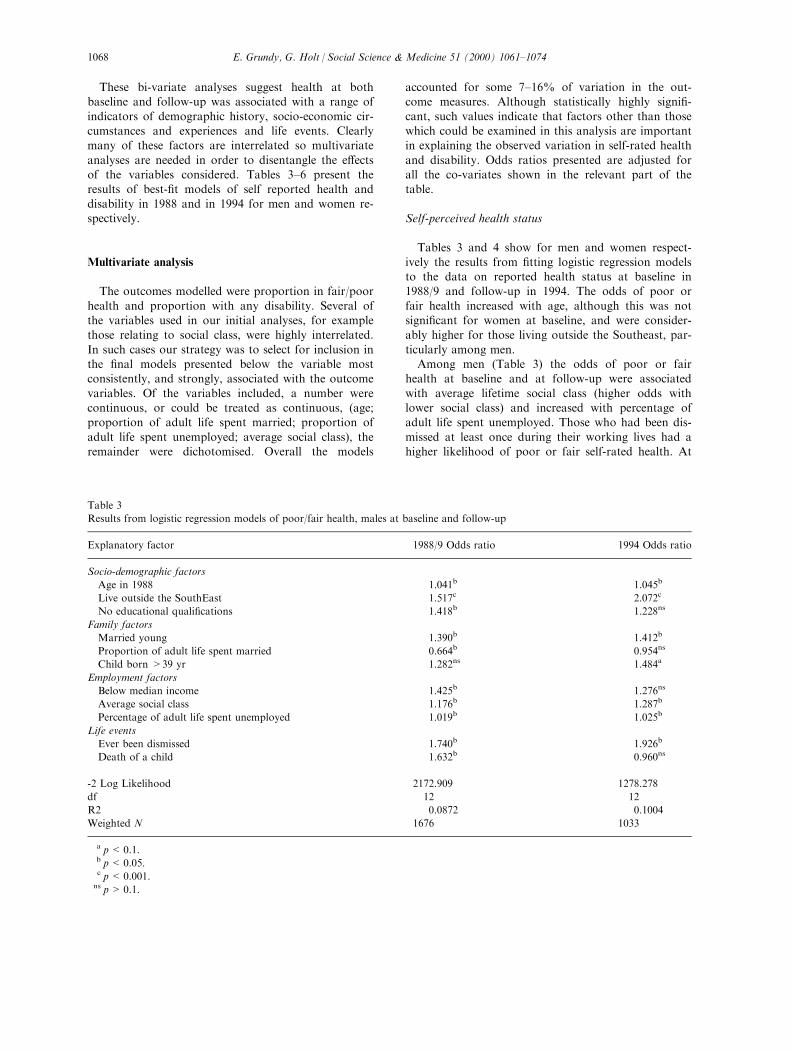
ticularly among men.Among men (Table 3) the odds of poor or fair
health at baseline and at follow-up were associated
with average lifetime social class (higher odds withlower social class) and increased with percentage ofadult life spent unemployed. Those who had been dis-
missed at least once during their working lives had ahigher likelihood of poor or fair self-rated health. At
Table 3
Results from logistic regression models of poor/fair health, males at baseline and follow-up
Explanatory factor 1988/9 Odds ratio 1994 Odds ratio
Socio-demographic factors
Age in 1988 1.041b 1.045b
Live outside the SouthEast 1.517c 2.072c
No educational quali®cations 1.418b 1.228ns
Family factors
Married young 1.390b 1.412b
Proportion of adult life spent married 0.664b 0.954ns
Child born >39 yr 1.282ns 1.484a
Employment factors
Below median income 1.425b 1.276ns
Average social class 1.176b 1.287b
Percentage of adult life spent unemployed 1.019b 1.025b
Life events
Ever been dismissed 1.740b 1.926b
Death of a child 1.632b 0.960ns
-2 Log Likelihood 2172.909 1278.278
df 12 12
R2 0.0872 0.1004
Weighted N 1676 1033
a p<0.1.b p<0.05.c p<0.001.ns p>0.1.
E. Grundy, G. Holt / Social Science & Medicine 51 (2000) 1061±10741068
Table 4
Results from logistic regression models of poor/fair health, females at baseline and follow-up
Explanatory factor 1988/9 Odds ratio 1994 Odds ratio
Socio-demographic factors
Age in 1988 1.015ns 1.037b
Live outside the SouthEast 1.367b 1.481b
No quali®cations 1.249a 1.524b
Owner occupier 0.768b 0.676b
Family factors
Married more than once 1.401b 1.801b
Child born <23 yr 1.375b 1.890c
Had more than four children 1.362ns 2.013b
Employment factors
Below median income 1.422b 1.227ns
Average social class 1.173b 1.041ns
Life events
Death of a child 1.450a 1.499ns
-2 Log Likelihood 2387.298 1510.816
df 11 11
R2 0.0669 0.0932
Weighted N 1817 1185
a p<0.1.b p<0.05.c p<0.001.ns p>0.1.
Table 5
Results from logistic regression models of some disability, males at baseline and follow-up
Explanatory factor 1988/9 Odds ratio 1994 Odds ratio
Socio-demographic factors
Age in 1988 1.051c 1.057c
Live outside the SouthEast 1.393b 1.251ns
No educational quali®cations 1.288ns 1.694b
Owner occupier 0.918ns 0.697b
Family factors
Married young 1.312b 1.429b
Had more than four children 0.985ns 1.936a
Employment factors
Below median income 1.505c 0.847ns
Average social class 1.187b 1.160a
Percentage of adult life spent unemployed 1.020b 1.005ns
Life events
Ever been dismissed 1.849b 0.839ns
Health in 1988/9
In fair/poor health in 1988/9 ± 3.224c
-2 Log Likelihood 2034.381 1248.160
df 11 12
R2 0.0807 0.1484
Weighted N 1673 1035
a p<0.1.b p<0.05.c p<0.001.ns p>0.1.
E. Grundy, G. Holt / Social Science & Medicine 51 (2000) 1061±1074 1069
baseline, but not at follow-up, having no academicquali®cations and an income below the median were
also associated with higher odds. A young age at mar-riage was positively associated with higher odds ofpoor or fair health in both 1988 and 1994 while the
proportion of adult life spent married was negativelyassociated with this outcome at baseline. The oddsratio at baseline was also signi®cantly raised among
those who had experienced the death of a child. Menwho had had a child at the age of 40 or older werealso more likely to report fair or poor health in 1994,
although the strength of this association did not reachthe 5% level of signi®cance.Factors associated with increased probability of
female fair/poor self rated health included: having no
quali®cations; having been married more than once;and being under 23 years of age at ®rst birth. At base-line, but not at follow-up, having an income below the
median, and average social class were also associatedwith higher odds of fair or poor health, as was experi-ence of a death of a child, although this was only sig-
ni®cant at the 10% level. High parity (®ve or morechildren) increased the risk of poor or fair health atfollow-up. At both points in time, owner-occupiers
had lower odds of poor or fair health than did tenants.
Disability
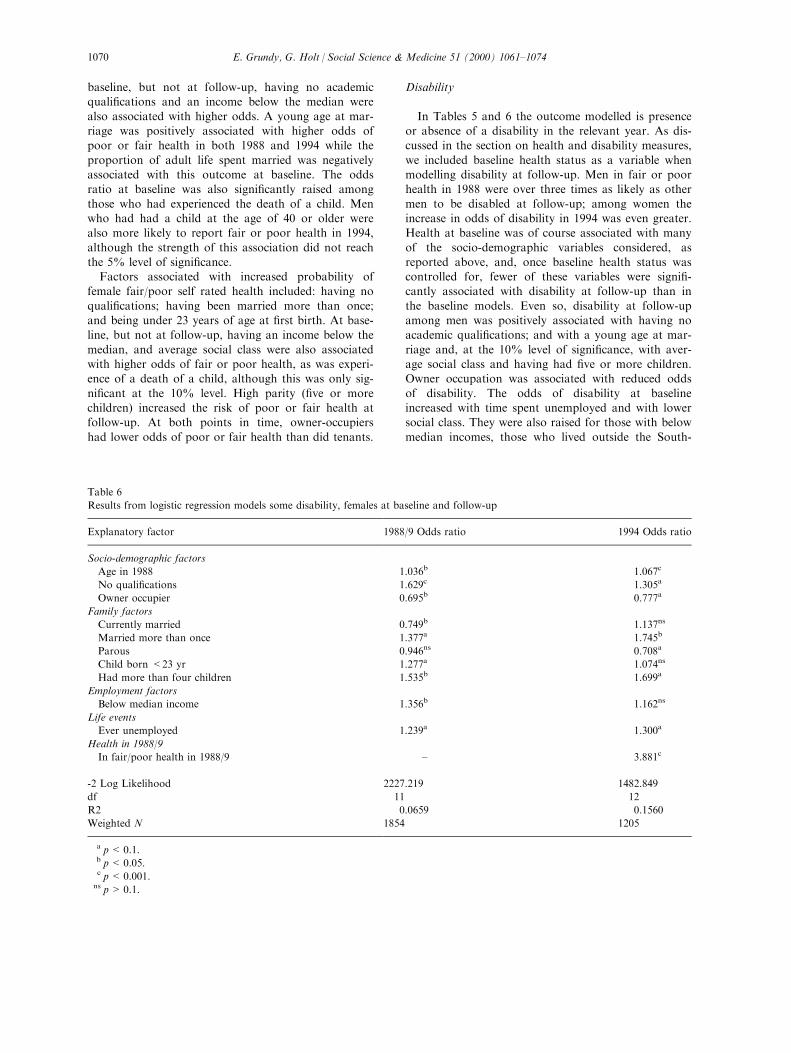
In Tables 5 and 6 the outcome modelled is presenceor absence of a disability in the relevant year. As dis-cussed in the section on health and disability measures,
we included baseline health status as a variable whenmodelling disability at follow-up. Men in fair or poorhealth in 1988 were over three times as likely as other
men to be disabled at follow-up; among women theincrease in odds of disability in 1994 was even greater.Health at baseline was of course associated with many
of the socio-demographic variables considered, asreported above, and, once baseline health status wascontrolled for, fewer of these variables were signi®-cantly associated with disability at follow-up than in
the baseline models. Even so, disability at follow-upamong men was positively associated with having noacademic quali®cations; and with a young age at mar-
riage and, at the 10% level of signi®cance, with aver-age social class and having had ®ve or more children.Owner occupation was associated with reduced odds
of disability. The odds of disability at baselineincreased with time spent unemployed and with lowersocial class. They were also raised for those with below
median incomes, those who lived outside the South-
Table 6
Results from logistic regression models some disability, females at baseline and follow-up
Explanatory factor 1988/9 Odds ratio 1994 Odds ratio
Socio-demographic factors
Age in 1988 1.036b 1.067c
No quali®cations 1.629c 1.305a
Owner occupier 0.695b 0.777a
Family factors
Currently married 0.749b 1.137ns
Married more than once 1.377a 1.745b
Parous 0.946ns 0.708a
Child born <23 yr 1.277a 1.074ns
Had more than four children 1.535b 1.699a
Employment factors
Below median income 1.356b 1.162ns
Life events
Ever unemployed 1.239a 1.300a
Health in 1988/9
In fair/poor health in 1988/9 ± 3.881c
-2 Log Likelihood 2227.219 1482.849
df 11 12
R2 0.0659 0.1560
Weighted N 1854 1205
a p<0.1.b p<0.05.c p<0.001.ns p>0.1.
E. Grundy, G. Holt / Social Science & Medicine 51 (2000) 1061±10741070
east, those who had married young and those who hadexperienced dismissal from a job.
Among women, owner occupiers had a reduced riskof disability at baseline and at follow-up as, in case ofdisability status at baseline, did currently married
women. Those without quali®cations and with incomesbelow the median had higher odds of disability atbaseline. Family factors associated with baseline dis-
ability included high parity and, at the 10% level ofsigni®cance, having being married more than once andyoung age at ®rst marriage. The odds of disability at
follow-up were raised in high parity women but loweramong the parous than the childless.Taken together the results of these analyses of vari-
ations in health and disability status show that among
both men and women health and disability at twopoints in time were associated with socio-economicand demographic history and circumstances and with
experience of adverse life events. Among men associ-ations with employment related factors and regionwere stronger than among women, while family related
factors tended to be more strongly associated withvariations in the health and disability status of women.Comparing baseline and follow-up models, income was
more consistently associated with baseline outcomesthan with health and disability in 1994 (by which timevery few sample members were working).
Discussion
There are a number of limitations to the study wereport on here. Firstly, the information on health and
disability comes from self-reports (albeit very detailedself-reports in the case of disability). Although self-reported health status has been shown in a number ofstudies to be correlated with other health indicators
(Blaxter, 1991; Idler & Kasl, 1995; Sundquist &Johansson, 1997), clearly there may be associationsbetween socio-economic factors and perceptions of
health which could confound our results. If, as seemsprobable, those in less advantaged social groups havelower health expectations, the e�ect of any such bias
would mean that some of the results reported heremay be too conservative, rather than exaggerated.However, the lack of any observational data on health,or of information on health related behaviour such as
smoking, remains a limitation.A further possible data problem is the e�ect of recall
bias. In a population such as that of contemporary
Great Britain, misreporting of events such as marriageand childbearing is not likely to be serious. Berney andBlane (1997) reported good recall of social circum-
stances 50 years earlier when a lifegrid method of ret-rospective data collection was used. However, recall ofthe details of work many decades earlier may be more
of a problem. Respondents were asked to consult rel-
evant documents, such as payslips, pension books, sav-ings certi®cates and bank statements, when answeringthe questions of employment and ®nances, even so
some degree of misreporting seems likely. A furtherproblem is di�erential loss to follow-up, although wehave tried to adjust for this, the adjustment process
involves making various assumptions which may notbe correct. As with all studies of particular cohorts, it
is unclear whether the results are generalisable to thoseborn in di�erent time periods and with di�erent ex-posures to events such as war, conscription and econ-
omic shock. Finally, as our results come from anobservational study, we cannot show cause and e�ect.
Despite these limitations, a number of importantconclusions may be drawn from the analyses. Firstly,it seems that demographic history and events, as well
as socio-economic history and circumstances, are as-sociated with health and disability status in early oldage, particularly among women. As reported in a num-
ber of other studies, marriage was generally associatedwith better health outcomes. However, having married
young, a young age at childbearing and having mar-ried more than once were in some cases associatedwith a higher odds of poor health or disability, even
after allowing for age, educational, employment andincome related factors. The ®nding of an association
between high parity and poorer health among womenin the study is consistent with earlier work on thistopic (Kington et al., 1997). Kington et al. (1997) also
found an association between experience of the deathof an infant and poorer health among women aged 50and over, we found a relationship with experience of
death of a child at any age. A range of factors mightaccount for this, including the greater risks of death
among infants whose mothers have poor health orunhealthy behaviours (particularly smoking), possibleintergenerational congruence in health related beha-
viour, risk taking and genetic vulnerability and ®nally,the adverse e�ect of a child's death on the parent'smental health and well-being. We also found some as-
sociation between late paternity and health, althoughthis e�ect was not strong. Some recent studies have
suggested that daughters born to older fathers havereduced longevity (Gavrilov & Gavrilova, 1997) but weare not aware of research showing an implication for
the health of the father. It seems most likely that thispossible association, which needs con®rmation, re¯ects
the operation of various selection factors not con-trolled for in this analysis, rather than a direct e�ect.Associations between health status and the socio-econ-
omic and employment related factors considered weregenerally in the expected direction. Average lifetimesocial class, few or no educational quali®cations and
low income increased the odds of being in poor healthor having some disability at baseline and at follow-up
E. Grundy, G. Holt / Social Science & Medicine 51 (2000) 1061±1074 1071
while owner occupation was associated with a reduced
risk, particularly among women. The stronger associ-ation between tenure and health outcomes amongwomen as compared with men may re¯ect a lesser sal-
ience of occupationally based variables, and the lesserheterogeneity in social class, in women in thesecohorts. Length of time spent unemployed increased
the odds of poor outcomes to a large extent, a ®ndingconsistent with other work on links between unemploy-
ment and health related outcomes (Moser, Goldblatt,Fox & Jones, 1987).Those living outside the Southeast of England, par-
ticularly men, also had higher odds of poor health ordisability. This is consistent with our knowledge of re-
gional variations in mortality and may re¯ect the oper-ation of a range of factors, such as di�erentialmigration and the e�ect of living in a `depressed' area.
Analyses of larger data sets allowing greater areal dis-aggregation are needed to investigate this ®ndingfurther.
It is likely that some of the associations found re¯ectthe operation of various selection factors, rather than,
or in addition to, causally important in¯uences. Insome cases the direction of the causation may bereversed. Poor health or unhealthy behaviours, such as
heavy drinking, may, for example, increase both therisk of being dismissed from a job and the risk of poorhealth in later life. However, there are also plausible
causal pathways that may underlie the associationsfound. Stress resulting from lack of status or control
at work, for example, has been associated with poorerhealth outcomes hypothesised to operate through de-pressed immunological responses, as well as beha-
vioural di�erences (Marmot & Theorell, 1988).Accumulated lifetime stresses and insults arise in otherspheres of life, as well as work. Stress arising from
family related experiences, such as early marriage andchildbearing, both of which are risk factors for marital
breakdown and so presumably for marital con¯ict,(Murphy, 1985) may have a similar e�ect. It is alsoknown that events such as widowhood and divorce are
associated with adverse behavioural changes, includingincreased smoking and drinking (Bowling, 1987).Large family size may itself cause stress in a society
with generally low fertility, as well as having directe�ects on the risks of developing certain chronic dis-
eases, such as diabetes and cardiovascular disease(Kritz-Silverstein, Barrett-Connor, Wingard & Fried-lander, 1994; Ness et al., 1993).
These results show clearly that socio-economic,demographic, and `life events' factors are all associated
with health status in early old age and that integrated,rather than bifurcated, approaches to the study ofhealth di�erentials are needed. Further analyses of
changes in health indicators between baseline and fol-low-up, and of associations with characteristics at fol-
low-up currently in progress may allow moreexploration of possible causal pathways and shed
further light on these associations. Studies based onother data sets are also needed.
Acknowledgements
The research reported here was supported by theEconomic and Social Research Council (UK) as partof its Health Variations Programme (Phase 2), grantreference number L128 25 1040. The British Retire-
ment Survey was commissioned by the UK Depart-ment of Social Security (DSS) and carried out by theSocial Survey Division of the O�ce of National Stat-
istics (formerly the O�ce of Population Censuses andSurveys). Respondents were interviewed twice: once in1988/89 and again in 1994. The DSS commissioned the
Institute of Fiscal Studies and the Age Concern Insti-tute of Gerontology to analyse the combined datasetand ®ndings were published in the report `Thedynamics of retirement' edited by R. Disney, E.
Grundy and P. Johnson, DSS Research Report No.72, The Stationery O�ce. Views expressed in thispaper are not necessarily those of the DSS or any
other government department.
References
Acheson, D. (1998). Independent inquiry into inequalities in
health report. London: The Stationery O�ce.
Arber, S., & Ginn, J. (1993). Gender and inequalities in
health in later life. Social Science & Medicine, 36, 33±46.
Barker, D. J. P. (1992). Fetal and infant origins of adult dis-
eases. London: British Medical Journal Publications.
Bartley, M., Blane, D., & Montgomery, S. (1997).
Socioeconomic determinants of health: health and the life
course: why safety nets matter. British Medical Journal,
314, 1194±1198.
Bennett, N., Dodd, T., Flatley, J., Freeth, S., & Bolling, K.
(1995). Health Survey for England 1993. London: HMSO.
Bennett, N., Jarvis, L., Rowlands, O., Singleton, N., &
Haselden, L. (1996). General Household Survey 1994.
London: HMSO.
Berney, L., & Blane, D. (1997). Collecting retrospective data:
accuracy of recall after 50 years judged against historical
records. Social Science & Medicine, 45, 1519±1525.
Blane, D., Berney, L., Davey Smith, G., Gunnell, D. J., &
Holland, P. (1999). Reconstructing the life course: health
during early old age in a follow-up study based on the
Boyd Orr cohort. Public Health, 113, 117±124.
Blaxter, M. (1985). Self de®nition of health status and consul-
tation rates in primary care. Quarterly Journal of Social
A�airs, 1, 131.
Blaxter, M. (1991). Fifty years on Ð inequalities in health. In
M. Murphy, & J. Hobcroft, Population research in Britain
(pp. 69±94). London: Population Investigation Committee.
E. Grundy, G. Holt / Social Science & Medicine 51 (2000) 1061±10741072
Bone, M., Gregory, J., Gill, B., & Lader, D. (1992).
Retirement and Retirement Plans. London: HMSO.
Bowling, A. (1987). Mortality after bereavement: a review of
the literature on survival periods and factors a�ecting sur-
vival. Social Science & Medicine, 24, 117±124.
Davey Smith, G., Hart, C., Blane, D., Gillis, C., &
Hawthorne, V. (1997). Lifetime socioeconomic position
and mortality: prospective observational study. British
Medical Journal, 314, 547±550.
Department of Health (1999). Reducing health inequalities: an
action report. London: Department of Health.
Deville, J., Sarndal, C., & Sautory, O. (1993). Generalised
raking procedures in survey sampling. Journal of the
American Statistical Society, 88, 1013±1020.
Disney, R., Grundy, E., & Johnson, P. (1997). The dynamics
of retirement: analysis of the Retirement Surveys. In
Department of Social Security Research Report, no. 72.
London: The Stationery O�ce.
Forsdahl, A. (1977). Are poor living conditions in childhood
and adolescence an important risk factor for arteriosclero-
tic disease? British Journal of Preventative Social Medicine,
31, 91±95.
Foster, K., Wilmot, A., & Dobbs, J. (1990). General
Household Survey 1988. London: HMSO.
Fox, A. J., Goldblatt, P. O., & Jones, D. R. (1985). Social
class mortality di�erentials: artefact, selection or life cir-
cumstances? Journal of Epidemiology and Community
Health, 39, 1±8.
Gavrilov, L. A., & Gavrilova, N. S. (1997). Parental age at
conception and o�spring longevity. Reviews in Clinical
Gerontology, 7, 5±12.
Glaser, K., Murphy, M., & Grundy, E. (1997). Limiting long
term illness and household structure among people aged
45 and over, Great Britain 1991. Ageing and Society, 17,
3±19.
Goldman, N., Korenman, S., & Weinstein, R. (1995). Marital
status and health among the elderly. Social Science &
Medicine, 40, 1717±1730.
Green, A., Beral, V., & Moser, K. (1988). Mortality in
women in relation to their childbearing. British Medical
Journal, 297, 391±395.
Grundy, E. (1987). Future patterns of morbidity among the
elderly. In F. I. Caird, & J. Grimley, Advanced geriatric
medicine (pp. 53±72). Bristol: John Wright.
Grundy, E. (1993). Moves into supported private households
among elderly people in England and Wales. Environment
and Planning, 25, 1467±1479.
Grundy, E., Bowling, A., & Farquhar, M. (1996). Social sup-
port, life satisfaction and survival at older ages. In G.
Caselli, & A. Lopez, Health and mortality among elderly
populations (pp. 135±156). Oxford: Clarendon Press.
Grundy, E., & Glaser, K. (1998). Disability, health, receipt of
bene®ts and receipt and provision of care. In R. Disney,
E. Grundy, & P. Johnson, The dynamics of retirement (pp.
73±131). London: The Stationery O�ce Department of
Social Security Research Report no. 72.
Grundy, E., Glaser, K. (2000) Di�erentials in the onset and
progression of disability in early old age in Great Britain,
Age and Ageing (in press).
Idler, E. L., & Kasl, S. V. (1995). Self ratings of health: do
they also predict change in functional ability? J. Gerontol.
B. Psychol. Sci. Soc. Sci., 50, S344±353.
Idler, E. L., & Benyamini, Y. (1997). Self-rated health and
mortality: a review of twenty-seven community studies.
Journal of Health and Social Behaviour, 38, 21±37.
Kington, R., Lillard, L., & Rogowski, J. (1997). Reproductive
history, socioeconomic status, and self-reported health sta-
tus of women aged 50 years or older. American Journal of
Public Health, 87(1), 33±37.
Kivela, S. L., Kongas-Saviaro, P., Laippala, P., Pahkala, K.,
& Kesti, E. (1996). Social and psychosocial factors predict-
ing depression in old age: a longitudinal study. Int.
Psychogeriatr., 8(4), 635±644.
Kritz-Silverstein, D., Barrett-Connor, E., Wingard, D. L., &
Friedlander, N. J. (1994). Relation of pregnancy history to
insulin levels in older, nondiabetic women. American
Journal of Epidemiology, 140, 375±382.
Kunst, A. (1997). Cross-national comparisons of socio-econ-
omic di�erences in mortality. Thesis Erasmus University,
Rotterdam.
Lund, E., Arnesen, E., & Borgan, J. K. (1990). Pattern of
childbearing and mortality in married women Ð a
national prospective study from Norway. Journal of
Epidemiology and Community Health, 44, 237±240.
Manderbacka, K., Lundberg, O., & Martikainen, P. (1999).
Do risk factors and health behaviours contribute to self
ratings of health? Social Science & Medicine, 48, 1713±
1720.
Markides, K. S., & Cooper, C. L. (1989). Aging, stress and
health. New York: Wiley.
Marmot, M., & Theorell, T. (1988). Social class and cardio-
vascular disease: the contribution of work. International
Journal of Health Services, 18, 659±674.
Marmot, M. G., & Shipley, M. J. (1996). Do socioeconomic
di�erences in mortality persist after retirement? 25 year
follow up of civil servants from the ®rst Whitehall study.
British Medical Journal, 313, 1177±1180.
Martin, J., Meltzer, H., & Elliot, D. (1988). The prevalence of
disability among adults. London: HMSO.
McClements, L. D. (1978). The economics of social security.
London: Heinemann Educational Books.
Medical Research Council (1994). Topic Review: The health of
the UK's elderly people. London: Medical Research
Council.
Moser, K., Goldblatt, P. O., Fox, A. J., & Jones, D. R.
(1987). Unemployment and mortality: comparison of the
1971 and 1981 Longitudinal Study samples. British
Medical Journal, 294, 86±90.
Murphy, M. (1985). Demographic and socio-economic in¯u-
ences on recent British marital breakdown patterns.
Population Studies, 39, 441±460.
Murphy, M., Glaser, K., & Grundy, E. (1997). Marital status
and long-term illness in Britain. Journal of Marriage and
the Family, 59, 156±164.
Ness, R. B., Harris, T., Cobb, J., Flegal, K. M., Kelsey, J. L.,
Balanger, A., Stunkard, A. J., & d'Agostino, R. B. (1993).
Number of pregnancies and the subsequent risk of cardio-
vascular disease. New England Journal of Medicine, 328,
1528±1533.
ONS (1999). O�ce for National Statistics Table 6.1.
Population Trends, 96, 77.
E. Grundy, G. Holt / Social Science & Medicine 51 (2000) 1061±1074 1073
OPCS (1980). O�ce of Population Censuses and Surveys. In
Classi®cation of occupations and coding index. London:
HMSO.
Preston, S. H., & Taubman, P. (1994). Socioeconomic di�er-
ences in adult mortality and health status. In L. G.
Martin, & S. H. Preston, The demography of agin.
Washington, DC: National Academy Press.
Sundquist, J., & Johansson, S. E. (1997). Self reported health
and low educational level predictors for mortality: a popu-
lation based follow up study of 39,156 people in Sweden.
Journal of Epidemiology and Community Health, 51, 35±40.
Townsend, P., & Davidson, N. (1982). Inequalities in health:
the Black report. London: Penguin Books.
Vagero, D., & Lundberg, O. (1995). Socio-economic mortality
di�erentials among adults in Sweden. In A. Lopez, G.
Caselli, & T. Valkonen, Adult mortality in developed
countries: from description to explanation (pp. 223±242).
Oxford: Clarendon Press.
Victor, C. R. (1989). Inequalities in health in later life. Age
and Ageing, 18, 387±391.
Wadsworth, M. E. (1997). Health inequalities in the life
course perspective. Social Science and Medicine, 44, 859±
869.
Wilkinson, R. G. (1996). Unhealthy societies: the a�ictions of
inequality. London: Routledge.
Wunsch, G., Duchene, J., Thiltges, E., & Salhi, M. (1996).
Socioeconomic di�erences in mortality. A life course
approach. European Journal of Population, 12, 167±185.
E. Grundy, G. Holt / Social Science & Medicine 51 (2000) 1061±10741074