Embed Size (px)
Citation preview

Adult Fall Chinook Salmon Passage through Fishways at
Lower Columbia River Dams, 2002-2005
Kinsey E. Frick,† Brian J. Burke,
† Mary L. Moser,
† and Christopher A. Peery
‡
Report of Research by
†Fish Ecology Division
Northwest Fisheries Science Center
National Marine Fisheries Service
2725 Montlake Boulevard East
Seattle, Washington 98112
and
‡U.S. Geological Survey
Idaho Cooperative Fish and Wildlife Research Unit
University of Idaho
Moscow, Idaho 83844-1141
for
Portland District
Northwestern Division
U.S. Army Corps of Engineers
P.O. Box 2946
Portland, Oregon 97208-2946
Projects ADS-00-1 through 5 and ADS-00-12
May 2008

ii

iii
EXECUTIVE SUMMARY
Radiotelemetry tags were gastrically implanted in fall Chinook salmon
Oncorhynchus tshawytscha to examine behavior trends at hydropower dams from 2002 to
2005. Movements were monitored as fish migrated upstream using radiotelemetry
receivers placed along the Columbia River, at the mouths of most tributaries, and
throughout fishways at four lower Columbia River dams (Bonneville, The Dalles, John
Day, and McNary Dams). Results were examined for interannual and interdam
differences, and compared to fall Chinook salmon movements from previous years
(Burke et al. 2005). Striking consistencies in fish behavior at individual dams were
observed between years.
Passage efficiency at dams on the lower Columbia River ranged from 89.3 to
97.3% during the four years and was relatively stable through time. Similarly, differences
in dam passage durations were greater among dams than among years (medians ranged
from 12 to 23.5 h across all dams and years). Fish passed McNary Dam more quickly
than the other dams in each year, though between dam comparisons are tricky due to the
unique structure design and receiver configuration at each project. While fishway use
patterns were dam-specific, strong preferences were observed for individual fishways at
each dam (like the John Day Dam south fishway). Entrance efficiencies ranged from 66.5
to 96.5%. Once fish entered a fishway, it was generally used for a passage attempt,
except at McNary Dam where fish approached and entered primarily at the south ladder,
but often abandoned it and later used the for north ladder.
When time at the dam was analyzed by segment, fall Chinook salmon appeared to
spend the majority of their time in the tailrace and at the base of the dams, and this
occurred both before and after making attempts to pass the dam. Within fishways fish
spent the most time in ladders. Total time spent in the collection channel and transition
pool segments was relatively low, but these areas were common turn-around points for
fish that failed to pass a dam. Turn-arounds were observed in all segments of the
fishways at each dam examined. However, the median number of attempts made at a
segment was consistently low. Fish at John Day Dam made the most turn-arounds prior
to dam passage.
Fallback rates varied among dams and ranged from 7.0 to 10.5% of the fish that
passed. Most fallback events occurred more than 24 h after fish had cleared the dams,
supporting volitional returns rather than unintentional fallbacks. However, for fallbacks
within 24 h of passage, the rate was often dependent on the fishway used to ascend,
particularly at The Dalles and John Day Dams.

iv

v
CONTENTS
EXECUTIVE SUMMARY................................................................................................ iii
INTRODUCTION............................................................................................................... 1
TAGGING METHODS ...................................................................................................... 3
PASSAGE EFFICIENCY ................................................................................................... 5
Methods................................................................................................................... 5
Results ..................................................................................................................... 5
PASSAGE DURATION ..................................................................................................... 9
Methods................................................................................................................... 9
Results ..................................................................................................................... 9
FISHWAY USE AND BEHAVIOR ................................................................................. 19
Approaches, Entrances, and Exits into/from Fishways ......................................... 19
Methods..................................................................................................... 19
Results ....................................................................................................... 20
Duration in Fishway Segments ............................................................................. 22
Methods..................................................................................................... 22
Results ....................................................................................................... 23
Turn-Arounds ........................................................................................................ 27
Methods..................................................................................................... 27
Results ....................................................................................................... 28
Fallback Fish ......................................................................................................... 37
Methods..................................................................................................... 37
Results ....................................................................................................... 37
DISCUSSION ................................................................................................................... 40
ACKNOWLEDGEMENTS .............................................................................................. 47
REFERENCES ................................................................................................................. 48
APPENDIX: 2001 Dam Antenna Locations .................................................................... 52

vi

INTRODUCTION
An important aspect of the adult Pacific salmonid Oncorhynchus spp.
radiotelemetry research project is describing how fish move past dams in the lower
Columbia and Snake Rivers. Monitoring the fishway entrance use and movements within
the fishways of adult salmon and steelhead at all four of the lower Snake River dams
began in spring 1993 and continued through 1994. Antennas connected to SRX/DSP
receivers were placed near entrances to fishways, within fishways, and at the top of the
ladders at these dams. Coverage was later expanded to include the four dams on the
lower Columbia River, major tributary mouths, and some passage routes at dams in the
middle Columbia River.
With this telemetry system, we monitored movements of individual radio-tagged
fish as they approached entrances to fishways, and identified fishway openings used by
fish to enter and exit. We also documented movements within fishways, and assessed the
time required for fish to pass the dams. Radiotelemetry has also allowed documentation
of system-wide timing and movements (Keefer et al. 2004), fishway use and passage in
years prior to 1998, and for other runs and species (Bjornn et al. 1995, 1998a, Keefer et
al. 2003a, and Naughton et al. (2005)). Detailed information on fishway use and passage
for fall Chinook in 1998 through 2001 was reported by Burke et al. (2005). The study
described here continues these analyses and compares results obtained in 2002 to 2005 to
results in Burke et al. (2005).
The objectives relating to the movement of fall Chinook salmon tagged from 2002
through 2005 included, but were not limited to, monitoring fishway entrance use,
measuring movements and turn-arounds in the fishways, examining delay and passage
times at lower Columbia and Snake River dams, and determining routes and rates of
fallback events.

2

3
TAGGING METHODS
Fall Chinook salmon (mean length = 81.5 cm, range 51 to 109.5 cm; Figure 1)
were collected in the Washington shore adult fish facility (AFF) at Bonneville Dam on
the mainstem Columbia River (river kilometer (rkm) 235.1; Table 1). Here, they were
outfitted with radio transmitters via intragastric insertion (Mellas and Haynes 1985).
Sampling started in early August and ran into October, and coincided with the fall
Chinook run (Table 1; Figure 2). The median size and length distribution of fish tagged
in 2003 and 2004 were similar to previous years (Burke et al. 2005); fish tagged in 2002
and 2005 were slightly smaller. The number of fish tagged on each day was roughly
proportionate to their abundance based on longer-term averages of run size (Figure 2).
To maximize sample sizes across the lower Columbia River hydropower projects, upriver
bright fall Chinook were selected when possible. In general, tules, fish that spawn in
tributaries of the lower Columbia River, were not selected.
Fixed Lotek1 SRX receivers detected radio-tagged fish in and around dam
structures at each of the four lower Columbia River dams. These receivers were used to
determine when a fish approached a dam, entered a fishway, moved within the fishway,
and exited the fishway (See Appendix for dam-specific maps of antenna locations).
Bjornn et al. (2000) and Keefer et al. (2004) provide a detailed description of tagging and
monitoring methods used throughout the basin. Methods and results for individual
analyses in this report are given in the following sections.
Table 1. Number of fish released above and below Bonneville Dam (BO) and dates of
release in each year.
2002 2003 2004 2005
1 Aug-15 Oct 1 Aug-15 Oct 17 Aug-3 Oct 24 Aug-1 Oct
Total Number Tagged 1066 666 606 600
Released Downstream of BO 755 665 571 0
Released into BO ladder 1 1 35 600
Released Upstream of BO 310 0 0 0
1 Use of trade names does not imply endorsement by the National Marine Fisheries Service, NOAA.

4
0
20
40
60
80
100
120
140
160
40 50 60 70 80 90 100 110 120
Fork Length (cm)
Freq
uen
cy
2002
2003
2004
2005
0
5000
10000
15000
20000
25000
30000
35000
40000
45000
50000
8/3 8/17 8/31 9/14 9/28 10/12 10/26
Bo
nn
ev
ille
Fis
h C
ou
nt
(av
era
ged
a
cro
ss y
ea
rs)
0
20
40
60
80
100
120
140
Nu
mb
er o
f Fish
Ta
gg
ed
1996-2005
2002
2003
2004
2005
Figure 1. Length frequency distribution of radio-tagged fall Chinook salmon.
Figure 2. Average count of fall Chinook salmon at Bonneville Dam from 1996 to 2005
and the number radio-tagged fish (summed over 3 day intervals) in our study.

5
PASSAGE EFFICIENCY
Methods
Passage efficiency was defined as the number of fish passing a dam divided by the
number of fish that had an opportunity to pass. The opportunity to pass was determined
two ways: 1) using all fish that were detected at the dam, and 2) using only fish that
entered a fishway at that dam. Fish released directly into the ladder system or upstream
from a given dam (primarily occurring at Bonneville Dam) were excluded from the
passage efficiency analysis at that dam. Passage efficiency was calculated for each of the
four lower Columbia River dams.
Increased energy expenditure and reduced escapement to spawning grounds can
result from fallback events at dams (Boggs et al. 2003). We indirectly tracked fallbacks,
which were identified by detections downstream from a dam that occurred after a fish
passed that dam. For fish that fell back at a dam, we only included records occurring
before the fallback event in our analysis of dam passage time and passage efficiency. We
also calculated passage efficiency on subsequent attempts for those fish that fell back
over a dam, including only records occurring after the fallback event in this analysis.
Results
Passage efficiency (before fallback) for fish detected anywhere at these four dams
in 2002 through 2005 ranged from 89.3 to 97.3% (Table 2). Using only fish that entered
a fishway, passage efficiency increased to between 91.8 and 99.4%. As in past years
(Burke et al. 2005), passage efficiency at John Day Dam was slightly different in both
magnitude and variability from the other three lower Columbia River dams. At John Day
Dam, passage efficiency was variable among years and increased monotonically from
2002 to 2005. It should be noted however, that passage efficiency at John Day Dam in
2001, a low-flow year, was greater than 3 of the 4 years reported here (excepting 2005,
which had the lowest flow of this study period). At Bonneville, The Dalles, and McNary
Dams, passage efficiency (for fish detected anywhere at the dam) differed relatively little
between years, and did not provide evidence of clear trends. The passage efficiencies for
each dam in these years are similar to those reported in Burke et al. (2005). However,
passage efficiency was generally higher at The Dalles Dam in 2002-2005.

6
Successful dam passage on attempts following fallback events (reascension rates)
was much lower than passage efficiencies of fish making their first ascent. Rates ranged
from 11.1% at John Day Dam (2005) to 52.9% at The Dalles Dam (2005) for fish
detected anywhere at the dam. However, once fish re-entered a fishway on subsequent
attempts, their passage efficiencies were higher in all cases (although sample sizes were
very low) and approached those of first passage attempts. While passage efficiency after
fallback was generally higher for fish that entered a fishway, passage efficiency was still
notably low at McNary Dam in 2002. Low passage efficiency after fallback was also
seen at John Day Dam in previous years (Burke et al. 2005), but was not apparent
between 2002 and 2005. See Boggs et al. (2004) for additional information on
reascension rates.

7
Table 2. Passage efficiency at Bonneville (BON), The Dalles (TDD), John Day (JDD), and McNary (MCN) Dams. The first panel represents passage efficiency before any fallback events; the second represents passage efficiency after a fallback.
Number of fish
2002 2003 2004 2005
BON TDD JDD MCN BON TDD JDD MCN BON TDD JDD MCN BON TDD JDD MCN
Before Fallback
Released below dam 755 1066 1066 1066 665 666 666 666 571 606 606 606 0 600 600 600
Recorded at dama 718 815 638 487 618 482 391 301 526 452 387 292 0 464 367 272
Recorded approaching
dam 697 792 627 483 603 468 384 297 512 441 382 288 0 444 363 270
Recorded entering
fishway 687 780 621 482 594 464 376 296 507 435 375 285 0 434 356 269
Number passed 676 744 570 479 583 453 350 293 496 426 349 275 0 420 342 263
Passage Efficiency
a 94.2 91.3 89.3 98.4 94.3 94.0 89.5 97.3 94.3 94.2 90.2 94.2 0.0 90.5 93.2 96.7
Passage Efficiencybb
98.4 95.4 91.8 99.4 98.1 97.6 93.1 99.0 97.8 97.9 93.1 96.5 0.0 96.8 96.1 97.8
After Fallback
Released below dam 28 66 10 17 23 43 7 8 18 40 11 6 0 23 10 2
Recorded at dama 28 62 9 16 23 40 7 7 18 40 10 5 0 17 9 2
Recorded approaching
dam 21 29 5 10 14 14 1 3 10 18 4 1 0 9 4 1
Recorded entering
fishway 16 28 5 8 9 13 1 3 6 16 4 1 0 9 1 1
Number passed 14 25 3 3 6 11 1 2 6 12 3 1 0 9 1 1
Passage Efficiency
a 50.0 40.3 33.3 18.8 26.1 27.5 14.3 28.6 33.3 30.0 30.0 20.0 0.0 52.9 11.1 50.0
Passage Efficiencyb
87.5 89.3 60.0 37.5 66.7 84.6 100 66.7 100 75.0 75.0 100 0.0 100 100 100
a detected anywhere
b fish that entered

8

9
PASSAGE DURATION
Methods
For passage duration calculations, we defined the timing of three events for each
fish released at sites downstream from each dam:
1) Arrival in the tailrace area: the first detection of a fish at a tailrace receiver (located
1.8 and 3.2 km downstream from each dam).
2) First entrance into a fishway: the first detection at a receiver just inside a fishway
entrance.
3) Dam passage: the last detection at the top of a ladder.
Using these data, we calculated the time from arrival in the tailrace to first
entrance, the time from first entrance to dam passage, and the total passage time from
arrival in the tailrace to dam passage. Some fish were not detected at one or more of
these endpoints and were not included in this analysis.
The same passage metrics were calculated for fish that fell back over a dam to
determine whether fish performed differently on their second ascension. In the case of
fish with multiple fallbacks, only the data recorded during the first re-ascension were used
in this analysis.
Results
As in fall Chinook monitored in 1998–2001 (Burke et al. 2005), a distinct diel
effect was apparent in the passage duration data. Techniques are available to elucidate
these diel trends (Moser et al. 2004; Naughton et al. 2005; Caudill et al. In Press), though
in-depth analyses of timing are beyond the scope of this report. However, diel trends are
even evident in simple counts of coded records (Figure 3). Since a coded record is
always the first of a block of records at a particular site (for a given fish), the timing of
coded records usually represents arrival at a particular area, and therefore indicates fish
movement. Timing of coded records clearly indicated that most salmon activity occurred
between 0600 and 1800 hours (daylight). Most behaviors we monitored occurred during
the day, though arrival and departure from the areas downstream of the dam (F1 and L1 in
Figure 3) comprised a larger proportion of the nighttime movements we observed.
Passage events (denoted by LT, or last top) were notably absent during the early morning
hours, but continued later into the night than other behaviors as fish pushed to ascend the
dams.

10
0
1000
2000
3000
4000
5000
6000
7000
0 2 4 6 8 10 12 14 16 18 20 22
Time of Day
Freq
uen
cy
0
20000
40000
60000
80000
100000
120000LT
LP
FP
E1
A1
F1 and L1
All
Figure 3. Frequency of coded records per hour of the day for 2002. LT = last top, LP =
last pool, FP = first pool, E1 = first entrance into fishway, A1 = first approach
to fishway, F1 and L1 = first approach and last departure from downstream
areas, All = all coded records for fall Chinook in 2002 (right axis).
Passage duration sample size ranged from 23 to 691 fish (Table 3). With few
exceptions, differences in passage duration were greater among dams than among years
(Figures 4-6). In all cases, the distribution of times to pass a dam (whether measured
from arrival downstream or first entrance) was highly skewed with long tails created by
fish slow to pass (see Figure 5 as example). Therefore, we tested for differences using
non-parametric comparisons of passage time distributions. At Bonneville Dam, for
example, the cumulative distribution of first to last detection passage times (Figure 6)
indicated a bimodal distribution of passage times, where the 80th
percentile was much
larger than that for The Dalles Dam. This bimodal pattern reflects diel patterns of fish
activity.
For time from tailrace arrival to first entrance, median salmon passage times
ranged from 2.0 (John Day Dam, 2004) to 8.3 h (Bonneville Dam, 2002). This included
travel time from tailrace receivers, milling behavior while searching for entrances, and the
decision to enter the fishway. All of these behaviors are strongly dependent on time of

11
day. As in past studies (Burke et al. 2005) the time from tailrace arrival to activity at the
base of the dam tended to be longest at John Day Dam (Table 3). However, fish at John
Day Dam did not exhibit the longest times for passage duration for every metric. Times
from fish detection at the tailrace receivers to first entrance were shorter than at any other
dam for any individual year. Times for first entrance to passage were shorter at The
Dalles Dam than any others (except McNary Dam in 2003).
When calculating passage time from first entrance to passage, the duration
represents time spent in passing through fishways, including time spent during multiple
passage attempts made after the first entrance detection. Median passage duration from
first entrance to passage ranged from 3.8 (The Dalles Dam, 2004) to 21.4 h (John Day
Dam, 2002; Figure 5). John Day Dam had consistently longer passage time distributions
than the other lower Columbia River dams in every year (Wilcoxon Rank Sum test,
P < 0.0001). At Bonneville, John Day, and McNary Dams, passage duration was
consistently longest in 2002 (Wilcoxon Rank Sum test, P < 0.05). The only exception to
this was at John Day Dam, where passage duration in 2003 was not significantly different
from 2002 (P > 0.05). At The Dalles Dam, passage duration was longest in 2003
(Wilcoxon Rank Sum test, P < 0.0001).
When we examined the time from tailrace arrival to passage, which encompasses
all behaviors in the vicinity of the dam structure, both the median values and the
cumulative proportion values (Figure 6) tended to be lowest in 2004 in all cases. The
overall range was 12.0 (McNary Dam, 2003) to 23.4 h (John Day Dam, 2003). Fish at
John Day Dam consistently took the longest to pass, but this was not as pronounced as for
duration from first entrance to passage. The long entrance to passage time was mediated
by a shorter duration from tailrace arrival to entrance. The passage times for tailrace
arrival to dam passage that are reported here are consistent with those in previous work
(Burke et al. 2005) except for the times at John Day Dam. Here, the times were
substantially shorter than previously reported for all years except for 2002. Of the median
passage times in each report, the higher flow years (2000 and 2002) always had the
longest passage times at Bonneville, The Dalles, and John Day Dams. The other metrics
cannot be directly compared, as they use approach time instead of entrance time in their
calculations.
Due to small sample sizes, only median values of post-fallback passage time (fish
that fell back and attempted to pass again) are reported (Table 3). We report the same
metric used as with pre-fallback passage times: tailrace arrival to first entrance of the
dam, first entrance to dam passage, and tailrace arrival to dam passage. Median passage
times across the three metrics ranged from 2.2 to 436.7 h (n = 1 in both cases). In all
cases, post-fallback median passage times were either longer or not significantly different
from pre-fallback median passage times (Table 3).

12
Table 3. Median passage duration (h) and sample size (in parentheses) for distinct areas at all four lower Columbia River dams. Upper panel represents fish before any fallback events; lower panel represents passage efficiency after a fallback event. Shaded cells indicate a significant difference (increases in nearly all cases) between pre- and post-fallback passage times (Wilcoxon rank sum test, P < 0.05). No fish were released below Bonneville Dam in 2005; thus no pre-fallback results are available.
Bonneville The Dalles John Day McNary
2002 2003 2004 2005 2002 2003 2004 2005 2002 2003 2004 2005 2002 2003 2004 2005
Passage duration (h) before fallback
Arrival in the area to
first entrance at a dam
8.3
(503)
3.3
(389)
4.0
(244) N/A
5.5
(374)
5.0
(270)
6.6
(211)
7.7
(5.3)
2.4
(334)
3.1
(212)
2.0
(223)
2.2
(145)
2.7
(235)
3.6
(98)
3.1
(97)
2.5
(32)
First entrance at a dam
to dam passage
8.7
(574)
8.2
(498)
7.9
(327) N/A
6.0
(639)
6.6
(424)
3.8
(363)
4.4
(365)
21.4
(373)
15.9
(317)
10.4
(320)
8.9
(322)
7.1
(375)
6.1
(234)
5.3
(218)
6.6
(185)
Arrival in the area to
dam passage
21.0
(567)
20.3
(424)
19.8
(329) N/A
16.7
(411)
16.1
(276)
15.4
(234)
16.0
(51)
23.4
(415)
19.1
(214)
15.8
(222)
15.8
(144)
12.8
(286)
12.0
(286)
13.0
(106)
15.9
(23)
Passage duration (h) after fallback
Arrival in the area to
first entrance at a dam
20.2
(32)
39.5
(7)
22.4
(4)
19.6
(3)
13.3
(15)
15.1
(11)
24.6
(10)
18.4
(4)
18.3
(4)
N/A
(0)
318.4
(2)
416.1
(1)
172.4
(5)
150.5
(5)
94.7
(1)
N/A
(0)
First entrance at a dam
to dam passage
8.8
(36)
9.5
(5)
2.7
(5)
34.9
(2)
6.8
(20)
2.5
(11)
3.2
(9)
2.9
(7)
27.5
(2)
2.2
(1)
24.5
(2)
20.6
(1)
18.5
(2)
4.9
(2)
4.3
(1)
6.8
(1)
Arrival in the area to
dam passage
24.5
(32)
22.2
(4)
26.4
(5)
30.8
(3)
39.7
(16)
69.2
(10)
35.8
(11)
39.4
(5)
77.4
(2)
N/A
(0)
133.6
(2)
436.7
(1)
41.8
(1)
155.4
(2)
99.0
(1)
N/A
(0)

13
0
0.2
0.4
0.6
0.8
1
0 4 8 12 16 20 24
Time (h)
Cum
ula
tiv
e P
rop
ort
ion
of
Fis
h
2002
2003
2004
2005
0
0.2
0.4
0.6
0.8
1
0 4 8 12 16 20 24
Time (h)
Cum
ula
tive
Pro
port
ion
of
Fis
h
2002
2003
2004
med. = 5.5
med. = 5.0
med. = 6.6
med. = 7.7
med. = 8.3
med. = 3.3
med. = 4.0
a
b
Figure 4a. Cumulative proportion of fish as a function of duration from the first detection
downstream from a dam to the first entrance at Bonneville Dam (a) and The
Dalles Dam (b). Median passage times are also shown.

14
0
0.2
0.4
0.6
0.8
1
0 2 4 6 8 10 12 14 16 18 20 22 24
Time (h)
Cum
ula
tiv
e P
rop
ort
ion
of
Fis
h
2002
2003
2004
2005
0
0.2
0.4
0.6
0.8
1
0 2 4 6 8 10 12 14 16 18 20 22 24
Time (h)
Cu
mu
lati
ve
Po
rpo
rtio
n o
f F
ish
2002
2003
2004
2005
med. = 2.7
med. = 3.6
med. = 3.1
med. = 2.5
med. = 2.4
med. = 3.1
med. = 2.0
med. = 2.2
c
d
Figure 4b. Cumulative proportion of fish as a function of duration from the first detection
downstream from a dam to the first entrance at John Day Dam (c) and
McNary Dam (d). Median passage times are also shown.

15
0
0.2
0.4
0.6
0.8
1
0 12 24 36 48 60 72 84 96
Time (hrs)
Cu
mu
lati
ve
Pro
po
rtio
n o
f F
ish
2002
2003
2004
2005
TD
0
0.2
0.4
0.6
0.8
1
0 12 24 36 48 60 72 84 96
Time (hrs)
Cum
ula
tive
Pro
port
ion
of
Fis
h
2002
2003
2004
BO
Figure 5a. Cumulative proportion of fish as a function of duration from the first entrance
at a dam to the last detection at the top of the ladder at Bonneville Dam (BO)
and The Dalles Dam (TD). Median passage times are also shown.
med. = 8.7
med. = 8.2
med. = 7.9
med. = 6.0
med. = 6.6
med. = 3.8
med. = 4.4

16
0
0.2
0.4
0.6
0.8
1
0 12 24 36 48 60 72 84 96
Time (hrs)
Cum
ula
tive
Pro
port
ion
of
Fis
h
2002
2003
2004
2005
JD
0
0.2
0.4
0.6
0.8
1
0 12 24 36 48 60 72 84 96
Time (hrs)
Cum
ula
tive
Pro
port
ion
of
Fis
h
2002
2003
2004
2005
MN
Figure 5b. Cumulative proportion of fish as a function of duration from the first entrance
at a dam to the last detection at the top of the ladder at John Day Dam (JD)
and McNary Dam (MN). Median passage times are also shown.
med. = 21.4
med. = 15.9
med. = 10.4
med. = 8.9
med. = 7.1
med. = 6.1
med. = 5.3
med. = 6.6

17
0
0.2
0.4
0.6
0.8
1
0 12 24 36 48 60 72 84 96
Time (hrs)
Cum
ula
tiv
e P
rop
ort
ion
of
Fis
h
2002
2003
2004
0
0.2
0.4
0.6
0.8
1
0 12 24 36 48 60 72 84 96
Time (hrs)
Cum
ula
tive
Pro
port
ion
of
Fis
h
2002
2003
2004
2005
a
b
Figure 6a. Cumulative proportion of fish as a function of duration from the first detection
downstream from a dam to the last detection at the top of the ladder at
Bonneville Dam (a) and The Dalles Dam (b). Median passage times are also
shown.
med. = 21.0
med. = 20.3
med. = 19.8
med. = 16.7
med. = 16.1
med. = 15.4
med. = 16.0

18
0
0.2
0.4
0.6
0.8
1
0 12 24 36 48 60 72 84 96
Time (hrs)
Cu
mu
lati
ve
Pro
po
rtio
n o
f F
ish
2002
2003
2004
2005
0
0.2
0.4
0.6
0.8
1
0 12 24 36 48 60 72 84 96
Time (hrs)
Cu
mu
lati
ve
Pro
po
rtio
n o
f F
ish
2002
2003
2004
2005
c
d
Figure 6b. Cumulative proportion of fish as a function of duration from the first detection
downstream from a dam to the last detection at the top of the ladder at John
Day Dam (c) and McNary Dam (d). Median passage times are also shown.
med. = 23.4
med. = 19.1
med. = 15.8
med. = 15.8
med. = 12.8
med. = 12.0
med. = 13.0
med. = 15.9

19
FISHWAY USE AND BEHAVIOR
Radio receivers were set up strategically within each fishway to ensure adequate
coverage for determining fish behavior. In addition to passage efficiency and duration,
the placement of these receivers enabled us to follow fish movement in and around
entrances to the various fishways. We examined behavior within the fishways both in
terms of how long fish spend in various segments of each fishway and how often fish
change direction within a fishway.
Approaches, Entrances, and Exits into/from Fishways
Methods
For each dam, we analyzed the number of times that adult fall Chinook salmon
passed through individually monitored entrances. We computed first approaches (the
first fishway entrance approached by an individual fish), and all approaches (all
approaches, including first approaches, made at a given entrance) at each dam. An
approach was defined as the detection of a radio-tagged fish at an antenna positioned
outside an entrance. After their first approach, fish often approached repeatedly and at
multiple entrances. Occasionally, a fish was detected inside the fishway without being
detected outside the entrance. These were termed “unknown approaches.” Based on the
entrance used, data were assigned to the fishway system in question (e.g.,
Washington-shore fishway).
Similarly, we reported first entrances (the first fishway entrance used by an
individual fish), and all entrances (all entrances, including first entrances) for each
fishway. An entrance was defined as the detection of a transmitter by an antenna
positioned inside a fishway. If the entrance location was not clear, the passage could still
be assigned to the fishway system (“unknown entrance”). Entrance efficiency was
calculated by fishway as the number of first entrances divided by the number of first
approaches.

20
Results
In general, interannual variability in entrance use was low for the lower Columbia
River Dams. However, there were distinct use patterns for fall Chinook salmon at each
dam. These results focus on fishway entrance usage during dam passage attempts prior to
fallback events. Fishway entrance usage for all events directly correlated with usage for
first approaches.
Bonneville Dam—Fish made approaches more often at powerhouse 2 (PH2) than
at powerhouse 1 (PH1). Greater use of the Washington shore ladder was evident for first
approaches and first entrances as well as all approaches and entrances (Table 4).
The Dalles Dam—As in previous years (Burke et al. 2005), fish tended to use the
east ladder entrance (Table 4). Entrance efficiency at this location was high, at over 90%
in all years. At the north ladder, more fish made a first entrance at the north entrance than
made their first approach at this location in 2004 and 2005. Relatively few fish used the
north shore fishway for approaches, entrances, or passage.
John Day Dam—Similar to The Dalles, there was little use of the north ladder
entrance at John Day Dam (Table 4). Despite low usage and potentially incomplete
receiver coverage, entrance efficiency for fish that used the north ladder at John Day Dam
was exceptionally high. The south ladder had higher use, but intermediate entrance
efficiencies. This finding is also consistent with previously reported patterns of John Day
ladder use (Burke et al. 2005).
McNary Dam—As at the other dams, interannual variability in entrance use was
low at McNary Dam, and there were consistent patterns of ladder usage. Overall, more
fish were detected using the south ladder. Fewer fish were detected entering the south
end of the powerhouse than approaching it. However, more fish first entered the north
ladder entrance than made their first approach there, and more fish passed via the north
ladder than first approached or first entered that ladder (Table 4). In other words,
migrating fish moved into the north ladder to pass after entering elsewhere. This pattern
has also been observed in previous studies of fall Chinook salmon in the Columbia River
(Burke et al. 2005).
Apparent entrance efficiency differed depending on the side of the river and the
dam in question, ranging from 66.5% (Oregon shore of Bonneville Dam in 2004) to
96.5% (Washington shore of The Dalles Dam in 2002). In general, proportional use of
entrances was not different between the first entrance and all subsequent entrances.

21
Table 4. Number of radio-tagged adult Chinook salmon known to make approaches, entrances, and pass via each of two ladders or the navigation lock. First approaches and first entrances, as well as all approaches and all entrances (in parentheses) are reported for each dam.
Bonneville Dam The Dalles Dam John Day Dam McNary Dam
WA shore OR shore Nav lock North East Nav lock North South Nav lock North South Nav lock
2002 Approaches
534
(8,021)
220
(6,571) 0
114
(536)
656
(3,101) 0
21
(916)
572
(11,347) 0
74
(710)
408
(2,741) 0
Entrances
450
(1,526)
186
(575) 0
110
(409)
593
(1,433) 0
30
(616)
401
(3,939) 0
102
(484)
290
(958) 0
Passage
404 301 13 84 688 0 75 470 0 229 242 1
2003 Approaches
410
(6,204)
202
(1,470) 0
71
(247)
400
(1,985) 0
9
(577)
375
(27,784) 0
55
(389)
238
(1,521) 0
Entrances
382
(1,373)
149
(455) 0
60
(172)
392
(1,022) 0
23
(391)
320
(3,384) 0
59
(269)
194
(514) 0
Passage
368 208 5 13 448 0 34 314 2 124 159 0
2004 Approaches
330
(4,412)
173
(1.098) 0
27
(157)
392
(1,488) 0
8
(467)
377
(18,278) 0
71
(424)
217
(1,143) 0
Entrances
239
(726)
115
(347) 0
32
(107)
354
(769) 0
28
(381)
321
(2,917) 0
92
(265)
149
(341) 0
Passage
363 159 4 25 411 0 23 325 3 135 125 0
2005 Approaches
1
(143)
15
(112) 0
49
(160)
371
(1,324) 0
11
(345)
354
(8,716) 0
35
(381)
233
(1,225) 0
Entrances
1
(48)
3
(27) 0
49
(129)
337
(651) 0
17
(257)
320
(2.573) 0
53
(226)
201
(591) 0
Passage
574 7 0 11 418 0 5 337 1 73 122 0

22
Duration in Fishway Segments
Methods
To determine the total amount of time fish spent in various stretches of the
fishway and tailrace (duration), we first divided the area around each dam into 5
segments, defined as follows:
1) Tailrace: from the downstream antennas (1.8 to 3.2 km downstream from each dam)
to the area of detection at the base of the powerhouses or spillways.
2) Base of the dam: the area of detection at the base of the powerhouses and spillways
but outside of the actual fishway.
3) Collection channel: from just inside the various fishway entrances to either the
confluence of the various channels or the first submerged weir, depending on the
design of the fishway.
4) Transition pool: from the end of the collection channel to the first emerged weir.
5) Ladder: from the first emerged weir to the top of the fishway, including the ladder
exit.
Analyses for duration in fishway segments were conducted for 2002 through
2004; 2005 results were not analyzed due to changes in receiver configuration that did not
provide the level of detail necessary to perform these analyses. Specifically, the transition
pool segment was not defined or monitored with the antenna array in 2005, thus
impacting our ability to differentiate between any of the in-fishway segments.
We calculated the time from the first record in any given section to the first record
in any other section. Thus, we inherently assumed that fish remained in the section where
they were last detected until we had evidence that they were somewhere else. However,
three factors affect the accuracy of this determination: differences in receiver coverage
between dams, distance between receivers in some locations, and the fact that detection
probability is not 100%. Receiver coverage evaluations have been done and have shown
that segment time results were not affected by the presence/absence of some receivers
(Burke et al. 2005). The possibility of mis-assignment remains, particularly when
distinguishing between the tailrace and the base of the dam. Thus, these results should be
viewed as estimates of time spent in each segment and not absolute durations.
We calculated duration in each segment for each time the fish entered it, since fish
tended to enter a particular segment more than once. All durations in a particular
segment were then summed, regardless of how many times the fish entered and exited
that segment. Fish that were not detected in a segment were not included in the
calculation for that segment.

23
Results
Segment times ranged widely, and the distributions were highly skewed (Table 5,
Figures 7-8). Median times and ranges were also dam-dependent. Overall, fish
consistently spent less time in the collection channel and the transition pool than in other
sections of the fishways (Table 5, Figures 7-8). In most cases, over 90% of the fish spent
less than 2 h in each of these sections. The median range for the collection channel was
0.4 (Bonneville Dam, 2002 and McNary Dam, 2003) to 2.6 h (John Day Dam, 2002),
while that for the transition pool was 0.2 (McNary Dam, 2003) to 2.0 h (McNary Dam,
2004; Table 5). The amount of time spent in the other segments varied widely among
dams, but the tailrace and base of the dam segments consistently had the longest durations
(medians ranged from 1.8 to 11.9 h).
Table 5. Median total time (h) in each segment of the fishways for radio-tagged adult fall
Chinook salmon.
Median time (h)
Tailrace
Base
of the dam
Collection
channel Transition pool Ladder
Bonneville Dam
2002 11.9 3.4 0.4 0.4 3.2
2003 11.0 2.8 0.5 0.6 3.1
2004 9.0 3.2 0.5 0.5 3.9
The Dalles Dam
2002 3.4 6.6 0.6 0.8 2.2
2003 3.5 4.9 0.8 0.5 2.4
2004 5.5 2.2 0.8 0.4 1.9
John Day Dam
2002 6.5 7.8 2.6 0.6 3.0
2003 6.5 7.6 2.5 0.5 3.0
2004 3.8 5.0 2.3 0.4 2.7
McNary Dam
2002 1.8 3.8 0.5 0.5 2.7
2003 1.9 3.8 0.4 0.2 2.9
2004 2.2 3.3 2.0 2.0 0.7

24
The Dalles Dam
TR BD CC TP LD
'02 '03'04 '02'03'04 '02 '03'04 '02'03'04 '02'03'04
Tim
e (h
)
0
6
12
18
24
30
Bonneville Dam
TR BD CC TP LD
'02 '03'04 '02'03'04 '02 '03'04 '02'03'04 '02'03'04
Tim
e (h
)
0
12
24
36
48
60
Figure 7. Median (bar) amount of total time fish spent in each of five fishway segments
at Bonneville and The Dalles Dams, 2002-2005. Whiskers represent 10th
and
90th
percentiles, boxes represent 25th
and 75th
percentiles. TR = tailrace, BD =
base of dam, CC = collection channel, TP = transition pool, LD = ladder.
25
John Day Dam
TR BD CC TP LD
'02 '03'04 '02'03'04 '02 '03'04 '02'03'04 '02'03'04
Tim
e (h
)
0
12
24
36
48
60
McNary Dam
TR BD CC TP LD
'02 '03'04 '02'03'04 '02 '03'04 '02'03'04 '02'03'04
Tim
e (h
)
0
6
12
18
24
Figure 8. Median (bar) amount of total time fish spent in each of five fishway segments
at John Day and McNary Dams, 2002-2005. Whiskers represent 10th
and 90th
percentiles, boxes represent 25th
and 75th
percentiles. TR = tailrace, BD = base
of dam, CC = collection channel, TP = transition pool, LD = ladder.

26
At Bonneville Dam, fish spent more time in the ladder than in the collection
channel or the transition pool. The amount of time spent in the ladder was similar to that
for the tailrace segment, but less than time spent at the base of the dam. This pattern was
also observed at Bonneville Dam in 1998 and 2001 (Burke et al. 2005). At The Dalles
and John Day Dams, fish spent more time in the ladder than in the collection channel and
transition pools, and there was much less variability than observed for the downstream
and tailrace segments. Fish collectively spent more time in the collection channel at John
Day Dam than in other collections channels, as shown by the broader distribution of times
(Figure 8), a pattern also observed by Burke et al. (2005). At McNary Dam, fish spent
relatively little time in all segments, though their times had wide ranges and were highly
skewed, especially for tailrace and ladder segments.
Among-year differences for each dam were minor. The notable exception was for
segment times at McNary Dam in 2004. In this case, fall Chinook salmon spent
considerably more time in the collection channel and transition pool segments, and less
time in the ladder than in 2002 and 2003. We found that fish held in these segments
longer in 2004 than in other years (rather than visited them more often), which represents
different behavior than has been observed at this dam in the past. We are unaware of any
changes to the dam structure or operations to explain this change.

27
Turn-Arounds
Methods
We determined how many times each fish reversed direction within the fishways
by dividing each fishway into five segments, as in the previous analysis. Because the five
segments are spatially sequential, we were able to determine which direction a fish was
traveling by marking detections in one segment followed by detections in a separate
segment (either upstream or downstream from the first segment). We then counted
changes in direction for each fish. Direction reversals were assigned to the segment
where the terminal detection occurred. For example, if a fish was detected in the
collection channel and then detected in the transition pool, we determined that it was
swimming upstream. If that fish was next detected in the collection channel, we assigned
a turn-around (from upstream to downstream) to the transition pool segment.
In addition, we examined how far downstream fish retreated after turning around
by noting the segment where the fish was when it started moving upstream following a
turn-around event. A fish that turned around in the ladder and retreated downstream and
out of the fishway was assigned a turn-around in the ladder and an exit to the base of the
dam. Turn-arounds are reported for each section and are summarized based on how far
the fish retreated. Only fish that eventually passed the dam were included in the analysis
presented here. As with other analyses, if a fish fell back at a dam, only behavior before
that fallback event was included. Data for fish that were detected at the dam but failed to
pass were also examined (3-32 fish in each dam/year combination), but yielded
qualitatively similar patterns of turn around behavior.
In some instances, fish were not detected in a particular segment, even though
they did swim through it (based on detections on either side of the segment). By
definition, not being detected in a segment would preclude a determination of reversing
direction in that segment. Hence, there was the potential for bias against segments with
low detection probability. This was especially true of the north fishway collection
channels at The Dalles and McNary Dams, where the length of the collection channel
segment depended on the tailwater level and the position of the receivers resulted in
minimal coverage. However, evaluation of this bias has indicated that it is small (Burke
et al. 2005).

28
Results
Across all dams and years, 82.2 to 90% of the fish reversed direction at least once
while heading upstream. Turn-arounds occurred in all fishway segments at each dam
examined (Table 6). Many fish that reversed direction did so more than once; individual
fish reversed direction from 0 to 111 times for a single fishway segment. However, the
median number of attempts to pass through any section was between 0 and 4 (Table 6).
Relatively few direction reversals occurred at The Dalles and McNary Dams
(Figures 9 and 10); the median number of turn-arounds in each of the fishway segments
and in each year was less than or equal to 1 and the 90th
percentile was less than or equal
to 4. Similarly, at Bonneville Dam fish exhibited relatively few turn-arounds.
Table 6. Percent of radio-tagged adult fall Chinook salmon that reversed direction at least
once per fishway segment within Bonneville, The Dalles, John Day, and McNary Dams in 2002, 2003, and 2004 for passage events prior to fallback. The median number of turn-arounds per fish is shown in parentheses.
Proportion (%) and median number of turn-arounds
Collection channel Transition pool Ladder
Bonneville Dam
2002 55.3 (1) 59.8 (1) 24.1(0)
2003 45.3 (0) 60.2 (1) 13.4 (0)
2004 37.9 (0) 59.3 (1) 8.9 (0)
The Dalles Dam
2002 26.6 (0) 53.2 (1) 18.4 (0)
2003 28.5 (0) 45.7 (0) 19.2 (0)
2004 16.4 (0) 44.8 (0) 9.2 (0)
John Day Dam
2002 90.0 (4) 85.6 (3) 15.4 (0)
2003 83.1 (4) 82.0 (3) 12.6 (0)
2004 80.8 (3) 82.2 (3) 4.0 (0)
McNary Dam
2002 66.4 (1) 54.5 (1) 23.8 (0)
2003 50.5 (1) 34.1 (0) 17.4 (0)
2004 58.2 (1) 25.1 (0) 4.7 (0)

29
The Dalles Dam
2002 2003 2004
CC TP LD CC TP LD CC TP LD
Num
ber
of
Turn
-aro
unds
0
3
6
9
Bonneville Dam
2002 2003 2004
CC TP LD CC TP LD CC TP LD
Num
ber
of
Tu
rn-a
rounds
0
3
6
9
Figure 9. Median (bar) number of times fish reversed direction while heading upstream
at Bonneville and The Dalles Dams. Whiskers represent 10th and 90th
percentiles, boxes represent 25th and 75th percentiles for each fishway
segment: CC = collection channel, TP = transition pool, and LD = ladder.

30
John Day Dam
2002 2003 2004
CC TP LD CC TP LD CC TP LD
Num
ber
of
Turn
-aro
unds
0
3
6
9
12
15
18
McNary Dam
2002 2003 2004
CC TP LD CC TP LD CC TP LD
Num
ber
of
Turn
-aro
unds
0
3
6
9
Figure 10. Median (bars) number of times fish reversed direction while heading upstream
at John Day and McNary Dams. Whiskers represent 10th and 90th
percentiles, boxes represent 25th and 75th percentiles for each fishway
segment: CC = collection channel, TP = transition pool, and LD = ladder.
31
However, the 90th
percentile at Bonneville was higher than at The Dalles and McNary
Dams (Figures 9 and 10). At Bonneville and The Dalles Dams, the transition pool
segment consistently had the widest range of turns per segment, even when the median
number of turns in the segment was low. At John Day Dam, there was a wide range of
turns per segment, indicating that some fish made many turns in this section.
John Day Dam stood out from the other dams in that most fish made large
numbers of turn-arounds in both the collection channel and the transition pool in all
3 years (Figure 10). The medians were consistently and significantly higher than the
other three dams in all years for both of these fishway segments (Wilcoxon Rank Sum
test, P < 0.05). Over 90% of turn-arounds in these segments at John Day Dam occurred
in the south fishway. For fish that turned around, the south fishway had a median of
7 attempts per fish for the collection channel and 4 for the transition pool across all years
(all other sections and dams had 1 to 2 attempts per fish on median across all years).
Unlike the collection channel and transition pool, the number of turn-arounds per fish in
the ladder segment of John Day Dam was comparable to the other dams, even in the south
fishway. Additionally, fewer fish turned around in the ladder segment of the fishway at
John Day Dam than at the other dams or at other sections of the fishway.
The patterns in turn-around behavior for fall Chinook salmon in 2002-2004 were
amazingly similar to those seen in 1998, 2000, and 2001 (Burke et al. 2005). This lack of
interannual variability indicates that environmental conditions have less to do with these
behaviors than the dam structures and flow patterns within them, things that have not
changed over the course of this study.
Following a turn around, we determined the segment to which fish retreated
before turning around and heading back upstream. These “retreat” segments were mostly
in areas outside of the dam fishways. However, fish turning around in the ladders often
retreated only to the transition pools before progressing upstream again. Retreat segment
analyses provided more specific fish movement and behavior data related to turn around
behavior.
These results varied by dam and allowed us to identify the proportion of times fish
that entered a section successfully passed through it. In cases of turn-arounds, these data
also show the section to which fish retreated following a turn-around, and the total
number of attempts at each section (Figures 11-14). When fish turned around within the
fishways, most individuals consistently retreated to the base of the dam at The Dalles,
John Day, and McNary Dams (Figures 12-14). At Bonneville Dam, retreats were spread
more evenly between the tailrace, the base of the dam, and the collection channel

32
(Figure 11). However, at all dams, retreat distances varied greatly for each segment and
differed among dams, fishways, and years (Figures 11-14).
The percentages of fish that successfully passed through the collection channel
and transition pool segments were highly variable. Success rates for the ladder segments
were generally lowest at Bonneville Dam and the north fishway of The Dalles Dam. Fish
turning around in the ladder section often retreated only to the transition pool segment of
the fishway. However, if they continued downstream, they completely exited the dam
structure. The interannual and dam-specific patterns of retreat were notably similar to
those previously reported for fall Chinook salmon in the lower Columbia River (Burke et
al. 2005).

33
0%
50%
100%
2002 2003 2004
Exit to TR
Exit to CC
Exit to TP
Success
(246) (181)(1024)
0%
50%
100%
2002 2003 2004
Pro
po
rti
on
al
beh
av
ior
(854) (393)(848)
0%
50%
100%
2002 2003 2004
Exit to TR
Exit to CC
Success
(660) (512)(2230)
0%
50%
100%
2002 2003 2004
Pro
po
rti
on
al
beh
av
ior
(1681) (844)(1491)
0%
50%
100%
2002 2003 2004
Exit to TR
Success
(1986) (541) (417)
0%
50%
100%
2002 2003 2004
Pro
po
rti
on
al
beh
av
ior
(1408) (1264) (712)CC
TP
LD
Figure 11. Proportion of attempts to pass through Bonneville Dam collection channel
(CC), transition pool (TP), and ladder (LD) that were either successful or
resulted in a turn-around. Turn-arounds were divided up based on how far
fish retreated to the tailrace (exit to TR), the collection channel (exit to CC),
or the transition pool (exit to TP). Numbers in parentheses indicate total
number of attempts made by radio-tagged fish.
Washington Shore Fishway Oregon Shore Fishway

34
0%
50%
100%
2002 2003 2004
Exit to TR
Success
(514) (486) (232)
0%
50%
100%
2002 2003 2004
Pro
po
rti
on
al
beh
av
ior
(67) (26) (19)
0%
50%
100%
2002 2003 2004
Exit to TR
Exit to CC
Success
(969) (882)(1411)
0%
50%
100%
2002 2003 2004
Pro
po
rti
on
al
beh
av
ior
(235) (111)(558)
0%
50%
100%
2002 2003 2004
Exit to TR
Exit to CC
Exit to TP
Success
(530) (444)(781)
0%
50%
100%
2002 2003 2004
Pro
po
rti
on
al
beh
av
ior
(111) (39)(275)
CC
TP
LD
Figure 12. Proportion of attempts to pass through The Dalles Dam collection channel
(CC), transition pool (TP), and ladder (LD) that were either successful or
resulted in a turn-around. Turn-arounds are divided up based on how far the
fish retreated: to the tailrace (exit to TR), the collection channel (exit to CC),
or the transition pool (exit to TP). Numbers in parentheses indicate the total
number of attempts made by radio-tagged fish.
North Fishway East Fishway

35
0%
50%
100%
2002 2003 2004
Exit to TR
Exit to CC
Success
(1887) (1767)(3271)
0%
50%
100%
2002 2003 2004
Pro
po
rti
on
al
beh
av
ior
(182) (197)(307)
0%
50%
100%
2002 2003 2004
Pro
po
rti
on
al
beh
av
ior
(192) (134)(341)
0%
50%
100%
2002 2003 2004
Exit to TR
Exit to CC
Exit to TP
Success
(370) (342)(682)
0%
50%
100%
2002 2003 2004
Pro
po
rti
on
al
beh
av
ior
(42) (25)(235)
0%
50%
100%
2002 2003 2004
Exit to TR
Success
(3684) (3217)(6147)CC
TP
LD
Figure 13. Proportion of attempts to pass through the John Day Dam collection channel
(CC), transition pool (TP), and ladder (LD) that were either successful or
resulted in a turn-around. Turn-arounds are divided up based on how far the
fish retreated: to the tailrace (exit to TR), the collection channel (exit to CC),
or the transition pool (exit to TP) segment. Numbers in parentheses indicate
the total number of attempts made by radio-tagged fish.
North Fishway South Fishway

36
0%
50%
100%
2002 2003 2004
Exit to TR
Exit to CC
Success
(431) (58)(800)
0%
50%
100%
2002 2003 2004
Exit to TR
Success
(744) (340)(1167)
0%
50%
100%
2002 2003 2004
Exit to TR
Exit to CC
Exit to TP
Success
(246) (141)(420)
0%
50%
100%
2002 2003 2004
Pro
po
rti
on
al
beh
av
ior
(128) (148)(264)
0%
50%
100%
2002 2003 2004
Pro
po
rti
on
al
beh
av
ior
(0) (197)(425)
0%
50%
100%
2002 2003 2004
Pro
po
rti
on
al
beh
av
ior
(3) (114)(207)CC
TP
LD
Figure 14. Proportion of attempts to pass through the McNary Dam collection channel
(CC), transition pool (TP), and ladder (LD) that were either successful or
resulted in a turn-around. Turn-arounds are divided up based on how far the
fish retreated: to the tailrace (exit to TR), the collection channel (exit to CC),
or the transition pool (exit to TP) segment. Numbers in parentheses indicate
the total number of attempts made by radio-tagged fish.
North Fishway South Fishway

37
Fallback Fish
Methods
We first counted the number of individual fish that fell back at each dam, and then
calculated the proportion of fish that passed that exhibited fallback behaviors (fallback
rate). Some fish fell back more than once, so we also counted both the number of times
each fish fell back and the total number of fallback events at each dam. In 2002 (as in
2000 and 2001, Burke et al. 2005), some fish were released upstream from Bonneville
Dam to examine fallback rates based on release location in the forebay. We considered
fallbacks for these fish at Bonneville Dam separately.
The probability of falling back over a dam can be influenced by the route fish used
to ascend a fishway (Reischel and Bjornn 2003). For each fallback event, we determined
the ladder from which the fish exited immediately before falling back. Fallbacks were
divided into those that occurred within 24 h of passage and those occurring after more
than 24 h. If a fish passed a dam via an unknown route, the ladder was assigned a null
value. A more detailed analysis of fallback events can be found in Boggs et al. (2003;
2004).
Results
Fall Chinook salmon fell back at each of the lower Columbia River dams. Rates
ranged from 0.8 (McNary Dam, 2005) to 9.5% (The Dalles Dam, 2003) for fish released
below a dam (Table 7). Relatively few fish fell back over an individual dam more than
once (range = 0.0 to 1.5%). The highest percentage of fish falling back more than once
occurred at Bonneville and The Dalles Dams, particularly in 2003: 1.0% at Bonneville
Dam for fish released downstream, and 1.5% at The Dalles Dam.
In 2002, when fish were released both downstream and upstream of Bonneville
Dam, fallback rates at that dam were highly dependent on where fish were released. For
fish released downstream, the fallback rate at the dam was 4.1% (Table 7). For fish
released upstream from Bonneville Dam, the fallback rate was 14.2%. Fish released
upstream of Bonneville Dam in previous years had similarly high rates of fallback (Burke
et al. 2005).
For fish released downstream of the dam being analyzed, fallback rates were
highest at The Dalles Dam, followed by Bonneville Dam (same pattern as in previous
years). Fallback rates varied among years at some dams (Table 7). For example, at The

38
Table 7. Number of fall Chinook salmon that fell back over the dams and the number of repeat fallbacks. The percentage of fish that fell back of those that passed the dam is in parentheses (for Bonneville Dam, upstream-released fish, percentage value is for all fish released upstream from Bonneville Dam).
Number and percentage of fallbacks
2002 2003 2004 2005
Bonneville Dam (downstream-released)
Total number of fish 28 (4.1) 23 (3.9) 18 (3.4) 27 (4.6)
Total number of fallback events 33 28 25 31
Number that fell back once 23 (3.4) 19 (3.3) 13 (2.4) 23 (3.9)
Number that fell back twice 5 (0.7) 6 (1.0) 3 (0.6) 4 (0.7)
Number that fell back three times 0 (0.0) 1 (0.2) 2 (0.4) 0 (0.0)
Number that fell back more than three times 0 (0.0) 0 (0.0) 0 (0.0) 0 (0.0)
Bonneville Dam (upstream-released)
Total number of fish 44 (14.2)
Total number of fallback events 50
Number that fell back once 38 (12.3)
Number that fell back twice 6 (1.9)
Number that fell back three times 0 (0.0)
Number that fell back more than three times 0 (0.0)
The Dalles Dam
Total number of fish 66 (8.9) 43 (9.5) 40 (9.4) 23 (5.5)
Total number of fallback events 76 50 44 26
Number that fell back once 57 (7.7) 36 (7.9) 36 (8.5) 21 (5.0)
Number that fell back twice 8 (1.1) 7 (1.5) 4 (0.9) 1 (0.2)
Number that fell back three times 1 (0.1) 0 (0.0) 0 (0.0) 1 (0.2)
Number that fell back more than three times 0 (0.0) 0 (0.0) 0 (0.0) 0 (0.0)
John Day Dam
Total number of fish 10 (1.8) 7 (2.0) 10 (2.9) 10 (2.9)
Total number of fallback events 10 7 10 10
Number that fell back once 10 (1.8) 7 (2.0) 10 (2.9) 10 (2.9)
Number that fell back twice 0 (0.0) 0 (0.0) 0 (0.0) 0 (0.0)
Number that fell back three times 0 (0.0) 0 (0.0) 0 (0.0) 0 (0.0)
Number that fell back more than three times 0 (0.0) 0 (0.0) 0 (0.0) 0 (0.0)
McNary Dam
Total number of fish 17 (3.5) 8 (2.7) 6 (2.2) 2 (0.8)
Total number of fallback events 17 12 7 2
Number that fell back once 17 (3.5) 6 (2.0) 5 (1.8) 2 (0.8)
Number that fell back twice 0 (0.0) 1 (0.3) 1 (0.4) 0 (0.0)
Number that fell back three times 0 (0.0) 0 (0.0) 0 (0.0) 0 (0.0)
Number that fell back more than three times 0 (0.0) 1 (0.3) 0 (0.0) 0 (0.0)

39
Dalles Dam, fallback rates decreased substantially in 2005 (down to 5.5% from around
9% in previous years). A decrease in fallback rate was also observed at McNary Dam
(from 3.5 to 0.8% across the study years). However, the opposite occurred at John Day
Dam, where fallback rate increased from 1.8 to 2.9%. At both John Day and McNary
Dams, total numbers of fallbacks were much lower than at Bonneville and The Dalles
Dams, ranging from 1 to 3.5% in the 4 years.
Most fallback events occurred more than 24 hours after fish passed a dam,
regardless of the passage route used. For fish that fell back within a day of passing a
dam, almost 90% had used an Oregon-shore ladder (averaged over all four dams, Table
8). Although more fish used Oregon shore ladders, particularly at The Dalles and John
Day Dams (Table 4), fish using the Oregon shore route also fell back at higher
frequencies. The only cases in which the fallback percentages were higher for a
Washington shore ladder were at John Day Dam in 2002 and The Dalles Dam in 2005
(Table 8); however, numbers available for these calculations were low in both cases.
Table 8. The number of Chinook salmon that fell back within 24 hours of passage
(<24 h), and over 24 h after passage (>24h) after using is the number of fish that fell back after passing via each route divided by the total number that passed by that route. Nav = Navigation Lock, Unkn = unknown ladder.
Ladder
WA % OR % Nav Unkn
<24 h >24 h <24 h >24 h
Bonneville Dam
2002 0 7 1.7 0 29 9.6 2 1
2003 0 4 1.1 1 22 11.1 1 1
2004 0 8 2.2 1 12 8.2 4 0
2005 0 30 5.2 0 1 14.3 0 2
The Dalles Dam
2002 2 6 9.5 6 62 9.9 0 0
2003 0 1 7.7 6 43 10.9 0 1
2004 0 1 4.0 7 36 10.5 0 1
2005 0 1 9.1 4 21 6.0 0 0
John Day Dam
2002 0 2 2.7 2 6 1.7 0 0
2003 0 0 0.0 2 5 2.2 0 0
2004 0 0 0.0 3 8 3.4 0 0
2005 0 0 0.0 3 7 3.0 0 1
McNary Dam
2002 2 5 3.1 0 9 3.7 0 1
2003 0 2 1.6 0 10 6.3 0 2
2004 0 1 0.7 0 6 4.8 0 1
2005 0 0 0.0 0 0 0.0 0 2

40
DISCUSSION
Upriver-migrating adult salmon show varied responses to obstacles such as dams,
depending on the structure itself and its operation, as well as the environmental
conditions at the time it is encountered. Despite the variability in stimuli and individual
fish responses, radiotelemetry techniques applied over multiple seasons can reveal trends
in fish behavior interactions. With seven years of fall Chinook salmon passage behavior
and fishway use available in the lower Columbia River, it is the consistency of fish
response to the dams regardless of environmental factors that stands out.
The ability of fall Chinook salmon to traverse fishways at hydropower dams is of
utmost importance in the impounded Columbia River. Passage efficiency of adult salmon
must be high for populations to persist. Of the four dams on the lower Columbia River,
McNary Dam hindered the fewest fish; passage efficiency averaged over 96% in this
study and in previous years (Burke et al. 2005). Likewise, passage efficiencies were
consistently high at Bonneville Dam, averaging just over 94% during this study and
previous work (Burke et al. 2005). John Day Dam posed the biggest challenge to
passage, with efficiencies under 90% in two of the four years we examined. There was
relatively small variability among years at all lower Columbia River dams.
Passage efficiency values were higher and interannual variability decreased when
only fish that actually entered a fishway were used. Passage efficiencies were over 95%
at Bonneville, The Dalles, and McNary Dams for these fish; the same patterns were
observed for fall Chinook salmon at these dams in previous years (Burke et al. 2005).
Variation in attraction to the fishways between years, or the ability of fish to locate and
enter fishways, may be the most important source of interannual variation that affects
passage efficiency. Therefore, external factors such as dam operations and environmental
conditions would have the most impact on passage efficiency while fish are in the
tailrace. Additional factors resulting in decreased passage efficiency for fish that did not
enter fishways are: 1) harvest below the dams, and 2) fish that approach dams after
overshooting a downstream tributary and turning around before entering a fishway
(Keefer et al. 2006a).
Passage efficiency patterns for fish at John Day Dam were notably different than
at the other dams. Interannual variability at this dam was not dependent on fish entering
the fishway, indicating that factors affecting passage occurred within the fishway at this
dam, instead of in the tailrace. The large number of turn-arounds per fish gives us
another indication of trouble in the John Day Dam fishways. Unfortunately, turn-around
data is not available for 2005, a year when we observed higher passage efficiency than

41
any previous years. Fall Chinook salmon are not the only migrating fish that change their
behavior at John Day Dam. Elevated temperatures within the dam fishways have
increased exit rates of steelhead (Keefer et al. 2003b) at this dam. Factors other than
temperature (i.e. flow, turbidity, oxygen levels, corner angle, or construction) may also
impact passage efficiency of fall Chinook salmon and warrant additional directed
research at John Day Dam.
After fallback events, overall passage efficiencies were much lower than on initial
attempts. Some portion of this is explained by fish intentionally moving downstream
after overshooting their natal tributary and not attempting to reascend (see Boggs et al.
2003). If fish re-entered the fishways after a fallback, passage was slower on subsequent
attempts, and efficiencies were similar but still lower than for fish that made only one
attempt. Additionally, passage efficiency on reascension was lower for fall Chinook
salmon than comparable rates for spring/summer Chinook salmon and steelhead (Boggs
et al. 2004). While passage efficiency at John Day Dam has historically been low on
reascension even for fish re-entering the fishway (Burke et al. 2005; Boggs et al. 2004),
that was not the case in our study. Sample sizes were small, but fish that entered the
fishway following a fallback typically ascended the entire fishway, even at John Day
Dam. For the large number that failed to re-enter the fishways, many were last detected
in the Deschutes, White Salmon, or Klickitat Rivers, supporting the idea that these fish
overshot their destinations.
Differences in size, structure, operation, and receiver configurations among dams
resulted in wide variation in the passage time estimates we computed at each structure.
For the total passage from arrival at the dam base to fishway exit at the top, fall Chinook
salmon consistently passed McNary Dam much faster than the other dams. Possible
reasons include: 1) fish learned from passages at downstream fishways, 2) they had
higher motivation as a result of being closer to spawning grounds, or 3) they encountered
more favorable environmental conditions later in the season. However, the passage at
McNary Dam covers a relatively short distance from downstream receivers to the dam
structure, and involves negotiating a smaller, less complex fishway than at many of the
other dams.
Overall passage times at all dams were generally longest in 2002, the year with the
highest flow of those examined, and one in which tagged fish were smaller than in other
years. While swimming speed may increase with body size (Brett 1995), the likelihood
of passing is inversely related to size (Caudill et al. in press). We did not see a change in
passage efficiency with the smaller fish in 2002, only in passage time. The correlation of
high flow and longer passage times is expected based on risk analyses (Caudill et al. in
press) and was also noted in previous years (Burke et al. 2005).

42
Dam passage time can be divided into: 1) time spent below the dam and 2) time
spent negotiating fishways. Fish at John Day Dam had high median passage times
overall, but time spent below the dam was shorter than at other dams. So, fish entered the
dam readily and the difference in passage time between John Day Dam and the other
dams occurred after fish were in the fishways. John Day Dam also had the slowest
median passage times for both steelhead and spring/summer Chinook salmon (Keefer
et al. 2002; Bjornn et al. 2000). Temperature differentials between the forebay and the
ladder at John Day Dam, as well as warm water temperatures within the Oregon shore
ladder have been correlated with poor performance at this dam (Keefer et al. 2003b).
After fish entered the fishways, the time from first entrance to dam passage was
shortest at The Dalles Dam. While fall Chinook salmon may have experienced delays
finding or entering the fishways, their upstream passage through the fishways was most
direct at this dam. Fishway passage time at McNary Dam was also short. Similarly,
steelhead passed McNary Dam quickly (Keefer et al. 2002), and spring/summer Chinook
salmon passed most rapidly at Bonneville and The Dalles Dams (Bjornn et al. 2000). It is
impossible to directly compare these passage times with past reports, as they have
reported time from first approach to dam passage rather than first entrance. We found
that using the fishway entrances reduces some of the dependence of data on receiver
locations and eliminates counting fish swimming past a receiver as a relevant behavior.
This calculation eliminates time between approach and entrance, which is often
artificially long as fish are deemed approaching when they are in fact milling at the base
of the dam.
Interannual variability in passage duration was low at all dams except for John
Day Dam, where median passage time was 8h longer in 2002 than in 2004 and 2005.
While the majority of fall Chinook salmon passed each of the four dams in less than 24h,
at John Day Dam in 2002 only 51% passed within this time. The 2002 passage time
numbers are similar to those previously reported (Burke et al. 2005), so passage times in
2003-2005 were considerably faster than in previous years. Collection channel turn-
arounds were more prevalent at John Day Dam in 2002, and the ladder section presented
more difficulties than in the other years examined.
Passage times following fallback events were substantially longer than on first
attempts. The difference was significant despite sample size limitations. This was most
apparent when the time analyzed incorporated re-approach and milling behaviors below
the dam. Each additional attempt requires more energy expenditure and may result in
slower passage times. Alternatively, fallback fish may represent those that are poor
navigators and thus move in a less directed and circuitous manner. While the amount of
fallbacks, reascension times, and overshoot behavior have been examined (Boggs et al.

43
2004, Keefer et al. 2006b), effects of cumulative stress and the resulting impact on fall
Chinook salmon fitness has not been adequately assessed.
At Bonneville Dam, most fall Chinook salmon used powerhouse entrances to
fishways which are closer to the shores along which fish migrate (Dawm and Osborne
1998; Hinch et al. 2002) as opposed to spillway entrances near the middle of the river.
Entrances at the other dams are all shoreline oriented, but there were distinct preferences
for entering the Oregon shore fishways at The Dalles, John Day, and McNary Dams. If
fall Chinook salmon sampled were largely destined for right-hand exiting tributaries, they
might show such preference (Keefer et al. 2006b), but the severity of the disparate use
and the strength of the Hanford Reach population in the fall Chinook run implicate
additional factors.
All entrances were used at Bonneville Dam, but fall Chinook salmon
disproportionately used the Washington shore fishway. Except for the fall of 2000, the
Washington shore ladder has consistently been preferred by these fish (Burke et al. 2005).
Fish tagged at Bonneville Dam were captured from the fishway on the Washington shore,
so there may have been a bias towards its use. Despite the same potential bias,
spring/summer Chinook salmon undergoing the same tag and release regime did not show
a preference on re-approach at Bonneville Dam (Keefer et al. 2006b). Moreover, fall
Chinook salmon, preferences in fishway use at Bonneville Dam have been inconsistent in
previous years (Burke et al. 2005). Powerhouse priority was at PH2 during this study,
and this, along with environmental conditions, may have influenced fishway use at
Bonneville Dam more than fish origin or experience. The position of open orifice gates
has not affected entrance use in past studies (Burke et al. 2005), so was not considered
here.
The proportional relationship between approaches, entrances, and passage events
appeared consistent for each fishway examined. At Bonneville, John Day, and The
Dalles Dams, the number of approaches, entrances, and passage within a year were
similar, indicating that after a fish chose a fishway, it proceeded all the way through it on
that attempt. While entrance efficiency varied, it was generally highest at these three
dams and fish usually entered upon approach.
At McNary Dam, the fish exhibited a different pattern of use. At the south ladder
overall use was higher than the north ladder. However, more fish approached the south
ladder than successfully entered it, and more entered it than passed all the way through it.
After approaching, and even entering, many fall Chinook salmon at McNary Dam exited
from the south ladder and moved to the north ladder to pass the dam. Apparently there is
some impediment to completely navigating the south ladder at this dam. This is a long-

44
standing pattern, as it was visible for fall Chinook salmon at McNary Dam in Burke et al.
(2005) as well.
Fall Chinook salmon passing over The Dalles Dam had the greatest likelihood of
falling back downstream (5.5-9.5%) of the dams examined (as in Burke et al. 2005). All
four dams had different fallback rates, but they were remarkably consistent among years.
The most notable difference was for fish that were released above Bonneville Dam in that
they fell back downstream at much higher rates than fish released below the dam. This
may have been in response to initial disorientation upon release, or entrainment in forebay
flows different from those acting upon fish exiting the ladders.
Most fish only fell back once at a given dam. For those released downstream of a
dam, at most 1.5% (The Dalles Dam, 2003) fell back more than once. Even the group of
fish released above Bonneville Dam had low secondary fallback rates, 1.9%, this suggests
that fallback behavior in these fish is related more to overshoot behavior or temporary
disorientation than to dam-induced disruption of migration.
The majority of fallback events occurred more than 24 h after fish passed a dam,
further indicating large scale orientation and homing/searching movements (Keefer et al.
2006a, Boggs et al. 2004). Yet, the particular fishway used to pass a dam can influence
fallback rates for shorter time frames (Reischel and Bjornn 2003). For fish that fell back
soon after passing, fish fell back more at Bonneville and McNary Dams after passing
through the Oregon shore ladders, and at The Dalles and John Day Dams after using
Washington shore ladders. A similar pattern was noted by Burke et al. (2005).
The highest fallback rates we recorded for fish released below a dam were in 2005
at Bonneville Dam. Fish exiting from the Bradford Island fishway are in the forebay of
the spillway, resulting in higher fallback rates (Reischel and Bjornn 2003). Releases
directly into the forebay further demonstrate this propensity. With respect to McNary
Dam, fall Chinook salmon exhibited an apparent tendency to overshoot their natal stream,
leading to fallbacks at this dam (Boggs et al. 2003). These were often associated with
Oregon shore passage due to heavier use of that fishway, but may also relate to potential
impediments to McNary Dam south ladder passage. Slow passage times affect spawning
success (Caudill et al. in press), and fallbacks exacerbate this problem for anadromous
salmonids.
Fall Chinook salmon spent most of their time at a project below the dam structure
rather than within the fishway proper at all dams. Holding below the dam leaves fish
particularly vulnerable to predation, especially for spring/summer Chinook salmon
exposed to sea lions at Bonneville Dam. Finding entrances and moving into fishways

45
may not be the whole problem; time below the dam may be exacerbated by diel behaviors
in which some fish exit fishways at night (see Naughton et al. 2005 for similar behavior
in sockeye salmon).
Within the fishways, cumulative time spent in the ladder segment was typically
longer than time in the collection channel and transition pool segments. However, at
John Day Dam, where time from first entrance to passage was particularly long, time in
the collection channel was long relative to analogous segments at other dams. Interannual
variability in time spent at each segment was generally low. However, at McNary Dam in
2004 fish spent much more time in the collection channels and transition pools than in
other years and exhibited quick passage through the ladder segment. Higher flow out of
the Snake River may have disproportionately affected McNary Dam passage in that year.
While fall Chinook salmon generally hold position more within the ladder
segment than in other fishway sections, the locations of turn-arounds provides some
additional insight into the reason fish take longer to pass a given segment of the fishway.
Only rarely do fish pass straight through all segments of a fishway on a given passage
attempt. As was seen by Burke et al. (2005), total time spent in the collection channel
and transition pool segments was low, but there are also more direction reversals in these
segments than in other segments. The transition pool has previously been implicated as a
common turn around point (Bjornn et al. 1998b, Keefer et al. 2003, Naughton et al.
2007). This was particularly true at John Day Dam. However, the median number of
times a fish turned around per section at this dam that we reported was lower than
previously reported (Burke et al. 2005).
Two possible explanations for turning behavior are lack of attractant flow
(Naughton et al. 2007) or large temperature differentials between segments (Peery et al.
2003). Fish tend to turn around at the downstream end of pools rather than at the
transition between segments, suggesting that lack of attractant flow may contribute most
to this behavior in the collection channel and transition pool segments (Naughton et al.
2007).
Passage success through the ladder segment at all dams was typically high,
particularly in 2004. However, at The Dalles Dam north fishway, it was substantially
lower than in previous years (Burke et al. 2005), with success as low as 12% (in 2003).
We are not aware of any changes made to the north fishway in that year. Conversely,
success rates through the ladder segment of the south fishway at McNary Dam increased
relative to previous years (Burke et al. 2005).

46
This report highlights the differences in behavior of fall Chinook salmon during
these years versus those previously reported (Burke et al. 2005), but the consistency of
behavior among all years is remarkable. From timing of passage to the locations of turn
arounds within fishways, responses were often consistent despite environmental
fluctuation and sampling variation. Previous work has been done to improve passage for
adult salmonids; however, more recent changes to the dam structures have focused on
improving juvenile salmonid passage. The work presented here identifies a few key areas
where additional structural or operational modifications to fishways could improve the
rate and efficiency of adult fall Chinook salmon passage at Lower Columbia River dams.

47
ACKNOWLEDGEMENTS
We thank Steve Lee and his crew for tagging the Chinook salmon at Bonneville
Dam. Thanks to Ken Tolotti and Carol Morat for maintaining and downloading hundreds
of receivers throughout Washington, Oregon, and Idaho. Thanks to Mike Jepson and his
crew for interpreting the telemetry data, fish by fish. This project would not have been
possible without the economic support of the U.S. Army Corps of Engineers. We thank
Doug Dey, David Clugston, and Marvin Shutters for technical and adminstrative help.
48
REFERENCES
Bjornn, T.C., J.P. Hunt, K.R. Tolotti, P.J. Keniry, and R.R. Ringe. 1994. Migration of
adult Chinook salmon and steelhead past dams and through reservoirs in the lower
Snake River and into tributaries - 1992. Technical Report 94-1, Idaho
Cooperative Fish and Wildlife Research Unit, University of Idaho, Moscow.
Bjornn, T.C., J.P. Hunt, K.R. Tolotti, P.J. Keniry, and R.R. Ringe. 1995. Migration of
adult Chinook salmon and steelhead past dams and through reservoirs in the lower
Snake River and into tributaries - 1993. Technical Report 95-1, Idaho
Cooperative Fish and Wildlife Research Unit, University of Idaho, Moscow.
Bjornn, T.C., J.P. Hunt, P.J. Keniry, R.R. Ringe, and C.A. Peery. 1998a. Entrances used
and passage through fishways for salmon and steelhead at Snake River dams. Part
III of final report for migration of adult Chinook salmon and steelhead past dams
and through reservoirs in the lower Snake River and into tributaries. U.S Army
Corps of Engineers, Walla Walla, Washington.
Bjornn, T.C., J.P. Hunt, P.J. Keniry, R.R. Ringe. 1998b. Movements of steelhead in
fishways in relation to transition pools. Part V of final report for: migration of
adult Chinook salmon and steelhead past dams and through reservoirs in the
Lower Snake River into Tributaries. U.S. Army Corps of Engineers, Walla Walla
District, Walla Walla, Washington.
Bjornn, T.C., M.A. Jepson, C.A. Peery, and K.R. Tolotti. 1996. Evaluation of adult
Chinook salmon passage at Priest Rapids Dam with orifice gates open and closed.
Technical Report 96-1, Idaho Cooperative Fish and Wildlife Research Unit,
University of Idaho, Moscow.
Bjornn, T. C., M. L. Keefer, C. A. Peery, K. R. Tolotti, R. R. Ringe, and P. J. Keniry.
2000. Migration of adult spring and summer Chinook salmon past Columbia and
Snake River dams, through reservoirs and distribution into tributaries, 1996.
Report for U.S. Army Corps of Engineers, Walla Walla District, Walla Walla,
WA, and Bonneville Power Administration, Portland, OR.
Boggs C. T., M. L. Keefer, C. A. Peery, M. L. Moser. 2003. Adult Chinook Salmon and
Steelhead Fallback at Bonneville Dam, 2000-2001. Technical Report 2003-7,
Idaho Cooperative Fish and Wildlife Research Unit, University of Idaho,
Moscow.

49
Boggs C. T., M. L. Keefer, C. A. Peery, T. C. Bjornn and L. C. Stuehrenberg. 2004.
Fallback, reascension and adjusted fishway escapement estimates for adult
Chinook salmon and steelhead at Columbia and Snake River dams. Transactions
of the American Fisheries Society, 133:932-949.
Brett, J. R. 1995. Energetics. Pages 3-68 In C. Groot,, L. Margolis and W. Clarke,
editors. Physiological ecology of Pacific Salmon. UBC Press, Vancouver, BC.
Brown, R.S., D.R. Giest, and M.G. Mesa. 2002. The Use of Electromyogram (EMG)
Telemetry to Assess Swimming Activity and Energy Use of Adult Spring
Chinook Salmon Migrating through the Tailraces, Fishways, and Forebays of
Bonneville Dam, 2000 and 2001. Technical Report PNNL-14080. Pacific
Northwest National Laboratory. Richland, WA.
Burke, B.J., K.E. Frick, M.L. Moser, T.J. Bohn, and T.C. Bjornn. 2005. Adult fall
Chinook salmon passage through fishways at lower Columbia River Dams in
1998, 2000, and 2001. Report of the National Marine Fisheries Service to the
U.S. Army Corps of Engineers, Portland and Walla Walla Districts.
Caudill, C.C., C.A. Peery, W.R. Daigle, M.A. Jepson, C.T. Boggs, T.C. Bjornn, and D.
Joosten. 2006. Adult Chinook salmon and steelhead dam passage behavior in
response to manipulated discharge through spillways at Bonneville Dam. Report
to the U.S. Army Corps of Engineers, Portland District. Technical Report 2006-5,
Idaho Cooperative Fish and Wildlife Research Unit, University of Idaho,
Moscow.
Caudill, C.C., W.R. Daigle, M.L. Keefer, C.T. Boggs, M.A. Jepson, B.J. Burke, R.W.
Zabel, T.C. Bjornn, and C.A. Peery. In Press. Slow dam passage in Columbia
River salmonids associated with unsuccessful migration: delayed negative effects
of passage obstacles of condition-dependent mortality? Canadian Journal of
Fisheries and Aquatic Sciences.
Dawm, D.W., and B.M. Osborne. 1998. Use of fixed-location, split-beam sonar to
describe temporal and spatial patterns of adult fall chum salmon migration in the
Chandalar River, Alaska. North American Journal of Fisheries Management,
18:477-486.
Hinch, S.G., E.M. Standen, M.C. Healey, and A.P. Farrell. 2002. Swimming patterns
and behaviour of upriver-migrating adult pink (Oncorhynchus gorbuscha) and
sockeye (O. nerka) salmon as assessed by EMG telemetry in the Fraser River,
British Columbia, Canada. Hydrobiologia, 483:147-160.

50
Keefer, M.L., T.C. Bjornn, C.A. Peery, K.R. Tolotti, R.R. Ringe, and P.J. Keniry. 2002.
Migration of adult steelhead past Columbia and Snake River dams, through
reservoirs and distribution into tributaries, 1996. Technical Report 2002-2, Idaho
Cooperative Fish and Wildlife Research Unit, University of Idaho, Moscow.
Keefer, M.L., T.C. Bjornn, C.A. Peery, K.R. Tolotti, and R.R. Ringe. 2003a. Adult
spring and summer Chinook salmon passage through fishways and transition
pools at Bonneville, McNary, Ice Harbor, and Lower Granite Dams, 1996.
Technical Report 2003-5, Idaho Cooperative Fish and Wildlife Research Unit,
University of Idaho, Moscow.
Keefer, M.L., C.C. Caudill, C.A. Peery, and T.C. Bjornn. 2006b. Route selection in a
large river during the homing migration of Chinook salmon (Oncorhynchus
tshawytscha). Canadian Journal of Fisheries and Aquatic Sciences,
63:1752-1762.
Keefer, M.L., C.A. Peery, and C.C. Caudill. 2006a. Long-distance downstream
movements by homing adult Chinook salmon. Journal of Fish Biology
68:944-950.
Keefer, M.L., C.A. Peery, T.C. Bjornn, and M.A. Jepson. 2004. Hydrosystem, Dam, and
Reservoir Passage Rates of Adult Chinook Salmon and Steelhead in the Columbia
and Snake Rivers. Transactions of the American Fisheries Society,
133:1413-1439.
Keefer, M.L, C.A. Peery, and B.J Burke. 2003b. Passage of radio-tagged adult salmon
and steelhead at John Day Dam with emphasis on fishway temperatures: 1997-
1998. Technical Report 2003-1, Idaho Cooperative Fish and Wildlife Research
Unit, University of Idaho, Moscow.
Mellas, E.J. and J.M Haynes. 1985. Swimming performance and behavior of rainbow
trout (Salmo gairdneri) and white perch (Morone americana): effects of attaching
telemetry transmitters. Canadian Journal of Fisheries and Aquatic Sciences
42:488-493.
Moser, M.L., R.W. Zabel, B.J. Burke, L.C. Stuehrenberg, and T.C. Bjornn. 2004.
Factors affecting adult Pacific lamprey passage rates at hydropower dams; using
“time to event” analysis of radiotelemetry data. Pages 1-10 In M.T. Spedicato, G.
Marmulla, and G. Lembo, editors. Aquatic Telemetry: Advances and
Applications. FAO–COISPA, Rome.

51
Naughton, G.P., C.C. Caudill, C.A. Peery, T.S. Clabough, M.A. Jepson, T.C. Bjornn, and
L.C. Stuehrenberg. 2007. Experimental evaluation of fishway modifications on
the passage behavior of adult Chinook salmon and steelhead at Lower Granite
Dam, Snake River, USA. River Research and Applications 23:99-111.
Naughton, G.P., C.C. Caudill, M.L. Keefer, T.C. Bjornn, L.C. Stuehrenberg , and C.A.
Peery. 2005. Late-season mortality during migration of radio-tagged adult
sockeye salmon (Oncorhynchus nerka) in the Columbia River. Canadian Journal
of Fisheries and Aquatic Sciences 62:30-47.
Peery, C. A., T. C. Bjornn, and L. C. Stuehrenberg. 2003. Water Temperatures and
Passage of Adult Salmon and Steelhead in the Lower Snake River. Technical
Report 2003-2, Idaho Cooperative Fish and Wildlife Research Unit, University of
Idaho, Moscow.
Reischel, T.S., and T.C. Bjornn. 2003. Influence of Fishway Placement on Fallback of
Adult Salmon at the Bonneville Dam on the Columbia River. North American
Journal of Fisheries Management 23:1215–1224.

52
F
o
re
b
a
y
Located 3.2 km
downstream
Located 1.1 km
downstream
NAVLOCK
Robins
IslandPowerhouse 1
Spillway
Bradford
Island
"A" Branch
Bradford I. exit
1BO
2BO
4BO
5BO
6BO
7BO
8BO
9BO
ABO
BBO
QBO
A1A2 A3
A1 A2
A3
A1
A2
A3
A4A5
A6
A1
A2
A4A3
A1 A2
A1
A5
A1A2
A3
A1
A3A4
A1A2A3
A3,2,1WBO
VBO
A1A2
A3
Bonneville Dam
2001 - SETUP
Flow
Forebay
UMT
Channel
NMFS
Facility
weir
Powerhouse 2
Cascades
Island
WA ladder exit
CBO
DBO
BJP
LBO
MBONBO
OBOPBO
A3A1 A4
A1 A2A6 A7
A5
A5
A1
A1
A1A2
A2A4
A1
A2
A3
A4
A1
A2 A3
A3,2,1
A4
XBO
Powerhouse 1
WA Shore
OR Shore
FP = 8BO- 5
MBO-1,2,5
BBO-3, 4
CBO-3, 4
A5A4
EBOA1
A2
FBOA1
A2
A3A4A5A6
TBO
BHI
Juvenile collection
pipe outfall
underwater antenna
A1
232.3 rkm
232.3 rkm
235.1 rkm
235.1 rkm
1BT A1-A5
A1=Turbine 1 gatewells A,B,C;
A2=Turbine 2 gatewells A,B,C, etc.
2BT A1-A5
A1=Turbine 6 gatewells A,B,C;
A2=Turbine 7 gatewells A,B,C, etc.
3BT A1-A4
A1=Turbine 11 gatewells A,B,C;
A2=Turbine 14 gatewells A,B,C, etc.
4BT A1-A4
A1=Turbine 15 gatewells A,B,C;
A2=Turbine 16 gatewells A,B,C, etc.
APPENDIX: 2001 Dam Antenna Locations
Bonneville Dam antenna setup.

53
The Dalles Dam East Ladder
The Dalles Dam Spillway
The Dalles Dam - 2001 setup
Note: orifice gates are closed
The Dalles Dam
East Ladder
HTD
GTD
A1
A3A4
A5
A1
A2
A3
FTD
A4
A5
308.1 rkm
FP = HTD-3, 4, or 5
The Dalles Dam - 2001 Setup
Note: There is not an A6
North Entrance Ladder
Full pool = 160 ft
Minimum pool = 155 ft
5TD
ETD
A1
A2A3
A4
A5
A7
FP = ETD-2
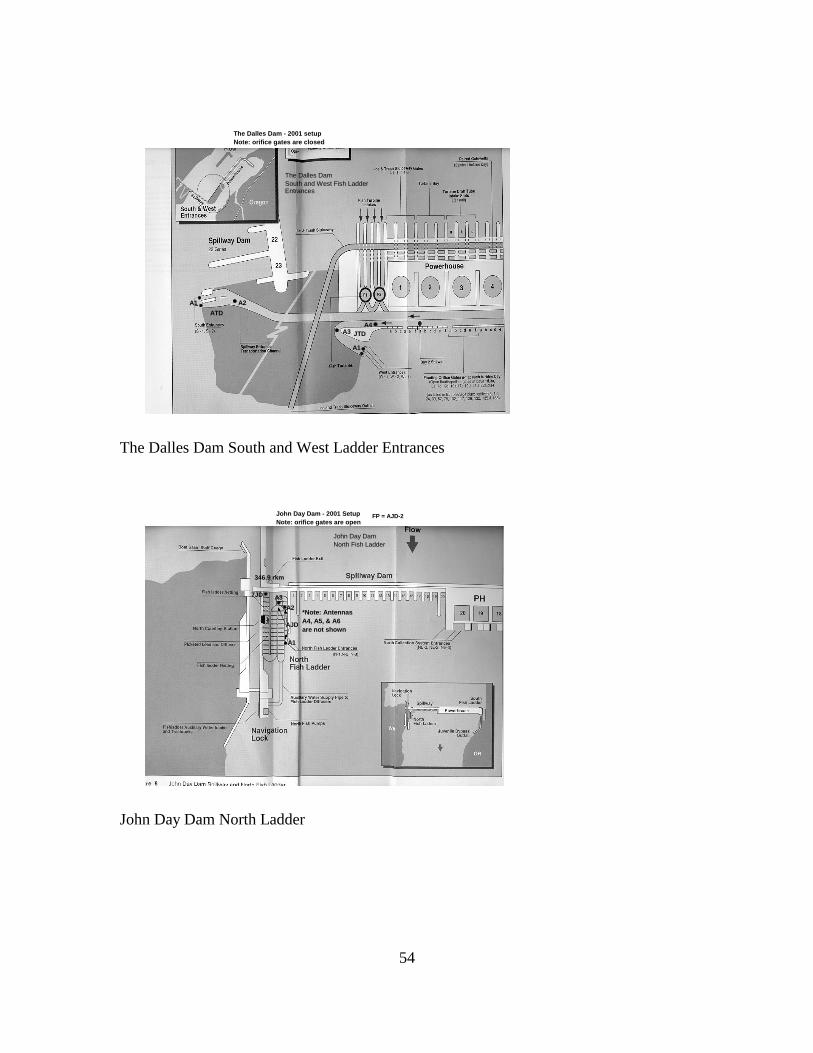
54
The Dalles Dam South and West Ladder Entrances
John Day Dam North Ladder
The Dalles Dam - 2001 setup
Note: orifice gates are closed
The Dalles Dam
South and West Fish Ladder Entrances
ATD
JTD
A1 A2
A1
A3A4
John Day Dam - 2001 Setup
Note: orifice gates are open
John Day Dam
North Fish Ladder
7JD
AJD
A2
A1
A3
*Note: Antennas
A4, A5, & A6
are not shown
346.9 rkm
FP = AJD-2

55
John Day Dam South Ladder
McNary Dam
John Day Dam
Power house and south shore
entrances
BJDLJD
6JD
A1A2
A3A4A5
A4 A1
A3
A1
A3
A2
A5
A6
MJD
FJD
GJD
A4
346.9 rkm
FP = MJD-1
John Day Dam
Power house and south shore
entrances
BJDLJD
6JD
A1A2
A3A4A5
A4 A1
A3
A1
A3
A2
A5
A6
MJD
FJD
GJD
A4
346.9 rkm
FP = MJD-1
Spillway
F
o
reb
ay
Yagi Antenna
Underwater Antenna
Located 2.4 km downstream
Located 2.4 km downstream
Only open OG's and weirs shown
Note:
SFE W2, W1
1,3,4,8,14,21,26,32,37,41,43,44
Labeled south to north
McNary Dam - 2001 Setup
Note: orifice gates are open
Powerhouse
N ladder exit
S ladder exit
W2
W3WFE
NFE W3W2
1MN
2MN
3MN
NMN
BMN
CMN
DMN
EMN
FMNA1A2A4
A3
A4
A1A2
A3
A4
A5
A4
A5
A1
A2
A1A2
A3
A1
A3
A6
BottomNavlock
Juvenilechannel
HMNTopNavlock
LMN
MMNA1
A2
A7
A5
A1
A2
A3
A4
467.3 rkm
467.3 rkm
497.8 rkm
497.8 rkm
FP = CMN-3
NMN-1, 2