Embed Size (px)
Citation preview


Adult Fall Chinook Salmon Passage through Fishways at Lower Columbia River Dams in 1998, 2000, and 2001
Brian J. Burke,† Kinsey E. Frick,† Mary L. Moser,† Theodore J. Bohn,‡ and
Theodore C. Bjornn*
†Fish Ecology Division Northwest Fisheries Science Center National Marine Fisheries Service
2725 Montlake Blvd. East Seattle, Washington 98112
‡Pacific States Marine Fisheries Commission
205 SE Spokane St., Suite 100 Portland, Oregon 97202
*U.S. Geological Survey
Idaho Cooperative Fish and Wildlife Research Unit University of Idaho
Moscow, Idaho 83844-1141
Report of research for
Portland District Northwestern Division
U.S. Army Corps of Engineers P.O. Box 2946
Portland, Oregon 97208-2946 Projects ADS-00-1 through 5 and ADS-00-12
June 2005

ii
iii
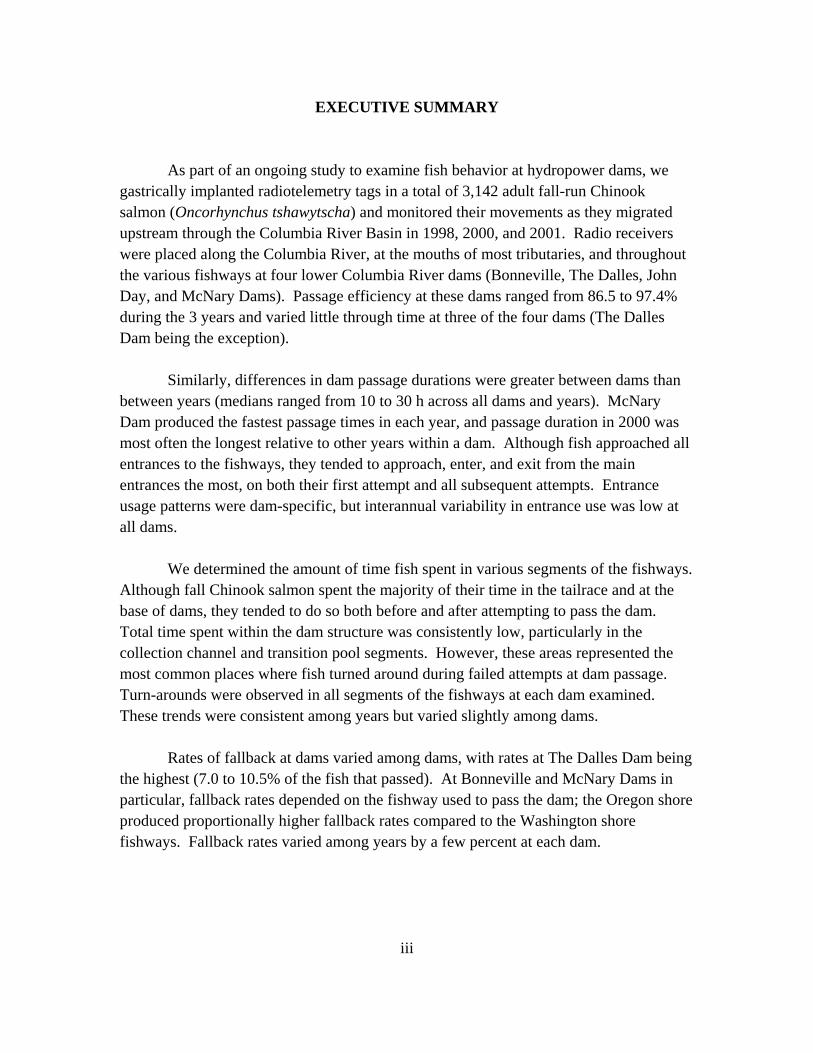
EXECUTIVE SUMMARY As part of an ongoing study to examine fish behavior at hydropower dams, we gastrically implanted radiotelemetry tags in a total of 3,142 adult fall-run Chinook salmon (Oncorhynchus tshawytscha) and monitored their movements as they migrated upstream through the Columbia River Basin in 1998, 2000, and 2001. Radio receivers were placed along the Columbia River, at the mouths of most tributaries, and throughout the various fishways at four lower Columbia River dams (Bonneville, The Dalles, John Day, and McNary Dams). Passage efficiency at these dams ranged from 86.5 to 97.4% during the 3 years and varied little through time at three of the four dams (The Dalles Dam being the exception). Similarly, differences in dam passage durations were greater between dams than between years (medians ranged from 10 to 30 h across all dams and years). McNary Dam produced the fastest passage times in each year, and passage duration in 2000 was most often the longest relative to other years within a dam. Although fish approached all entrances to the fishways, they tended to approach, enter, and exit from the main entrances the most, on both their first attempt and all subsequent attempts. Entrance usage patterns were dam-specific, but interannual variability in entrance use was low at all dams. We determined the amount of time fish spent in various segments of the fishways. Although fall Chinook salmon spent the majority of their time in the tailrace and at the base of dams, they tended to do so both before and after attempting to pass the dam. Total time spent within the dam structure was consistently low, particularly in the collection channel and transition pool segments. However, these areas represented the most common places where fish turned around during failed attempts at dam passage. Turn-arounds were observed in all segments of the fishways at each dam examined. These trends were consistent among years but varied slightly among dams. Rates of fallback at dams varied among dams, with rates at The Dalles Dam being the highest (7.0 to 10.5% of the fish that passed). At Bonneville and McNary Dams in particular, fallback rates depended on the fishway used to pass the dam; the Oregon shore produced proportionally higher fallback rates compared to the Washington shore fishways. Fallback rates varied among years by a few percent at each dam.

iv

v
CONTENTS EXECUTIVE SUMMARY ............................................................................................... iii INTRODUCTION .............................................................................................................. 1 TAGGING METHODS ...................................................................................................... 3 PASSAGE EFFICIENCY................................................................................................... 5
Methods .................................................................................................................. 5 Results..................................................................................................................... 5
PASSAGE DURATION..................................................................................................... 8
Methods .................................................................................................................. 8 Results..................................................................................................................... 8
FISHWAY USE AND BEHAVIOR................................................................................. 16
Approaches, Entrances, and Exits into/from Fishways ........................................ 16 Methods .................................................................................................... 16 Results....................................................................................................... 17
Duration in Fishway Segments ............................................................................. 20 Methods .................................................................................................... 20 Results....................................................................................................... 22
Turn-Arounds........................................................................................................ 28 Methods .................................................................................................... 28 Results....................................................................................................... 29
Fallback Fish......................................................................................................... 38 Methods .................................................................................................... 38 Results....................................................................................................... 38
DISCUSSION................................................................................................................... 43 ACKNOWLEDGEMENTS.............................................................................................. 50 REFERENCES ................................................................................................................. 51 APPENDIX A: 2001 Dam Antenna Locations................................................................ 55 APPENDIX B: Approaches, Entrances, and Exits (Figures) .......................................... 59 APPENDIX C: Approaches, Entrances, and Exits (Tables)............................................ 73

vi

INTRODUCTION An important aspect of research on adult Pacific salmonids (Oncorhynchus spp.) has been to describe how fish moved past dams in the lower Columbia and Snake Rivers. Accurately monitoring movements of fish outfitted with radio transmitters at dams was significantly enhanced with the development of digital spectrum processors (DSP), which, when combined with SRX radio receivers (SRX/DSP units), allowed simultaneous monitoring of all transmitter frequencies. SRX/DSP radio receivers were first used to monitor fishway entrance use by steelhead (O. mykiss) at Lower Granite Dam in 1992 (Bjornn et al. 1994). Monitoring fishway entrance use and movements within the fishways of adult salmon and steelhead at all four of the lower Snake River dams began in spring 1993 and continued through 1994. Antennas connected to SRX/DSP receivers were placed near entrances to fishways, within fishways, and at the top of the ladders at all four lower Snake River Dams. With this telemetry system, we monitored movements of individual fish outfitted with transmitters as they approached entrances to fishways, determined openings used by fish to enter and exit fishways, documented movement within fishways, and assessed the time required for fish to pass the dams. Here we report passage results for fall Chinook salmon for 1998, 2000, and 2001 (fall Chinook salmon were not tagged in 1999), which included, but were not limited to, fishway entrance use, movements in the fishways, delay and passage times at lower Columbia River dams, and routes and rates of fallback events. Detailed information on fishway use and passage in years prior to 1998 and for other runs and species was reported in Bjornn et al. (1995, 1998), Keefer et al. (2003a), and Naughton et al. (2005).

2

3
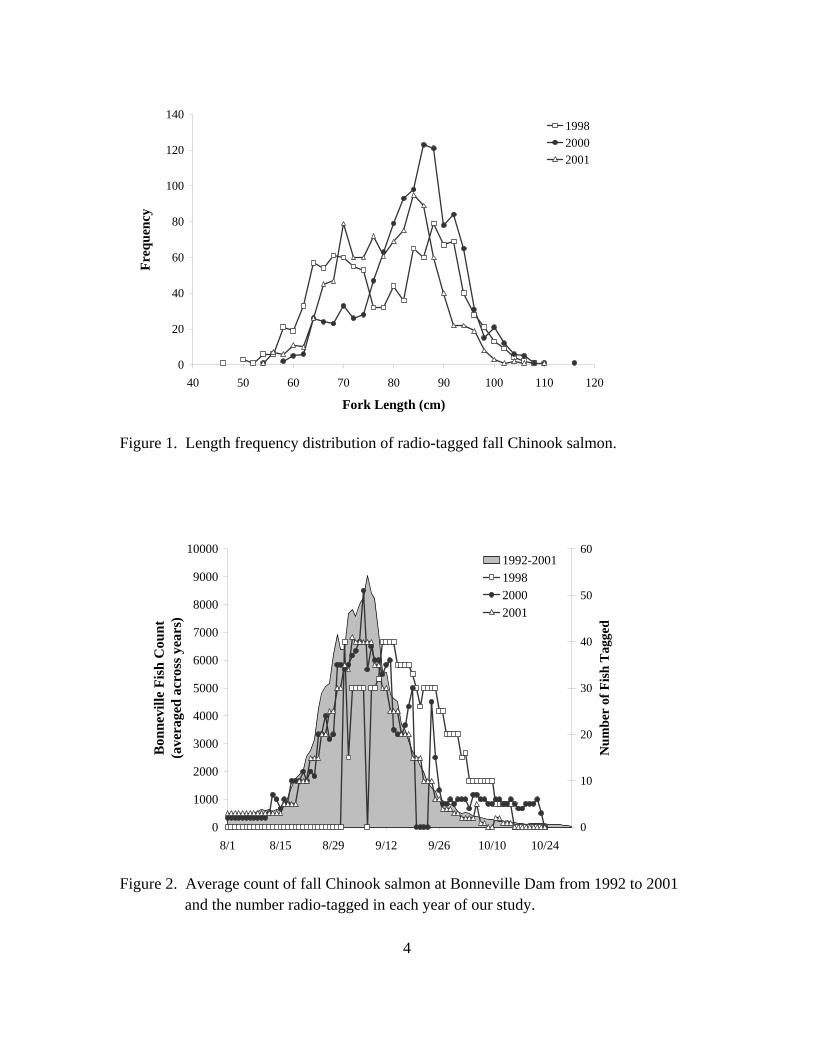
TAGGING METHODS Fall Chinook salmon (O. tshawytscha, mean length = 81.4 cm, range 47 to 116.5 cm; Figure 1) were collected and outfitted with radio transmitters at the Washington shore Adult Fish Facility (AFF) at Bonneville Dam on the mainstem Columbia River (river kilometer (rkm) 235.1; Table 1). Sampling started in early August (except in 1998, when high water temperatures precluded sampling until September) and ran through October; these times were set to coincide with the fall Chinook run at large (Table 1; Figure 2). To maximize sample sizes across the lower Columbia River hydropower projects, upriver bright fall Chinook were selected when possible (and tules, which usually spawn in tributaries of the lower Columbia River, selected against). At each of the four lower Columbia River dams, SRX receivers were used to determine when tagged fish first entered the tailrace of a dam. SRX/DSP receivers placed in and around the various fishways were used to determine when a fish approached a dam, entered a fishway, moved within the fishway, and exited the fishway (see Appendix A for maps of antenna locations). Bjornn et al. (2000) and Keefer et al. (2004) provide a detailed description of tagging and monitoring methods used throughout the basin. Methods and results for individual analyses in this report appear below. Table 1. Number of fish released above and below Bonneville Dam (BO). Date range is
for releases.
1998 2000 2001 1 Sep-15 Oct 1 Aug-23 Oct 1 Aug-15 Oct
Total number tagged 1,032 1,118 992
Released downstream of BO 1,032 745 561
Released upstream of BO 0 373 431
4
0
20
40
60
80
100
120
140
40 50 60 70 80 90 100 110 120
Fork Length (cm)
Freq
uenc
y199820002001
0
1000
2000
3000
4000
5000
6000
7000
8000
9000
10000
8/1 8/15 8/29 9/12 9/26 10/10 10/24
Bon
nevi
lle F
ish
Cou
nt(a
vera
ged
acro
ss y
ears
)
0
10
20
30
40
50
60
Num
ber
of F
ish
Tag
ged
1992-2001199820002001
Figure 1. Length frequency distribution of radio-tagged fall Chinook salmon. Figure 2. Average count of fall Chinook salmon at Bonneville Dam from 1992 to 2001
and the number radio-tagged in each year of our study.

5
PASSAGE EFFICIENCY
Methods We calculated fish passage efficiency for each of the four lower Columbia River dams. We defined passage efficiency as the number of fish passing a dam divided by the number of fish that had an opportunity to pass. The opportunity to pass was determined two ways; first we included all fish that were detected at the dam, and then we included only those fish that entered a fishway at that dam. Because some fish were released upstream from Bonneville Dam in 2000 and 2001, we used only fish that were released downstream from Bonneville Dam for this analysis. However, all fish that approached The Dalles, John Day, and McNary Dams were included in analyses of passage at these dams. Because fallback events cause fish to expend more energy and can reduce escapement to spawning grounds (Boggs et al. 2003), we noted fallbacks at each dam. These events were identified by detections downstream from a dam that occurred after a fish passed that dam. For fish that fell back at a dam, we included in our analysis of dam passage time and passage efficiency only detections occurring before the fallback event. We also calculated passage efficiency on subsequent passage attempts, including only detections occurring after the fallback event.
Results Passage efficiency (before fallback) for all fish detected anywhere at these four dams ranged from 86.5 to 97.4% for the 3 years reported here (Table 2). Using only fish that entered a fishway, passage efficiency ranged from 88.9 to 100%. Passage efficiency at John Day Dam was slightly different in both magnitude and variability from the other three lower Columbia River dams. At John Day Dam, passage efficiency was variable among years and increased monotonically from 1998 to 2001, whereas at Bonneville, The Dalles, and McNary Dams, passage efficiency (for fish detected anywhere) was lowest in 2000, differed relatively little between years, and did not provide evidence of clear trends. For fish that fell back over a dam, reascension rates were much lower than passage efficiency of fish making their first ascent. Rates ranged from under 10% at John Day Dam (1998) to 76% at Bonneville Dam (2001). However, when considering only those fish that re-entered a fishway, passage efficiency was higher in all cases (although sample sizes were very low). This higher passage efficiency using only fish that entered a fishway was substantial, but passage efficiency numbers at John Day Dam in 1998 and 2000 were still very low following fallback events. See Boggs et al. (2004)

6
for more information on reascension rates.

7
Table 2. Passage efficiency at dams defined as number of fish passing a dam divided by either the number of fish detected anywhere at a dam or the number of fish that entered a fishway. Upper panel represents passage efficiency before any fallback events; lower represents passage efficiency after a fallback event.
1998 2000 2001
BonnevilleThe
Dalles John Day McNary Bonneville
The Dalles
John Day McNary Bonneville
The Dalles
John Day McNary
Before fallback Number released below dam 1032 1032 1032 1032 745 1118 1118 1118 561 992 992 992 Number recorded anywhere at dam 977 690 557 439 708 835 641 483 548 794 615 499 Number recorded approaching dam 931 666 547 433 668 782 630 468 527 764 606 496 Number recorded entering fishway 918 657 542 430 657 773 628 467 521 752 605 494 Number passed 914 628 482 428 659 738 567 456 521 713 580 482 Passage efficiency (all detections) 93.5 91.0 86.5 97.4 93.0 88.3 88.4 94.4 95.0 89.8 94.3 96.5 Passage efficiency (fish that entered) 99.5 95.5 88.9 99.5 100 95.4 90.2 97.6 100 94.8 95.8 97.5
After fallback Number that fell back 32 66 19 9 26 62 14 9 25 50 15 17 Number recorded anywhere at dam 32 55 16 9 26 52 10 8 25 50 12 16 Number recorded approaching dam 16 23 6 7 21 27 6 2 23 27 4 9 Number recorded entering fishway 18 22 5 4 18 24 4 2 19 25 4 9 Number passed 14 19 1 3 17 22 1 2 19 21 3 7 Passage Efficiency (all detections) 43.7 34.5 6.2 33.3 65.3 42.3 10.0 25.0 76.0 42.0 25.0 43.7 Passage Efficiency (fish that entered) 77.7 86.3 20.0 75.0 94.4 91.6 25.0 100 100 84.0 75.0 77.7

8
PASSAGE DURATION
Methods For passage duration calculations, we determined the timing of three events for each fish, defined as follows: 1) Arrival in the area of a dam tailrace: the first detection of a fish at a tailrace
receiver (between 1.8 and 3.2 km downstream from each dam). 2) First approach to a dam fishway entrance: the first detection at a receiver just
outside a fishway entrance. 3) Passage of a dam: the last detection at the top of a ladder. Using these records, we calculated the time from arrival in the tailrace to first approach, the time from first approach to dam passage, and the total passage time from arrival in the tailrace to dam passage. Some fish were not detected at one or more of these endpoints and, therefore, were not included in this analysis. Similar passage times were calculated for fish that fell back over a dam to determine whether fish perform differently on their second ascension. In the case of fish with multiple fallbacks, only the data recorded during the first re-ascension were used in this analysis.
Results Apparent in much of the passage duration data was a distinct diel effect. It is beyond the scope of this report to elucidate the exact diel trend, but techniques are available for such analyses (Moser et al. 2004; Naughton et al. 2005), and results for Chinook are forthcoming. Diel trends were evident even in simple counts of coded records of fish movement (Figure 3). Since a coded record is always the first of a block of detections at a particular site (for a given fish), the timing of coded records more often than not represents the arrival to a particular area, and therefore indicates at least some movement of the fish. The timing of coded records clearly indicated that most salmon activity occurred from approximately 0600 to 1800 hours.

9
0
200
400
600
800
1000
1200
0 2 4 6 8 10 12 14 16 18 20 22Time of Day
Freq
uenc
y
0
5000
10000
15000
20000
25000
30000
35000LTLPFPE1A1F1 and L1All
Figure 3. Frequency of coded records of fish movement per hour of the day for 1998.
LT = last top, LP = last pool, FP = first pool, E1 = first entrance into fishway, A1 = first approach to fishway, F1 and L1 = first approach and last departure from downstream areas, All = all coded records for fall Chinook in 1998 (right axis).
Median passage durations resulting from these fish movements are shown in Table 3. Sample sizes ranged from 178 to 882 fish. With few exceptions, differences in passage duration were greater among dams than among years (Figures 4-6). In all cases, the distribution of times to pass a dam (whether measured from arrival downstream or first approach) was highly skewed to the right. Therefore, all statistical analyses were nonparametric, and we tested for differences between distributions of passage times, rather than medians.

10
Table 3. Median duration (h) and sample size (n) for pre-fallback passage events.
Arrival in the area to first approach
at a dam
First approach at a dam to dam
passage Arrival in the area to
dam passage
Dam Year Duration
(h) n Duration
(h) n Duration
(h) n
Bonneville 1998 2.0 792 14.9 882 20.6 784 2000 2.9 543 12.9 637 21.8 543 2001 2.5 471 10.1 502 17.1 474 The Dalles 1998 3.3 231 11.4 589 16.0 222 2000 4.0 312 14.5 696 19.2 301 2001 3.5 496 11.2 686 17.6 468 John Day 1998 1.6 344 21.9 361 23.1 299 2000 1.6 279 30.0 525 32.4 261 2001 1.4 282 20.0 542 21.4 284 McNary 1998 1.6 306 7.7 385 10.1 283 2000 1.9 197 11.0 424 16.5 178 2001 1.7 294 10.7 425 13.9 273

11
0
0.2
0.4
0.6
0.8
1
0 4 8 12 16 20 24Time (h)
199820002001
0
0.2
0.4
0.6
0.8
1
0 4 8 12 16 20 24Time (h)
199820002001
0
0.2
0.4
0.6
0.8
1
0 4 8 12 16 20 24Time (h)
Cum
ulat
ive
Prop
ortio
n of
Fis
h
199820002001
0
0.2
0.4
0.6
0.8
1
0 4 8 12 16 20 24Time (h)
Cum
ulat
ive
Prop
ortio
n of
Fis
h
199820002001
Bonneville Dam The Dalles Dam
John Day Dam McNary Dam Figure 4. Cumulative proportion of fish as a function of duration from the first detection
downstream from a dam to the first approach at that dam. Median passage times are shown in Table 3.

12
0
0.2
0.4
0.6
0.8
1
0 12 24 36 48 60 72 84 96Time (hrs)
199820002001
0
0.2
0.4
0.6
0.8
1
0 12 24 36 48 60 72 84 96Time (hrs)
199820002001
0
0.2
0.4
0.6
0.8
1
0 12 24 36 48 60 72 84 96Time (hrs)
Cum
ulat
ive
Prop
ortio
n of
Fis
h
199820002001
0
0.2
0.4
0.6
0.8
1
0 12 24 36 48 60 72 84 96Time (hrs)
Cum
ulat
ive
Prop
ortio
n of
Fis
h
199820002001
Bonneville Dam The Dalles Dam
John Day Dam McNary Dam Figure 5. Cumulative proportion of fish as a function of duration from the first approach
at a dam to the last detection at the top of the ladder at that dam. Median passage times are shown in Table 3.

13
0
0.2
0.4
0.6
0.8
1
0 12 24 36 48 60 72 84 96Time (hrs)
199820002001
0
0.2
0.4
0.6
0.8
1
0 12 24 36 48 60 72 84 96Time (hrs)
199820002001
0
0.2
0.4
0.6
0.8
1
0 12 24 36 48 60 72 84 96Time (hrs)
Cum
ulat
ive
Prop
ortio
n of
Fis
h
199820002001
0
0.2
0.4
0.6
0.8
1
0 12 24 36 48 60 72 84 96Time (hrs)
Cum
ulat
ive
Prop
ortio
n of
Fis
h
199820002001
Bonneville Dam The Dalles Dam
John Day Dam McNary Dam
Figure 6. Cumulative proportion of fish as a function of duration from the first detection
downstream from a dam to the last detection at the top of the ladder at that dam. Median passage times are shown in Table 3.

14
For time from downstream arrival in the area to first approach, median salmon passage times were longest at The Dalles Dam in all 3 years (Table 3), ranging from 3.3 to 4.0 h. However, the median passage time is only one attribute of a non-normal distribution. At Bonneville Dam, for example, the cumulative distribution of first to last detection passage times (Figure 6) indicated a bimodal distribution of passage times, where the 80th percentile was much larger than that for The Dalles Dam. The bimodal patterns follow 12- and 24-hour intervals, relating to the diel patterns of fish activity. Median passage duration from first approach to passage ranged from 7.7 (McNary Dam, 1998) to 30.0 h (John Day Dam, 2000, Figure 5). John Day Dam had longer passage time distributions than all three other dams in every year (Wilcoxon rank sum test, P <0.0001). Across dams, passage duration was longest in 2000 in most cases (Wilcoxon rank sum test, P <0.05). The only exceptions to this were at Bonneville Dam in 1998 and McNary Dam in 2001 (neither of which was significantly different from 2000, P >0.05). When we examine the time from arrival in the area of a dam to passage of that dam, both the median values and the cumulative proportion values (Figure 6) were lowest in 2000 in all cases. The overall range was 10.1 (McNary Dam, 1998) to 32.4 h (John Day Dam, 2000). John Day Dam was again consistently the longest to pass on median, but not as drastically as for duration from first approach to passage. Also, as with passage duration calculated as time from first approach to passage, differences between 1998 and 2001 were usually less significant than between either year and 2000. Due to small sample sizes, only median values of post-fallback passage time (for fish that fell back) are reported (Table 4). As with pre-fallback passage times, we report three separate passage metrics: arrival in the area to first approach of the dam, first approach to dam passage, and arrival in the area to dam passage. Median passage times across the three metrics ranged from 1.7 to 604.4 h (n = 1 in both cases). In most cases, post-fallback median passage times were either not significantly different from or longer than pre-fallback median passage times, though this was not always true (e.g., first approach to passage at Bonneville Dam in 1998).

15
Table 4. Median passage duration (h) and sample size (n) for post-fallback passage
events.
Arrival in the area to first approach
at a dam
First approach at a dam to dam
passage Arrival in the area to
dam passage
Dam Year Duration
(h) n Duration
(h) n Duration
(h) n
Bonneville 1998 40.4* 6 4.9* 10 41.7 5 2000 12.5* 28 10.8 34 46.2 27 2001 6.7* 55 13.4 61 21.1* 51 The Dalles 1998 23.9* 12 14.5 16 34.5* 12 2000 9.4* 14 14.9 19 27.9 15 2001 4.0 17 8.7 18 17.5 16 John Day 1998 123.8 1 140.2 1 N/A 0 2000 10.5* 2 135.3 1 N/A 0 2001 39.2 4 10.0 3 144.5 3 McNary 1998 444.1* 2 29.0* 3 604.4 1 2000 1.7 1 435.3 1 437.0 1 2001 1.9 5 13.6 7 19.9 4 * Significantly different than corresponding value in Table 3 (Wilcoxon rank sum test, P <0.05).

16
FISHWAY USE AND BEHAVIOR Radio receivers were set up strategically within each fishway to ensure adequate coverage for determining fish behavior. In addition to passage efficiency and duration, the placement of these receivers enabled us to follow fish movement in and around the entrances to the various fishways. We examined behavior within the fishways both in terms of how long fish spend in various segments of each fishway and how often fish change direction within a fishway.
Approaches, Entrances, and Exits into/from Fishways Methods For each dam, we analyzed the number of times that adult fall Chinook salmon passed through individually monitored entrances. We obtained less spatial resolution in 2000 and 2001 at Bonneville Dam Powerhouse 2 and the McNary Dam powerhouse because fewer entrance locations were monitored than in 1998. As with other analyses, fish released upstream from Bonneville Dam were not included in the calculations at Bonneville Dam. We computed first approaches (the first fishway entrance approached by an individual fish), and all approaches (all approaches, including the first approaches, that were made at a given entrance) at each dam. An approach was defined as the detection of a radio-tagged fish at an antenna positioned outside an entrance. After their first approach, fish often approached multiple entrances and orifice gates many times. However, it was difficult to discern whether a fish was approaching an entrance or merely swimming past it. Occasionally, a fish was detected inside the fishway without being detected outside the entrance. This was termed “unknown approach.” If it was clear which entrance location the fish had approached, the data were assigned to that entrance. If it was unclear which entrance was approached, the data were assigned to the fishway system where the fish approached (e.g., Washington-shore fishway), but not an individual approach location. Similarly, we computed first entrances (the first entrance location for an individual fish), and all entrances (all entrances, including first entrances) that were made at a given location. An entrance was defined as the detection of a transmitter by an antenna positioned inside a fishway. When it was clear which entrance location was used, but the time of entry was not clear (“unknown entrance”), the passage was assigned

17
to that entrance location. If the entrance location was not clear, the passage was assigned to the fishway system that was entered. We also computed apparent entrance efficiency, defined as the number of fish that first entered a particular fishway entrance divided by the number of fish that made their first approach to that fishway entrance. A third metric, assessing fishway exits, was also evaluated. Exits were defined as detection in a fishway followed by detection outside of and downstream from the fishway. We determined the number of first exits (the first exit location for fish that entered and subsequently exited the fishway into the tailrace), and all exits (all exits, including first exits) that were made at a given location. An “Unknown exit” (fish detected downstream from the fishway but not directly detected exiting the fishway) was assigned to specific locations when the exit location was clear from previous and subsequent detections. Otherwise, data were assigned to the fishway system that the fish had exited. For fish that fell back downstream after having reached the dam forebay, we compared the approach, entrance, and exit locations before and after the fallback event. For fish with multiple fallbacks, only the events recorded during the first re-ascension were used. Results In general, interannual variability in entrance use was low for the lower Columbia River dams (Appendices B and C). However, there were distinct usage patterns for fall Chinook salmon at each dam. These results focus on entrance usage during dam passage attempts prior to fallback events; behaviors after fallbacks were similar (Appendix C). Similarly, fishway usage for all events (approaches, entrances, and exits) directly followed the pattern for first approach, first entrance, and first exit. Bonneville Dam—With all years combined, fish made approaches in roughly equal numbers at powerhouse 1 (PH1) and powerhouse 2 (PH2). We observed fewer first approaches at the main entrances adjacent to the spillway than at the powerhouses. At the powerhouses, fish made initial approaches at all main ladder entrances, though more fish initially approached the north shore of PH2 than other PH2 entrances. In 1998 and 2001, fish tended to first approach, first enter, and pass via the Washington shore ladder in greater proportions than via the Oregon shore ladder (Table 5). However, in 2000, the opposite trend occurred; fish used the Oregon shore ladder more frequently for all three activities.

18
Table 5. Number of radio-tagged adult subyearling Chinook salmon known to make first approaches, first entrances, and pass a dam via each of two ladders or pass via the navigation lock.
Bonneville Dam The Dalles Dam John Day Dam McNary Dam
WA
Shore OR
Shore Nav North East Nav North South Nav North South Nav
1998 Approached 542 427 N/A 34 601 N/A 42 436 N/A 77 347 N/A Entered 517 301 N/A 35 552 N/A 39 294 N/A 128 281 N/A Passed 471 407 32 91 538 0 136 345 0 227 199 2 2000 Approached 275 385 N/A 62 691 N/A 22 577 N/A 66 391 N/A Entered 229 351 N/A 72 647 N/A 39 439 N/A 164 206 N/A Passed 245 385 29 112 626 0 182 386 0 298 150 8 2001 Approached 358 157 N/A 91 646 N/A 21 551 N/A 58 416 N/A Entered 285 160 N/A 77 602 N/A 19 410 N/A 81 292 N/A Passed 303 206 12 100 613 0 31 549 0 148 334 0

19
Apparent entrance efficiency (first entrances divided by first approaches) differed among fishway entrances. Specifically, the PH2 south shore had many more first entrances per first approach than the PH2 north shore. A similar pattern occurred at PH1, though the difference in efficiency between the south entrance and the north entrance was not as large as at PH2. At both Bonneville Dam powerhouses, the orifice gates had many fewer entrances than approaches. Fall Chinook salmon exited Bonneville Dam fishways in roughly the same distribution across entrances as they used fishways to enter. The Dalles Dam—Fish tended to first approach at the east ladder entrance (Table 5; Appendices B and C). Entrance efficiency here was high; there were even more fish that made a first entrance at the east ladder than made their first approach at this location. Unlike what was observed at Bonneville Dam, fish used different entrances to exit the fishways than they used to enter them. In fact, the majority of exits (between 47 and 65%) were from the entrance adjacent to the south side of the spillway. Relatively few fish used the north shore fishway for approaches, entrances, exits, or passage. John Day Dam—Similar to what was observed at The Dalles Dam, very few fish used the north ladder entrances for any activities. Although fish apparently approached the John Day Dam entrances in the same proportion as they entered them, the number of unknown entrances was high (Appendices B and C). It was therefore difficult to estimate entrance efficiency for the south ladder (Table 5). Likewise, we were unable to determine whether fish entered the John Day Dam fishways in the same proportions as they exited them. McNary Dam—As at the other dams, interannual variability in entrance use was low at McNary Dam (Appendices B and C). Most first approaches were made at either the south spillway entrance, the north end of the powerhouse, or the main entrance to the north ladder. Although fewer fish were detected entering the north end of the powerhouse than were detected approaching, the number of unknown entrances was higher than the number of unknown approaches. Many of the unknown entrances could have been at the north end of the powerhouse, making the number of approaches and the number of entrances comparable. However, more fish first entered the north ladder entrance than made their first approach there, and more fish passed via the north ladder than first approached or first entered that ladder (Table 5). After their first approach, fish approached multiple entrances and orifice gates many times. In general, proportional use of entrances was not different between the first entrance or exit and all subsequent entrances or exits (Appendices B and C).
20
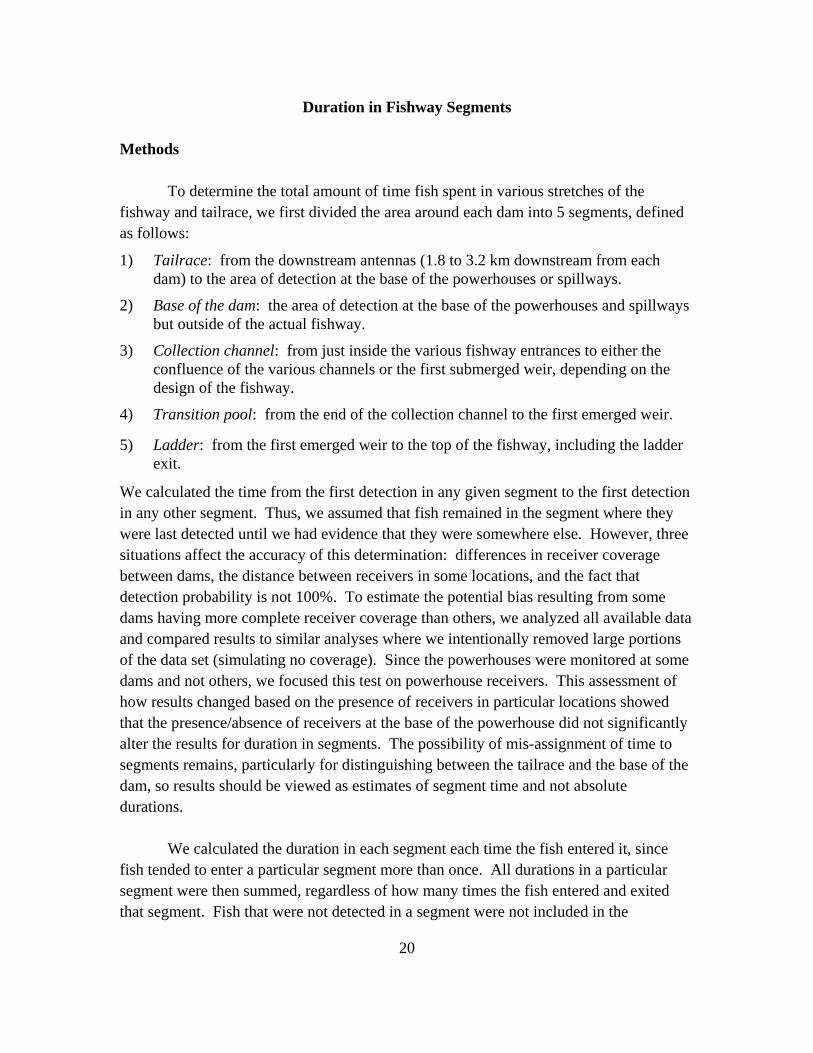
Duration in Fishway Segments Methods To determine the total amount of time fish spent in various stretches of the fishway and tailrace, we first divided the area around each dam into 5 segments, defined as follows:
1) Tailrace: from the downstream antennas (1.8 to 3.2 km downstream from each dam) to the area of detection at the base of the powerhouses or spillways.
2) Base of the dam: the area of detection at the base of the powerhouses and spillways but outside of the actual fishway.
3) Collection channel: from just inside the various fishway entrances to either the confluence of the various channels or the first submerged weir, depending on the design of the fishway.
4) Transition pool: from the end of the collection channel to the first emerged weir.
5) Ladder: from the first emerged weir to the top of the fishway, including the ladder exit.
We calculated the time from the first detection in any given segment to the first detection in any other segment. Thus, we assumed that fish remained in the segment where they were last detected until we had evidence that they were somewhere else. However, three situations affect the accuracy of this determination: differences in receiver coverage between dams, the distance between receivers in some locations, and the fact that detection probability is not 100%. To estimate the potential bias resulting from some dams having more complete receiver coverage than others, we analyzed all available data and compared results to similar analyses where we intentionally removed large portions of the data set (simulating no coverage). Since the powerhouses were monitored at some dams and not others, we focused this test on powerhouse receivers. This assessment of how results changed based on the presence of receivers in particular locations showed that the presence/absence of receivers at the base of the powerhouse did not significantly alter the results for duration in segments. The possibility of mis-assignment of time to segments remains, particularly for distinguishing between the tailrace and the base of the dam, so results should be viewed as estimates of segment time and not absolute durations. We calculated the duration in each segment each time the fish entered it, since fish tended to enter a particular segment more than once. All durations in a particular segment were then summed, regardless of how many times the fish entered and exited that segment. Fish that were not detected in a segment were not included in the

21
calculation for that segment.

22
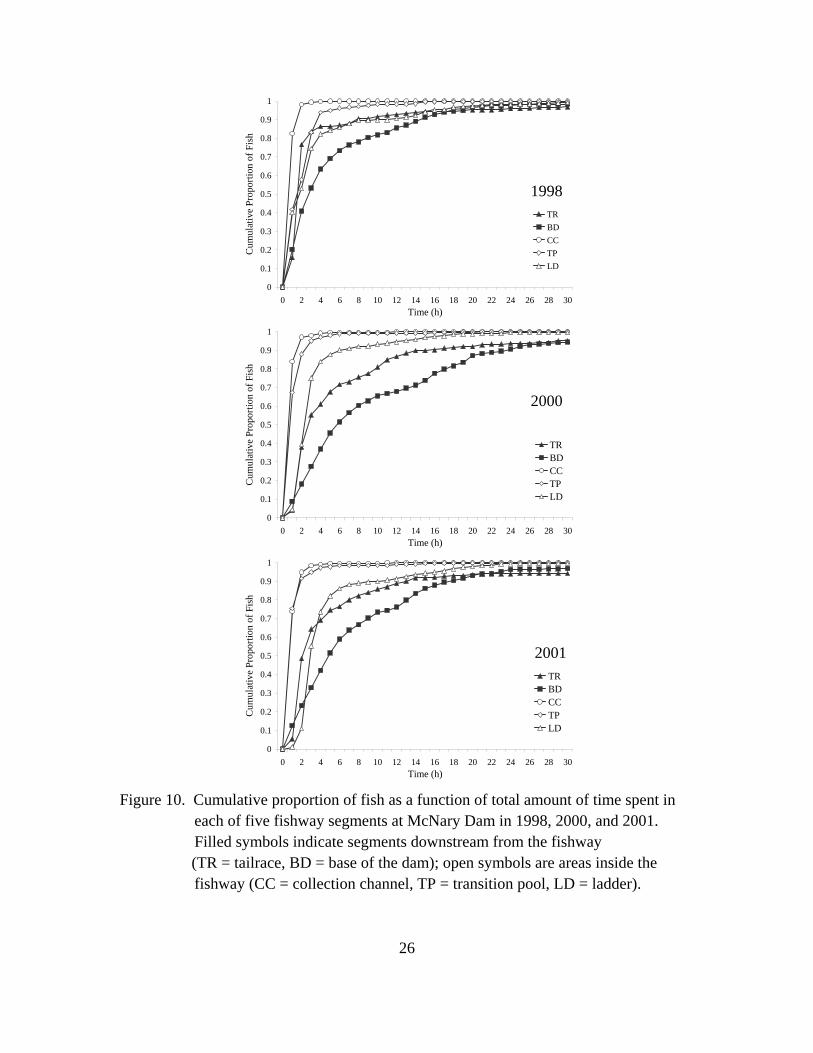
Results Segment times ranged widely, and the distributions were highly skewed. Data are presented as the cumulative proportion of the fish that spent less or equal time in a segment than the time reported for that segment (Figures 7-10). For example, 80% of the fish spent a total of 4 h or less in the ladder segment at Bonneville Dam in 2000. Overall, fish consistently spent less time in the collection channel and the transition pool than in other segments of the fishways (Figures 7-10, Table 6). In most cases, over 90% of the fish spent less than 2 h in each of these segments. The range of medians for the collection channel was 0.3 (McNary Dam, 2000) to 3.2 h (John Day Dam, 2000), while that for the transition pool was 0.3 (Bonneville Dam, 2000) to 1.7 h (McNary Dam, 1998; Table 6). The amount of time spent in the other segments was dam-specific, though the tailrace and base of the dam segments consistently had the longest durations across dams (medians ranged from 1.4 to 16.8 h). At Bonneville Dam, fish spent more time in the ladder than in the collection channel or the transition pool, but less time than in the tailrace and base of the dam segments. At The Dalles and John Day Dams, time spent in the ladder was more comparable to the amount of time spent in the collection channel and transition pools, with most of the time spent at the base of the dam. At McNary Dam, fish spent relatively little time in all segments except the base of the dam, where fish spent, on median, between 2.8 and 5.7 h. Among-year differences were minor. At Bonneville Dam, fish spent more time in the tailrace in 1998 than in the other 2 years. In 2000, they spent more time at the base of the dam than in the other 2 years (a pattern seen at all four dams). And in 2001, they spent more time in the ladder than in the other 2 years. Interannual variability at the other dams was of similar magnitude to that at Bonneville Dam, but the pattern of time spent in the different segments varied among dams (Figures 7-10).

23
0
0.1
0.2
0.3
0.4
0.5
0.6
0.7
0.8
0.9
1
0 2 4 6 8 10 12 14 16 18 20 22 24 26 28 30Time (h)
Cum
ulat
ive
Prop
ortio
n of
Fis
h
TRBDCCTPLD
0
0.1
0.2
0.3
0.4
0.5
0.6
0.7
0.8
0.9
1
0 2 4 6 8 10 12 14 16 18 20 22 24 26 28 30Time (h)
Cum
ulat
ive
Prop
ortio
n of
Fis
h
TRBDCCTPLD
0
0.1
0.2
0.3
0.4
0.5
0.6
0.7
0.8
0.9
1
0 2 4 6 8 10 12 14 16 18 20 22 24 26 28 30Time (h)
Cum
ulat
ive
Prop
ortio
n of
Fis
h
TRBDCCTPLD
1998 2000 2001 Figure 7. Cumulative proportion of fish as a function of total amount of time spent in
each of five fishway segments at Bonneville Dam in 1998, 2000, and 2001. Filled symbols indicate segments downstream from the fishway (TR = tailrace, BD = base of the dam); open symbols are areas inside the fishway (CC = collection channel, TP = transition pool, LD = ladder).

24
0
0.1
0.2
0.3
0.4
0.5
0.6
0.7
0.8
0.9
1
0 2 4 6 8 10 12 14 16 18 20 22 24 26 28 30Time (h)
Cum
ulat
ive
Prop
ortio
n of
Fis
h
TRBDCCTPLD
0
0.1
0.2
0.3
0.4
0.5
0.6
0.7
0.8
0.9
1
0 2 4 6 8 10 12 14 16 18 20 22 24 26 28 30Time (h)
Cum
ulat
ive
Prop
ortio
n of
Fis
h
TRBDCCTPLD
0
0.1
0.2
0.3
0.4
0.5
0.6
0.7
0.8
0.9
1
0 2 4 6 8 10 12 14 16 18 20 22 24 26 28 30Time (h)
Cum
ulat
ive
Prop
ortio
n of
Fis
h
TRBDCCTPLD
1998 2000 2001 Figure 8. Cumulative proportion of fish as a function of total amount of time spent in
each of five fishway segments at The Dalles Dam in 1998, 2000, and 2001. Filled symbols indicate segments downstream from the fishway (TR = tailrace, BD = base of the dam); open symbols are areas inside the fishway (CC = collection channel, TP = transition pool, LD = ladder).

25
0
0.1
0.2
0.3
0.4
0.5
0.6
0.7
0.8
0.9
1
0 2 4 6 8 10 12 14 16 18 20 22 24 26 28 30Time (h)
Cum
ulat
ive
Prop
ortio
n of
Fis
h
TRBDCCTPLD
0
0.1
0.2
0.3
0.4
0.5
0.6
0.7
0.8
0.9
1
0 2 4 6 8 10 12 14 16 18 20 22 24 26 28 30Time (h)
Cum
ulat
ive
Prop
ortio
n of
Fis
h
TRBDCCTPLD
0
0.1
0.2
0.3
0.4
0.5
0.6
0.7
0.8
0.9
1
0 2 4 6 8 10 12 14 16 18 20 22 24 26 28 30Time (h)
Cum
ulat
ive
Prop
ortio
n of
Fis
h
TRBDCCTPLD
1998 2000 2001 Figure 9. Cumulative proportion of fish as a function of total amount of time spent in
each of five fishway segments at John Day Dam in 1998, 2000, and 2001. Filled symbols indicate segments downstream from the fishway (TR = tailrace, BD = base of the dam); open symbols are areas inside the fishway (CC = collection channel, TP = transition pool, LD = ladder).
26
0
0.1
0.2
0.3
0.4
0.5
0.6
0.7
0.8
0.9
1
0 2 4 6 8 10 12 14 16 18 20 22 24 26 28 30Time (h)
Cum
ulat
ive
Prop
ortio
n of
Fis
h
TRBDCCTPLD
0
0.1
0.2
0.3
0.4
0.5
0.6
0.7
0.8
0.9
1
0 2 4 6 8 10 12 14 16 18 20 22 24 26 28 30Time (h)
Cum
ulat
ive
Prop
ortio
n of
Fis
h
TRBDCCTPLD
0
0.1
0.2
0.3
0.4
0.5
0.6
0.7
0.8
0.9
1
0 2 4 6 8 10 12 14 16 18 20 22 24 26 28 30Time (h)
Cum
ulat
ive
Prop
ortio
n of
Fis
h
TRBDCCTPLD
1998 2000 2001 Figure 10. Cumulative proportion of fish as a function of total amount of time spent in
each of five fishway segments at McNary Dam in 1998, 2000, and 2001. Filled symbols indicate segments downstream from the fishway (TR = tailrace, BD = base of the dam); open symbols are areas inside the fishway (CC = collection channel, TP = transition pool, LD = ladder).

27
Table 6. Median time in each segment of the fishways and time between segments for radio-tagged adult fall Chinook salmon.
Median total time spent in fishway segment (h)
Tailrace Base of the damCollection
channel Transition pool Ladder
Bonneville Dam 1998 12.4 2.5 0.6 0.5 3.0 2000 12.9 4.1 0.5 0.3 2.6 2001 8.7 2.4 0.4 0.4 3.4 The Dalles Dam 1998 4.6 5.5 0.9 0.7 2.0 2000 3.7 11.6 0.6 1.1 1.9 2001 3.1 6.8 0.5 0.8 2.3 John Day Dam 1998 4.6 9.5 2.1 0.7 2.7 2000 12.2 16.8 3.2 0.7 2.8 2001 4.9 9.0 2.2 0.4 3.1 McNary Dam 1998 1.4 2.8 0.5 1.7 1.9 2000 2.5 5.7 0.3 0.7 2.2 2001 2.1 4.8 0.6 0.6 2.9
Median time between first detection in a segment and first detection in next segment (h)*
Bonneville Dam 1998 2.0 0.6 0.2 2.2 2.9 2000 2.7 1.1 0.2 1.5 2.5 2001 2.5 0.5 0.2 0.9 3.3 The Dalles Dam 1998 3.4 1.3 0.0 2.3 2.0 2000 4.1 0.8 0.0 4.1 1.9 2001 3.5 0.5 0.0 2.1 2.3 John Day Dam 1998 1.5 0.5 1.2 9.0 2.8 2000 1.6 0.8 2.0 22.0 2.9 2001 1.4 0.5 1.3 6.6 3.2 McNary Dam 1998 1.6 0.5 0.2 1.4 2.5 2000 1.9 1.2 0.0 3.0 2.1 2001 1.7 0.8 0.3 2.7 2.8
* Except in the transition pool, where time values are from the first detection in the transition pool to the
last detection in the transition pool (this format was used in previous reports; e.g., Keefer et al. 2003a).

28
Turn-Arounds Methods To determine how many times a fish reversed direction within the fishways, we divided each fishway into five segments, as in the previous analysis. Because the five segments are sequential within a fishway, we first determined which direction a fish was traveling by marking detections in one segment followed by detections in a separate segment (either upstream or downstream from the first segment). We then counted changes in direction between segments for each fish. For each direction reversal, we assigned turn-arounds to the segment where the terminal detection occurred. For example, if a fish was detected in the collection channel and then detected in the transition pool, we determined that it was swimming upstream. If that fish was then detected in the collection channel again, we assigned a turn-around (from upstream to downstream) to the transition pool segment. In addition, we examined how far back fish retreated after a turn-around by looking at the segment where the fish again started moving upstream following the turn-around event. For example, a fish that turned around in the ladder and retreated back to the tailrace (below the dam but outside of the fishways) was assigned a turn-around in the ladder and an exit to the tailrace. However, turn-arounds were not assigned to the transition pool and collection channel segments through which the fish passed after turning around in the ladder. Turn-arounds are reported for each segment and are summarized based on how far the fish retreated. Only fish that eventually passed the dam were included in the analysis. As with other analyses, if a fish fell back at a dam, only behavior before that fallback event was included. In some instances, fish were not detected in a particular segment, even though they did swim through it (we know this based on detections on either side of the segment). By definition, not being detected in a segment would preclude a determination of reversing direction in that segment. Hence, there was the potential for bias against segments with low detection probability. This was especially true of the north fishway collection channels at The Dalles and McNary Dams, where the extent of the collection channel segment depended on the tailwater level, and the position of the receivers resulted in minimal coverage of this area. However, we ran these analyses twice: once including all fish, regardless of detection in each segment, and a second time including only fish that were detected at least once in each of the five segments. Results were similar for the two analyses, indicating that any bias due to detection probability was small. Therefore, we only reported results for the analysis that included all fish.

29
Results Across all dams and years, 67 to 98% of fish reversed direction at least once while heading upstream and turn-arounds occurred in all fishway segments at each dam examined (Table 7). Subsequent downstream reversals (segments to which fish retreated before turning around and heading back upstream) occurred mostly in areas outside of the dam fishways, though Bonneville Dam and John Day Dam collection channel segments were also common downstream reversal areas for many fish (Table 7). Many fish that reversed direction did so more than once (Figures 11 and 12). Across all dams and years, individual fish reversed direction from 0 to 173 times for a single fishway segment. However, the median number of attempts per fish at each segment was from 1 to 2 attempts. While migrating upstream, fish reversed directions relatively few times at both The Dalles and McNary Dams (Figures 11 and 12); the median number of turns in each of the fishway segments and in each year was less than or equal to 2, and the 90th percentile was less than or equal to 8 turns. Similarly, at Bonneville Dam in 2000 and 2001, fish exhibited relatively few turns. However, in 1998, some fish swam into ladders at Bonneville Dam and reversed direction many times. The 75th percentile in ladders was greater than 5 attempts and the 90th percentile was almost 25 turns (Figure 11). John Day Dam stood out from the other dams in that most fish made large numbers of turns in both the collection channel and the transition pool in all 3 years (Figure 12). The medians were consistently and significantly higher than the other three dams in all years for both of these fishway segments (Wilcoxon rank sum test, P < 0.05). Over 90% of turn-arounds in these segments at John Day Dam occurred in the south fishway, which had median numbers of 7 to 9 attempts per fish for the collection channel and 4 to 5 for the transition pool. Unlike the collection channel and transition pool, the number of turn-arounds per fish in the ladder segment of John Day Dam was comparable to that of the other dams, even in the south fishway.

30
Table 7. Percent of adult radio-tagged subyearling Chinook reversing direction at least once per fishway segment at Bonneville, The Dalles, John Day, and McNary Dams in 1998, 2000, and 2001.
Heading upstream Heading downstream
Base of the
dam Collection channel
Transition pool Ladder Tailrace
Base of the dam
Collection channel
Transition pool
Bonneville Dam 1998 44.1 56.8 67.1 46.1 61.9 69.6 37.6 33.0 2000 17.3 42.3 73.4 20.0 38.5 58.6 56.6 5.2 2001 10.6 48.8 56.8 22.6 31.7 58.3 36.5 12.5 The Dalles Dam 1998 2.9 34.6 58.0 9.6 11.5 61.9 18.2 3.3 2000 3.5 24.4 71.0 7.5 12.6 71.3 19.5 1.1 2001 5.9 34.5 56.2 7.9 14.7 61.9 10.7 0.6 John Day Dam 1998 8.3 91.7 82.0 40.0 46.1 94.8 46.7 30.3 2000 8.8 93.3 91.0 8.6 53.1 97.4 55.7 2.8 2001 6.6 89.3 81.0 15.0 44.1 92.4 45.5 4.1 Mc Nary Dam 1998 2.3 55.8 36.7 59.8 7.9 74.5 11.7 48.4 2000 1.3 67.8 62.9 21.9 13.4 82.5 9.2 12.5 2001 1.9 66.0 62.9 46.3 13.3 83.2 13.3 28.2

31
Bonneville Dam
1998 2000 2001
TR BD CC TP LD TR BD CC TP LD TR BD CC TP LD
Num
ber o
f Tur
ns
0
5
10
24
The Dalles Dam
1998 2000 2001
TR BD CC TP LD TR BD CC TP LD TR BD CC TP LD
Num
ber o
f Tur
ns
0
2
4
6
8
10
Figure 11. Median (bar) number of times fish reversed direction while heading upstream
at Bonneville and The Dalles Dams and re-entered a previous segment. Whiskers represent 10th and 90th percentiles, boxes represent 25th and 75th percentiles. TR = tailrace, BD = base of the dam, CC = collection channel, TP = transition pool, and LD = ladder.

32
John Day Dam
1998 2000 2001
TR BD CC TP LD TR BD CC TP LD TR BD CC TP LD
Num
ber o
f Tur
ns
0
5
10
15
20
25
McNary Dam
1998 2000 2001
TR BD CC TP LD TR BD CC TP LD TR BD CC TP LD
Num
ber o
f Tur
ns
0
2
4
6
8
10
Figure 12. Median (bars) number of times fish reversed direction while heading
upstream at John Day and McNary Dams and re-entered a previous segment. Whiskers represent 10th and 90th percentiles, boxes represent 25th and 75th percentiles. TR = tailrace, BD = base of the dam, CC = collection channel, TP = transition pool, and LD = ladder.

33
Retreat distance analyses provided more specific determinations of fish movement and behavior related to turn-arounds (Figures 13-16). Results are dam-specific and identify the proportion of attempts at each segment that resulted in successful passage through that segment, as well as the segment to which fish retreated following a turn-around. At Bonneville Dam, retreats were well spread among the tailrace, the base of the dam, and the collection channel (Figure 13). In contrast, at The Dalles, John Day, and McNary Dams, fish that turned around consistently retreated to the base of the dam in high proportions (Figures 14-6). However, at all dams, retreat distances varied greatly for each segment and differed among dams, fishways, and years (Figures 13-16). For example, in the collection channel at both Bonneville and McNary Dams, fish had a higher success rate in the Oregon-shore fishways in all 3 years than in the Washington-shore fishways. However, the opposite was true in the ladder segment at these two dams; fish consistently had higher success rates in the Washington-shore fishways than in the Oregon-shore fishways. Success rates through the collection channel and transition pool segments were highly variable, but successes accounted for less than 60% of the total number of attempts in these segments for the majority of the fishways. Across dams, success rates through the ladder segments were higher than for other fishway segments, though similarly variable. At all dams and fishways, fish turning around in the ladder segment often retreated only to the transition pool segment of the fishway.

34
0%
50%
100%
1998 2000 2001
Prop
ortio
nal b
ehav
ior
(1872) (958) (893)
0%
50%
100%
1998 2000 2001
Exit to TR
Exit to CC
Success
(2116) (887)(3153)
0%
50%
100%
1998 2000 2001
Prop
ortio
nal b
ehav
ior
(856) (677)(1692)
0%
50%
100%
1998 2000 2001
Exit to TR
Success
(1810) (2377) (834)
0%
50%
100%
1998 2000 2001
Exit to TR
Exit to CC
Exit to TP
Success
(610) (391)(2075)
0%
50%
100%
1998 2000 2001
Prop
ortio
nal b
ehav
ior
(281) (363)(944)
Washington Shore Fishway Oregon Shore Fishway Collection channel
Transition pool
Ladder Figure 13. Proportion of attempts to pass through the Bonneville Dam collection
channel, transition pool, and ladder that were either successful or resulted in a turn-around. Turn-arounds are divided based on whether fish retreated to the tailrace (exit to TR), the collection channel (exit to CC), or the transition pool (exit to TP). Numbers in parentheses indicate the total number of attempts made by radio-tagged fish.

35
0%
50%
100%
1998 2000 2001
Prop
ortio
nal b
ehav
ior
(71) (66) (76)
0%
50%
100%
1998 2000 2001
Prop
ortio
nal b
ehav
ior
(529) (394)(322)
0%
50%
100%
1998 2000 2001
Exit to TR
Exit to CC
Exit to TP
Success
(668) (667)(612)
0%
50%
100%
1998 2000 2001
Exit to TR
Success
(640) (605) (612)
0%
50%
100%
1998 2000 2001
Prop
ortio
nal b
ehav
ior
(124) (116)(118)
0%
50%
100%
1998 2000 2001
Exit to TR
Exit to CC
Success
(2419) (1608)(1300)
North Fishway East Fishway Collection Channel
Transition pool
Ladder Figure 14. Proportion of attempts to pass through The Dalles Dam collection channel,
transition pool, and ladder that were either successful or resulted in a turn-around in 1998, 2000, and 2001. Turn-arounds are divided based on whether fish retreated: to the tailrace (exit to TR), the collection channel (exit to CC), or the transition pool (exit to TP). Numbers in parentheses indicate the total number of attempts made by radio-tagged fish.

36
0%
50%
100%
1998 2000 2001
Prop
ortio
nal b
ehav
ior
(841) (215)(1520)
0%
50%
100%
1998 2000 2001
Prop
ortio
nal b
ehav
ior
(205) (47)(953)
0%
50%
100%
1998 2000 2001
Exit to TR
Success
(7124) (6360)(4644)
0%
50%
100%
1998 2000 2001
Prop
ortio
nal b
ehav
ior
(709) (341)(545)
0%
50%
100%
1998 2000 2001
Exit to TR
Exit to CC
Success
(3738) (3087)(2121)
0%
50%
100%
1998 2000 2001
Exit to TR
Exit to CC
Exit to TP
Success
(432) (667)(567)
North Fishway South Fishway Collection channel
Transition pool
Ladder
Figure 15. Proportion of attempts to pass through the John Day Dam collection channel,
transition pool, and ladder that were either successful or resulted in a turn-around in 1998, 2000, and 2001. Turn-arounds are divided based on whether fish retreated: to the tailrace (exit to TR), the collection channel (exit to CC), or the transition pool (exit to TP) segment. Numbers in parentheses indicate the total number of attempts made by radio-tagged fish.

37
0%
50%
100%
1998 2000 2001
Prop
ortio
nal b
ehav
ior
(280) (181)(167)
0%
50%
100%
1998 2000 2001
Exit to TR
Exit to CC
Success
(702) (1290)(1195)
0%
50%
100%
1998 2000 2001
Exit to TR
Success
(274) (808)(998)
0%
50%
100%
1998 2000 2001
Prop
ortio
nal b
ehav
ior
(616) (359)(360)
0%
50%
100%
1998 2000 2001
Prop
ortio
nal b
ehav
ior
(352) (198)(294)
0%
50%
100%
1998 2000 2001
Exit to TR
Exit to CC
Exit to TP
Success
(274) (808)(998)
North Fishway South Fishway Collection channel
Transition pool
Ladder Figure 16. Proportion of attempts to pass through the McNary Dam collection channel,
transition pool, and ladder that were either successful or resulted in a turn-around in 1998, 2000, and 2001. Turn-arounds are divided based on whether fish retreated: to the tailrace (exit to TR), the collection channel (exit to CC), or the transition pool (exit to TP) segment. Numbers in parentheses indicate the total number of attempts made by radio-tagged fish.

38
Fallback Fish Methods Fish detection histories were checked individually for fallback events. A record indicating fallback was inserted into the database when a detection in the forebay was followed by a detection in the tailrace, allowing easy summarization of these events. We first counted the number of unique fish that fell back at each dam. Since some fish fell back more than once, we also counted both the number of times each fish fell back and the total number of fallback events at each dam. In 2000 and 2001, some fish were released upstream from Bonneville Dam to evaluate fallback rates based on release location in the forebay. We counted fallbacks for these fish at Bonneville Dam separately, but analyzed all fish together at the other 3 dams. The ladder that fish used to ascend a fishway can influence the probability of falling back over the dam (Reischel and Bjornn 2003). For each fallback event, we determined the ladder from which the fish exited the fishway before falling back. If a fish passed a dam via an unknown route, or if the fish was detected at an upstream dam prior to falling back, the ladder was assigned a null value. A more detailed analysis of fallback events can be found in Boggs et al. (2003; 2004) Results Fallback events occurred for fall Chinook salmon at each of the lower Columbia River dams during these study years. Rates ranged from 2.0 (McNary Dam, 2000) to 10.5% (The Dalles Dam, 1998) for fish released below a dam (Table 8). A relatively small percentage of fish fell back over an individual dam more than once (range = 0.0 to 1.4%). The highest percentage of fish falling back more than once occurred at Bonneville and The Dalles Dams, particularly in 2001 (1.4% at Bonneville Dam, regardless of release location, and 1.3% at The Dalles Dam). Fallback rates at Bonneville Dam were highly dependent on where fish were released. For those fish released downstream from Bonneville Dam, fallback rates at the dam did not exceed 4.8% (Table 8). For fish released upstream from Bonneville Dam, fallback rates were 7.2% (2000) and 14.2% (2001). Many of these fallback events for forebay-released fish occurred in the navigation lock.

39
Table 8. Number of fall Chinook salmon that fell back over the dams and the number of repeat fallbacks. The percentage of fish that fell back of those that passed the dam is in parentheses (for Bonneville Dam, upstream-released fish, percentage value is for all fish released upstream from Bonneville Dam).
1998 2000 2001
Bonneville Dam (downstream-released) Total number of fish 32 (3.5) 26 (3.9) 25 (4.8) Total number of fallback events 37 34 36 Number that fell back once 28 (3.1) 19 (2.9) 18 (3.5) Number that fell back twice 3 (0.3) 6 (0.9) 3 (0.6) Number that fell back three times 1 (0.1) 1 (0.2) 4 (0.8) Number that fell back more than three times 0 (0.0) 0 (0.0) 0 (0.0)
Bonneville Dam (upstream-released) Total number of fish 27 (7.2) 61 (14.2) Total number of fallback events 30 74 Number that fell back once 25 (6.7) 55 (12.8) Number that fell back twice 1 (0.3) 1 (0.2) Number that fell back three times 1 (0.3) 3 (0.7) Number that fell back more than three times 0 (0.0) 2 (0.5)
The Dalles Dam Total number of fish 66 (10.5) 62 (8.4) 50 (7.0) Total number of fallback events 75 70 61 Number that fell back once 60 (9.6) 55 (7.5) 41 (5.8) Number that fell back twice 5 (0.8) 6 (0.8) 7 (1.0) Number that fell back three times 0 (0.0) 1 (0.1) 2 (0.3) Number that fell back more than three times 1 (0.2) 0 (0.0) 0 (0.0)
John Day Dam Total number of fish 19 (3.9) 14 (2.5) 15 (2.6) Total number of fallback events 19 14 16 Number that fell back once 19 (3.9) 14 (2.5) 14 (2.4) Number that fell back twice 0 (0.0) 0 (0.0) 1 (0.2) Number that fell back three times 0 (0.0) 0 (0.0) 0 (0.0) Number that fell back more than three times 0 (0.0) 0 (0.0) 0 (0.0)
McNary Dam Total number of fish 9 (2.1) 9 (2.0) 17 (3.5) Total number of fallback events 9 9 19 Number that fell back once 9 (2.1) 9 (2.0) 15 (3.1) Number that fell back twice 0 (0.0) 0 (0.0) 2 (0.4) Number that fell back three times 0 (0.0) 0 (0.0) 0 (0.0) Number that fell back more than three times 0 (0.0) 0 (0.0) 0 (0.0)

40
Excluding fish released just upstream from Bonneville Dam, fallback rates were consistently highest at The Dalles Dam, followed by Bonneville Dam. Variation in fallback rates among years was not consistent across all dams (Table 8). At Bonneville Dam, fallback rates (for fish released below Bonneville Dam) increased slightly (3.5 to 4.8%) from 1998 to 2001. However, the opposite occurred at The Dalles Dam (10.5 to 7.0%). At both John Day and McNary Dams, total numbers of fallbacks were much lower and fallback rates were in the range of 2 to 4% for the 3 years. . For most fallback events at Bonneville and The Dalles Dams, fish either initially passed via an unknown route or were detected upstream from the dam before falling back. In these cases, we did not associate a ladder with the pre-fallback passage. For fish that fell back before swimming upstream, and that passed the dam by a known route, over 70% of the fallback events in the lower Columbia River occurred after passing through an Oregon shore ladder (averaged over all four dams, Table 9). However, fish often initially passed via the Oregon shore ladder at higher frequencies than the Washington shore ladder, particularly at The Dalles and John Day Dams (Table 5). The resulting fallback-to-passage ratio at The Dalles and John Day Dams was therefore higher in the Washington shore ladder than the Oregon shore ladder. However, at Bonneville and McNary Dams, the Oregon shore ladder produced a higher fallback-to-passage ratio than the Washington shore ladder (shown as a percentage in Table 9).

41
Table 9. Ladder usage (numbers of fish) by fall Chinook salmon prior to fallback events; for the Washington shore (WA) and Oregon shore (OR) ladders, also shown as a percentage of fish that passed via that route. Nav = Navigation Lock, Unk = unknown ladder.
Ladder
Washington shore Oregon shore Nav Unk n (%) n (%) n n
Bonneville Dam 1998 7 1.5 12 3.0 5 13 2000 4 1.6 17 4.4 8 35 2001 11 3.6 19 9.2 11 69 The Dalles Dam 1998 3 3.3 7 1.3 0 65 2000 2 1.8 9 1.4 0 59 2001 5 5.0 7 1.1 0 49 John Day Dam 1998 4 2.9 6 1.7 0 9 2000 5 2.8 6 1.6 0 3 2001 0 0 13 2.4 0 3 McNary Dam 1998 2 0.9 6 3.0 0 1 2000 4 1.3 2 1.3 0 3 2001 1 0.7 12 3.6 0 6

42

43
DISCUSSION The behavior of upriver-migrating adult salmonids, even within individual runs, varies depending on the hydroelectric project, the area or route within a fishway, and on river conditions at the time of migration (among and within years). Additionally, each dam fish encounter is unique in structure and variable in how it is operated, making comparisons among dams and among years difficult. However, radiotelemetry data can still be examined for fish behavioral patterns and trends to elucidate the factors affecting salmonid/dam interactions. Passage efficiency allowed us to examine the success of fall Chinook salmon in traversing hydropower obstructions. Of the four lower Columbia River dams, passage efficiency for fall Chinook salmon was consistently highest at McNary Dam, averaging over 96%; passage efficiency for spring/summer Chinook salmon in 1996 was also higher at McNary than at the other lower Columbia River dams (Bjornn et al. 2000), but not so for steelhead (Keefer et al. 2002). Bonneville Dam also showed consistently high passage efficiency for fall Chinook salmon across years, averaging just under 94%. Given the relatively small variance among years, environmental variability apparently affected passage efficiency to only a small degree. However, at most dams, passage efficiency was lowest in 2001, when river flow was lowest and water temperature highest. When only considering those fish that actually entered a fishway, interannual variability dropped even further at Bonneville, The Dalles, and McNary Dams and passage efficiency increased to over 95%. Therefore, the interannual variability in passage efficiency potentially arises from the differential ability of fish to enter the fishways among years. If so, whatever influence external factors have on passage efficiency (including environmental variation and dam operations), these factors likely affect fish while they are in the tailrace; once in the fishway, fish consistently pass at a specific rate determined by each dam. Other potential sources of interannual variability in passage efficiency (when all fish are included) are variable harvest efforts below dams and fish detected approaching a dam that do not enter the fishway (e.g., those destined for tributaries downstream). Fish did not exhibit the same behaviors at John Day Dam as at the other lower Columbia River dams. Interannual variability in passage efficiency was similar when using all fish or just those that entered the fishway. This trend would result if factors affecting fish passage efficiency primarily acted on the fish while they were in the fishway proper.

44
An example of potential in-fishway passage problems is turn-arounds per fish; these were highest at John Day Dam, even for fish that eventually passed the dam, and are an indication of deterrents to fish passage within the structure. For comparison, steelhead have also exhibited much higher exit rates at John Day Dam than at other Columbia River dams, and these rates were often correlated with water temperature in the ladders (Keefer et al. 2003b). However, factors other than temperature may have also affected passage efficiency and further research is needed to determine the source of variability in passage efficiency documented at John Day Dam. Passage efficiencies after fish fell back over a dam (post-fallback reascension rates) were lower than have been reported for spring/summer Chinook and steelhead (Boggs et al. 2004). However, as with initial passage efficiency, rates rose considerably when only fish that entered a fishway were included in the analysis. Low passage efficiency for fallback fish is likely due, at least in part, to those fish that “overshot” their natal tributary and intentionally moved back downstream (see Boggs et al. 2003). This would also explain the high passage efficiency for fish that entered the fishway after falling back (i.e., the subset of fallback fish that attempted to reascend). However, at John Day Dam, in both 1998 and 2000, passage efficiency was very low even for fish that re-entered the fishway. Many of these fish were last detected in the Deschutes, White Salmon, or Klickitat Rivers, though some fates were not clear, and sample sizes were too low to detect general trends in behavior. Given that the four lower Columbia River Dams are different in size, structure, and operation, one would not expect fish to pass each of the dams in the same amount of time. Indeed, the range of yearly median passage times rarely overlapped across dams (Table 3). Fish consistently passed McNary Dam (from first arrival in the area to dam passage) much faster, on median, than the other dams, perhaps due to either past experience (learning), higher motivation (being closer to spawning grounds than the other dams), or a smaller, less complex fishway. Although steelhead were also observed (in 1996) as having the shortest median passage time at McNary Dam (Keefer et al. 2002), this was not true for spring/summer Chinook, which passed both Bonneville and The Dalles Dams faster, on median, than McNary Dam in 1996 (Bjornn et al. 2000). Obstructions in the fishway or general fishway design at John Day Dam may be the cause of the higher median passage times observed there. The time from arrival in the area to first approach was much shorter than from first approach to dam passage (more so than at the other dams). Therefore, the difference in passage time between John Day and the other lower Columbia River Dams occurs following the first approach to a fishway entrance. Warmer water temperatures in the Oregon shore ladder, and the temperature differential between the forebay and the ladder at John Day Dam, may have

45
contributed to poorer performance there (Keefer et al. 2003b), but no conclusive determinations have been made. For comparison, both steelhead and spring/summer Chinook salmon also had the longest median passage time at John Day Dam (Keefer et al. 2002; Bjornn et al. 2000). Although fall Chinook salmon tended to pass all dams more slowly in 2000 than in other years, interannual variability in passage duration was low at all dams except John Day Dam, where fish took almost 10 h longer, on median, to pass in 2000 than in 1998 and 2001. While the majority of fall Chinook salmon passed each of the four dams in less than 24 h, at John Day Dam in 2000 only 37.5% passed within this time. However, passage rate (fish passing per unit time) tended to drop after 24 h at all dams and in all years, with some fish taking 2 or 3 weeks to pass. Causes for these extended delays are unknown. The hydropower system combined with changing environmental factors may have a variable effect on fish behavior, only slightly affecting some fish while causing long delays for others. Further research and scrutiny of fish with extended passage times may provide valuable information concerning the way fish respond to hydropower operations, fishway design, and abiotic environmental conditions. Passage durations following fallback events were often substantially longer than on first attempts. There are several possible explanations, including the stress (e.g., increased energy expenditure) of additional passage that may slow fish down. It is also possible that fish that are uncertain of their destination may be both swimming slower and falling back more than other fish, resulting in a spurious correlation between passage times and fallback rates. To date, these possibilities have not been adequately assessed. However, routes of passage of post-fallback attempts are not always the same as first passages, indicating some change in behavior with experience. Fall Chinook salmon approached Bonneville Dam in high numbers at all entrances in all years of study. As seen with spring/summer Chinook salmon (Bjornn et al. 1996), closure of orifice gate entrances did not seem to alter results. However, fish tended to enter fishways at much higher proportions at the main entrances of the powerhouses, and to a lesser extent, the spillway, regardless of the status of the orifice gates at Bonneville Dam. Powerhouse entrances are closer to the shores along which fish migrate (Dawm and Osborne 1998; Hinch et al. 2002) as opposed to spillway entrances, which are located near the middle of the river and may impact entrance usage at Bonneville Dam. Higher proportional use of the Oregon shore fishways in 1998 and 2001 may relate to the set of fish tagged in those years being destined for right-hand exiting

46
tributaries (Keefer et al. In review), or to river flow conditions that differed in 2000 when proportional use switched to the Washington shore. When fish exited the fishways back into the tailrace, there did not seem to be any selective pressure for or against a particular entrance; the majority of exits occurred in the same place fish had entered. The other dam for which we had receivers at orifice gates, McNary Dam, also did not have as many fish approaching the orifice gates as the primary entrances. Fish tended to first approach, first enter, and first exit in high proportions through the main entrances, with little activity at the orifice gates. The same pattern was true of overall usage. The high proportion of fish entrances and exits at the main fishway entrances is likely due to the larger diameter of the entrances and the larger volume of water passing through these areas. At both Bonneville and McNary Dams, the use of main entrances as the primary entrance does not appear to be run-specific, as spring/summer Chinook salmon showed similar usage patterns (Keefer et al. 2003a). Orifice gates were not monitored at The Dalles and John Day Dams during these 3 years. At The Dalles Dam, most fish were detected making their first approach and first entry at the base of the powerhouse at the East Ladder entrances (as opposed to the powerhouse orifice gates; not having these gates monitored obviously underestimates the first entrances at these locations). Very few fish exited the west powerhouse entrances. Instead, many fish exited the fishway from an entrance at the south end of the spillway. In addition to using shore-oriented entrances, fish appear to use flow as a cue for route selection for both entrances and exits.
Similar to what was observed at The Dalles Dam, the majority of fish first approached and first entered the John Day Dam fishways via the entrances adjacent to the south ladder. Although a slight majority of first exits were also out of the south ladder, there were more first exits out of than first entrances into the spillway entrance. The large number of unknown entrances at John Day Dam, partly explained by the placement and operation of receivers in the area, make the determination of entrance use particularly difficult. Throughout the system the total number of approaches was high. However, the data received when a fish swims along the base of a dam (past a receiver) is almost identical to the data received when a fish swims directly towards an entrance with the intention of passing a dam. For this reason, total approach data should be used with caution. However, total entrance and exit data are less ambiguous. In all years and at all dams, the proportional use of the various entrances did not change much between first entrances or exits and all entrances or exits. Whatever factors affect a fish’s route for these activities acts on the fish throughout its time at the dam, not just during the initial

47
passage attempt. Again, this trend can be seen in other runs of Chinook salmon (Keefer et al. 2003a). Although the distribution of entranceway use did not seem to change, fish behavior changed with experience. We compared the counts of entranceway use both before a fallback event and afterwards (Appendix C). Fish tended to approach, enter, and exit the fishways fewer times on their second ascension at all locations, a trend also observed with spring/summer Chinook salmon (Keefer et al. 2003a). Inter-dam differences in fallback rates were higher than interannual differences. Every year, the highest fallback rates for downstream-released fish (7.0-10.5%) were at The Dalles Dam. At John Day and McNary Dams, fallback rates were less than 4% in all 3 years. No consistent trend (among years) was noted in fallback rates across all dams; fallback rates increased through time at Bonneville Dam, decreased through time at The Dalles Dam, and varied little between years at John Day and McNary Dams. The particular fishway used to pass a dam can influence fallback rates. The proportion of passage events that resulted in a fallback was much higher in the Oregon shore ladder than in the Washington shore ladder at both Bonneville and McNary Dams (the opposite was true for The Dalles and John Day Dams, though the difference between ladders was smaller). The highest fallback rates seen in all 3 years were in 2001 at Bonneville Dam for fish released above the dam, though these fish were released specifically to test whether certain ladder exit locations are more likely to produce fallbacks. Results indicated that migration routes along Bradford Island after exiting that fishway put fish in the forebay of the spillway, leading to higher fallback rates (Reischel and Bjornn 2003). Fall Chinook salmon at McNary Dam have a high overshoot percentage for fallbacks in general (Boggs et al. 2003), and more fish may use the Oregon shore ladder that are bound for spawning areas in the Snake River and its tributaries (Keefer et al. In review). For further information concerning fallback rates for Columbia Basin salmonids, see Boggs et al. (2003). Due to the different placement of receivers relative to each of the dams, it is difficult to compare time in each segment of the fishway across dams. It was originally thought that we would experience a similar situation within a dam (i.e., due to different placement of receivers across years, we would not be able to make comparisons across years). In 1998, Bonneville and McNary Dams both had many more receivers at the base of the powerhouses than they had in subsequent years. We ran analyses for these two dams in 1998 using all available data, and then again using only those receivers that were present in all years. At least for the analysis of duration in various fishway segments, there were no significant differences between the two data sets, indicating that the
48
presence of the powerhouse receivers did not provide much additional passage duration information. However, this may not be true for other analyses. Fish consistently spent more time below the dam structure (in the tailrace or at the base of the dam) than within the fishway proper at all dams. This was particularly true in 2000, which generally had the slowest passage times; the additional time to pass was spent primarily in areas below the dam structures (also see Brown et al. 2002). While this was also the case at John Day Dam, where the time from first approach to passage was particularly long, time in the collection channel was substantially longer at this dam relative to the others examined. Generally, time spent at the base of the dam may be increased by diel behaviors; some fish back out of the fishway in the evening and spend the night in relative inactivity below the dam (see also Naughton et al. 2005 for similar behavior in sockeye salmon). In all 3 years, fish spent more time in the tailrace of Bonneville Dam than they spent in any of the other four segments of the fishway defined in this report (Figure 7). At the other three dams, fish spent more time at the base of the dam, as defined above, than in any other segment (Figures 8-10). Whether this difference between dams is due to the behavior of fish as they approach their first dam (even though they have been to Bonneville Dam once before, when tagged) or if this is simply a result of the differential placement and detection probability of the receivers among dams is not readily discernable. While in the fishway, fish spent more time in the ladder than in the collection channel and the transition pool. It is important to keep in mind, however, that these values are the total time spent inside each segment, not the elapsed time from the first record in a segment to the last record in a segment as has been the case in most prior reports from this research project (for comparisons between results for the two methods, see Table 6). Segment times also incorporate delays resulting from fish turn-around behaviors within a segment for which a fish does not exit that segment (within segment behavior). The turn-around analysis elucidated discrepancies between methods in previous reports (e.g., Keefer et al. 2003a) and methods in this report for determining the time fish spent in the various fishway segments (Table 8). Although turn-arounds occur in the transition pool, and a long time can pass from when a fish first enters the segment and when it leaves the transition pool for the last time, fish often leave that segment and spend the majority of their time in the tailrace or at the base of the dam before reentering the fishway and passing through the transition pool. Even though fish do not spend much time in the collection channel and transition pool, it is clear that passage attempts in these

49
segments result in more direction reversals than in other segments.
This implies that either the environment in these segments is less conducive to fish passage (e.g., there is a large temperature change between segments, as shown by Peery et al. 2003) or fish have an innate behavior to ‘rethink’ passing sections of the river that appear risky or energetically costly, such as ladders. If fish arrive at the base of a ladder and instinctively pause before passing rough, turbulent, and potentially dangerous areas, then returning to the tailrace or the base of the dam may be a retreat to an environment that is less threatening or confusing than the fishway proper.
This concept also applies to use of areas at the base of the dam, where fish retreat
following turn-arounds in all segments. However, fish tend to turn around at the low end of the pools and less so at the transition between the pool and the overflow section of the lower ladder (Keefer et al. 2003), suggesting that slack water or lack of guiding flow through the submerged orifices may contribute to this behavior in these segments (Naughton et al. In prep). It should be noted, however, that descending the fishway and spending additional time in the tailrace is energetically costly (Brown et al. 2002). Fish may be making a trade-off between energy expenditure and safety or other concerns associated with fishways. It would be of considerable benefit to obtain a better understanding of the effects of abiotic factors (including environmental cues) on salmonid fishway use and behavior (e.g. Moser et al. 2004); we have a forthcoming report describing the relationship of environmental variables on Chinook and steelhead performance.

50
ACKNOWLEDGEMENTS We thank Steve Lee and his crew for tagging the Chinook at Bonneville Dam. Thanks to Ken Tolotti for maintaining and downloading hundreds of receivers throughout Washington, Oregon, and Idaho. Thanks to Mike Jepson and his crew for interpreting the telemetry data, fish by fish. Thanks to Alicia Matter and Sarah McCarthy for database maintenance and quality assurance. We also thank Chris Peery and Michelle Feeley for administrative assistance and project supervision and Matt Keefer, Chris Peery, JoAnne Butzerin, and Doug Dey for reviewing drafts of this report. This project would not have been possible without the economic support of the Corps of Engineers and the technical and administrative help from Mike Langeslay, Marvin Shutters, David Clugston, and Doug Dey.
51
REFERENCES Bjornn, T. C., J. P. Hunt, K. R. Tolotti, P. J. Keniry, and R. R. Ringe. 1994. Migration
of adult Chinook salmon and steelhead past dams and through reservoirs in the lower Snake River and into tributaries - 1992. Technical Report 94-1, Idaho Cooperative Fish and Wildlife Research Unit, University of Idaho, Moscow.
Bjornn, T. C., J. P. Hunt, K. R. Tolotti, P. J. Keniry, and R. R. Ringe. 1995. Migration
of adult Chinook salmon and steelhead past dams and through reservoirs in the lower Snake River and into tributaries - 1993. Technical Report 95-1, Idaho Cooperative Fish and Wildlife Research Unit, University of Idaho, Moscow.
Bjornn, T. C., J. P. Hunt, P. J. Keniry, R. R. Ringe, and C. A. Peery. 1998. Entrances
used and passage through fishways for salmon and steelhead at Snake River dams. Part III of final report for Migration of adult Chinook salmon and steelhead past dams and through reservoirs in the lower Snake River and into tributaries. U.S. Army Corps of Engineers, Walla Walla, Washington.
Bjornn, T. C., M. A. Jepson, C. A. Peery, and K. R. Tolotti. 1996. Evaluation of adult
Chinook salmon passage at Priest Rapids Dam with orifice gates open and closed. Technical Report 96-1, Idaho Cooperative Fish and Wildlife Research Unit, University of Idaho, Moscow.
Bjornn, T. C., M. L. Keefer, C. A. Peery, K. R. Tolotti, R. R. Ringe, and P. J. Keniry.
2000. Migration of adult spring and summer Chinook salmon past Columbia and Snake River dams, through reservoirs and distribution into tributaries, 1996. Report for U.S. Army Corps of Engineers, Walla Walla District, Walla Walla, WA, and Bonneville Power Administration, Portland, OR.
Boggs C. T., M. L. Keefer, C. A. Peery, M. L. Moser. 2003. Adult Chinook Salmon and
Steelhead Fallback at Bonneville Dam, 2000-2001. Technical Report 2003-7, Idaho Cooperative Fish and Wildlife Research Unit, University of Idaho, Moscow.
Boggs C. T., M. L. Keefer, C. A. Peery, T. C. Bjornn, and L. C. Stuehrenberg. 2004.
Fallback, reascension and adjusted fishway escapement estimates for adult Chinook salmon and steelhead at Columbia and Snake River dams. Transactions of the American Fisheries Society, 133:932-949.

52
Brown, R. S., D. R. Giest, and M. G. Mesa. 2002. The use of electromyogram (EMG) telemetry to assess swimming activity and energy use of adult spring Chinook salmon migrating through the tailraces, fishways, and forebays of Bonneville Dam, 2000 and 2001. Technical Report PNNL-14080. Pacific Northwest National Laboratory. Richland, WA.
Dawm, D. W., and B. M. Osborne. 1998. Use of fixed-location, split-beam sonar to
describe temporal and spatial patterns of adult fall chum salmon migration in the Chandalar River, Alaska. North American Journal of Fisheries Management, 18:477-486.
Hinch, S. G., E. M. Standen, M. C. Healey, and A. P. Farrell. 2002. Swimming patterns
and behaviour of upriver-migrating adult pink (Oncorhynchus gorbuscha) and sockeye (O. nerka) salmon as assessed by EMG telemetry in the Fraser River, British Columbia, Canada. Hydrobiologia 483:147-160.
Keefer, M. L., T. C. Bjornn, C. A. Peery, K. R. Tolotti, R. R. Ringe, and P. J. Keniry.
2002. Migration of adult steelhead past Columbia and Snake River dams, through reservoirs and distribution into tributaries, 1996. Technical Report 2002-2, Idaho Cooperative Fish and Wildlife Research Unit, University of Idaho, Moscow.
Keefer, M. L., T. C. Bjornn, C. A. Peery, K. R. Tolotti, and R. R. Ringe. 2003a. Adult
spring and summer Chinook salmon passage through fishways and transition pools at Bonneville, McNary, Ice Harbor, and Lower Granite Dams, 1996. Technical Report 2003-5, Idaho Cooperative Fish and Wildlife Research Unit, University of Idaho, Moscow.
Keefer, M. L., C. C. Caudill, C. A. Peery, and T. C. Bjornn. In review. Route selection
in a large river during the homing migration of Chinook salmon. Animal Behavior.
Keefer, M. L., C. A. Peery, T. C. Bjornn, and M. A. Jepson. 2004. Hydrosystem, Dam,
and Reservoir Passage Rates of Adult Chinook Salmon and Steelhead in the Columbia and Snake Rivers. Transactions of the American Fisheries Society, 133:1413-1439.

53
Keefer, M. L, C. A. Peery, and B. J. Burke. 2003b. Passage of radio-tagged adult salmon and steelhead at John Day Dam with emphasis on fishway temperatures: 1997-1998. Technical Report 2003-1, Idaho Cooperative Fish and Wildlife Research Unit, University of Idaho, Moscow.
Moser, M. L., R. W. Zabel, B. J. Burke, L. C. Stuehrenberg, and T. C. Bjornn. 2004.
Factors affecting adult Pacific lamprey passage rates at hydropower dams; using “time to event” analysis of radiotelemetry data. Pages 1-10 in M. T. Spedicato, G. Marmulla, and G. Lembo, editors. Aquatic telemetry: advances and applications. FAO – COISPA, Rome.
Naughton, G. P., C. A. Peery, T. S. Clabough, M. A. Jepson, C. C. Caudill, and L. C.
Stuehrenberg. In prep. Effects of fishway modifications on passage of adult Chinook salmon and steelhead at Lower Granite Dam, Snake River, USA.
Naughton, G. P., C. C. Caudill, M. L. Keefer, T. C. Bjornn, L. C. Stuehrenberg , and
C. A. Peery. 2005. Late-season mortality during migration of radio-tagged adult sockeye salmon (Oncorhynchus nerka) in the Columbia River. Canadian Journal of Fisheries and Aquatic Sciences 62:30-47.
Peery, C. A., T. C. Bjornn, and L. C. Stuehrenberg. 2003. Water temperatures and
passage of adult salmon and steelhead in the lower Snake River. Technical Report 2003-2, Idaho Cooperative Fish and Wildlife Research Unit, University of Idaho, Moscow.
Reischel, T. S., and T. C. Bjornn. 2003. Influence of fishway placement on fallback of
adult salmon at the Bonneville Dam on the Columbia River. North American Journal of Fisheries Management 23:1215–1224.
Zabel, R. W., B. J. Burke, M. L. Moser, and C. A. Peery. In press. Understanding
migrational delay of adult salmon at dams using “time-to-event” analysis and radiotelemetry data. Bioengineering Symposium, American Fisheries Society, Bethesda, Maryland.

54

55
The Dalles Dam - 2001 setupNote: orifice gates are closed
The Dalles DamEast Ladder
HTD
GTD
A1
A3A4
A5
A1
A2
A3
FTD
A4
A5
308.1 rkm
FP = HTD-3, 4, or 5
Forebay
Located 3.2 km downstream
Located 1.1 km downstream
NAVLOCK
Robins Island
Powerhouse 1
Spillway
Bradford Island
"A" Branch
Bradford I. exit
1BO
2BO
4BO
5BO
6BO
7BO
8BO
9BO
ABO
BBO
QBO
A1A2 A3
A1 A2
A3
A1A2
A3
A4 A5A6
A1A2
A4A3
A1 A2A1
A5
A1A2
A3
A1A3
A4
A1A2A3
A3,2,1WBO
VBOA1
A2A3
Bonneville Dam2001 - SETUP
FlowForebay
UMT Channel
NMFS Facility
weir
Powerhouse 2
Cascades Island
WA ladder exit
CBO
DBO
BJPLBO
MBONBO
OBOPBO
A3A1 A4
A1 A2A6 A7
A5
A5
A1
A1
A1A2
A2A4
A1
A2
A3
A4
A1
A2 A3
A3,2,1
A4
XBO
Powerhouse 1
WA Shore
OR Shore
FP = 8BO- 5
MBO-1,2,5BBO-3, 4CBO-3, 4
A5A4
EBOA1
A2
FBOA1A2
A3A4A5A6
TBO
BHI
Juvenile collectionpipe outfallunderwater antenna
A1
232.3 rkm
232.3 rkm
235.1 rkm
235.1 rkm
1BT A1-A5 A1=Turbine 1 gatewells A,B,C; A2=Turbine 2 gatewells A,B,C, etc.
2BT A1-A5 A1=Turbine 6 gatewells A,B,C; A2=Turbine 7 gatewells A,B,C, etc.
3BT A1-A4 A1=Turbine 11 gatewells A,B,C; A2=Turbine 14 gatewells A,B,C, etc.
4BT A1-A4 A1=Turbine 15 gatewells A,B,C; A2=Turbine 16 gatewells A,B,C, etc.
APPENDIX A: 2001 Dam Antenna Locations Appendix Figure A1. Bonneville Dam antenna setup.

56
The Dalles Dam - 2001 SetupNote: There is not an A6
North Entrance LadderFull pool = 160 ftMinimum pool = 155 ft
5TD
ETD
A1
A2A3
A4
A5
A7
FP = ETD-2
The Dalles Dam - 2001 setupNote: orifice gates are closed
The Dalles DamSouth and West Fish Ladder Entrances
ATD
JTD
A1 A2
A1
A3A4
Appendix Figure A2. The Dalles Dam East Ladder (above) and spillway (below).

57
John Day Dam - 2001 SetupNote: orifice gates are open
John Day DamNorth Fish Ladder
7JD
AJD
A2
A1
A3
*Note: Antennas A4, A5, & A6 are not shown
346.9 rkm
FP = AJD-2
Appendix Figure A3. The Dalles Dam South and West ladder entrances (above) and
John Day Dam North ladder (below).

58
John Day Dam Power house and south shore entrances
BJDLJD
6JD
A1A2
A3A4A5 A4 A1
A3
A1
A3A2
A5
A6
MJD
FJD
GJD
A4
346.9 rkm
FP = MJD-1
John Day Dam Power house and south shore entrances
BJDLJD
6JD
A1A2
A3A4A5 A4 A1
A3
A1
A3A2
A5
A6
MJD
FJD
GJD
A4
346.9 rkm
FP = MJD-1
Spillway
Forebay
Yagi Antenna
Underwater Antenna
Located 2.4 km downstream
Located 2.4 km downstream
Only open OG's and weirs shown
Note:
SFE W2, W1
1,3,4,8,14,21,26,32,37,41,43,44Labeled south to north
McNary Dam - 2001 SetupNote: orifice gates are open
Powerhouse
N ladder exit
S ladder exit
W2W3
WFE
NFE W3W2
1MN
2MN
3MN
NMN
BMN
CMN
DMN
EMN
FMNA1A2A4
A3A4
A1 A2
A3
A4
A5
A4
A5
A1A2
A1A2
A3
A1
A3
A6
BottomNavlock
Juvenilechannel
HMNTopNavlock
LMN
MMNA1
A2
A7
A5
A1
A2
A3
A4
467.3 rkm
467.3 rkm
497.8 rkm
497.8 rkm
FP = CMN-3NMN-1, 2
Appendix Figure A4. John Day Dam South ladder (above) and McNary Dam (below).

59
APPENDIX B: Approaches, Entrances, and Exits (Figures)

60
Bonneville Dam, 1998
-0.15
-0.10
-0.05
0.00
0.05
0.10
0.15
0.20
First EventsAll Events
Prop
ortio
n
-0.3
-0.2
-0.1
0.0
0.1
0.2
0.3
SShP
H1
(4B
O-1
)SG
9 (5
BO
-1)
SG21
(6B
O-1
)SG
34 (6
BO
-4)
SG58
(7B
O-1
)SG
64 (7
BO
-4)
NSh
PH1-
1 (8
BO
-1)
SSpi
llway
(BB
O-1
)U
nkno
wn
B1
fishw
ayN
Spill
way
(CB
O-1
)SS
hPH
2-1
(DB
O-1
)SS
hPH
2-2
(DB
O-5
)O
G1
(EB
O-1
)O
G3
(EB
O-4
)O
G5
(FB
O-1
)O
G7
(FB
O-3
)O
G9
(GB
O-1
)O
G10
(G
BO
-4)
OG
11 (
HB
O-1
)O
G12
(H
BO
-5)
OG
14 (
JBO
-1)
OG
16 (
JBO
-4)
OG
18 (
KB
O-1
)O
G20
(K
BO
-4)
NSh
PH2-
1 (L
BO
-1)
NSh
PH2-
2 (L
BO
-5)
Unk
now
n W
A fi
shw
ay
-0.3
-0.2
-0.1
0.0
0.1
0.2
0.3
Approaches
Entrances
Exits
n = 931
n = 31,587
n = 915
n = 3,786
n = 724
n = 2,942
Appendix Figure B1. Distribution of first and all approaches, entrances, and exits across
fishway entranceways at Bonneville Dam in 1998.

61
Bonneville Dam, 2000
-0.2
-0.1
0.0
0.1
0.2
First EventsAll Events
Prop
ortio
n
-0.4
-0.2
0.0
0.2
0.4
SShP
H1
(4B
O-1
)SG
9 (5
BO
-1)
SG21
(6B
O-1
)SG
34 (6
BO
-4)
SG58
(7B
O-1
)SG
64 (7
BO
-4)
NSh
PH1-
1 (8
BO
-1)
SSpi
llway
(BB
O-1
)U
nkno
wn
B1
fishw
ayN
Spill
way
(CB
O-1
)SS
hPH
2-1
(DB
O-1
)SS
hPH
2-2
(DB
O-5
)O
G1
(EB
O-1
)O
G3
(EB
O-4
)O
G5
(FB
O-1
)O
G7
(FB
O-3
)O
G9
(GB
O-1
)O
G10
(G
BO
-4)
OG
11 (
HB
O-1
)O
G12
(H
BO
-5)
OG
14 (
JBO
-1)
OG
16 (
JBO
-4)
OG
18 (
KB
O-1
)O
G20
(K
BO
-4)
NSh
PH2-
1 (L
BO
-1)
NSh
PH2-
2 (L
BO
-5)
Unk
now
n W
A fi
shw
ay
-0.3
-0.2
-0.1
0.0
0.1
0.2
0.3
Approaches
Entrances
Exits
n = 669
n = 13,531
n = 657
n = 2,240
n = 432
n = 1,611
Appendix Figure B2. Distribution of first and all approaches, entrances, and exits across
fishway entranceways at Bonneville Dam in 2000.

62
Bonneville Dam, 2001
-0.3
-0.2
-0.1
0.0
0.1
0.2
0.3
First EventsAll Events
Prop
ortio
n
-0.6
-0.4
-0.2
0.0
0.2
0.4
0.6
SShP
H1
(4B
O-1
)SG
9 (5
BO
-1)
SG21
(6B
O-1
)SG
34 (6
BO
-4)
SG58
(7B
O-1
)SG
64 (7
BO
-4)
NSh
PH1-
1 (8
BO
-1)
SSpi
llway
(BB
O-1
)U
nkno
wn
B1
fishw
ayN
Spill
way
(CB
O-1
)SS
hPH
2-1
(DB
O-1
)SS
hPH
2-2
(DB
O-5
)O
G1
(EB
O-1
)O
G3
(EB
O-4
)O
G5
(FB
O-1
)O
G7
(FB
O-3
)O
G9
(GB
O-1
)O
G10
(G
BO
-4)
OG
11 (
HB
O-1
)O
G12
(H
BO
-5)
OG
14 (
JBO
-1)
OG
16 (
JBO
-4)
OG
18 (
KB
O-1
)O
G20
(K
BO
-4)
NSh
PH2-
1 (L
BO
-1)
NSh
PH2-
2 (L
BO
-5)
Unk
now
n W
A fi
shw
ay
-0.4
-0.3
-0.2
-0.1
0.0
0.1
0.2
0.3
0.4
Approaches
Entrances
Exits
n = 527
n = 8,209
n = 522
n = 1,564
n = 336
n = 1,056
Appendix Figure B3. Distribution of first and all approaches, entrances, and exits across
fishway entranceways at Bonneville Dam in 2001.

63
The Dalles Dam, 1998
-0.6
-0.4
-0.2
0.0
0.2
0.4
0.6
First EventsAll Events
Prop
ortio
n
-0.6
-0.4
-0.2
0.0
0.2
0.4
0.6
EL (C
TD-1
/HTD
-1)
WPH
(BTD
-1/J
TD-1
)
SSpi
llway
(ATD
-1)
Unk
now
n E
Fish
way
NL
(ETD
-1)
Unk
now
n N
Fish
way
-0.6
-0.4
-0.2
0.0
0.2
0.4
0.6
Approaches
Entrances
Exits
n = 666
n = 3,714
n = 656
n = 1,836
n = 436
n = 1,210
Appendix Figure B4. Distribution of first and all approaches, entrances, and exits across
fishway entranceways at The Dalles Dam in 1998.

64
The Dalles Dam, 2000
-0.8
-0.6
-0.4
-0.2
0.0
0.2
0.4
0.6
0.8
First EventsAll Events
Prop
ortio
n
-0.8
-0.6
-0.4
-0.2
0.0
0.2
0.4
0.6
0.8
EL (C
TD-1
/HTD
-1)
WPH
(BTD
-1/J
TD-1
)
SSpi
llway
(ATD
-1)
Unk
now
n E
Fish
way
NL
(ETD
-1)
Unk
now
n N
Fish
way
-0.8
-0.6
-0.4
-0.2
0.0
0.2
0.4
0.6
0.8
Approaches
Entrances
Exits
n = 782
n = 5,576
n = 774
n = 3,129
n = 568
n = 2,392
Appendix Figure B5. Distribution of first and all approaches, entrances, and exits across
fishway entranceways at The Dalles Dam in 2000.
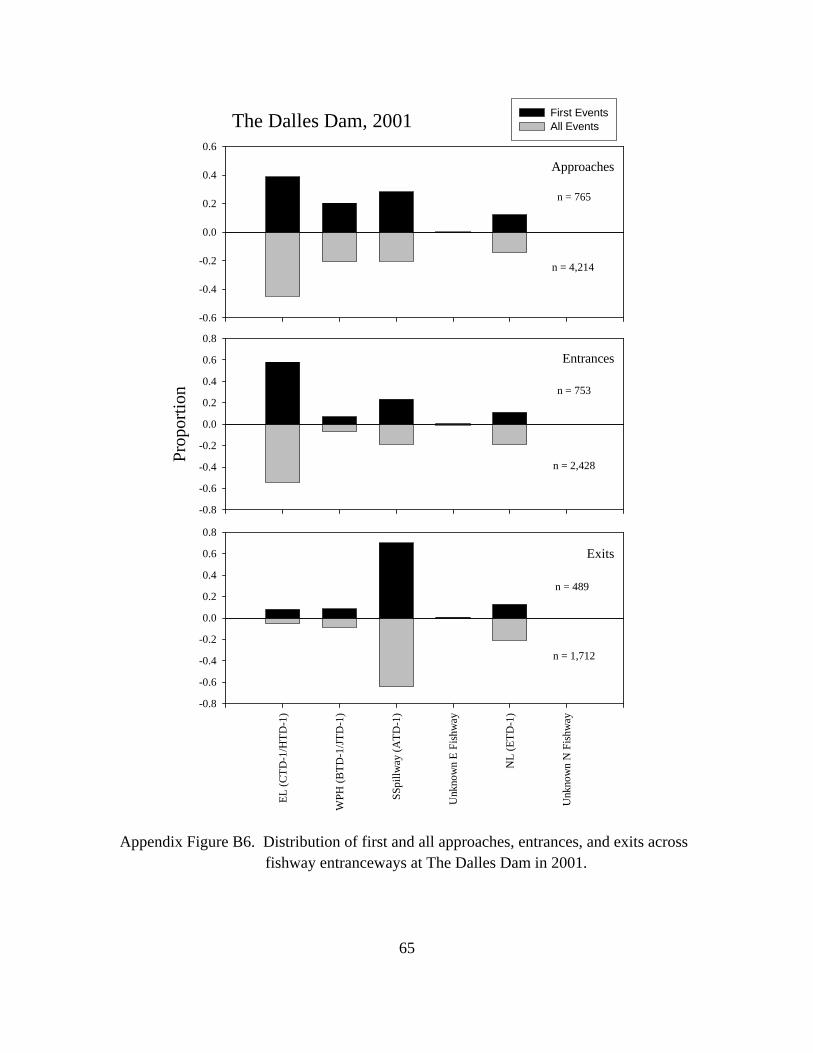
65
The Dalles Dam, 2001
-0.6
-0.4
-0.2
0.0
0.2
0.4
0.6
First EventsAll Events
Prop
ortio
n
-0.8
-0.6
-0.4
-0.2
0.0
0.2
0.4
0.6
0.8
EL (C
TD-1
/HTD
-1)
WPH
(BTD
-1/J
TD-1
)
SSpi
llway
(ATD
-1)
Unk
now
n E
Fish
way
NL
(ETD
-1)
Unk
now
n N
Fish
way
-0.8
-0.6
-0.4
-0.2
0.0
0.2
0.4
0.6
0.8
Approaches
Entrances
Exits
n = 765
n = 4,214
n = 753
n = 2,428
n = 489
n = 1,712
Appendix Figure B6. Distribution of first and all approaches, entrances, and exits across
fishway entranceways at The Dalles Dam in 2001.

66
John Day Dam, 1998
-0.8
-0.6
-0.4
-0.2
0.0
0.2
0.4
0.6
0.8
First EventsAll Events
Prop
ortio
n
-0.6
-0.4
-0.2
0.0
0.2
0.4
0.6
SL (C
JD-1
/LJD
-1)
Sspi
llway
-1 (B
JD-1
)
Sspi
llway
-2 (B
JD-2
)
Unk
now
n S
Fish
way
NL
(AJD
-1)
Unk
now
n N
Fish
way
-0.6
-0.4
-0.2
0.0
0.2
0.4
0.6
Approaches
Entrances
Exits
n = 545
n = 11,798
n = 540
n = 6,162
n = 522
n = 4,700
Appendix Figure B7. Distribution of first and all approaches, entrances, and exits across
fishway entranceways at John Day Dam in 1998.

67
John Day Dam, 2000
-0.8
-0.6
-0.4
-0.2
0.0
0.2
0.4
0.6
0.8
First EventsAll Events
Prop
ortio
n
-0.8
-0.6
-0.4
-0.2
0.0
0.2
0.4
0.6
0.8
SL (C
JD-1
/LJD
-1)
Sspi
llway
-1 (B
JD-1
)
Sspi
llway
-2 (B
JD-2
)
Unk
now
n S
Fish
way
NL
(AJD
-1)
Unk
now
n N
Fish
way
-0.6
-0.4
-0.2
0.0
0.2
0.4
0.6
Approaches
Entrances
Exits
n = 630
n = 19,983
n = 628
n = 10,276
n = 613
n = 9,364
Appendix Figure B8. Distribution of first and all approaches, entrances, and exits across
fishway entranceways at John Day Dam in 2000.

68
John Day Dam, 2001
-0.6
-0.4
-0.2
0.0
0.2
0.4
0.6
0.8
First EventsAll Events
Prop
ortio
n
-0.6
-0.4
-0.2
0.0
0.2
0.4
0.6
SL (C
JD-1
/LJD
-1)
Sspi
llway
-1 (B
JD-1
)
Sspi
llway
-2 (B
JD-2
)
Unk
now
n S
Fish
way
NL
(AJD
-1)
Unk
now
n N
Fish
way
-0.6
-0.4
-0.2
0.0
0.2
0.4
0.6
Approaches
Entrances
Exits
n = 607
n = 12,077
n = 605
n = 6,833
n = 568
n = 6,257
Appendix Figure B9. Distribution of first and all approaches, entrances, and exits across
fishway entranceways at John Day Dam in 2001.

69
McNary Dam, 1998
-0.3
-0.2
-0.1
0.0
0.1
0.2
0.3
First EventsAll Events
Prop
ortio
n
-0.4
-0.3
-0.2
-0.1
0.0
0.1
0.2
0.3
0.4
SSh
(3M
N-1
)
OG
1 (5
MN
-1)
OG
3 (5
MN
-4)
OG
4 (6
MN
-1)
OG
8 (6
MN
-4)
OG
14 (7
MN
-1)
OG
21 (7
MN
-4)
OG
26 (8
MN
-1)
OG
32 (8
MN
-4)
OG
37 (9
MN
-1)
OG
41 (9
MN
-4)
OG
43 (A
MN
-1)
OG
44 (A
MN
-3)
NPH
(BM
N-1
)
Unk
now
n S
Fish
way
NSh
(CM
N-1
)
Unk
now
n N
Fish
way
-0.6
-0.4
-0.2
0.0
0.2
0.4
0.6
Approaches
Entrances
Exits
n = 431
n = 9,817
n = 429
n = 1,441
n = 329
n = 1,018
Appendix Figure B10. Distribution of first and all approaches, entrances, and exits
across fishway entranceways at McNary Dam in 1998.

70
McNary Dam, 2000
-0.6
-0.4
-0.2
0.0
0.2
0.4
0.6
First EventsAll Events
Prop
ortio
n
-0.6
-0.4
-0.2
0.0
0.2
0.4
0.6
SSh
(3M
N-1
)
OG
1 (5
MN
-1)
OG
3 (5
MN
-4)
OG
4 (6
MN
-1)
OG
8 (6
MN
-4)
OG
14 (7
MN
-1)
OG
21 (7
MN
-4)
OG
26 (8
MN
-1)
OG
32 (8
MN
-4)
OG
37 (9
MN
-1)
OG
41 (9
MN
-4)
OG
43 (A
MN
-1)
OG
44 (A
MN
-3)
NPH
(BM
N-1
)
Unk
now
n S
Fish
way
NSh
(CM
N-1
)
Unk
now
n N
Fish
way
-0.6
-0.4
-0.2
0.0
0.2
0.4
0.6
Approaches
Entrances
Exits
Not Monitored
Not Monitored
n = 468
n = 4,728
n = 467
n = 1,947
n = 397
n = 1,499
Appendix Figure B11. Distribution of first and all approaches, entrances, and exits
across fishway entranceways at McNary Dam in 2000.

71
McNary Dam, 2001
-0.6
-0.4
-0.2
0.0
0.2
0.4
0.6
First EventsAll Events
Prop
ortio
n
-0.6
-0.4
-0.2
0.0
0.2
0.4
0.6
SSh
(3M
N-1
)
OG
1 (5
MN
-1)
OG
3 (5
MN
-4)
OG
4 (6
MN
-1)
OG
8 (6
MN
-4)
OG
14 (7
MN
-1)
OG
21 (7
MN
-4)
OG
26 (8
MN
-1)
OG
32 (8
MN
-4)
OG
37 (9
MN
-1)
OG
41 (9
MN
-4)
OG
43 (A
MN
-1)
OG
44 (A
MN
-3)
NPH
(BM
N-1
)
Unk
now
n S
Fish
way
NSh
(CM
N-1
)
Unk
now
n N
Fish
way
-0.6
-0.4
-0.2
0.0
0.2
0.4
0.6
Approaches
Entrances
Exits
Not Monitored
Not Monitored
n = 495
n = 4,362
n = 494
n = 2,169
n = 417
n = 1,690
Appendix Figure B12. Distribution of first and all approaches, entrances, and exits
across fishway entranceways at McNary Dam in 2001.

72

73
APPENDIX C: Approaches, Entrances, and Exits (Tables) Appendix Table C1. Number of approaches, entrances, and exits for each fishway
entrance. Both the number of first approaches, entrances, or exits and the total number of approaches (App), entrances, (Ent) or exits (in parentheses) are shown.
1998 2000 2001 Entrance App. Ent. Exit App. Ent. Exit App. Ent. Exit
BONNEVILLE DAM
SShPH1 (4BO-1) 88 159 99 85 198 68 46 66 8 (1053) (435) (342) (1576) (485) (254) (527) (123) (21) SG9 (5BO-1) 4 7 0 3 4 0 0 0 0 (147) (22) (0) (198) (7) (0) (52) (2) (0) SG21 (6BO-1) 89 12 4 77 4 0 8 0 0 (1488) (47) (6) (1606) (19) (1) (465) (2) (0) SG34 (6BO-4) 62 3 0 52 0 0 11 0 0 (1346) (23) (1) (1187) (12) (2) (300) (4) (3) SG58 (7BO-1) 3 6 2 13 3 0 0 0 0 (442) (22) (2) (663) (9) (2) (161) (1) (0) SG64 (7BO-4) 36 12 7 37 13 13 8 0 4 (1266) (40) (16) (1488) (38) (33) (465) (1) (9) NShPH1-1 (8BO-1) 83 95 53 58 49 44 17 6 18 (1219) (256) (135) (1292) (151) (107) (392) (18) (33) SSpillway (BBO-1) 16 34 34 60 87 55 69 92 34 (359) (241) (184) (382) (235) (156) (296) (196) (76) Unknown B1 fishway 6 41 51 1 16 29 0 2 2 (76) (110) (134) (22) (48) (72) (0) (2) (2) NSpillway (CBO-1) 28 42 34 23 31 20 22 27 10 (321) (183) (153) (196) (99) (69) (140) (81) (30) SShPH2-1 (DBO-1) 91 104 185 43 29 73 43 22 104 (2391) (410) (768) (1116) (119) (301) (1173) (87) (366) SShPH2-2 (DBO-5) 41 239 43 98 118 23 115 184 51 (3984) (1017) (198) (1758) (541) (122) (1879) (644) (153) OG1 (EBO-1) 3 6 3 (1890) (73) (20) OG3 (EBO-4) 3 4 3 (1485) (43) (19) OG5 (FBO-1) 0 1 0 (146) (4) (1) OG7 (FBO-3) 3 1 0 (539) (9) (2) OG9 (GBO-1) 50 1 2 (2783) (22) (4) OG10 (GBO-4) 8 3 0 (712) (12) (0) OG11 (HBO-1) 15 2 0 (1087) (15) (2) OG12 (HBO-5) 1 1 0 (265) (11) (4)

74
Appendix Table C1. Continued. 1998 2000 2001 Entrance App. Ent. Exit App. Ent. Exit App. Ent. Exit
BONNEVILLE DAM (continued)
OG14 (JBO-1) 11 1 1 (1384) (9) (1) OG16 (JBO-4) 15 0 2 (1416) (17) (6) OG18 (KBO-1) 3 5 2 (568) (41) (9) OG20 (KBO-4) 1 9 8 (671) (72) (37) NShPH2-1 (LBO-1) 164 51 67 87 43 57 125 39 76 (1736) (270) (373) (979) (159) (261) (1035) (131) (225) NShPH2-2 (LBO-5) 106 56 90 30 21 16 55 18 14 (2737) (256) (354) (970) (140) (93) (1279) (84) (67) Unknown WA 1 20 34 2 41 34 8 66 15 fishway (76) (126) (171) (98) (178) (138) (45) (188) (71)
THE DALLES DAM
EL (CTD-1/HTD-1) 241 323 29 447 551 52 297 437 39 (1658) (834) (79) (3316) (2095) (185) (1886) (1319) (94) WPH (BTD-1/JTD-1) 152 88 70 126 29 45 156 53 42 (905) (220) (175) (955) (134) (178) (868) (168) (152) SSpillway (ATD-1) 208 142 233 134 97 401 217 176 343 (628) (313) (573) (659) (323) (1560) (853) (458) (1098) Unknown E Fishway 4 13 37 0 0 2 1 4 3 (107) (108) (109) (0) (1) (4) (5) (23) (9) NL (ETD-1) 61 90 65 75 97 68 94 83 62 (416) (361) (269) (646) (576) (465) (602) (460) (359) Unknown N Fishway 0 0 2 0 0 0 0 0 0 (0) (0) (5) (0) (0) (0) (0) (0) (0)
JOHN DAY DAM
SL (CJD-1/LJD-1) 312 223 195 438 365 247 419 322 240 (4284) (2083) (1064) (8920) (4892) (3372) (5033) (3025) (2505) Sspillway-1 (BJD-1) 97 54 145 115 72 194 109 74 176 (1788) (382) (1241) (3920) (730) (2690) (2634) (536) (1789) Sspillway-2 (BJD-2) 28 20 94 24 2 61 25 14 67 (1631) (132) (911) (3137) (36) (809) (2164) (83) (812) Unknown S Fishway 66 202 50 30 145 70 33 176 65 (2332) (2350) (403) (1378) (2784) (851) (1350) (2651) (636) NL (AJD-1) 42 41 38 23 44 40 21 19 19 (1762) (1214) (1064) (2628) (1834) (1638) (896) (538) (509) Unknown N Fishway 0 0 0 0 0 1 0 0 1 (1) (1) (17) (0) (0) (4) (0) (0) (6)

75
Appendix Table C1. Continued. 1998 2000 2001 Entrance App. Ent. Exit App. Ent. Exit App. Ent. Exit
MCNARY DAM
SSh (3MN-1) 115 101 119 208 98 116 212 196 220 (1229) (337) (407) (1731) (411) (436) (1772) (717) (815) OG1 (5MN-1) 10 8 0 (582) (28) (0) OG3 (5MN-4) 6 3 0 (425) (10) (0) OG4 (6MN-1) 9 4 1 (614) (24) (1) OG8 (6MN-4) 1 4 0 (119) (12) (0) OG14 (7MN-1) 26 10 0 (875) (31) (1) OG21 (7MN-4) 16 0 0 (590) (10) (0) OG26 (8MN-1) 19 40 4 (629) (123) (16) OG32 (8MN-4) 6 4 0 (466) (19) (0) OG37 (9MN-1) 13 7 0 (614) (32) (0) OG41 (9MN-4) 16 18 2 (818) (43) (2) OG43 (AMN-1) 17 11 0 (761) (40) (0) OG44 (AMN-3) 7 4 1 (539) (18) (2) NPH (BMN-1) 86 67 108 183 108 153 204 97 108 (860) (212) (324) (1738) (361) (558) (1539) (361) (442) Unknown S Fishway 5 17 15 9 92 8 21 119 29 (43) (45) (35) (202) (406) (33) (360) (611) (101) NSh (CMN-1) 79 131 79 68 169 120 58 82 60 (653) (457) (230) (1057) (769) (471) (691) (480) (332) Unknown N Fishway 0 0 0 0 0 0 0 0 0 (0) (0) (0) (0) (0) (1) (0) (0) (0)

76
Appendix Table C2. Number of approaches, entrances, and exits from each fishway entrance before and after fallback events. Both categories contain only data from fish that did, at some time, fall back at this dam. Both the number of first approaches, entrances, or exits and the total number of approaches, entrances, or exits (in parentheses) are shown.
1998 2000 2001 Entrance before after before after before after
Bonneville Dam – Approaches
SShPH1 (4BO-1) 5 4 4 7 3 5 (32) (12) (46) (27) (63) (17) SG9 (5BO-1) 1 0 1 0 0 0 (4) (2) (14) (5) (5) (1) SG21 (6BO-1) 7 0 2 1 1 0 (34) (10) (45) (27) (49) (17) SG34 (6BO-4) 3 1 3 1 1 0 (21) (8) (35) (23) (28) (8) SG58 (7BO-1) 0 0 1 0 0 1 (4) (1) (16) (10) (14) (6) SG64 (7BO-4) 2 1 0 1 1 0 (21) (4) (40) (26) (60) (7) NShPH1-1 (8BO-1) 1 0 2 4 5 1 (18) (2) (37) (22) (56) (5) SSpillway (BBO-1) 0 1 3 2 2 2 (10) (1) (7) (8) (14) (14) Unknown B1 fishway 0 0 1 0 0 0 (1) (1) (3) (1) (0) (0) NSpillway (CBO-1) 0 0 0 0 0 1 (5) (0) (4) (9) (5) (10) SShPH2-1 (DBO-1) 3 2 2 1 1 3 (37) (10) (6) (15) (29) (25) SShPH2-2 (DBO-5) 0 1 0 1 2 2 (42) (10) (5) (17) (52) (28) OG1 (EBO-1) 0 1 (27) (5) OG3 (EBO-4) 0 0 (20) (3) OG5 (FBO-1) 0 0 (2) (0) OG7 (FBO-3) 0 0 (10) (1) OG9 (GBO-1) 0 0 (31) (7) OG10 (GBO-4) 0 0 (10) (7)

77
Appendix Table C2. Continued. 1998 2000 2001 Entrance before after before after before after
Bonneville Dam – Approaches (continued)
OG11 (HBO-1) 0 0 (19) (6) OG12 (HBO-5) 0 0 (4) (0) OG14 (JBO-1) 0 0 (20) (10) OG16 (JBO-4) 1 0 (17) (8) OG18 (KBO-1) 0 0 (12) (5) OG20 (KBO-4) 0 0 (7) (8) NShPH2-1 (LBO-1) 4 3 1 2 6 5 (20) (10) (4) (9) (30) (27) NShPH2-2 (LBO-5) 4 1 0 1 1 1 (32) (13) (1) (13) (31) (32) Unknown WA fishway 0 0 0 0 0 0 (1) (0) (1) (0) (1) (0)
Bonneville Dam – Entrances
SShPH1 (4BO-1) 11 4 6 6 8 1 (21) (5) (14) (6) (12) (1) SG9 (5BO-1) 0 0 2 0 0 0 (1) (0) (2) (0) (0) (0) SG21 (6BO-1) 2 0 0 0 0 0 (3) (0) (0) (0) (0) (0) SG34 (6BO-4) 0 0 0 0 0 0 (1) (0) (1) (0) (0) (0) SG58 (7BO-1) 0 1 0 0 0 0 (0) (1) (1) (0) (0) (0) SG64 (7BO-4) 0 0 1 0 0 0 (1) (0) (2) (0) (0) (0) NShPH1-1 (8BO-1) 2 0 2 1 1 0 (10) (0) (3) (3) (1) (1) SSpillway (BBO-1) 1 1 2 1 1 5 (6) (1) (4) (2) (7) (7) Unknown B1 fishway 2 0 3 3 1 0 (4) (1) (4) (4) (1) (0) NSpillway (CBO-1) 2 0 1 1 0 1 (3) (0) (2) (1) (3) (4) SShPH2-1 (DBO-1) 4 0 0 1 0 0 (10) (1) (2) (2) (1) (0)

78
Appendix Table C2. Continued. 1998 2000 2001 Entrance before after before after before after
Bonneville Dam – Entrances (continued)
SShPH2-2 (DBO-5) 3 1 2 2 5 0 (7) (2) (3) (3) (16) (1) OG1 (EBO-1) 0 0 (1) (0) OG3 (EBO-4) 0 0 (0) (0) OG5 (FBO-1) 0 0 (0) (0) OG7 (FBO-3) 0 0 (0) (0) OG9 (GBO-1) 0 0 (1) (0) OG10 (GBO-4) 0 1 (1) (1) OG11 (HBO-1) 0 0 (0) (0) OG12 (HBO-5) 0 0 (0) (0) OG14 (JBO-1) 0 0 (0) (0) OG16 (JBO-4) 0 0 (0) (0) OG18 (KBO-1) 0 0 (0) (0) OG20 (KBO-4) 0 0 (0) (0) NShPH2-1 (LBO-1) 2 1 0 2 1 3 (7) (3) (0) (2) (3) (4) NShPH2-2 (LBO-5) 1 3 0 0 1 2 (3) (5) (0) (1) (1) (2) Unknown WA fishway 0 2 1 0 2 3 (2) (2) (2) (0) (4) (4)
Bonneville Dam – Exits
SShPH1 (4BO-1) 9 2 3 0 0 0 (18) (2) (5) (0) (0) (0) SG9 (5BO-1) 0 0 0 0 0 0 (0) (0) (0) (0) (0) (0) SG21 (6BO-1) 0 0 0 0 0 0 (1) (0) (0) (0) (0) (0) SG34 (6BO-4) 0 0 0 0 0 0 (0) (0) (1) (0) (0) (0) SG58 (7BO-1) 0 0 0 0 0 0 (0) (0) (0) (0) (0) (0)

79
Appendix Table C2. Continued. 1998 2000 2001 Entrance before after before after before after
Bonneville Dam – Exits (continued) SG64 (7BO-4) 0 0 1 1 0 0 (0) (0) (1) (1) (0) (0) NShPH1-1 (8BO-1) 0 0 3 1 5 0 (1) (0) (5) (1) (6) (0) SSpillway (BBO-1) 2 1 1 0 1 1 (6) (1) (2) (1) (5) (1) Unknown B1 fishway 1 0 0 0 0 0 (4) (1) (1) (0) (0) (0) NSpillway (CBO-1) 3 0 0 1 0 0 (4) (1) (1) (1) (2) (2) SShPH2-1 (DBO-1) 3 2 0 2 2 1 (8) (3) (1) (3) (10) (1) SShPH2-2 (DBO-5) 2 0 0 0 0 1 (4) (0) (0) (0) (0) (1) OG1 (EBO-1) 0 0 (0) (0) OG3 (EBO-4) 0 0 (0) (0) OG5 (FBO-1) 0 0 (0) (0) OG7 (FBO-3) 0 0 (0) (0) OG9 (GBO-1) 0 0 (0) (0) OG10 (GBO-4) 0 0 (0) (0) OG11 (HBO-1) 0 0 (0) (0) OG12 (HBO-5) 0 0 (0) (0) OG14 (JBO-1) 0 0 (0) (0) OG16 (JBO-4) 0 0 (0) (0) OG18 (KBO-1) 0 0 (0) (0) OG20 (KBO-4) 0 0 (0) (0) NShPH2-1 (LBO-1) 1 1 0 0 3 1 (3) (2) (0) (0) (4) (1) NShPH2-2 (LBO-5) 0 1 0 1 1 0 (3) (1) (1) (1) (1) (0) Unknown WA fishway 0 1 2 2 0 1 (2) (1) (3) (2) (2) (2)

80
Appendix Table C2. Continued. 1998 2000 2001 Entrance before after before after before after
The Dalles Dam – Approaches
EL (CTD-1/HTD-1) 17 6 33 10 17 5 (144) (41) (183) (39) (102) (21) WPH (BTD-1/JTD-1) 14 5 11 8 9 5 (81) (20) (62) (27) (34) (17) SSpillway (ATD-1) 27 8 13 3 15 7 (68) (22) (44) (29) (51) (17) Unknown E Fishway 0 1 0 0 0 0 (2) (2) (0) (0) (0) (0) NL (ETD-1) 8 4 5 5 9 10 (41) (15) (39) (25) (33) (33) Unknown N Fishway 0 0 0 0 0 0 (0) (0) (0) (0) (0) (0)
The Dalles Dam – Entrances
EL (CTD-1/HTD-1) 29 10 38 7 29 7 (70) (27) (121) (27) (70) (19) WPH (BTD-1/JTD-1) 7 4 7 3 1 0 (15) (9) (8) (6) (4) (3) SSpillway (ATD-1) 19 4 10 7 13 8 (31) (8) (21) (19) (33) (13) Unknown E Fishway 0 0 0 0 0 0 (2) (1) (0) (0) (0) (0) NL (ETD-1) 11 4 7 6 7 10 (36) (14) (33) (29) (26) (27) Unknown N Fishway 0 0 0 0 0 0 (0) (0) (0) (0) (0) (0)
The Dalles Dam – Exits
EL (CTD-1/HTD-1) 2 1 0 1 1 0 (4) (3) (4) (4) (3) (2) WPH (BTD-1/JTD-1) 5 3 10 3 2 0 (6) (11) (14) (5) (5) (1) SSpillway (ATD-1) 23 7 24 8 23 10 (46) (13) (79) (27) (56) (19) Unknown E Fishway 4 1 0 0 0 0 (8) (3) (0) (0) (0) (0) NL (ETD-1) 9 3 6 3 6 5 (24) (10) (24) (25) (18) (19) Unknown N Fishway 0 0 0 0 0 0 (0) (0) (0) (0) (0) (0)

81
Appendix Table C2. Continued. 1998 2000 2001 Entrance before after before after before after
John Day Dam – Approaches
SL (CJD-1/LJD-1) 10 2 10 1 9 2 (87) (11) (132) (16) (141) (12) Sspillway-1 (BJD-1) 3 1 2 3 4 2 (40) (7) (81) (18) (45) (8) Sspillway-2 (BJD-2) 1 0 1 0 2 0 (27) (2) (65) (14) (40) (7) Unknown S Fishway 3 1 1 1 0 0 (45) (5) (23) (6) (24) (2) NL (AJD-1) 2 2 0 1 0 0 (36) (5) (37) (16) (11) (4) Unknown N Fishway 0 0 0 0 0 0 (0) (0) (0) (0) (0) (0)
John Day Dam – Entrances
SL (CJD-1/LJD-1) 7 2 7 2 11 0 (42) (6) (73) (7) (98) (6) Sspillway-1 (BJD-1) 0 0 2 0 2 1 (8) (2) (9) (2) (8) (1) Sspillway-2 (BJD-2) 1 0 0 0 0 0 (2) (0) (0) (0) (1) (0) Unknown S Fishway 8 2 4 1 2 2 (45) (5) (8) (7) (51) (6) NL (AJD-1) 2 0 1 1 0 0 (26) (3) (26) (8) (4) (4) Unknown N Fishway 0 0 0 0 0 0 (0) (0) (0) (0) (0) (0)
John Day Dam – Exits
SL (CJD-1/LJD-1) 4 1 3 2 7 0 (36) (5) (44) (13) (69) (6) Sspillway-1 (BJD-1) 6 1 9 0 4 2 (22) (3) (46) (0) (48) (4) Sspillway-2 (BJD-2) 4 0 0 0 3 1 (18) (3) (13) (1) (15) (1) Unknown S Fishway 0 1 0 1 0 1 (8) (2) (19) (2) (13) (1) NL (AJD-1) 3 0 2 1 0 0 (20) (1) (21) (7) (4) (3) Unknown N Fishway 0 0 0 0 0 0 (1) (0) (0) (0) (0) (0)

82
Appendix Table C2. Continued. 1998 2000 2001 Entrance before after before after before after
McNary Dam – Approaches
SSh (3MN-1) 6 1 5 0 9 6 (26) (29) (54) (1) (66) (21) OG1 (5MN-1) 0 0 (6) (7) OG3 (5MN-4) 0 0 (4) (4) OG4 (6MN-1) 0 0 (13) (8) OG8 (6MN-4) 0 0 (3) (1) OG14 (7MN-1) 0 0 (14) (20) OG21 (7MN-4) 0 0 (13) (6) OG26 (8MN-1) 0 1 (13) (12) OG32 (8MN-4) 0 1 (9) (5) OG37 (9MN-1) 1 0 (16) (10) OG41 (9MN-4) 0 0 (19) (17) OG43 (AMN-1) 1 0 (18) (22) OG44 (AMN-3) 0 0 (10) (17) NPH (BMN-1) 1 2 2 0 7 3 (17) (18) (61) (1) (50) (11) Unknown S Fishway 0 0 0 1 0 0 (0) (0) (2) (1) (1) (0) NSh (CMN-1) 0 2 2 1 1 0 (8) (9) (48) (3) (23) (6) Unknown N Fishway 0 0 0 0 0 0 (0) (0) (0) (0) (0) (0)

83
Appendix Table C2. Continued. 1998 2000 2001 Entrance before after before after before after
McNary Dam – Entrances
SSh (3MN-1) 2 2 4 0 8 3 (6) (6) (11) (1) (30) (5) OG1 (5MN-1) 1 0 (1) (0) OG3 (5MN-4) 0 0 (0) (0) OG4 (6MN-1) 0 0 (1) (0) OG8 (6MN-4) 0 0 (0) (0) OG14 (7MN-1) 0 0 (0) (0) OG21 (7MN-4) 0 0 (0) (0) OG26 (8MN-1) 2 0 (4) (1) OG32 (8MN-4) 0 0 (1) (0) OG37 (9MN-1) 0 0 (2) (0) OG41 (9MN-4) 0 0 (1) (0) OG43 (AMN-1) 0 0 (0) (0) OG44 (AMN-3) 0 0 (0) (0) NPH (BMN-1) 3 1 3 1 3 1 (7) (2) (7) (2) (7) (1) Unknown S Fishway 0 0 1 1 2 1 (0) (0) (7) (1) (6) (1) NSh (CMN-1) 1 1 1 0 4 4 (6) (3) (31) (2) (16) (4) Unknown N Fishway 0 0 0 0 0 0 (0) (0) (0) (0) (0) (0)

84
Appendix Table C2. Continued. 1998 2000 2001 Entrance before after before after before after
McNary Dam - Exits
SSh (3MN-1) 1 1 4 0 6 1 (7) (4) (10) (0) (25) (1) OG1 (5MN-1) 0 0 (0) (0) OG3 (5MN-4) 0 0 (0) (0) OG4 (6MN-1) 0 0 (0) (0) OG8 (6MN-4) 0 0 (0) (0) OG14 (7MN-1) 0 0 (0) (0) OG21 (7MN-4) 0 0 (0) (0) OG26 (8MN-1) 1 0 (1) (0) OG32 (8MN-4) 0 0 (0) (0) OG37 (9MN-1) 0 0 (0) (0) OG41 (9MN-4) 0 0 (0) (0) OG43 (AMN-1) 0 0 (0) (0) OG44 (AMN-3) 0 0 (0) (0) NPH (BMN-1) 3 2 3 1 1 0 (9) (3) (11) (2) (3) (0) Unknown S Fishway 0 0 0 0 0 0 (0) (0) (0) (0) (0) (0) NSh (CMN-1) 1 0 1 0 3 3 (3) (2) (26) (0) (16) (3) Unknown N Fishway 0 0 0 0 0 0 (0) (0) (0) (0) (0) (0)