Embed Size (px)
Citation preview
A
ciTdapP4©
K
1
lcuaetAevdtipfa
b
0d
Available online at www.sciencedirect.com
Journal of Hazardous Materials 152 (2008) 589–600
Adsorptive removal of acrylonitrile by commercial gradeactivated carbon: Kinetics, equilibrium and thermodynamics
Arvind Kumar, B. Prasad ∗, I.M. MishraDepartment of Chemical Engineering, Indian Institute of Technology Roorkee, Roorkee-247 667, Uttarakhand, India
Received 16 September 2006; received in revised form 9 July 2007; accepted 9 July 2007Available online 21 July 2007
bstract
The potential of activated carbons—powdered (PAC) and granular (GAC), for the adsorption of acrylonitrile (AN) at different initial ANoncentrations (50 ≤ C0 ≤ 500 mg/l) from aqueous solutions was studied over the temperature range of 303–333 K. The effect of adsorbent dosage,nitial AN concentration, contact time, and the change in pH with addition of adsorbents on adsorption was studied. The Langmuir, Freundlich,empkin, and Redlich–Peterson (R–P) isotherm equations were used to test their fit with the experimental data, and the model parameters wereetermined for different temperatures. The Langmuir and R–P models were found to be the best to describe the equilibrium isotherm data of AN
dsorption on PAC and GAC, respectively. Error analysis also confirmed the efficacy of the R–P isotherm to best fit the experimental data. Theseudo-second order kinetic model best represents the kinetics of the adsorption of AN onto PAC and GAC. Maximum adsorption capacity ofAC and GAC at optimum conditions of AN removal (adsorbent dose ≈ 20 g/l of solution, and equilibrium time ≈ 5 h) was found to be 51.72 and6.63 mg/g, respectively.rms; E
ac
mecriaeTd[io
2007 Elsevier B.V. All rights reserved.
eywords: Acrylonitrile; Activated carbon; GAC; Adsorption; Kinetics; Isothe
. Introduction
Acrylonitrile (AN) (CAS no. 107-13-1) is a volatile, colour-ess, flammable liquid with sweet characteristic odour and isonsidered to be an extremely hazardous substance [1]. It issed in the production of acrylic and modacrylic fibers, resinsnd rubbers, and as a chemical intermediate. AN may enter thenvironment accidentally, during its storage and transport buthe highest potential for exposure is at the work place whereN is dealt with. The chronic exposure induces several adverse
ffects like asphyxia, eye irritation, headache, sneezing, nausea,omiting, weakness, lightheadedness, mild jaundice, insomnia,iarrhoea, inflammation of the respiratory tract, etc. AN affectshe central and peripheral nervous system, skin, and eyes. Watermproves the stability of acrylonitrile, and the technical grade
roduct gets stabilized against self-polymerization and colourormation by the addition of hydroquinone mono methyl ethernd water [2]. EPA classifies acrylonitrile as a priority pollutant,∗ Corresponding author. Tel.: +91 1332 285323; fax: +91 1332 276535.E-mail addresses: [email protected] (A. Kumar),
[email protected] (B. Prasad), [email protected] (I.M. Mishra).
tftod
uo
304-3894/$ – see front matter © 2007 Elsevier B.V. All rights reserved.oi:10.1016/j.jhazmat.2007.07.048
rror analysis; Thermodynamics
hazardous air as well as water pollutant, and a volatile organicompound [3].
Most of the adsorption studies on the removal of toxicaterials from the aqueous solutions dealt with the adsorptive
quilibrium and kinetics, and used commercial grade activatedarbons and low-cost adsorbents. The literature on the adsorptiveemoval of toxic organics and heavy metal ions is enormous. Var-ous isotherm models, viz. two parameter models of Freundlichnd Langmuir, and three parameter models of Redlich–Peterson,tc. have been used to represent the equilibrium isotherm data.he details of these models and their characteristics have beenealt with comprehensively recently by Mishra and coworkers4–10]. Mechanistic studies to understand sorption character-stics have been reported by many investigators [4,8,10]. Mostf the authors have used Vermeulen’s [11] approximations tohe analytical solution of a differential equation to represent theractional approach to equilibrium and to determine the effec-ive diffusivity of the adsorbate into the adsorbents. The effectf temperature on the adsorption phenomenon and intraparticle
iffusion process has also been studied.Except the work of Liu et al. [12] wherein the authorssed natural zeolites to adsorb AN at high concentrations, nother work is available in literature dealing with the adsorp-
5 rdous Materials 152 (2008) 589–600
t(eiPstogatm
2
2
Rfcuuuspbat(wGwitbtr
rurtAH(
2
wm1wHwt
Fa
rfltinfitawAti�
o
2
A
2
mutbootce
90 A. Kumar et al. / Journal of Haza
ive removal of AN from wastewaters. Activated carbonsAC)—powdered (PAC) and granular (GAC), have been usedxtensively for the adsorption of a variety of pollutants and tox-cs from aqueous solutions. The present work reports the use ofAC and GAC for the adsorptive removal of AN from aqueousolution. Effects of such parameters as adsorbent dose (m), ini-ial AN concentration (C0), contact time (t) and initial pH (pH0)f the solution on the adsorption process have also been investi-ated. The kinetics of adsorption of AN on the adsorbents havelso been studied. Equilibrium adsorption data have been fittedo various isotherm equations to determine the best isotherm
odel to represent the experimental sorption data.
. Material and methods
.1. Adsorbents and their characterization
The commercial grade PAC was obtained from HiMediaesearch Laboratory, Mumbai and the GAC was obtained
rom S.D. Fine Chemicals, Ltd., Mumbai (India). The physico-hemical characteristics of the adsorbents were determinedsing standard procedures. Proximate analysis was carried outsing the standard procedure [13]. Bulk density was determinedsing MAC bulk density meter. The pore size distribution, thepecific surface area and pore volume of the PAC and GAC sam-les were carried out at Kunash Instruments Pvt. Ltd., Mumbai,y N2 adsorption using Micromeritics instrument (Tristar 3000)nd by using Brunauer–Emmett–Teller (BET) method, usinghe software of Micromeritics. Nitrogen was used as cold bath77.15 K). The Barrett–Joyner–Hanlenda (BJH) method [14]as used to calculate the mesopore distribution for the PAC andAC. FTIR spectrometer (Thermo Nicolet, Model Magna 760)as employed to determine the presence of functional groups
n all the adsorbents at room temperature. Pellet (pressed-disk)echnique was used for this purpose. The pellets were preparedy mixing the adsorbent with KBr (mass ratio 100:1). The spec-ral range covered was from 4000 to 500 cm−1 scanned at theate of 16 nm s−1.
X-ray diffraction (XRD) analysis of the adsorbents was car-ied out using Phillips diffraction unit (Model PW1140/90),sing copper as the target with nickel as the filter medium, andadiation maintained at 1.542 A. Goniometer speed was main-ained at 1◦ min−1 and the orientation was kept from 5◦ to 105◦.
scanning electron microscope (Model SEM-501, Phillips,olland) was used for obtaining Scanning electron microscopy
SEM) micrographs of the adsorbents
.2. Point of zero charge (pHPZC)
The zero surface charge characteristics of the PAC and GACere determined by using the solid addition method [10]. Fortyillilitres of 0.1 M KNO3 solution was transferred to a series of
00 ml stoppered conical flasks. The pH0 values of the solutions
ere roughly adjusted between 2 and 12 by adding either 0.1NCl or NaOH. The total volume of the solution in each flaskas adjusted exactly to 50 ml by adding the KNO3 solution ofhe same strength. The pH0 of the solutions were then accu-
2
d
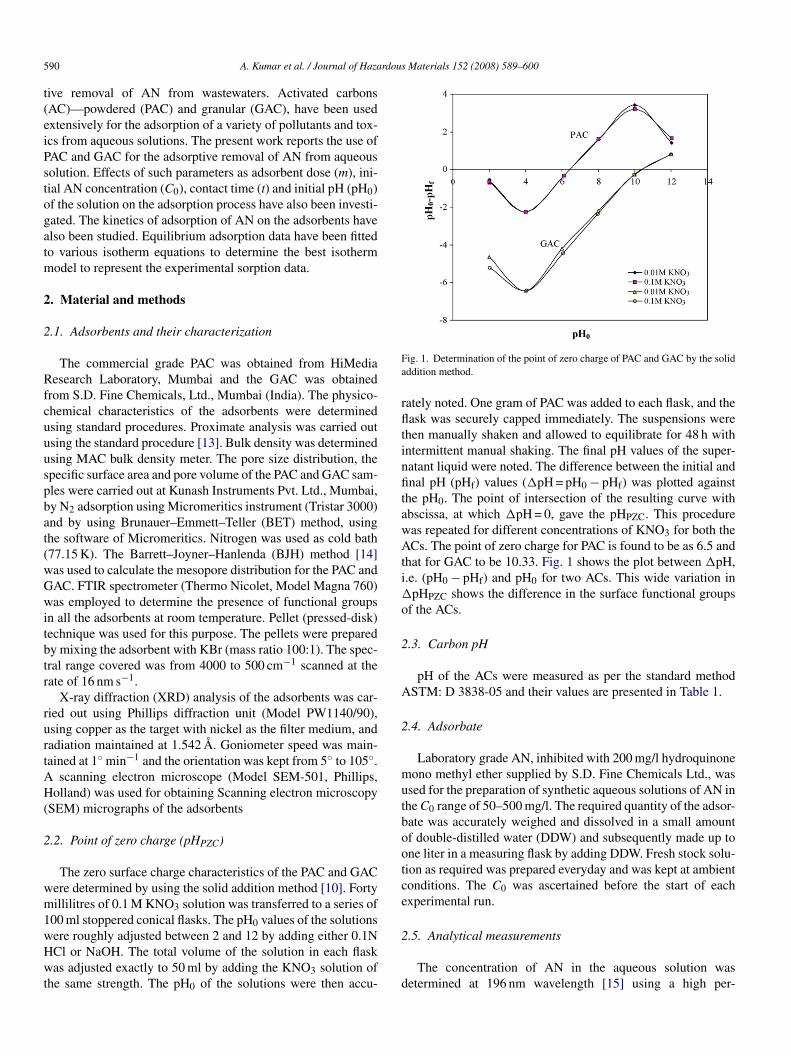
ig. 1. Determination of the point of zero charge of PAC and GAC by the solidddition method.
ately noted. One gram of PAC was added to each flask, and theask was securely capped immediately. The suspensions were
hen manually shaken and allowed to equilibrate for 48 h withntermittent manual shaking. The final pH values of the super-atant liquid were noted. The difference between the initial andnal pH (pHf) values (�pH = pH0 − pHf) was plotted against
he pH0. The point of intersection of the resulting curve withbscissa, at which �pH = 0, gave the pHPZC. This procedureas repeated for different concentrations of KNO3 for both theCs. The point of zero charge for PAC is found to be as 6.5 and
hat for GAC to be 10.33. Fig. 1 shows the plot between �pH,.e. (pH0 − pHf) and pH0 for two ACs. This wide variation in
pHPZC shows the difference in the surface functional groupsf the ACs.
.3. Carbon pH
pH of the ACs were measured as per the standard methodSTM: D 3838-05 and their values are presented in Table 1.
.4. Adsorbate
Laboratory grade AN, inhibited with 200 mg/l hydroquinoneono methyl ether supplied by S.D. Fine Chemicals Ltd., was
sed for the preparation of synthetic aqueous solutions of AN inhe C0 range of 50–500 mg/l. The required quantity of the adsor-ate was accurately weighed and dissolved in a small amountf double-distilled water (DDW) and subsequently made up tone liter in a measuring flask by adding DDW. Fresh stock solu-ion as required was prepared everyday and was kept at ambientonditions. The C0 was ascertained before the start of eachxperimental run.
.5. Analytical measurements
The concentration of AN in the aqueous solution wasetermined at 196 nm wavelength [15] using a high per-
A. Kumar et al. / Journal of Hazardous
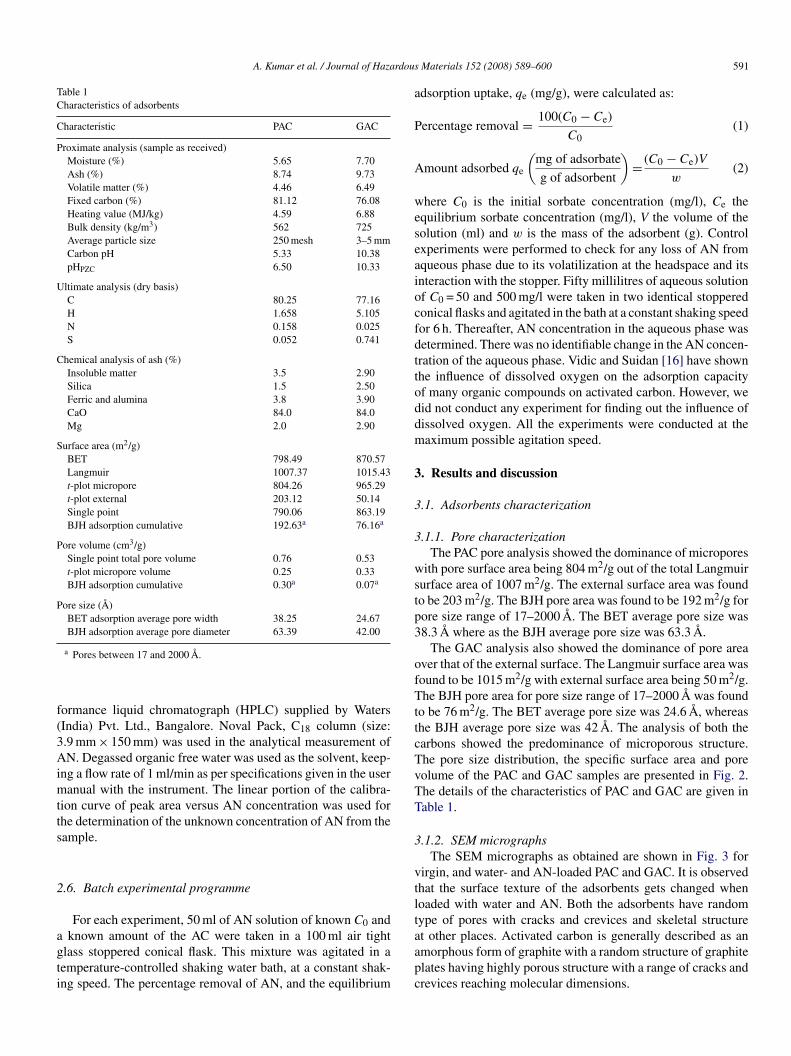
Table 1Characteristics of adsorbents
Characteristic PAC GAC
Proximate analysis (sample as received)Moisture (%) 5.65 7.70Ash (%) 8.74 9.73Volatile matter (%) 4.46 6.49Fixed carbon (%) 81.12 76.08Heating value (MJ/kg) 4.59 6.88Bulk density (kg/m3) 562 725Average particle size 250 mesh 3–5 mmCarbon pH 5.33 10.38pHPZC 6.50 10.33
Ultimate analysis (dry basis)C 80.25 77.16H 1.658 5.105N 0.158 0.025S 0.052 0.741
Chemical analysis of ash (%)Insoluble matter 3.5 2.90Silica 1.5 2.50Ferric and alumina 3.8 3.90CaO 84.0 84.0Mg 2.0 2.90
Surface area (m2/g)BET 798.49 870.57Langmuir 1007.37 1015.43t-plot micropore 804.26 965.29t-plot external 203.12 50.14Single point 790.06 863.19BJH adsorption cumulative 192.63a 76.16a
Pore volume (cm3/g)Single point total pore volume 0.76 0.53t-plot micropore volume 0.25 0.33BJH adsorption cumulative 0.30a 0.07a
Pore size (A)BET adsorption average pore width 38.25 24.67BJH adsorption average pore diameter 63.39 42.00
f(3Aimtts
2
agti
a
P
A
weseaiocfdttoddm
3
3
3
wstp3
ofTttcTvTT
3
vtltype of pores with cracks and crevices and skeletal structureat other places. Activated carbon is generally described as an
a Pores between 17 and 2000 A.
ormance liquid chromatograph (HPLC) supplied by WatersIndia) Pvt. Ltd., Bangalore. Noval Pack, C18 column (size:.9 mm × 150 mm) was used in the analytical measurement ofN. Degassed organic free water was used as the solvent, keep-
ng a flow rate of 1 ml/min as per specifications given in the useranual with the instrument. The linear portion of the calibra-
ion curve of peak area versus AN concentration was used forhe determination of the unknown concentration of AN from theample.
.6. Batch experimental programme
For each experiment, 50 ml of AN solution of known C0 andknown amount of the AC were taken in a 100 ml air tight
lass stoppered conical flask. This mixture was agitated in aemperature-controlled shaking water bath, at a constant shak-ng speed. The percentage removal of AN, and the equilibrium
apc
Materials 152 (2008) 589–600 591
dsorption uptake, qe (mg/g), were calculated as:
ercentage removal = 100(C0 − Ce)
C0(1)
mount adsorbed qe
(mg of adsorbate
g of adsorbent
)= (C0 − Ce)V
w(2)
here C0 is the initial sorbate concentration (mg/l), Ce thequilibrium sorbate concentration (mg/l), V the volume of theolution (ml) and w is the mass of the adsorbent (g). Controlxperiments were performed to check for any loss of AN fromqueous phase due to its volatilization at the headspace and itsnteraction with the stopper. Fifty millilitres of aqueous solutionf C0 = 50 and 500 mg/l were taken in two identical stopperedonical flasks and agitated in the bath at a constant shaking speedor 6 h. Thereafter, AN concentration in the aqueous phase wasetermined. There was no identifiable change in the AN concen-ration of the aqueous phase. Vidic and Suidan [16] have shownhe influence of dissolved oxygen on the adsorption capacityf many organic compounds on activated carbon. However, weid not conduct any experiment for finding out the influence ofissolved oxygen. All the experiments were conducted at theaximum possible agitation speed.
. Results and discussion
.1. Adsorbents characterization
.1.1. Pore characterizationThe PAC pore analysis showed the dominance of micropores
ith pore surface area being 804 m2/g out of the total Langmuirurface area of 1007 m2/g. The external surface area was foundo be 203 m2/g. The BJH pore area was found to be 192 m2/g forore size range of 17–2000 A. The BET average pore size was8.3 A where as the BJH average pore size was 63.3 A.
The GAC analysis also showed the dominance of pore areaver that of the external surface. The Langmuir surface area wasound to be 1015 m2/g with external surface area being 50 m2/g.he BJH pore area for pore size range of 17–2000 A was found
o be 76 m2/g. The BET average pore size was 24.6 A, whereashe BJH average pore size was 42 A. The analysis of both thearbons showed the predominance of microporous structure.he pore size distribution, the specific surface area and poreolume of the PAC and GAC samples are presented in Fig. 2.he details of the characteristics of PAC and GAC are given inable 1.
.1.2. SEM micrographsThe SEM micrographs as obtained are shown in Fig. 3 for
irgin, and water- and AN-loaded PAC and GAC. It is observedhat the surface texture of the adsorbents gets changed whenoaded with water and AN. Both the adsorbents have random
morphous form of graphite with a random structure of graphitelates having highly porous structure with a range of cracks andrevices reaching molecular dimensions.

592 A. Kumar et al. / Journal of Hazardous
Fig. 2. Pore size distribution of PAC and GAC.
3
oftspthCh
Dima
Fig. 3. SEM of virgin, water- and AN-l
Materials 152 (2008) 589–600
.1.3. Thermo-gravimetric analysisThermal stability of PAC and GAC is directly dependent
n the decomposition temperature of its various oxides andunctional groups. The surface groups present on carbons andhose formed as a result of interaction with oxidizing gases orolutions are generally quite stable even under vacuum at tem-eratures below 150 ◦C, irrespective of the temperature at whichhey were formed. However, when the carbons are heated atigher temperatures, the surface groups decompose, producingO (150–600 ◦C), CO2 (350–1000 ◦C), water vapour and freeydrogen (500–1000 ◦C) [9].
The thermo-gravimetric analysis curves (TGA, DTA andTG) of activated carbons under inert (nitrogen) and oxidiz-
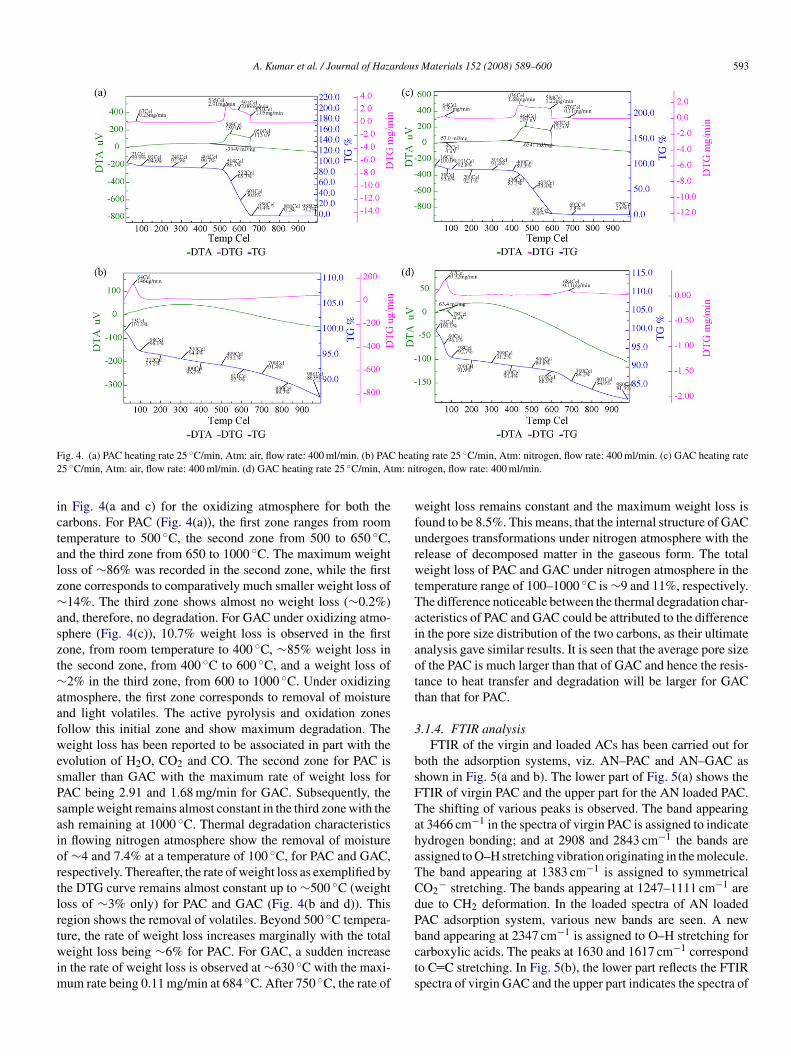
ng atmosphere at the carrier gas (nitrogen or air, as the caseay be) flow rate of 400 ml/min at a heating rate of 25 K/min
re shown in Fig. 4(a–d). Three different zones can be seen
oaded activated carbons at 5 KX.
A. Kumar et al. / Journal of Hazardous Materials 152 (2008) 589–600 593
F heat2 m: ni
ictalz∼aszt∼aafwesPsaiortlrtwim
wfurwtTaiaott
3
bsFTahaTCdP
ig. 4. (a) PAC heating rate 25 ◦C/min, Atm: air, flow rate: 400 ml/min. (b) PAC5 ◦C/min, Atm: air, flow rate: 400 ml/min. (d) GAC heating rate 25 ◦C/min, At
n Fig. 4(a and c) for the oxidizing atmosphere for both thearbons. For PAC (Fig. 4(a)), the first zone ranges from roomemperature to 500 ◦C, the second zone from 500 to 650 ◦C,nd the third zone from 650 to 1000 ◦C. The maximum weightoss of ∼86% was recorded in the second zone, while the firstone corresponds to comparatively much smaller weight loss of14%. The third zone shows almost no weight loss (∼0.2%)
nd, therefore, no degradation. For GAC under oxidizing atmo-phere (Fig. 4(c)), 10.7% weight loss is observed in the firstone, from room temperature to 400 ◦C, ∼85% weight loss inhe second zone, from 400 ◦C to 600 ◦C, and a weight loss of
2% in the third zone, from 600 to 1000 ◦C. Under oxidizingtmosphere, the first zone corresponds to removal of moisturend light volatiles. The active pyrolysis and oxidation zonesollow this initial zone and show maximum degradation. Theeight loss has been reported to be associated in part with the
volution of H2O, CO2 and CO. The second zone for PAC ismaller than GAC with the maximum rate of weight loss forAC being 2.91 and 1.68 mg/min for GAC. Subsequently, theample weight remains almost constant in the third zone with thesh remaining at 1000 ◦C. Thermal degradation characteristicsn flowing nitrogen atmosphere show the removal of moisturef ∼4 and 7.4% at a temperature of 100 ◦C, for PAC and GAC,espectively. Thereafter, the rate of weight loss as exemplified byhe DTG curve remains almost constant up to ∼500 ◦C (weightoss of ∼3% only) for PAC and GAC (Fig. 4(b and d)). Thisegion shows the removal of volatiles. Beyond 500 ◦C tempera-
ure, the rate of weight loss increases marginally with the totaleight loss being ∼6% for PAC. For GAC, a sudden increasen the rate of weight loss is observed at ∼630 ◦C with the maxi-um rate being 0.11 mg/min at 684 ◦C. After 750 ◦C, the rate of
bcts
ing rate 25 ◦C/min, Atm: nitrogen, flow rate: 400 ml/min. (c) GAC heating ratetrogen, flow rate: 400 ml/min.
eight loss remains constant and the maximum weight loss isound to be 8.5%. This means, that the internal structure of GACndergoes transformations under nitrogen atmosphere with theelease of decomposed matter in the gaseous form. The totaleight loss of PAC and GAC under nitrogen atmosphere in the
emperature range of 100–1000 ◦C is ∼9 and 11%, respectively.he difference noticeable between the thermal degradation char-cteristics of PAC and GAC could be attributed to the differencen the pore size distribution of the two carbons, as their ultimatenalysis gave similar results. It is seen that the average pore sizef the PAC is much larger than that of GAC and hence the resis-ance to heat transfer and degradation will be larger for GAChan that for PAC.
.1.4. FTIR analysisFTIR of the virgin and loaded ACs has been carried out for
oth the adsorption systems, viz. AN–PAC and AN–GAC ashown in Fig. 5(a and b). The lower part of Fig. 5(a) shows theTIR of virgin PAC and the upper part for the AN loaded PAC.he shifting of various peaks is observed. The band appearingt 3466 cm−1 in the spectra of virgin PAC is assigned to indicateydrogen bonding; and at 2908 and 2843 cm−1 the bands aressigned to O–H stretching vibration originating in the molecule.he band appearing at 1383 cm−1 is assigned to symmetricalO2
− stretching. The bands appearing at 1247–1111 cm−1 areue to CH2 deformation. In the loaded spectra of AN loadedAC adsorption system, various new bands are seen. A new
and appearing at 2347 cm−1 is assigned to O–H stretching forarboxylic acids. The peaks at 1630 and 1617 cm−1 correspondo C C stretching. In Fig. 5(b), the lower part reflects the FTIRpectra of virgin GAC and the upper part indicates the spectra of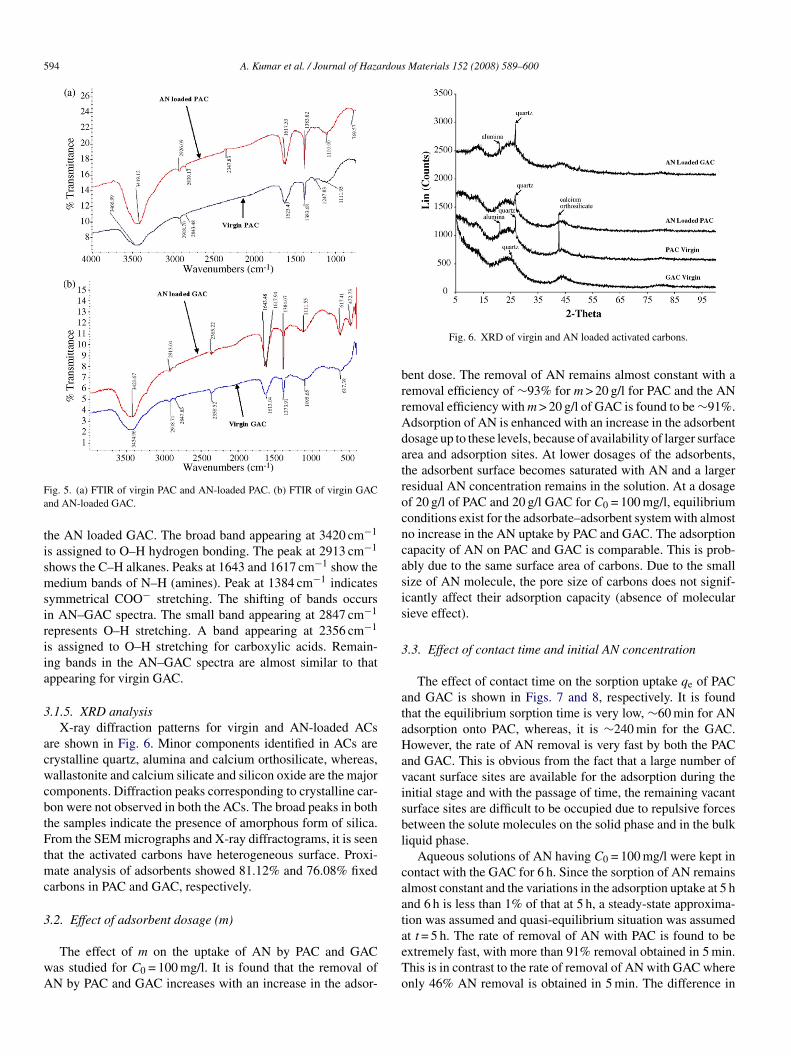
594 A. Kumar et al. / Journal of Hazardous Materials 152 (2008) 589–600
Fa
tismsiriia
3
acwcbtFtmc
3
wA
brrAdatrocncasis
3
ataHavisbl
caat
ig. 5. (a) FTIR of virgin PAC and AN-loaded PAC. (b) FTIR of virgin GACnd AN-loaded GAC.
he AN loaded GAC. The broad band appearing at 3420 cm−1
s assigned to O–H hydrogen bonding. The peak at 2913 cm−1
hows the C–H alkanes. Peaks at 1643 and 1617 cm−1 show theedium bands of N–H (amines). Peak at 1384 cm−1 indicates
ymmetrical COO− stretching. The shifting of bands occursn AN–GAC spectra. The small band appearing at 2847 cm−1
epresents O–H stretching. A band appearing at 2356 cm−1
s assigned to O–H stretching for carboxylic acids. Remain-ng bands in the AN–GAC spectra are almost similar to thatppearing for virgin GAC.
.1.5. XRD analysisX-ray diffraction patterns for virgin and AN-loaded ACs
re shown in Fig. 6. Minor components identified in ACs arerystalline quartz, alumina and calcium orthosilicate, whereas,allastonite and calcium silicate and silicon oxide are the major
omponents. Diffraction peaks corresponding to crystalline car-on were not observed in both the ACs. The broad peaks in bothhe samples indicate the presence of amorphous form of silica.rom the SEM micrographs and X-ray diffractograms, it is seen
hat the activated carbons have heterogeneous surface. Proxi-ate analysis of adsorbents showed 81.12% and 76.08% fixed
arbons in PAC and GAC, respectively.
.2. Effect of adsorbent dosage (m)
The effect of m on the uptake of AN by PAC and GACas studied for C0 = 100 mg/l. It is found that the removal ofN by PAC and GAC increases with an increase in the adsor-
aeTo
Fig. 6. XRD of virgin and AN loaded activated carbons.
ent dose. The removal of AN remains almost constant with aemoval efficiency of ∼93% for m > 20 g/l for PAC and the ANemoval efficiency with m > 20 g/l of GAC is found to be ∼91%.dsorption of AN is enhanced with an increase in the adsorbentosage up to these levels, because of availability of larger surfacerea and adsorption sites. At lower dosages of the adsorbents,he adsorbent surface becomes saturated with AN and a largeresidual AN concentration remains in the solution. At a dosagef 20 g/l of PAC and 20 g/l GAC for C0 = 100 mg/l, equilibriumonditions exist for the adsorbate–adsorbent system with almosto increase in the AN uptake by PAC and GAC. The adsorptionapacity of AN on PAC and GAC is comparable. This is prob-bly due to the same surface area of carbons. Due to the smallize of AN molecule, the pore size of carbons does not signif-cantly affect their adsorption capacity (absence of molecularieve effect).
.3. Effect of contact time and initial AN concentration
The effect of contact time on the sorption uptake qe of PACnd GAC is shown in Figs. 7 and 8, respectively. It is foundhat the equilibrium sorption time is very low, ∼60 min for ANdsorption onto PAC, whereas, it is ∼240 min for the GAC.owever, the rate of AN removal is very fast by both the PAC
nd GAC. This is obvious from the fact that a large number ofacant surface sites are available for the adsorption during thenitial stage and with the passage of time, the remaining vacanturface sites are difficult to be occupied due to repulsive forcesetween the solute molecules on the solid phase and in the bulkiquid phase.
Aqueous solutions of AN having C0 = 100 mg/l were kept inontact with the GAC for 6 h. Since the sorption of AN remainslmost constant and the variations in the adsorption uptake at 5 hnd 6 h is less than 1% of that at 5 h, a steady-state approxima-ion was assumed and quasi-equilibrium situation was assumed
t t = 5 h. The rate of removal of AN with PAC is found to bextremely fast, with more than 91% removal obtained in 5 min.his is in contrast to the rate of removal of AN with GAC wherenly 46% AN removal is obtained in 5 min. The difference in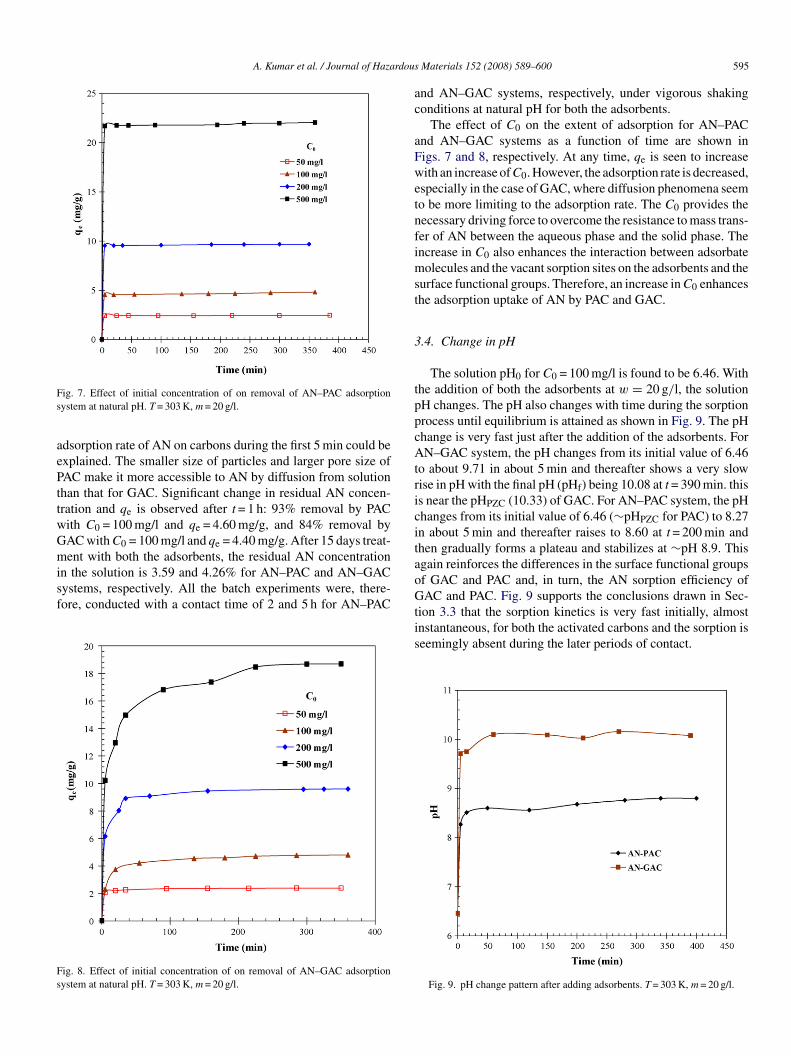
A. Kumar et al. / Journal of Hazardous
Fs
aePttwGmisf
Fs
ac
aFwetnfimst
3
tppcAtricit
ig. 7. Effect of initial concentration of on removal of AN–PAC adsorptionystem at natural pH. T = 303 K, m = 20 g/l.
dsorption rate of AN on carbons during the first 5 min could bexplained. The smaller size of particles and larger pore size ofAC make it more accessible to AN by diffusion from solutionhan that for GAC. Significant change in residual AN concen-ration and qe is observed after t = 1 h: 93% removal by PACith C0 = 100 mg/l and qe = 4.60 mg/g, and 84% removal byAC with C0 = 100 mg/l and qe = 4.40 mg/g. After 15 days treat-
ent with both the adsorbents, the residual AN concentrationn the solution is 3.59 and 4.26% for AN–PAC and AN–GACystems, respectively. All the batch experiments were, there-ore, conducted with a contact time of 2 and 5 h for AN–PAC
ig. 8. Effect of initial concentration of on removal of AN–GAC adsorptionystem at natural pH. T = 303 K, m = 20 g/l.
aoGtis
Materials 152 (2008) 589–600 595
nd AN–GAC systems, respectively, under vigorous shakingonditions at natural pH for both the adsorbents.
The effect of C0 on the extent of adsorption for AN–PACnd AN–GAC systems as a function of time are shown inigs. 7 and 8, respectively. At any time, qe is seen to increaseith an increase of C0. However, the adsorption rate is decreased,
specially in the case of GAC, where diffusion phenomena seemo be more limiting to the adsorption rate. The C0 provides theecessary driving force to overcome the resistance to mass trans-er of AN between the aqueous phase and the solid phase. Thencrease in C0 also enhances the interaction between adsorbateolecules and the vacant sorption sites on the adsorbents and the
urface functional groups. Therefore, an increase in C0 enhanceshe adsorption uptake of AN by PAC and GAC.
.4. Change in pH
The solution pH0 for C0 = 100 mg/l is found to be 6.46. Withhe addition of both the adsorbents at w = 20 g/l, the solutionH changes. The pH also changes with time during the sorptionrocess until equilibrium is attained as shown in Fig. 9. The pHhange is very fast just after the addition of the adsorbents. ForN–GAC system, the pH changes from its initial value of 6.46
o about 9.71 in about 5 min and thereafter shows a very slowise in pH with the final pH (pHf) being 10.08 at t = 390 min. thiss near the pHPZC (10.33) of GAC. For AN–PAC system, the pHhanges from its initial value of 6.46 (∼pHPZC for PAC) to 8.27n about 5 min and thereafter raises to 8.60 at t = 200 min andhen gradually forms a plateau and stabilizes at ∼pH 8.9. Thisgain reinforces the differences in the surface functional groupsf GAC and PAC and, in turn, the AN sorption efficiency ofAC and PAC. Fig. 9 supports the conclusions drawn in Sec-
ion 3.3 that the sorption kinetics is very fast initially, almostnstantaneous, for both the activated carbons and the sorption iseemingly absent during the later periods of contact.
Fig. 9. pH change pattern after adding adsorbents. T = 303 K, m = 20 g/l.
5 rdous
3
afi
3
E
l
wqpdTa
b
wIe
q
T
h
hosaa
ktupo0oddr
3
amineiAtmgrfHLavecTia
TK
E
P
P
96 A. Kumar et al. / Journal of Haza
.5. Adsorption kinetics
In order to investigate the sorption kinetics of AN onto PACnd GAC, the experimental results were analyzed using pseudo-rst order and pseudo-second order models [17].
.5.1. Pseudo-first order and pseudo-second order modelsThe pseudo-first-order equation is given as follows [18]:
dqt
dt= kf(qe − qt) (3)
q. (3) can be linearized into the following form
n(qe − qt) = lnqe − kft (4)
here qt is the amount of adsorbate adsorbed at time t (mg/g);e the adsorption capacity in equilibrium (mg/g), and kf is theseudo-first order rate constant (min−1) for AN adsorption. kf isetermined from a plot of ln (qe − qt) versus t (not shown here).he kf, qe,exp and qe,cal values from the pseudo-first order modelre given in Table 2.
The pseudo-second order model can be represented as givenelow [19]:
dqt
dt= ks(qe − qt)
2 (5)
here ks is the pseudo-second order rate constant (g/mg min).ntegrating Eq. (5) and noting that qt = 0 at t = 0, the followingquation is obtained:
t = ksq2e t
1 + ksqet(6)
he initial sorption rate, h (mg/g min) at t = 0 is defined as
= ksq2e (7)
, qe and ks can be determined from the non-linear regression
f Eq. (6) with the experimental data using the MicroSoft Excelpread sheet for Windows. The best-fit values of h, qe and kslong with the correlation coefficients for the pseudo-first ordernd pseudo-second order models are shown in Table 2.odcs
able 2inetic parameters for the removal of AN–PAC and AN–GAC system
quations AN–PAC adsorption system
50 mg/l 100 mg/l 200 mg/l 500 m
seudo first order equation: ln(qe–qt) = ln qe–kftkf (min−1) 3.785 0.783 0.790 1qe,exp (mg/g) 2.451 4.814 9.697qe,cal (mg/g) 2.430 4.652 9.656R2 1.000 0.998 0.999MPSD 0.566 3.015 1.293
seudo second order equation: qt = kSq2e t/(1 + kSqet)
ks (g/mg min) 32.629 1.626 1.734 3h (mg/g min) 193.024 35.245 161.812 1601qe,cal (mg/g) 2.432 4.655 9.659R2 1.000 0.998 0.999MPSD 0.475 2.912 0.914
Materials 152 (2008) 589–600
The qe,exp and qe,cal values from the pseudo-second orderinetic model are very close to each other and the correla-ion coefficients are also found to be very high and closer tonity. Therefore, the sorption kinetics can be represented by theseudo-second order kinetic model for the adsorption of ANnto PAC and GAC. Mall et al. [20] have reported ks values of.413 and 0.069 g/mg.min for the adsorption of Congo red dyento commercial- and laboratory-grade activated carbons. Butue to different nature of the adsorbate–adsorbent systems, airect comparison of ks values obtained in this study with thoseeported in literature is not justified.
.6. Adsorption equilibrium study
To optimize the design of an adsorption system for thedsorption of the adsorbates, it is important to establish theost appropriate correlation for the equilibrium curves. Various
sotherm equations have been used to describe the equilibriumature of adsorption. Large number of researchers in the field ofnvironmental engineering have used Freundlich and Langmuirsotherm equations to represent equilibrium adsorption data forC-organic contaminants systems. This, despite the fact that
hese equations have serious limitations on their usage. Theost popular Freundlich isotherm is suitable for highly hetero-
eneous surfaces; however, it is valid for adsorption data over aestricted range of concentrations. For highly heterogeneous sur-aces and extremely low concentrations, Henry’s Law is valid.owever, Freundlich equation [21] does not approach Henry’saw at vanishing concentrations. The Langmuir equation [22],lthough follows Henry’s Law at vanishing concentrations, isalid for homogeneous surfaces. Thus, both these isothermquations may not be suitable for AN adsorption on activatedarbon for the whole range of concentrations used in the study.emkin isotherm equation contains a factor that explicitly takes
nto account the interactions between adsorbing species and thedsorbate. This isotherm assumes that (i) the heat of adsorption
f all the molecules in the layer decreases linearly with coverageue to adsorbate–adsorbate interactions, and (ii) adsorption isharacterized by a uniform distribution of binding energies, up toome maximum binding energy [23]. The Redlich and PetersonAN–GAC adsorption system
g/l 50 mg/l 100 mg/l 200 mg/l 500 mg/l
20.485 0.410 0.139 0.216 0.06822.045 2.395 4.807 9.597 21.04521.797 2.367 4.587 9.450 17.3690.999 0.996 0.987 0.988 0.9471.115 4.724 10.786 9.447 28.918
33.7 0.518 0.040 0.036 0.01567 2.930 0.897 3.392 4.83421.797 2.370 4.723 9.635 17.6500.999 0.998 0.998 0.997 0.9661.114 2.998 3.051 3.32 17.918
A. Kumar et al. / Journal of Hazardous Materials 152 (2008) 589–600 597
Ft
(rea
ss
Ft
(tnare given as
TI
C
L
F
T
R
ig. 10. Equilibrium isotherms for the adsorption of AN onto PAC at differentemperatures.
R–P) equation [24] is a three parameter-equation, often used toepresent solute adsorption data on heterogeneous surfaces. Thisquation reduces to Freundlich equation at high concentrations
nd to Henry’s equation at very low concentrations.Two different error functions were also employed in thistudy to find out the most suitable isotherm model to repre-ent the experimental data. The hybrid fractional error function
H
able 3sotherm parameters and error analysis for the removal of AN–PAC and AN–GAC sy
onstants AN–PAC
303 K 313 K 323 K
angmuir isotherm: qe = qmKLCe/(1 + KLCe)KL (l/mg) 0.0427 0.0370 0.0353qm (mg/g) 51.7210 46.6286 43.0980R2 0.9810 0.9873 0.9924HYBRID −0.2031 0.5774 1.3492MPSD 19.3395 15.3296 13.9598
reundlich isotherm: qe = KFC1/ne
KF (mg/g)/(mg/l)1/n 2.7111 2.5053 2.43571/n 0.6989 0.6405 0.6058R2 0.9574 0.9878 0.9935HYBRID −4.0352 −1.1965 −0.6181MPSD 28.4812 16.0037 11.2359
emkin isotherm: qe = B1 ln(KTCe)KT (l/mg) 0.6845 0.6761 0.6519B1 9.5770 8.1368 7.5169R2 0.9874 0.9655 0.9674HYBRID 6.1072 16.0114 16.2277MPSD 38.6607 88.9240 80.4538
–P isotherm: qe = KRCe/(1 + aRCβe )
KR (l/mg) 210.8830 4.1773 4.3056aR 76.9157 0.8129 0.9459β 0.3030 0.5077 0.5222R2 0.8190 0.9703 0.9907HYBRID −4.0493 −1.2544 −0.4285MPSD 28.4402 14.6680 8.8838
ig. 11. Equilibrium isotherms for the adsorption of AN onto GAC at differentemperatures.
HYBRID) [25] and the Marquardt’s percent standard devia-ion (MPSD) error function [26] have been used previously by aumber of researchers in the field [5,6,9]. These error functions
YBRID = 100
n − p
n∑i
[qe,meas − qe,calc
qe,meas
]i
(8)
stem.
AN–GAC
333 K 303 K 313 K 323 K 333 K
0.0229 0.0370 0.0423 0.0345 0.023842.5183 46.6288 41.5545 39.1653 37.21380.9879 0.9873 0.9890 0.9770 0.97411.9496 0.5774 2.4043 2.9759 3.5568
27.1498 15.3297 13.6340 19.1517 25.8657
2.1319 2.5053 2.7483 2.4940 2.19900.5734 0.6405 0.5836 0.5590 0.52660.9846 0.9878 0.9934 0.9914 0.9934
−1.5343 −1.1965 −0.6262 −0.7669 −0.592319.2853 16.0037 11.4029 12.1977 11.2364
0.5590 0.6761 0.7668 0.6787 0.59326.7327 8.1368 7.3324 6.7654 5.94140.9350 0.9655 0.9728 0.9593 0.9424
13.6463 16.0114 14.7090 14.4891 13.6653104.4845 88.9240 59.9385 78.4516 88.0334
25.0326 4.1900 2.9840 5.8607 82.725310.8317 0.8180 0.3015 1.5362 36.7582
0.4428 0.5070 0.6957 0.5277 0.74800.9720 0.9703 0.9992 0.9887 0.9917
−1.6874 −1.2528 −0.0835 −0.7345 −0.618919.7610 14.6701 2.9459 11.5099 11.3591
5 rdous Materials 152 (2008) 589–600
M
eia
3
atiaa
3
icipifdiss
wltTi
aftcbCAie
cot1dFaTpat
Fo
atdatstoalthe amount of AN bound to the adsorbent is equal to qm/2. Thisindicates the affinity of the AN to bind with the adsorbents. Ahigh KL value indicates a higher affinity. The data in Table 3also indicate that the values of qm and KL decreased with an
98 A. Kumar et al. / Journal of Haza
PSD = 100
√√√√ 1
n − p
n∑i
∣∣∣∣qe,meas − qe,calc
qe,meas
∣∣∣∣2
t
(9)
HYBRID was developed to improve the fit of the square ofrrors function at low concentration values. The MPSD is similarn some respects to a geometric mean error distribution modifiedccording to the number of degrees of freedom of the system.
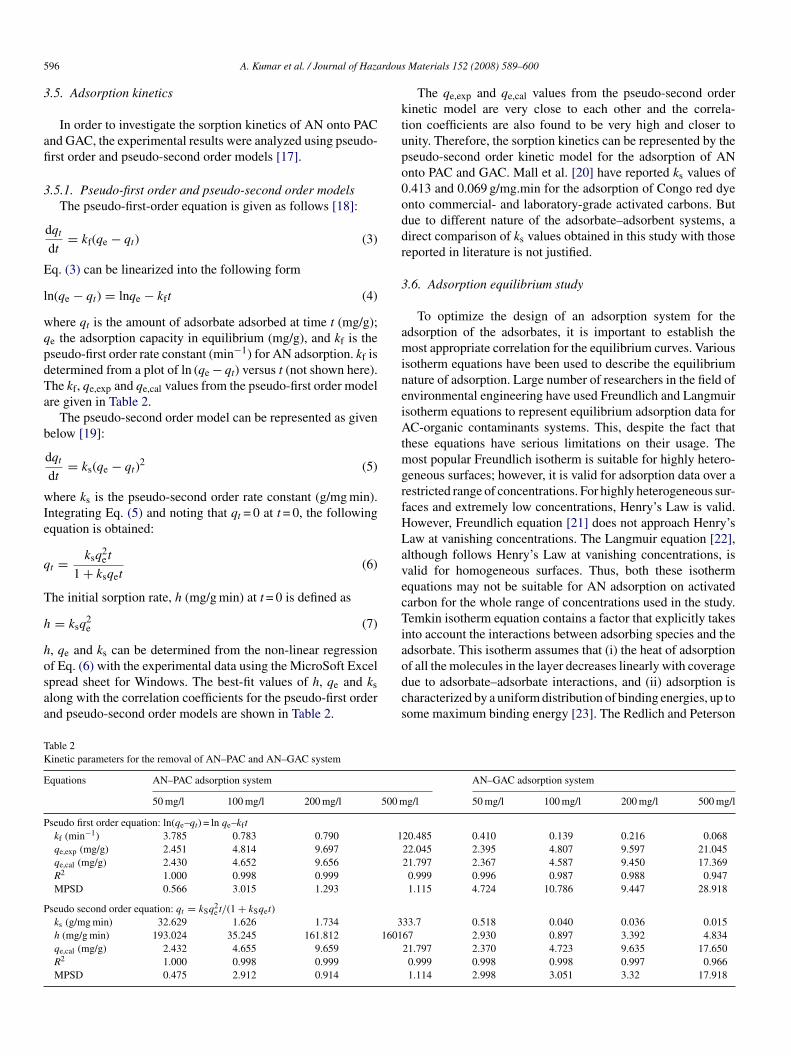
.6.1. Effect of temperatureEquilibrium isotherms for AN adsorption onto GAC and PAC
t various temperatures are shown in Figs. 10 and 11, respec-ively. It is found that the adsorption of AN decreases with anncrease in temperature. It can, therefore, be inferred that thedsorption is exothermic in nature. The trend obtained is ingreement with the general adsorption processes.
.6.2. Choosing best isotherm modelSince each of the error functions produces a different set of
sotherm parameters, an overall optimum parameter set is diffi-ult to identify directly. Thus, a normalization of each parameters employed in order to have a better comparison between thearameter sets for the single isotherm model [27]. In the normal-zation process, each error function was selected and the resultsor each parameter set were determined. Secondly, the errorsetermined for a given error function were divided by the max-mum error to obtain the normalized errors for each parameteret. Lastly, the normalized errors for each parameter set wereummed up.
Langmuir, Freundlich, Temkin, and R–P isotherm constantsere determined from the plots of 1/qe versus 1/Ce; ln qe versus
n Ce, qe versus ln Ce, and ln (KRCe/qe–1) versus ln Ce, respec-ively, at 303, 313, 323 and 333 K using MS Excel for Windows.he isotherm constants and R2 values for all the isotherms stud-
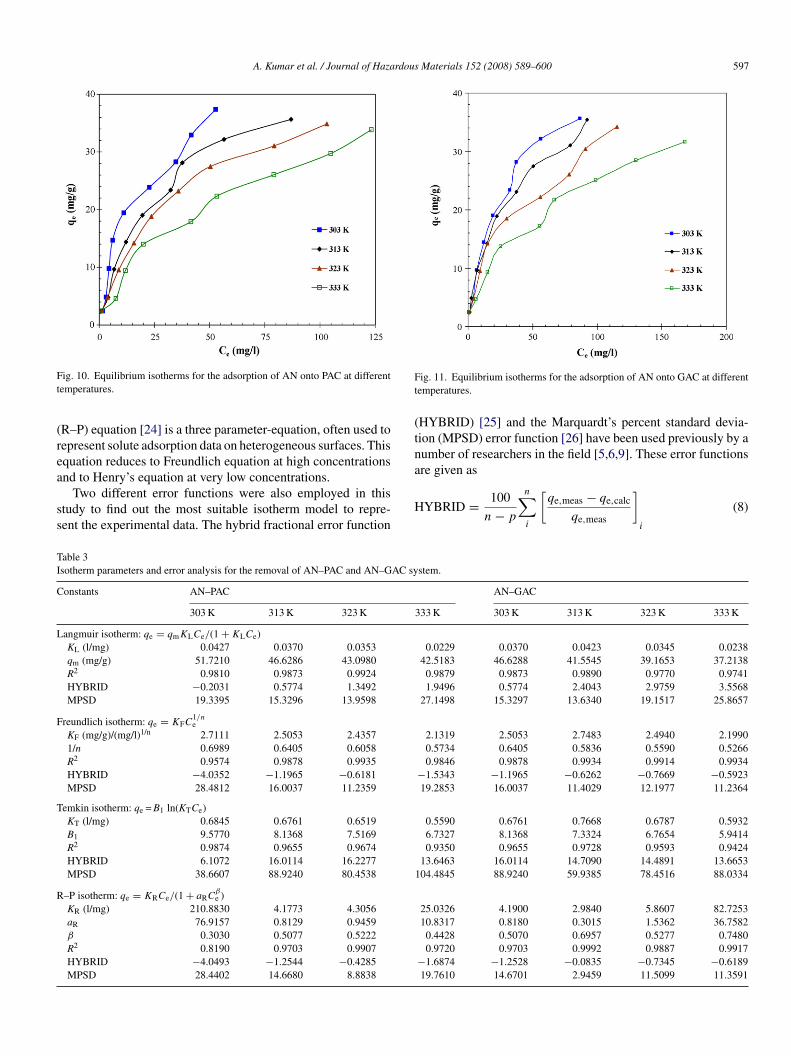
ed are listed in Table 3.Comparison of R2 values for various isotherms for AN–PAC
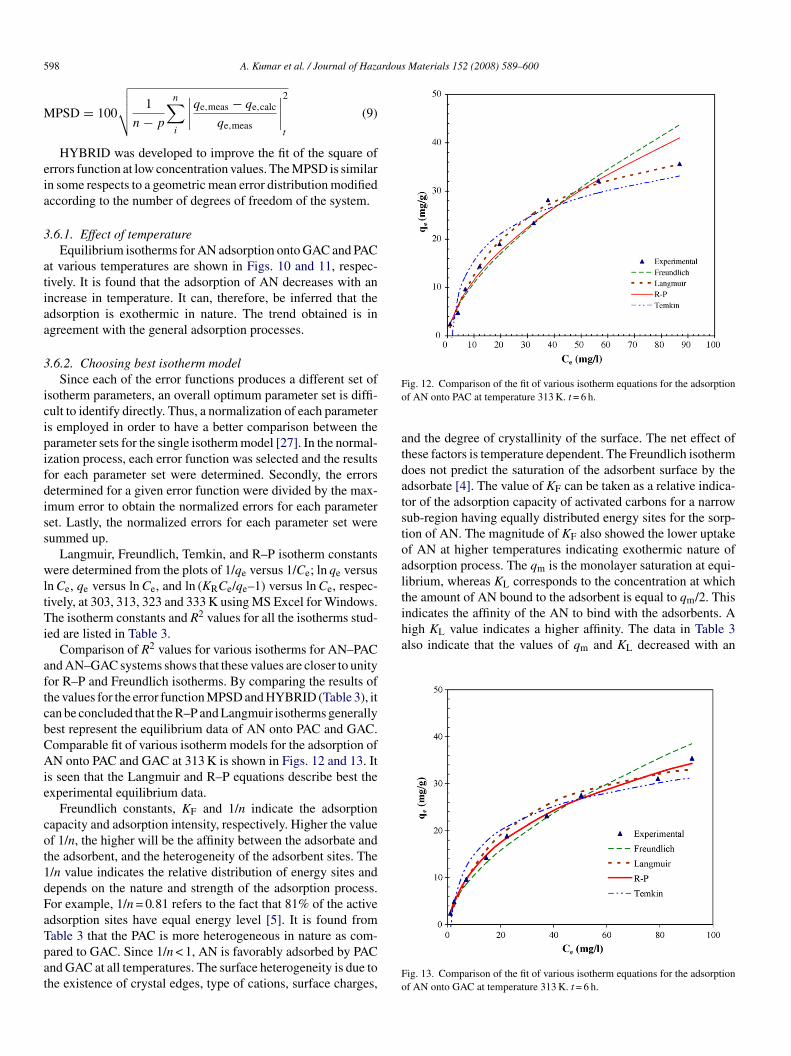
nd AN–GAC systems shows that these values are closer to unityor R–P and Freundlich isotherms. By comparing the results ofhe values for the error function MPSD and HYBRID (Table 3), itan be concluded that the R–P and Langmuir isotherms generallyest represent the equilibrium data of AN onto PAC and GAC.omparable fit of various isotherm models for the adsorption ofN onto PAC and GAC at 313 K is shown in Figs. 12 and 13. It
s seen that the Langmuir and R–P equations describe best thexperimental equilibrium data.
Freundlich constants, KF and 1/n indicate the adsorptionapacity and adsorption intensity, respectively. Higher the valuef 1/n, the higher will be the affinity between the adsorbate andhe adsorbent, and the heterogeneity of the adsorbent sites. The/n value indicates the relative distribution of energy sites andepends on the nature and strength of the adsorption process.or example, 1/n = 0.81 refers to the fact that 81% of the activedsorption sites have equal energy level [5]. It is found from
able 3 that the PAC is more heterogeneous in nature as com-ared to GAC. Since 1/n < 1, AN is favorably adsorbed by PACnd GAC at all temperatures. The surface heterogeneity is due tohe existence of crystal edges, type of cations, surface charges,Fo
ig. 12. Comparison of the fit of various isotherm equations for the adsorptionf AN onto PAC at temperature 313 K. t = 6 h.
nd the degree of crystallinity of the surface. The net effect ofhese factors is temperature dependent. The Freundlich isothermoes not predict the saturation of the adsorbent surface by thedsorbate [4]. The value of KF can be taken as a relative indica-or of the adsorption capacity of activated carbons for a narrowub-region having equally distributed energy sites for the sorp-ion of AN. The magnitude of KF also showed the lower uptakef AN at higher temperatures indicating exothermic nature ofdsorption process. The qm is the monolayer saturation at equi-ibrium, whereas KL corresponds to the concentration at which
ig. 13. Comparison of the fit of various isotherm equations for the adsorptionf AN onto GAC at temperature 313 K. t = 6 h.
A. Kumar et al. / Journal of Hazardous
FA
ioTpmr
3
pse
l
a
k
wtcdofTtT8tsfs
4
aAbowocasisoPRdaP
R
[
[
[
[
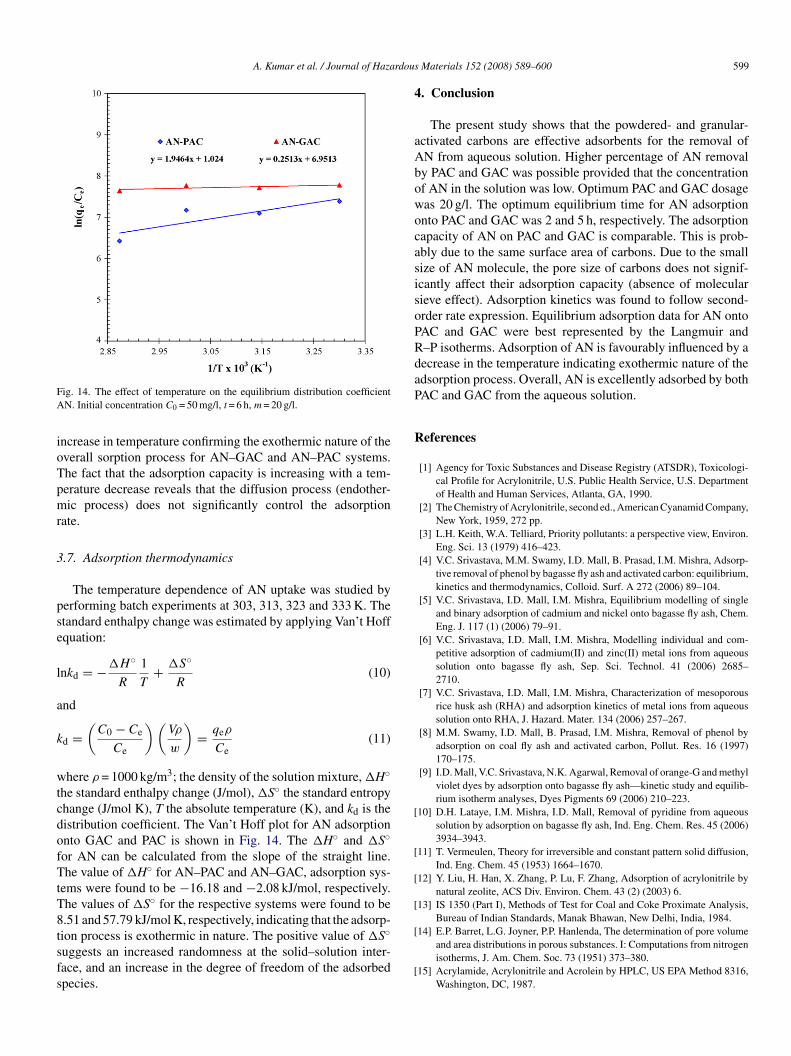
ig. 14. The effect of temperature on the equilibrium distribution coefficientN. Initial concentration C0 = 50 mg/l, t = 6 h, m = 20 g/l.
ncrease in temperature confirming the exothermic nature of theverall sorption process for AN–GAC and AN–PAC systems.he fact that the adsorption capacity is increasing with a tem-erature decrease reveals that the diffusion process (endother-ic process) does not significantly control the adsorption
ate.
.7. Adsorption thermodynamics
The temperature dependence of AN uptake was studied byerforming batch experiments at 303, 313, 323 and 333 K. Thetandard enthalpy change was estimated by applying Van’t Hoffquation:
nkd = −�H◦
R
1
T+ �S◦
R(10)
nd
d =(
C0 − Ce
Ce
) (Vρ
w
)= qeρ
Ce(11)
here ρ = 1000 kg/m3; the density of the solution mixture, �H◦he standard enthalpy change (J/mol), �S◦ the standard entropyhange (J/mol K), T the absolute temperature (K), and kd is theistribution coefficient. The Van’t Hoff plot for AN adsorptionnto GAC and PAC is shown in Fig. 14. The �H◦ and �S◦or AN can be calculated from the slope of the straight line.he value of �H◦ for AN–PAC and AN–GAC, adsorption sys-
ems were found to be −16.18 and −2.08 kJ/mol, respectively.he values of �S◦ for the respective systems were found to be
.51 and 57.79 kJ/mol K, respectively, indicating that the adsorp-ion process is exothermic in nature. The positive value of �S◦uggests an increased randomness at the solid–solution inter-ace, and an increase in the degree of freedom of the adsorbedpecies.[
[
Materials 152 (2008) 589–600 599
. Conclusion
The present study shows that the powdered- and granular-ctivated carbons are effective adsorbents for the removal ofN from aqueous solution. Higher percentage of AN removaly PAC and GAC was possible provided that the concentrationf AN in the solution was low. Optimum PAC and GAC dosageas 20 g/l. The optimum equilibrium time for AN adsorptionnto PAC and GAC was 2 and 5 h, respectively. The adsorptionapacity of AN on PAC and GAC is comparable. This is prob-bly due to the same surface area of carbons. Due to the smallize of AN molecule, the pore size of carbons does not signif-cantly affect their adsorption capacity (absence of molecularieve effect). Adsorption kinetics was found to follow second-rder rate expression. Equilibrium adsorption data for AN ontoAC and GAC were best represented by the Langmuir and–P isotherms. Adsorption of AN is favourably influenced by aecrease in the temperature indicating exothermic nature of thedsorption process. Overall, AN is excellently adsorbed by bothAC and GAC from the aqueous solution.
eferences
[1] Agency for Toxic Substances and Disease Registry (ATSDR), Toxicologi-cal Profile for Acrylonitrile, U.S. Public Health Service, U.S. Departmentof Health and Human Services, Atlanta, GA, 1990.
[2] The Chemistry of Acrylonitrile, second ed., American Cyanamid Company,New York, 1959, 272 pp.
[3] L.H. Keith, W.A. Telliard, Priority pollutants: a perspective view, Environ.Eng. Sci. 13 (1979) 416–423.
[4] V.C. Srivastava, M.M. Swamy, I.D. Mall, B. Prasad, I.M. Mishra, Adsorp-tive removal of phenol by bagasse fly ash and activated carbon: equilibrium,kinetics and thermodynamics, Colloid. Surf. A 272 (2006) 89–104.
[5] V.C. Srivastava, I.D. Mall, I.M. Mishra, Equilibrium modelling of singleand binary adsorption of cadmium and nickel onto bagasse fly ash, Chem.Eng. J. 117 (1) (2006) 79–91.
[6] V.C. Srivastava, I.D. Mall, I.M. Mishra, Modelling individual and com-petitive adsorption of cadmium(II) and zinc(II) metal ions from aqueoussolution onto bagasse fly ash, Sep. Sci. Technol. 41 (2006) 2685–2710.
[7] V.C. Srivastava, I.D. Mall, I.M. Mishra, Characterization of mesoporousrice husk ash (RHA) and adsorption kinetics of metal ions from aqueoussolution onto RHA, J. Hazard. Mater. 134 (2006) 257–267.
[8] M.M. Swamy, I.D. Mall, B. Prasad, I.M. Mishra, Removal of phenol byadsorption on coal fly ash and activated carbon, Pollut. Res. 16 (1997)170–175.
[9] I.D. Mall, V.C. Srivastava, N.K. Agarwal, Removal of orange-G and methylviolet dyes by adsorption onto bagasse fly ash—kinetic study and equilib-rium isotherm analyses, Dyes Pigments 69 (2006) 210–223.
10] D.H. Lataye, I.M. Mishra, I.D. Mall, Removal of pyridine from aqueoussolution by adsorption on bagasse fly ash, Ind. Eng. Chem. Res. 45 (2006)3934–3943.
11] T. Vermeulen, Theory for irreversible and constant pattern solid diffusion,Ind. Eng. Chem. 45 (1953) 1664–1670.
12] Y. Liu, H. Han, X. Zhang, P. Lu, F. Zhang, Adsorption of acrylonitrile bynatural zeolite, ACS Div. Environ. Chem. 43 (2) (2003) 6.
13] IS 1350 (Part I), Methods of Test for Coal and Coke Proximate Analysis,Bureau of Indian Standards, Manak Bhawan, New Delhi, India, 1984.
14] E.P. Barret, L.G. Joyner, P.P. Hanlenda, The determination of pore volumeand area distributions in porous substances. I: Computations from nitrogenisotherms, J. Am. Chem. Soc. 73 (1951) 373–380.
15] Acrylamide, Acrylonitrile and Acrolein by HPLC, US EPA Method 8316,Washington, DC, 1987.
6 rdous
[
[
[
[
[
[
[
[
[
[
00 A. Kumar et al. / Journal of Haza
16] R.D. Vidic, M.T. Suidan, Role of dissolved oxygen on the adsorptive capac-ity of activated carbon for synthetic and natural organic matter, Environ.Sci. Technol. 25 (1991) 1612–1618.
17] V.C. Srivastava, I.D. Mall, N.K. Agarwal, I.M. Mishra, Adsorptive removalof malachite green dye from aqueous solution by bagasse fly ash and acti-vated carbon—kinetic study and equilibrium isotherm analyses, Colloid.Surf. A 260 (2005) 17–28.
18] C.J. Rivard, K. Grohmann, Degradation of furfural (2-furaldehyde) tomethane and carbon dioxide by an anaerobic consortium, Appl. Biochem.Biotech. 28/29 (1991) 285–295.
19] Y.S. Ho, G. McKay, Pseudo-second order model for sorption processes,
Process Biochem. 34 (1999) 451–465.20] V.C. Srivastava, I.D. Mall, N.K. Agarwal, I.M. Mishra, Removal of congo-red from aqueous solution by bagasse fly ash and activated carbon:kinetic study and equilibrium isotherm analyses, Chemosphere 61 (2005)492–501.
[
[
Materials 152 (2008) 589–600
21] H.M.F. Freundlich, Over the adsorption in solution, J. Phys. Chem. 57(1906) 385–471.
22] I. Langmuir, The adsorption of gases on plane surfaces of glass, mica, andplatinum, J. Am. Chem. Soc. 40 (1918) 1361–1403.
23] M.J. Temkin, V. Pyzhev, Kinetics of ammonia synthesis on promoted ironcatalysts, Acta Physicochim. URSS 12 (1940) 327–356.
24] O. Redlich, D.L. Peterson, A useful adsorption isotherm, J. Phys. Chem.63 (1959) 1024–1026.
25] J.F. Porter, G. McKay, K.H. Choy, The prediction of sorption from a binarymixture of acidic dyes using single- and mixed-isotherm variants of theideal adsorbed solute theory, Chem. Eng. Sci. 54 (1999) 5863–5885.
26] D.W. Marquardt, An algorithm for least squares estimation of nonlinearparameters, J. Soc. Ind. Appl. Math. 11 (1963) 431–441.
27] Y.C. Wong, Y.S. Szeto, W.H. Cheung, G. McKay, Adsorption of acid dyeson chitosan—equilibrium isotherm analyses, Process Biochem. 39 (2004)693–702.