Embed Size (px)
Citation preview
8/8/2019 Adsorptive of Congo
http://slidepdf.com/reader/full/adsorptive-of-congo 1/7
Colloids and Surfaces A: Physicochem. Eng. Aspects 299 (2007) 146–152
Adsorptive removal of congo red, a carcinogenic textile dye by chitosanhydrobeads: Binding mechanism, equilibrium and kinetics
Sandipan Chatterjee, Sudipta Chatterjee, Bishnu P. Chatterjee, Arun K. Guha ∗
Department of Biological Chemistry, Indian Association for the Cultivation of Science, Jadavpur, Kolkata 700032, India
Received 21 November 2005; received in revised form 10 November 2006; accepted 15 November 2006
Available online 25 November 2006
Abstract
Physico-chemical investigation on adsorption of congo red, an anionic azo dye by chitosan hydrobeads has been carried out. Adsorption processhas been found to be dependant on temperature with optimum activity at 30 ◦C. Both ionic interaction as well as physical forces is responsible for
binding of congo red with chitosan. Theoretical correlation of the experimental equilibrium adsorption data for congo red–chitosan hydrobeads
systemwould be best explained by linearized form of Langmuir isothermmodel.The kinetic results followpseudo second-order rate equation.pH of
the experimental solution influenced congo red adsorption inversely, and ∼20.0% of the dye could be desorbed from the loaded beads by changing
thepH of thesolutionto alkaline range (∼pH 12.0). Bothsodium chlorideandsodium dodecyl sulfatesignificantly influencedthe adsorptionprocess.
© 2006 Elsevier B.V. All rights reserved.
Keywords: Chitosan hydrobeads; Congo red; Adsorption; Binding mechanism; Zeta potential
1. Introduction
Annual production of textile dyes is estimated to be over8× 105 tonnes of which 10% are discharged as effluents [1].
Release of these dyes in water stream is aesthetically unde-
sirable and has serious environmental impact. Due to intense
colour theyreduce sunlight transmission intowater henceaffect-
ing aquatic plants, which ultimately disturb aquatic ecosystem
[2]; in addition they are toxic to humans also. Due to the strong
environmental regulation, removal of dyes is necessary before
discharging into water bodies. Most of the textile dyes belong
to the azo groups. Being electron deficient in nature, they are
less susceptible to oxidative catabolism [3] and generally non-
biodegradable. Only a few can be degraded microbiologically
under anaerobic condition [4] but in most cases with the pro-
duction of carcinogenic amines [5] and mutagens [6].
Conventional procedures to remove dye from wastewater
such as activated sludge, bacterial and chemical oxidation,
ozonisation or physical methods like membrane filtration, ion
∗ Correspondingauthor at: Department of Biological Chemistry, Indian Asso-
ciation forthe Cultivationof Science, 2 A&BRajaS. C. MullickRoad,Jadavpur,
Kolkata 700032, India. Tel.: +91 33 2473 5904/4971x502;
fax: +91 33 2473 2805.
E-mail address: [email protected](A.K. Guha).
exchange or electrochemical techniques are either expensive or
inadequate [7–13]. Solid phase extraction, commonly known as
sorption, is the recent technology to remove dye from wastew-ater. Activated carbon is widely used as adsorbent [14] f or this
purpose but high procuring and processing cost restricted its
use in many countries. This promoted search for alternative
cost effective adsorbent. Recently different low cost adsorbents
including some industrial and agricultural wastes [15–22], such
as fly ash, fuller’s earth, waste red mud, bentonite clay, metal
hydroxide sludge, peat, pith, cotton waste, rice husk, teakwood
bark, etc. have been used but their effectiveness is limited and
inferior to that of activated carbon. Adsorption capacity of the
biological materials like coir pith [23], banana and orange peel
[24] particularly towards anionic dye is very poor. Biological
materials generally contain high amount of celluloseand adsorb
anionic dye in a reversible process involving physical adsorption
as against basic dyes where adsorption occurs there coulombic
attraction and ion exchange process [25].
The biopolymer chitosan has gained importance in environ-
mental biotechnology due to its very good adsorption capacity
towardsdyes andmetal ions [26–28]. Moreover, chitosan can be
obtained at industrial scale by chemical deacetylation of crus-
tacean chitin, bye product of seafood industry. Further, chitosan
in the form of swollen beads has been found to exhibit better
adsorption capacity than flakes [29].
0927-7757/$ – see front matter © 2006 Elsevier B.V. All rights reserved.
doi:10.1016/j.colsurfa.2006.11.036
8/8/2019 Adsorptive of Congo
http://slidepdf.com/reader/full/adsorptive-of-congo 2/7
S. Chatterjee et al. / Colloids and Surfaces A: Physicochem. Eng. Aspects 299 (2007) 146–152 147
Objective of the present investigation is to study the efficacy
of chitosan in the form of hydrobeads to remove congo red,
a member of anionic azo dyes, from its aqueous solution and
to investigate the dye-chitosan interaction during adsorption in
single component system as well as in presence of different
industrial contaminants.
2. Materials and methods
2.1. Chemicals
Chitosan used in the present investigation was prepared from
shrimp shell by modified Hackmann procedure as describedear-
lier [30]. Average molecular weight and degree of deacetylation
of this chitosan were 398kDa and90.8%, respectively. All other
chemicals were of analytical grade and procured from BDH,
England.
2.2. Preparation of chitosan beads
Chitosan hydrobeads were prepared by drop-wise addition
of 3% chitosan solution (w/v) in 7% AcOH (w/v) to an alka-
line coagulating mixture (H2O: MeOH:NaOH:: 4:5:1, w/w) as
described by Mitani et al. [31]. The beads were spherical in
shape with an average diameter ∼2.5 mm as determined with
electronicmicrovernier caliper. Before use, chitosan beads were
kept for 30 min in water of pH adjusted to that required for
different experimental conditions.
2.3. Preparation of congo red solution and analytical
measurements
Stock solution of congo red (1 g/l) was prepared in deion-
ized water and desired concentrations of the dye were obtained
by diluting the same with water. Calibration curve of congo
red was prepared by measuring absorbance of different prede-
termined concentrations of the samples at λmax 497nm using
UV–vis spectrophotometer (Varian Carry 50). Concentration of
dye in the experimental solution was calculated from the linear
regression equation(OD= 0.046× concentration of dyein mg/l)
of the calibration curve. Adsorption of dye by 1 g of chitosan in
the form of hydrobeads was determined by the following mass
balance equation.
q = (Ci−Cf )
×V
1000×W
where q represents theamountof dyeadsorbed,C i and C f are the
initial andfinal concentration (mg/ml) of dye after adsorption. V
is the volume (ml) of experimental solution and W is the weight
(g) of chitosan in form of hydrobeads.
2.4. Scanning electron micrograph (SEM) studies
Chitosan beads beforeandafter adsorption of congo redwere
dried initially at 70 ◦C for 48 h and finally for 24 h after increas-
ing the temperature to 105 ◦C. Beads were kept in a desiccator
untiluse.The scanningelectron microscope (SEM)photographs
were taken in a Hitachi model S-415A scanning electron micro-
scope after coating the beads with gold by elctro-deposition
under vacuum.
2.5. Mesurement of zeta potential
Dry powder of chitosan beads (0.2 g) was added to 200 mldeionized water and pH of the suspension was adjusted with
0.1N NaOH or HCl to the desired level. The mixture was
stirred for 24h and then allowed to settle for 12h. Supernatant
containing some small particleswasused for zeta potentialmea-
surements in zetananoseries instrument(Malvern Instruments).
2.6. Equilibrium studies
Fifty millilitres aqueous solution of congo red (pH∼6.0, nat-
ural) with predetermined initial concentration (1–500 mg/l) was
taken in different 250-ml Erlenmeyer flasks. Swollen chitosan
hydrobeads (1 g) having water content of 96.4% were added to
each flask. The flasks were agitated (50 rpm) at 30± 1 ◦C for
48 h, which is expected to be far beyond the time required to
reach equilibrium. At the end of incubation, beads were sepa-
rated by filtration through glass wool and concentration of the
dye in the solution was estimated spectrophtometrically. The
same experiment was repeated at two different temperatures
(viz., 40 ◦C and 50 ◦C).
2.7. Adsorption dynamics
The above experiment was repeated with 500-mg/l congo
red solution at 30 ◦C and concentration of dye in the solution
was determined at different time intervals. Each data point wasobtained from individual flask and therefore no correction was
necessary due to withdrawal of sampling volume [32].
2.8. Influence of pH
Influence of pH on the adsorption process was studied over a
range 3.0 to 12.0. Other conditions were the same as described
in kinetic study, and dye concentration was measured after 10 h.
2.9. Influence of sodium chloride, sodium dodecyl sulphate
and desorption studies
Influence of sodium chloride and sodium dodecyl sulphate
on dye adsorption was studied in similar way as described in pH
experiment. Congo red solution contained either sodium chlo-
ride (0.5M and 1 M) or sodium dodecyl sulfate (1% and 2%,
w/v); pH of the solution was maintained at 6.0.
After kinetic experiment, dye-loaded chitosan hydrobeads
(1 g) obtained by filtrationandwashing with water through glass
wool were taken in different 250-ml Erlenmeyer flasks. Fifty
millilitres water having pH adjusted to 8–12 or 50 ml ethanol,
methanol, propanol, ether, acetone was added to each flask. The
flasks were agitated (50 rpm) for 24h at30 ◦C and concentration
of the dye in the supernatant was estimated.
8/8/2019 Adsorptive of Congo
http://slidepdf.com/reader/full/adsorptive-of-congo 3/7
148 S. Chatterjee et al. / Colloids and Surfaces A: Physicochem. Eng. Aspects 299 (2007) 146–152
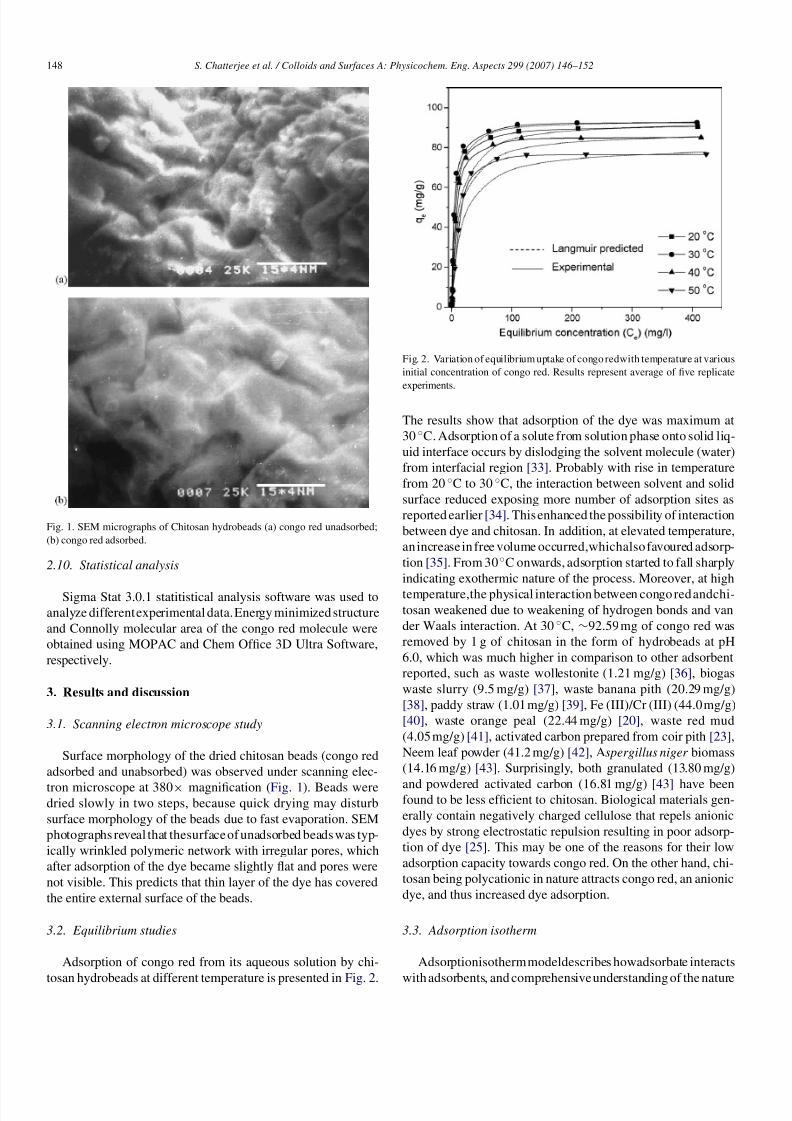
Fig. 1. SEM micrographs of Chitosan hydrobeads (a) congo red unadsorbed;
(b) congo red adsorbed.
2.10. Statistical analysis
Sigma Stat 3.0.1 statitistical analysis software was used to
analyze differentexperimental data.Energy minimizedstructure
and Connolly molecular area of the congo red molecule were
obtained using MOPAC and Chem Office 3D Ultra Software,
respectively.
3. Results and discussion
3.1. Scanning electron microscope study
Surface morphology of the dried chitosan beads (congo red
adsorbed and unabsorbed) was observed under scanning elec-
tron microscope at 380× magnification (Fig. 1). Beads weredried slowly in two steps, because quick drying may disturb
surface morphology of the beads due to fast evaporation. SEM
photographs reveal that thesurfaceof unadsorbed beadswas typ-
ically wrinkled polymeric network with irregular pores, which
after adsorption of the dye became slightly flat and pores were
not visible. This predicts that thin layer of the dye has covered
the entire external surface of the beads.
3.2. Equilibrium studies
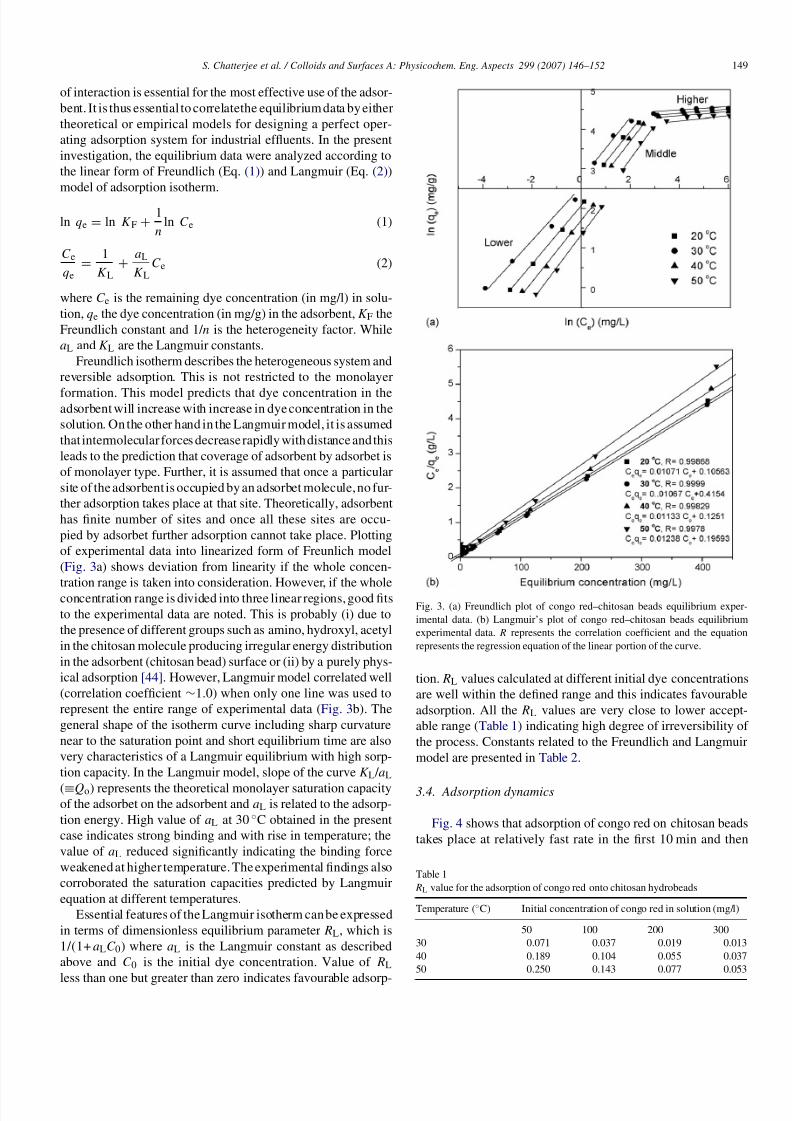
Adsorption of congo red from its aqueous solution by chi-
tosan hydrobeads at different temperature is presented in Fig. 2.
Fig. 2. Variation of equilibrium uptake of congo redwith temperature at various
initial concentration of congo red. Results represent average of five replicate
experiments.
The results show that adsorption of the dye was maximum at
30 ◦C. Adsorption of a solute from solution phase onto solid liq-
uid interface occurs by dislodging the solvent molecule (water)
from interfacial region [33]. Probably with rise in temperature
from 20 ◦C to 30 ◦C, the interaction between solvent and solid
surface reduced exposing more number of adsorption sites as
reported earlier [34]. Thisenhanced the possibility of interaction
between dye and chitosan. In addition, at elevated temperature,
anincrease in free volume occurred,whichalsofavoured adsorp-
tion [35]. From 30 ◦C onwards, adsorption started to fall sharply
indicating exothermic nature of the process. Moreover, at high
temperature,the physical interaction between congoredandchi-tosan weakened due to weakening of hydrogen bonds and van
der Waals interaction. At 30 ◦C, ∼92.59mg of congo red was
removed by 1 g of chitosan in the form of hydrobeads at pH
6.0, which was much higher in comparison to other adsorbent
reported, such as waste wollestonite (1.21 mg/g) [36], biogas
waste slurry (9.5 mg/g) [37], waste banana pith (20.29 mg/g)
[38], paddy straw (1.01mg/g) [39], Fe (III)/Cr (III) (44.0mg/g)
[40], waste orange peal (22.44 mg/g) [20], waste red mud
(4.05mg/g) [41], activated carbon prepared from coir pith [23],
Neem leaf powder (41.2 mg/g) [42], Aspergillus niger biomass
(14.16 mg/g) [43]. Surprisingly, both granulated (13.80 mg/g)
and powdered activated carbon (16.81 mg/g) [43] have beenfound to be less efficient to chitosan. Biological materials gen-
erally contain negatively charged cellulose that repels anionic
dyes by strong electrostatic repulsion resulting in poor adsorp-
tion of dye [25]. This may be one of the reasons for their low
adsorption capacity towards congo red. On the other hand, chi-
tosan being polycationic in nature attracts congo red, an anionic
dye, and thus increased dye adsorption.
3.3. Adsorption isotherm
Adsorptionisothermmodeldescribes howadsorbate interacts
withadsorbents, and comprehensiveunderstanding of the nature
8/8/2019 Adsorptive of Congo
http://slidepdf.com/reader/full/adsorptive-of-congo 4/7
S. Chatterjee et al. / Colloids and Surfaces A: Physicochem. Eng. Aspects 299 (2007) 146–152 149
of interaction is essential for the most effective use of the adsor-
bent. It is thus essential to correlatethe equilibriumdata byeither
theoretical or empirical models for designing a perfect oper-
ating adsorption system for industrial effluents. In the present
investigation, the equilibrium data were analyzed according to
the linear form of Freundlich (Eq. (1)) and Langmuir (Eq. (2))
model of adsorption isotherm.
ln qe = ln KF +1
nln Ce (1)
Ce
qe=
1
KL+
aL
KLCe (2)
where C e is the remaining dye concentration (in mg/l) in solu-
tion, qe the dye concentration (in mg/g) in the adsorbent, K F the
Freundlich constant and 1/ n is the heterogeneity factor. While
aL and K L are the Langmuir constants.
Freundlich isotherm describes the heterogeneous system and
reversible adsorption. This is not restricted to the monolayer
formation. This model predicts that dye concentration in theadsorbent will increase with increase in dyeconcentration in the
solution. Onthe other hand in the Langmuir model, it is assumed
that intermolecularforces decreaserapidly withdistanceandthis
leads to the prediction that coverage of adsorbent by adsorbet is
of monolayer type. Further, it is assumed that once a particular
site of theadsorbent is occupied by an adsorbet molecule,no fur-
ther adsorption takes place at that site. Theoretically, adsorbent
has finite number of sites and once all these sites are occu-
pied by adsorbet further adsorption cannot take place. Plotting
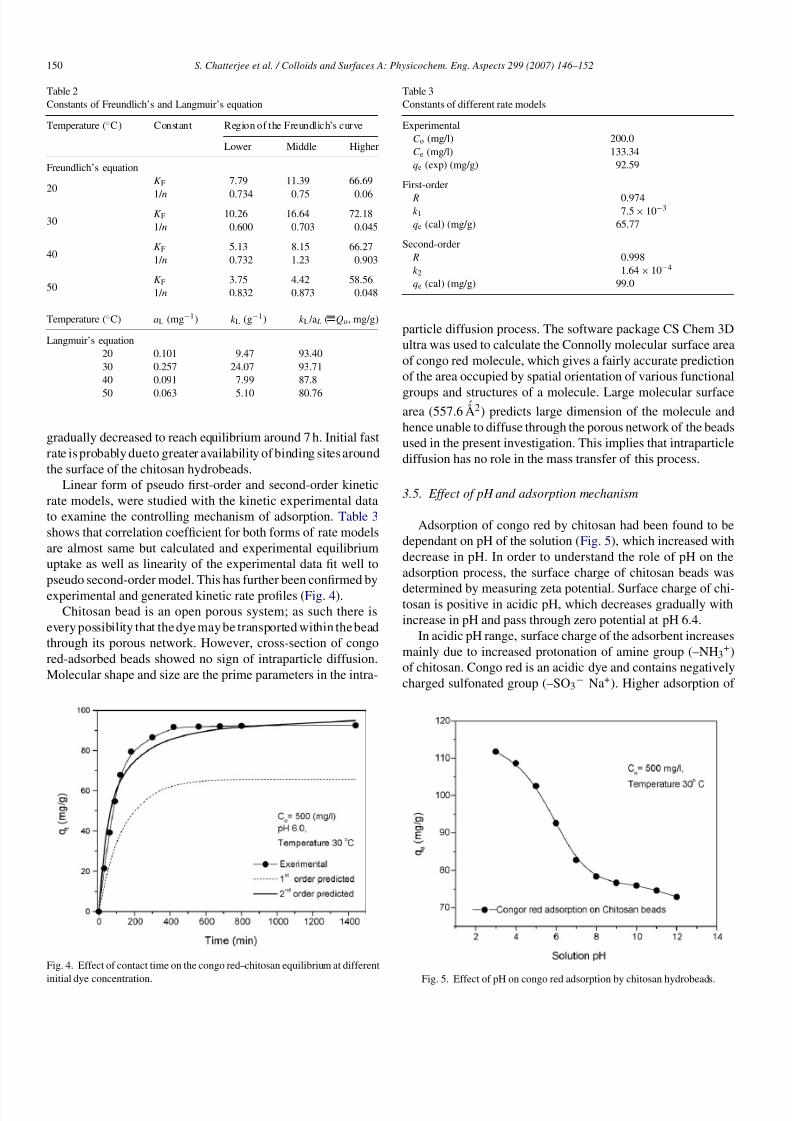
of experimental data into linearized form of Freunlich model
(Fig. 3a) shows deviation from linearity if the whole concen-
tration range is taken into consideration. However, if the wholeconcentration range is divided into three linear regions,good fits
to the experimental data are noted. This is probably (i) due to
the presence of different groups such as amino, hydroxyl, acetyl
in the chitosan molecule producing irregular energy distribution
in the adsorbent (chitosan bead) surface or (ii) by a purely phys-
ical adsorption [44]. However, Langmuir model correlated well
(correlation coefficient ∼1.0) when only one line was used to
represent the entire range of experimental data (Fig. 3b). The
general shape of the isotherm curve including sharp curvature
near to the saturation point and short equilibrium time are also
very characteristics of a Langmuir equilibrium with high sorp-
tion capacity. In the Langmuir model, slope of the curve K L / aL
(≡Qo) represents the theoretical monolayer saturation capacityof the adsorbet on the adsorbent and aL is related to the adsorp-
tion energy. High value of aL at 30 ◦C obtained in the present
case indicates strong binding and with rise in temperature; the
value of aL reduced significantly indicating the binding force
weakenedat higher temperature. Theexperimental findings also
corroborated the saturation capacities predicted by Langmuir
equation at different temperatures.
Essential features of theLangmuir isotherm canbe expressed
in terms of dimensionless equilibrium parameter RL, which is
1/(1+ aLC 0) where aL is the Langmuir constant as described
above and C 0 is the initial dye concentration. Value of RL
less than one but greater than zero indicates favourable adsorp-
Fig. 3. (a) Freundlich plot of congo red–chitosan beads equilibrium exper-
imental data. (b) Langmuir’s plot of congo red–chitosan beads equilibrium
experimental data. R represents the correlation coefficient and the equation
represents the regression equation of the linear portion of the curve.
tion. RL values calculated at different initial dye concentrations
are well within the defined range and this indicates favourable
adsorption. All the RL values are very close to lower accept-
able range (Table 1) indicating high degree of irreversibility of
the process. Constants related to the Freundlich and Langmuir
model are presented in Table 2.
3.4. Adsorption dynamics
Fig. 4 shows that adsorption of congo red on chitosan beads
takes place at relatively fast rate in the first 10 min and then
Table 1
RL value for the adsorption of congo red onto chitosan hydrobeads
Temperature (◦C) Initial concentration of congo red in solution (mg/l)
50 100 200 300
30 0.071 0.037 0.019 0.013
40 0.189 0.104 0.055 0.037
50 0.250 0.143 0.077 0.053
8/8/2019 Adsorptive of Congo
http://slidepdf.com/reader/full/adsorptive-of-congo 5/7
150 S. Chatterjee et al. / Colloids and Surfaces A: Physicochem. Eng. Aspects 299 (2007) 146–152
Table 2
Constants of Freundlich’s and Langmuir’s equation
Temperature (◦C) Constant Region of the Freundlich’s curve
Lower Middle Higher
Freundlich’s equation
20K F 7.79 11.39 66.69
1/ n 0.734 0.75 0.06
30K F 10.26 16.64 72.18
1/ n 0.600 0.703 0.045
40K F 5.13 8.15 66.27
1/ n 0.732 1.23 0.903
50K F 3.75 4.42 58.56
1/ n 0.832 0.873 0.048
Temperature (◦C) aL (mg−1) k L (g−1) k L /a L ( Qo, mg/g)
Langmuir’s equation
20 0.101 9.47 93.40
30 0.257 24.07 93.71
40 0.091 7.99 87.8
50 0.063 5.10 80.76
gradually decreased to reach equilibrium around 7 h. Initial fast
rate isprobably dueto greater availability of binding sitesaround
the surface of the chitosan hydrobeads.
Linear form of pseudo first-order and second-order kinetic
rate models, were studied with the kinetic experimental data
to examine the controlling mechanism of adsorption. Table 3
shows that correlation coefficient for both forms of rate models
are almost same but calculated and experimental equilibrium
uptake as well as linearity of the experimental data fit well to
pseudo second-order model. This has further been confirmed by
experimental and generated kinetic rate profiles (Fig. 4).
Chitosan bead is an open porous system; as such there is
every possibility that thedyemaybe transported within thebead
through its porous network. However, cross-section of congo
red-adsorbed beads showed no sign of intraparticle diffusion.
Molecular shape and size are the prime parameters in the intra-
Fig. 4. Effect of contact time on the congo red–chitosan equilibrium at different
initial dye concentration.
Table 3
Constants of different rate models
Experimental
C o (mg/l) 200.0
C e (mg/l) 133.34
qe (exp) (mg/g) 92.59
First-order
R 0.974k 1 7.5× 10⁻³
qe (cal) (mg/g) 65.77
Second-order
R 0.998
k 2 1.64×10⁻⁴
qe (cal) (mg/g) 99.0
particle diffusion process. The software package CS Chem 3D
ultra was used to calculate the Connolly molecular surface area
of congo red molecule, which gives a fairly accurate prediction
of the area occupied by spatial orientation of various functional
groups and structures of a molecule. Large molecular surfacearea (557.6 ´̊A2) predicts large dimension of the molecule and
hence unable to diffuse through the porous network of the beads
used in the present investigation. This implies that intraparticle
diffusion has no role in the mass transfer of this process.
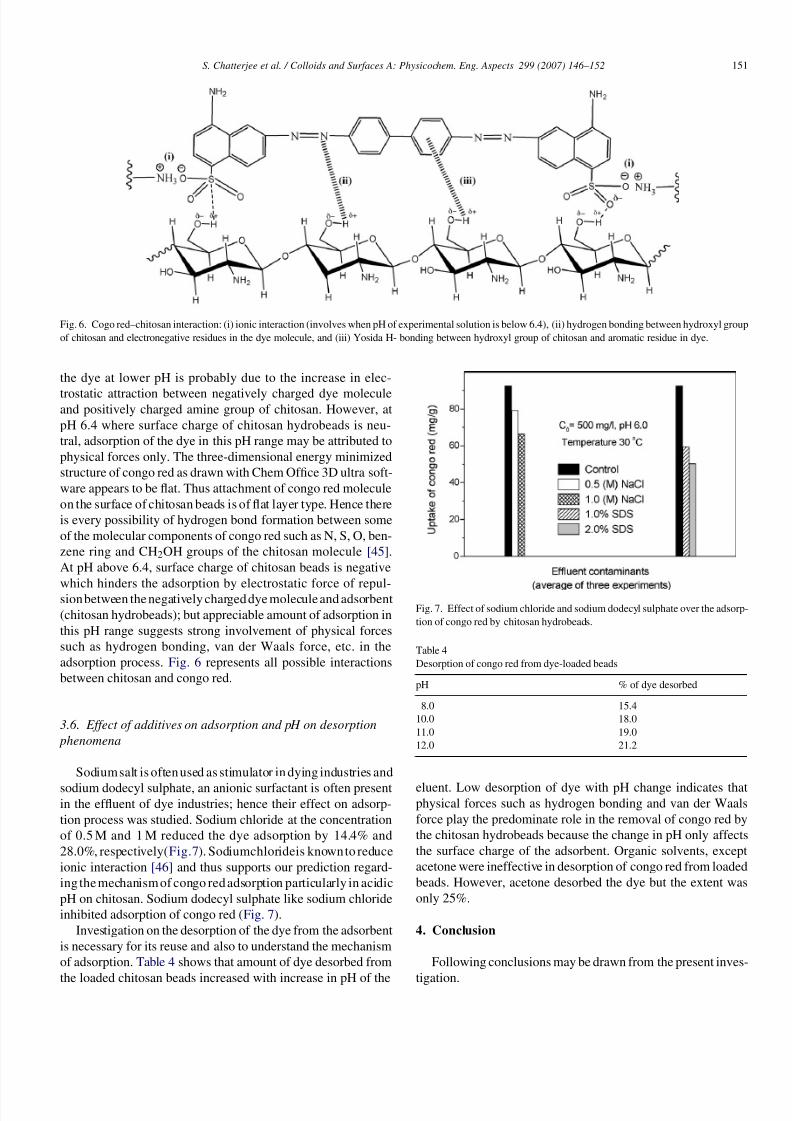
3.5. Effect of pH and adsorption mechanism
Adsorption of congo red by chitosan had been found to be
dependant on pH of the solution (Fig. 5), which increased with
decrease in pH. In order to understand the role of pH on the
adsorption process, the surface charge of chitosan beads was
determined by measuring zeta potential. Surface charge of chi-tosan is positive in acidic pH, which decreases gradually with
increase in pH and pass through zero potential at pH 6.4.
In acidic pH range, surface charge of the adsorbent increases
mainly due to increased protonation of amine group (–NH3+)
of chitosan. Congo red is an acidic dye and contains negatively
charged sulfonated group (–SO3− Na+). Higher adsorption of
Fig. 5. Effect of pH on congo red adsorption by chitosan hydrobeads.
8/8/2019 Adsorptive of Congo
http://slidepdf.com/reader/full/adsorptive-of-congo 6/7
S. Chatterjee et al. / Colloids and Surfaces A: Physicochem. Eng. Aspects 299 (2007) 146–152 151
Fig. 6. Cogo red–chitosan interaction: (i) ionic interaction (involves when pH of experimental solution is below 6.4), (ii) hydrogen bonding between hydroxyl group
of chitosan and electronegative residues in the dye molecule, and (iii) Yosida H- bonding between hydroxyl group of chitosan and aromatic residue in dye.
the dye at lower pH is probably due to the increase in elec-
trostatic attraction between negatively charged dye moleculeand positively charged amine group of chitosan. However, at
pH 6.4 where surface charge of chitosan hydrobeads is neu-
tral, adsorption of the dye in this pH range may be attributed to
physical forces only. The three-dimensional energy minimized
structure of congo red as drawn with Chem Office 3D ultra soft-
ware appears to be flat. Thus attachment of congo red molecule
on the surface of chitosan beads is of flat layer type. Hence there
is every possibility of hydrogen bond formation between some
of the molecular components of congo red such as N, S, O, ben-
zene ring and CH2OH groups of the chitosan molecule [45].
At pH above 6.4, surface charge of chitosan beads is negative
which hinders the adsorption by electrostatic force of repul-sionbetween thenegatively chargeddye moleculeand adsorbent
(chitosan hydrobeads); but appreciable amount of adsorption in
this pH range suggests strong involvement of physical forces
such as hydrogen bonding, van der Waals force, etc. in the
adsorption process. Fig. 6 represents all possible interactions
between chitosan and congo red.
3.6. Effect of additives on adsorption and pH on desorption
phenomena
Sodiumsalt is oftenused as stimulator in dying industries and
sodium dodecyl sulphate, an anionic surfactant is often presentin the effluent of dye industries; hence their effect on adsorp-
tion process was studied. Sodium chloride at the concentration
of 0.5 M and 1 M reduced the dye adsorption by 14.4% and
28.0%, respectively(Fig.7). Sodiumchlorideis knownto reduce
ionic interaction [46] and thus supports our prediction regard-
ing themechanismof congo redadsorption particularly in acidic
pH on chitosan. Sodium dodecyl sulphate like sodium chloride
inhibited adsorption of congo red (Fig. 7).
Investigation on the desorption of the dye from the adsorbent
is necessary for its reuse and also to understand the mechanism
of adsorption. Table 4 shows that amount of dye desorbed from
the loaded chitosan beads increased with increase in pH of the
Fig. 7. Effect of sodium chloride and sodium dodecyl sulphate over the adsorp-
tion of congo red by chitosan hydrobeads.
Table 4
Desorption of congo red from dye-loaded beads
pH % of dye desorbed
8.0 15.4
10.0 18.0
11.0 19.0
12.0 21.2
eluent. Low desorption of dye with pH change indicates thatphysical forces such as hydrogen bonding and van der Waals
force play the predominate role in the removal of congo red by
the chitosan hydrobeads because the change in pH only affects
the surface charge of the adsorbent. Organic solvents, except
acetone were ineffective in desorption of congo red from loaded
beads. However, acetone desorbed the dye but the extent was
only 25%.
4. Conclusion
Following conclusions may be drawn from the present inves-
tigation.
8/8/2019 Adsorptive of Congo
http://slidepdf.com/reader/full/adsorptive-of-congo 7/7
152 S. Chatterjee et al. / Colloids and Surfaces A: Physicochem. Eng. Aspects 299 (2007) 146–152
1. Chitosan beads is a good adsorbent for the removal of congo
red from its aqueous solution and 1g of chitosan in the form
of hydrobeads can remove ∼93 mg of the dye at natural pH
(∼6.0).
2. Langmuir adsorption isotherm model fitswell to describe the
equilibrium adsorption isotherm data.
3. Adsorption process is dependant on pH and temperature and
followssecond-orderkinetics rate model todescribe themass
transfer mechanism.
4. Sodium chloride and sodium dodecyl sulphate (SDS) inhibit
the adsorption process.
5. Physical forces as well as ionic interaction are responsible
for binding of congo red with chitosan.
Acknowledgements
Authors are thankful to Dr. P.C Banerjee of Indian Institute
of Chemical Biology, Kolkata for valuable suggestions. Sandi-
pan Chatterjee wishes to acknowledge Council of Scientific and
Industrial Research (CSIR), New Delhi, for providing fellow-ship.
Appendix A. Supplementary data
Supplementary data associated with this article canbe found,
in the online version, at doi:10.1016/j.colsurfa.2006.11.036.
References
[1] H. Zollinger, Colour Chemistry-Synthesis, Properties and Application of
Organic Dyes And Pigments, VCH Publishers, New York, 1987.
[2] S.A. Figueiredo, R.A. Boaventura, J.M. Loureoro, Sep. Purif. Technol. 20
(2000) 129.[3] C.A. Fewson, Trends Biotechnol. 6 (1988) 148.
[4] S. Chinwetkitvanich, M. Tuntoolvest, T. Panswad, Water Res. 34 (2000)
2223.
[5] U. Mayer,Biodegradation of SyntheticOrganicColorant FEMSSymp, vol.
12, 1981, p. 371.
[6] K.T. Chung, C.E. Cerniglia, Mutat. Res. 277 (1992) 201.
[7] P.C. Vandevivere, R. Bianchi, W. Verstraete, J. Chem. Tech. Biotechnol. 72
(1998) 289.
[8] G.M. Walker, L.R. Weatherley, Water Res. 31 (1997) 2093.
[9] R. Ganesh, G.D. Boardman, D. Michelsen, Water Res. 38 (1994) 1367.
[10] W. Chu, S.M. Tsui, Chemosphere 39 (1999) 1667.
[11] Y.M. Slokar, A.M. Le, Meyer, Dyes Pigm. 37 (1997) 335.
[12] G. Mishra, M.A. Tripathy, Colourage 40 (1993) 35.
[13] U.B. Ogutveren, S. Kaparal, J. Environ. Sci. Health A 29 (1994) 1.
[14] N.M. Nasser, M.J. El-Geundi, J. Chem. Technol. Biotechnol. 50 (1991)
257.
[15] G. Mc Kay, M.S. Otterburn, J.A. Aga, Water Air Soil Pollut. 24 (1985)
307.
[16] C. Namasivayam, K. Ranganathan, Res. Ind. 37 (1992) 165.[17] S. Netpradit, P. Thiravetyan, S. Towprayoon, Water Res. 37 (2003) 763.
[18] G. Mckay, S.J. Allen, Can. J. Chem. Eng. 58 (1980) 521.
[19] C. Namsivayam, N. Kanchana, Chemosphere 25 (1992) 1691.
[20] C. Namasivayam, N. Muniasamy, K. Gayathri, M. Rani, K. Ranganathan,
Biores. Technol. 57 (1996) 37.
[21] G. Mckay, M. El-Geundi, N.M. Nassar, Water Res. 21 (1987) 1513.
[22] G. McKay, G. Ramprasad, P. Mowli, Water Air Soil Pollut. 29 (1986)
273.
[23] C. Namasivayam, D. Kavitha, Dyes Pigm. 54 (2002) 47.
[24] G. Annadurai, R.L. Juang, D.J. Lee, J. Hazard. Mater. B92 (2002) 263.
[25] A. Bousher, X. Shen, R.G.J. Edyvean, Water Res. 31 (1997) 2084.
[26] H. Yoshida, T. Takemori, Water Sci. Technol. 35 (1997) 29.
[27] L. Jin, R. Bai, Langmuir 18 (2002) 9765.
[28] E. Guibal, Sep. Purif. Technol. 38 (2004) 43.
[29] H.K. No, S.P. Meyers, Env. Cont. Toxico. 163 (2000) 1.[30] S. Chatterjee,A.K. Guha, B.P. Chatterjee, Ind.J. Chem. Technol. 10 (2003)
350.
[31] T. Mitani, N. Fukomuro, C. Yoshimoto, H. Ishii, Agric. Biol. Chem. 55
(1991) 2419.
[32] S. Chatterjee, S. Chatterjee, B.P. Chatterjee, A.R. Das, A.K. Guha, J. Col-
loid Interf. Sci. 288 (2005) 30.
[33] D.K. Chattoraj, T. Imae’, A. Mitra, Langmuir 20 (2004) 4903.
[34] T.N.decastro Dantas’,A.A. Dantas Neto, A.M.C.P. de,E.L. Moura, Barros,
de. Paiva Telemeco, Langmuir 17 (2001) 4256.
[35] Y.S. Ho, G. McKay, Chem. Eng. J. 70 (1998) 115.
[36] V.N. Singh, G. Mishra, K.K. Panday, Indian J. Technol. 22 (1984) 70.
[37] C. Namasivayam, R.T. Yamuna, J. Chem. Technol. Biotechnol. 53 (1992)
153.
[38] C. Namasivayam, M. Kanchana, Perntiak J. Sci. Technol. 1 (1993) 32.
[39] N. Deo, M. Ali, Ind. J. Env. Prot. 13 (1993) 496.
[40] C. Namasivayam, R. Jeyakumar, R.T. Yamuna, Waste Manage. 14 (1994)
643.
[41] C. Namasivayam, D.J.S.E. Arasi, Chemosphere 34 (1997) 401.
[42] K.G. Bhattachryya, A. Sharma, J. Env. Mannage. 71 (2004) 217.
[43] Y. Fu, T. Viraraghavan, Adv. Env. Res. 7 (2002) 239.
[44] W. Fritz, E.U. Schlunder, Chem. Eng. Sci. 36 (1981) 721.
[45] Y.C. Wong, Y.S. Szeto, W.H. Cheung, G. McKay, Langmuir 19 (2003)
7888.
[46] M.S. Chiou, H.Y. Li, Chemosphere 50 (2003) 1095.