Embed Size (px)
Citation preview
Indian Journal of Chemical Technology Vol. 19, September 2012, pp. 311-321
Adsorption of basic dyes from synthetic textile effluent by activated carbon
prepared from Thevetia peruviana
J Raffiea Baseri1,*, P N Palanisamy2 & P Siva Kumar3 1 Department of Chemistry, Al-Ameen Engineering College, Erode 638 104, India
2 Department of Chemistry, Kongu Engineering College, Perundurai, Erode 638 052, India 3Department of Chemistry, Arignar Anna Government Arts College, Namakkal 637 002, India
Received 4 August 2011; accepted 25 January 2012
The adsorption capacity of activated carbon obtained from Thevetia peruviana for three basic dyes, namely Malachite Green, Crystal Violet and Rhodamine–B, available in synthetic textile effluents has been studied. The percentage removal of Malachite Green, Crystal Violet, and Rhodamine–B on to the activated carbon decreases from 98.46 to 89.80, from 97.83 to 88.66 and from 97.33 to 87.12 respectively with the increase in initial dye concentration from 25 mg/L to 100 mg/L at 30ºC. The removal data have been analyzed using Langmuir, Freundlich, Temkin and D-R isotherm models at various temperatures varying from 30 ºC to 45 ºC. The positive value of enthalpy indicates that the adsorption of basic dyes on to activated carbon is endothermic, which is further supported by the increase in adsorption rate of dyes with the increase in temperature from 30 ºC to 45 ºC. It is found that an activated carbon prepared by the chemical impregnation of Thevetia
peruviana with H3PO4 acid can be used as the best adsorbent for the removal of basic dyes from synthetic textile effluents.
Keywords: Activated carbon, Adsorption isotherm, Crystal violet, Effluent treatment, H3PO4 acid, Malachite Green,
Rhodamine–B, Kinetic models, Thevetia peruviana
Water pollution is mainly due to the discharge of untreated or partially treated waste water from many
industries on land or in water bodies1. The anaerobic
decomposition of the dyes and incomplete bacterial degradation produce toxic amines which are harmful
to the environment2. Adsorption is one of the
best conventional waste water treatment methods compared to other treatment methods such as
coagulation, flocculation3, reverse osmosis, ozonation
4,
electrochemical techniques5 and fungal decolorisation.
Activated carbon is the most popular and widely used adsorbent because of high adsorption efficiency
for the organic compound. But the commercially
available activated carbon is very expensive and has problems of regeneration. Hence, production of low
cost and effective adsorbents is still a field of interest
and research is continuing in this area. Coir pith6,
coconut shell7, peanut hull
8, rice husk
9, saw dust
10,
corn cob11
have been used as low cost natural
adsorbents.
The extent of adsorption depends on the porosity and surface area of the adsorbent. The porous
structure plays a major role in the increase of adsorption rate. Activated carbon is produced by
a process of carbonization followed by activation.
The carbonization process converts the organic material to primary carbon, whereas the activation
process removes the decomposition products
deposited in the pores and makes the activated carbon porous in nature.
The objective of this research work is to study the
adsorption kinetics and thermodynamics of cationic (basic) dyes namely Malachite Green, Crystal Violet
and Rhodamine–B by the activated carbon prepared
from Thevetia peruviana (TPAC). Activated carbon was prepared from the plant Thevetia peruviana by
the carbonization process followed by chemical
impregnation with phosphoric acid. The adsorption data are also analyzed by kinetic models and isotherm
models.
Experimental Procedure
Preparation of adsorbent from Thevetia peruviana
Thevetia peruviana is abundantly available tree through out India, which has no economical
importance. The bark of this tree was cut into small
—————— *Corresponding author. E-mail: [email protected]
INDIAN J. CHEM. TECHNOL, SEPTEMBER 2012
312
pieces of 2 - 3 cm size and then dried in sunlight
for 10 days. The dried material was soaked in
a boiling solution of 10 % H3PO4 for 1 h and kept at room temperature for 24 h. After that, the wood
material was separated, air dried and carbonized in
muffle furnace at 400°C. The carbonized material
was powdered and activated in a muffle furnace at 800°C for a period of 10 min. Then the material was
washed with plenty of water to remove residual
acid, dried, sieved to a desired particle size and stored in a tight lid container for further adsorption
studies. The characteristics of the activated carbon
are studied as per the standard procedures12,13
and are
given in Table 1.
Preparation of synthetic solutions of dyes
Basic dyes, Malachite Green (Basic Green 4), Crystal Violet (Basic Violet 3) and Rhodamine–B
(Basic Violet 10) were used. All the chemicals
were of high purity, commercially available AR grade. The properties of the selected dyes are given
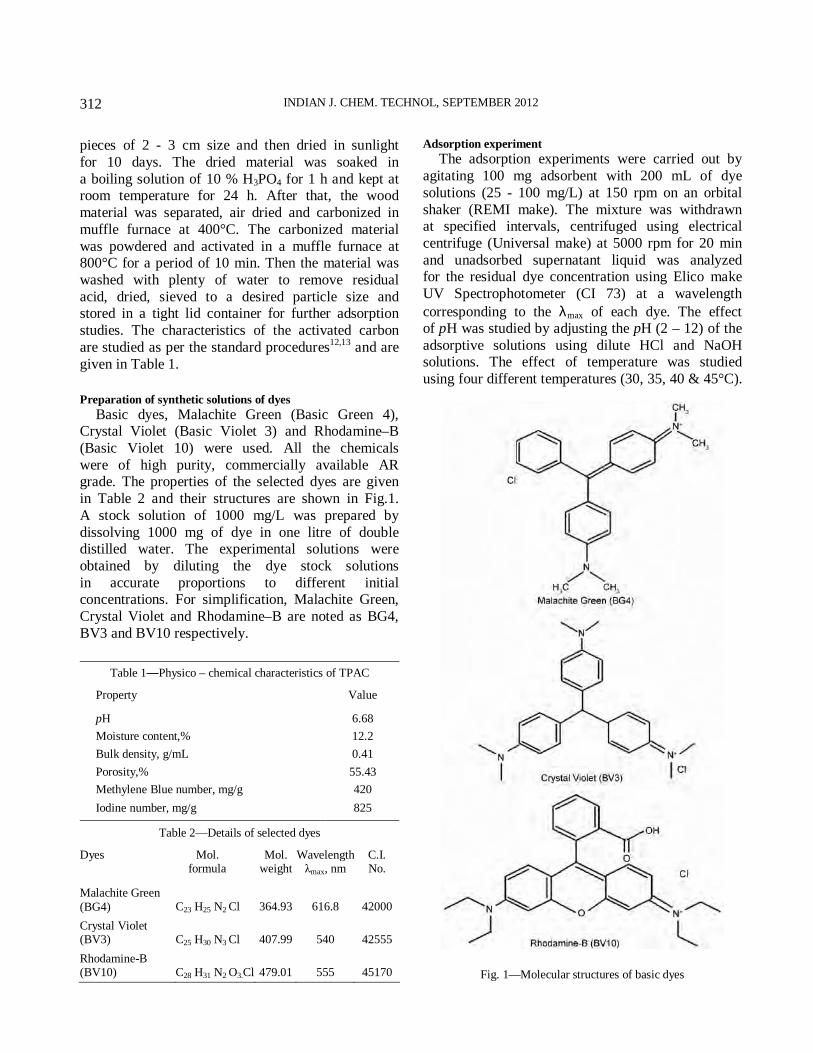
in Table 2 and their structures are shown in Fig.1.
A stock solution of 1000 mg/L was prepared by
dissolving 1000 mg of dye in one litre of double distilled water. The experimental solutions were
obtained by diluting the dye stock solutions
in accurate proportions to different initial concentrations. For simplification, Malachite Green,
Crystal Violet and Rhodamine–B are noted as BG4,
BV3 and BV10 respectively.
Table 1—Physico – chemical characteristics of TPAC
Property Value
pH 6.68
Moisture content,% 12.2
Bulk density, g/mL 0.41
Porosity,% 55.43
Methylene Blue number, mg/g 420
Iodine number, mg/g 825
Table 2—Details of selected dyes
Dyes Mol. formula
Mol. weight
Wavelength λmax, nm
C.I. No.
Malachite Green
(BG4) C23 H25 N2 Cl 364.93 616.8 42000
Crystal Violet (BV3) C25 H30 N3 Cl 407.99 540 42555
Rhodamine-B (BV10) C28 H31 N2 O3.Cl 479.01 555 45170
Adsorption experiment
The adsorption experiments were carried out by
agitating 100 mg adsorbent with 200 mL of dye
solutions (25 - 100 mg/L) at 150 rpm on an orbital
shaker (REMI make). The mixture was withdrawn at specified intervals, centrifuged using electrical
centrifuge (Universal make) at 5000 rpm for 20 min
and unadsorbed supernatant liquid was analyzed for the residual dye concentration using Elico make
UV Spectrophotometer (CI 73) at a wavelength
corresponding to the λmax of each dye. The effect of pH was studied by adjusting the pH (2 – 12) of the
adsorptive solutions using dilute HCl and NaOH solutions. The effect of temperature was studied
using four different temperatures (30, 35, 40 & 45°C).
Fig. 1—Molecular structures of basic dyes
BASERI et al.: ADSORPTION OF BASIC DYES FROM SYNTHETIC TEXTILE EFFLUENT
313
All experiments were carried out in duplicate and
the mean values are reported, where the maximum
deviation was within 4%. The effects of each parameter (initial dye
concentration, pH, agitation time) were evaluated in
an experiment by varying that parameter, while
keeping the other parameters as constant. The amount of dye on TPAC adsorbent was calculated using the
following equation:
M
CCq e
t
)( 0 −= V … (1)
where qt (mg/g) is the amount of dye adsorbed at
time t ; C0 and Ce (mg/L) , the concentrations of dye at initial and equilibrium respectively; V and M ,
the volume of the solution (litre) and the mass (g) of
dry adsorbent used respectively. Desorption studies
Desorption studies were carried out to analyse
the mechanism of adsorption and recovery of the
adsorbate and adsorbent. The regeneration of the
adsorbent may make the treatment process economical. The supernatant was separated after
centrifugation and the adsorbent was separated and
allowed to agitate with 100 mL of distilled water at different pH (2 – 11) above the equilibrium time of
adsorption. The desorbed dye solution was separated
by centrifugation and estimated as given in the adsorption studies
14.
Results and Discussion
Characterization studies
The characteristic of carbon prepared from
Thevetia peruviana is presented in Table 1. The
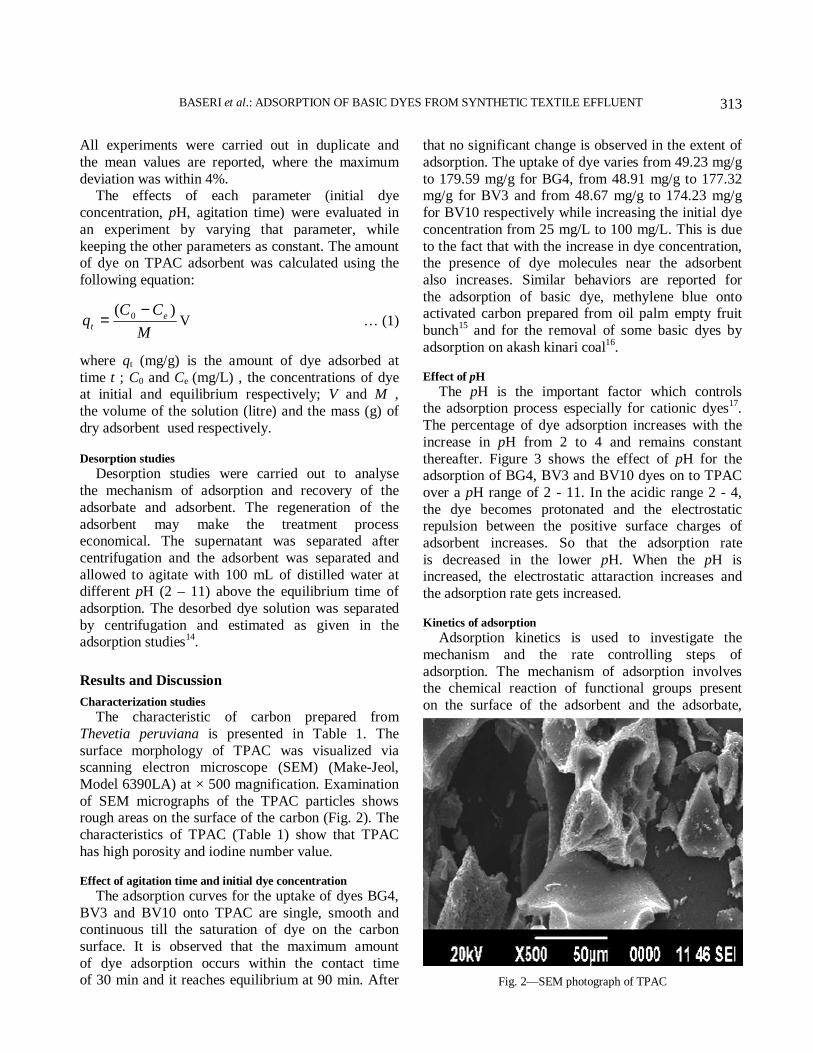
surface morphology of TPAC was visualized via scanning electron microscope (SEM) (Make-Jeol,
Model 6390LA) at × 500 magnification. Examination
of SEM micrographs of the TPAC particles shows rough areas on the surface of the carbon (Fig. 2). The
characteristics of TPAC (Table 1) show that TPAC
has high porosity and iodine number value.
Effect of agitation time and initial dye concentration
The adsorption curves for the uptake of dyes BG4,
BV3 and BV10 onto TPAC are single, smooth and continuous till the saturation of dye on the carbon
surface. It is observed that the maximum amount
of dye adsorption occurs within the contact time of 30 min and it reaches equilibrium at 90 min. After
that no significant change is observed in the extent of
adsorption. The uptake of dye varies from 49.23 mg/g
to 179.59 mg/g for BG4, from 48.91 mg/g to 177.32 mg/g for BV3 and from 48.67 mg/g to 174.23 mg/g
for BV10 respectively while increasing the initial dye
concentration from 25 mg/L to 100 mg/L. This is due
to the fact that with the increase in dye concentration, the presence of dye molecules near the adsorbent
also increases. Similar behaviors are reported for
the adsorption of basic dye, methylene blue onto activated carbon prepared from oil palm empty fruit
bunch15
and for the removal of some basic dyes by
adsorption on akash kinari coal16
.
Effect of pH
The pH is the important factor which controls the adsorption process especially for cationic dyes
17.
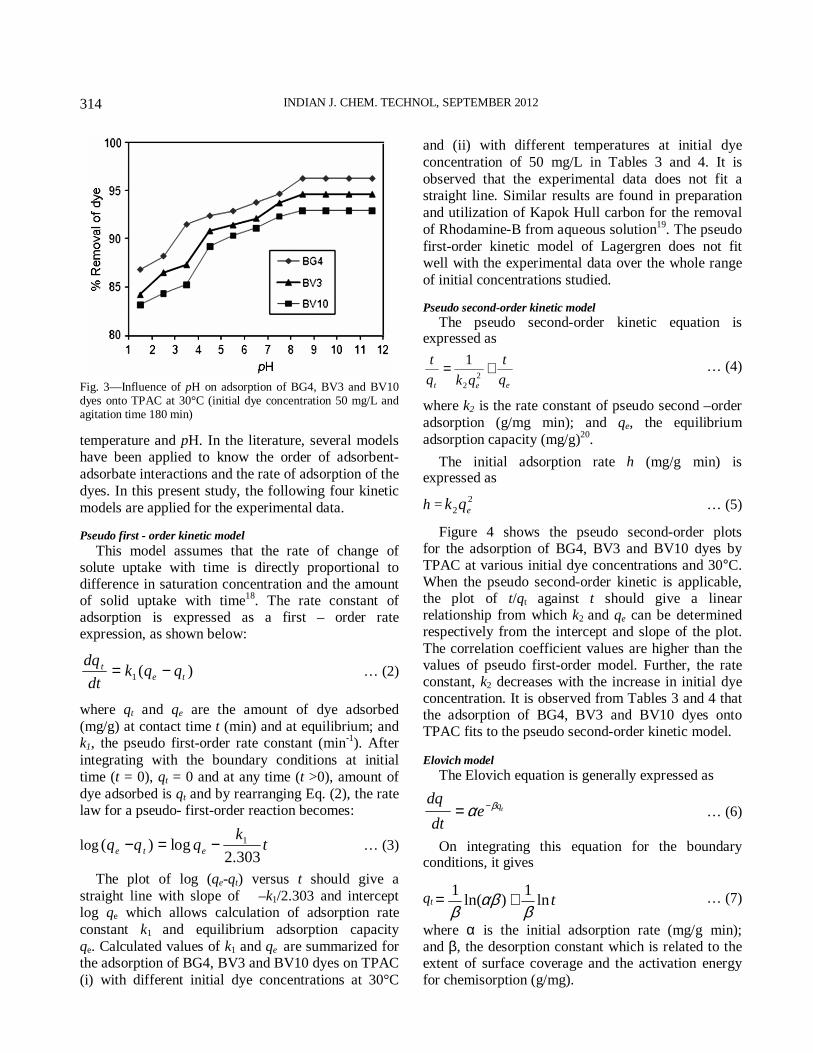
The percentage of dye adsorption increases with the
increase in pH from 2 to 4 and remains constant
thereafter. Figure 3 shows the effect of pH for the adsorption of BG4, BV3 and BV10 dyes on to TPAC
over a pH range of 2 - 11. In the acidic range 2 - 4,
the dye becomes protonated and the electrostatic repulsion between the positive surface charges of
adsorbent increases. So that the adsorption rate
is decreased in the lower pH. When the pH is increased, the electrostatic attaraction increases and
the adsorption rate gets increased.
Kinetics of adsorption
Adsorption kinetics is used to investigate the
mechanism and the rate controlling steps of
adsorption. The mechanism of adsorption involves the chemical reaction of functional groups present
on the surface of the adsorbent and the adsorbate,
Fig. 2—SEM photograph of TPAC
INDIAN J. CHEM. TECHNOL, SEPTEMBER 2012
314
Fig. 3—Influence of pH on adsorption of BG4, BV3 and BV10 dyes onto TPAC at 30°C (initial dye concentration 50 mg/L and agitation time 180 min)
temperature and pH. In the literature, several models have been applied to know the order of adsorbent-
adsorbate interactions and the rate of adsorption of the
dyes. In this present study, the following four kinetic
models are applied for the experimental data.
Pseudo first - order kinetic model
This model assumes that the rate of change of solute uptake with time is directly proportional to difference in saturation concentration and the amount of solid uptake with time
18. The rate constant of
adsorption is expressed as a first – order rate expression, as shown below:
)(1 te
t qqkdt
dq−= … (2)
where qt and qe are the amount of dye adsorbed
(mg/g) at contact time t (min) and at equilibrium; and k1, the pseudo first-order rate constant (min
-1). After
integrating with the boundary conditions at initial
time (t = 0), qt = 0 and at any time (t >0), amount of
dye adsorbed is qt and by rearranging Eq. (2), the rate law for a pseudo- first-order reaction becomes:
log tk
qqqete
303.2log)( 1−=− … (3)
The plot of log (qe-qt) versus t should give a
straight line with slope of –k1/2.303 and intercept log qe which allows calculation of adsorption rate
constant k1 and equilibrium adsorption capacity
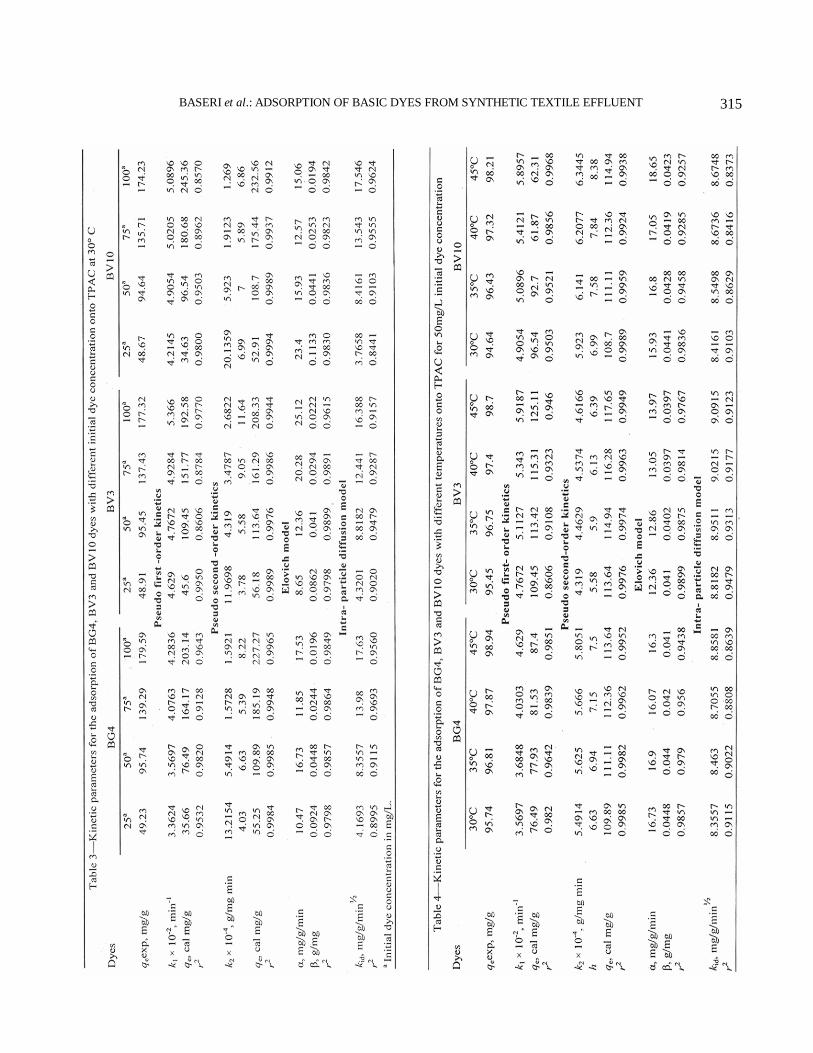
qe. Calculated values of k1 and qe are summarized for the adsorption of BG4, BV3 and BV10 dyes on TPAC
(i) with different initial dye concentrations at 30°C
and (ii) with different temperatures at initial dye
concentration of 50 mg/L in Tables 3 and 4. It is
observed that the experimental data does not fit a straight line. Similar results are found in preparation
and utilization of Kapok Hull carbon for the removal
of Rhodamine-B from aqueous solution19
. The pseudo
first-order kinetic model of Lagergren does not fit well with the experimental data over the whole range
of initial concentrations studied.
Pseudo second-order kinetic model
The pseudo second-order kinetic equation is expressed as
eet q
t
qkq
t+=
2
2
1 … (4)
where k2 is the rate constant of pseudo second –order
adsorption (g/mg min); and qe, the equilibrium
adsorption capacity (mg/g)20
.
The initial adsorption rate h (mg/g min) is expressed as
h =2
2 eqk … (5)
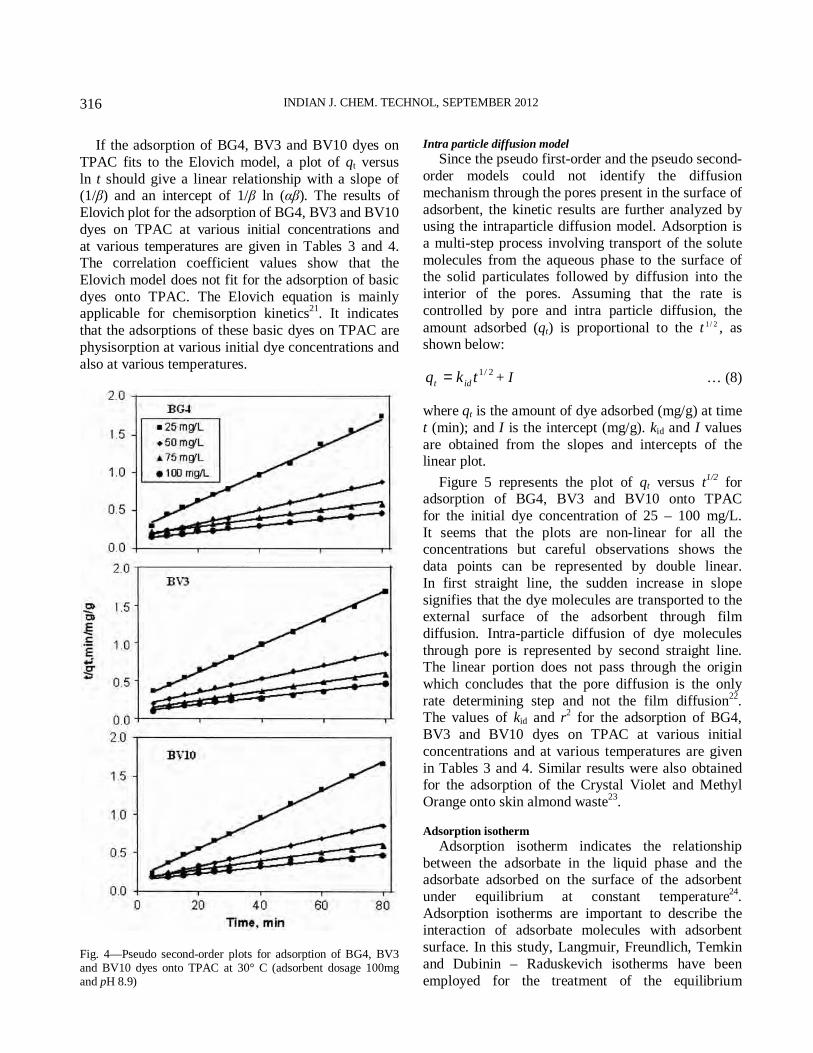
Figure 4 shows the pseudo second-order plots for the adsorption of BG4, BV3 and BV10 dyes by TPAC at various initial dye concentrations and 30°C. When the pseudo second-order kinetic is applicable, the plot of t/qt against t should give a linear relationship from which k2 and qe can be determined respectively from the intercept and slope of the plot.
The correlation coefficient values are higher than the values of pseudo first-order model. Further, the rate constant, k2 decreases with the increase in initial dye concentration. It is observed from Tables 3 and 4 that the adsorption of BG4, BV3 and BV10 dyes onto TPAC fits to the pseudo second-order kinetic model.
Elovich model
The Elovich equation is generally expressed as
tqe
dt
dqβα −= … (6)
On integrating this equation for the boundary conditions, it gives
qt = tln1
)ln(1
βαβ
β+ … (7)
where α is the initial adsorption rate (mg/g min); and β, the desorption constant which is related to the extent of surface coverage and the activation energy for chemisorption (g/mg).
BASERI et al.: ADSORPTION OF BASIC DYES FROM SYNTHETIC TEXTILE EFFLUENT
315
INDIAN J. CHEM. TECHNOL, SEPTEMBER 2012
316
If the adsorption of BG4, BV3 and BV10 dyes on
TPAC fits to the Elovich model, a plot of qt versus
ln t should give a linear relationship with a slope of (1/β) and an intercept of 1/β ln (αβ). The results of
Elovich plot for the adsorption of BG4, BV3 and BV10
dyes on TPAC at various initial concentrations and
at various temperatures are given in Tables 3 and 4. The correlation coefficient values show that the
Elovich model does not fit for the adsorption of basic
dyes onto TPAC. The Elovich equation is mainly applicable for chemisorption kinetics
21. It indicates
that the adsorptions of these basic dyes on TPAC are
physisorption at various initial dye concentrations and
also at various temperatures.
Intra particle diffusion model
Since the pseudo first-order and the pseudo second-
order models could not identify the diffusion
mechanism through the pores present in the surface of
adsorbent, the kinetic results are further analyzed by using the intraparticle diffusion model. Adsorption is
a multi-step process involving transport of the solute
molecules from the aqueous phase to the surface of the solid particulates followed by diffusion into the
interior of the pores. Assuming that the rate is
controlled by pore and intra particle diffusion, the
amount adsorbed (qt) is proportional to the t 2/1 , as shown below:
2/1tkq idt = + I … (8)
where qt is the amount of dye adsorbed (mg/g) at time
t (min); and I is the intercept (mg/g). kid and I values
are obtained from the slopes and intercepts of the linear plot.
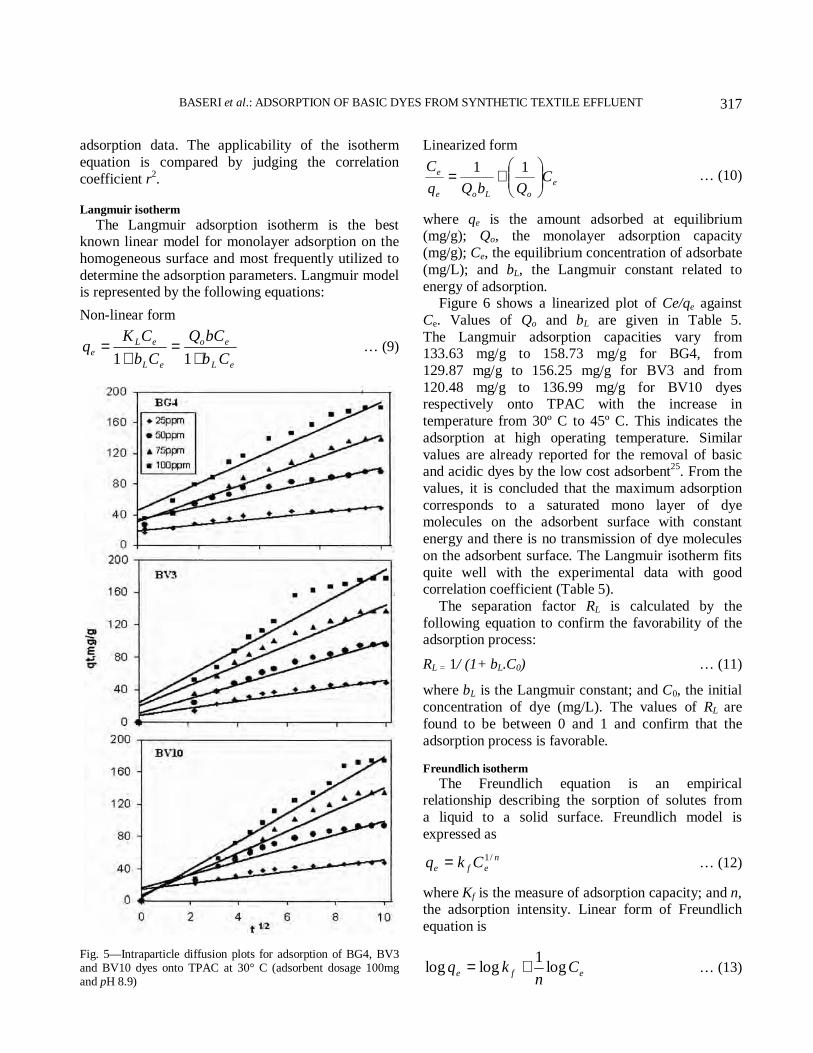
Figure 5 represents the plot of qt versus t1/2
for adsorption of BG4, BV3 and BV10 onto TPAC
for the initial dye concentration of 25 – 100 mg/L.
It seems that the plots are non-linear for all the concentrations but careful observations shows the
data points can be represented by double linear.
In first straight line, the sudden increase in slope
signifies that the dye molecules are transported to the external surface of the adsorbent through film
diffusion. Intra-particle diffusion of dye molecules
through pore is represented by second straight line. The linear portion does not pass through the origin
which concludes that the pore diffusion is the only
rate determining step and not the film diffusion22
. The values of kid and r
2 for the adsorption of BG4,
BV3 and BV10 dyes on TPAC at various initial
concentrations and at various temperatures are given
in Tables 3 and 4. Similar results were also obtained for the adsorption of the Crystal Violet and Methyl
Orange onto skin almond waste23
.
Adsorption isotherm
Adsorption isotherm indicates the relationship
between the adsorbate in the liquid phase and the adsorbate adsorbed on the surface of the adsorbent
under equilibrium at constant temperature24
.
Adsorption isotherms are important to describe the interaction of adsorbate molecules with adsorbent
surface. In this study, Langmuir, Freundlich, Temkin
and Dubinin – Raduskevich isotherms have been
employed for the treatment of the equilibrium
Fig. 4—Pseudo second-order plots for adsorption of BG4, BV3 and BV10 dyes onto TPAC at 30° C (adsorbent dosage 100mg and pH 8.9)
BASERI et al.: ADSORPTION OF BASIC DYES FROM SYNTHETIC TEXTILE EFFLUENT
317
adsorption data. The applicability of the isotherm
equation is compared by judging the correlation
coefficient r2.
Langmuir isotherm
The Langmuir adsorption isotherm is the best known linear model for monolayer adsorption on the
homogeneous surface and most frequently utilized to
determine the adsorption parameters. Langmuir model is represented by the following equations:
Non-linear form
eL
eo
eL
eL
eCb
bCQ
Cb
CKq
+=
+=
11 … (9)
Linearized form
e
oLoe
e CQbQq
C
+=
11 … (10)
where qe is the amount adsorbed at equilibrium (mg/g); Qo, the monolayer adsorption capacity
(mg/g); Ce, the equilibrium concentration of adsorbate
(mg/L); and bL, the Langmuir constant related to
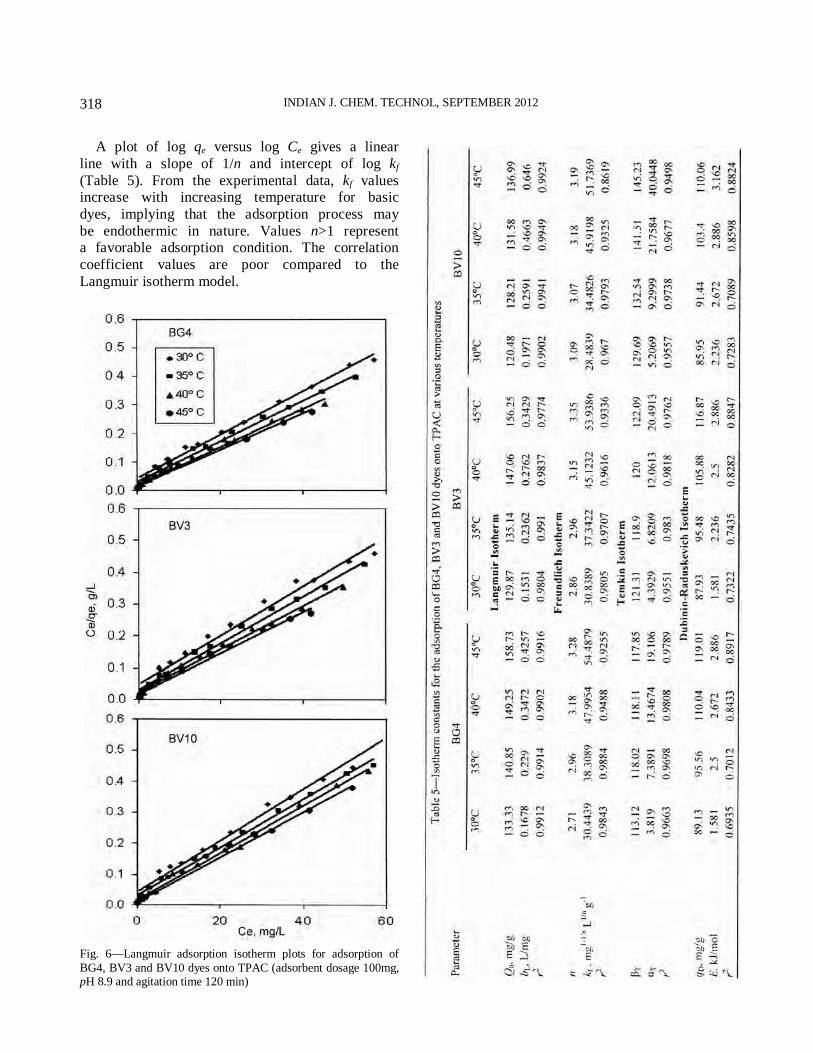
energy of adsorption. Figure 6 shows a linearized plot of Ce/qe against
Ce. Values of Qo and bL are given in Table 5.
The Langmuir adsorption capacities vary from 133.63 mg/g to 158.73 mg/g for BG4, from
129.87 mg/g to 156.25 mg/g for BV3 and from
120.48 mg/g to 136.99 mg/g for BV10 dyes respectively onto TPAC with the increase in
temperature from 30º C to 45º C. This indicates the
adsorption at high operating temperature. Similar
values are already reported for the removal of basic and acidic dyes by the low cost adsorbent
25. From the
values, it is concluded that the maximum adsorption
corresponds to a saturated mono layer of dye molecules on the adsorbent surface with constant
energy and there is no transmission of dye molecules
on the adsorbent surface. The Langmuir isotherm fits
quite well with the experimental data with good correlation coefficient (Table 5).
The separation factor RL is calculated by the
following equation to confirm the favorability of the adsorption process:
RL = 1/ (1+ bL.C0) … (11)
where bL is the Langmuir constant; and C0, the initial
concentration of dye (mg/L). The values of RL are
found to be between 0 and 1 and confirm that the
adsorption process is favorable.
Freundlich isotherm
The Freundlich equation is an empirical relationship describing the sorption of solutes from
a liquid to a solid surface. Freundlich model is
expressed as
n
efe Ckq /1= … (12)
where Kf is the measure of adsorption capacity; and n,
the adsorption intensity. Linear form of Freundlich
equation is
efeC
nkq log
1loglog += … (13)
Fig. 5—Intraparticle diffusion plots for adsorption of BG4, BV3 and BV10 dyes onto TPAC at 30° C (adsorbent dosage 100mg and pH 8.9)
INDIAN J. CHEM. TECHNOL, SEPTEMBER 2012
318
A plot of log qe versus log Ce gives a linear
line with a slope of 1/n and intercept of log kf
(Table 5). From the experimental data, kf values increase with increasing temperature for basic
dyes, implying that the adsorption process may
be endothermic in nature. Values n>1 represent a favorable adsorption condition. The correlation
coefficient values are poor compared to the
Langmuir isotherm model.
Fig. 6—Langmuir adsorption isotherm plots for adsorption of
BG4, BV3 and BV10 dyes onto TPAC (adsorbent dosage 100mg, pH 8.9 and agitation time 120 min)
BASERI et al.: ADSORPTION OF BASIC DYES FROM SYNTHETIC TEXTILE EFFLUENT
319
Temkin isotherm
Temkin isotherm equation is based on the
assumption that adsorption takes place through the
characterization of uniform distribution in binding
energies up to a certain level and the sorption energy decreases linearly as the coverage of adsorbent
increases26
.
The linear form of Temkin equation is
e
T
T
T
e Cb
RTa
b
RTq lnln += … (14)
where bT is the Temkin constant related to heat of sorption (J/mg); aT, the Temkin isotherm constant;
R, the gas constant with the value of 8.314(J/mol/K);
and T, the absolute temperature in Kelvin. The values of the constants aT and bT are calculated
from the intercept and slope of the plot qe versus ln Ce.
The correlation coefficient values are very poor (Table 5). This shows that Temkin model does not fit
with the experimental data. Dubinin – Raduskevich (D- R) isotherm
The D-R isotherm describes the adsorption on a
single uniform pore. Dubinin-Raduskevich isotherm is generally expressed as follows
27:
2.
εB
De eqq−= … (15)
The linear form of D-R isotherm equation is represented as
2lnln εBqq De −= … (16)
)1
1ln(eC
RT +=ε … (17)
where qD is the theoretical saturation capacity (mol/g);
B, a constant related to the mean free energy of adsorption per mole of the adsorbate (mol
2/ J
2); ε, the
Polanyi potential; Ce, the equilibrium concentration
of adsorbate in solution (mol/L); R (J/mol/K), the gas constant; and T(K), the absolute temperature. The
D-R constants qD and B are calculated from the linear
plots of ln qe versus ε2 and are given in Table 5.
The constant B gives an idea about the mean free energy E (kJ/mol) of adsorption per molecule of
the adsorbate when it is transferred to the surface of
the solid from infinity in the solution and can be calculated using the following relationship
28:
E = 1/ (2B) 1/2
… (18)
It is observed29
that the adsorption is physisorption if
the energy of activation is in the range of 5 – 40 kJ/ mol
and chemisorption if the energy of activation is 40- 800 kJ/mol. From Table 5, it can be predicted that
the adsorptions of BG4, BV3 and BV10 by TPAC are
physisorption in nature. D-R isotherm is not able to
describe the experimental data properly because of the poor linear correlation coefficient as shown in Table 5
for the adsorption of three basic dyes onto TPAC at
different temperatures. Thermodynamics of adsorption and effect of temperature
The experiments were carried out at four different
temperatures (30, 35, 40 and 45°C) to observe the
effect of temperature on the adsorption of BG 4, BV3 and BV10 dyes respectively on the activated carbon
of Thevetia peruviana. It has been observed that the
percentage removal of BG4, BV3 and BV10 by TPAC increases from 95.74% to 98.94% for BG4,
from 95.45% to 98.70% for BV3 and from 94.64% to
98.21% respectively while increasing the temperature.
This indicates that the sorption of basic dyes on to
TPAC is endothermic in nature.
Thermodynamic parameters provide in-depth
information of inherent energetic changes associated
with adsorption; therefore, these parameters should be accurately evaluated. Langmuir isotherm equation is
applied to calculate the thermodynamic parameters as
follows:
ln k L = TR
H
R
S 1°∆−
°∆ … (19)
where kL is the Langmuir equilibrium constant; °∆H
and °∆S , the standard enthalpy and entropy changes
of adsorption respectively.
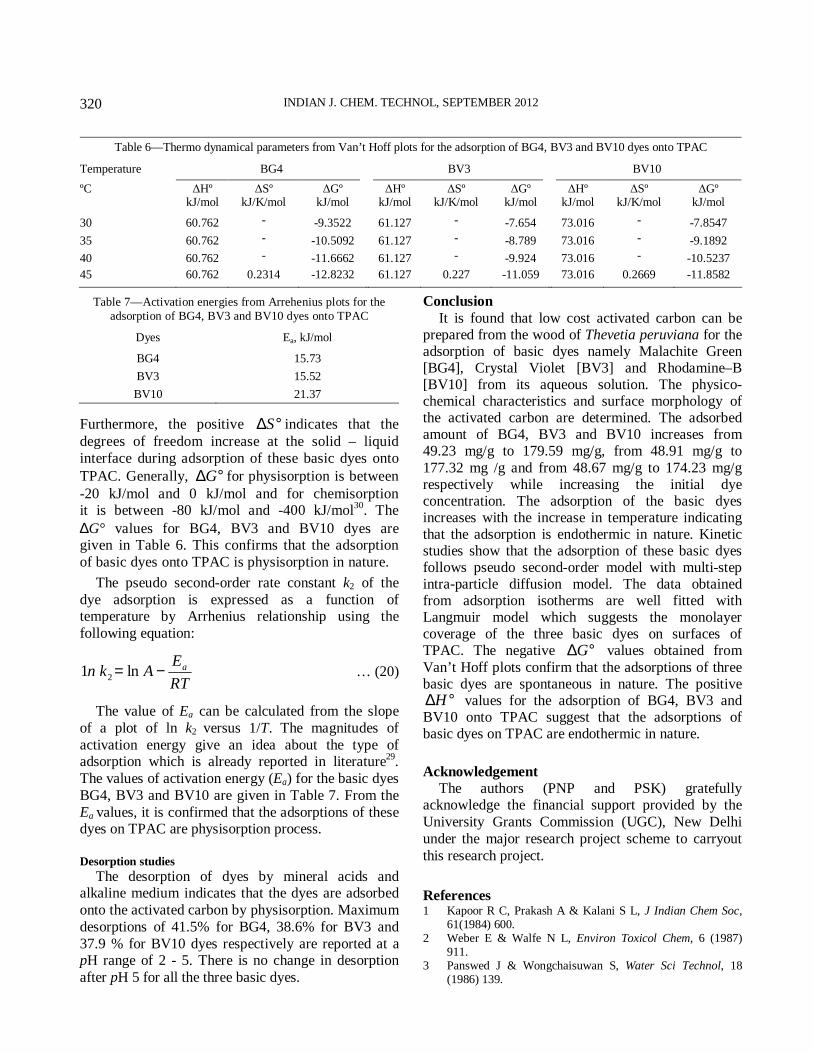
Thermodynamic parameters, like °∆H , °∆S and
°∆G were determined from the slope and intercept of
Van’t Hoff’s plot of ln kL versus 1/T. Table 6 shows
the thermodynamic parameters °∆H , °∆S and °∆G
for the removal of BG4, BV3 and BV10 by TPAC
respectively. The °∆G values are found to be
negative at all tested temperatures (30 - 45°C),
indicating that the adsorptions of BG4, BV3 and BV10 dyes onto TPAC are spontaneous
and thermodynamically favorable. The positive
°∆H values indicate that the adsorptions of BG4,
BV3 and BV10 dyes onto TPAC are endothermic process, which is supported by the increase in
adsorption of the dye with the increase in temperature.
INDIAN J. CHEM. TECHNOL, SEPTEMBER 2012
320
Table 7—Activation energies from Arrehenius plots for the
adsorption of BG4, BV3 and BV10 dyes onto TPAC
Dyes Ea, kJ/mol
BG4 15.73
BV3 15.52
BV10 21.37
Furthermore, the positive °∆S indicates that the
degrees of freedom increase at the solid – liquid
interface during adsorption of these basic dyes onto
TPAC. Generally, °∆G for physisorption is between
-20 kJ/mol and 0 kJ/mol and for chemisorption it is between -80 kJ/mol and -400 kJ/mol
30. The
∆G° values for BG4, BV3 and BV10 dyes are given in Table 6. This confirms that the adsorption
of basic dyes onto TPAC is physisorption in nature.
The pseudo second-order rate constant k2 of the
dye adsorption is expressed as a function of temperature by Arrhenius relationship using the
following equation:
RT
EAkn a−= ln1 2 … (20)
The value of Ea can be calculated from the slope
of a plot of ln k2 versus 1/T. The magnitudes of
activation energy give an idea about the type of adsorption which is already reported in literature
29.
The values of activation energy (Ea) for the basic dyes
BG4, BV3 and BV10 are given in Table 7. From the
Ea values, it is confirmed that the adsorptions of these dyes on TPAC are physisorption process.
Desorption studies
The desorption of dyes by mineral acids and alkaline medium indicates that the dyes are adsorbed
onto the activated carbon by physisorption. Maximum
desorptions of 41.5% for BG4, 38.6% for BV3 and
37.9 % for BV10 dyes respectively are reported at a pH range of 2 - 5. There is no change in desorption
after pH 5 for all the three basic dyes.
Conclusion
It is found that low cost activated carbon can be prepared from the wood of Thevetia peruviana for the adsorption of basic dyes namely Malachite Green [BG4], Crystal Violet [BV3] and Rhodamine–B [BV10] from its aqueous solution. The physico- chemical characteristics and surface morphology of the activated carbon are determined. The adsorbed amount of BG4, BV3 and BV10 increases from 49.23 mg/g to 179.59 mg/g, from 48.91 mg/g to
177.32 mg /g and from 48.67 mg/g to 174.23 mg/g respectively while increasing the initial dye concentration. The adsorption of the basic dyes increases with the increase in temperature indicating that the adsorption is endothermic in nature. Kinetic studies show that the adsorption of these basic dyes follows pseudo second-order model with multi-step intra-particle diffusion model. The data obtained from adsorption isotherms are well fitted with Langmuir model which suggests the monolayer coverage of the three basic dyes on surfaces of TPAC. The negative °∆G values obtained from
Van’t Hoff plots confirm that the adsorptions of three basic dyes are spontaneous in nature. The positive
°∆H values for the adsorption of BG4, BV3 and BV10 onto TPAC suggest that the adsorptions of basic dyes on TPAC are endothermic in nature.
Acknowledgement
The authors (PNP and PSK) gratefully acknowledge the financial support provided by the
University Grants Commission (UGC), New Delhi
under the major research project scheme to carryout
this research project.
References 1 Kapoor R C, Prakash A & Kalani S L, J Indian Chem Soc,
61(1984) 600. 2 Weber E & Walfe N L, Environ Toxicol Chem, 6 (1987)
911. 3 Panswed J & Wongchaisuwan S, Water Sci Technol, 18
(1986) 139.
Table 6—Thermo dynamical parameters from Van’t Hoff plots for the adsorption of BG4, BV3 and BV10 dyes onto TPAC
Temperature BG4 BV3 BV10
ºC
∆Hº kJ/mol
∆Sº kJ/K/mol
∆Gº kJ/mol
∆Hº kJ/mol
∆Sº kJ/K/mol
∆Gº kJ/mol
∆Hº kJ/mol
∆Sº kJ/K/mol
∆Gº kJ/mol
30 60.762 - -9.3522 61.127 - -7.654 73.016 - -7.8547
35 60.762 - -10.5092 61.127 - -8.789 73.016 - -9.1892
40 60.762 - -11.6662 61.127 - -9.924 73.016 - -10.5237
45 60.762 0.2314 -12.8232 61.127 0.227 -11.059 73.016 0.2669 -11.8582
BASERI et al.: ADSORPTION OF BASIC DYES FROM SYNTHETIC TEXTILE EFFLUENT
321
4 Muthukumar M & Selvakumar N, Dyes Pigm, 62 (2004) 221. 5 Alinasafi A, Khemis M, Pons M N & Leclerc J P , Chem Eng
Process, 44 (2005) 461. 6 Namasivayam C & Kavitha D, Dyes Pigm, 54 (2002) 47. 7 Low K S & Lee C K, J Sci Technol, 13 (1990) 221. 8 Periasamy K & Namasivayam C, Chemosphere, 32 (1996)
769. 9 Nawar S S & Doma H S, Sci Total Environ, 79 (1989)
271. 10 Adithya Prakash, Sangeeta S & Prasada Rao PTSRK, Indian
J Chem Technol, 15 (2008) 146. 11 Yakout S M & Ali M M S, J At Mol Sci, 2(2) (2011) 117. 12 Activated Carbon, Powdered and Granular–Methods of
Sampling and its Tests, IS 877 (Bureau of Indian Standards, New Delhi), 1989.
13 Standard Test Method for Determination of Iodine Number
of Activated Carbon D4607-94, ASTM (American Society for Testing Materials), 1980.
14 Ahsan Habib, Zahidul Hasan, Shajedur Rahman A S M & Shafiqul Aslam A M, Pak J Anal Environ Chem, 2 (2006) 112.
15 Tan I A & Hameed B H, J Appl Sci, 10 (21) (2010) 2565. 16 Tabrez A Khan, Ved Vati Singh & Kumar D, J Sci Ind Res,
63 (2004) 355.
17 Pie-Ling Tan, Ching-Lee Wong, Siew- Teng Ong & Siew-Ling Hii, J Appl Sci, 9 (17) (2009) 3005.
18 Lagergren S, Kung Sven Veten Hand, 24(1898)1. 19 Syed Shabudeen P S, Venkatesh R & Pattabhi S, E- Journal
of Chemistry, 3 (2006) 83. 20 Nevine Kamal Amin, Desalination, 223 (2008) 152. 21 Palanisamy P N & Sivakumar P, Int J ChemTech Res,
1(3)(2009) 502. 22 Chao-y In Kuo, Chung – Hsin Wu & Jane-yii Wu, J Colloid
Interf Sci, 327 (2008) 308.
23 Atmani F, Bensmaili A & Mezenner N Y, J Environ Sci
Technol, 2(4) (2009) 153. 24 Nwabanne & Mordi M I, African J Biotechnol, 8(8) (2009)
1555. 25 Arivoli S, Sundaravadivelu M & Elango K P, Indian J Chem
Technol, 15 (2008) 130. 26 Hameed B H & Daud F B M, Chem Eng J, 139(2008) 48. 27 Dubinin M M, Chem Rev, 60(1960) 235.
28 Ozcan A S, Erdem B & Ozcan A, Colloids Surfaces [A]: Physicochem Eng Aspect, 266 (2005) 73.
29 Arh- Hwang Chen & Shin-Ming Chen, J Hazard Mater, 172 (2009) 1111.
30 Jaycock M J & Parfitt G D, Chemistry of Interfaces (Ellis Horwood Ltd. Chichester), 1981.

![[IJCT V3I4P11] Authors:Mrs. Komathi A, Mrs. Shoba. S. A](https://img.pdfslide.us/doc/110x75/58a5dd5d1a28abd14d8b55f1/ijct-v3i4p11-authorsmrs-komathi-a-mrs-shoba-s-a.jpg)
![[IJCT V3I3P6] Authors:Markus Gerhart, Marko Boger](https://img.pdfslide.us/doc/110x75/5888a0ca1a28ab264b8b5de7/ijct-v3i3p6-authorsmarkus-gerhart-marko-boger.jpg)
![[IJCT-V2I5P20] Authors : Abdallah Lakhouili , Hicham Medromi , El Hassan Essoufi](https://img.pdfslide.us/doc/110x75/5695d3491a28ab9b029d65b4/ijct-v2i5p20-authors-abdallah-lakhouili-hicham-medromi-el-hassan-essoufi.jpg)
![[IJCT V3I2P1]](https://img.pdfslide.us/doc/110x75/5876118f1a28ab306c8b5dbf/ijct-v3i2p1.jpg)

![[IJCT-V2I4P1] Authors :Saudagar Arshed Salim , Prof. Mr. Vinod Shinde](https://img.pdfslide.us/doc/110x75/55cf8663550346484b9723c3/ijct-v2i4p1-authors-saudagar-arshed-salim-prof-mr-vinod-shinde.jpg)

![[IJCT-V2I4P2] Authors :Philip Sallis , William Claster](https://img.pdfslide.us/doc/110x75/55c5b8ccbb61eb76608b459e/ijct-v2i4p2-authors-philip-sallis-william-claster.jpg)
![[IJCT V3I4P7] Authors: Mahalakshmi S., Kavitha S](https://img.pdfslide.us/doc/110x75/58f132911a28aba03e8b4611/ijct-v3i4p7-authors-mahalakshmi-s-kavitha-s.jpg)
![[IJCT V3I4P1] Authors: Anusha Itnal, Sujata Umarani](https://img.pdfslide.us/doc/110x75/58f1329c1a28ab03378b4675/ijct-v3i4p1-authors-anusha-itnal-sujata-umarani.jpg)
![[IJCT-V1I2P2] Author :Vahid Ghoreish](https://img.pdfslide.us/doc/110x75/577cc1761a28aba7119326b7/ijct-v1i2p2-author-vahid-ghoreish.jpg)
![[IJCT V3I4P13] Authors:Ms. Swathi G.,2 Ms. Abarna N](https://img.pdfslide.us/doc/110x75/5888a0a71a28ab264b8b5d81/ijct-v3i4p13-authorsms-swathi-g2-ms-abarna-n.jpg)
![[IJCT V3I4P12] Authors:Mrs. Sandhiya V., Ms. Abarna N.,](https://img.pdfslide.us/doc/110x75/5888a0a71a28ab264b8b5d83/ijct-v3i4p12-authorsmrs-sandhiya-v-ms-abarna-n.jpg)
![[IJCT V3I4P6] Authors: Bhavana Gujarkar , Ms.S.M.Borkar](https://img.pdfslide.us/doc/110x75/58a5dd341a28abd14d8b554d/ijct-v3i4p6-authors-bhavana-gujarkar-mssmborkar.jpg)
![[IJCT-V2I1P25] Author :Ibrahim K A Abughali, SonajhariaMinz](https://img.pdfslide.us/doc/110x75/55cf91f5550346f57b9227fa/ijct-v2i1p25-author-ibrahim-k-a-abughali-sonajhariaminz.jpg)
![[IJCT-V2I1P14] Author : O. O. Ajayi , O. O. Aribike](https://img.pdfslide.us/doc/110x75/5875b3591a28ab8b618b68f5/ijct-v2i1p14-author-o-o-ajayi-o-o-aribike.jpg)
![[IJCT V3I4P8] Authors: Mrs. Sangeetha Lakshmi .G, Ms. Arun kumari .G](https://img.pdfslide.us/doc/110x75/5888a0ca1a28ab264b8b5ddf/ijct-v3i4p8-authors-mrs-sangeetha-lakshmi-g-ms-arun-kumari-g.jpg)
![[IJCT V3I4P10] Authors: Ms. Asma Banu R., Mrs. Shoba S. A](https://img.pdfslide.us/doc/110x75/58a5dd5d1a28abd14d8b55f3/ijct-v3i4p10-authors-ms-asma-banu-r-mrs-shoba-s-a.jpg)
![[IJCT V3I3P9] Authors:AnumolBabu, Rose V Pattani](https://img.pdfslide.us/doc/110x75/58a38f331a28ab9c7e8b6a27/ijct-v3i3p9-authorsanumolbabu-rose-v-pattani.jpg)
![[IJCT V3I4P3] Authors: Markus Gerhart, Marko Boger](https://img.pdfslide.us/doc/110x75/5888a0ac1a28ab264b8b5d8b/ijct-v3i4p3-authors-markus-gerhart-marko-boger.jpg)
![[IJCT V3I3P5] Authors: Alok Kumar Dwivedi, Gouri Shankar Prajapati](https://img.pdfslide.us/doc/110x75/58a5dd341a28abd14d8b5549/ijct-v3i3p5-authors-alok-kumar-dwivedi-gouri-shankar-prajapati.jpg)

