Embed Size (px)
Citation preview
Adolescent Nutrition Survey in Nepal, 2014 1
Government of Nepal
Nepal Health Research Council
NEP
AL H
EA
LTH RESEARCH CO
UN
CIL
ESTD. 1991
Nepal Health Research Council (NHRC)Ramshah Path, Kathmandu, NepalTel : +977 1 4254220Fax : +977 1 4262469E-mail : [email protected] Website : www.nhrc.org.np
Adolescent Nutrition Survey in Nepal 2014
2 Adolescent Nutrition Survey in Nepal, 2014
Adolescent Nutrition Survey in Nepal, 2014
October 2016
Nepal Health Research CouncilRamshahpath, Kathmandu
Adolescent Nutrition Survey in Nepal, 2014 i
Adolescent Nutrition Survey in Nepal, 2014
AuthorsKrishna Kumar Aryal, Ranju Kumari Mehata, Binaya Chalise, Suresh Mehata, Femila Sapkota, Meghnath Dhimal, Bijay Kumar Jha, Khem Bahadur Karki
Recommended CitationAryal KK, Mehta RK, Chalise B, Mehata S, Sapkota F, Dhimal M, Jha BK, Karki KB. Adolescent Nutrition Survey in Nepal, 2014. Kathmandu, Nepal: Nepal Health Research Council, 2016.
Cover Photo source: Google Image
Adolescent Nutrition Survey in Nepal, 2014 i
List of Acronyms
BMI Body Mass IndexCLIA Chemiluminescence ImmunoassayEA Enumeration AreaERB Ethical Review BoardFCHV Female Community Health VolunteerHFW Height For WeightHP Health PostIFA Iron/Folic AcidINGO International Non-Government OrganizationNDHS Nepal Demographic Health SurveyNGO Non Government OrganizationNPHL Nepal Public Health LaboratoryNPR Nepalese RupeesPHC Primary Health CenterPPS Probability Proportionate SampleSEAR South East Asia RegionSPSS Statistical Package for Social Science SDG Sustainable Development GoalUNICE United Nations International Children’s Emergency Fund UNU United Nation UniversityVDC Village Development CommitteeWFA Weight For AgeWHO World Health Organization
ii Adolescent Nutrition Survey in Nepal, 2014
Executive Summary
The World Health Organization (WHO) defines adolescence as a period of life spanning the ages between 10-19 years where both physical as well as psychological changes occur. The major nutritional problems of adolescent population include stunting and thinness, micro nutrient deficiency and obesity. Generally, most health programs overlook these nutritional problems of adolescents because the adolescent population is often considered healthy. The study was thus executed to determine the nutritional status of adolescents in Nepal.
A descriptive cross sectional study was conducted in the fiscal year 2070/71 (2013/14). The study included male and female adolescents (10-19 years) from 13 districts representing the three ecological (Mountain, Hill and the Tarai) regions of Nepal. A multistage cluster sampling was used to select study district and the study participants. The study used data arising from the anthropometric measurement to determine adolescents’ nutritional status. Similarly, hemoglobin and serum ferritin level was assessed to determine the anemia prevalence.
The study findings reveal that 71% (95% CI: 61.2-79.1) of male (95% CI: 61.2-79.1) adolescents and 59% (95% CI: 48.2-68.5) of female (95% CI: 48.2-68.5) adolescents were undernourished. More than two-fifth 43% (95% CI: 28.2-58.4) married adolescent and 65% (95% CI: 55.5-74.2) of unmarried adolescents were undernourished. The likelihood of Uunder nutrition was high among adolescent residing in the Tarai 72% (95% CI: 62.1-79.8) followed by Hill 59% (95% CI: 47.8-68.7) and Mountain 54% (95% CI:43.0-64.2). The prevalence was almost similar among adolescents living in urban areas 63% (95%CI: 51.8-73.4) and rural areas 65% (95%CI:55.1-73.9). By religion, the highest prevalence of under nutrition was observed among Muslim 81% (95% CI: 63.2-91.1), followed by Hindu 66% (95%CI:55.7-74.4), Christian 65% (95% CI :48.2-78.3) and Buddhist 55% (95% CI:40.2-68.7). A higher prevalence was observed among disadvantaged non Dalit Tarai caste 80% (95% CI:71.3-86.9) followed by religious minorities 76% (95% CI:57.5-88.1). Adolescents without household latrine had prevalence of under nutrition 76% (95%CI:67.1-83.1) 61% (95%CI: 50.1-70.1) with household having latrine). Adolescents who refuse to wear shoes had higher prevalence of under nutrition 76% (95% CI:61.7-85.5) adolescents who prefer to wear shoes 64% (95% CI:54.3-73.2). Fruits and vegetables appeared to have protective effects against under nutrition. For example, the prevalence of under nutrition was higher among adolescents who ate less than one serving of fruits and vegetables per day compared to those eating 5 or more servings per day.
Overall, 35% of adolescents were anemic at the time of study. The figure is slightly higher among early adolescents 33% (95%CI:30.5-35.6) and 27% (95%CI:33.8-40.3) among late adolescent. The prevalence of anemia was 27% (95% CI:24.5-30.1) among male whereas almost double 42% (95%CI:38.9-45.0) among female. By religion, the highest prevalence was
Adolescent Nutrition Survey in Nepal, 2014 iii
observed among Muslims 45% (95%CI:33.0-58.2) followed by Christian 41% (95%CI:27.6-56.5) and Hindu 35%(95%CI:32.9-36.9). The least prevalence was observed among Buddhist 18% (95%CI:12.1-27.1). The highest prevalence was observed among religious minorities 44% (95%CI:29.6-58.5), followed by disadvantaged non Dalit Tarai adolescents 40% (95%CI:34.9-46.2) and the lowest among relatively advantaged Janajatis 21% (95% CI:14.8-29.3). The study suggests sanitation and hygiene could be an important determinant of anemia. Anemia prevalence was, for instance, lower 33% (95% CI:30.9-35.2) among adolescents having household latrine and among adolescents without latrine 38% (95%CI:34.0-43.1). Similarly, the prevalence was lower 34% (95%CI:31.8-35.6) among adolescents wearing shoes while going out than those 52% (95%CI:41.7-61.8) travelling barefooted. Anemia prevalence was 31% (95%CI:15.4-52.2) among adolescents consuming iron and folic acid while 35% (95% CI:32.7-36.5) among those not consuming the iron and folic acid.
The study concludes that adolescents from the disadvantaged group, residing in remote areas, having limited access to sanitation facilities and consuming little amount of fruits and vegetables are at risk of under nutrition as well as the anemia. The study, therefore, suggest targeted interventions to promote healthy eating and sanitation practices of the most vulnerable adolescents.
iv Adolescent Nutrition Survey in Nepal, 2014
Acknowledgement
I am grateful to all the members of the steering committee of Nutrition Unit of Nepal Health Research Council (NHRC) for their efforts and commitment for the completion of this report. I am greatly indebted to Prof Ramesh Kant Adhikari, for his invaluable advice in this project.I express my special thanks to core research team, Ms Femila Sapkota, Research Officer (Focal Person) and other Assistant Research Officers Asmita Shrestha, Nirmala Bhattarai and Sujata Acharya for their effort in proposal development, data collection, data entry and furthermore in completion of research project. I am thankful to Dr Krishna Aryal, Dr Suresh Mehata, Ms Ranju Kumari Mehta and Mr Binaya Chalise for data cleaning, data analysis and report writing of the study. Similarly, I am also thankful to Senior Research Officers Dr Meghnath Dhimal and Mr Purushottam Dhakal, for their contribution in the study. I am also thankful to Mr Bijay Kumar Jha, Training Officer as well as other staffs of NHRC for their support.
I thank the team of National Public Health Laboratory, Teku, Kathmandu for their support in testing the serum ferritin level for this study. I want to forward my special thanks to the staff of District (Public) Health Offices of selected Districts, health workers and FCHVs of selected VDCs and Municipalities who provided relevant support to conduct this study. I also would like to acknowledge the field research team of this study to have sincerely carried out the data collection. Similarly, I want to give thanks to all respondents who provided required information for the study.
Finally, I am grateful to all experts who had directly or indirectly contributed and supported to carry out this study.
Dr. Khem Bahadur KarkiMember SecretaryNepal Health Research Council
Adolescent Nutrition Survey in Nepal, 2014 v
Table of ContentsList of Acronyms iExecutive Summary iiAcknowledgement ivList of Tables viiChapter 1 Introduction 1
1.1 Background 11.2 General objectives: 21.3 Specific objectives: 21.4 Organization of the Report 2
Chapter 2 Methodology 32.1 Study Design 32.2 Sampling 32.3 Sample Size 42.4 Inclusion and Exclusion Criteria 52.5 Study Tools and Techniques 52.6 Training and Fieldwork 62.7 Quality Assurance 62.8 Data collection 62.8.1 Interview 62.8.2 Anthropometric Measurement 72.8.3 Hemoglobin Measurement 72.8.4 Ferritin Test 72.9 Data Management and Analysis 72.9.1 Anthropometric Data 82.9.2 Anemia 82.10 Limitation of the Study 92.11Ethical consideration 9
Chapter 3 Findings 103.1 Background Characteristics 103.2 Family Background 123.3 Source of Drinking Water 143.4 Health and Nutrition Habit 143.4.1 Smoking and Drinking Habits 143.4.2 Menstrual Practice 153.4.3 Food Habit 163.4.4 Food Variety 183.5 Knowledge of Nutrient and Nutritional Disorder 193.5.1 Nutritious Food 19
vi Adolescent Nutrition Survey in Nepal, 2014
3.5.2 Vitamin A and Night Blindness 203.5.3 Iodized Salt 223.5.4 Knowledge of Anemia 233.6 Nutritional Disorder 253.6.1 Worm Infestation 253.6.2 Malaria 263.6.3 Iron and Folic Acid 263.7 Nutritional Status 273.7.1 Under Nutrition by Socio-Demographic Characteristics 273.8 Anemia 293.8.1 Anemia by Socio-demographic Attributes 303.9 Ferritin Test 32
Chapter 4 Conclusion 334.1 Conclusion 334.2 Ways Forward 34References 35Annex I Informed Consent/Assent Form / Ethical Considerations 36Annex: II Questionnaire 40Annex III: Sample Weight 54
Adolescent Nutrition Survey in Nepal, 2014 vii
List of tables
Table 2.1: Sampled Districts by Ecological and Development Regions 3Table 2.2 Cut-Off Values for Anemia by Age and Sex of Adolescents 8Table 2.3: Adjusted Value for Hemoglobin Level by the Altitude of Clusters 8Table 3.1: Background characteristics of respondents 11Table 3.2: Socioeconomic background of adolescents’ family 12Table 3.3: Drinking water source 14Table 3.4: Smoking and alcohol drinking habit 15Table 3.5: Menstrual Practice of female respondents 16Table 3.6: Food habits of adolescents 17Table 3.7: Variety of Foods by number of food groups and age group 18Table 3.8: Awareness on nutrition and benefits of nutritious food 20Table 3.9: Awareness on vitamin A and night blindness 21Table 3.10: awareness on importance of Iodized salt 22Table 3.11: Awareness on anemia, its causes, sign and symptoms, preventive measures and source of information 23Table 3.12: Worm infestation status 25Table 3.13: Malaria prevalence 26Table 3.14: Taking Iron Folic acid tables 26Table 3.15: Nutritional status of adolescents 27Table 3.16: Under nutrition by background characteristics 28Table 3.17: Status of anemia among adolescents by age 29Table 3.18: Status of Anemia by Socioeconomic attributes of Adolescents. 30Table 3.19: Status of Iron Deficiency Anemia by Socioeconomic attributes of Adolescents. 32

viii Adolescent Nutrition Survey in Nepal, 2014
Adolescent Nutrition Survey in Nepal, 2014 1
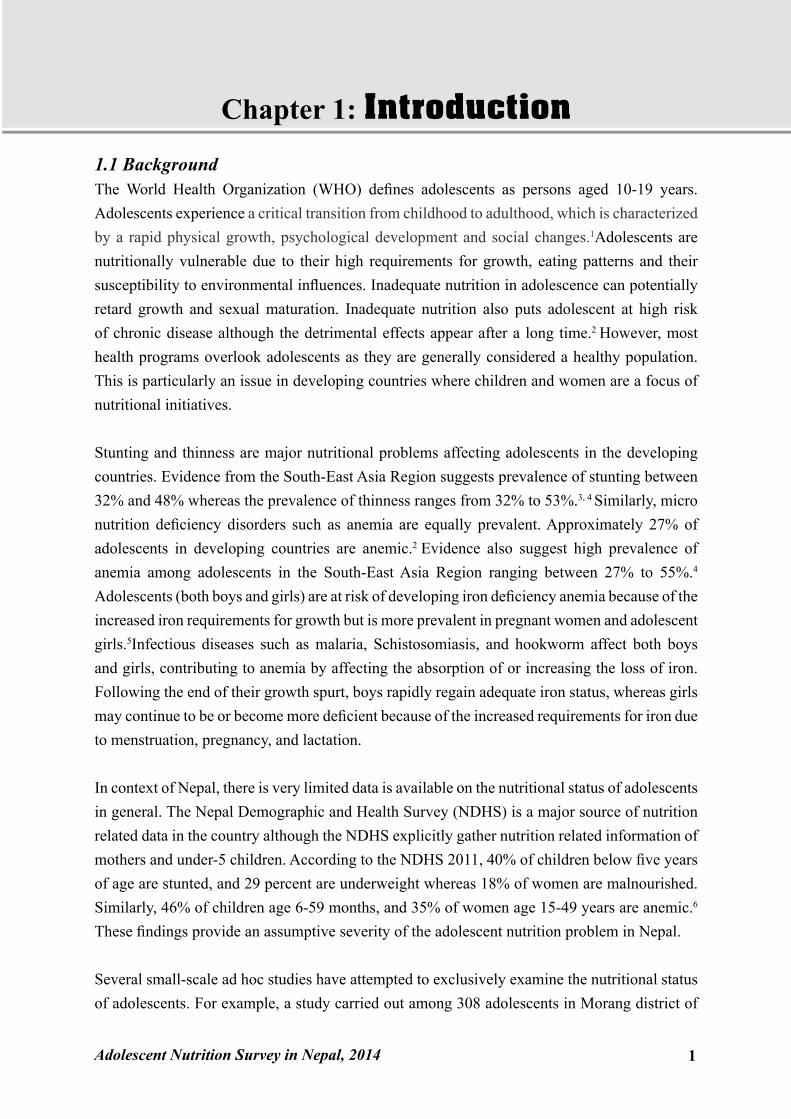
Chapter 1: Introduction1.1 BackgroundThe World Health Organization (WHO) defines adolescents as persons aged 10-19 years. Adolescents experience a critical transition from childhood to adulthood, which is characterized by a rapid physical growth, psychological development and social changes.1Adolescents are nutritionally vulnerable due to their high requirements for growth, eating patterns and their susceptibility to environmental influences. Inadequate nutrition in adolescence can potentially retard growth and sexual maturation. Inadequate nutrition also puts adolescent at high risk of chronic disease although the detrimental effects appear after a long time.2 However, most health programs overlook adolescents as they are generally considered a healthy population. This is particularly an issue in developing countries where children and women are a focus of nutritional initiatives.
Stunting and thinness are major nutritional problems affecting adolescents in the developing countries. Evidence from the South-East Asia Region suggests prevalence of stunting between 32% and 48% whereas the prevalence of thinness ranges from 32% to 53%.3, 4 Similarly, micro nutrition deficiency disorders such as anemia are equally prevalent. Approximately 27% of adolescents in developing countries are anemic.2 Evidence also suggest high prevalence of anemia among adolescents in the South-East Asia Region ranging between 27% to 55%.4
Adolescents (both boys and girls) are at risk of developing iron deficiency anemia because of the increased iron requirements for growth but is more prevalent in pregnant women and adolescent girls.5Infectious diseases such as malaria, Schistosomiasis, and hookworm affect both boys and girls, contributing to anemia by affecting the absorption of or increasing the loss of iron. Following the end of their growth spurt, boys rapidly regain adequate iron status, whereas girls may continue to be or become more deficient because of the increased requirements for iron due to menstruation, pregnancy, and lactation.
In context of Nepal, there is very limited data is available on the nutritional status of adolescents in general. The Nepal Demographic and Health Survey (NDHS) is a major source of nutrition related data in the country although the NDHS explicitly gather nutrition related information of mothers and under-5 children. According to the NDHS 2011, 40% of children below five years of age are stunted, and 29 percent are underweight whereas 18% of women are malnourished. Similarly, 46% of children age 6-59 months, and 35% of women age 15-49 years are anemic.6
These findings provide an assumptive severity of the adolescent nutrition problem in Nepal.
Several small-scale ad hoc studies have attempted to exclusively examine the nutritional status of adolescents. For example, a study carried out among 308 adolescents in Morang district of
2 Adolescent Nutrition Survey in Nepal, 2014
Nepal reported the overall prevalence of anemia as 66%, with high prevalence among female (78%) compare to male (53%).7 Similarly, a hospital based study carried out among 1047 adolescents from December 2011 to August 2012 in the same district noted the prevalence of iron deficiency anemia as 56%, with almost similar proportion among male (27%) and female (29%).8However, all previous studies suffer from some serious limitations. One major drawback is that small-scale studies such as these have not necessarily included adolescents aged 10-19 years. Moreover, these studies are limited to local surveys with small sample size. The generalizability of such studies on the issue is thus problematic. A better study would examine a large, randomly selected sample of adolescents aged 10-19 years representing ecological strata of the country.
The purpose of this study was thus to investigate nutritional status from a nationally representative sample of adolescents aged 10-19 years. During this process, the study followed a cross-sectional survey, using structured interview, anthropometric measurement and blood sample test as data collection methods to address the following general and specific research objectives.
1.2 General objectives:• To assess the nutritional status among adolescents in Nepal
1.3 Specific objectives:• To find out the socio demographic status of adolescents in Nepal• To assess the food consumption practices of Adolescents• To assess the sanitation and hygiene practices of adolescents• To find out the knowledge of nutrition among adolescents • To assess the nutritional status (anthropometry) of adolescents in Nepal• To identify the prevalence of anaemia among adolescent in Nepal• To identify the iron deficiency anaemia (Ferritin level in serum) in sub-sample of
adolescents population
1.4 Organization of the ReportThe research report has been organized into four chapters including this introductory chapter. The first chapter reviewed the overall status of adolescent nutrition in the country. Then, the chapter outlined general and specific objectives addressed by the study. The second chapter is a detail description of research strategies executed in the study. The third chapter moves on to present study findings focusing on the nutritional status and practices of adolescents. The final chapter gives a brief summary of the entire report and concludes with suggestion for further research and practices.
Adolescent Nutrition Survey in Nepal, 2014 3
Chapter 2: Methodology
The previous chapter reviewed overall status of adolescent nutrition in Nepal, and highlighted the evidence gap. The research objectives outlined in the previous chapter guided the research strategies in this study, which are the focus of this chapter. This chapter describes and discusses methods used during the study.
2.1 Study DesignThe adolescent nutrition survey is a nationally representative cross-sectional survey, designed to provide population estimates relating to adolescent nutritional indicators across the country. The survey was conducted in the fiscal year 2013/14 (2070/71 BS), which included adolescent population aged 10-19 years including both male and female.
2.2 SamplingMulti stage cluster sampling was applied for the Adolescent Nutrition Survey. Ecological and administrative stratification were considered in the sampling for the study. Ecologically, the country is divided into three ecological zones (mountains, hills, and the Tarai). The country's administrative division contains five development regions (Eastern, Central, Western, Mid Western and the Fare Western) and 75 districts divided into Village Development Committees (VDCs) and municipalities, which in turn are divided into wards. Each VDC has nine wards, while the number of wards in municipalities varies according to population, ranging from ten to 35. Each ward was classified as urban (located in a municipality) or rural (located in a VDC).
Sampling was carried out at three different stages to determine the study participants. In the first stage of sampling, study districts were selected such that the districts were representative of the ecological strata and the development regions. The NDHS 20116 divided Nepal’s ecological and administrative zones into 13 sub-regions. The study used the NDHS classification of sub-regions to randomly select one district form each of these 13 sub-regions. A list of selected districts from the sub-regions is depicted on table 2.1
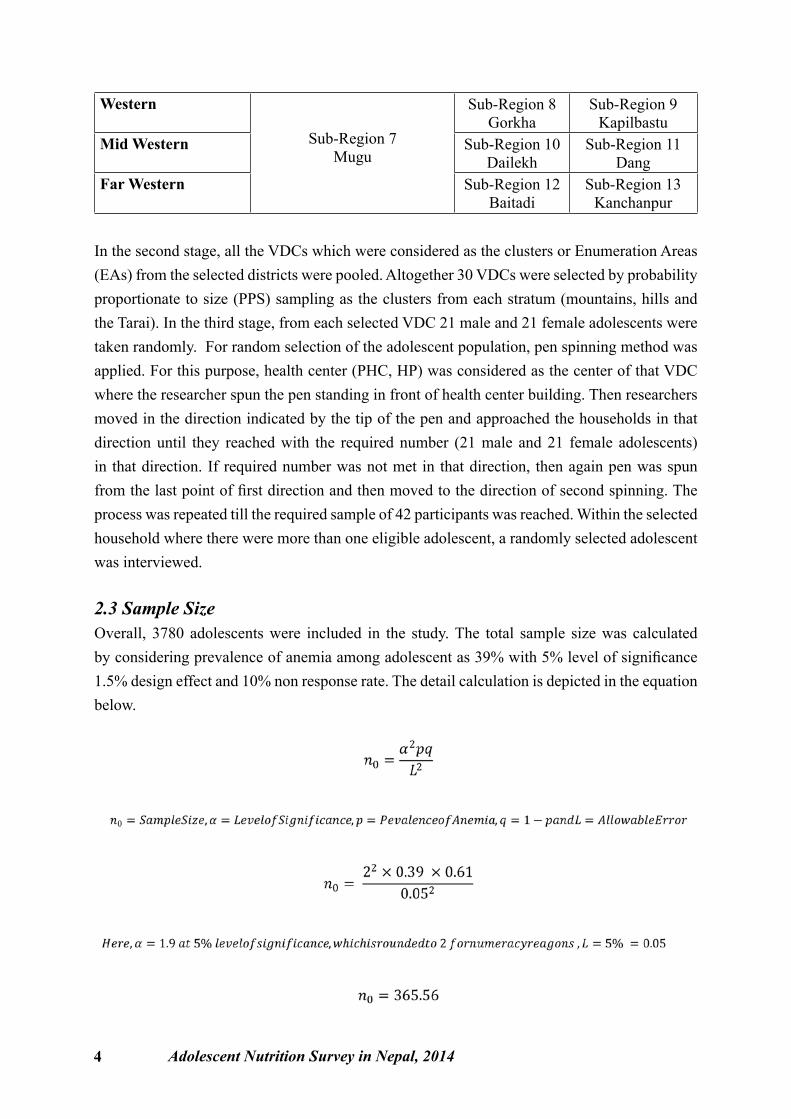
Table 2.1: Sampled Districts by Ecological and Development Regions
Development RegionEcological Region
Mountain Hill TeraiEastern Sub-Region I
TaplejungSub-Region 2
PachtharSub-Region 3
SaptariCentral Sub-Region 4
SindhupalchokSub-Region 5
SindhuliSub-Region 6
Mohattari
4 Adolescent Nutrition Survey in Nepal, 2014
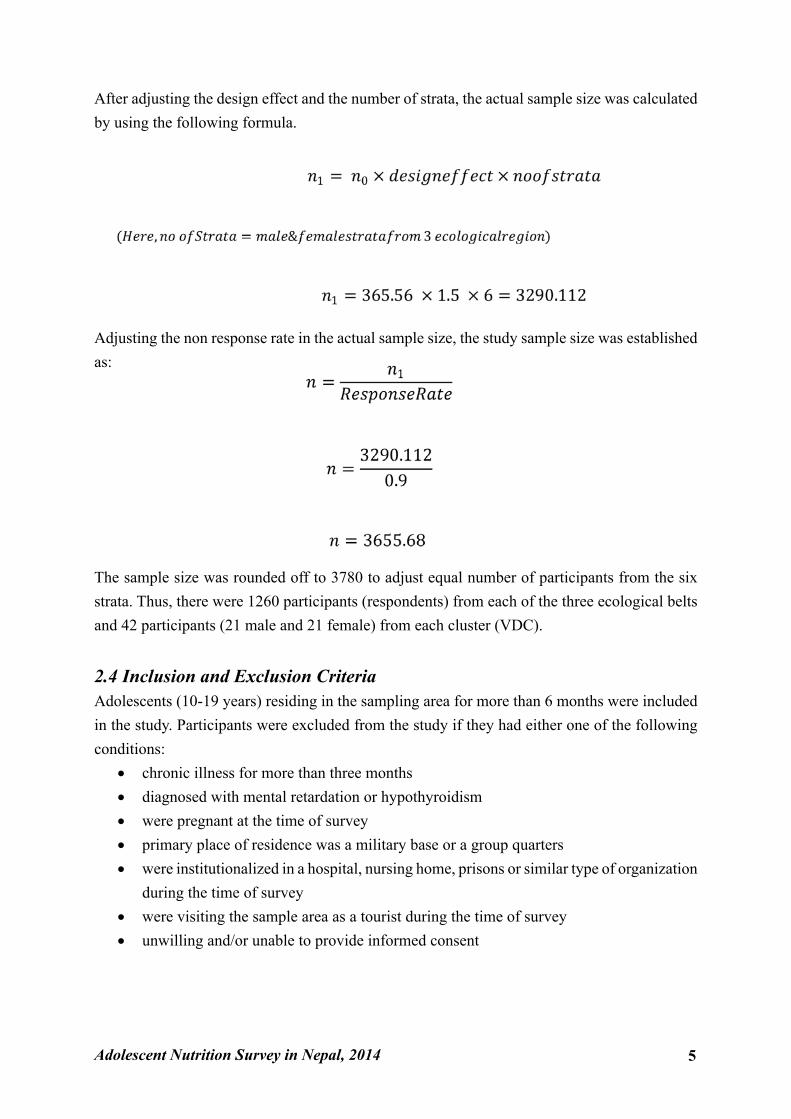
Western
Sub-Region 7Mugu
Sub-Region 8Gorkha
Sub-Region 9Kapilbastu
Mid Western Sub-Region 10Dailekh
Sub-Region 11Dang
Far Western Sub-Region 12Baitadi
Sub-Region 13Kanchanpur
In the second stage, all the VDCs which were considered as the clusters or Enumeration Areas (EAs) from the selected districts were pooled. Altogether 30 VDCs were selected by probability proportionate to size (PPS) sampling as the clusters from each stratum (mountains, hills and the Tarai). In the third stage, from each selected VDC 21 male and 21 female adolescents were taken randomly. For random selection of the adolescent population, pen spinning method was applied. For this purpose, health center (PHC, HP) was considered as the center of that VDC where the researcher spun the pen standing in front of health center building. Then researchers moved in the direction indicated by the tip of the pen and approached the households in that direction until they reached with the required number (21 male and 21 female adolescents) in that direction. If required number was not met in that direction, then again pen was spun from the last point of first direction and then moved to the direction of second spinning. The process was repeated till the required sample of 42 participants was reached. Within the selected household where there were more than one eligible adolescent, a randomly selected adolescent was interviewed.
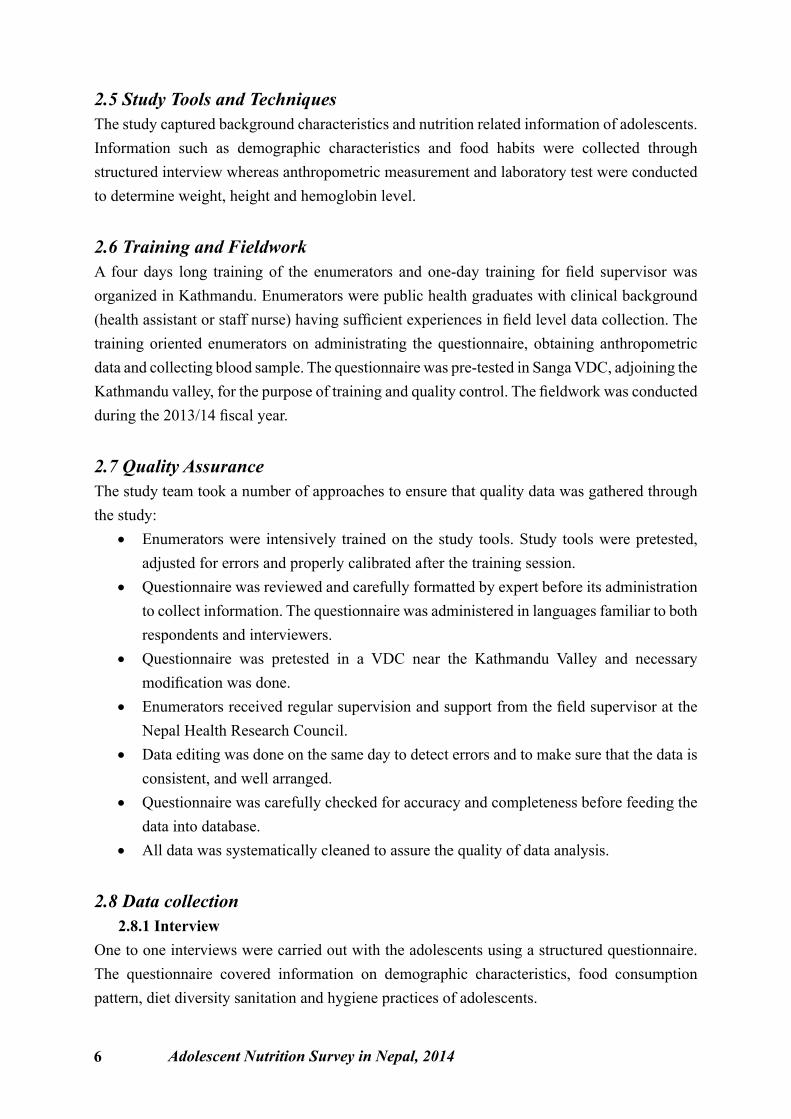
2.3 Sample SizeOverall, 3780 adolescents were included in the study. The total sample size was calculated by considering prevalence of anemia among adolescent as 39% with 5% level of significance 1.5% design effect and 10% non response rate. The detail calculation is depicted in the equation below.
Adolescent Nutrition Survey in Nepal, 2014 5
After adjusting the design effect and the number of strata, the actual sample size was calculated by using the following formula.
Adjusting the non response rate in the actual sample size, the study sample size was established as:
The sample size was rounded off to 3780 to adjust equal number of participants from the six strata. Thus, there were 1260 participants (respondents) from each of the three ecological belts and 42 participants (21 male and 21 female) from each cluster (VDC).
2.4 Inclusion and Exclusion CriteriaAdolescents (10-19 years) residing in the sampling area for more than 6 months were included in the study. Participants were excluded from the study if they had either one of the following conditions:
• chronic illness for more than three months• diagnosed with mental retardation or hypothyroidism • were pregnant at the time of survey• primary place of residence was a military base or a group quarters• were institutionalized in a hospital, nursing home, prisons or similar type of organization
during the time of survey• were visiting the sample area as a tourist during the time of survey• unwilling and/or unable to provide informed consent
6 Adolescent Nutrition Survey in Nepal, 2014
2.5 Study Tools and TechniquesThe study captured background characteristics and nutrition related information of adolescents. Information such as demographic characteristics and food habits were collected through structured interview whereas anthropometric measurement and laboratory test were conducted to determine weight, height and hemoglobin level.
2.6 Training and FieldworkA four days long training of the enumerators and one-day training for field supervisor was organized in Kathmandu. Enumerators were public health graduates with clinical background (health assistant or staff nurse) having sufficient experiences in field level data collection. The training oriented enumerators on administrating the questionnaire, obtaining anthropometric data and collecting blood sample. The questionnaire was pre-tested in Sanga VDC, adjoining the Kathmandu valley, for the purpose of training and quality control. The fieldwork was conducted during the 2013/14 fiscal year.
2.7 Quality AssuranceThe study team took a number of approaches to ensure that quality data was gathered through the study:
• Enumerators were intensively trained on the study tools. Study tools were pretested, adjusted for errors and properly calibrated after the training session.
• Questionnaire was reviewed and carefully formatted by expert before its administration to collect information. The questionnaire was administered in languages familiar to both respondents and interviewers.
• Questionnaire was pretested in a VDC near the Kathmandu Valley and necessary modification was done.
• Enumerators received regular supervision and support from the field supervisor at the Nepal Health Research Council.
• Data editing was done on the same day to detect errors and to make sure that the data is consistent, and well arranged.
• Questionnaire was carefully checked for accuracy and completeness before feeding the data into database.
• All data was systematically cleaned to assure the quality of data analysis.
2.8 Data collection2.8.1 Interview
One to one interviews were carried out with the adolescents using a structured questionnaire. The questionnaire covered information on demographic characteristics, food consumption pattern, diet diversity sanitation and hygiene practices of adolescents.
Adolescent Nutrition Survey in Nepal, 2014 7
2.8.2 Anthropometric MeasurementAnthropometric measurements of respondents were obtained by asking the age and then measuring and recording of height and weight. The age was taken in completed months and verified using birth certificate if available. The height of the adolescent was measured by using a height measuring scale. The weight of the respondents was measured by using a digital weighing scale. The apparatus used was readable to a one decimal point in Kilogram. Height-for-weight, weight-for-age, height-for-age and BMI was calculated to assess the nutritional status of the selected sample.
2.8.3 Hemoglobin MeasurementThe blood hemoglobin concentration of adolescent was measured by using the HemoCue system of HemoCue AB, Sweden. Trained enumerators conducted a procedure to collect blood sample. Each respondents and her/his guardian were asked for consent to participate in the hemoglobin testing of respondents. A sterile lancet was used to prick blood from finger. The third and fourth drop of blood was collected on microcuvette after discarding the first and second drop of blood. Then, the microcuvette was placed in HemoCue machine after calibrating to zero. The observed haemoglobin level was recorded on the questionnaire.
2.8.4 Ferritin TestFerritin test was carried out to those anemic samples of the Tarai districts. Trained enumerators collected blood samples and separated the blood serum in the field. Then, the serum samples were transported the same day to the National Public Health Laboratory in Kathmandu, maintaining the cold chain. Chemiluminescence Immunoassay (CLIA) was used to conduct the ferritin test.
2.9 Data Management and AnalysisThe collected data was checked and edited at the end of each day of data collection. Then, data was recorded in epi-data and analyzed by using SPSS. Frequency tables of all variables were generated along with the cross tabulation between nutrition status and the background variables. In order to obtain nationally representative results from the survey, it was necessary to calculate appropriate sample weights based on the sample design (see Annex 3). This has eliminated any bias related to the probabilities of selecting one district in each sub-region. Moreover, without weighting the characteristics of the larger sub-regions (with more districts) would have under represented and the characteristics of the smaller sub-regions(with fewer districts) would have over-represented. The data were post-stratified by age group into two categories as early adolescent and the late adolescents. Then, based on Nepal Population and Housing Census9, sample weight was applied to each category to represent the district sample for the region.
8 Adolescent Nutrition Survey in Nepal, 2014
2.9.1 Anthropometric DataBody Mass Index (BMI) was calculated using the anthropometric data to determine the nutritional status of adolescents. Adolescents with BMI less than 18.5 were classified as underweight. Similarly, adolescents with BMI between 18.5 and 24.9 were classified as normal where as adolescents with BMI more than or equal to 25 were categorized as overweight.
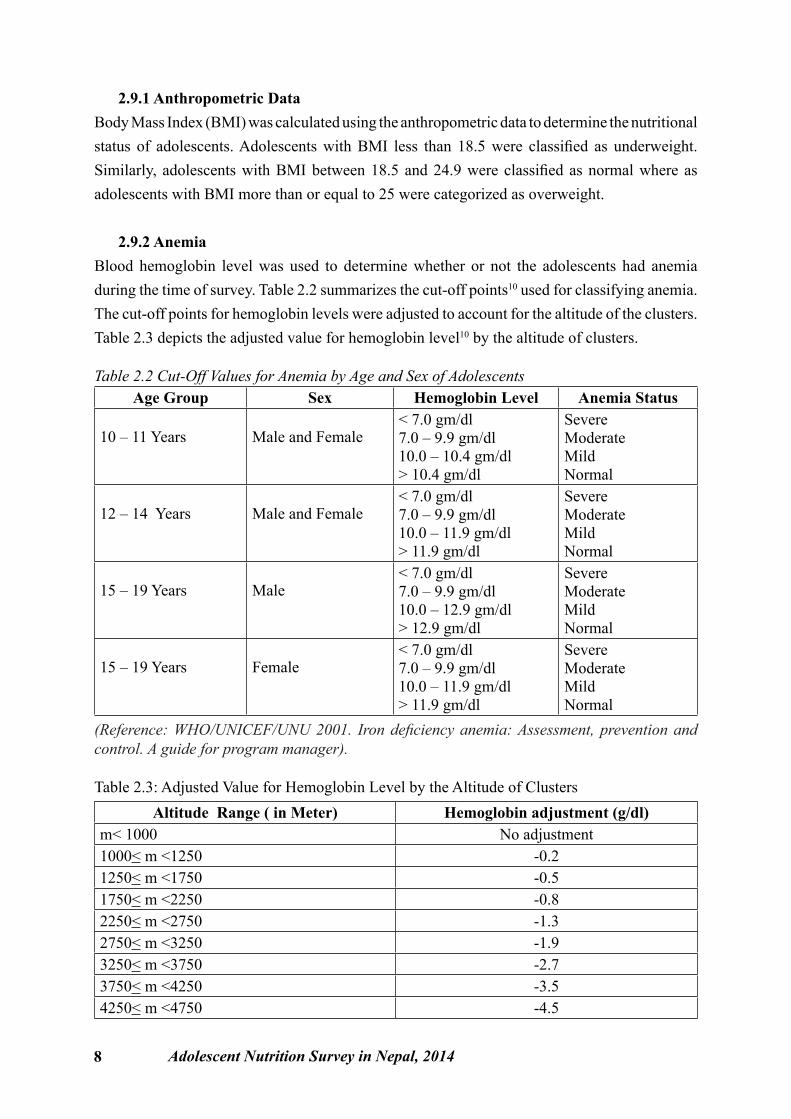
2.9.2 AnemiaBlood hemoglobin level was used to determine whether or not the adolescents had anemia during the time of survey. Table 2.2 summarizes the cut-off points10 used for classifying anemia. The cut-off points for hemoglobin levels were adjusted to account for the altitude of the clusters. Table 2.3 depicts the adjusted value for hemoglobin level10 by the altitude of clusters.
Table 2.2 Cut-Off Values for Anemia by Age and Sex of AdolescentsAge Group Sex Hemoglobin Level Anemia Status
10 – 11 Years Male and Female< 7.0 gm/dl 7.0 – 9.9 gm/dl10.0 – 10.4 gm/dl> 10.4 gm/dl
SevereModerateMildNormal
12 – 14 Years Male and Female< 7.0 gm/dl 7.0 – 9.9 gm/dl10.0 – 11.9 gm/dl> 11.9 gm/dl
SevereModerateMildNormal
15 – 19 Years Male< 7.0 gm/dl 7.0 – 9.9 gm/dl10.0 – 12.9 gm/dl> 12.9 gm/dl
SevereModerateMildNormal
15 – 19 Years Female< 7.0 gm/dl 7.0 – 9.9 gm/dl10.0 – 11.9 gm/dl> 11.9 gm/dl
SevereModerateMildNormal
(Reference: WHO/UNICEF/UNU 2001. Iron deficiency anemia: Assessment, prevention and control. A guide for program manager).
Table 2.3: Adjusted Value for Hemoglobin Level by the Altitude of ClustersAltitude Range ( in Meter) Hemoglobin adjustment (g/dl)
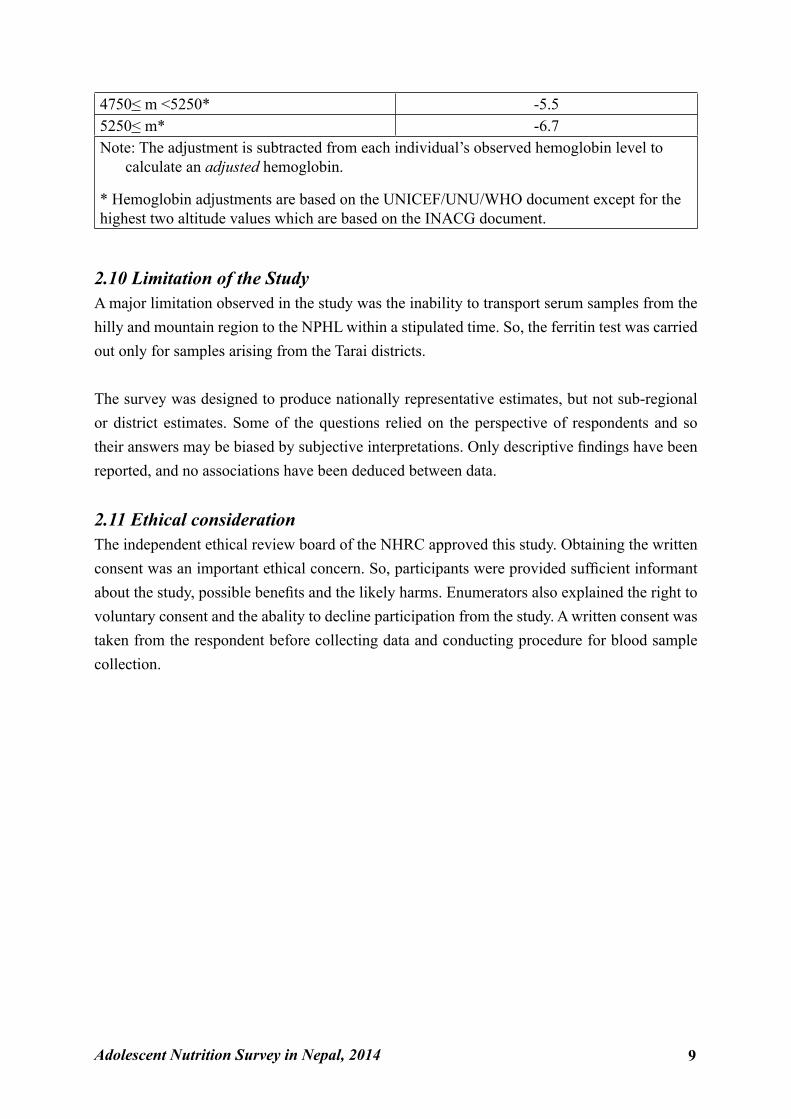
m< 1000 No adjustment1000< m <1250 -0.21250< m <1750 -0.51750< m <2250 -0.82250< m <2750 -1.32750< m <3250 -1.93250< m <3750 -2.73750< m <4250 -3.54250< m <4750 -4.5
Adolescent Nutrition Survey in Nepal, 2014 9
4750< m <5250* -5.55250< m* -6.7Note: The adjustment is subtracted from each individual’s observed hemoglobin level to
calculate an adjusted hemoglobin.
* Hemoglobin adjustments are based on the UNICEF/UNU/WHO document except for the highest two altitude values which are based on the INACG document.
2.10 Limitation of the StudyA major limitation observed in the study was the inability to transport serum samples from the hilly and mountain region to the NPHL within a stipulated time. So, the ferritin test was carried out only for samples arising from the Tarai districts.
The survey was designed to produce nationally representative estimates, but not sub-regional or district estimates. Some of the questions relied on the perspective of respondents and so their answers may be biased by subjective interpretations. Only descriptive findings have been reported, and no associations have been deduced between data.
2.11 Ethical considerationThe independent ethical review board of the NHRC approved this study. Obtaining the written consent was an important ethical concern. So, participants were provided sufficient informant about the study, possible benefits and the likely harms. Enumerators also explained the right to voluntary consent and the abality to decline participation from the study. A written consent was taken from the respondent before collecting data and conducting procedure for blood sample collection.
10 Adolescent Nutrition Survey in Nepal, 2014
Chapter 3: FindingsThe purpose of this chapter is to present the findings obtained from the Adolescent Nutrition Survey. In line with the research objectives outlined in the first chapter, this chapter summarizes the study findings under relevant headings and subheadings. The chapter begins by describing background characteristics of adolescents included in the survey. Then the chapter moves on to explain findings related to health and nutritional practices of adolescents. Describing the nutritional status of adolescents obtained from the anthropometric measurement and blood sample test will conclude this chapter.
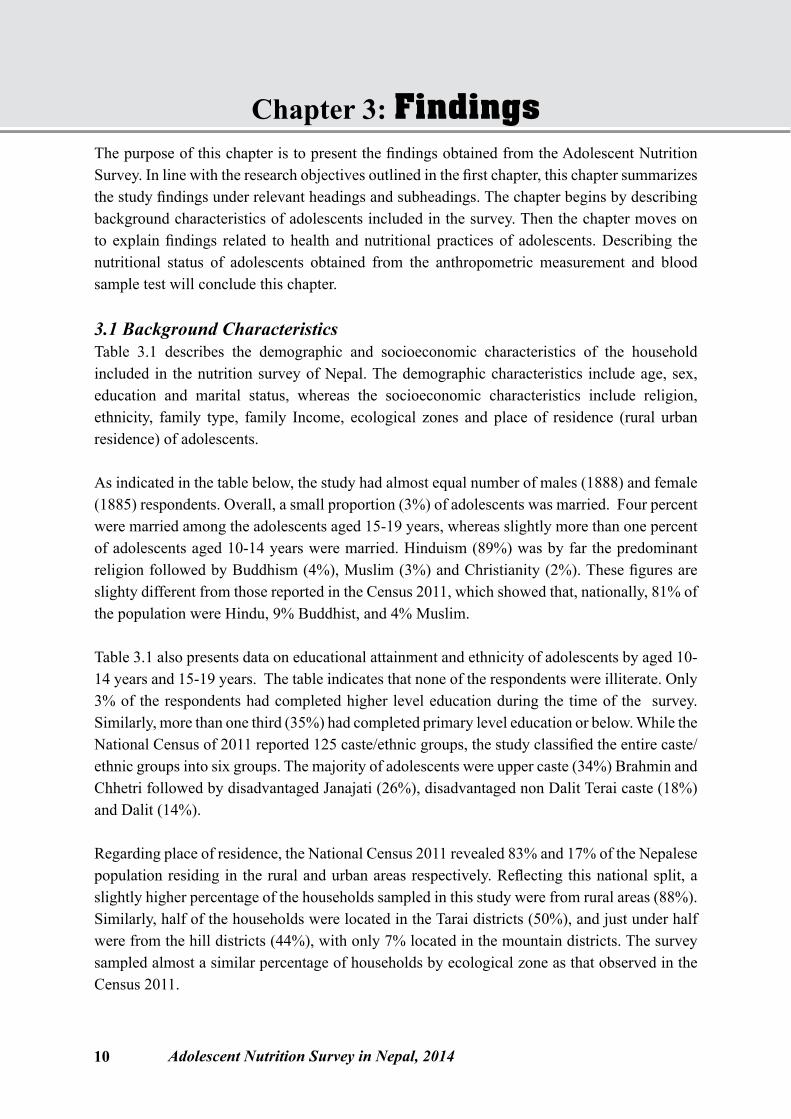
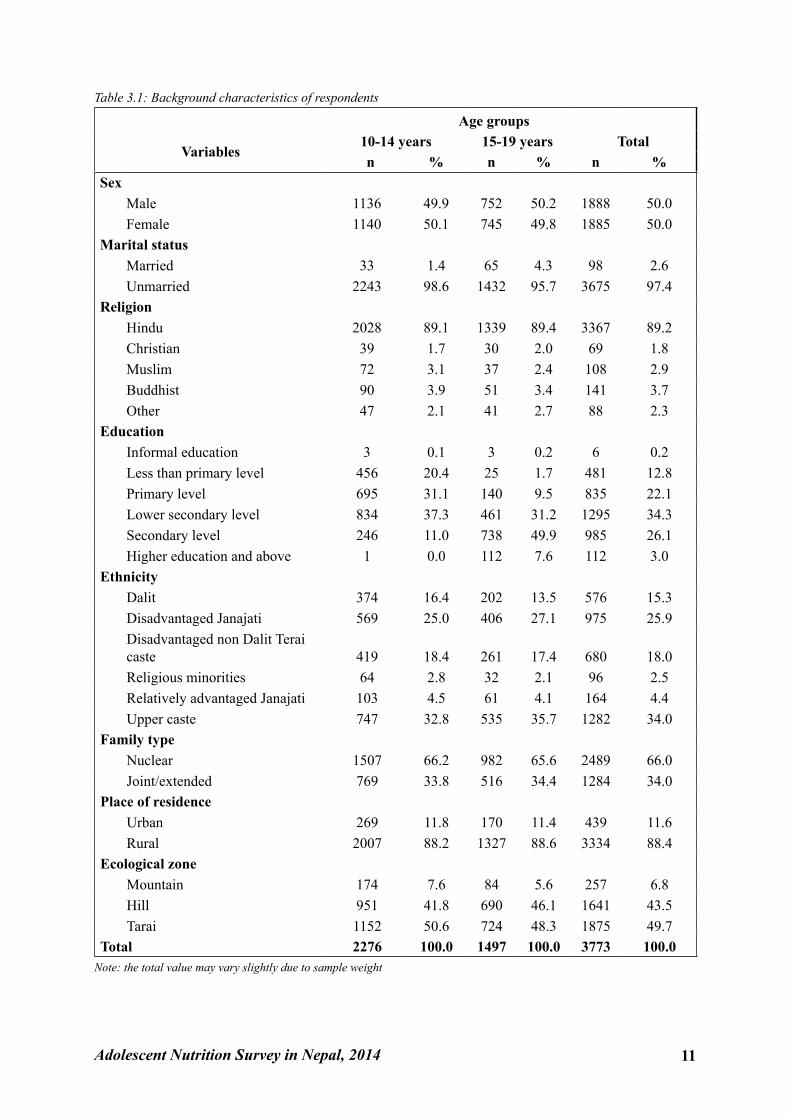
3.1 Background CharacteristicsTable 3.1 describes the demographic and socioeconomic characteristics of the household included in the nutrition survey of Nepal. The demographic characteristics include age, sex, education and marital status, whereas the socioeconomic characteristics include religion, ethnicity, family type, family Income, ecological zones and place of residence (rural urban residence) of adolescents.
As indicated in the table below, the study had almost equal number of males (1888) and female (1885) respondents. Overall, a small proportion (3%) of adolescents was married. Four percent were married among the adolescents aged 15-19 years, whereas slightly more than one percent of adolescents aged 10-14 years were married. Hinduism (89%) was by far the predominant religion followed by Buddhism (4%), Muslim (3%) and Christianity (2%). These figures are slighty different from those reported in the Census 2011, which showed that, nationally, 81% of the population were Hindu, 9% Buddhist, and 4% Muslim.
Table 3.1 also presents data on educational attainment and ethnicity of adolescents by aged 10-14 years and 15-19 years. The table indicates that none of the respondents were illiterate. Only 3% of the respondents had completed higher level education during the time of the survey. Similarly, more than one third (35%) had completed primary level education or below. While the National Census of 2011 reported 125 caste/ethnic groups, the study classified the entire caste/ethnic groups into six groups. The majority of adolescents were upper caste (34%) Brahmin and Chhetri followed by disadvantaged Janajati (26%), disadvantaged non Dalit Terai caste (18%) and Dalit (14%).
Regarding place of residence, the National Census 2011 revealed 83% and 17% of the Nepalese population residing in the rural and urban areas respectively. Reflecting this national split, a slightly higher percentage of the households sampled in this study were from rural areas (88%). Similarly, half of the households were located in the Tarai districts (50%), and just under half were from the hill districts (44%), with only 7% located in the mountain districts. The survey sampled almost a similar percentage of households by ecological zone as that observed in the Census 2011.
Adolescent Nutrition Survey in Nepal, 2014 11
Table 3.1: Background characteristics of respondents
Age groups
Variables 10-14 years 15-19 years Total n % n % n %
SexMale 1136 49.9 752 50.2 1888 50.0Female 1140 50.1 745 49.8 1885 50.0
Marital statusMarried 33 1.4 65 4.3 98 2.6Unmarried 2243 98.6 1432 95.7 3675 97.4
ReligionHindu 2028 89.1 1339 89.4 3367 89.2Christian 39 1.7 30 2.0 69 1.8Muslim 72 3.1 37 2.4 108 2.9Buddhist 90 3.9 51 3.4 141 3.7Other 47 2.1 41 2.7 88 2.3
EducationInformal education 3 0.1 3 0.2 6 0.2Less than primary level 456 20.4 25 1.7 481 12.8Primary level 695 31.1 140 9.5 835 22.1Lower secondary level 834 37.3 461 31.2 1295 34.3Secondary level 246 11.0 738 49.9 985 26.1Higher education and above 1 0.0 112 7.6 112 3.0
EthnicityDalit 374 16.4 202 13.5 576 15.3Disadvantaged Janajati 569 25.0 406 27.1 975 25.9Disadvantaged non Dalit Terai caste 419 18.4 261 17.4 680 18.0Religious minorities 64 2.8 32 2.1 96 2.5Relatively advantaged Janajati 103 4.5 61 4.1 164 4.4Upper caste 747 32.8 535 35.7 1282 34.0
Family typeNuclear 1507 66.2 982 65.6 2489 66.0Joint/extended 769 33.8 516 34.4 1284 34.0
Place of residenceUrban 269 11.8 170 11.4 439 11.6Rural 2007 88.2 1327 88.6 3334 88.4
Ecological zoneMountain 174 7.6 84 5.6 257 6.8Hill 951 41.8 690 46.1 1641 43.5Tarai 1152 50.6 724 48.3 1875 49.7
Total 2276 100.0 1497 100.0 3773 100.0Note: the total value may vary slightly due to sample weight
12 Adolescent Nutrition Survey in Nepal, 2014
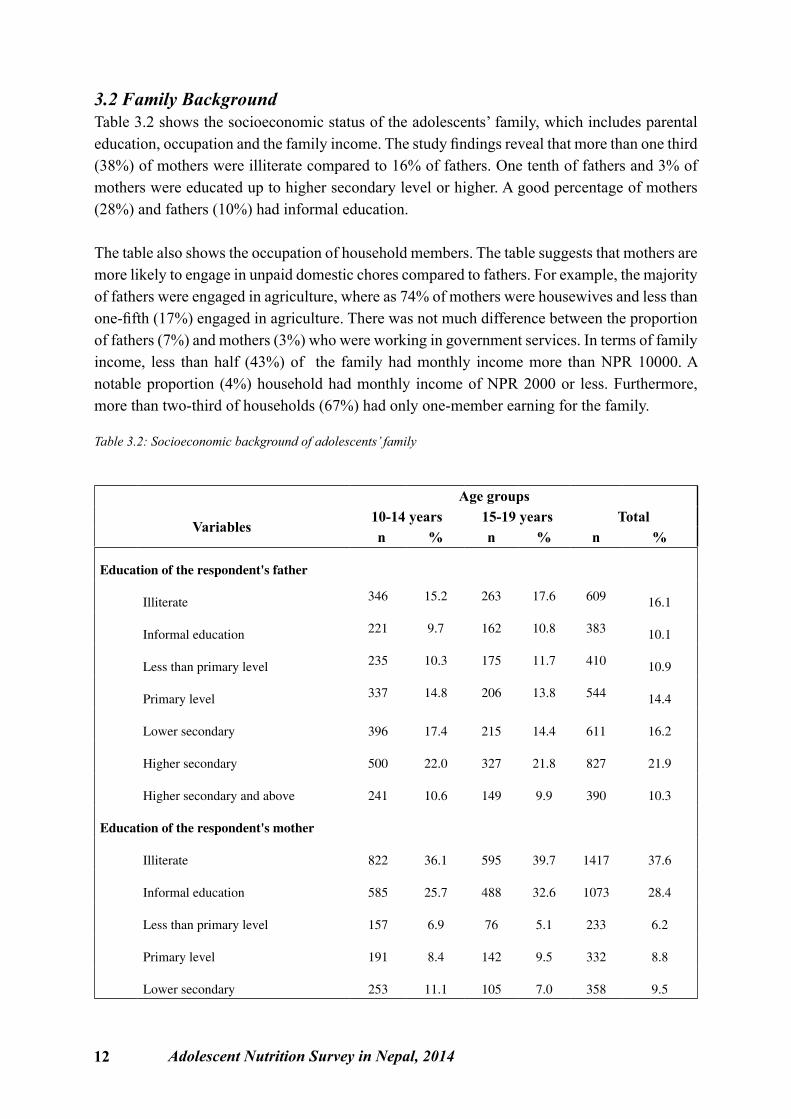
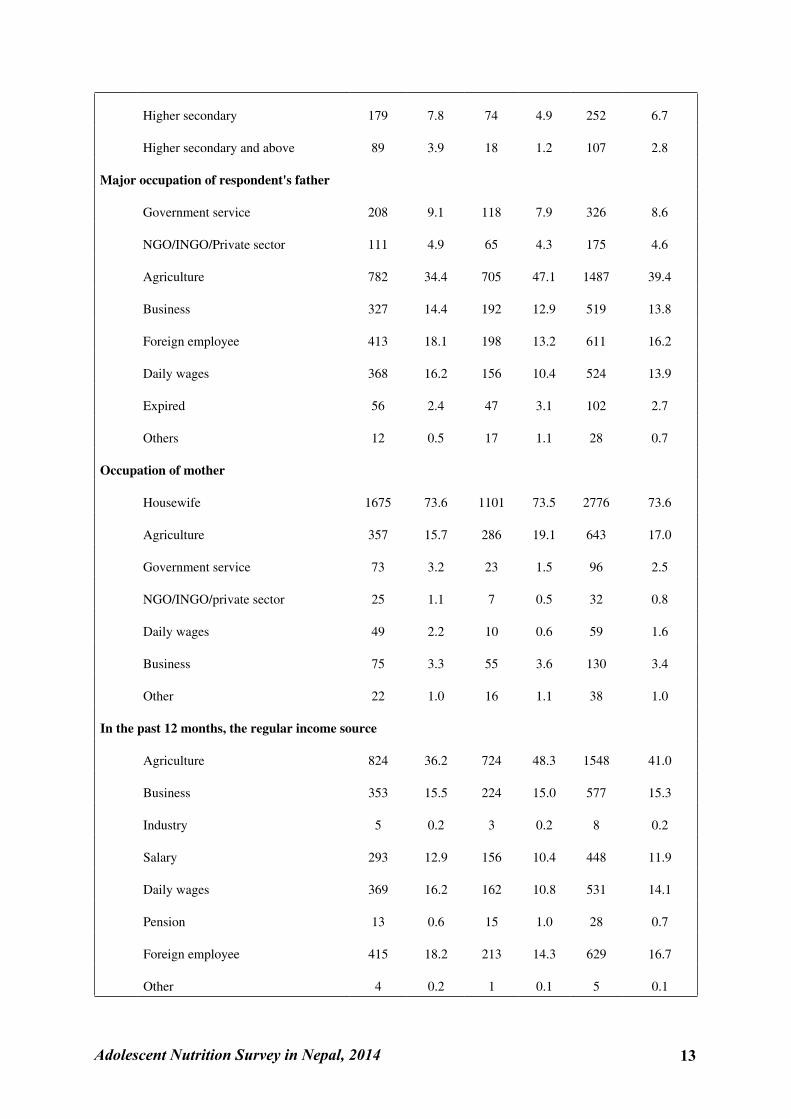
3.2 Family BackgroundTable 3.2 shows the socioeconomic status of the adolescents’ family, which includes parental education, occupation and the family income. The study findings reveal that more than one third (38%) of mothers were illiterate compared to 16% of fathers. One tenth of fathers and 3% of mothers were educated up to higher secondary level or higher. A good percentage of mothers (28%) and fathers (10%) had informal education.
The table also shows the occupation of household members. The table suggests that mothers are more likely to engage in unpaid domestic chores compared to fathers. For example, the majority of fathers were engaged in agriculture, where as 74% of mothers were housewives and less than one-fifth (17%) engaged in agriculture. There was not much difference between the proportion of fathers (7%) and mothers (3%) who were working in government services. In terms of family income, less than half (43%) of the family had monthly income more than NPR 10000. A notable proportion (4%) household had monthly income of NPR 2000 or less. Furthermore, more than two-third of households (67%) had only one-member earning for the family.
Table 3.2: Socioeconomic background of adolescents’ family
Age groups
Variables 10-14 years 15-19 years Total n % n % n %
Education of the respondent's father
Illiterate 346 15.2 263 17.6 609 16.1
Informal education 221 9.7 162 10.8 383 10.1
Less than primary level 235 10.3 175 11.7 410 10.9
Primary level 337 14.8 206 13.8 544 14.4
Lower secondary 396 17.4 215 14.4 611 16.2
Higher secondary 500 22.0 327 21.8 827 21.9
Higher secondary and above 241 10.6 149 9.9 390 10.3
Education of the respondent's mother
Illiterate 822 36.1 595 39.7 1417 37.6
Informal education 585 25.7 488 32.6 1073 28.4
Less than primary level 157 6.9 76 5.1 233 6.2
Primary level 191 8.4 142 9.5 332 8.8
Lower secondary 253 11.1 105 7.0 358 9.5
Adolescent Nutrition Survey in Nepal, 2014 13
Higher secondary 179 7.8 74 4.9 252 6.7
Higher secondary and above 89 3.9 18 1.2 107 2.8
Major occupation of respondent's father
Government service 208 9.1 118 7.9 326 8.6
NGO/INGO/Private sector 111 4.9 65 4.3 175 4.6
Agriculture 782 34.4 705 47.1 1487 39.4
Business 327 14.4 192 12.9 519 13.8
Foreign employee 413 18.1 198 13.2 611 16.2
Daily wages 368 16.2 156 10.4 524 13.9
Expired 56 2.4 47 3.1 102 2.7
Others 12 0.5 17 1.1 28 0.7
Occupation of mother
Housewife 1675 73.6 1101 73.5 2776 73.6
Agriculture 357 15.7 286 19.1 643 17.0
Government service 73 3.2 23 1.5 96 2.5
NGO/INGO/private sector 25 1.1 7 0.5 32 0.8
Daily wages 49 2.2 10 0.6 59 1.6
Business 75 3.3 55 3.6 130 3.4
Other 22 1.0 16 1.1 38 1.0
In the past 12 months, the regular income source
Agriculture 824 36.2 724 48.3 1548 41.0
Business 353 15.5 224 15.0 577 15.3
Industry 5 0.2 3 0.2 8 0.2
Salary 293 12.9 156 10.4 448 11.9
Daily wages 369 16.2 162 10.8 531 14.1
Pension 13 0.6 15 1.0 28 0.7
Foreign employee 415 18.2 213 14.3 629 16.7
Other 4 0.2 1 0.1 5 0.1
14 Adolescent Nutrition Survey in Nepal, 2014
Number of earning members in the family
One 1605 70.6 917 61.3 2522 66.8
Two 556 24.4 462 30.9 1018 27.0
Three 113 5.0 117 7.8 230 6.1
Monthly income of family in NPR
≤2000 88 3.8 51 3.4 139 3.7
2001-5000 482 21.2 273 18.2 755 20.0
5001-10000 790 34.7 480 32.0 1270 33.7
>10000 915 40.2 693 46.3 1609 42.6
Total 2275 100.0 1497 100.0 3772 100.0
Note: the total value may vary slightly due to sample weight
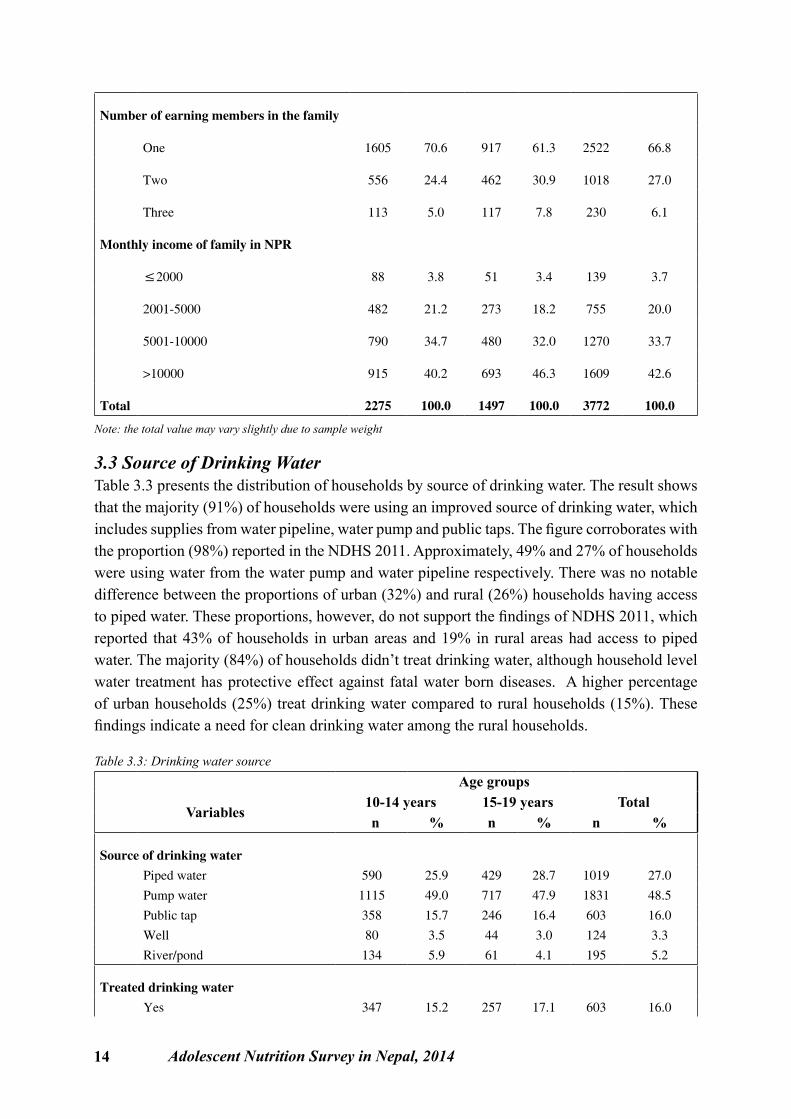
3.3 Source of Drinking WaterTable 3.3 presents the distribution of households by source of drinking water. The result shows that the majority (91%) of households were using an improved source of drinking water, which includes supplies from water pipeline, water pump and public taps. The figure corroborates with the proportion (98%) reported in the NDHS 2011. Approximately, 49% and 27% of households were using water from the water pump and water pipeline respectively. There was no notable difference between the proportions of urban (32%) and rural (26%) households having access to piped water. These proportions, however, do not support the findings of NDHS 2011, which reported that 43% of households in urban areas and 19% in rural areas had access to piped water. The majority (84%) of households didn’t treat drinking water, although household level water treatment has protective effect against fatal water born diseases. A higher percentage of urban households (25%) treat drinking water compared to rural households (15%). These findings indicate a need for clean drinking water among the rural households.
Table 3.3: Drinking water source Age groups
Variables 10-14 years 15-19 years Total n % n % n %
Source of drinking water Piped water 590 25.9 429 28.7 1019 27.0
Pump water 1115 49.0 717 47.9 1831 48.5
Public tap 358 15.7 246 16.4 603 16.0
Well 80 3.5 44 3.0 124 3.3
River/pond 134 5.9 61 4.1 195 5.2
Treated drinking water Yes 347 15.2 257 17.1 603 16.0
Adolescent Nutrition Survey in Nepal, 2014 15
No 1929 84.8 1240 82.9 3169 84.0
Total 2276 100.0 1497 100.0 3773 100.0
Note: the total value may vary slightly due to sample weight
3.4 Health and Nutrition HabitThis section presents findings related to health and nutrition habits of adolescents. The specific focus of the section is on smoking and drinking habits, menstrual practices and the food consumption practices of adolescents.
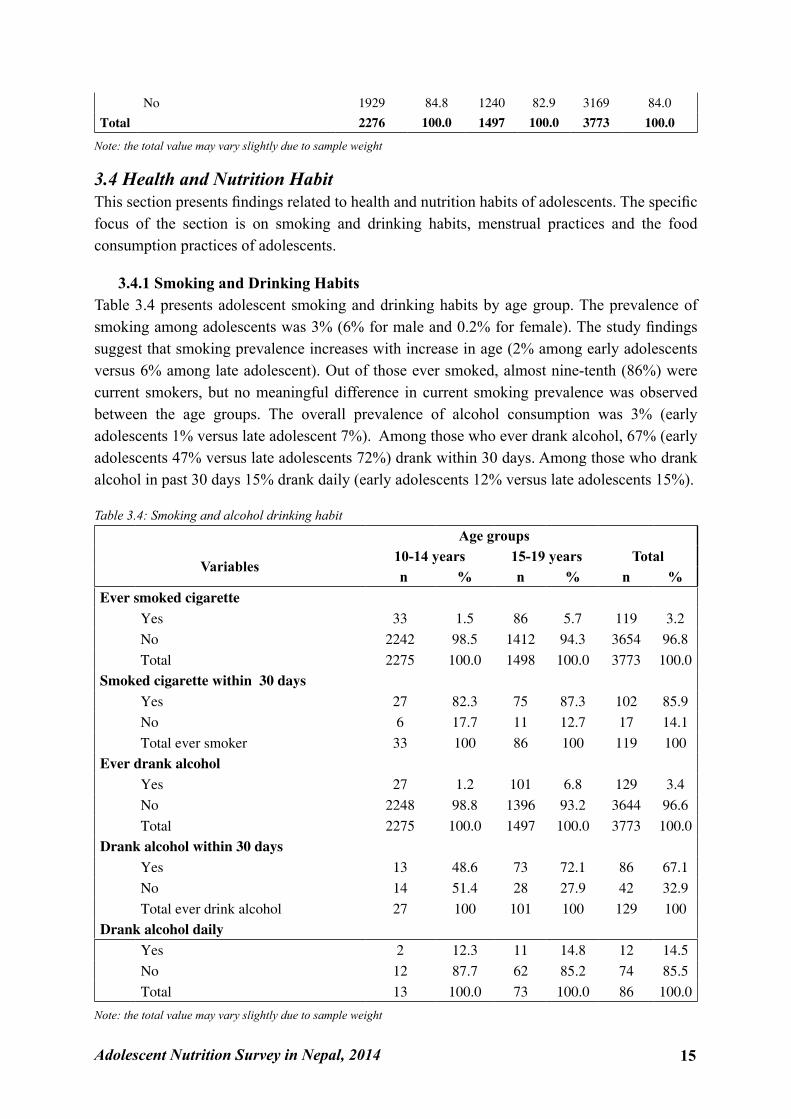
3.4.1 Smoking and Drinking HabitsTable 3.4 presents adolescent smoking and drinking habits by age group. The prevalence of smoking among adolescents was 3% (6% for male and 0.2% for female). The study findings suggest that smoking prevalence increases with increase in age (2% among early adolescents versus 6% among late adolescent). Out of those ever smoked, almost nine-tenth (86%) were current smokers, but no meaningful difference in current smoking prevalence was observed between the age groups. The overall prevalence of alcohol consumption was 3% (early adolescents 1% versus late adolescent 7%). Among those who ever drank alcohol, 67% (early adolescents 47% versus late adolescents 72%) drank within 30 days. Among those who drank alcohol in past 30 days 15% drank daily (early adolescents 12% versus late adolescents 15%).
Table 3.4: Smoking and alcohol drinking habit Age groups
Variables 10-14 years 15-19 years Total n % n % n %
Ever smoked cigarette Yes 33 1.5 86 5.7 119 3.2 No 2242 98.5 1412 94.3 3654 96.8
Total 2275 100.0 1498 100.0 3773 100.0Smoked cigarette within 30 days Yes 27 82.3 75 87.3 102 85.9 No 6 17.7 11 12.7 17 14.1
Total ever smoker 33 100 86 100 119 100Ever drank alcohol Yes 27 1.2 101 6.8 129 3.4 No 2248 98.8 1396 93.2 3644 96.6
Total 2275 100.0 1497 100.0 3773 100.0Drank alcohol within 30 days Yes 13 48.6 73 72.1 86 67.1 No 14 51.4 28 27.9 42 32.9
Total ever drink alcohol 27 100 101 100 129 100Drank alcohol daily Yes 2 12.3 11 14.8 12 14.5 No 12 87.7 62 85.2 74 85.5
Total 13 100.0 73 100.0 86 100.0
Note: the total value may vary slightly due to sample weight
16 Adolescent Nutrition Survey in Nepal, 2014
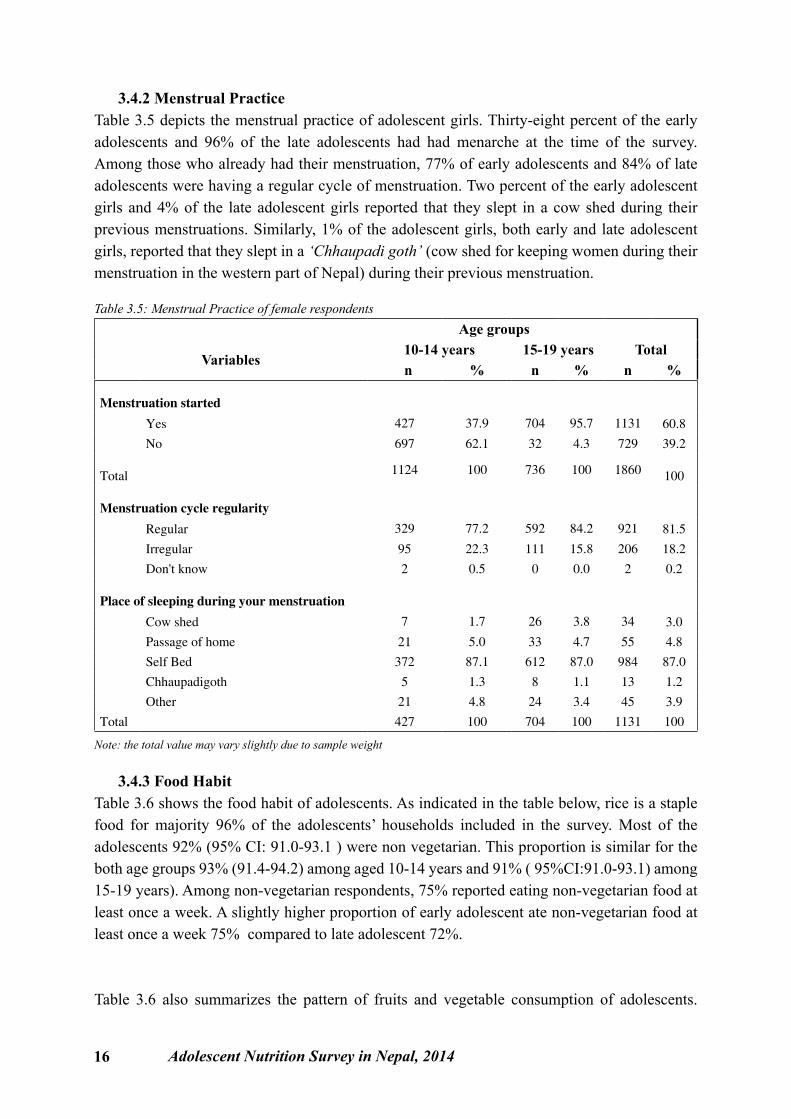
3.4.2 Menstrual PracticeTable 3.5 depicts the menstrual practice of adolescent girls. Thirty-eight percent of the early adolescents and 96% of the late adolescents had had menarche at the time of the survey. Among those who already had their menstruation, 77% of early adolescents and 84% of late adolescents were having a regular cycle of menstruation. Two percent of the early adolescent girls and 4% of the late adolescent girls reported that they slept in a cow shed during their previous menstruations. Similarly, 1% of the adolescent girls, both early and late adolescent girls, reported that they slept in a ‘Chhaupadi goth’ (cow shed for keeping women during their menstruation in the western part of Nepal) during their previous menstruation.
Table 3.5: Menstrual Practice of female respondents Age groups
Variables 10-14 years 15-19 years Total
n % n % n %
Menstruation started
Yes 427 37.9 704 95.7 1131 60.8
No 697 62.1 32 4.3 729 39.2
Total 1124 100 736 100 1860 100
Menstruation cycle regularity
Regular 329 77.2 592 84.2 921 81.5
Irregular 95 22.3 111 15.8 206 18.2
Don't know 2 0.5 0 0.0 2 0.2
Place of sleeping during your menstruation
Cow shed 7 1.7 26 3.8 34 3.0
Passage of home 21 5.0 33 4.7 55 4.8
Self Bed 372 87.1 612 87.0 984 87.0
Chhaupadigoth 5 1.3 8 1.1 13 1.2
Other 21 4.8 24 3.4 45 3.9
Total 427 100 704 100 1131 100
Note: the total value may vary slightly due to sample weight
3.4.3 Food HabitTable 3.6 shows the food habit of adolescents. As indicated in the table below, rice is a staple food for majority 96% of the adolescents’ households included in the survey. Most of the adolescents 92% (95% CI: 91.0-93.1 ) were non vegetarian. This proportion is similar for the both age groups 93% (91.4-94.2) among aged 10-14 years and 91% ( 95%CI:91.0-93.1) among 15-19 years). Among non-vegetarian respondents, 75% reported eating non-vegetarian food at least once a week. A slightly higher proportion of early adolescent ate non-vegetarian food at least once a week 75% compared to late adolescent 72%.
Table 3.6 also summarizes the pattern of fruits and vegetable consumption of adolescents.
Adolescent Nutrition Survey in Nepal, 2014 17
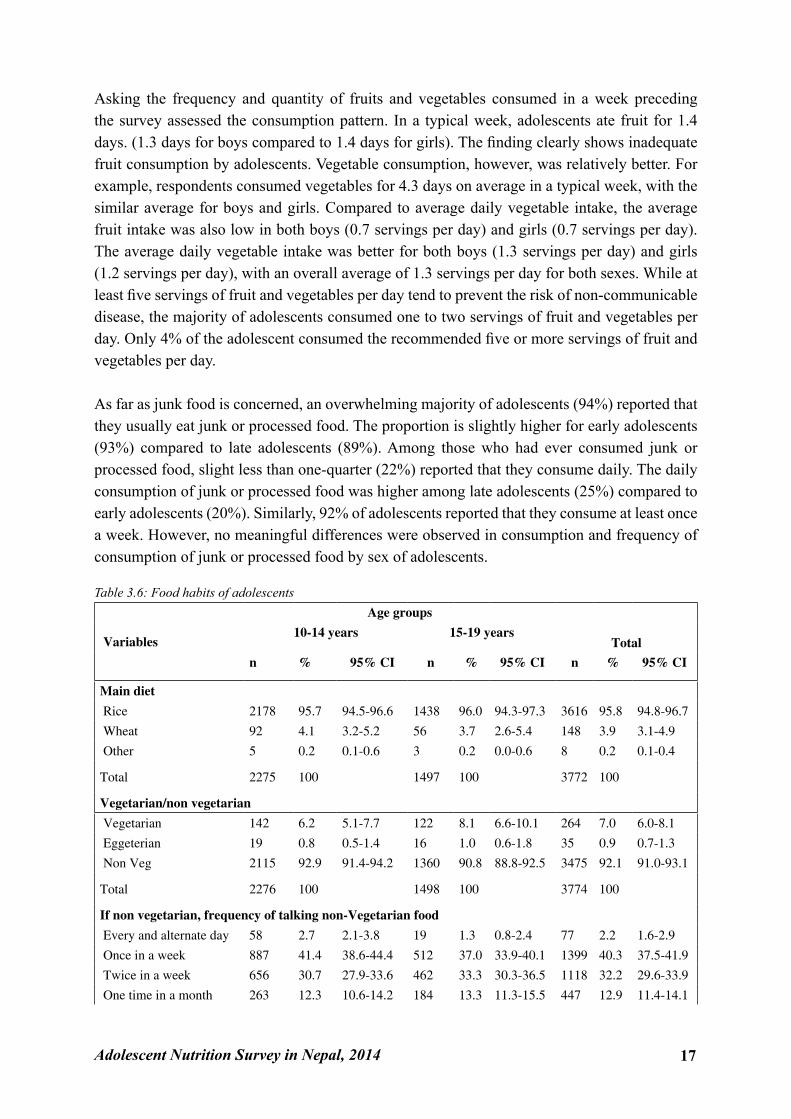
Asking the frequency and quantity of fruits and vegetables consumed in a week preceding the survey assessed the consumption pattern. In a typical week, adolescents ate fruit for 1.4 days. (1.3 days for boys compared to 1.4 days for girls). The finding clearly shows inadequate fruit consumption by adolescents. Vegetable consumption, however, was relatively better. For example, respondents consumed vegetables for 4.3 days on average in a typical week, with the similar average for boys and girls. Compared to average daily vegetable intake, the average fruit intake was also low in both boys (0.7 servings per day) and girls (0.7 servings per day). The average daily vegetable intake was better for both boys (1.3 servings per day) and girls (1.2 servings per day), with an overall average of 1.3 servings per day for both sexes. While at least five servings of fruit and vegetables per day tend to prevent the risk of non-communicable disease, the majority of adolescents consumed one to two servings of fruit and vegetables per day. Only 4% of the adolescent consumed the recommended five or more servings of fruit and vegetables per day.
As far as junk food is concerned, an overwhelming majority of adolescents (94%) reported that they usually eat junk or processed food. The proportion is slightly higher for early adolescents (93%) compared to late adolescents (89%). Among those who had ever consumed junk or processed food, slight less than one-quarter (22%) reported that they consume daily. The daily consumption of junk or processed food was higher among late adolescents (25%) compared to early adolescents (20%). Similarly, 92% of adolescents reported that they consume at least once a week. However, no meaningful differences were observed in consumption and frequency of consumption of junk or processed food by sex of adolescents.
Table 3.6: Food habits of adolescents
Variables
Age groups
Total10-14 years 15-19 years
n % 95% CI n % 95% CI n % 95% CI
Main diet
Rice 2178 95.7 94.5-96.6 1438 96.0 94.3-97.3 3616 95.8 94.8-96.7
Wheat 92 4.1 3.2-5.2 56 3.7 2.6-5.4 148 3.9 3.1-4.9
Other 5 0.2 0.1-0.6 3 0.2 0.0-0.6 8 0.2 0.1-0.4
Total 2275 100 1497 100 3772 100
Vegetarian/non vegetarian
Vegetarian 142 6.2 5.1-7.7 122 8.1 6.6-10.1 264 7.0 6.0-8.1
Eggeterian 19 0.8 0.5-1.4 16 1.0 0.6-1.8 35 0.9 0.7-1.3
Non Veg 2115 92.9 91.4-94.2 1360 90.8 88.8-92.5 3475 92.1 91.0-93.1
Total 2276 100 1498 100 3774 100
If non vegetarian, frequency of talking non-Vegetarian food
Every and alternate day 58 2.7 2.1-3.8 19 1.3 0.8-2.4 77 2.2 1.6-2.9
Once in a week 887 41.4 38.6-44.4 512 37.0 33.9-40.1 1399 40.3 37.5-41.9
Twice in a week 656 30.7 27.9-33.6 462 33.3 30.3-36.5 1118 32.2 29.6-33.9
One time in a month 263 12.3 10.6-14.2 184 13.3 11.3-15.5 447 12.9 11.4-14.1
18 Adolescent Nutrition Survey in Nepal, 2014
Two times in a month 268 12.5 10.8-14.5 203 14.6 12.3-17.1 470 13.5 12.0-14.8
Other 8 0.4 0.2-0.9 7 0.5 0.2-1.3 15 0.4 0.2-0.8
Total 2115 100 1360 100 3475 100
No. of fruits and vegetable servings
None 72 3.2 2.4-4.1 25 1.7 1.0-2.8 97 2.6 2.0-3.3
1-2 servings 1710 75.1 72.6-77.5 1081 72.2 69.4-74.9 2791 74.0 72.0-75.8
3-4 Servings 403 17.7 15.6-20.1 327 21.9 19.4-24.5 730 19.4 17.7-21.2
5 or more servings 76 3.3 2.5-4.4 60 4.0 3.0-5.5 136 3.6 3.0-4.4
Don't know 14 0.6 0.3-1.3 4 0.3 0.1-1.1 18 0.5 0.3-0.9
Junk food/processed food use
Yes 2125 93.4 91.6-94.8 1427 95.3 93.8-96.5 3552 94.2 92.9-95.2
No 150 6.6 5.2-8.4 70 4.7 3.5-6.2 221 5.8 4.8-7.2
Total 2275 100 1497 100 3772 100
If yes, frequency of junk/processed food use
Every or alternate day 434 20.4 18.3-22.7 351 24.6 21.8-27.5 785 22.1 20.3-24.0
Once in a week 632 29.7 27.2-32.5 376 26.4 23.4-30.1 1008 28.4 26.2-30.7
Twice in a week 919 43.3 40.7-45.8 562 39.4 35.8-43.2 1481 41.7 39.6-43.8
Once in a month 90 4.2 3.2-5.6 92 6.5 5.1-8.2 183 5.1 4.3-6.2
Twice in a month 40 1.9 1.3-2.6 41 2.9 2.1-4.1 81 2.3 1.7-3.0
Other 10 0.5 0.3-0.8 5 0.3 0.1-0.7 15 0.4 0.3-0.6
Total 2125 100 1427 100 3552 100
Note: the total value may vary slightly due to sample weight
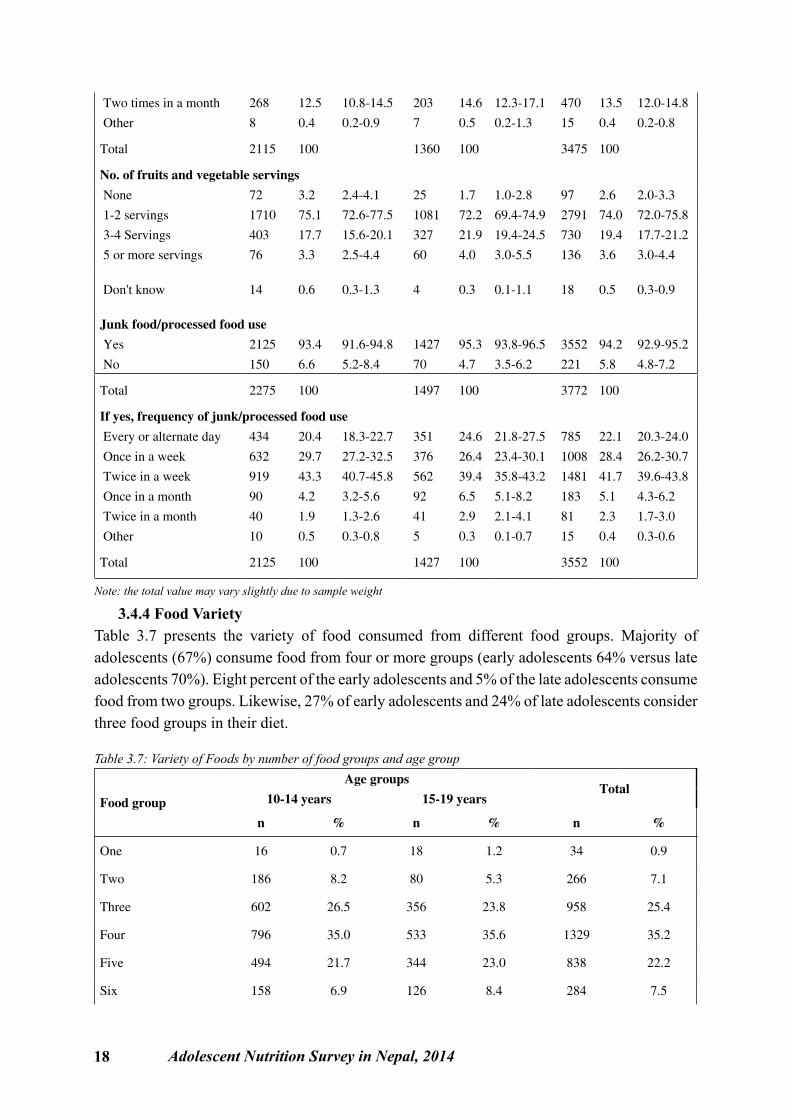
3.4.4 Food VarietyTable 3.7 presents the variety of food consumed from different food groups. Majority of adolescents (67%) consume food from four or more groups (early adolescents 64% versus late adolescents 70%). Eight percent of the early adolescents and 5% of the late adolescents consume food from two groups. Likewise, 27% of early adolescents and 24% of late adolescents consider three food groups in their diet.
Table 3.7: Variety of Foods by number of food groups and age group
Food group
Age groupsTotal
10-14 years 15-19 years
n % n % n %
One 16 0.7 18 1.2 34 0.9
Two 186 8.2 80 5.3 266 7.1
Three 602 26.5 356 23.8 958 25.4
Four 796 35.0 533 35.6 1329 35.2
Five 494 21.7 344 23.0 838 22.2
Six 158 6.9 126 8.4 284 7.5
Adolescent Nutrition Survey in Nepal, 2014 19
Seven 23 1.0 41 2.8 64 1.7
Total 2275 100 1497 100 3772 100
Note: the total value may vary slightly due to sample weight
3.5 Knowledge of Nutrient and Nutritional DisorderThis section summarizes adolescents’ knowledge on nutritious food and the nutrients such as Vitamin A and other micronutrients. The section also presents adolescents’ views on common nutritional disorders such as night blindness and anemia.
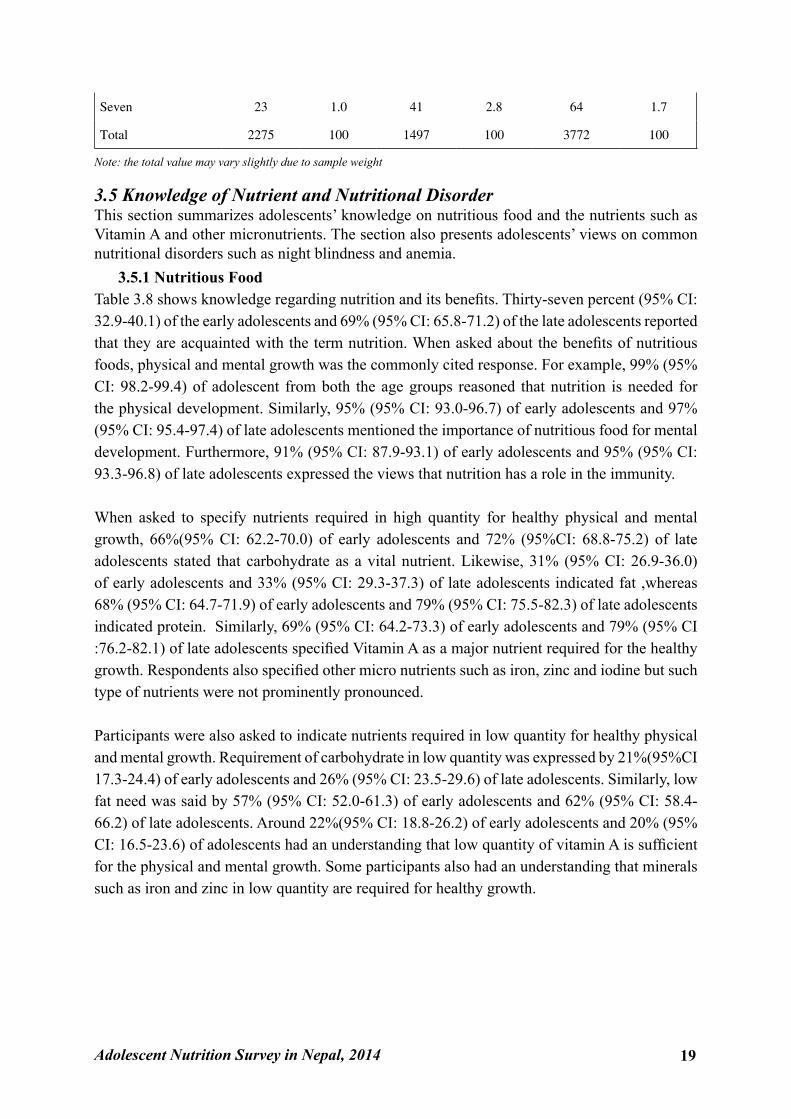
3.5.1 Nutritious FoodTable 3.8 shows knowledge regarding nutrition and its benefits. Thirty-seven percent (95% CI: 32.9-40.1) of the early adolescents and 69% (95% CI: 65.8-71.2) of the late adolescents reported that they are acquainted with the term nutrition. When asked about the benefits of nutritious foods, physical and mental growth was the commonly cited response. For example, 99% (95% CI: 98.2-99.4) of adolescent from both the age groups reasoned that nutrition is needed for the physical development. Similarly, 95% (95% CI: 93.0-96.7) of early adolescents and 97% (95% CI: 95.4-97.4) of late adolescents mentioned the importance of nutritious food for mental development. Furthermore, 91% (95% CI: 87.9-93.1) of early adolescents and 95% (95% CI: 93.3-96.8) of late adolescents expressed the views that nutrition has a role in the immunity.
When asked to specify nutrients required in high quantity for healthy physical and mental growth, 66%(95% CI: 62.2-70.0) of early adolescents and 72% (95%CI: 68.8-75.2) of late adolescents stated that carbohydrate as a vital nutrient. Likewise, 31% (95% CI: 26.9-36.0) of early adolescents and 33% (95% CI: 29.3-37.3) of late adolescents indicated fat ,whereas 68% (95% CI: 64.7-71.9) of early adolescents and 79% (95% CI: 75.5-82.3) of late adolescents indicated protein. Similarly, 69% (95% CI: 64.2-73.3) of early adolescents and 79% (95% CI :76.2-82.1) of late adolescents specified Vitamin A as a major nutrient required for the healthy growth. Respondents also specified other micro nutrients such as iron, zinc and iodine but such type of nutrients were not prominently pronounced.
Participants were also asked to indicate nutrients required in low quantity for healthy physical and mental growth. Requirement of carbohydrate in low quantity was expressed by 21%(95%CI 17.3-24.4) of early adolescents and 26% (95% CI: 23.5-29.6) of late adolescents. Similarly, low fat need was said by 57% (95% CI: 52.0-61.3) of early adolescents and 62% (95% CI: 58.4-66.2) of late adolescents. Around 22%(95% CI: 18.8-26.2) of early adolescents and 20% (95% CI: 16.5-23.6) of adolescents had an understanding that low quantity of vitamin A is sufficient for the physical and mental growth. Some participants also had an understanding that minerals such as iron and zinc in low quantity are required for healthy growth.
20 Adolescent Nutrition Survey in Nepal, 2014
Table 3.8: Awareness on nutrition and benefits of nutritious food
Variables
Age groupsTotal
10-14 years 15-19 years
n % 95% CI n % 95%CI n % 95% CI
Know about nutrition
Yes 830 36.5 32.9-40.1 1027 68.6 65.8-71.2 1856 49.2 45.5-52.9
No 1446 63.5 59.9-67.1 472 31.4 28.8-34.2 1917 50.8 47.1-54.5
Reasons for eating nutritious food*
Adequate physical growth 825 99.4 98.2-99.8 1013 98.6 97.4-99.3 1838 99.0 98.2-99.4
Adequate mental growth 789 95.2 93.0-96.7 995 97.0 95.4-97.4 1784 96.1 94.8-97.1
Immunity power 754 90.8 87.9-93.1 979 95.3 93.3-96.8 1733 93.4 91.5-94.8
Total 830 100 1027 100 1856 100
Major nutrients required in high quantity for physical and mental growth*
Carbohydrate 549 66.1 62.2-70.0 740 72.1 68.8-75.2 1289 69.5 67.0-71.9
Fat 259 31.2 26.9-36.0 341 33.2 29.3-37.3 600 32.3 29.3-35.5
Protein 567 68.4 64.7-71.9 812 79.1 75.5-82.3 1379 74.3 72.0-76.5
Vitamin A 572 68.9 64.2-73.3 814 79.3 76.2-82.1 1386 74.7 72.1-77.1
Iron 464 55.9 51.5-60.3 662 64.5 60.5-68.2 1126 60.7 57.7-63.5
Iodine 445 53.6 49.1-58.0 715 69.7 66.1-73.0 1160 62.5 59.4-65.5
Zinc and other minerals 203 24.5 20.8-28.6 346 33.7 30.5-37.0 549 29.6 27.2-32.0
Other vitamins 432 52.1 48.2-56.0 579 56.4 52.0-60.7 1011 54.5 51.6-57.3
Others 12 1.4 0.6-2.9 17 1.7 0.9-3.1 29 1.6 1.0-2.5
Total 830 100 1027 100 1856 100
Major nutrients required in less quantity for physical and mental growth*
Carbohydrate 171 20.6 17.3-24.4 271 26.4 23.5-29..6 442 23.8 21.5-26.3
Fat 470 56.7 52.0-61.3 640 62.4 58.4-66.2 1110 59.8 56.9-62.7
Protein 143 17.2 14.4-20.5 199 19.4 16.7-22.4 342 18.4 16.4-20.6
Vitamin A 185 22.3 18.8-26.2 203 19.8 16.5-23.6 388 20.9 18.5-23.6
Iron 224 27.0 23.2-31.1 289 28.1 24.0-32.6 513 27.6 24.8-30.6
Iodine 257 31.0 27.4-34.8 294 28.7 25.3-32.4 551 29.7 27.3-32.2
Zinc and other minerals 223 26.9 23.4-30.7 294 28.7 25.4-32.1 517 27.9 25.2-30.6
Other vitamins 178 21.5 18.0-25.4 269 26.2 23.2-29.4 447 24.1 21.8-26.5
Total who know about nutrition 830 100 1027 100 1856 100
Note: the total value may vary slightly due to sample weight; *multiple response question
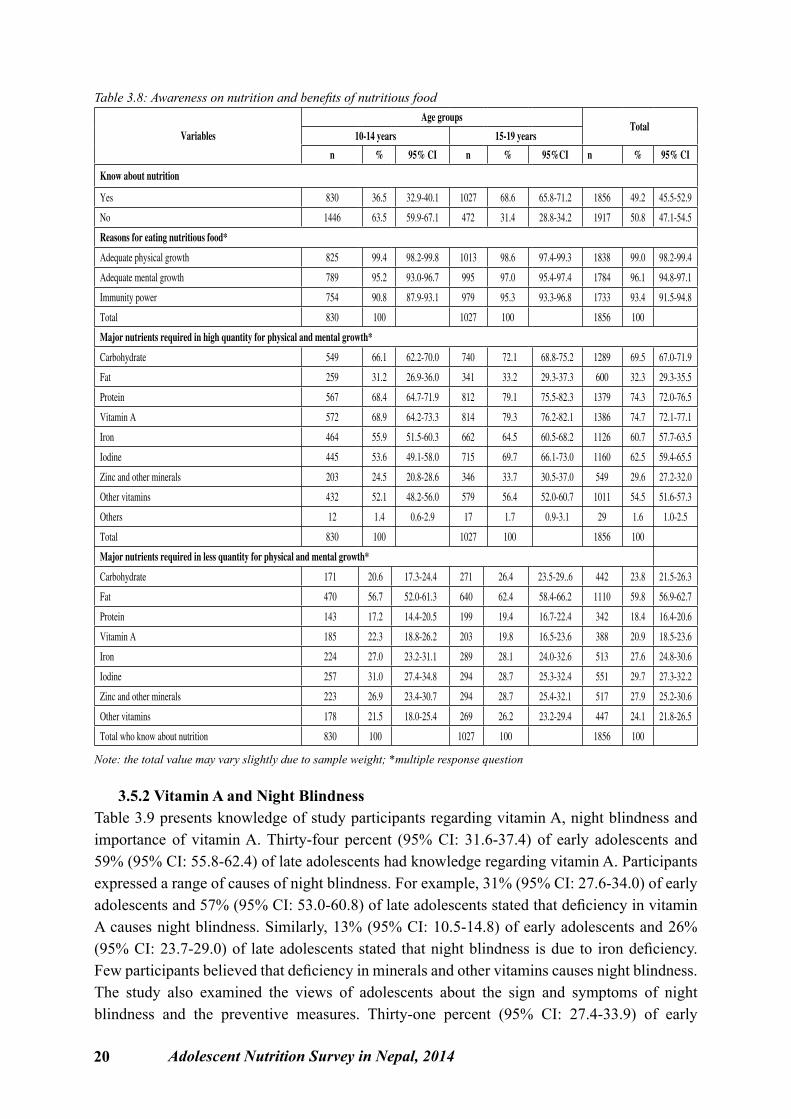
3.5.2 Vitamin A and Night BlindnessTable 3.9 presents knowledge of study participants regarding vitamin A, night blindness and importance of vitamin A. Thirty-four percent (95% CI: 31.6-37.4) of early adolescents and 59% (95% CI: 55.8-62.4) of late adolescents had knowledge regarding vitamin A. Participants expressed a range of causes of night blindness. For example, 31% (95% CI: 27.6-34.0) of early adolescents and 57% (95% CI: 53.0-60.8) of late adolescents stated that deficiency in vitamin A causes night blindness. Similarly, 13% (95% CI: 10.5-14.8) of early adolescents and 26% (95% CI: 23.7-29.0) of late adolescents stated that night blindness is due to iron deficiency. Few participants believed that deficiency in minerals and other vitamins causes night blindness. The study also examined the views of adolescents about the sign and symptoms of night blindness and the preventive measures. Thirty-one percent (95% CI: 27.4-33.9) of early
Adolescent Nutrition Survey in Nepal, 2014 21
adolescents and 59% (95% CI: 55.7-62.4) of late adolescents described reduced night vision as an alarming symptom of the night blindness. Participants also identified other signs and symptoms of the night blindness such as dry eyes and corneal inflammation but such responses were low. Interestingly, 69% (95% CI: 65.9-72.3) of early adolescents and 40% (95% CI: 37.1-43.8) of late adolescents were unfamiliar with the signs and symptoms of night blindness.
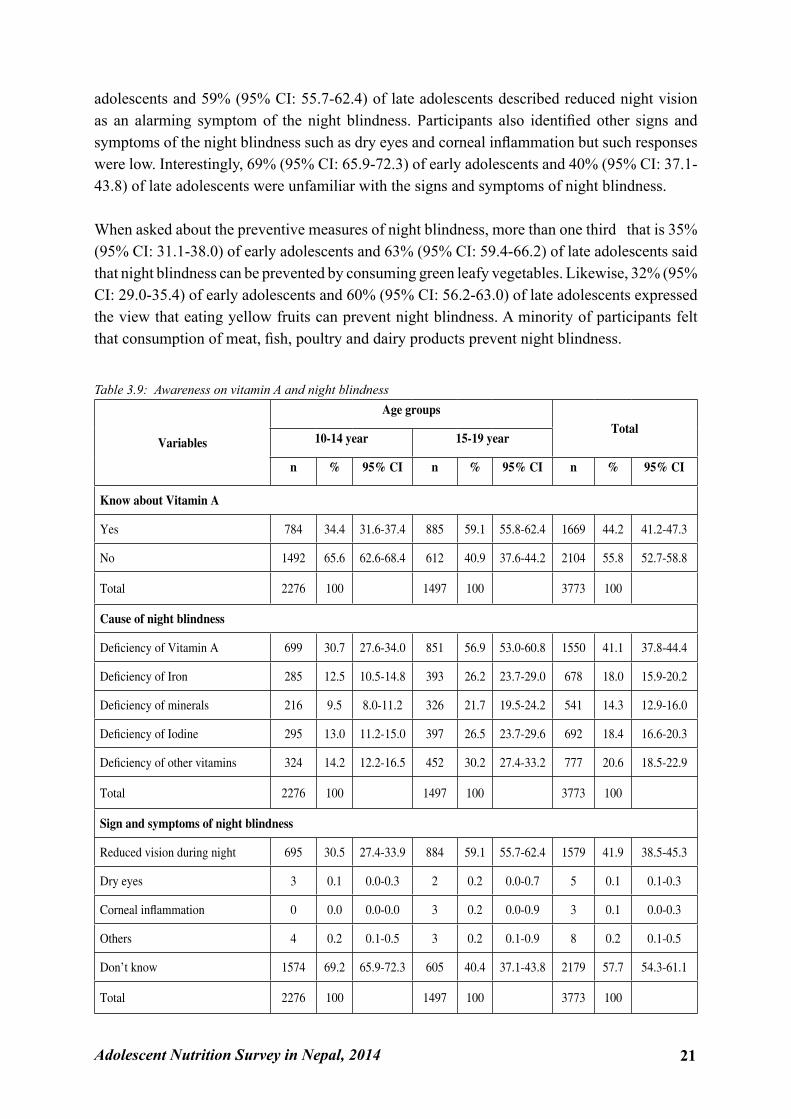
When asked about the preventive measures of night blindness, more than one third that is 35% (95% CI: 31.1-38.0) of early adolescents and 63% (95% CI: 59.4-66.2) of late adolescents said that night blindness can be prevented by consuming green leafy vegetables. Likewise, 32% (95% CI: 29.0-35.4) of early adolescents and 60% (95% CI: 56.2-63.0) of late adolescents expressed the view that eating yellow fruits can prevent night blindness. A minority of participants felt that consumption of meat, fish, poultry and dairy products prevent night blindness.
Table 3.9: Awareness on vitamin A and night blindness
Variables
Age groupsTotal
10-14 year 15-19 year
n % 95% CI n % 95% CI n % 95% CI
Know about Vitamin A
Yes 784 34.4 31.6-37.4 885 59.1 55.8-62.4 1669 44.2 41.2-47.3
No 1492 65.6 62.6-68.4 612 40.9 37.6-44.2 2104 55.8 52.7-58.8
Total 2276 100 1497 100 3773 100
Cause of night blindness
Deficiency of Vitamin A 699 30.7 27.6-34.0 851 56.9 53.0-60.8 1550 41.1 37.8-44.4
Deficiency of Iron 285 12.5 10.5-14.8 393 26.2 23.7-29.0 678 18.0 15.9-20.2
Deficiency of minerals 216 9.5 8.0-11.2 326 21.7 19.5-24.2 541 14.3 12.9-16.0
Deficiency of Iodine 295 13.0 11.2-15.0 397 26.5 23.7-29.6 692 18.4 16.6-20.3
Deficiency of other vitamins 324 14.2 12.2-16.5 452 30.2 27.4-33.2 777 20.6 18.5-22.9
Total 2276 100 1497 100 3773 100
Sign and symptoms of night blindness
Reduced vision during night 695 30.5 27.4-33.9 884 59.1 55.7-62.4 1579 41.9 38.5-45.3
Dry eyes 3 0.1 0.0-0.3 2 0.2 0.0-0.7 5 0.1 0.1-0.3
Corneal inflammation 0 0.0 0.0-0.0 3 0.2 0.0-0.9 3 0.1 0.0-0.3
Others 4 0.2 0.1-0.5 3 0.2 0.1-0.9 8 0.2 0.1-0.5
Don’t know 1574 69.2 65.9-72.3 605 40.4 37.1-43.8 2179 57.7 54.3-61.1
Total 2276 100 1497 100 3773 100
22 Adolescent Nutrition Survey in Nepal, 2014
Prevention*
Eating green leafy vegetables 784 34.5 31.1-38.0 941 62.9 59.4-66.2 1725 45.7 42.3-49.2
Eating other vegetables 763 33.5 30.2-37.0 918 61.3 58.0-64.6 1680 44.5 41.2-47.9
Eating yellow fruits 732 32.2 29.0-35.4 893 59.6 56.2-63.0 1625 43.1 39.8-46.4
Eating other fruits 717 31.5 28.3-34. 877 58.6 55.1-62.0 1594 42.2 39.0-45.6
Eating meat/fish 622 27.3 24.7-30.1 760 50.8 47.2-54.4 1382 36.6 33.8-39.6
Eating eggs 590 25.9 23.4-28.6 729 48.7 45.1-52.2 1318 34.9 32.2-37.8
Eating liver 532 23.4 20.9-26.1 656 43.8 40.3-47.4 1188 31.5 28.9-34.2
Drinking milk 673 29.6 26.3-33.0 833 55.6 52.1-59.0 1506 39.9 36.8-43.1
Taking medicine 664 29.2 26.2-32.3 797 53.2 50.1-56.3 1460 38.7 35.8-41.7
Other 23 1.0 0.6-1.7 10 0.7 0.3-1.5 33 0.9 0.5-1.4
Total 2276 100.0 1497 100.0 3773 100.0
Note: the total value may vary slightly due to sample weight; *multiple response question
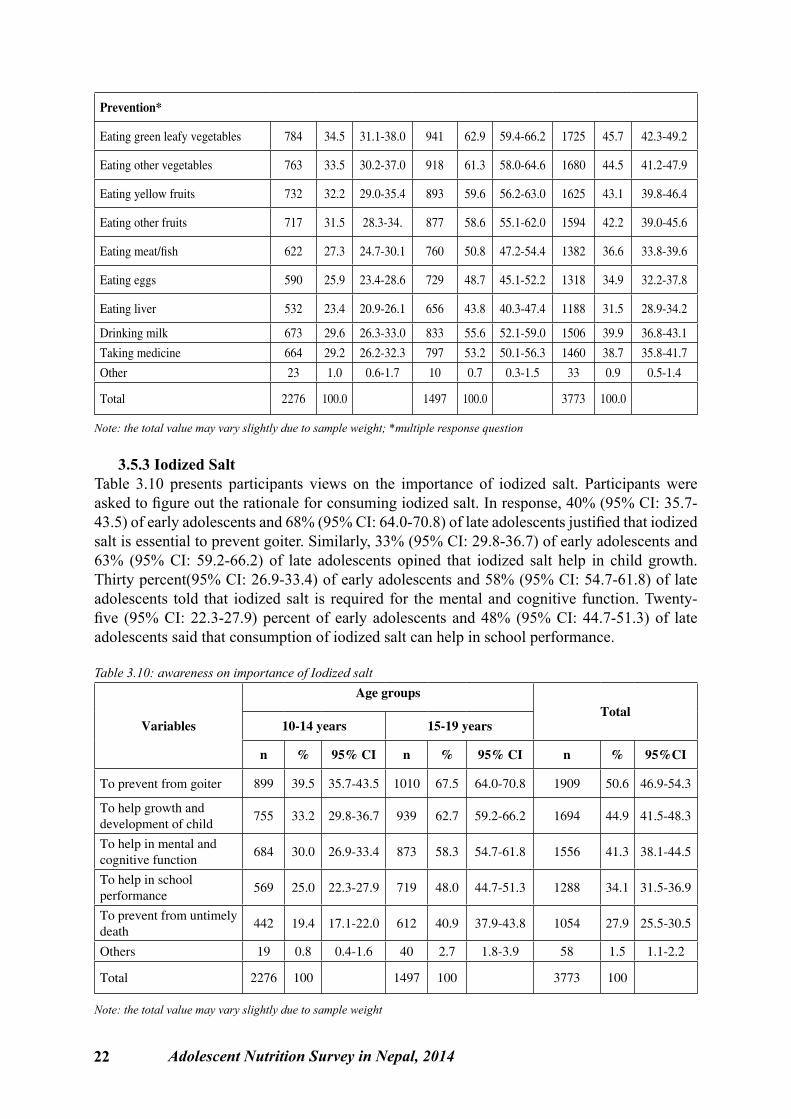
3.5.3 Iodized SaltTable 3.10 presents participants views on the importance of iodized salt. Participants were asked to figure out the rationale for consuming iodized salt. In response, 40% (95% CI: 35.7-43.5) of early adolescents and 68% (95% CI: 64.0-70.8) of late adolescents justified that iodized salt is essential to prevent goiter. Similarly, 33% (95% CI: 29.8-36.7) of early adolescents and 63% (95% CI: 59.2-66.2) of late adolescents opined that iodized salt help in child growth. Thirty percent(95% CI: 26.9-33.4) of early adolescents and 58% (95% CI: 54.7-61.8) of late adolescents told that iodized salt is required for the mental and cognitive function. Twenty-five (95% CI: 22.3-27.9) percent of early adolescents and 48% (95% CI: 44.7-51.3) of late adolescents said that consumption of iodized salt can help in school performance.
Table 3.10: awareness on importance of Iodized salt
Variables
Age groups Total
10-14 years 15-19 years
n % 95% CI n % 95% CI n % 95%CI
To prevent from goiter 899 39.5 35.7-43.5 1010 67.5 64.0-70.8 1909 50.6 46.9-54.3
To help growth and development of child
755 33.2 29.8-36.7 939 62.7 59.2-66.2 1694 44.9 41.5-48.3
To help in mental and cognitive function
684 30.0 26.9-33.4 873 58.3 54.7-61.8 1556 41.3 38.1-44.5
To help in school performance
569 25.0 22.3-27.9 719 48.0 44.7-51.3 1288 34.1 31.5-36.9
To prevent from untimely death
442 19.4 17.1-22.0 612 40.9 37.9-43.8 1054 27.9 25.5-30.5
Others 19 0.8 0.4-1.6 40 2.7 1.8-3.9 58 1.5 1.1-2.2
Total 2276 100 1497 100 3773 100
Note: the total value may vary slightly due to sample weight
Adolescent Nutrition Survey in Nepal, 2014 23
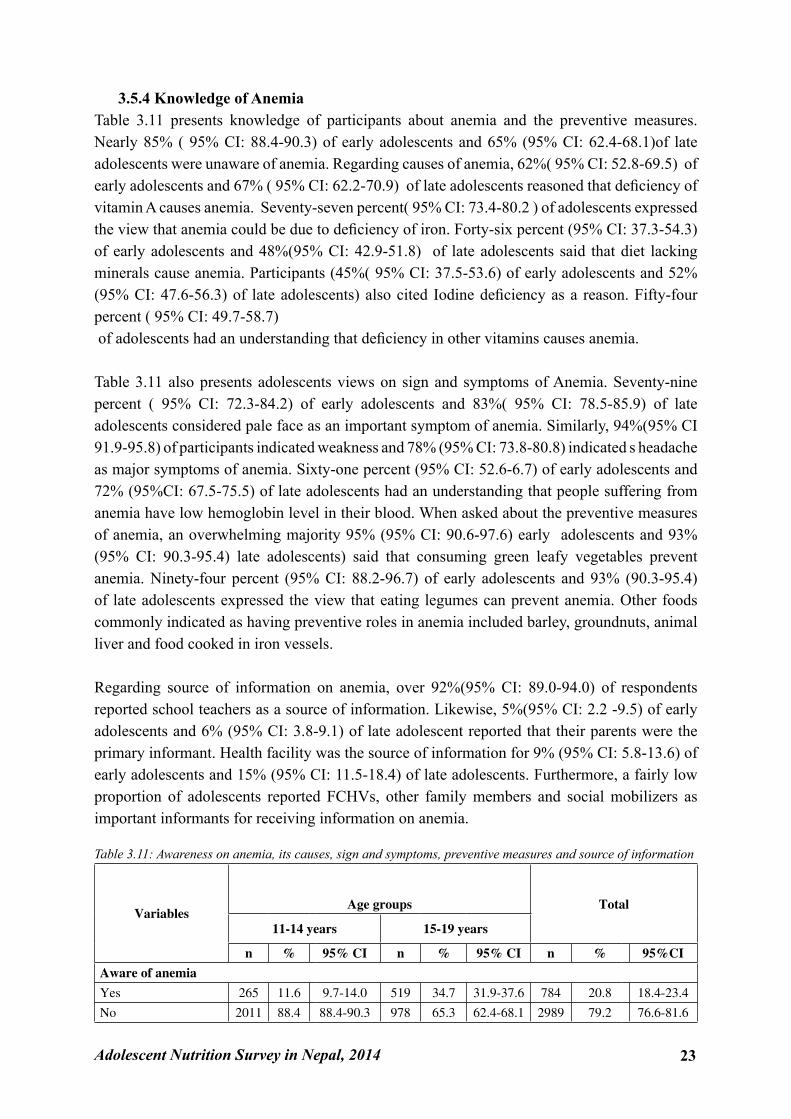
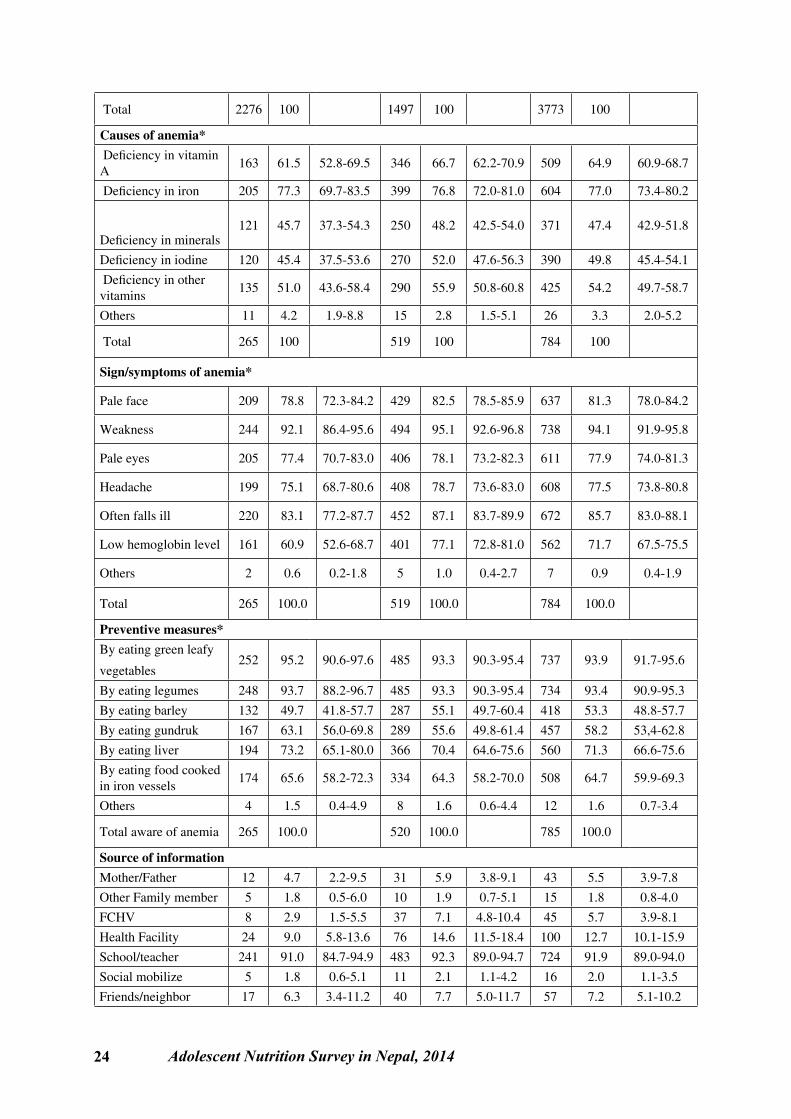
3.5.4 Knowledge of AnemiaTable 3.11 presents knowledge of participants about anemia and the preventive measures. Nearly 85% ( 95% CI: 88.4-90.3) of early adolescents and 65% (95% CI: 62.4-68.1)of late adolescents were unaware of anemia. Regarding causes of anemia, 62%( 95% CI: 52.8-69.5) of early adolescents and 67% ( 95% CI: 62.2-70.9) of late adolescents reasoned that deficiency of vitamin A causes anemia. Seventy-seven percent( 95% CI: 73.4-80.2 ) of adolescents expressed the view that anemia could be due to deficiency of iron. Forty-six percent (95% CI: 37.3-54.3)of early adolescents and 48%(95% CI: 42.9-51.8) of late adolescents said that diet lacking minerals cause anemia. Participants (45%( 95% CI: 37.5-53.6) of early adolescents and 52% (95% CI: 47.6-56.3) of late adolescents) also cited Iodine deficiency as a reason. Fifty-four percent ( 95% CI: 49.7-58.7) of adolescents had an understanding that deficiency in other vitamins causes anemia.
Table 3.11 also presents adolescents views on sign and symptoms of Anemia. Seventy-nine percent ( 95% CI: 72.3-84.2) of early adolescents and 83%( 95% CI: 78.5-85.9) of late adolescents considered pale face as an important symptom of anemia. Similarly, 94%(95% CI 91.9-95.8) of participants indicated weakness and 78% (95% CI: 73.8-80.8) indicated s headache as major symptoms of anemia. Sixty-one percent (95% CI: 52.6-6.7) of early adolescents and 72% (95%CI: 67.5-75.5) of late adolescents had an understanding that people suffering from anemia have low hemoglobin level in their blood. When asked about the preventive measures of anemia, an overwhelming majority 95% (95% CI: 90.6-97.6) early adolescents and 93% (95% CI: 90.3-95.4) late adolescents) said that consuming green leafy vegetables prevent anemia. Ninety-four percent (95% CI: 88.2-96.7) of early adolescents and 93% (90.3-95.4) of late adolescents expressed the view that eating legumes can prevent anemia. Other foods commonly indicated as having preventive roles in anemia included barley, groundnuts, animal liver and food cooked in iron vessels.
Regarding source of information on anemia, over 92%(95% CI: 89.0-94.0) of respondents reported school teachers as a source of information. Likewise, 5%(95% CI: 2.2 -9.5) of early adolescents and 6% (95% CI: 3.8-9.1) of late adolescent reported that their parents were the primary informant. Health facility was the source of information for 9% (95% CI: 5.8-13.6) of early adolescents and 15% (95% CI: 11.5-18.4) of late adolescents. Furthermore, a fairly low proportion of adolescents reported FCHVs, other family members and social mobilizers as important informants for receiving information on anemia.
Table 3.11: Awareness on anemia, its causes, sign and symptoms, preventive measures and source of information
VariablesAge groups Total
11-14 years 15-19 years
n % 95% CI n % 95% CI n % 95%CIAware of anemia Yes 265 11.6 9.7-14.0 519 34.7 31.9-37.6 784 20.8 18.4-23.4
No 2011 88.4 88.4-90.3 978 65.3 62.4-68.1 2989 79.2 76.6-81.6
24 Adolescent Nutrition Survey in Nepal, 2014
Total 2276 100 1497 100 3773 100
Causes of anemia* Deficiency in vitamin A
163 61.5 52.8-69.5 346 66.7 62.2-70.9 509 64.9 60.9-68.7
Deficiency in iron 205 77.3 69.7-83.5 399 76.8 72.0-81.0 604 77.0 73.4-80.2
Deficiency in minerals121 45.7 37.3-54.3 250 48.2 42.5-54.0 371 47.4 42.9-51.8
Deficiency in iodine 120 45.4 37.5-53.6 270 52.0 47.6-56.3 390 49.8 45.4-54.1
Deficiency in other vitamins
135 51.0 43.6-58.4 290 55.9 50.8-60.8 425 54.2 49.7-58.7
Others 11 4.2 1.9-8.8 15 2.8 1.5-5.1 26 3.3 2.0-5.2
Total 265 100 519 100 784 100
Sign/symptoms of anemia*
Pale face 209 78.8 72.3-84.2 429 82.5 78.5-85.9 637 81.3 78.0-84.2
Weakness 244 92.1 86.4-95.6 494 95.1 92.6-96.8 738 94.1 91.9-95.8
Pale eyes 205 77.4 70.7-83.0 406 78.1 73.2-82.3 611 77.9 74.0-81.3
Headache 199 75.1 68.7-80.6 408 78.7 73.6-83.0 608 77.5 73.8-80.8
Often falls ill 220 83.1 77.2-87.7 452 87.1 83.7-89.9 672 85.7 83.0-88.1
Low hemoglobin level 161 60.9 52.6-68.7 401 77.1 72.8-81.0 562 71.7 67.5-75.5
Others 2 0.6 0.2-1.8 5 1.0 0.4-2.7 7 0.9 0.4-1.9
Total 265 100.0 519 100.0 784 100.0
Preventive measures*By eating green leafy
vegetables252 95.2 90.6-97.6 485 93.3 90.3-95.4 737 93.9 91.7-95.6
By eating legumes 248 93.7 88.2-96.7 485 93.3 90.3-95.4 734 93.4 90.9-95.3
By eating barley 132 49.7 41.8-57.7 287 55.1 49.7-60.4 418 53.3 48.8-57.7
By eating gundruk 167 63.1 56.0-69.8 289 55.6 49.8-61.4 457 58.2 53,4-62.8
By eating liver 194 73.2 65.1-80.0 366 70.4 64.6-75.6 560 71.3 66.6-75.6
By eating food cooked in iron vessels
174 65.6 58.2-72.3 334 64.3 58.2-70.0 508 64.7 59.9-69.3
Others 4 1.5 0.4-4.9 8 1.6 0.6-4.4 12 1.6 0.7-3.4
Total aware of anemia 265 100.0 520 100.0 785 100.0
Source of information Mother/Father 12 4.7 2.2-9.5 31 5.9 3.8-9.1 43 5.5 3.9-7.8
Other Family member 5 1.8 0.5-6.0 10 1.9 0.7-5.1 15 1.8 0.8-4.0
FCHV 8 2.9 1.5-5.5 37 7.1 4.8-10.4 45 5.7 3.9-8.1
Health Facility 24 9.0 5.8-13.6 76 14.6 11.5-18.4 100 12.7 10.1-15.9
School/teacher 241 91.0 84.7-94.9 483 92.3 89.0-94.7 724 91.9 89.0-94.0
Social mobilize 5 1.8 0.6-5.1 11 2.1 1.1-4.2 16 2.0 1.1-3.5
Friends/neighbor 17 6.3 3.4-11.2 40 7.7 5.0-11.7 57 7.2 5.1-10.2
Adolescent Nutrition Survey in Nepal, 2014 25
Relatives 1 0.5 0.1-2.9 8 1.5 0.7-3.1 9 1.1 0.6-2.3
Other 1 0.2 0.0-1.4 5 1.0 0.3-3.1 6 0.8 0.3-2.1
Total 265 100.0 523 100.0 788 100.0
Note: the total value may vary slightly due to sample weight; *multiple response
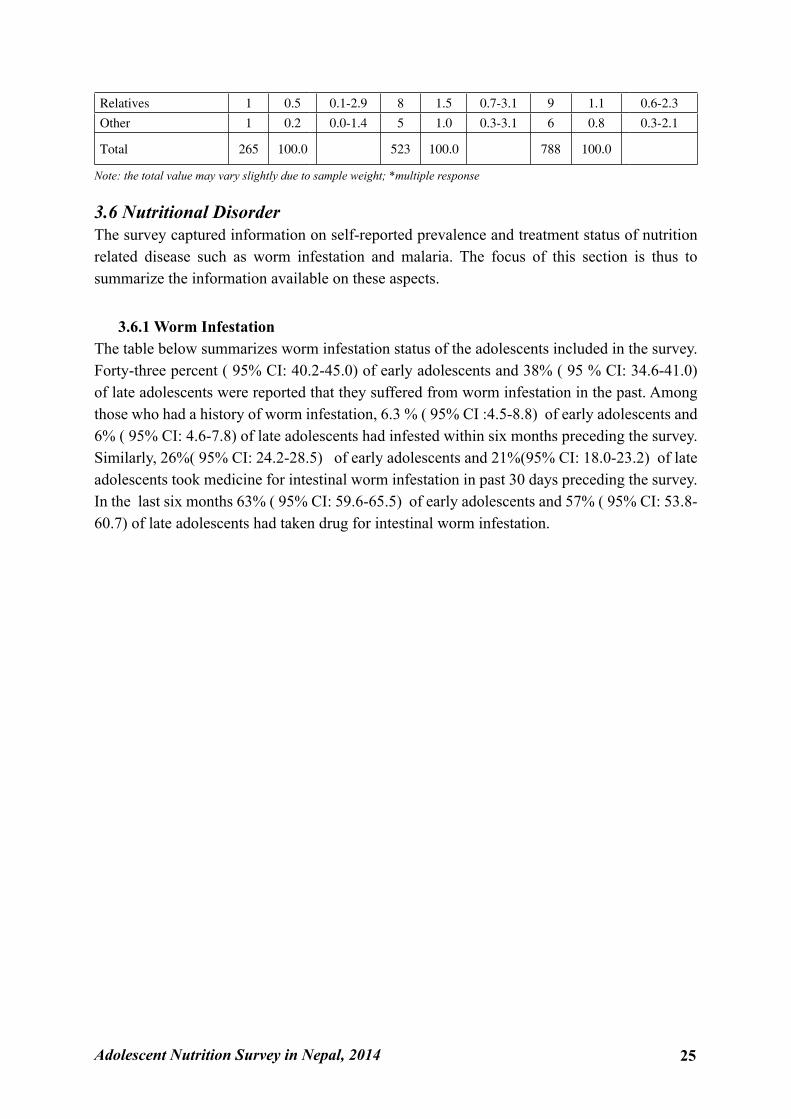
3.6 Nutritional DisorderThe survey captured information on self-reported prevalence and treatment status of nutrition related disease such as worm infestation and malaria. The focus of this section is thus to summarize the information available on these aspects.
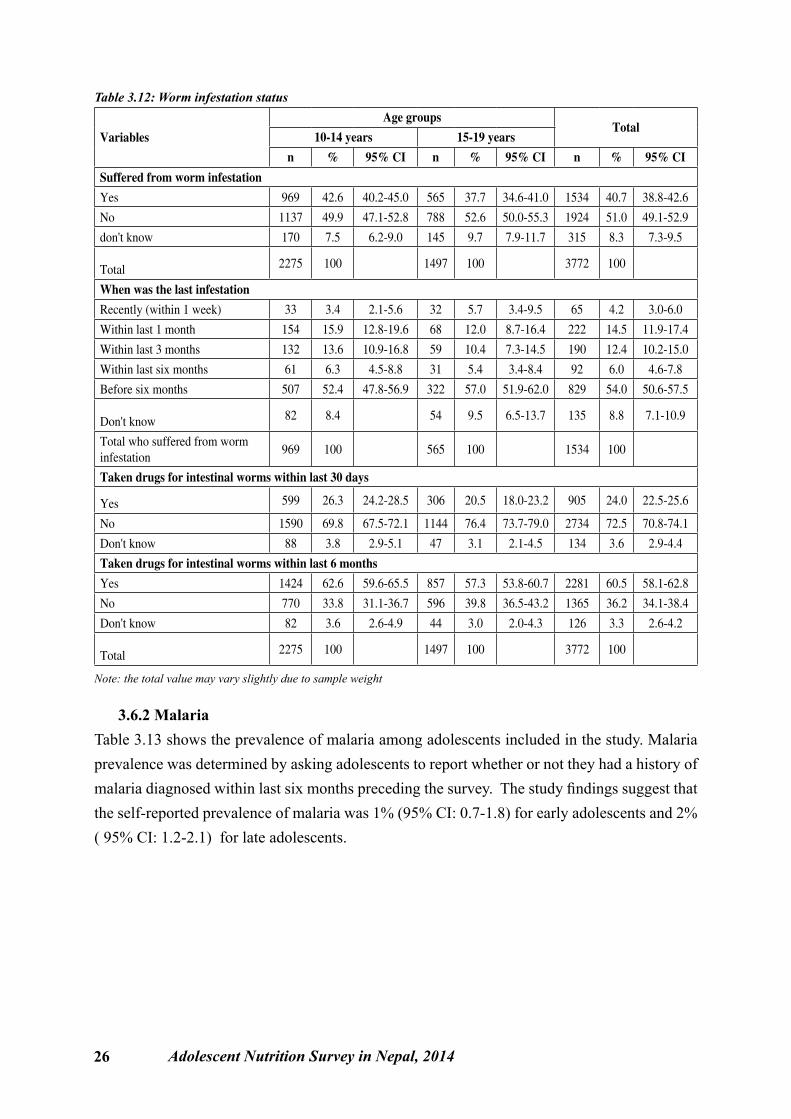
3.6.1 Worm InfestationThe table below summarizes worm infestation status of the adolescents included in the survey. Forty-three percent ( 95% CI: 40.2-45.0) of early adolescents and 38% ( 95 % CI: 34.6-41.0) of late adolescents were reported that they suffered from worm infestation in the past. Among those who had a history of worm infestation, 6.3 % ( 95% CI :4.5-8.8) of early adolescents and 6% ( 95% CI: 4.6-7.8) of late adolescents had infested within six months preceding the survey. Similarly, 26%( 95% CI: 24.2-28.5) of early adolescents and 21%(95% CI: 18.0-23.2) of late adolescents took medicine for intestinal worm infestation in past 30 days preceding the survey. In the last six months 63% ( 95% CI: 59.6-65.5) of early adolescents and 57% ( 95% CI: 53.8-60.7) of late adolescents had taken drug for intestinal worm infestation.
26 Adolescent Nutrition Survey in Nepal, 2014
Table 3.12: Worm infestation status
Variables
Age groupsTotal
10-14 years 15-19 yearsn % 95% CI n % 95% CI n % 95% CI
Suffered from worm infestationYes 969 42.6 40.2-45.0 565 37.7 34.6-41.0 1534 40.7 38.8-42.6
No 1137 49.9 47.1-52.8 788 52.6 50.0-55.3 1924 51.0 49.1-52.9
don't know 170 7.5 6.2-9.0 145 9.7 7.9-11.7 315 8.3 7.3-9.5
Total 2275 100 1497 100 3772 100
When was the last infestation Recently (within 1 week) 33 3.4 2.1-5.6 32 5.7 3.4-9.5 65 4.2 3.0-6.0
Within last 1 month 154 15.9 12.8-19.6 68 12.0 8.7-16.4 222 14.5 11.9-17.4
Within last 3 months 132 13.6 10.9-16.8 59 10.4 7.3-14.5 190 12.4 10.2-15.0
Within last six months 61 6.3 4.5-8.8 31 5.4 3.4-8.4 92 6.0 4.6-7.8
Before six months 507 52.4 47.8-56.9 322 57.0 51.9-62.0 829 54.0 50.6-57.5
Don't know 82 8.4 54 9.5 6.5-13.7 135 8.8 7.1-10.9
Total who suffered from worm infestation
969 100 565 100 1534 100
Taken drugs for intestinal worms within last 30 days
Yes 599 26.3 24.2-28.5 306 20.5 18.0-23.2 905 24.0 22.5-25.6
No 1590 69.8 67.5-72.1 1144 76.4 73.7-79.0 2734 72.5 70.8-74.1
Don't know 88 3.8 2.9-5.1 47 3.1 2.1-4.5 134 3.6 2.9-4.4
Taken drugs for intestinal worms within last 6 monthsYes 1424 62.6 59.6-65.5 857 57.3 53.8-60.7 2281 60.5 58.1-62.8
No 770 33.8 31.1-36.7 596 39.8 36.5-43.2 1365 36.2 34.1-38.4
Don't know 82 3.6 2.6-4.9 44 3.0 2.0-4.3 126 3.3 2.6-4.2
Total 2275 100 1497 100 3772 100
Note: the total value may vary slightly due to sample weight
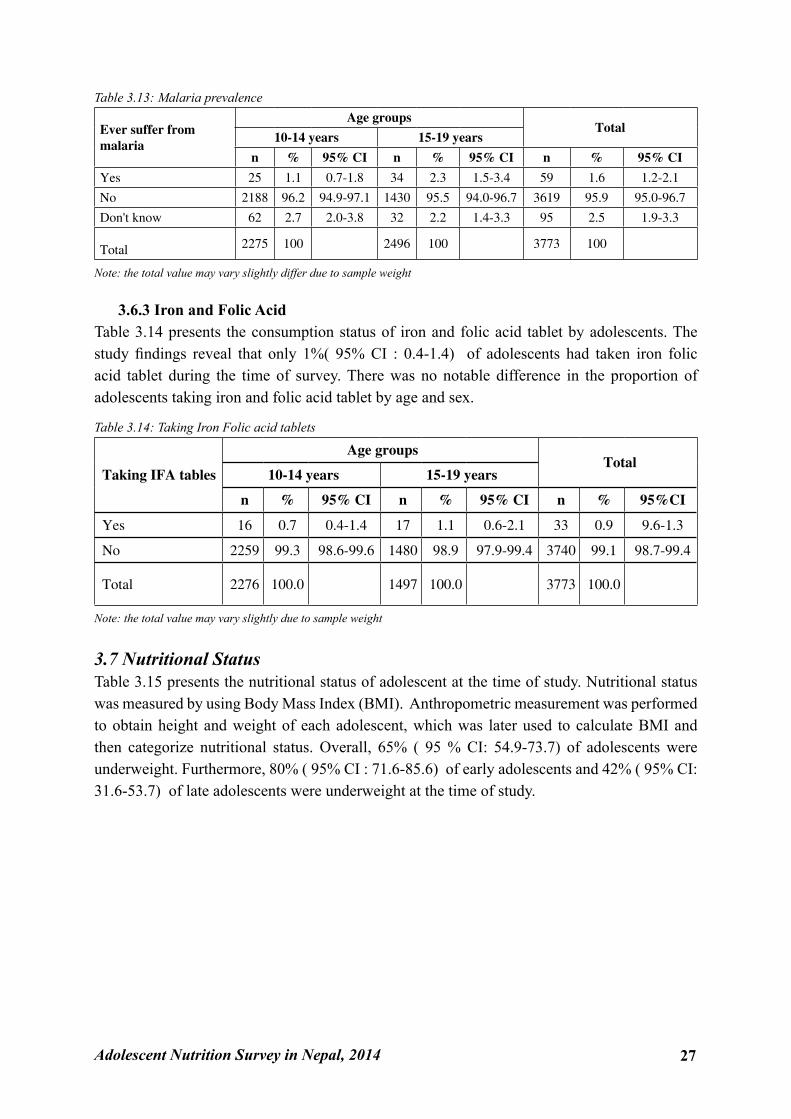
3.6.2 MalariaTable 3.13 shows the prevalence of malaria among adolescents included in the study. Malaria prevalence was determined by asking adolescents to report whether or not they had a history of malaria diagnosed within last six months preceding the survey. The study findings suggest that the self-reported prevalence of malaria was 1% (95% CI: 0.7-1.8) for early adolescents and 2% ( 95% CI: 1.2-2.1) for late adolescents.
Adolescent Nutrition Survey in Nepal, 2014 27
Table 3.13: Malaria prevalence
Ever suffer from malaria
Age groupsTotal
10-14 years 15-19 years
n % 95% CI n % 95% CI n % 95% CI
Yes 25 1.1 0.7-1.8 34 2.3 1.5-3.4 59 1.6 1.2-2.1
No 2188 96.2 94.9-97.1 1430 95.5 94.0-96.7 3619 95.9 95.0-96.7
Don't know 62 2.7 2.0-3.8 32 2.2 1.4-3.3 95 2.5 1.9-3.3
Total 2275 100 2496 100 3773 100
Note: the total value may vary slightly differ due to sample weight
3.6.3 Iron and Folic AcidTable 3.14 presents the consumption status of iron and folic acid tablet by adolescents. The study findings reveal that only 1%( 95% CI : 0.4-1.4) of adolescents had taken iron folic acid tablet during the time of survey. There was no notable difference in the proportion of adolescents taking iron and folic acid tablet by age and sex.
Table 3.14: Taking Iron Folic acid tablets
Taking IFA tables
Age groupsTotal
10-14 years 15-19 years
n % 95% CI n % 95% CI n % 95%CI
Yes 16 0.7 0.4-1.4 17 1.1 0.6-2.1 33 0.9 9.6-1.3
No 2259 99.3 98.6-99.6 1480 98.9 97.9-99.4 3740 99.1 98.7-99.4
Total 2276 100.0 1497 100.0 3773 100.0
Note: the total value may vary slightly due to sample weight
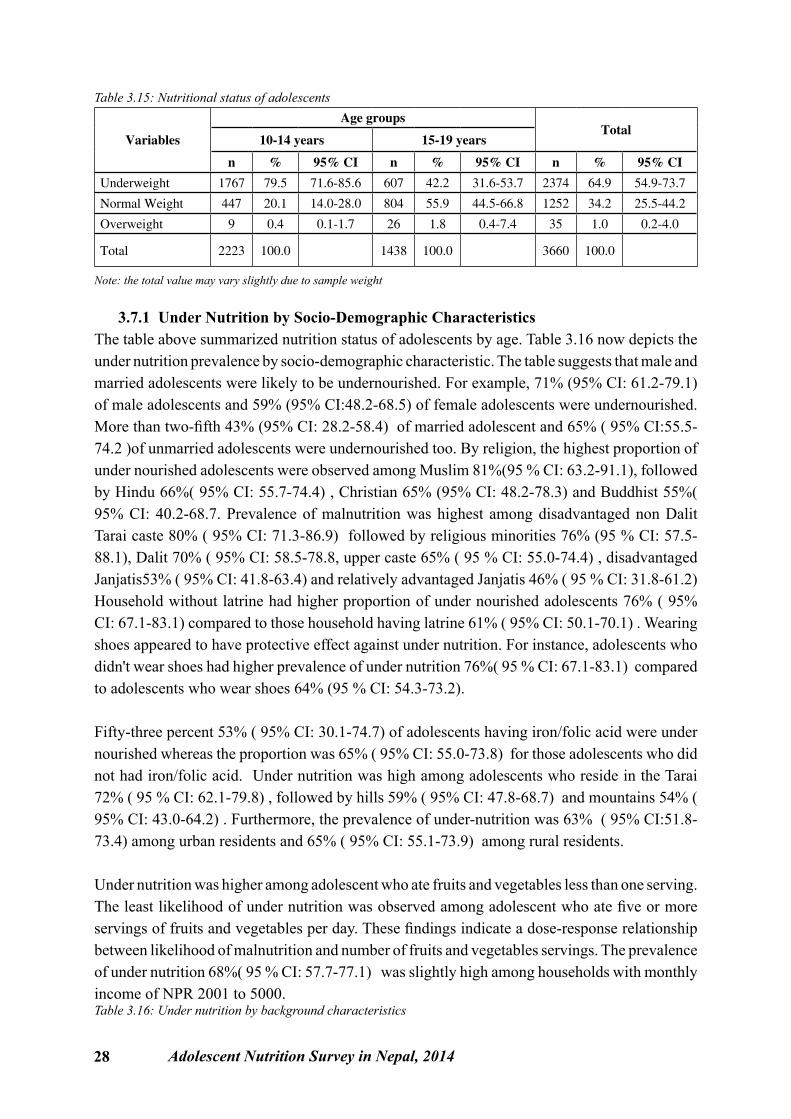
3.7 Nutritional StatusTable 3.15 presents the nutritional status of adolescent at the time of study. Nutritional status was measured by using Body Mass Index (BMI). Anthropometric measurement was performed to obtain height and weight of each adolescent, which was later used to calculate BMI and then categorize nutritional status. Overall, 65% ( 95 % CI: 54.9-73.7) of adolescents were underweight. Furthermore, 80% ( 95% CI : 71.6-85.6) of early adolescents and 42% ( 95% CI: 31.6-53.7) of late adolescents were underweight at the time of study.
28 Adolescent Nutrition Survey in Nepal, 2014
Table 3.15: Nutritional status of adolescents
Variables
Age groupsTotal
10-14 years 15-19 years
n % 95% CI n % 95% CI n % 95% CI
Underweight 1767 79.5 71.6-85.6 607 42.2 31.6-53.7 2374 64.9 54.9-73.7
Normal Weight 447 20.1 14.0-28.0 804 55.9 44.5-66.8 1252 34.2 25.5-44.2
Overweight 9 0.4 0.1-1.7 26 1.8 0.4-7.4 35 1.0 0.2-4.0
Total 2223 100.0 1438 100.0 3660 100.0
Note: the total value may vary slightly due to sample weight
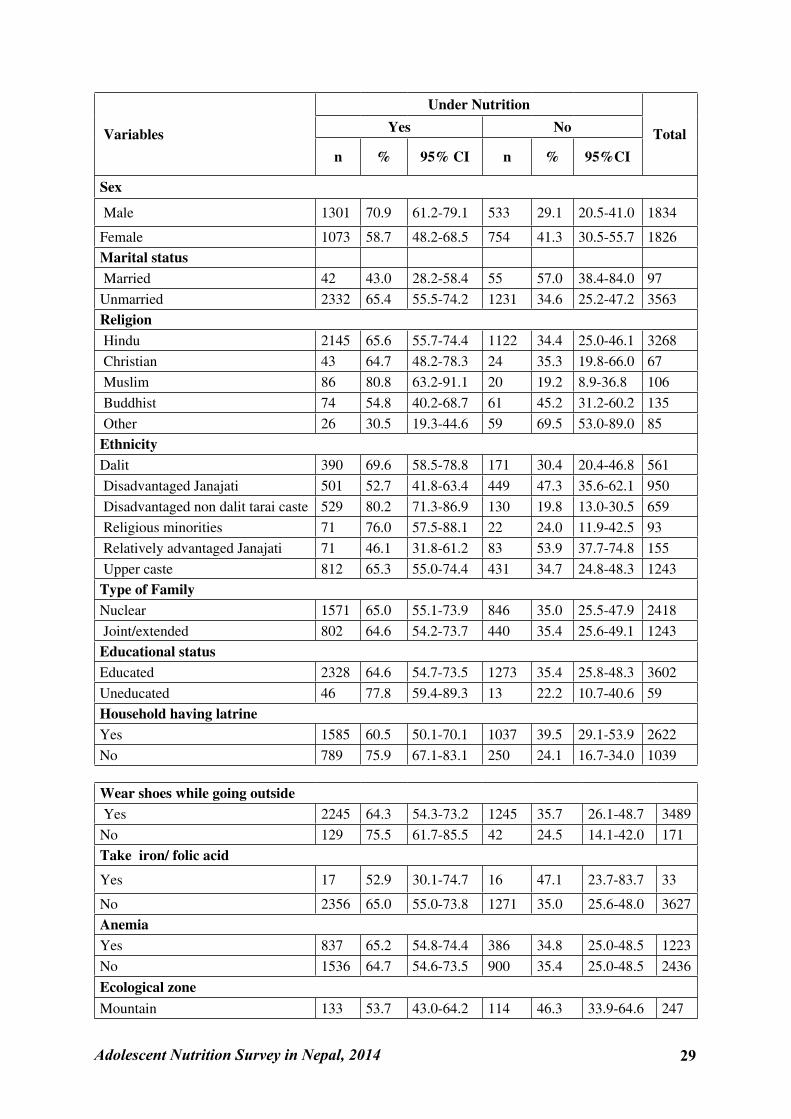
3.7.1 Under Nutrition by Socio-Demographic CharacteristicsThe table above summarized nutrition status of adolescents by age. Table 3.16 now depicts the under nutrition prevalence by socio-demographic characteristic. The table suggests that male and married adolescents were likely to be undernourished. For example, 71% (95% CI: 61.2-79.1) of male adolescents and 59% (95% CI:48.2-68.5) of female adolescents were undernourished. More than two-fifth 43% (95% CI: 28.2-58.4) of married adolescent and 65% ( 95% CI:55.5-74.2 )of unmarried adolescents were undernourished too. By religion, the highest proportion of under nourished adolescents were observed among Muslim 81%(95 % CI: 63.2-91.1), followed by Hindu 66%( 95% CI: 55.7-74.4) , Christian 65% (95% CI: 48.2-78.3) and Buddhist 55%( 95% CI: 40.2-68.7. Prevalence of malnutrition was highest among disadvantaged non Dalit Tarai caste 80% ( 95% CI: 71.3-86.9) followed by religious minorities 76% (95 % CI: 57.5-88.1), Dalit 70% ( 95% CI: 58.5-78.8, upper caste 65% ( 95 % CI: 55.0-74.4) , disadvantaged Janjatis53% ( 95% CI: 41.8-63.4) and relatively advantaged Janjatis 46% ( 95 % CI: 31.8-61.2)Household without latrine had higher proportion of under nourished adolescents 76% ( 95% CI: 67.1-83.1) compared to those household having latrine 61% ( 95% CI: 50.1-70.1) . Wearing shoes appeared to have protective effect against under nutrition. For instance, adolescents who didn't wear shoes had higher prevalence of under nutrition 76%( 95 % CI: 67.1-83.1) compared to adolescents who wear shoes 64% (95 % CI: 54.3-73.2).
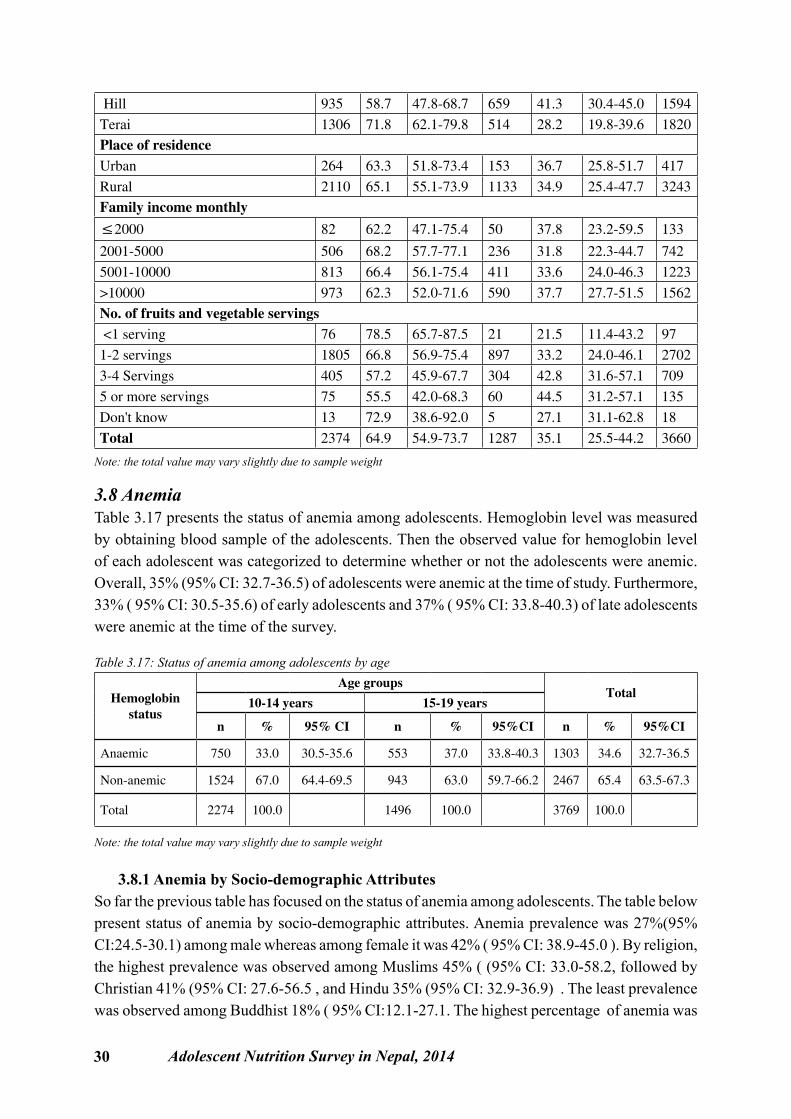
Fifty-three percent 53% ( 95% CI: 30.1-74.7) of adolescents having iron/folic acid were under nourished whereas the proportion was 65% ( 95% CI: 55.0-73.8) for those adolescents who did not had iron/folic acid. Under nutrition was high among adolescents who reside in the Tarai 72% ( 95 % CI: 62.1-79.8) , followed by hills 59% ( 95% CI: 47.8-68.7) and mountains 54% ( 95% CI: 43.0-64.2) . Furthermore, the prevalence of under-nutrition was 63% ( 95% CI:51.8-73.4) among urban residents and 65% ( 95% CI: 55.1-73.9) among rural residents.
Under nutrition was higher among adolescent who ate fruits and vegetables less than one serving. The least likelihood of under nutrition was observed among adolescent who ate five or more servings of fruits and vegetables per day. These findings indicate a dose-response relationship between likelihood of malnutrition and number of fruits and vegetables servings. The prevalence of under nutrition 68%( 95 % CI: 57.7-77.1) was slightly high among households with monthly income of NPR 2001 to 5000. Table 3.16: Under nutrition by background characteristics
Adolescent Nutrition Survey in Nepal, 2014 29
Variables
Under Nutrition
TotalYes No
n % 95% CI n % 95%CI
Sex
Male 1301 70.9 61.2-79.1 533 29.1 20.5-41.0 1834
Female 1073 58.7 48.2-68.5 754 41.3 30.5-55.7 1826Marital status Married 42 43.0 28.2-58.4 55 57.0 38.4-84.0 97Unmarried 2332 65.4 55.5-74.2 1231 34.6 25.2-47.2 3563Religion Hindu 2145 65.6 55.7-74.4 1122 34.4 25.0-46.1 3268 Christian 43 64.7 48.2-78.3 24 35.3 19.8-66.0 67 Muslim 86 80.8 63.2-91.1 20 19.2 8.9-36.8 106 Buddhist 74 54.8 40.2-68.7 61 45.2 31.2-60.2 135 Other 26 30.5 19.3-44.6 59 69.5 53.0-89.0 85EthnicityDalit 390 69.6 58.5-78.8 171 30.4 20.4-46.8 561 Disadvantaged Janajati 501 52.7 41.8-63.4 449 47.3 35.6-62.1 950 Disadvantaged non dalit tarai caste 529 80.2 71.3-86.9 130 19.8 13.0-30.5 659 Religious minorities 71 76.0 57.5-88.1 22 24.0 11.9-42.5 93 Relatively advantaged Janajati 71 46.1 31.8-61.2 83 53.9 37.7-74.8 155 Upper caste 812 65.3 55.0-74.4 431 34.7 24.8-48.3 1243Type of FamilyNuclear 1571 65.0 55.1-73.9 846 35.0 25.5-47.9 2418 Joint/extended 802 64.6 54.2-73.7 440 35.4 25.6-49.1 1243Educational statusEducated 2328 64.6 54.7-73.5 1273 35.4 25.8-48.3 3602Uneducated 46 77.8 59.4-89.3 13 22.2 10.7-40.6 59Household having latrine Yes 1585 60.5 50.1-70.1 1037 39.5 29.1-53.9 2622No 789 75.9 67.1-83.1 250 24.1 16.7-34.0 1039
Wear shoes while going outside Yes 2245 64.3 54.3-73.2 1245 35.7 26.1-48.7 3489No 129 75.5 61.7-85.5 42 24.5 14.1-42.0 171Take iron/ folic acid
Yes 17 52.9 30.1-74.7 16 47.1 23.7-83.7 33
No 2356 65.0 55.0-73.8 1271 35.0 25.6-48.0 3627AnemiaYes 837 65.2 54.8-74.4 386 34.8 25.0-48.5 1223No 1536 64.7 54.6-73.5 900 35.4 25.0-48.5 2436
Ecological zoneMountain 133 53.7 43.0-64.2 114 46.3 33.9-64.6 247
30 Adolescent Nutrition Survey in Nepal, 2014
Hill 935 58.7 47.8-68.7 659 41.3 30.4-45.0 1594Terai 1306 71.8 62.1-79.8 514 28.2 19.8-39.6 1820Place of residence Urban 264 63.3 51.8-73.4 153 36.7 25.8-51.7 417Rural 2110 65.1 55.1-73.9 1133 34.9 25.4-47.7 3243Family income monthly
≤2000 82 62.2 47.1-75.4 50 37.8 23.2-59.5 133
2001-5000 506 68.2 57.7-77.1 236 31.8 22.3-44.7 7425001-10000 813 66.4 56.1-75.4 411 33.6 24.0-46.3 1223>10000 973 62.3 52.0-71.6 590 37.7 27.7-51.5 1562No. of fruits and vegetable servings <1 serving 76 78.5 65.7-87.5 21 21.5 11.4-43.2 971-2 servings 1805 66.8 56.9-75.4 897 33.2 24.0-46.1 27023-4 Servings 405 57.2 45.9-67.7 304 42.8 31.6-57.1 7095 or more servings 75 55.5 42.0-68.3 60 44.5 31.2-57.1 135Don't know 13 72.9 38.6-92.0 5 27.1 31.1-62.8 18Total 2374 64.9 54.9-73.7 1287 35.1 25.5-44.2 3660
Note: the total value may vary slightly due to sample weight
3.8 AnemiaTable 3.17 presents the status of anemia among adolescents. Hemoglobin level was measured by obtaining blood sample of the adolescents. Then the observed value for hemoglobin level of each adolescent was categorized to determine whether or not the adolescents were anemic. Overall, 35% (95% CI: 32.7-36.5) of adolescents were anemic at the time of study. Furthermore, 33% ( 95% CI: 30.5-35.6) of early adolescents and 37% ( 95% CI: 33.8-40.3) of late adolescents were anemic at the time of the survey.
Table 3.17: Status of anemia among adolescents by age
Hemoglobin status
Age groupsTotal
10-14 years 15-19 years
n % 95% CI n % 95%CI n % 95%CI
Anaemic 750 33.0 30.5-35.6 553 37.0 33.8-40.3 1303 34.6 32.7-36.5
Non-anemic 1524 67.0 64.4-69.5 943 63.0 59.7-66.2 2467 65.4 63.5-67.3
Total 2274 100.0 1496 100.0 3769 100.0
Note: the total value may vary slightly due to sample weight
3.8.1 Anemia by Socio-demographic AttributesSo far the previous table has focused on the status of anemia among adolescents. The table below present status of anemia by socio-demographic attributes. Anemia prevalence was 27%(95% CI:24.5-30.1) among male whereas among female it was 42% ( 95% CI: 38.9-45.0 ). By religion, the highest prevalence was observed among Muslims 45% ( (95% CI: 33.0-58.2, followed by Christian 41% (95% CI: 27.6-56.5 , and Hindu 35% (95% CI: 32.9-36.9) . The least prevalence was observed among Buddhist 18% ( 95% CI:12.1-27.1. The highest percentage of anemia was
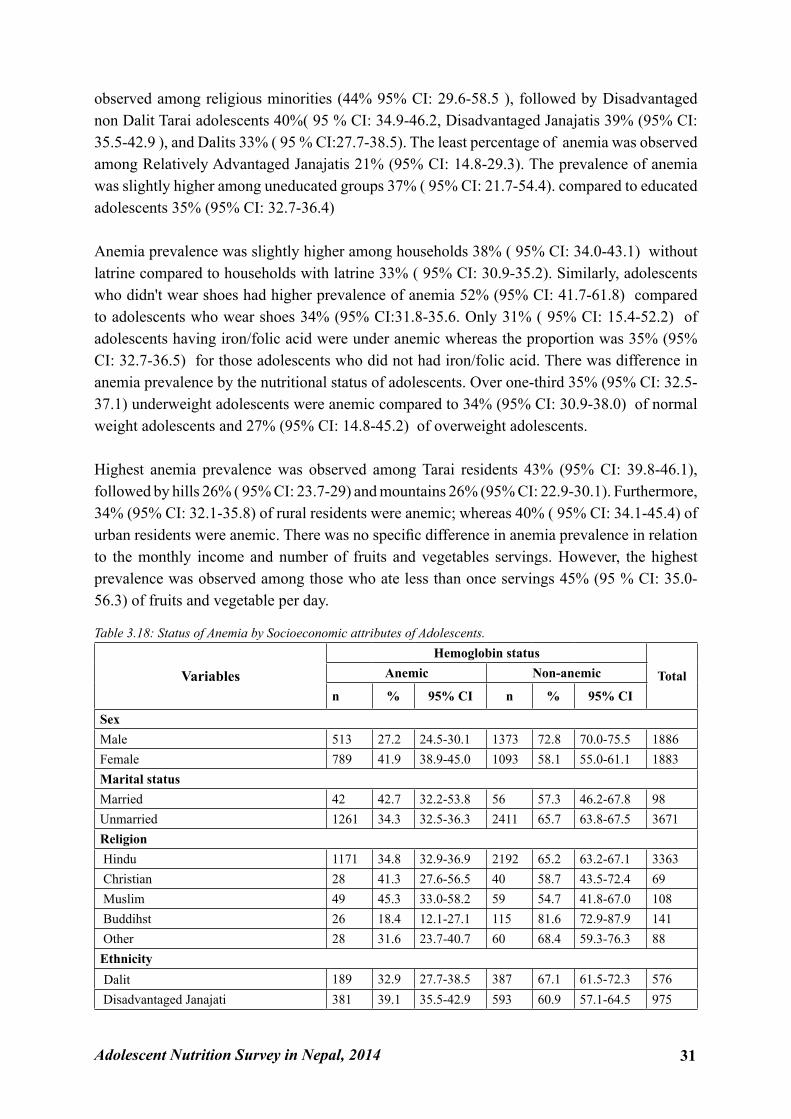
Adolescent Nutrition Survey in Nepal, 2014 31
observed among religious minorities (44% 95% CI: 29.6-58.5 ), followed by Disadvantaged non Dalit Tarai adolescents 40%( 95 % CI: 34.9-46.2, Disadvantaged Janajatis 39% (95% CI: 35.5-42.9 ), and Dalits 33% ( 95 % CI:27.7-38.5). The least percentage of anemia was observed among Relatively Advantaged Janajatis 21% (95% CI: 14.8-29.3). The prevalence of anemia was slightly higher among uneducated groups 37% ( 95% CI: 21.7-54.4). compared to educated adolescents 35% (95% CI: 32.7-36.4)
Anemia prevalence was slightly higher among households 38% ( 95% CI: 34.0-43.1) without latrine compared to households with latrine 33% ( 95% CI: 30.9-35.2). Similarly, adolescents who didn't wear shoes had higher prevalence of anemia 52% (95% CI: 41.7-61.8) compared to adolescents who wear shoes 34% (95% CI:31.8-35.6. Only 31% ( 95% CI: 15.4-52.2) of adolescents having iron/folic acid were under anemic whereas the proportion was 35% (95% CI: 32.7-36.5) for those adolescents who did not had iron/folic acid. There was difference in anemia prevalence by the nutritional status of adolescents. Over one-third 35% (95% CI: 32.5-37.1) underweight adolescents were anemic compared to 34% (95% CI: 30.9-38.0) of normal weight adolescents and 27% (95% CI: 14.8-45.2) of overweight adolescents.
Highest anemia prevalence was observed among Tarai residents 43% (95% CI: 39.8-46.1), followed by hills 26% ( 95% CI: 23.7-29) and mountains 26% (95% CI: 22.9-30.1). Furthermore, 34% (95% CI: 32.1-35.8) of rural residents were anemic; whereas 40% ( 95% CI: 34.1-45.4) of urban residents were anemic. There was no specific difference in anemia prevalence in relation to the monthly income and number of fruits and vegetables servings. However, the highest prevalence was observed among those who ate less than once servings 45% (95 % CI: 35.0-56.3) of fruits and vegetable per day.
Table 3.18: Status of Anemia by Socioeconomic attributes of Adolescents.
VariablesHemoglobin status
TotalAnemic Non-anemic
n % 95% CI n % 95% CI
Sex Male 513 27.2 24.5-30.1 1373 72.8 70.0-75.5 1886Female 789 41.9 38.9-45.0 1093 58.1 55.0-61.1 1883Marital status Married 42 42.7 32.2-53.8 56 57.3 46.2-67.8 98Unmarried 1261 34.3 32.5-36.3 2411 65.7 63.8-67.5 3671Religion Hindu 1171 34.8 32.9-36.9 2192 65.2 63.2-67.1 3363 Christian 28 41.3 27.6-56.5 40 58.7 43.5-72.4 69 Muslim 49 45.3 33.0-58.2 59 54.7 41.8-67.0 108 Buddihst 26 18.4 12.1-27.1 115 81.6 72.9-87.9 141 Other 28 31.6 23.7-40.7 60 68.4 59.3-76.3 88Ethnicity Dalit 189 32.9 27.7-38.5 387 67.1 61.5-72.3 576 Disadvantaged Janajati 381 39.1 35.5-42.9 593 60.9 57.1-64.5 975
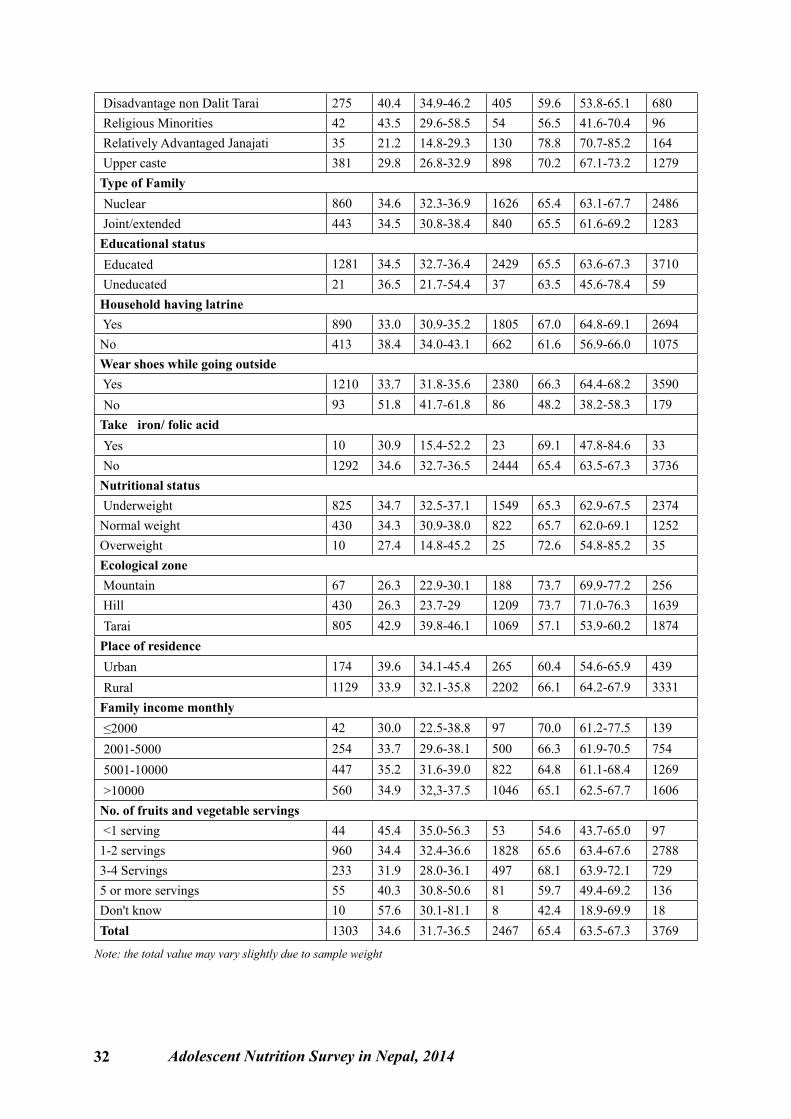
32 Adolescent Nutrition Survey in Nepal, 2014
Disadvantage non Dalit Tarai 275 40.4 34.9-46.2 405 59.6 53.8-65.1 680 Religious Minorities 42 43.5 29.6-58.5 54 56.5 41.6-70.4 96 Relatively Advantaged Janajati 35 21.2 14.8-29.3 130 78.8 70.7-85.2 164 Upper caste 381 29.8 26.8-32.9 898 70.2 67.1-73.2 1279Type of Family Nuclear 860 34.6 32.3-36.9 1626 65.4 63.1-67.7 2486 Joint/extended 443 34.5 30.8-38.4 840 65.5 61.6-69.2 1283Educational status Educated 1281 34.5 32.7-36.4 2429 65.5 63.6-67.3 3710 Uneducated 21 36.5 21.7-54.4 37 63.5 45.6-78.4 59Household having latrine Yes 890 33.0 30.9-35.2 1805 67.0 64.8-69.1 2694No 413 38.4 34.0-43.1 662 61.6 56.9-66.0 1075Wear shoes while going outside Yes 1210 33.7 31.8-35.6 2380 66.3 64.4-68.2 3590 No 93 51.8 41.7-61.8 86 48.2 38.2-58.3 179Take iron/ folic acid Yes 10 30.9 15.4-52.2 23 69.1 47.8-84.6 33 No 1292 34.6 32.7-36.5 2444 65.4 63.5-67.3 3736Nutritional status Underweight 825 34.7 32.5-37.1 1549 65.3 62.9-67.5 2374Normal weight 430 34.3 30.9-38.0 822 65.7 62.0-69.1 1252Overweight 10 27.4 14.8-45.2 25 72.6 54.8-85.2 35Ecological zone Mountain 67 26.3 22.9-30.1 188 73.7 69.9-77.2 256 Hill 430 26.3 23.7-29 1209 73.7 71.0-76.3 1639 Tarai 805 42.9 39.8-46.1 1069 57.1 53.9-60.2 1874Place of residence Urban 174 39.6 34.1-45.4 265 60.4 54.6-65.9 439 Rural 1129 33.9 32.1-35.8 2202 66.1 64.2-67.9 3331Family income monthly ≤2000 42 30.0 22.5-38.8 97 70.0 61.2-77.5 139 2001-5000 254 33.7 29.6-38.1 500 66.3 61.9-70.5 754 5001-10000 447 35.2 31.6-39.0 822 64.8 61.1-68.4 1269 >10000 560 34.9 32,3-37.5 1046 65.1 62.5-67.7 1606No. of fruits and vegetable servings <1 serving 44 45.4 35.0-56.3 53 54.6 43.7-65.0 971-2 servings 960 34.4 32.4-36.6 1828 65.6 63.4-67.6 27883-4 Servings 233 31.9 28.0-36.1 497 68.1 63.9-72.1 7295 or more servings 55 40.3 30.8-50.6 81 59.7 49.4-69.2 136Don't know 10 57.6 30.1-81.1 8 42.4 18.9-69.9 18Total 1303 34.6 31.7-36.5 2467 65.4 63.5-67.3 3769
Note: the total value may vary slightly due to sample weight
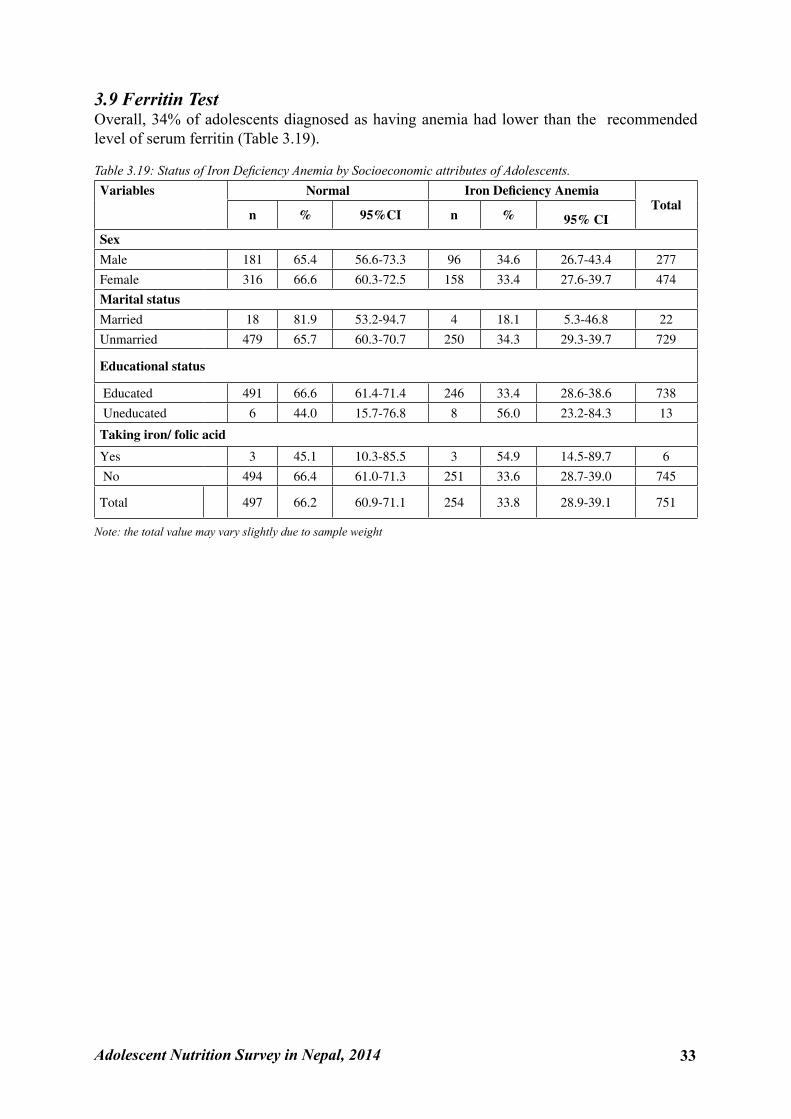
Adolescent Nutrition Survey in Nepal, 2014 33
3.9 Ferritin TestOverall, 34% of adolescents diagnosed as having anemia had lower than the recommended level of serum ferritin (Table 3.19).
Table 3.19: Status of Iron Deficiency Anemia by Socioeconomic attributes of Adolescents.Variables Normal Iron Deficiency Anemia
Totaln % 95%CI n % 95% CI
Sex
Male 181 65.4 56.6-73.3 96 34.6 26.7-43.4 277
Female 316 66.6 60.3-72.5 158 33.4 27.6-39.7 474
Marital status
Married 18 81.9 53.2-94.7 4 18.1 5.3-46.8 22
Unmarried 479 65.7 60.3-70.7 250 34.3 29.3-39.7 729
Educational status
Educated 491 66.6 61.4-71.4 246 33.4 28.6-38.6 738
Uneducated 6 44.0 15.7-76.8 8 56.0 23.2-84.3 13
Taking iron/ folic acid
Yes 3 45.1 10.3-85.5 3 54.9 14.5-89.7 6
No 494 66.4 61.0-71.3 251 33.6 28.7-39.0 745
Total 497 66.2 60.9-71.1 254 33.8 28.9-39.1 751
Note: the total value may vary slightly due to sample weight
34 Adolescent Nutrition Survey in Nepal, 2014
Chapter 4: Conclusion4.1 ConclusionThe purpose of this survey was to assess the nutritional status of adolescents aged 10 to 19 years. In so doing, a descriptive cross sectional study was conducted in 13 districts of Nepal representing the three ecological regions. One to one interview with adolescents, using a structured questionnaire, was carried out to gather information related to socio demographic characteristics and the nutritional practices of adolescents. Data obtained from anthropometric measurement and blood sample examination was used to determine the prevalence of under nutrition and anemia.
The study findings indicate that smoking is a common harmful health practice for adolescent boys whereas menstrual malpractice for adolescent girls. For example, the prevalence of smoking among male adolescent was 6% compared to female adolescents (0.2%). Similarly, a notable proportion of adolescent girls use a cow shed and the Chhaupadi goth to sleep during their menstruation. With respect to nutritional practice, more than 90% of adolescents appreciated the role of nutritious food in their physical growth and mental development. However, such views are not necessarily reflected in their food habits. For example, only small proportion of adolescents (4%) adequately consumed fruits and vegetable while an overwhelming proportion (42%) consumed junk food at least twice a week. These findings suggest a need for interventions to encourage healthy eating practices of adolescents.
Turning now to the nutritional status of adolescent, nearly 65% were found undernourished during the time of survey. The prevalence was higher for male and married adolescents. Seventy-one percent of male (95% CI: 61.2-79.1)(compared with 59% (95%CI 48.2-68.5) of female) adolescentsbut this difference is not statistically significant and 43% of married (compared with 69% of unmarried) adolescents were undernourished. Similarly, the prevalence was highest among disadvantaged non Dalit Terai caste (80%) and religious minorities (76%). The study also shows high prevalence of anemia, especially among the female (44%) adolescents. The highest likelihood of anemia was observed among disadvantaged ethnic groups such as non Dalit Terai adolescents (39%) and Janjatis (38%). The likelihood of anemia was highest among uneducated adolescents (39%) compared to educated adolescents (33%). Adolescents who didn't wear shoes had higher prevalence of anemia (53%) compared to adolescents who wear shoes (33%). Not surprisingly, the protective effective might be due to the fact that wearing shoes prevent hook worm infestation which in turn reduces the risk of anemia.
This study is the first to investigate nutritional status of adolescents in the context of Nepal. Although the Demographic and Health Surveys have examined the nutritional status of the
Adolescent Nutrition Survey in Nepal, 2014 35
Nepalese population, it should be noted here that the nature of this study differs from that of the previous study in relation to the study population. This study unequivocally focused on adolescents aged 10 to 19 years. To put it more simply, this study considered adolescents whereas the focus of Demographic and Health Surveys is on maternal and child nutrition. This study provides insights on the overall nutritional status of adolescents of Nepal and its distribution by different socio-demographic characteristics. The study findings offer some baseline information to help program planners to assess the status of the Iron and Folic Acid supplementation program for adolescents in the pilot districts implemented by Government of Nepal. Furthermore, the study findings are applicable to determine new priorities, especially within the context of Sustainable Development Goals (SDGs). While successfully implementing SDGs in Nepal has been criticized for the dearth of evidence11, the study findings provide opportunities to bridge the evidence gap by providing the benchmark information on adolescent nutrition.
4.2 Ways ForwardThe above section summarizes the study findings and outlined its applicability within the current national context. This section now considers recommendations for future research and practice. Overall, anemia and under-nutrition bare a major nutritional problem among adolescents of Nepal. The Tarai region in particular observed poor nutritional and hygienic practices, low BMI and high prevalence of anemia. Nutritional interventions targeting the adolescents of the region is thus required. Such programs would include mass supplementation of Iron and folic acid to the adolescent population. Further studies are required to uncover the ecology of anemia and under nutrition.
36 Adolescent Nutrition Survey in Nepal, 2014
References
1. WHO. Adolescent Health: World Health Organization; 2016. Available from: http://www.who.int/topics/adolescent_health/en/.
2. WHO. Nutrition in Adolescence: Issues and Challenges for the Health Sector: Issues in Adolescent Health and Development. World Health Organization, 2005.
3. WHO. Improvement of Nutritional Status of Adolescents. New Delhi, India: World Health Organization Regional Office for South-East Asia, 2002.
4. WHO. Adolescent Nutrition: A Review of the Situation in Selected South-East Asian Countries. World Health Organization Regional Office for South-East Asia, 2006.
5. De Benoist B, Mclean E,Egli I, Gogswell M. Worldwide Prevalence of Anaemia 1993-2005. WHO Global Database on Anaemia Geneva, World Health Organization, 2008
6. Ministry of Health and Population (MOHP) [Nepal], New ERA and ICF International Inc. Nepal Demographic and Health Survey 2011. Kathmandu, Nepal: Ministry of Health and Population, New ERA and ICF International; 2012.
7. Sinha AK, Karki GMS, Karna KK. Prevalence of Anemia among Adolescents in Biratnagar, Morang District, Nepal. Int J Pharm Bio. 2012; 3(5): 1077-1081.
8. Regmi SC, Adhikari R. A Study on the Factors Influencing Nutritional Status of Adoleccents Girls in Nepal, ICRW, 1717 Massachusetts Avenue NW, Suite 302, Washington , DC 20036, 1994
9. CBS. National Population and Housing Census 2011. Kathmandu, Nepal: National Planning Commission, Central Bureau of Statistics, 2011.
10. WHO, UNICEF, UNU. Iron Deficiency Anemia: Assessment, Prevention and Control. A Guide for Program Manager. World Health Organization, 2001.
11. National Planning Commission. Sustainable Development Goals, 2016-2030, National (Preliminary) Report. Kathmandu, Nepal: Government of Nepal, National Planning Commission, 2015.
Adolescent Nutrition Survey in Nepal, 2014 37
Annex I Informed Consent/Assent Form / Ethical ConsiderationsAdolescent Nutrition Survey in NepalInformation letter and participation consent (10-19 years adolescent)
Namaste! My name is ………………………………….I am here to collect data of the research entitled Adolescent Nutrition Survey in Nepal which is conducted by Nepal Health Research Council (NHRC). This survey is focused in the nutritional status of adolescent of Nepal which includes anthropometric measurement of 10-19 years adolescent, dietary habit as well as haemoglobin and ferritin level in their blood. Information provided by you will help Nepal Government in the policy making to uplift the nutrition status of adolescent.
ProcedureIf you are willing to participate in this study you are requested to sign in the consent form. A simple questionnaire is prepared for this study which includes social, personal issues of you/ your child as well as questionnaire related to daily activities specially nutrition and food pattern. Anthropometric measurement will be done by using Seca digital weighing machine (weight) and stature meter (height). The concentration of hemoglobin in the blood of adolescent will be measured using the HemoCue system. A sterile lancet will be used to prick blood from finger and immediately put on microcuvette so as to draw blood by capillary action. After filling the microcuvette by blood, the microcuvette will be placed in HemoCue machine after calibrating to zero. The haemoglobin content in the blood will be displaced within one minute in the machine and recorded in the questionnaire. This all process will take about 30 minutes.
Respondents RightsYour participation in this research is voluntary. During the interview you can withdraw your participation if you are not willing to continue.
Benefit/RisksYou have no financial benefits in this study but you are directly benefited with getting information regarding your haemoglobin level, BMI. If you are willing to participate in this study you may bear mild pain during taking the blood sample.
ConfidentialityConfidentiality will be maintained for all personal information. Computer coding will be done to protect personal information. Personal details will not be published in the journal, reports etc.
Additional information regarding the studyDuring the study if you have any question and queries regarding the study then you can ask to interviewer after the interview or you can also contact to Nepal Health Research Council, Ramshahpath, Kathmandu (telephone no 01-4254220).
38 Adolescent Nutrition Survey in Nepal, 2014
This research has been approved by Ethical Review Board of Nepal Health research Council. The responsibility of this board is to protect research participant from any kind of risk during the study.
Consent for the respondent for participationI have fully understood that to take part in this study is fully voluntary. I can withdraw my participation from this study at anytime without any charge. I am fully aware with objectives, procedure, danger and advantage of this study. I have understood; information taken from me is only for study purpose. I have had opportunity to ask question to clarify any queries during the study. I am willing to give my consent to use the information from me in this study only. For me to participate in this study is my personal decision. I have understood that the participation in the study will have no harm for me.
Respondent's Signature …………………………….
Respondent's Name ……………………………… Lapche (for illiterate)Thumb of Right hand
Date: --/--/---- day/ month/ year.
I have read this consent form while taking consent from the participant or participant has read the consent form. I have given opportunity to ask any questions. I can ensure that participant has given their personal information independently.
Interviewer Name Interviewer Signature
…………………………. ………………………………Date: --/--/---- day/ month/ year
Adolescent Nutrition Survey in Nepal, 2014 39
Adolescent Nutrition Survey in Nepal
Information letter and participation consent (10-17 years adolescent; assent form for parents)Namaste! My name is ………………………………….I am here to collect data of the research entitled Adolescent Nutrition Survey in Nepal which is conducted by Nepal Health Research Council (NHRC). This survey is focused in the nutritional status of adolescent of Nepal which includes anthropometric measurement of 10-19 years adolescent, dietary habit as well as haemoglobin and ferritin level in their blood. Information provided by your children will help Nepal Government in the policy making to uplift the nutrition status of adolescent.
ProcedureIf the selected adolescent from your household is able to participate in this study you are requested to sign in the assent form on his/her behalf. A simple questionnaire is prepared for this study which includes social, personal issues of your child as well as questionnaire related to daily activities specially nutrition and food pattern. Anthropometric measurement will be done by using Seca digital weighing machine (weight) and stature meter (height). The concentration of hemoglobin in the blood of adolescent will be measured using the HemoCue system. A sterile lancet will be used to prick blood from finger and immediately put on microcuvette so as to draw blood by capillary action. After filling the microcuvette by blood, the microcuvette will be placed in HemoCue machine after calibrating to zero. The haemoglobin content in the blood will be displaced within one minute in the machine and recorded in the questionnaire. This all process will take about 30 minutes.
Respondents RightsYour child's participation in this research is voluntary. During the interview your child can withdraw his/her participation if he/she is not willing to continue.
Benefit/RisksYou have no financial benefits in this study but you are directly benefited with getting information regarding your haemoglobin level, BMI. If you are willing to participate in this study you may bear mild pain during taking the blood sample.
ConfidentialityConfidentiality will be maintained for all personal information. Computer coding will be done to protect personal information. Personal details will not be published in the journal, reports etc.
Additional information regarding the studyDuring the study if you have any question and queries regarding the study then you can ask to interviewer after the interview or you can also contact to Nepal Health Research Council, Ramshah Path, Kathmandu (telephone no 01-4254220).
This research has been approved by Ethical Review Board of Nepal Health research Council.
40 Adolescent Nutrition Survey in Nepal, 2014
The responsibility of this board is to protect research participant from any kind of risk during the study.
Assent for the respondent by parents for participationI have fully understood that to take part in this study is fully voluntary. I can withdraw my child's participation in this study at anytime without any charge. I am fully aware with objectives, procedure, danger and advantage of this study. I have understood; information taken from my child is only for study purpose. I have had opportunity to ask question to clarify any queries during the study. I am willing to give my assent to use the information from my child in this study only. To allow my child to participate in this study is my personal decision. I have understood that the participation in the study will have no harm for me and my child.
Parent's Signature …………………………….
Parent's Name ………………………………
Respondent's Signature …………………………….
Respondent's Name ……………………………… Lapche (for illiterate)Thumb of Right hand
Date: --/--/---- day/ month/ year.
I have read this assent form while taking assent from the participant's parent or participant's parent has read the consent form. I have given opportunity to ask any questions. I can ensure that participant's parent has given their personal information independently.
Interviewer Name Interviewer Signature
…………………………. ………………………………Date: --/--/---- day/ month/ year
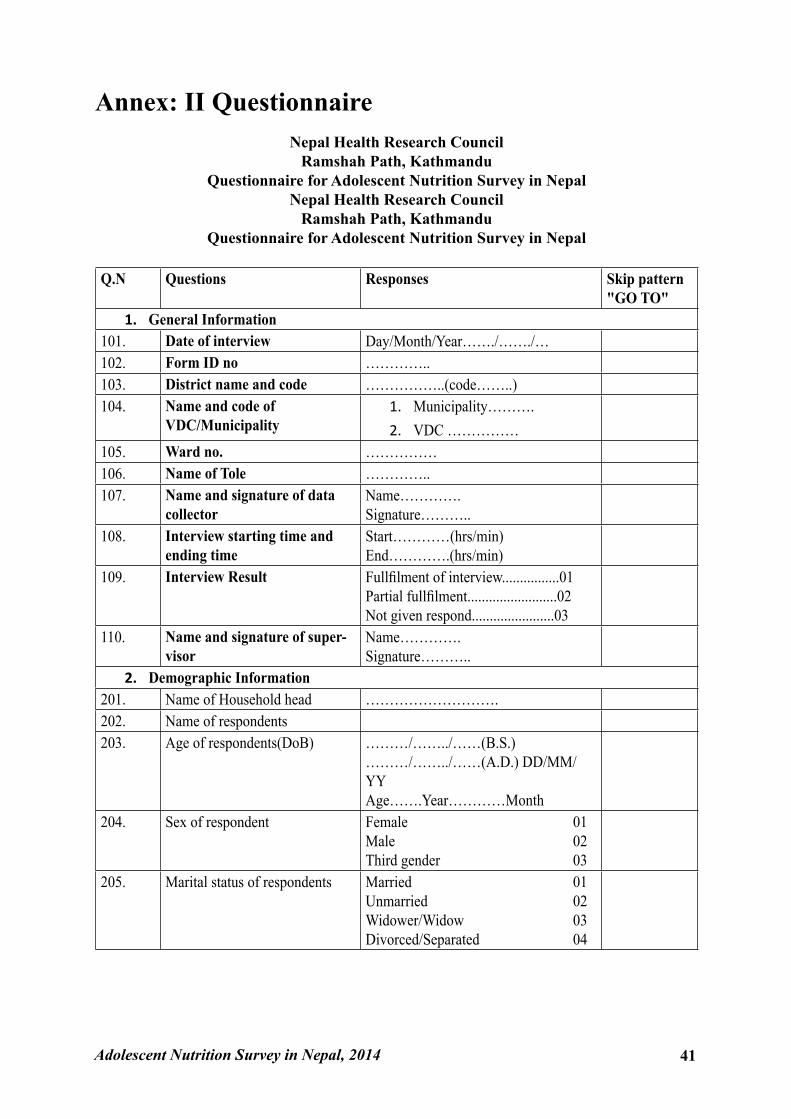
Adolescent Nutrition Survey in Nepal, 2014 41
Annex: II QuestionnaireNepal Health Research Council
Ramshah Path, KathmanduQuestionnaire for Adolescent Nutrition Survey in Nepal
Nepal Health Research CouncilRamshah Path, Kathmandu
Questionnaire for Adolescent Nutrition Survey in Nepal
Q.N Questions Responses Skip pattern "GO TO"
1. General Information101. Date of interview Day/Month/Year……./……./…102. Form ID no …………..103. District name and code ……………..(code……..)104. Name and code of
VDC/Municipality 1. Municipality……….2. VDC ……………
105. Ward no. ……………106. Name of Tole …………..107. Name and signature of data
collectorName………….Signature………..
108. Interview starting time and ending time
Start…………(hrs/min)End………….(hrs/min)
109. Interview Result Fullfilment of interview................01Partial fullfilment.........................02Not given respond.......................03
110. Name and signature of super-visor
Name………….Signature………..
2. Demographic Information201. Name of Household head ……………………….202. Name of respondents203. Age of respondents(DoB) ………/……../……(B.S.)
………/……../……(A.D.) DD/MM/YYAge…….Year…………Month
204. Sex of respondent Female 01Male 02Third gender 03
205. Marital status of respondents Married 01Unmarried 02Widower/Widow 03Divorced/Separated 04
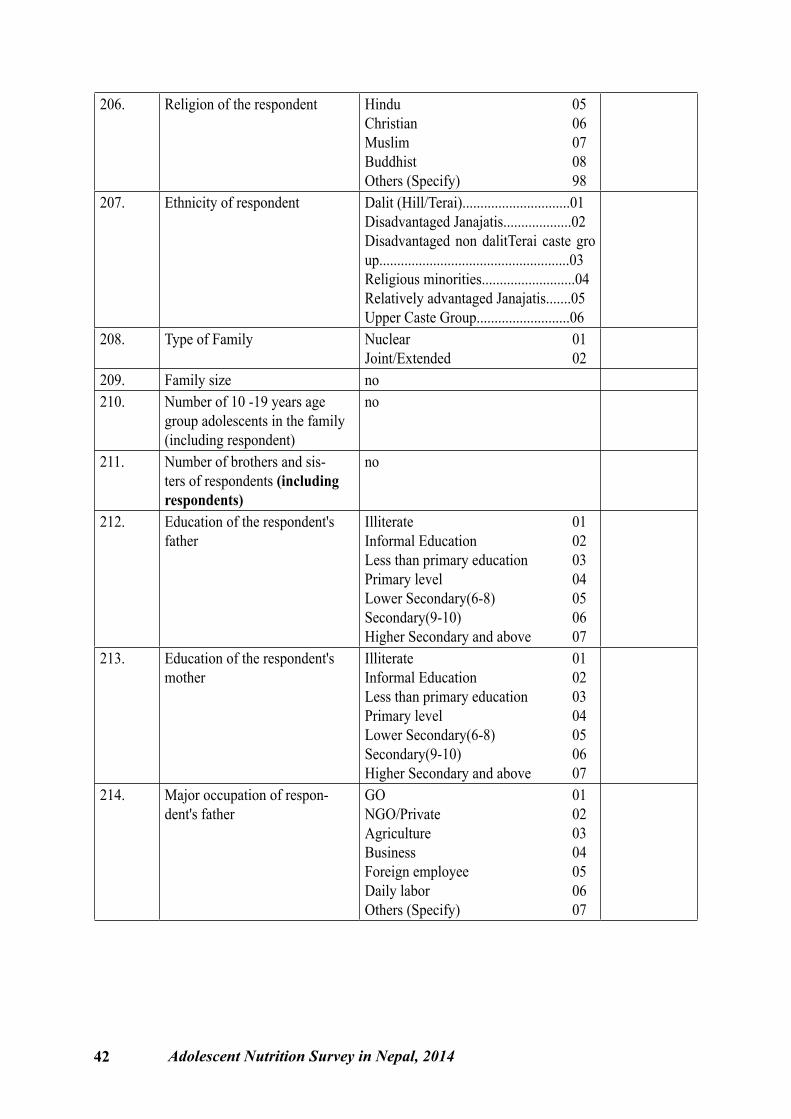
42 Adolescent Nutrition Survey in Nepal, 2014
206. Religion of the respondent Hindu 05Christian 06Muslim 07Buddhist 08Others (Specify) 98
207. Ethnicity of respondent Dalit (Hill/Terai)..............................01Disadvantaged Janajatis...................02Disadvantaged non dalitTerai caste group.....................................................03Religious minorities..........................04Relatively advantaged Janajatis.......05Upper Caste Group..........................06
208. Type of Family Nuclear 01Joint/Extended 02
209. Family size no210. Number of 10 -19 years age
group adolescents in the family (including respondent)
no
211. Number of brothers and sis-ters of respondents (including respondents)
no
212. Education of the respondent's father
Illiterate 01Informal Education 02Less than primary education 03Primary level 04Lower Secondary(6-8) 05Secondary(9-10) 06Higher Secondary and above 07
213. Education of the respondent's mother
Illiterate 01Informal Education 02Less than primary education 03Primary level 04Lower Secondary(6-8) 05Secondary(9-10) 06Higher Secondary and above 07
214. Major occupation of respon-dent's father
GO 01NGO/Private 02Agriculture 03Business 04Foreign employee 05Daily labor 06Others (Specify) 07
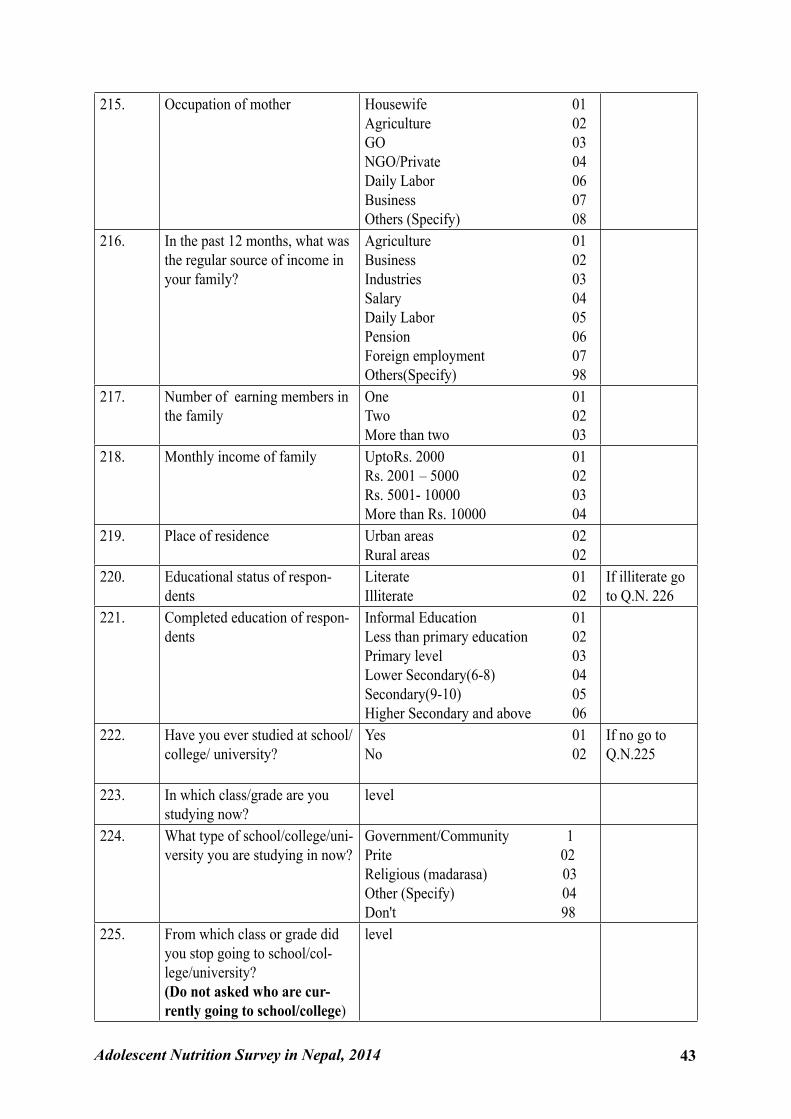
Adolescent Nutrition Survey in Nepal, 2014 43
215. Occupation of mother Housewife 01Agriculture 02GO 03NGO/Private 04Daily Labor 06Business 07Others (Specify) 08
216. In the past 12 months, what was the regular source of income in your family?
Agriculture 01Business 02Industries 03Salary 04Daily Labor 05Pension 06Foreign employment 07Others(Specify) 98
217. Number of earning members in the family
One 01Two 02More than two 03
218. Monthly income of family UptoRs. 2000 01Rs. 2001 – 5000 02Rs. 5001- 10000 03More than Rs. 10000 04
219. Place of residence Urban areas 02Rural areas 02
220. Educational status of respon-dents
Literate 01Illiterate 02
If illiterate go to Q.N. 226
221. Completed education of respon-dents
Informal Education 01Less than primary education 02Primary level 03Lower Secondary(6-8) 04Secondary(9-10) 05Higher Secondary and above 06
222. Have you ever studied at school/ college/ university?
Yes 01No 02
If no go to Q.N.225
223. In which class/grade are you studying now?
level
224. What type of school/college/uni-versity you are studying in now?
Government/Community 1Prite 02Religious (madarasa) 03Other (Specify) 04Don't 98
225. From which class or grade did you stop going to school/col-lege/university?(Do not asked who are cur-rently going to school/college)
level
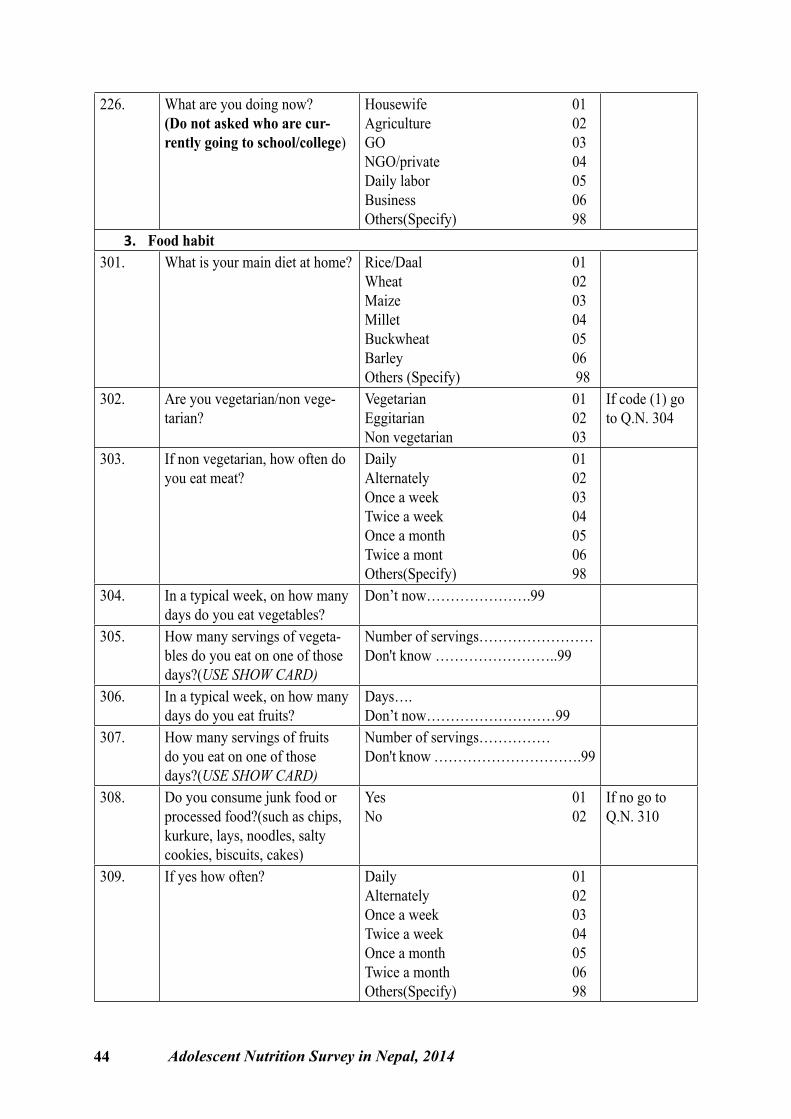
44 Adolescent Nutrition Survey in Nepal, 2014
226. What are you doing now?(Do not asked who are cur-rently going to school/college)
Housewife 01Agriculture 02GO 03NGO/private 04Daily labor 05Business 06Others(Specify) 98
3. Food habit301. What is your main diet at home? Rice/Daal 01
Wheat 02Maize 03Millet 04Buckwheat 05Barley 06Others (Specify) 98
302. Are you vegetarian/non vege-tarian?
Vegetarian 01Eggitarian 02Non vegetarian 03
If code (1) go to Q.N. 304
303. If non vegetarian, how often do you eat meat?
Daily 01Alternately 02Once a week 03Twice a week 04Once a month 05Twice a mont 06Others(Specify) 98
304. In a typical week, on how many days do you eat vegetables?
Don’t now………………….99
305. How many servings of vegeta-bles do you eat on one of those days?(USE SHOW CARD)
Number of servings……………………Don't know ……………………..99
306. In a typical week, on how many days do you eat fruits?
Days….Don’t now………………………99
307. How many servings of fruits do you eat on one of those days?(USE SHOW CARD)
Number of servings……………Don't know ………………………….99
308. Do you consume junk food or processed food?(such as chips, kurkure, lays, noodles, salty cookies, biscuits, cakes)
Yes 01No 02
If no go to Q.N. 310
309. If yes how often? Daily 01Alternately 02Once a week 03Twice a week 04Once a month 05Twice a month 06Others(Specify) 98
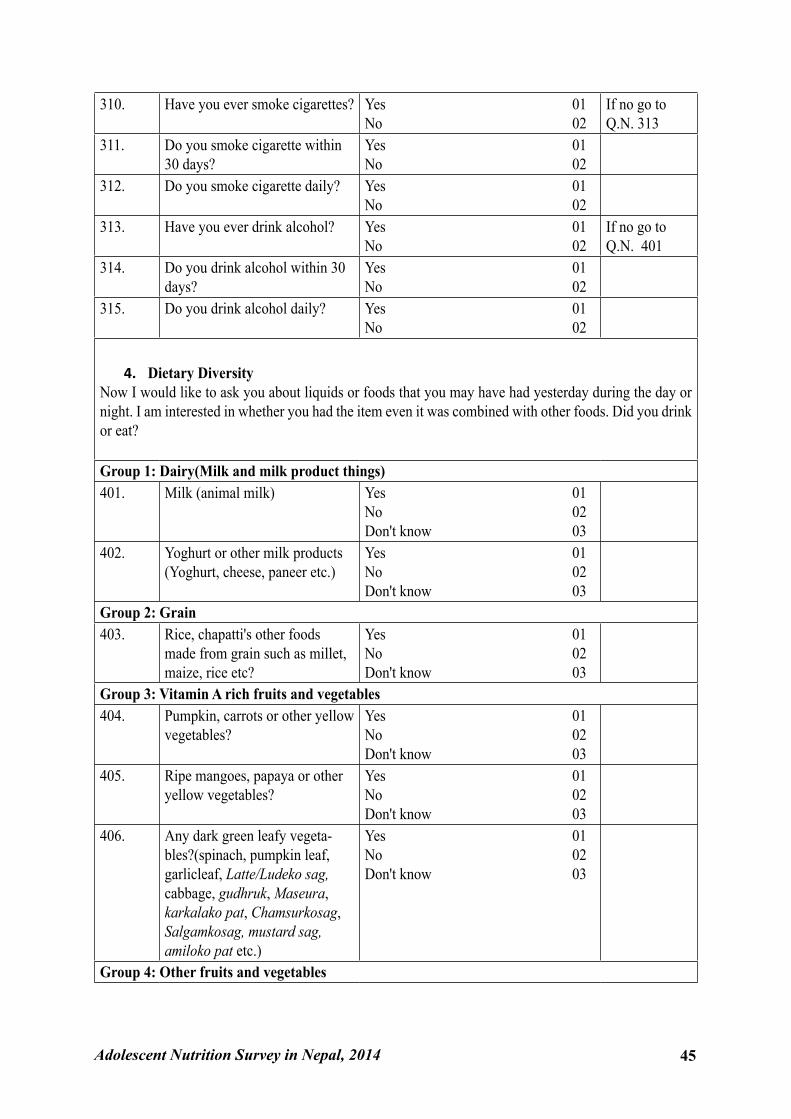
Adolescent Nutrition Survey in Nepal, 2014 45
310. Have you ever smoke cigarettes? Yes 01No 02
If no go to Q.N. 313
311. Do you smoke cigarette within 30 days?
Yes 01No 02
312. Do you smoke cigarette daily? Yes 01No 02
313. Have you ever drink alcohol? Yes 01No 02
If no go to Q.N. 401
314. Do you drink alcohol within 30 days?
Yes 01No 02
315. Do you drink alcohol daily? Yes 01No 02
4. Dietary DiversityNow I would like to ask you about liquids or foods that you may have had yesterday during the day or night. I am interested in whether you had the item even it was combined with other foods. Did you drink or eat?
Group 1: Dairy(Milk and milk product things)401. Milk (animal milk) Yes 01
No 02Don't know 03
402. Yoghurt or other milk products (Yoghurt, cheese, paneer etc.)
Yes 01No 02Don't know 03
Group 2: Grain403. Rice, chapatti's other foods
made from grain such as millet, maize, rice etc?
Yes 01No 02Don't know 03
Group 3: Vitamin A rich fruits and vegetables404. Pumpkin, carrots or other yellow
vegetables?Yes 01No 02Don't know 03
405. Ripe mangoes, papaya or other yellow vegetables?
Yes 01No 02Don't know 03
406. Any dark green leafy vegeta-bles?(spinach, pumpkin leaf, garlicleaf, Latte/Ludeko sag, cabbage, gudhruk, Maseura, karkalako pat, Chamsurkosag, Salgamkosag, mustard sag, amiloko pat etc.)
Yes 01No 02Don't know 03
Group 4: Other fruits and vegetables
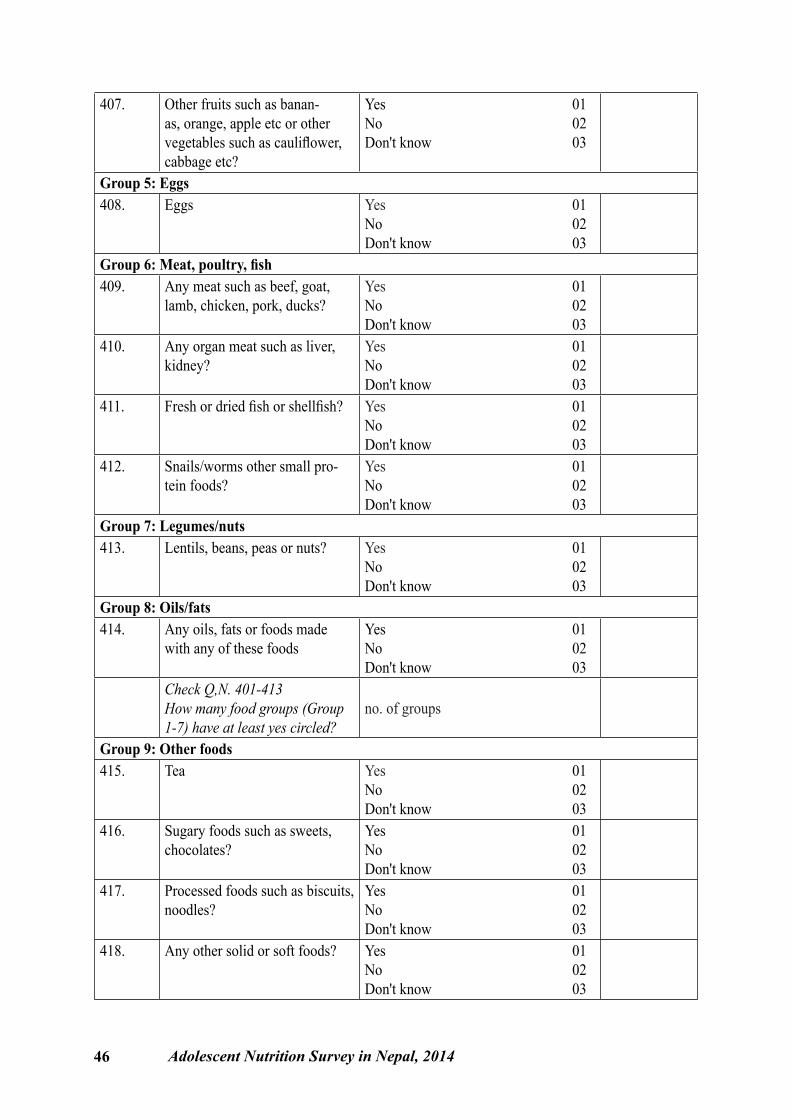
46 Adolescent Nutrition Survey in Nepal, 2014
407. Other fruits such as banan-as, orange, apple etc or other vegetables such as cauliflower, cabbage etc?
Yes 01No 02Don't know 03
Group 5: Eggs408. Eggs Yes 01
No 02Don't know 03
Group 6: Meat, poultry, fish409. Any meat such as beef, goat,
lamb, chicken, pork, ducks?Yes 01No 02Don't know 03
410. Any organ meat such as liver, kidney?
Yes 01No 02Don't know 03
411. Fresh or dried fish or shellfish? Yes 01No 02Don't know 03
412. Snails/worms other small pro-tein foods?
Yes 01No 02Don't know 03
Group 7: Legumes/nuts413. Lentils, beans, peas or nuts? Yes 01
No 02Don't know 03
Group 8: Oils/fats414. Any oils, fats or foods made
with any of these foodsYes 01No 02Don't know 03
Check Q,N. 401-413How many food groups (Group 1-7) have at least yes circled?
no. of groups
Group 9: Other foods415. Tea Yes 01
No 02Don't know 03
416. Sugary foods such as sweets, chocolates?
Yes 01No 02Don't know 03
417. Processed foods such as biscuits, noodles?
Yes 01No 02Don't know 03
418. Any other solid or soft foods? Yes 01No 02Don't know 03
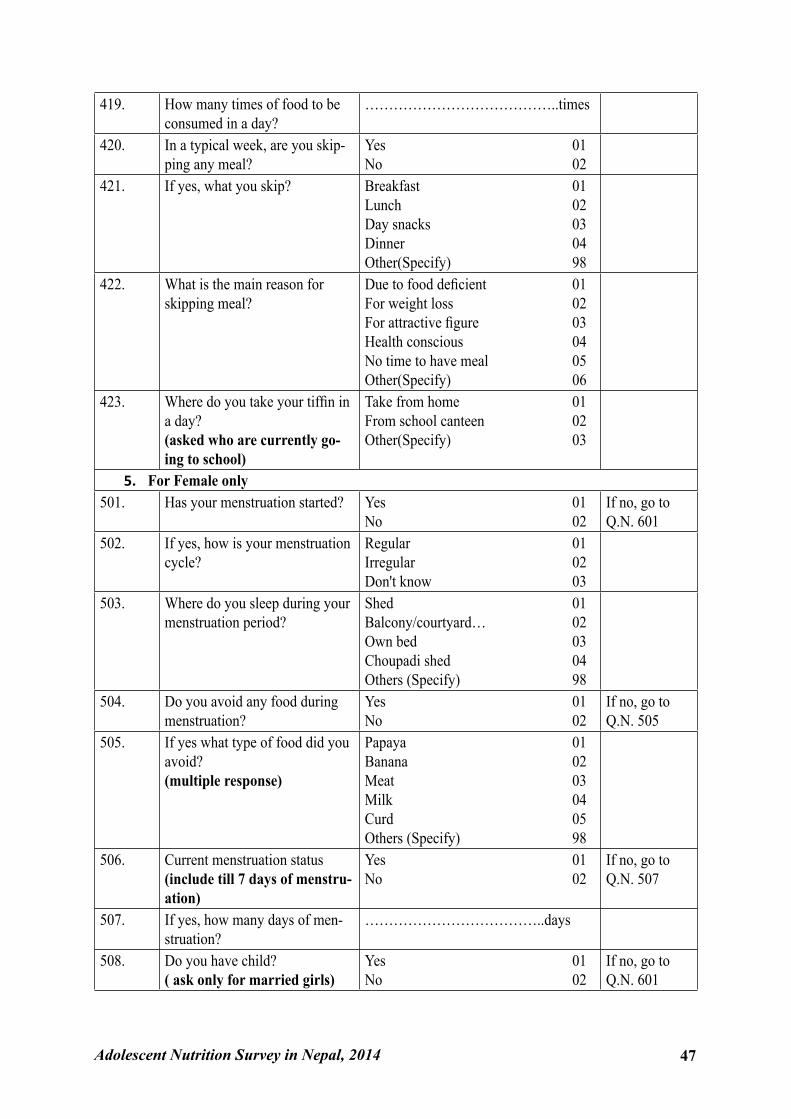
Adolescent Nutrition Survey in Nepal, 2014 47
419. How many times of food to be consumed in a day?
…………………………………..times
420. In a typical week, are you skip-ping any meal?
Yes 01No 02
421. If yes, what you skip? Breakfast 01Lunch 02Day snacks 03Dinner 04Other(Specify) 98
422. What is the main reason for skipping meal?
Due to food deficient 01For weight loss 02For attractive figure 03Health conscious 04No time to have meal 05Other(Specify) 06
423. Where do you take your tiffin in a day?(asked who are currently go-ing to school)
Take from home 01From school canteen 02Other(Specify) 03
5. For Female only501. Has your menstruation started? Yes 01
No 02If no, go to Q.N. 601
502. If yes, how is your menstruation cycle?
Regular 01Irregular 02Don't know 03
503. Where do you sleep during your menstruation period?
Shed 01Balcony/courtyard… 02Own bed 03Choupadi shed 04Others (Specify) 98
504. Do you avoid any food during menstruation?
Yes 01No 02
If no, go to Q.N. 505
505. If yes what type of food did you avoid?(multiple response)
Papaya 01Banana 02Meat 03Milk 04Curd 05Others (Specify) 98
506. Current menstruation status(include till 7 days of menstru-ation)
Yes 01No 02
If no, go to Q.N. 507
507. If yes, how many days of men-struation?
………………………………..days
508. Do you have child?( ask only for married girls)
Yes 01No 02
If no, go to Q.N. 601
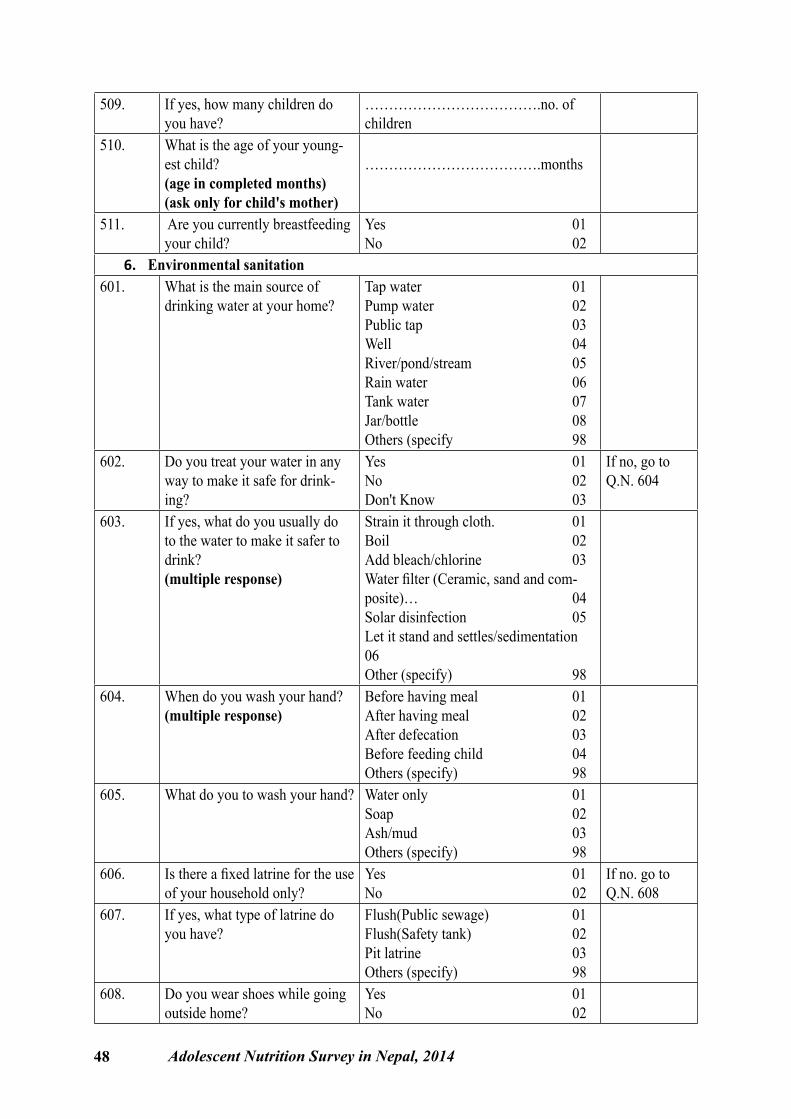
48 Adolescent Nutrition Survey in Nepal, 2014
509. If yes, how many children do you have?
……………………………….no. of children
510. What is the age of your young-est child? (age in completed months)(ask only for child's mother)
……………………………….months
511. Are you currently breastfeeding your child?
Yes 01No 02
6. Environmental sanitation601. What is the main source of
drinking water at your home?Tap water 01Pump water 02Public tap 03Well 04River/pond/stream 05Rain water 06Tank water 07Jar/bottle 08Others (specify 98
602. Do you treat your water in any way to make it safe for drink-ing?
Yes 01No 02Don't Know 03
If no, go to Q.N. 604
603. If yes, what do you usually do to the water to make it safer to drink? (multiple response)
Strain it through cloth. 01Boil 02Add bleach/chlorine 03Water filter (Ceramic, sand and com-posite)… 04Solar disinfection 05Let it stand and settles/sedimentation 06Other (specify) 98
604. When do you wash your hand?(multiple response)
Before having meal 01After having meal 02After defecation 03Before feeding child 04Others (specify) 98
605. What do you to wash your hand? Water only 01Soap 02Ash/mud 03Others (specify) 98
606. Is there a fixed latrine for the use of your household only?
Yes 01No 02
If no. go to Q.N. 608
607. If yes, what type of latrine do you have?
Flush(Public sewage) 01Flush(Safety tank) 02Pit latrine 03Others (specify) 98
608. Do you wear shoes while going outside home?
Yes 01No 02
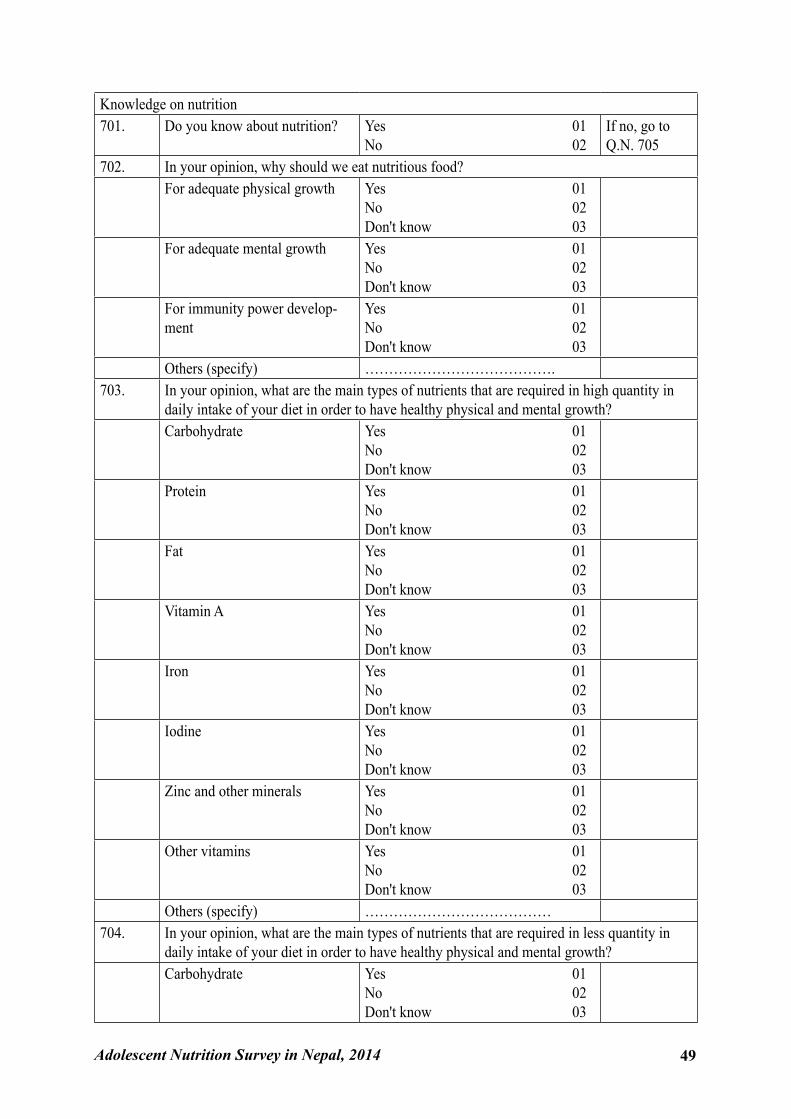
Adolescent Nutrition Survey in Nepal, 2014 49
Knowledge on nutrition701. Do you know about nutrition? Yes 01
No 02If no, go to Q.N. 705
702. In your opinion, why should we eat nutritious food?For adequate physical growth Yes 01
No 02Don't know 03
For adequate mental growth Yes 01No 02Don't know 03
For immunity power develop-ment
Yes 01No 02Don't know 03
Others (specify) ………………………………….703. In your opinion, what are the main types of nutrients that are required in high quantity in
daily intake of your diet in order to have healthy physical and mental growth?Carbohydrate Yes 01
No 02Don't know 03
Protein Yes 01No 02Don't know 03
Fat Yes 01No 02Don't know 03
Vitamin A Yes 01No 02Don't know 03
Iron Yes 01No 02Don't know 03
Iodine Yes 01No 02Don't know 03
Zinc and other minerals Yes 01No 02Don't know 03
Other vitamins Yes 01No 02Don't know 03
Others (specify) …………………………………704. In your opinion, what are the main types of nutrients that are required in less quantity in
daily intake of your diet in order to have healthy physical and mental growth?Carbohydrate Yes 01
No 02Don't know 03
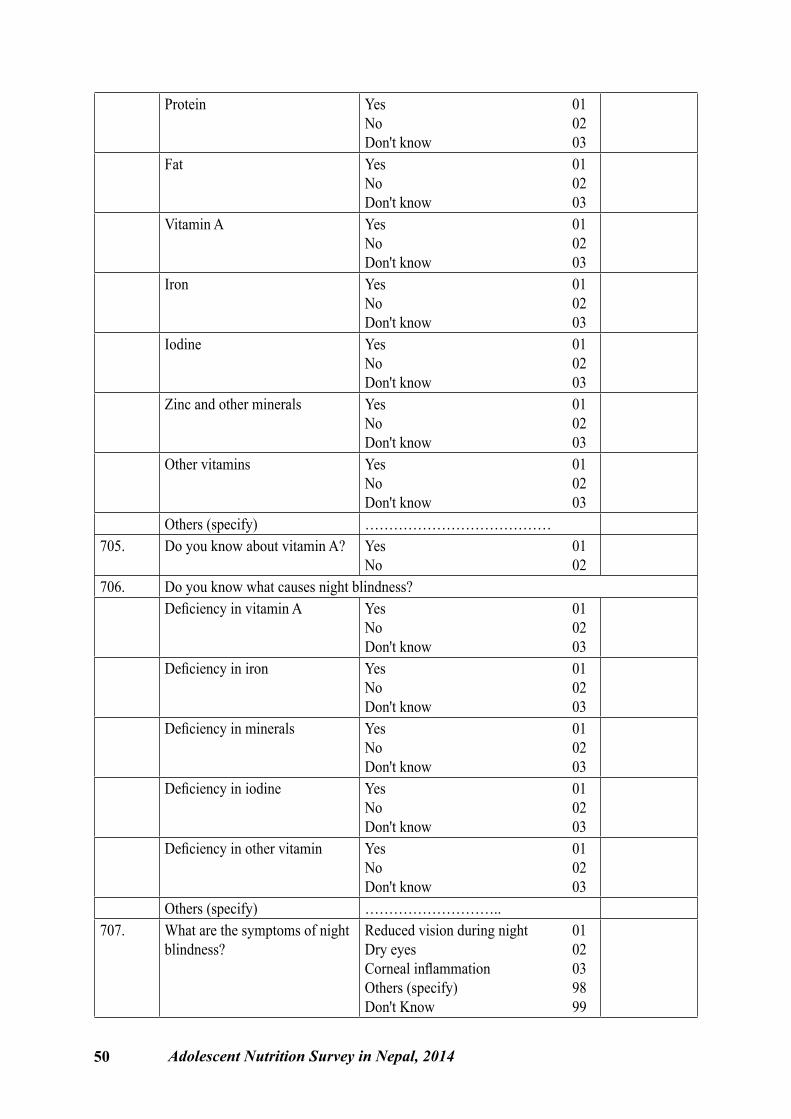
50 Adolescent Nutrition Survey in Nepal, 2014
Protein Yes 01No 02Don't know 03
Fat Yes 01No 02Don't know 03
Vitamin A Yes 01No 02Don't know 03
Iron Yes 01No 02Don't know 03
Iodine Yes 01No 02Don't know 03
Zinc and other minerals Yes 01No 02Don't know 03
Other vitamins Yes 01No 02Don't know 03
Others (specify) …………………………………705. Do you know about vitamin A? Yes 01
No 02706. Do you know what causes night blindness?
Deficiency in vitamin A Yes 01No 02Don't know 03
Deficiency in iron Yes 01No 02Don't know 03
Deficiency in minerals Yes 01No 02Don't know 03
Deficiency in iodine Yes 01No 02Don't know 03
Deficiency in other vitamin Yes 01No 02Don't know 03
Others (specify) ………………………..707. What are the symptoms of night
blindness?Reduced vision during night 01Dry eyes 02Corneal inflammation 03Others (specify) 98Don't Know 99
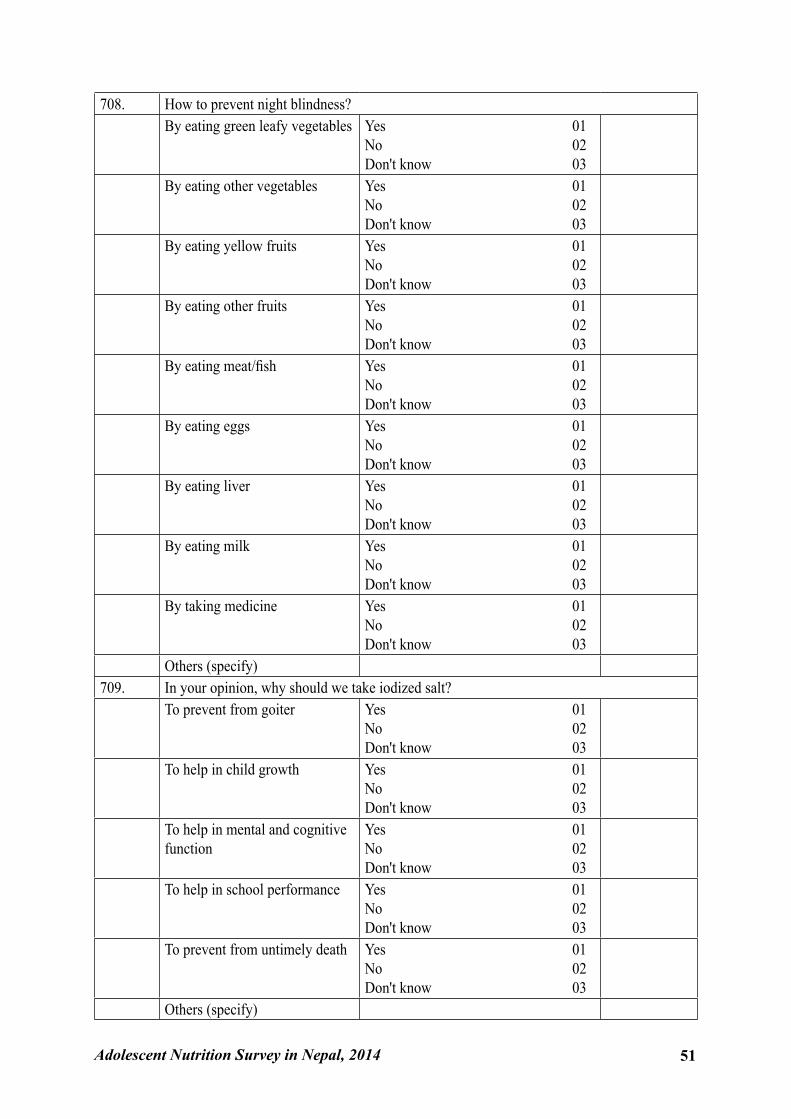
Adolescent Nutrition Survey in Nepal, 2014 51
708. How to prevent night blindness?By eating green leafy vegetables Yes 01
No 02Don't know 03
By eating other vegetables Yes 01No 02Don't know 03
By eating yellow fruits Yes 01No 02Don't know 03
By eating other fruits Yes 01No 02Don't know 03
By eating meat/fish Yes 01No 02Don't know 03
By eating eggs Yes 01No 02Don't know 03
By eating liver Yes 01No 02Don't know 03
By eating milk Yes 01No 02Don't know 03
By taking medicine Yes 01No 02Don't know 03
Others (specify)709. In your opinion, why should we take iodized salt?
To prevent from goiter Yes 01No 02Don't know 03
To help in child growth Yes 01No 02Don't know 03
To help in mental and cognitive function
Yes 01No 02Don't know 03
To help in school performance Yes 01No 02Don't know 03
To prevent from untimely death Yes 01No 02Don't know 03
Others (specify)
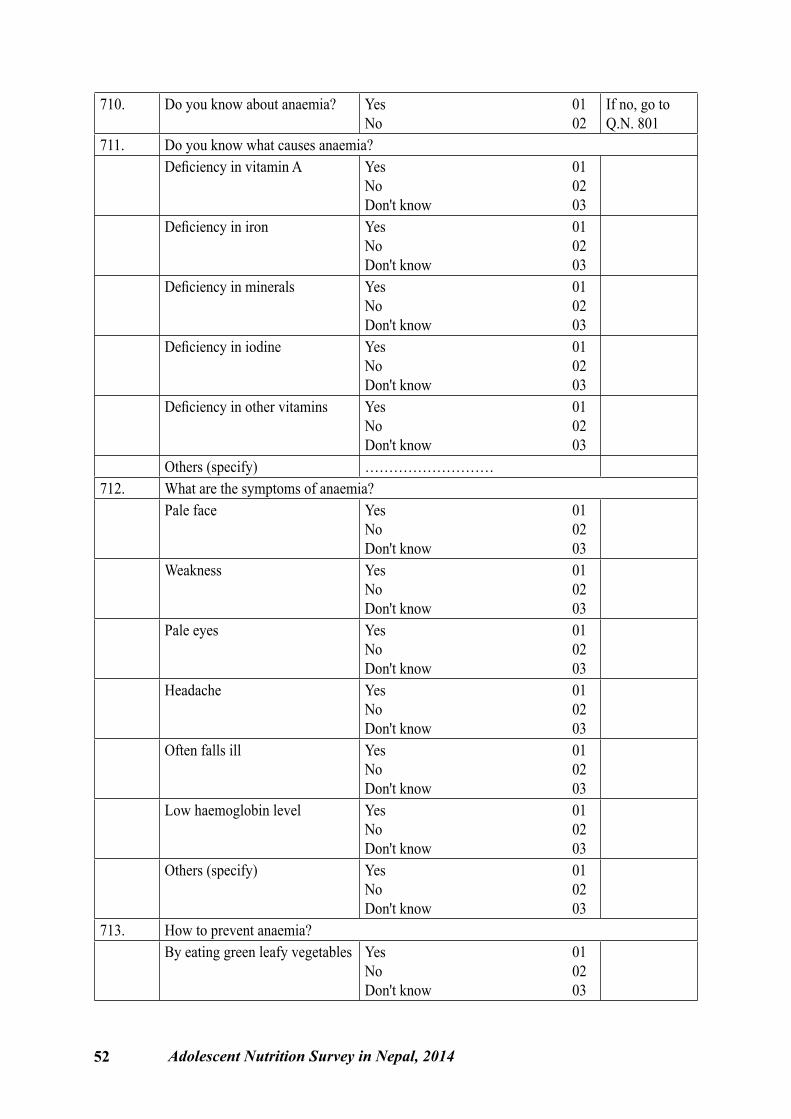
52 Adolescent Nutrition Survey in Nepal, 2014
710. Do you know about anaemia? Yes 01No 02
If no, go to Q.N. 801
711. Do you know what causes anaemia?Deficiency in vitamin A Yes 01
No 02Don't know 03
Deficiency in iron Yes 01No 02Don't know 03
Deficiency in minerals Yes 01No 02Don't know 03
Deficiency in iodine Yes 01No 02Don't know 03
Deficiency in other vitamins Yes 01No 02Don't know 03
Others (specify) ………………………712. What are the symptoms of anaemia?
Pale face Yes 01No 02Don't know 03
Weakness Yes 01No 02Don't know 03
Pale eyes Yes 01No 02Don't know 03
Headache Yes 01No 02Don't know 03
Often falls ill Yes 01No 02Don't know 03
Low haemoglobin level Yes 01No 02Don't know 03
Others (specify) Yes 01No 02Don't know 03
713. How to prevent anaemia?By eating green leafy vegetables Yes 01
No 02Don't know 03
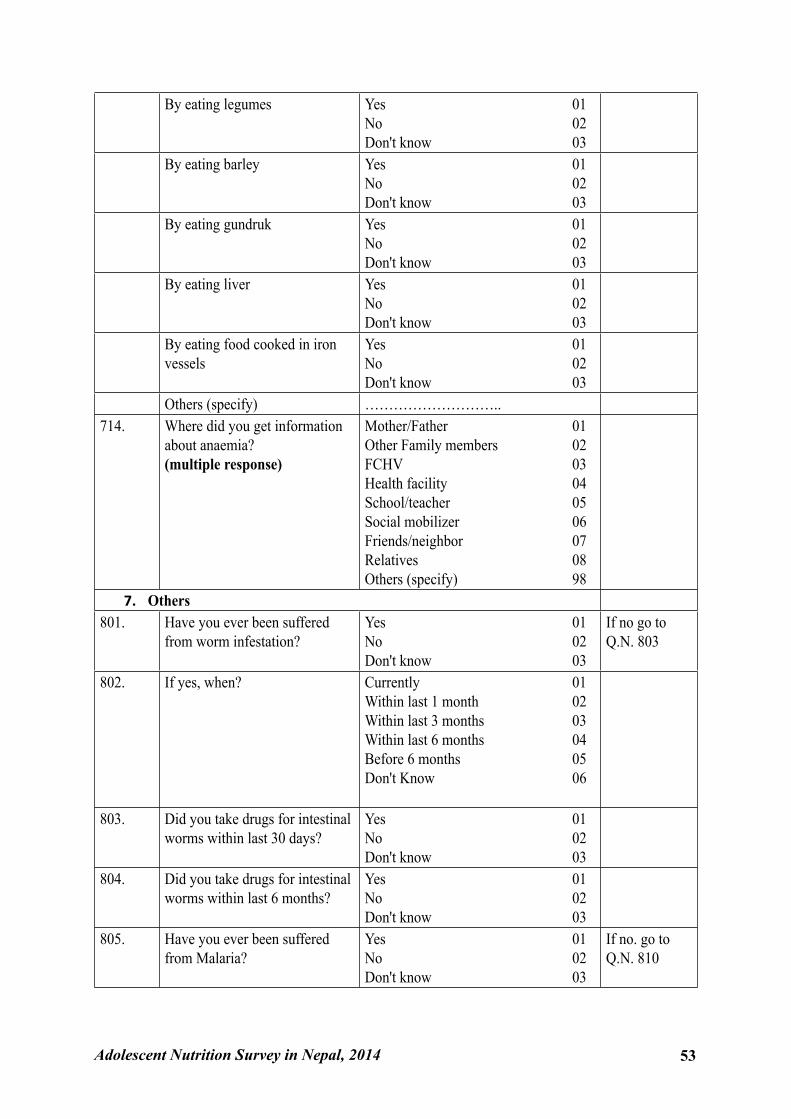
Adolescent Nutrition Survey in Nepal, 2014 53
By eating legumes Yes 01No 02Don't know 03
By eating barley Yes 01No 02Don't know 03
By eating gundruk Yes 01No 02Don't know 03
By eating liver Yes 01No 02Don't know 03
By eating food cooked in iron vessels
Yes 01No 02Don't know 03
Others (specify) ………………………..714. Where did you get information
about anaemia?(multiple response)
Mother/Father 01Other Family members 02FCHV 03Health facility 04School/teacher 05Social mobilizer 06Friends/neighbor 07Relatives 08Others (specify) 98
7. Others801. Have you ever been suffered
from worm infestation?Yes 01No 02Don't know 03
If no go to Q.N. 803
802. If yes, when? Currently 01Within last 1 month 02Within last 3 months 03Within last 6 months 04Before 6 months 05Don't Know 06
803. Did you take drugs for intestinal worms within last 30 days?
Yes 01No 02Don't know 03
804. Did you take drugs for intestinal worms within last 6 months?
Yes 01No 02Don't know 03
805. Have you ever been suffered from Malaria?
Yes 01No 02Don't know 03
If no. go to Q.N. 810
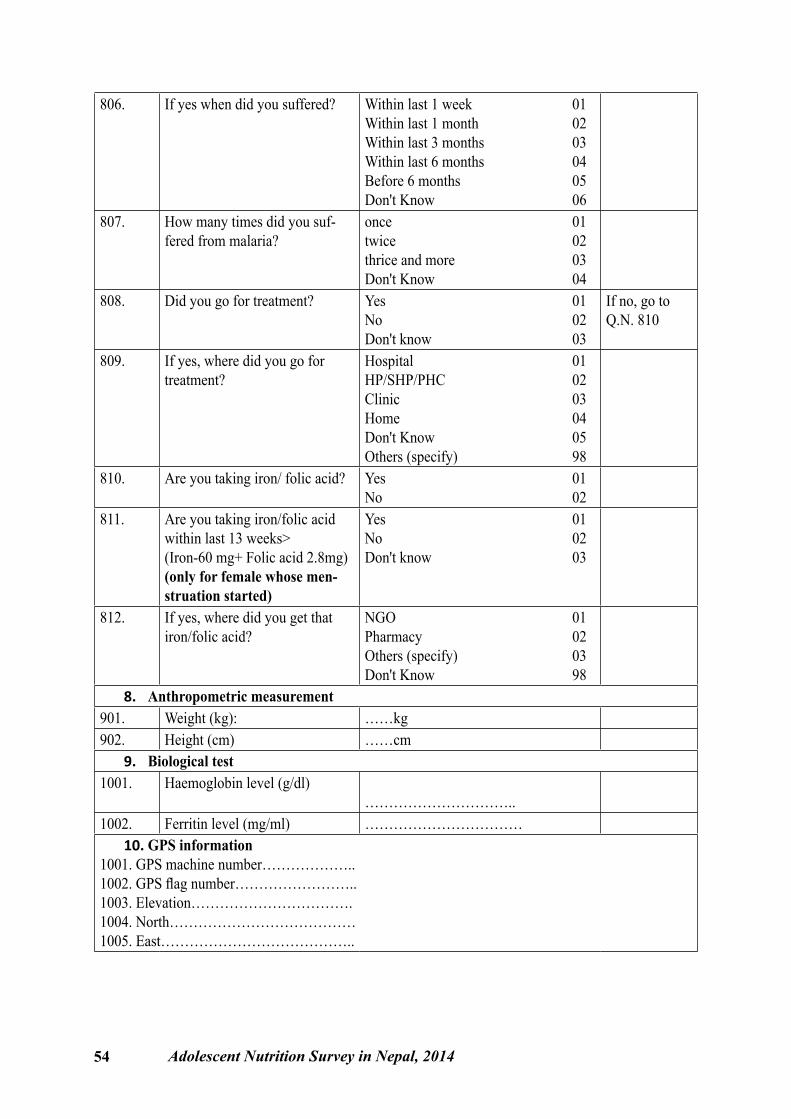
54 Adolescent Nutrition Survey in Nepal, 2014
806. If yes when did you suffered? Within last 1 week 01Within last 1 month 02Within last 3 months 03Within last 6 months 04Before 6 months 05Don't Know 06
807. How many times did you suf-fered from malaria?
once 01twice 02thrice and more 03Don't Know 04
808. Did you go for treatment? Yes 01No 02Don't know 03
If no, go to Q.N. 810
809. If yes, where did you go for treatment?
Hospital 01HP/SHP/PHC 02Clinic 03Home 04Don't Know 05Others (specify) 98
810. Are you taking iron/ folic acid? Yes 01No 02
811. Are you taking iron/folic acid within last 13 weeks>(Iron-60 mg+ Folic acid 2.8mg)(only for female whose men-struation started)
Yes 01No 02Don't know 03
812. If yes, where did you get that iron/folic acid?
NGO 01Pharmacy 02Others (specify) 03Don't Know 98
8. Anthropometric measurement901. Weight (kg): ……kg902. Height (cm) ……cm
9. Biological test1001. Haemoglobin level (g/dl)
…………………………..1002. Ferritin level (mg/ml) ……………………………
10. GPS information1001. GPS machine number………………..1002. GPS flag number……………………..1003. Elevation…………………………….1004. North…………………………………1005. East…………………………………..
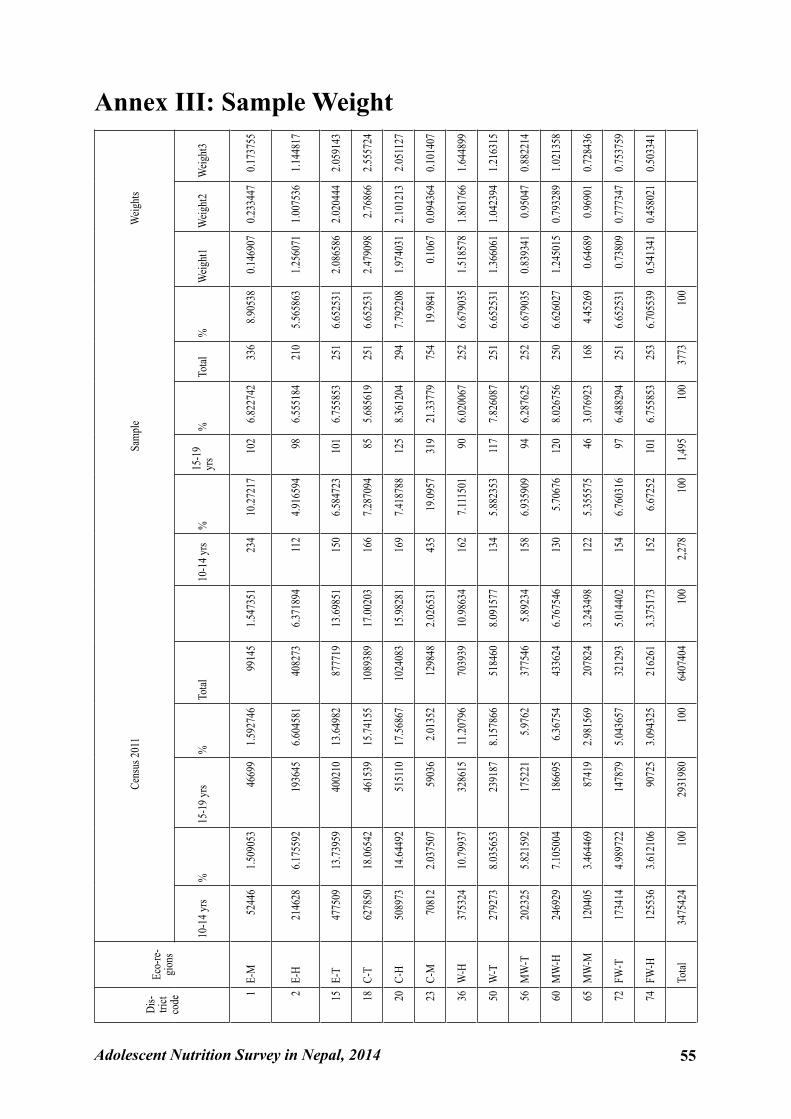
Adolescent Nutrition Survey in Nepal, 2014 55
Annex III: Sample WeightDi
s-tri
ct co
deEc
o-re
-gi
ons
Cens
us 20
11Sa
mpl
e W
eight
s
10-1
4 yrs
%15
-19 y
rs%
Total
10
-14 y
rs%
15-1
9 yr
s%
Total
%W
eight
1W
eight
2W
eight
3
1E-
M52
446
1.509
053
4669
91.5
9274
699
145
1.547
351
234
10.27
217
102
6.822
742
336
8.905
380.1
4690
70.2
3344
70.1
7375
5
2E-
H21
4628
6.175
592
1936
456.6
0458
140
8273
6.371
894
112
4.916
594
986.5
5518
421
05.5
6586
31.2
5607
11.0
0753
61.1
4481
7
15E-
T47
7509
13.73
959
4002
1013
.6498
287
7719
13.69
851
150
6.584
723
101
6.755
853
251
6.652
531
2.086
586
2.020
444
2.059
143
18C-
T62
7850
18.06
542
4615
3915
.7415
510
8938
917
.0020
316
67.2
8709
485
5.685
619
251
6.652
531
2.479
098
2.768
662.5
5572
4
20C-
H50
8973
14.64
492
5151
1017
.5686
710
2408
315
.9828
116
97.4
1878
812
58.3
6120
429
47.7
9220
81.9
7403
12.1
0121
32.0
5112
7
23C-
M70
812
2.037
507
5903
62.0
1352
1298
482.0
2653
143
519
.0957
319
21.33
779
754
19.98
410.1
067
0.094
364
0.101
407
36W
-H37
5324
10.79
937
3286
1511
.2079
670
3939
10.98
634
162
7.111
501
906.0
2006
725
26.6
7903
51.5
1857
81.8
6176
61.6
4489
9
50W
-T27
9273
8.035
653
2391
878.1
5786
651
8460
8.091
577
134
5.882
353
117
7.826
087
251
6.652
531
1.366
061
1.042
394
1.216
315
56M
W-T
2023
255.8
2159
217
5221
5.976
237
7546
5.892
3415
86.9
3590
994
6.287
625
252
6.679
035
0.839
341
0.950
470.8
8221
4
60M
W-H
2469
297.1
0500
418
6695
6.367
5443
3624
6.767
546
130
5.706
7612
08.0
2675
625
06.6
2602
71.2
4501
50.7
9328
91.0
2135
8
65M
W-M
1204
053.4
6446
987
419
2.981
569
2078
243.2
4349
812
25.3
5557
546
3.076
923
168
4.452
690.6
4689
0.969
010.7
2843
6
72FW
-T17
3414
4.989
722
1478
795.0
4365
732
1293
5.014
402
154
6.760
316
976.4
8829
425
16.6
5253
10.7
3809
0.777
347
0.753
759
74FW
-H12
5536
3.612
106
9072
53.0
9432
521
6261
3.375
173
152
6.672
5210
16.7
5585
325
36.7
0553
90.5
4134
10.4
5802
10.5
0334
1
To
tal34
7542
410
029
3198
010
064
0740
410
02,2
7810
01,4
9510
037
7310
0

56 Adolescent Nutrition Survey in Nepal, 2014
Government of Nepal
Nepal Health Research Council
NEP
AL H
EA
LTH RESEARCH CO
UN
CIL
ESTD. 1991
Nepal Health Research Council (NHRC)Ramshah Path, Kathmandu, NepalTel : +977 1 4254220Fax : +977 1 4262469E-mail : [email protected] Website : www.nhrc.org.np
Adolescent Nutrition Survey in Nepal 2014