Embed Size (px)
Citation preview
Adlai E. Stevenson High School
Student Surveys 2009-2010
Adlai E. Stevenson High School Student Surveys
2009-2010
Compiled and submitted by Patricia Martin and Lindsay Perkins
October 2010
Sincere appreciation to the following individuals must be expressed for their insights and assistance: Dr. Eric Twadell, Superintendent
Angela Sacchitello Sisi, Interim Director of Student Services
David Saxe, Assistant Principal for Operations and Program Support
The Administrative Team
The Counseling Department
Sherry Smith
Reichen Beaver
Suzanne Paloian
Tracey Moffat
Pat Geils
Jan Colburn
Janet Gotrik
Chris Nack
Todd Slotten
Steve Diver
Nancy Wagner
Charlene Chausis
Pat Guillette
Table Of Contents
Introduction 1
Freshman Survey Results and Summary 3
Sophomore Survey Results and Summary 7
Junior Survey Results and Summary 11
Senior Survey Results and Summary 17
Longitudinal Senior Exit Data and Summary 41
Student Services Across Grades 9-12 and Summary 49
One-Year Follow Up Survey and Summary 53
Five Year Follow Up Survey and Summary 63
1
Introduction
The purpose of the 2010 Student Surveys is to collect data that provides
information about student perspectives regarding the effectiveness of and extent
of participation in services and programs at Adlai E. Stevenson High School. It
consists of six surveys in all, four of which are administered to all students in
each grade, as well as two surveys administered to representative random
samples of one-year and five-year graduates.
Specifically, the surveys administered to freshmen, sophomores, and
juniors polled students of all four grade levels about their degree of satisfaction
with the performance of counselors in a variety of roles and functions. Items
were derived from the responses of juniors and seniors in preliminary focus
groups about what characteristics and functions they considered desirable in the
counselors! role.
The Senior Exit Survey additionally seeks out information about student
participation and satisfaction with academic and co-curricular programs as well
as information about our Social Emotional Learning initiative. The current survey
has been administered since 1992, and tracking of responses over six years
provides trends in student perceptions and levels of satisfaction.
Finally, one-year and five-year follow-up surveys attempt to ascertain
graduates! perceptions about their academic preparation at Stevenson, as well
as the levels and directions of education they have attained and the careers they
have chosen. The survey sample sizes this year continue to include
approximately fifteen percent (15%) of each class.
Methodology included surveying almost the entire freshman, sophomore,
junior, and senior classes; seniors met in large groups with their individual
counselors, while juniors, sophomores and freshmen participated in the survey
during course selection where they met in very small groups. Results are
reported in percentages using the number of students who responded to the item
(“n” is reported for each item) and not including those students who did not
respond or who responded, “Does not apply” in calculating each percentage.
Utilization of particular services and participation are also derived and reported
from the numbers of students responding to particular items. In discussing
results, percentages of more than 50% are reported as a majority and, using
correlation statistics as a guide, percentages over 75% are reported as “large” or
“strong” majorities, and, conversely, percentages under 25% are reported as
“small” or “weak” minorities.
Follow-up surveys were conducted by telephone with samples of one
hundred (100) 2009 Stevenson graduates, and one hundred (100) 2005
graduates. Results are reported in both raw numbers and percentages. These
individuals were selected at random from their respective classes. The follow-up
surveys intend to provide perspectives from a vantage point that expands
information derived from current students. Open-ended questions that
encouraged qualitative, rather than quantitative, responses continue to be
2
expanded to give individuals the opportunity to respond from their own
perspectives. As in the previous year, students were asked to complete these
qualitative questions at the beginning, rather than the end of the survey in order
to maximize student effort and sincerity.
It is hoped that the 2010 Student Surveys will provide some information to
board members, administrators, faculty, and staff about the effectiveness of
current programs and areas, which might be further, examined and addressed in
the future.
3
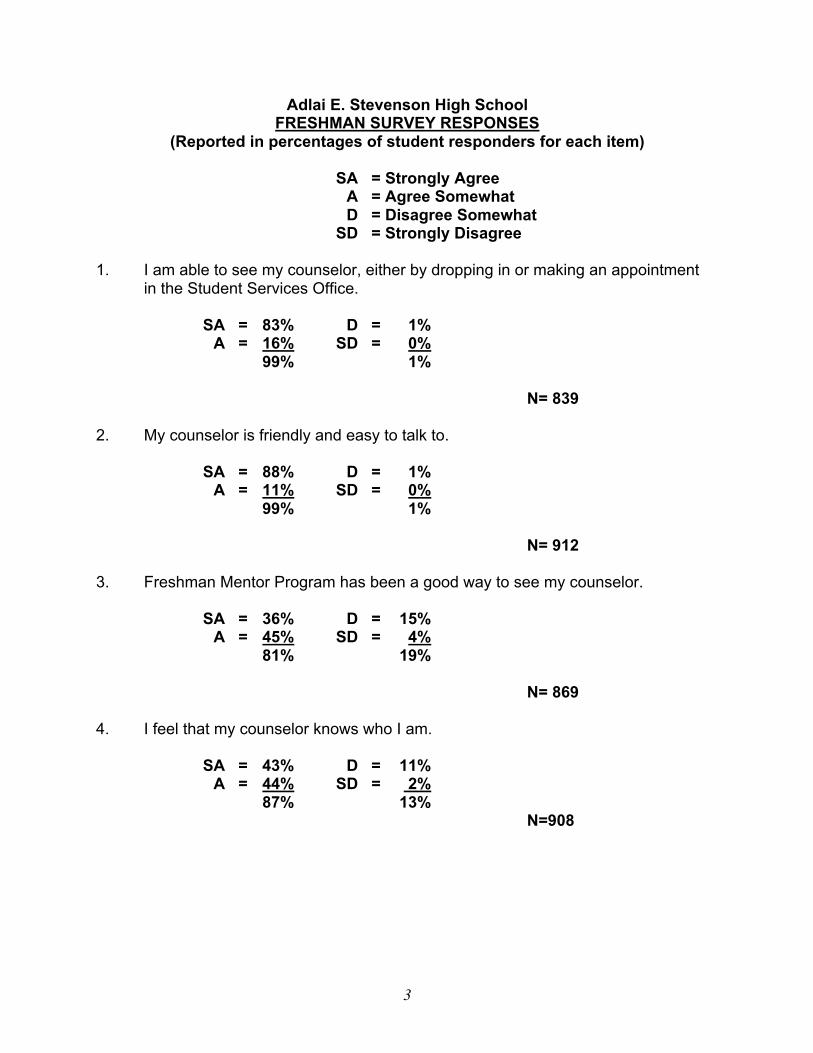
Adlai E. Stevenson High School FRESHMAN SURVEY RESPONSES
(Reported in percentages of student responders for each item)
SA = Strongly Agree A = Agree Somewhat D = Disagree Somewhat SD = Strongly Disagree 1. I am able to see my counselor, either by dropping in or making an appointment in the Student Services Office. SA = 83% D = 1% A = 16% SD = 0% 99% 1% N= 839 2. My counselor is friendly and easy to talk to. SA = 88% D = 1% A = 11% SD = 0% 99% 1% N= 912 3. Freshman Mentor Program has been a good way to see my counselor. SA = 36% D = 15% A = 45% SD = 4% 81% 19% N= 869 4. I feel that my counselor knows who I am. SA = 43% D = 11% A = 44% SD = 2% 87% 13% N=908
4
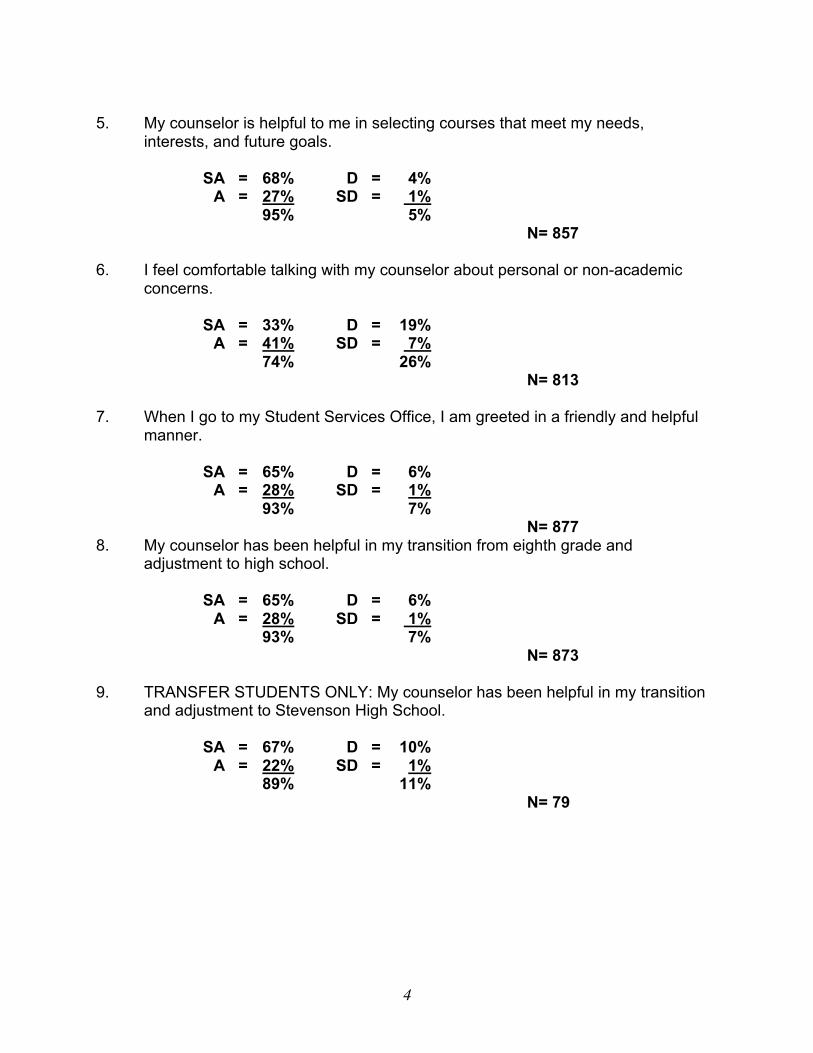
5. My counselor is helpful to me in selecting courses that meet my needs, interests, and future goals. SA = 68% D = 4%
A = 27% SD = 1%
95% 5%
N= 857
6. I feel comfortable talking with my counselor about personal or non-academic concerns. SA = 33% D = 19%
A = 41% SD = 7%
74% 26%
N= 813
7. When I go to my Student Services Office, I am greeted in a friendly and helpful manner. SA = 65% D = 6%
A = 28% SD = 1%
93% 7%
N= 877
8. My counselor has been helpful in my transition from eighth grade and adjustment to high school. SA = 65% D = 6%
A = 28% SD = 1%
93% 7%
N= 873
9. TRANSFER STUDENTS ONLY: My counselor has been helpful in my transition and adjustment to Stevenson High School.
SA = 67% D = 10%
A = 22% SD = 1%
89% 11%
N= 79
5
Freshman Survey Summary Student responses to the freshman survey indicate very positive perceptions about counselors. Even though most of the categories depict decreased results from last year’s survey, the overwhelming majority of freshmen still view their counselor in a positive light. Not only do nearly all freshmen overwhelmingly feel that they are able to meet with their counselors when they need to or want to (99%), but for the eleventh year in a row, at least 99 percent of students have agreed that counselors are accessible. For the third year in a row, virtually every student we surveyed (99%) believes that their counselor is friendly and easy to talk to. The Advisory program continues to be an effective conduit for freshmen to communicate with their respective counselors. This year there was a four percent decrease (81%) in the number of freshmen who agree that advisory is a useful way to visit with their counselor. Compared to last year, 87 percent of the freshmen feel that their counselor knows them, which is a 6 percent decrease. An overwhelming majority of students feel positive about the academic counseling that they receive (95%); however, this depicts a 4 percent decrease from last year’s results. Although some students are not comfortable discussing non academic concerns with counselors (26%), about three quarters of the students do feel at ease talking with their counselors about personal and individual matters (74%). This constitutes a 14 percent decrease from last year’s results. The perception of Student Services’ office personnel as being helpful and friendly remains high, registering at 97 percent. Both the general population (93%) and transfer students (89%) agree that their counselors are able to ease their transition and adjustment to Stevenson. Freshmen continue to view counselors in a positive light; however, nine of the ten categories depict decreases from the previous school year’s results. It is noteworthy to mention that over the past two years, the freshman survey results have been eliciting increasing and almost perfect scores. It may have been predicted that these scores would not remain consistently high and might decline at some point. Every category still depicts that no less than three quarters of the freshmen disagree with the question being asked. Two of the categories elicit nearly perfect results, reinforcing the fact that counselors are accessible, friendly, and easy to talk to (99%). Most students, 74 percent of freshmen, feel comfortable discussing personal or non-academic issues with their counselors. This statistic helps depict how the district’s Social Emotional Learning (SEL) goal is beginning to heighten student’s awareness about non-academic issues that can affect their future. It also shows how counselors can play a
6
vital role in the SEL initiative, while fostering positive relationships with their students. Overall, freshman students view their counselors as friendly, accessible, and able to deliver effective and efficient transitional counseling services. Counselors are also providing both academic and non-academic counseling services in meaningful and beneficial ways to students. The Freshman Mentor Program continues to be an effective way for freshmen to access their counselors. These numbers also continue to substantiate the strategy of increasing the total number of advisories among counselors to obtain a smaller quantity of students per advisory class. Maintaining advisories with a manageable number of students provides greater opportunity for counselors to breed familiarity and to provide quality contacts. Overall, levels of reported satisfaction suggest that solid groundwork continues to be laid for long-term, beneficial relationships between freshmen and their counselors.
7
Adlai E. Stevenson High School
SOPHOMORE SURVEY RESPONSES
(Reported in percentages of student responders for each item)
SA = Strongly Agree
A = Agree Somewhat
D = Disagree Somewhat
SD = Strongly Disagree
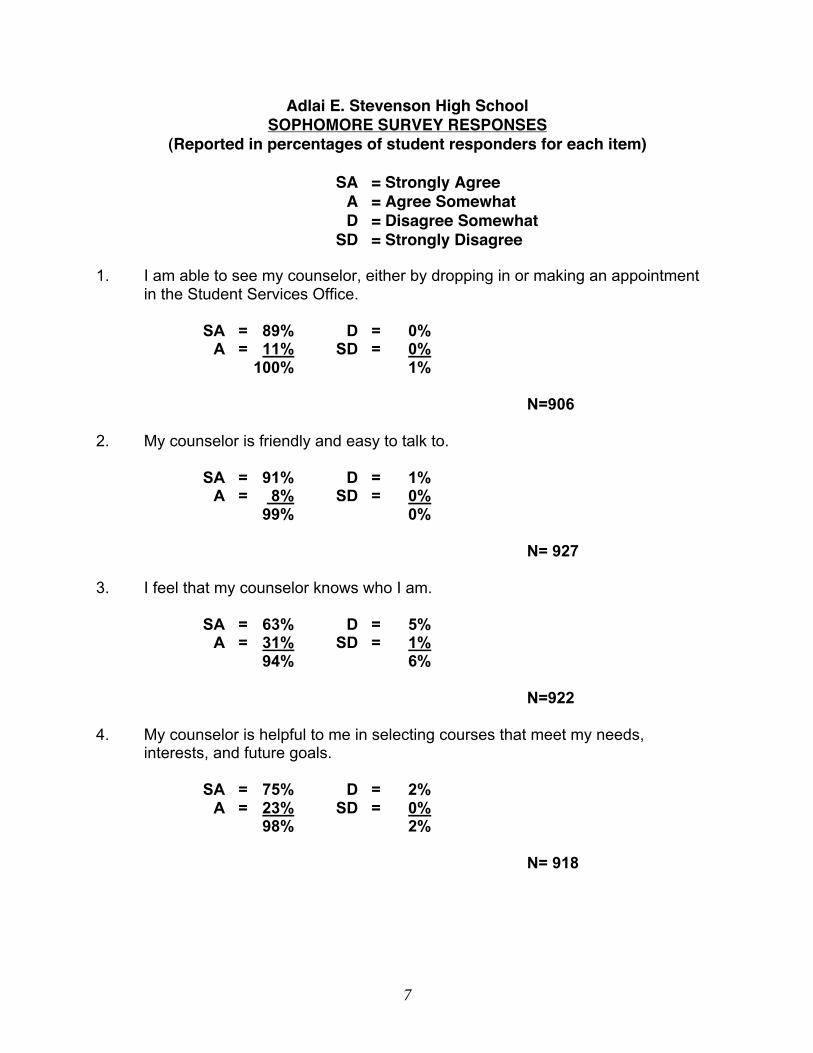
1. I am able to see my counselor, either by dropping in or making an appointment in the Student Services Office. SA = 89% D = 0%
A = 11% SD = 0%
100% 1%
N=906
2. My counselor is friendly and easy to talk to. SA = 91% D = 1%
A = 8% SD = 0%
99% 0%
N= 927
3. I feel that my counselor knows who I am. SA = 63% D = 5%
A = 31% SD = 1%
94% 6%
N=922
4. My counselor is helpful to me in selecting courses that meet my needs, interests, and future goals. SA = 75% D = 2%
A = 23% SD = 0%
98% 2%
N= 918
8
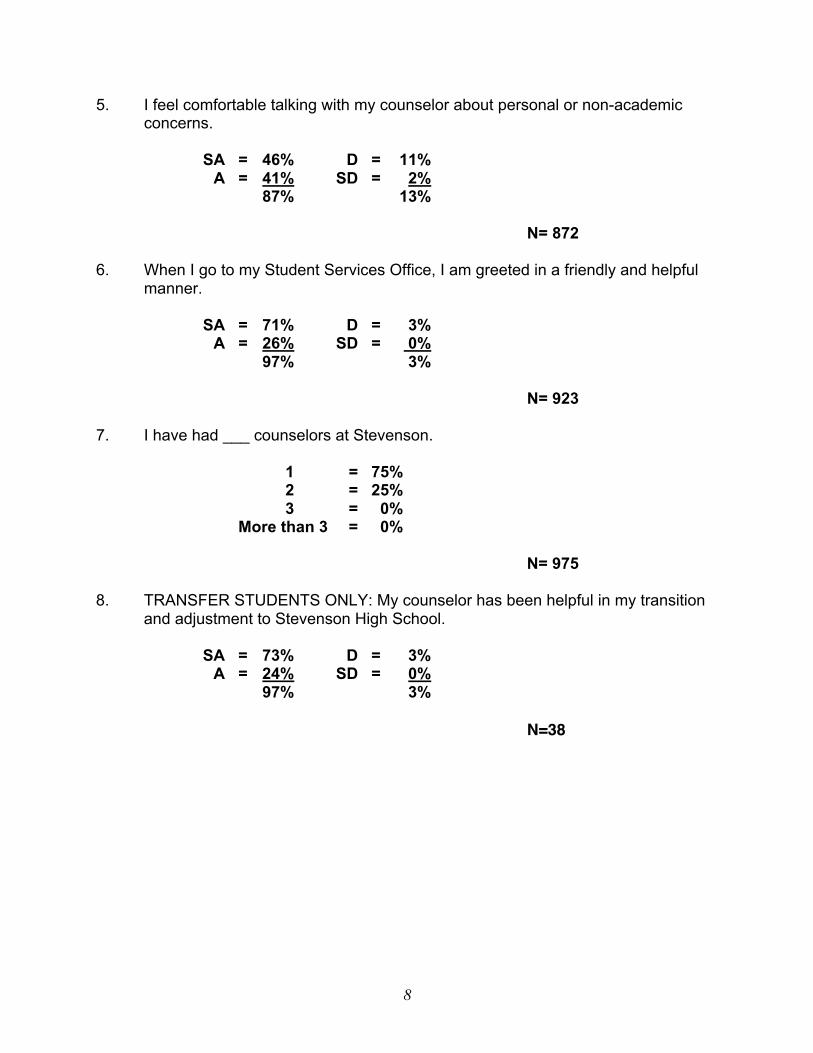
5. I feel comfortable talking with my counselor about personal or non-academic concerns. SA = 46% D = 11%
A = 41% SD = 2%
87% 13%
N= 872
6. When I go to my Student Services Office, I am greeted in a friendly and helpful manner. SA = 71% D = 3%
A = 26% SD = 0%
97% 3%
N= 923
7. I have had ___ counselors at Stevenson. 1 = 75%
2 = 25%
3 = 0%
More than 3 = 0%
N= 975
8. TRANSFER STUDENTS ONLY: My counselor has been helpful in my transition and adjustment to Stevenson High School.
SA = 73% D = 3%
A = 24% SD = 0%
97% 3%
N=38
9
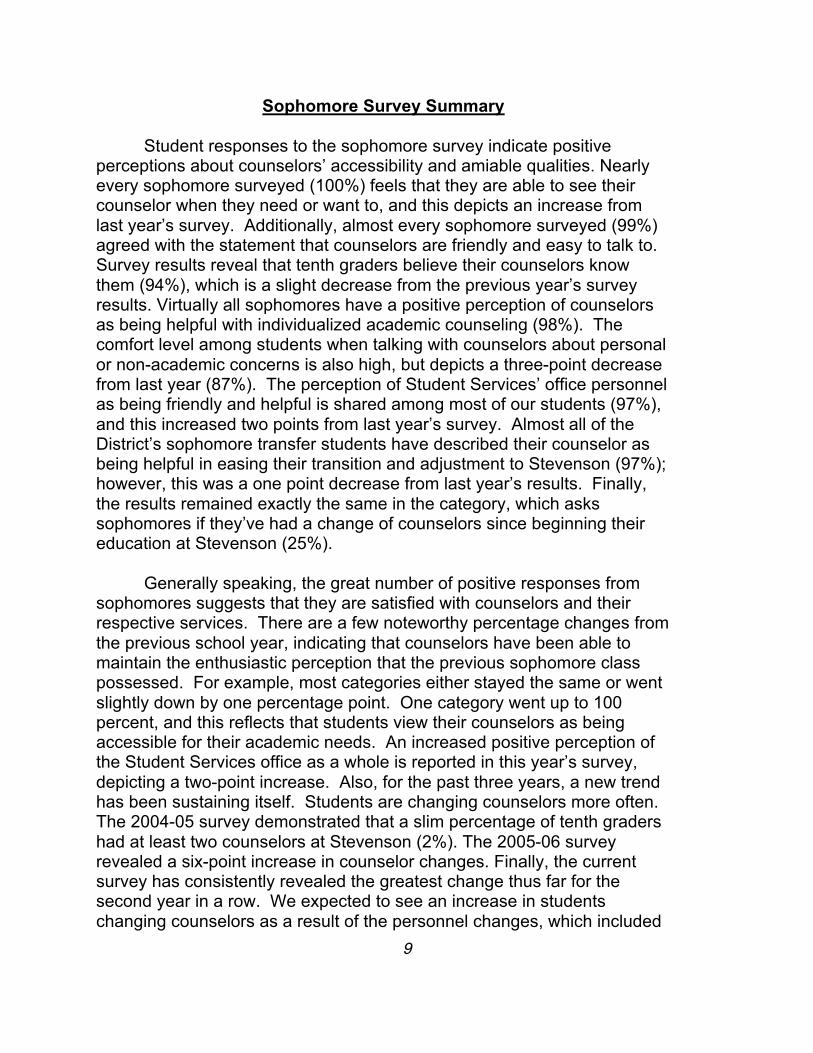
Sophomore Survey Summary Student responses to the sophomore survey indicate positive perceptions about counselors’ accessibility and amiable qualities. Nearly every sophomore surveyed (100%) feels that they are able to see their counselor when they need or want to, and this depicts an increase from last year’s survey. Additionally, almost every sophomore surveyed (99%) agreed with the statement that counselors are friendly and easy to talk to. Survey results reveal that tenth graders believe their counselors know them (94%), which is a slight decrease from the previous year’s survey results. Virtually all sophomores have a positive perception of counselors as being helpful with individualized academic counseling (98%). The comfort level among students when talking with counselors about personal or non-academic concerns is also high, but depicts a three-point decrease from last year (87%). The perception of Student Services’ office personnel as being friendly and helpful is shared among most of our students (97%), and this increased two points from last year’s survey. Almost all of the District’s sophomore transfer students have described their counselor as being helpful in easing their transition and adjustment to Stevenson (97%); however, this was a one point decrease from last year’s results. Finally, the results remained exactly the same in the category, which asks sophomores if they’ve had a change of counselors since beginning their education at Stevenson (25%). Generally speaking, the great number of positive responses from sophomores suggests that they are satisfied with counselors and their respective services. There are a few noteworthy percentage changes from the previous school year, indicating that counselors have been able to maintain the enthusiastic perception that the previous sophomore class possessed. For example, most categories either stayed the same or went slightly down by one percentage point. One category went up to 100 percent, and this reflects that students view their counselors as being accessible for their academic needs. An increased positive perception of the Student Services office as a whole is reported in this year’s survey, depicting a two-point increase. Also, for the past three years, a new trend has been sustaining itself. Students are changing counselors more often. The 2004-05 survey demonstrated that a slim percentage of tenth graders had at least two counselors at Stevenson (2%). The 2005-06 survey revealed a six-point increase in counselor changes. Finally, the current survey has consistently revealed the greatest change thus far for the second year in a row. We expected to see an increase in students changing counselors as a result of the personnel changes, which included
10
the hiring of four new counselors two school years ago. In light of these changes, we are accommodating, adjusting, and putting the proper resources in place in order to maintain the high satisfaction and utilization rates. Overall, counselors are continuing to create an inviting atmosphere that is conducive to communication and relationship building.
11
Adlai E. Stevenson High School JUNIOR SURVEY RESPONSES
(Reported in percentages of student responders for each item)
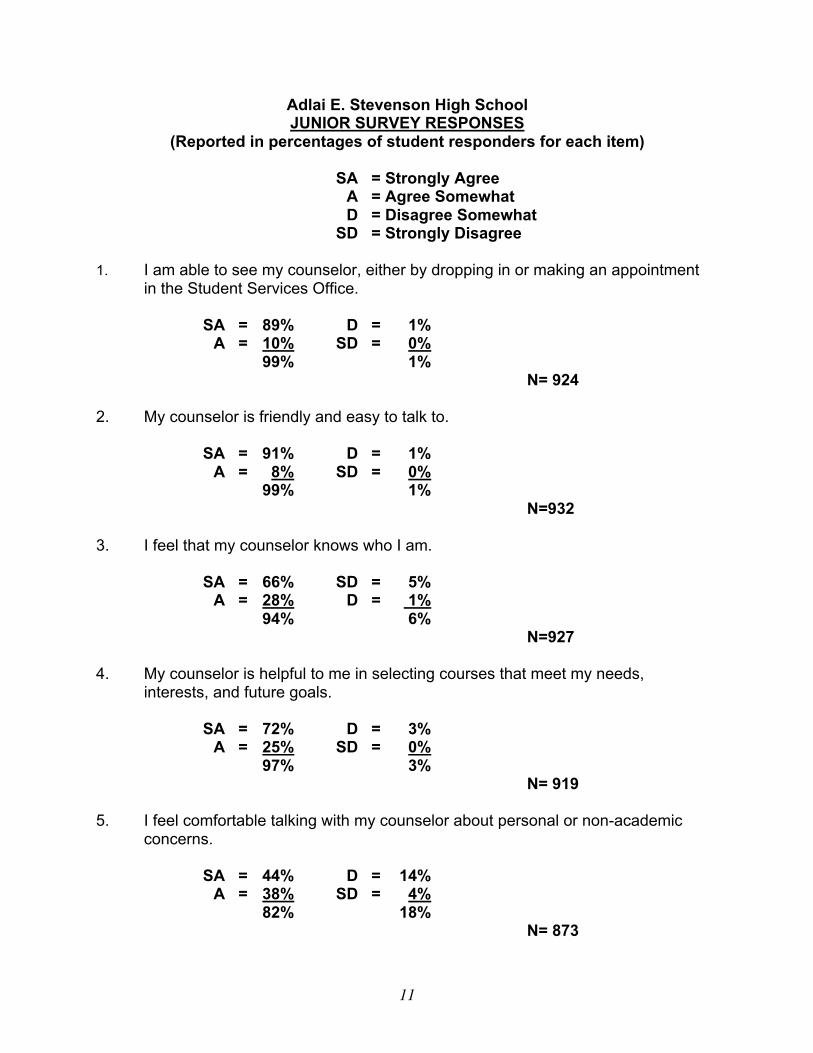
SA = Strongly Agree A = Agree Somewhat D = Disagree Somewhat SD = Strongly Disagree 1. I am able to see my counselor, either by dropping in or making an appointment in the Student Services Office. SA = 89% D = 1% A = 10% SD = 0% 99% 1% N= 924 2. My counselor is friendly and easy to talk to. SA = 91% D = 1% A = 8% SD = 0% 99% 1% N=932 3. I feel that my counselor knows who I am. SA = 66% SD = 5% A = 28% D = 1% 94% 6% N=927 4. My counselor is helpful to me in selecting courses that meet my needs, interests, and future goals. SA = 72% D = 3% A = 25% SD = 0% 97% 3% N= 919 5. I feel comfortable talking with my counselor about personal or non-academic concerns. SA = 44% D = 14% A = 38% SD = 4% 82% 18% N= 873
12
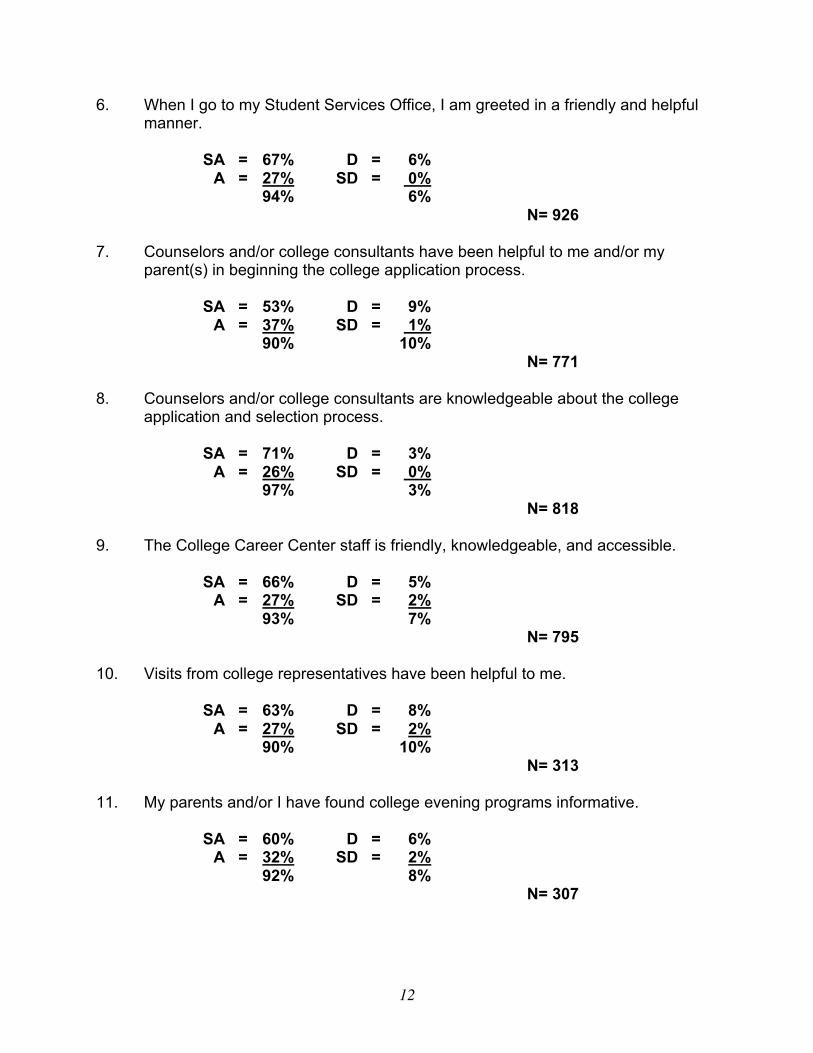
6. When I go to my Student Services Office, I am greeted in a friendly and helpful manner. SA = 67% D = 6%
A = 27% SD = 0%
94% 6%
N= 926
7. Counselors and/or college consultants have been helpful to me and/or my parent(s) in beginning the college application process. SA = 53% D = 9%
A = 37% SD = 1% 90% 10%
N= 771
8. Counselors and/or college consultants are knowledgeable about the college application and selection process. SA = 71% D = 3%
A = 26% SD = 0%
97% 3%
N= 818
9. The College Career Center staff is friendly, knowledgeable, and accessible. SA = 66% D = 5%
A = 27% SD = 2%
93% 7%
N= 795
10. Visits from college representatives have been helpful to me. SA = 63% D = 8%
A = 27% SD = 2%
90% 10%
N= 313
11. My parents and/or I have found college evening programs informative. SA = 60% D = 6%
A = 32% SD = 2%
92% 8%
N= 307
13
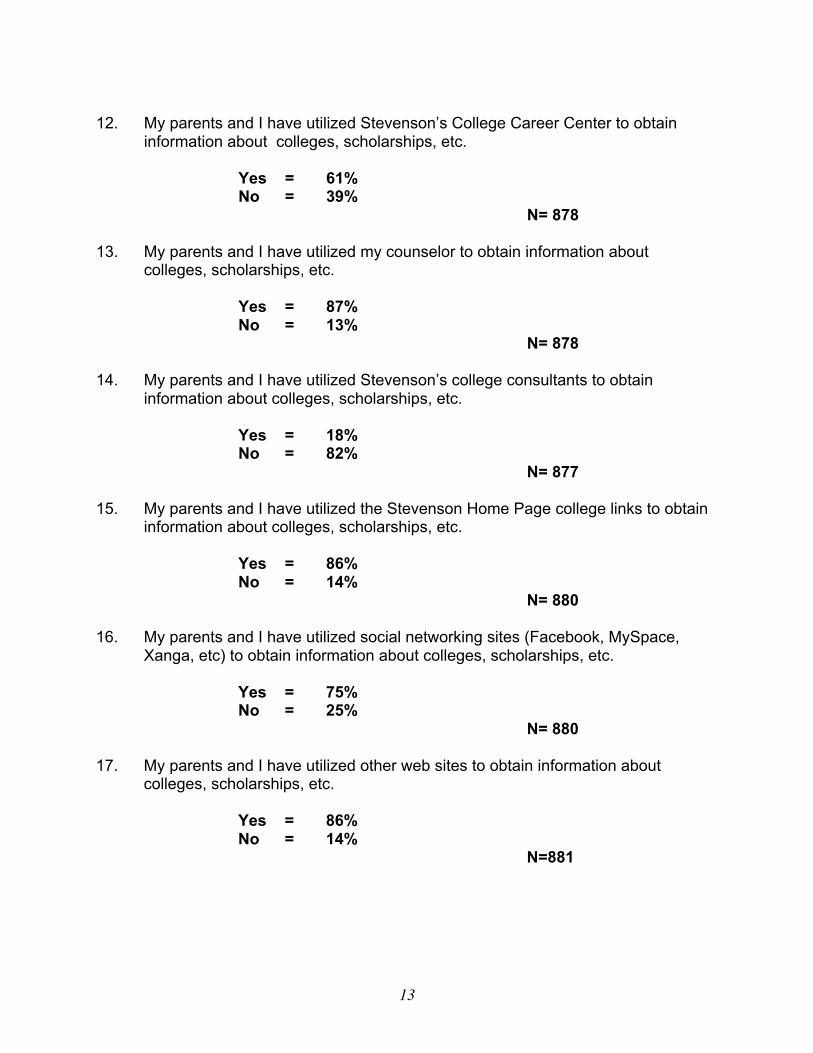
12. My parents and I have utilized Stevenson’s College Career Center to obtain
information about colleges, scholarships, etc.
Yes = 61%
No = 39%
N= 878
13. My parents and I have utilized my counselor to obtain information about colleges, scholarships, etc.
Yes = 87%
No = 13%
N= 878
14. My parents and I have utilized Stevenson’s college consultants to obtain
information about colleges, scholarships, etc.
Yes = 18%
No = 82%
N= 877
15. My parents and I have utilized the Stevenson Home Page college links to obtain
information about colleges, scholarships, etc.
Yes = 86%
No = 14%
N= 880
16. My parents and I have utilized social networking sites (Facebook, MySpace, Xanga, etc) to obtain information about colleges, scholarships, etc.
Yes = 75%
No = 25%
N= 880
17. My parents and I have utilized other web sites to obtain information about colleges, scholarships, etc.
Yes = 86%
No = 14%
N=881
14
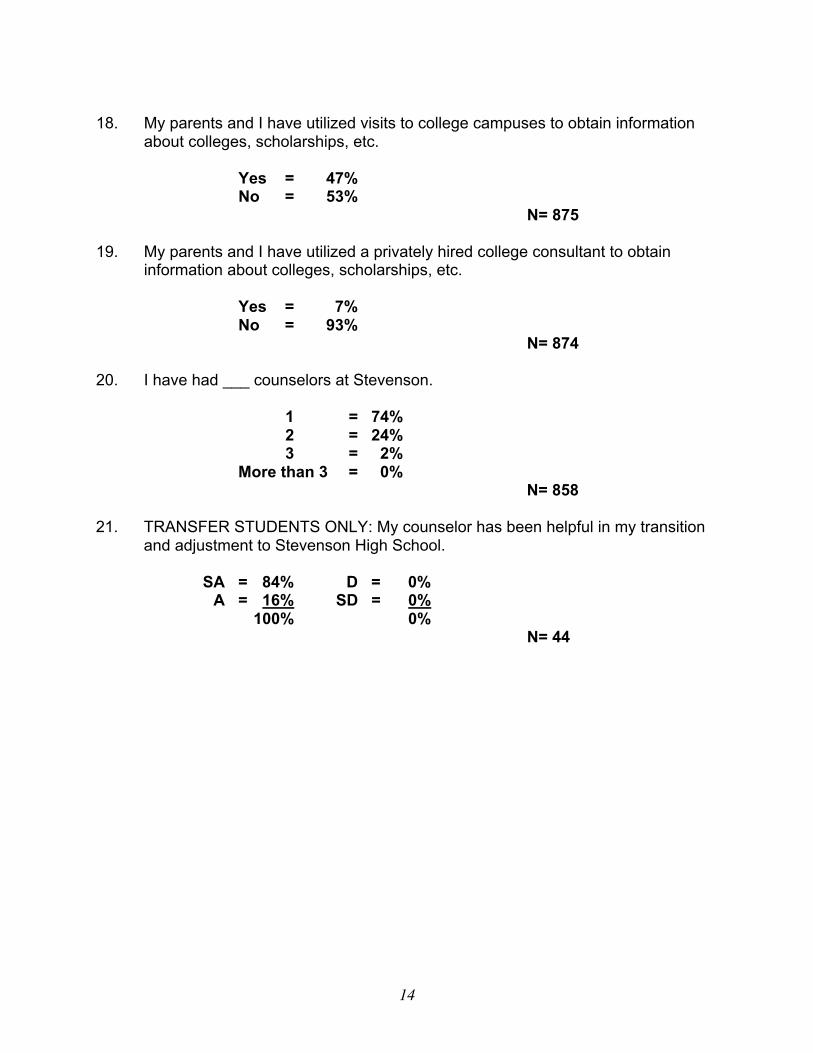
18. My parents and I have utilized visits to college campuses to obtain information
about colleges, scholarships, etc.
Yes = 47%
No = 53%
N= 875
19. My parents and I have utilized a privately hired college consultant to obtain
information about colleges, scholarships, etc.
Yes = 7%
No = 93%
N= 874
20. I have had ___ counselors at Stevenson. 1 = 74%
2 = 24%
3 = 2%
More than 3 = 0%
N= 858
21. TRANSFER STUDENTS ONLY: My counselor has been helpful in my transition and adjustment to Stevenson High School.
SA = 84% D = 0%
A = 16% SD = 0%
100% 0%
N= 44
15
Junior Survey Summary Junior responses to the survey continue to be exceptionally positive, closely duplicating the responses of the previous year’s junior class. Overall, juniors possess affirming perceptions about counselors and the services they render. Not only do juniors feel that they are readily able to see their counselors (99%), but they also find them approachable (99%). Students continue to express that their counselor knows them (94%) and find them helpful with course selections (97%). Comfort levels in discussions of a personal nature with counselors are strong (82%), while the number of juniors who are greeted in a friendly and helpful manner by Student Services office personnel is agreed upon by most (94%). All the junior transfer students who were surveyed related that counselors were helpful with their transition and adjustment to Stevenson (100%). It was found that only 24 percent of the juniors have had two or more counselors at SHS, which is a 17-point decrease from last year’s results.
Survey trends demonstrate that nearly all juniors are more than satisfied with general counseling services as questions continue to elicit similar results from year-to-year on the junior survey. The current survey reveals that four categories have increased by a few points, three categories have remained the same, and three responses have decreased by only one or two points. Another noteworthy statistic is that there was an increase in the amount of juniors who feel that their counselor is helpful when it comes to choosing courses to meet their academic needs. Consistent with the sophomore survey, the Student Services office is increasingly viewed as a friendly and helpful place, which is a three-point increase. Even though juniors and their parents are not yet fully exposed to the series of informative college counseling programs prior to survey administration, college counseling services are viewed just as favorably as general counseling services among respondents. Responses to college counseling-related items are similar to previous years. For example, three categories have increased by several points, one category remained the same, and six categories have dipped by insignificant levels (one to four points). Specifically, juniors perceive counselors and College/Career Center (CCC) personnel as being helpful at the beginning of the college application process (90%), and even more perceive them to be knowledgeable about the selection process (97%). Juniors who visit the CCC find staff to be friendly and accessible (93%). Those juniors who avail themselves to visiting college representatives report that they find these
16
contacts to be helpful (90%). Likewise, those who choose to attend evening programs that deal with college-related topics view the programs as informative (92%).
How many Stevenson students are utilizing college counseling services? In a series of statements that require yes/no responses, more than half (61%) of our juniors and their families have utilized the CCC, while a much higher percentage (87%) turn to their own counselors for college-related information, which is an eight and one-point decrease respectively. Fewer than one quarter of junior families (18%) reported that they have used Stevenson college consultants to obtain information, although surveys are conducted well before juniors have typically been able to take advantage of the department’s Narrowing Your Options appointment. However, this group of juniors was able to attend the fall Finding Your Fit program. A large majority of juniors (86%) claim to have accessed college information by way of college links located on Stevenson’s home page. This is consistent with last year’s impressive 16-point increase. There is still a large population of students utilizing outside links like Facebook to obtain information about college (75%); this is a five-point increase from last year’s results depicting that our students depend on these sites for much more than just social networking. However, consistent with last year’s results, students are still accessing the SHS Website more readily than these outside Websites when it comes to college research. Though it is early in the process, almost half of the junior class (47%) report that they have visited college campuses, which is a three-point increase in comparison to the previous year’s class. A small percentage of students are seeking the services of privately hired college consultants (7%), which indicates that our junior class relies on Stevenson’s resources and services when inquiring about college information. Favorable views towards college counseling and accompanying resources continue to result in utilization. Hopefully, based upon utilization and services rendered, students will become informed college consumers.
17
Adlai E. Stevenson High School Senior Survey Responses
Part One Free Response Questions
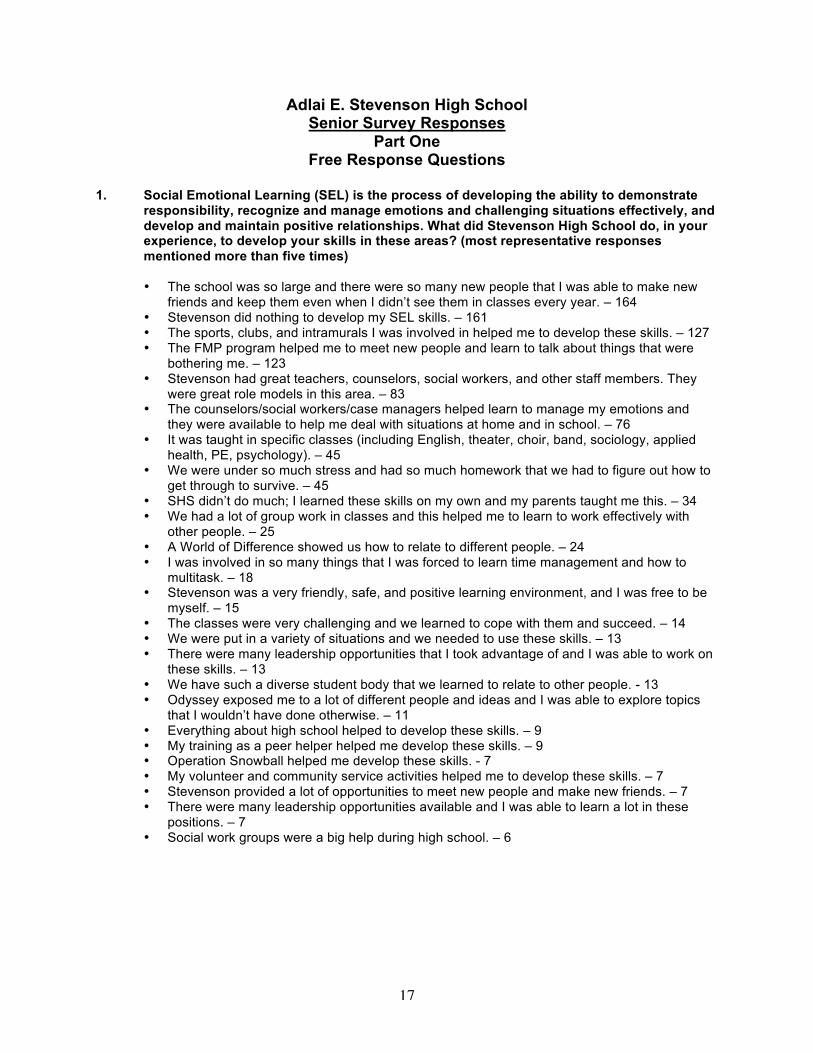
1. Social Emotional Learning (SEL) is the process of developing the ability to demonstrate responsibility, recognize and manage emotions and challenging situations effectively, and develop and maintain positive relationships. What did Stevenson High School do, in your experience, to develop your skills in these areas? (most representative responses mentioned more than five times)
• The school was so large and there were so many new people that I was able to make new
friends and keep them even when I didn’t see them in classes every year. – 164 • Stevenson did nothing to develop my SEL skills. – 161 • The sports, clubs, and intramurals I was involved in helped me to develop these skills. – 127 • The FMP program helped me to meet new people and learn to talk about things that were
bothering me. – 123 • Stevenson had great teachers, counselors, social workers, and other staff members. They
were great role models in this area. – 83 • The counselors/social workers/case managers helped learn to manage my emotions and
they were available to help me deal with situations at home and in school. – 76 • It was taught in specific classes (including English, theater, choir, band, sociology, applied
health, PE, psychology). – 45 • We were under so much stress and had so much homework that we had to figure out how to
get through to survive. – 45 • SHS didn’t do much; I learned these skills on my own and my parents taught me this. – 34 • We had a lot of group work in classes and this helped me to learn to work effectively with
other people. – 25 • A World of Difference showed us how to relate to different people. – 24 • I was involved in so many things that I was forced to learn time management and how to
multitask. – 18 • Stevenson was a very friendly, safe, and positive learning environment, and I was free to be
myself. – 15 • The classes were very challenging and we learned to cope with them and succeed. – 14 • We were put in a variety of situations and we needed to use these skills. – 13 • There were many leadership opportunities that I took advantage of and I was able to work on
these skills. – 13 • We have such a diverse student body that we learned to relate to other people. - 13 • Odyssey exposed me to a lot of different people and ideas and I was able to explore topics
that I wouldn’t have done otherwise. – 11 • Everything about high school helped to develop these skills. – 9 • My training as a peer helper helped me develop these skills. – 9 • Operation Snowball helped me develop these skills. - 7 • My volunteer and community service activities helped me to develop these skills. – 7 • Stevenson provided a lot of opportunities to meet new people and make new friends. – 7 • There were many leadership opportunities available and I was able to learn a lot in these
positions. – 7 • Social work groups were a big help during high school. – 6
18
2. In your opinion, how could SHS better help students develop SEL skills? (most representative responses with more than 6)
• You are already doing a good job. – 62 • Make getting involved in a club or sport mandatory for all students. – 56 • You should have more activities that involve the whole school, like Project Dance, GIVE,
and Odyssey, so we feel more connected and have more school spirit. – 52 • This is really up to students. The school should not do anything. – 50 • I don’t know. – 48 • Assign more group projects and team-building activities in classes. – 43 • There should be a better FMP program. – 41 • Have better adult (faculty/staff) role models. - 39 • The workload is overwhelming. We could develop these skills if there wasn’t so much
pressure and stress. – 33 • Give students more independence so that we can show that we are responsible. – 30 • There should be a mandatory SEL/life skills class. – 29 • The atmosphere should be more personal. – 28 • Make help from teachers/counselors/social workers easier to get. – 26 • Make more time for students to meet with their counselor/social worker. – 25 • Give us more opportunities to work on this. – 22 • Offer programs or workshops on SEL for students. – 22 • Discuss SEL in our regular classes. – 20 • There should be less of an AP/ACT/grades focus and more of an SEL focus. – 20 • This is a school; you should not focus on SEL. – 20 • Ask for student feedback about these issues. – 18 • Give less homework and we could spend more time on this. – 12 • Have a mandatory community service requirement. – 11 • Push students out of their comfort zones. – 10 • Counselors and social workers should be more accessible. – 10 • Make time for more student/teacher interaction. – 10 • Let us go outside for lunch. – 11 • Give more help in developing time management and stress management skills. – 14 • Make Peer Helpers bigger; get them involved in the FMP program. – 8 • Have getting to know you activities in each class. – 7 • Have smaller class sizes. – 7 • Have a more extensive AWOD program. – 7
3. Faculty and Staff members whom seniors reported as making a positive impact on their high school experience
19
Joan Ackerman-Zimny
Elizabeth Ahlgrim
Agnes Aichholzer
Maureen Albert
Amy Altschuler
Patrick Ambrose
Randy Anderson
Joseph Arce
Brandi Argentar
Daniel Argentar
Jennifer Arias
Ryan Aronoff
Steven Bahr
James Barnabee
Dean Barr
Kristen Barrett
Thrisha Bautista
Daniel Belasich
Hillary Bellert
Dorice Benedetto
Melissa Benedict
Katie Bennett
Julie Bentle
Helen Berger
Tricia Betthauser
Joseph Bettina
Mark Biesiada
Thomas Blasius
Patrick Block
John Bolger
Nancy Borenstein
Jennifer Bouchard
Sarah Bowen
Emily Box
Laura Brandt
Courtney Bresnen
Jenna Breuer
Barbara Brown
Laura Brown
Lynn Buccieri
William Burroughs
Stephanie Bush
Carol Butcher
Sara Cahill
Janie Calderazzo
Bradley Callard
Merle Callisher
Laura Camastro
Erik Campbell
Seamus Campion
Darlene Carlson
Jason Carlson
Lee Carlson
Donald Carmichael
Stephen Carmody
Amerigo Carnazzola
Sean Carney
Clark Chaffee
Mary Christel
Rick Coakley
Danielle Colan
Janie Calderazzo
Victoria Collins
Andrew Conneen
Valerie Consiglio
Shane Cook
Melinda Criglar
Timothy Crow
Peg Cucci
Jacqueline Cullen
Michael Cullen
Kelly Cupuro
Angela Dauphin
Chad Dauphin
John Deppong
Lisa Dettling
Ann Marie Di Iorio
Laura Dickinson
Grace Difiglio
Jennifer Donovan
Marie Drucker
N. Clayton Duba
Filip Dudic
Patricia Duncan
Debra Durham
David Eddy
Matthew Edstrom
Sheila Edstrom
David Elbaum
James Elijah
Jeremiah Enright
Brett Erdmann
Christina Erickson
Donielle Escalante
Melissa Fainman
Patrick Fairchild
Michael Farina
Andrew Farrissey
Michael Feigh
Laurie Feinzimer
Nancy Fenton
Ande Fine
Mary Finlay
Dolores Fischer
Nicole Fischer
Mike Fitzgerald
Kathy Flaherty
Joshua Flood
Timothy Foley
Denise Foster
Shelley Frain
Gerald Franklin
Richard Frankowski
David Frantonius
Lisa Franz
Jill Freitag
Mike Frisby
William Fritz
Peggy Gaier
Robert Gammelgaard
Sonia Gecker
Judith Gemperline
Joseph Geocaris
Jenessa Gerber
Jeremy Gertzfield
Meredith Goddard
Theodore Goergen
Nancy Gold
Eric Goolish
Toni Gorman
Janet Gotrik
Jillian Grady
Jeffrey Green
Rich Green
Rachel Gressel
Lawrence Grimm
Amy Grove
Lynda Gunther
Dr. Joseph Gust
Toni Gzehoviak
Nicholas Haan
Bradley Habel
Thomas Habley
Chad Hager
3. Faculty and Staff members whom seniors reported as making a positive impact on their high school experience
20
Marlene Hahn
Ilene Hamilton
Joyce Haqq
Greg Hartman
Judy Harwood
Chris Heckel-Oliver
Stephen Heller
Sara Hess
Maureen Heun
Donna Hickman
Christina Higgins
Josh Hjorth
Matthew Hodge
Cheryl Hoffman
Lacey Hoffman
Marissa Hollenbeck
Kathryn Hoopes
Penny Hradecky
Lew Hubbard
Nancy Hudson
Caroline Humes
Gloria Huntoon
Jin Hwang
Steven Ikenn
Amy Inselberger
David Jacobson
Darshan Jain
Lauren Jasin
Jennifer Jensen
Janet Jesse
Jeff Johannsen
Gina Johnson
Grant Johnson
Philip Earl Johnson
Parul Johnson
Noel Johnston
Faina Kaminsky
Lynne Kaskela
Adam Kehoe
Martha Keller
Sarah Kellogg
Christina Kelly
Kevin Kelly
T. Brian Kelly
Thomas Kelly
M. Elizabeth Kenney
Mary Cecilia Kenney
Phillip Kernes
Victoria Kieft
Paul Kim
Greg Kirchoff
Merle Klein
Jane Klewin
James Kollar
Shannon Kolze
Perrie Kominsky
Douglas Koski
Meredith Kottmeyer
Konstantinos Kougias
Jacob Kramer
Rob Krause
Janna Kuester
Allison Kulla
Eva Ladenburger
Vanessa Lal
Barry Lapping
Daniel Larsen
Mary Layco
Amanda LeBrun
Agatha Lee
Soo Lee
Stephanie Levenbrook
Louella Levey
Howard Levy
Anna Liker
Doug Lillydahl
Mark Linnenburger
Jill Lisius
Tom Loch
Matthew Lockowitz
Thomas Loew
Sara Lohrmann
Elizabeth Lucas
Abbie Lueken
Lisa Lukens
Cynthia Lynch
Bob Lyons
Melissa Mack
Bob Mackey
Amy Madej
Deborah Magee
Helen Magid
Rowena Mak
Susan Marcus
John Martin
Patricia Martin
Michael Martinez
Frank Mattucci
Elizabeth Maxwell
Jeffrey Mayer
Paul Mazzuca
Carol McCarthy
Kathleen McCauley
William McNamara
Judy Merola
Chet Meyer
David Meyer
Fernando Mier
Charles Milbert
Jennifer Miller
Sandra Millman
Christina Mitz
William Mitz
Dean Moran
Megan Moran
Anne Morelli
Brent Mork
Craig Morse
John Mortillaro
Dimitra Mullins
Christopher Mural
Angela Muresan
Jessie Murphy
Bill Myers
Timothy Myers
Karen Nehring
Lisa Nehring
Gary Novak
Alice Nuteson
Timothy O'Reilly
Daniel Ogborn
Scott Oliver
Mark Onuscheck
William Osmun
Catherine Owens
Lynn Owens
Suzanne Paloian
Jennifer Parisi
Rebecca Patchak
Lucia Pedraja
Lindsay Perkins
Daniel Peso
Gerald Peters
Susan Petschow
Christine Pfaffinger
Ann Pfeifer
Brandi Phelan
3. Faculty and Staff members whom seniors reported as making a positive impact on their high school experience
21
Kristin Piekarski
Richard Pierce
Yolanda Pilch
Robert Pinta
Pamela Polakow
Lori Polin-Silva
Jennifer Polisky
David Popper
Don Proft
Christy Psihogios
Phil Raffaelli
Catherine Rauch-Morse
Amy Read
Kirby Reed
Anthony Reibel
Michael Reimer
Joe Reinmann
Linda Reusch
Victoria Reznicek
Andrew Richardson
Manolo Rider-Sanchez
Rebecca Rikje
Jennifer Rosenzweig
Mark Royce
Neal Roys
Timothy Roznowski
Kathleen Rubenstein
Maureen Rubenstein
Julisa Ruiz
Cristal Sabbagh
Sheryl Sager
Christopher Salituro
Beth Sallmann
Marla Sarris
Jori Saunders
Vickie Saunders
Nancy Sax
Mark Schartner
John Schauble
Jennifer Schiavone
Mary Schneider
David Schoenfisch
Eileen Schopen
Andrew Schroeder
Jackie Schwartzinger
Allison Scully
Tamara Sears
Petra Sebastian
Carol Seeger
Nicole Serrano
Shakuntala Shah
Shifra Sheinfeld
Gregory Sherwin
Caroline Shupe
Todd Sikora
Craig Sincora
Susan Singer
Cheryl Singley
Kathleen Sison
Jeffrey Slepak
Davida Small
Jill Smiley
Bradley Smith
Kelly Smith
Kristen Smith
Nicole Smith
Ralph Smith
Robert Smith
Sherry Smith
Scott Sommers
Susan Sommers
Steven Soszko
Stavroula Sparagis
Maria Spielberger
Vincent Springer
Thomas Stanhope
Donna Stewart-Hickman
Craig Stocker
Sarah Stolzenberg
Laura Stone
Michelle Stone
Melanie Stumpf
Megan Sugrue
M. Terese Sullivan
Janet Sushinski
Sheri Tabloff
Christian Thibaudeau
Barbara Thill
Lisa Thoss
Sharlene Tiagonce
Jennifer Tierney
Dawn Timm
Jan Timmer
LouAnn Tollefson
Timothy Tomaso
Richard Tompson
Linda Transon
Lynn Tremmel
Steven Tucker
Fran Turkel
Anna Upson
Nicholas Valenziano
Tiffany Van Cleaf
Kenneth Van Mersbergen
Hector Vazquez
Jodi Vignassi
Enrique Vilaseco
Lindsay Vizvary
Laura Vladika
Kirsten Voelker
Daryl Wallace
Matthew Wallace
Kathleen Wallis
Janet Wang
Kara Ward
Robert Ward
Deanna Warkins
Sandra Washburn
Paul Weil
Aaron Wellington
Carly Wells
Deborah Wiersema
Scott Williams
Bryan Wills
William Wilms
Anna Wipplinger
Brian Wise
Erin Wise
Edward Wissing
Christina Wood
Jim Wood
Marlene Wood
Steven Wood
Sandra Wright
Jennifer Young
Kim Young
Noelle Young
Robert Zagorski
Kathryn Zawacki
Alden Zimlich
Jennifer Zizzo
! ""!
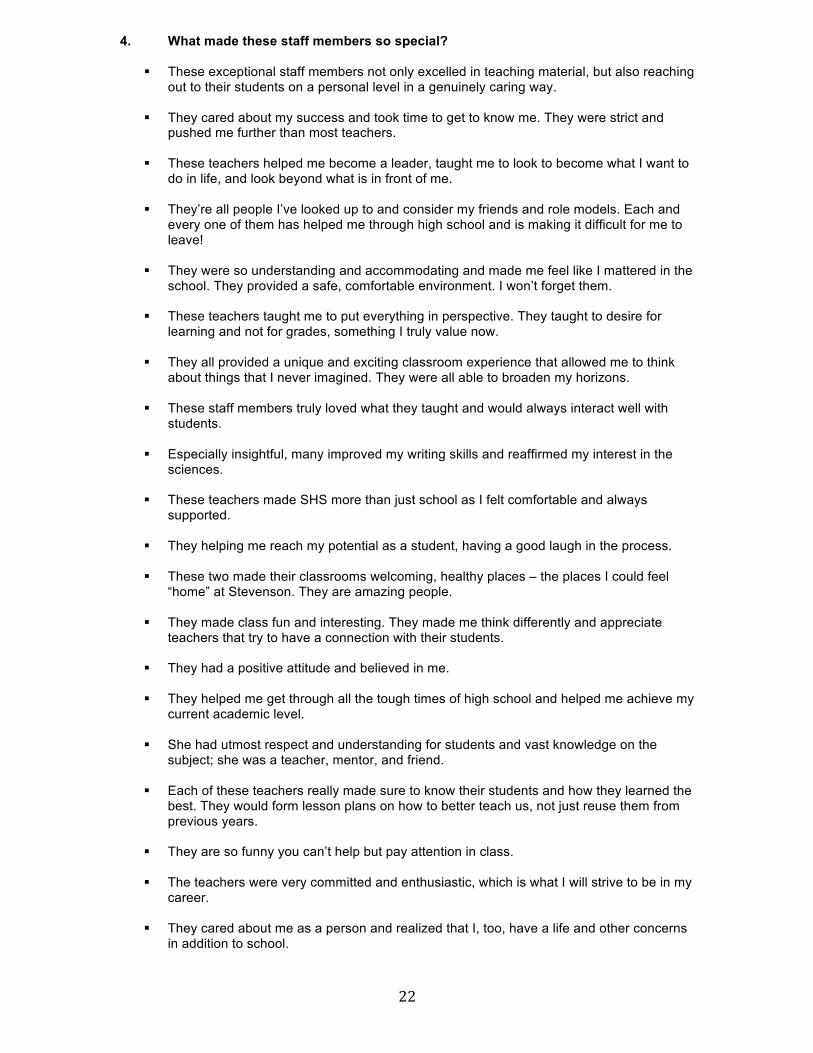
4. What made these staff members so special?
! These exceptional staff members not only excelled in teaching material, but also reaching
out to their students on a personal level in a genuinely caring way.
! They cared about my success and took time to get to know me. They were strict and pushed me further than most teachers.
! These teachers helped me become a leader, taught me to look to become what I want to
do in life, and look beyond what is in front of me.
! They’re all people I’ve looked up to and consider my friends and role models. Each and every one of them has helped me through high school and is making it difficult for me to leave!
! They were so understanding and accommodating and made me feel like I mattered in the
school. They provided a safe, comfortable environment. I won’t forget them.
! These teachers taught me to put everything in perspective. They taught to desire for learning and not for grades, something I truly value now.
! They all provided a unique and exciting classroom experience that allowed me to think
about things that I never imagined. They were all able to broaden my horizons.
! These staff members truly loved what they taught and would always interact well with students.
! Especially insightful, many improved my writing skills and reaffirmed my interest in the
sciences.
! These teachers made SHS more than just school as I felt comfortable and always supported.
! They helping me reach my potential as a student, having a good laugh in the process.
! These two made their classrooms welcoming, healthy places – the places I could feel
“home” at Stevenson. They are amazing people.
! They made class fun and interesting. They made me think differently and appreciate teachers that try to have a connection with their students.
! They had a positive attitude and believed in me.
! They helped me get through all the tough times of high school and helped me achieve my
current academic level.
! She had utmost respect and understanding for students and vast knowledge on the subject; she was a teacher, mentor, and friend.
! Each of these teachers really made sure to know their students and how they learned the
best. They would form lesson plans on how to better teach us, not just reuse them from previous years.
! They are so funny you can’t help but pay attention in class.
! The teachers were very committed and enthusiastic, which is what I will strive to be in my
career.
! They cared about me as a person and realized that I, too, have a life and other concerns in addition to school.
! "#!
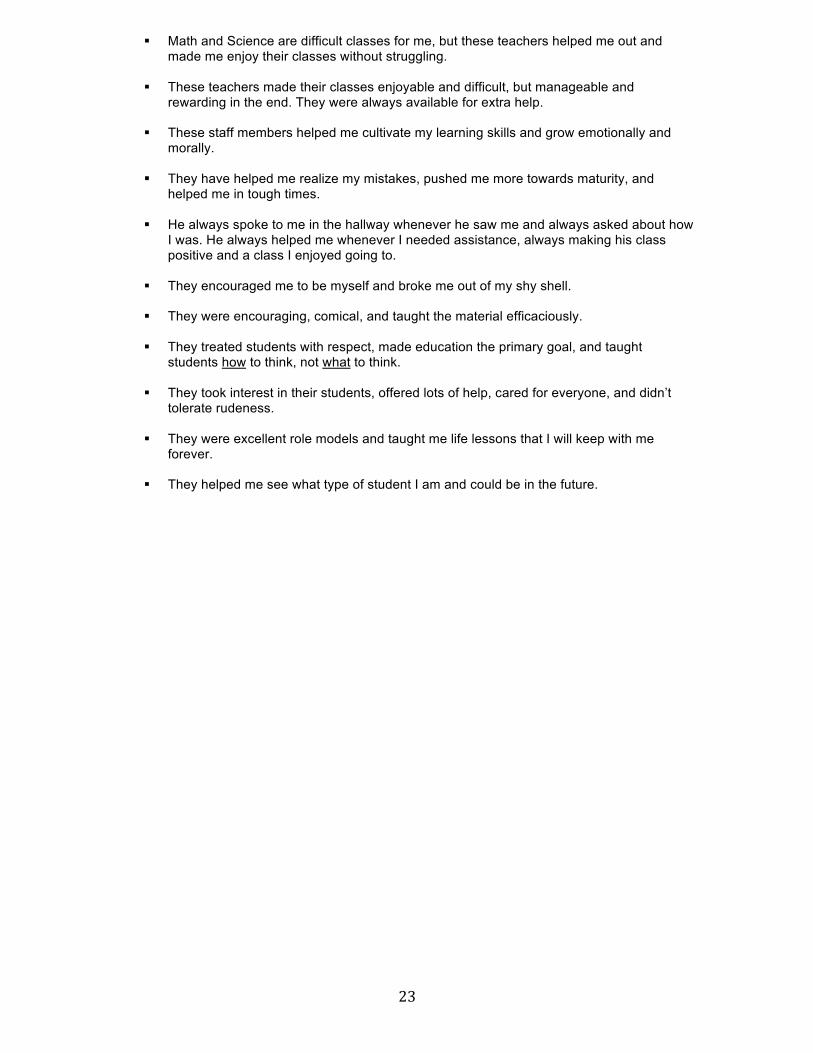
! Math and Science are difficult classes for me, but these teachers helped me out and made me enjoy their classes without struggling.
! These teachers made their classes enjoyable and difficult, but manageable and
rewarding in the end. They were always available for extra help.
! These staff members helped me cultivate my learning skills and grow emotionally and morally.
! They have helped me realize my mistakes, pushed me more towards maturity, and
helped me in tough times.
! He always spoke to me in the hallway whenever he saw me and always asked about how I was. He always helped me whenever I needed assistance, always making his class positive and a class I enjoyed going to.
! They encouraged me to be myself and broke me out of my shy shell.
! They were encouraging, comical, and taught the material efficaciously.
! They treated students with respect, made education the primary goal, and taught
students how to think, not what to think.
! They took interest in their students, offered lots of help, cared for everyone, and didn’t tolerate rudeness.
! They were excellent role models and taught me life lessons that I will keep with me
forever.
! They helped me see what type of student I am and could be in the future.
24
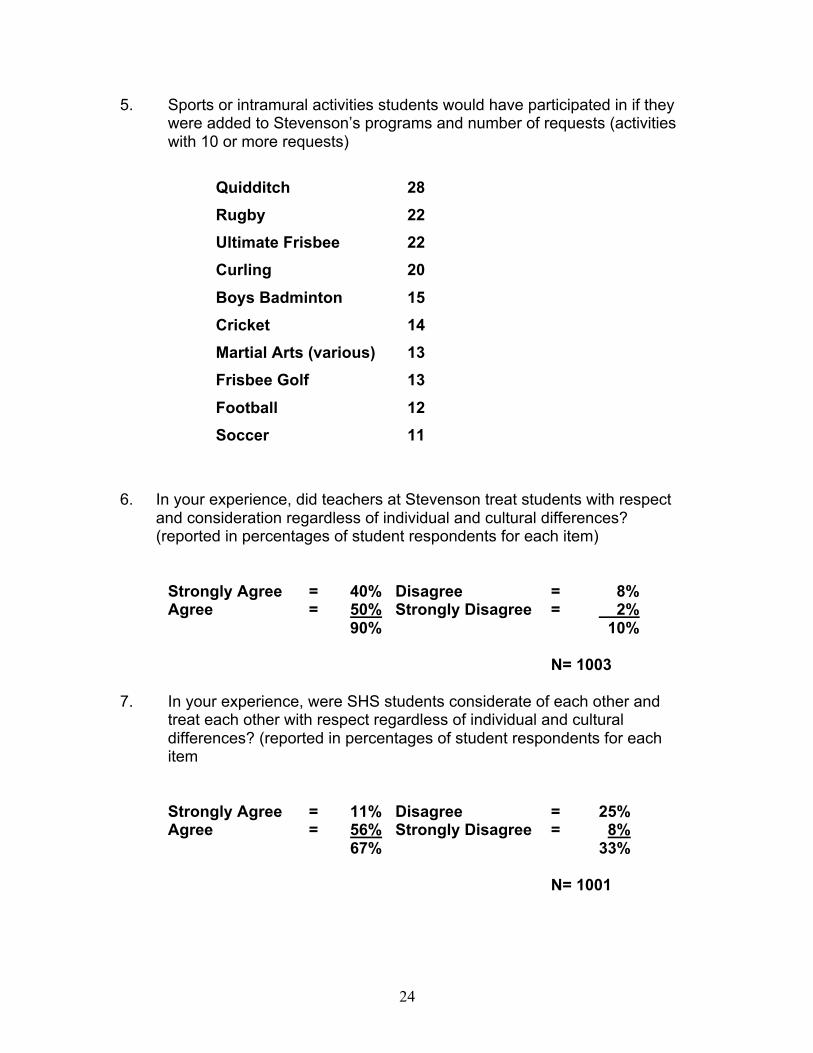
5. Sports or intramural activities students would have participated in if they were added to Stevenson’s programs and number of requests (activities with 10 or more requests)
Quidditch 28
Rugby 22
Ultimate Frisbee 22
Curling 20
Boys Badminton 15
Cricket 14
Martial Arts (various) 13
Frisbee Golf 13
Football 12
Soccer 11
6. In your experience, did teachers at Stevenson treat students with respect
and consideration regardless of individual and cultural differences? (reported in percentages of student respondents for each item)
Strongly Agree = 40% Disagree = 8% Agree = 50% Strongly Disagree = 2% 90% 10% N= 1003 7. In your experience, were SHS students considerate of each other and
treat each other with respect regardless of individual and cultural differences? (reported in percentages of student respondents for each item
Strongly Agree = 11% Disagree = 25% Agree = 56% Strongly Disagree = 8% 67% 33% N= 1001
25
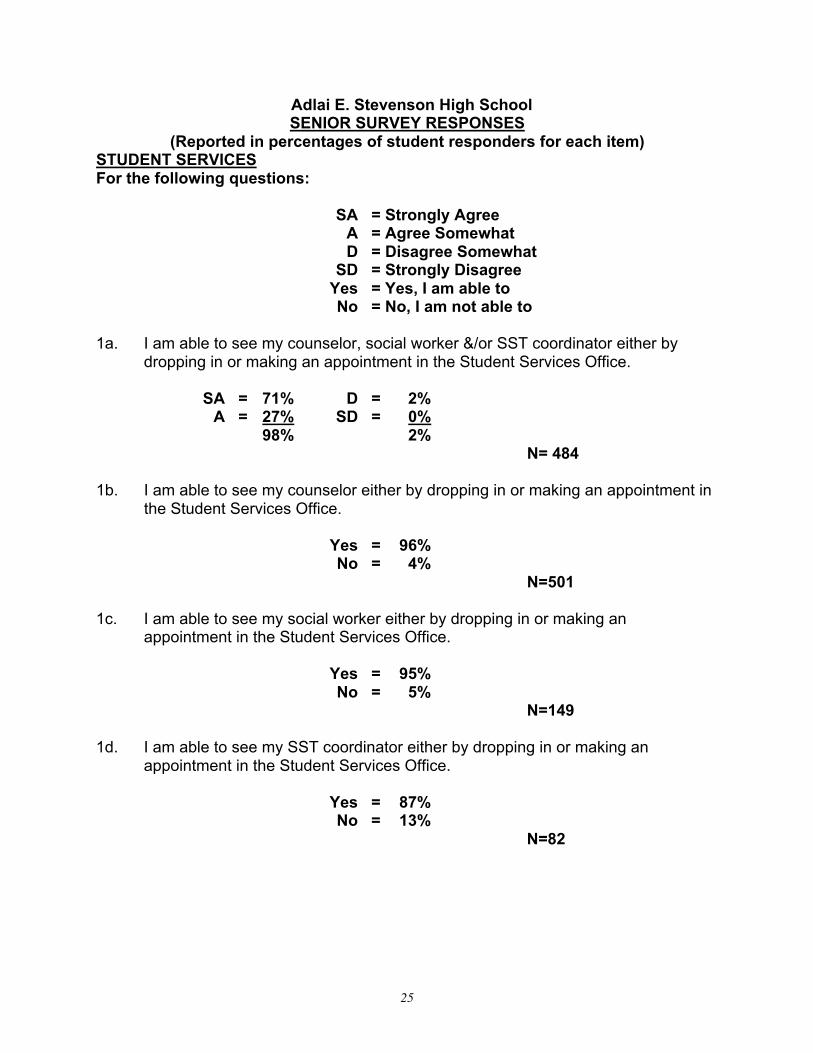
Adlai E. Stevenson High School SENIOR SURVEY RESPONSES
(Reported in percentages of student responders for each item) STUDENT SERVICES For the following questions: SA = Strongly Agree A = Agree Somewhat D = Disagree Somewhat SD = Strongly Disagree Yes = Yes, I am able to No = No, I am not able to 1a. I am able to see my counselor, social worker &/or SST coordinator either by
dropping in or making an appointment in the Student Services Office. SA = 71% D = 2% A = 27% SD = 0% 98% 2% N= 484 1b. I am able to see my counselor either by dropping in or making an appointment in
the Student Services Office. Yes = 96% No = 4% N=501 1c. I am able to see my social worker either by dropping in or making an
appointment in the Student Services Office. Yes = 95% No = 5% N=149 1d. I am able to see my SST coordinator either by dropping in or making an
appointment in the Student Services Office. Yes = 87% No = 13% N=82
26
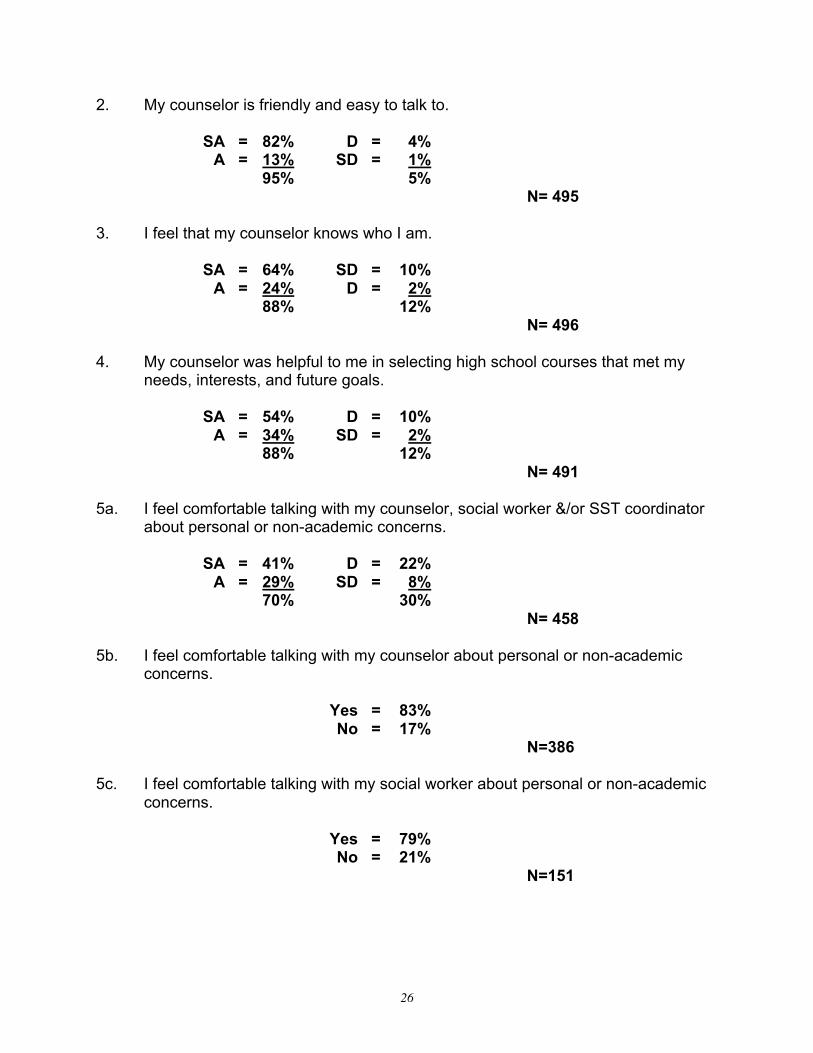
2. My counselor is friendly and easy to talk to. SA = 82% D = 4%
A = 13% SD = 1%
95% 5%
N= 495
3. I feel that my counselor knows who I am. SA = 64% SD = 10%
A = 24% D = 2%
88% 12%
N= 496
4. My counselor was helpful to me in selecting high school courses that met my needs, interests, and future goals.
SA = 54% D = 10%
A = 34% SD = 2%
88% 12%
N= 491
5a. I feel comfortable talking with my counselor, social worker &/or SST coordinator
about personal or non-academic concerns. SA = 41% D = 22%
A = 29% SD = 8%
70% 30%
N= 458
5b. I feel comfortable talking with my counselor about personal or non-academic concerns.
Yes = 83%
No = 17%
N=386
5c. I feel comfortable talking with my social worker about personal or non-academic concerns.
Yes = 79%
No = 21% N=151
27
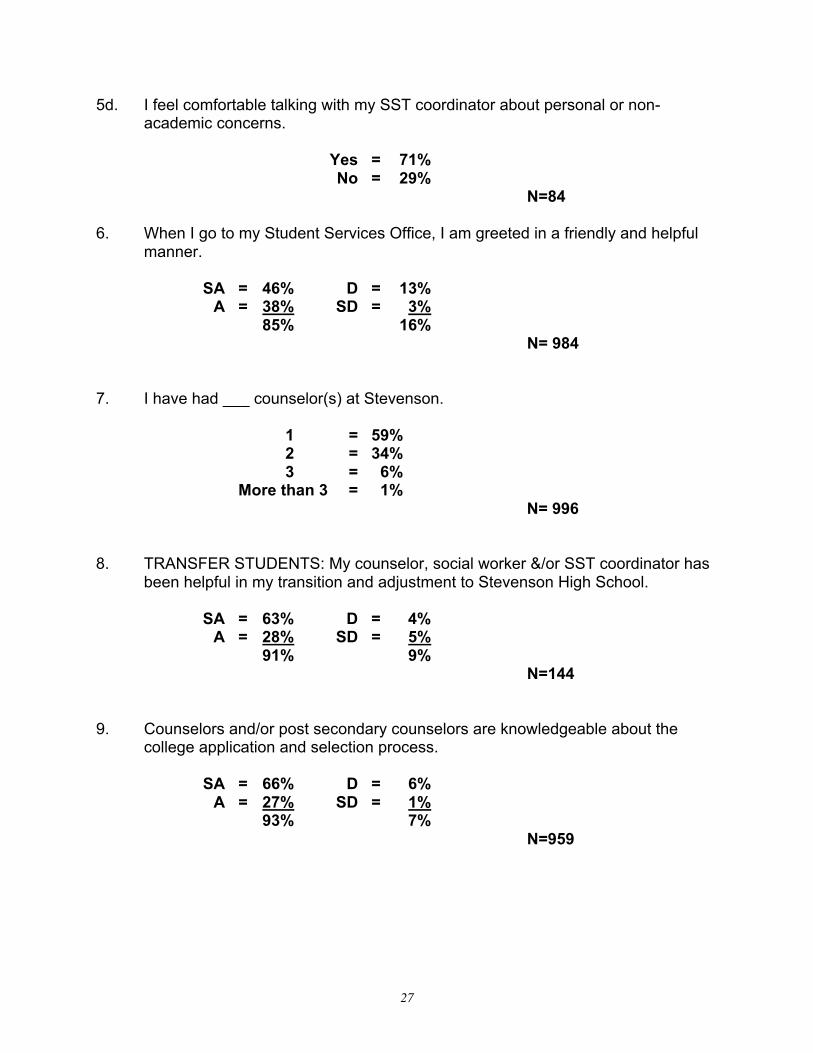
5d. I feel comfortable talking with my SST coordinator about personal or non-academic concerns.
Yes = 71%
No = 29%
N=84
6. When I go to my Student Services Office, I am greeted in a friendly and helpful manner. SA = 46% D = 13%
A = 38% SD = 3%
85% 16%
N= 984 7. I have had ___ counselor(s) at Stevenson. 1 = 59%
2 = 34%
3 = 6%
More than 3 = 1%
N= 996
8. TRANSFER STUDENTS: My counselor, social worker &/or SST coordinator has
been helpful in my transition and adjustment to Stevenson High School.
SA = 63% D = 4%
A = 28% SD = 5%
91% 9%
N=144
9. Counselors and/or post secondary counselors are knowledgeable about the
college application and selection process. SA = 66% D = 6%
A = 27% SD = 1%
93% 7%
N=959
28
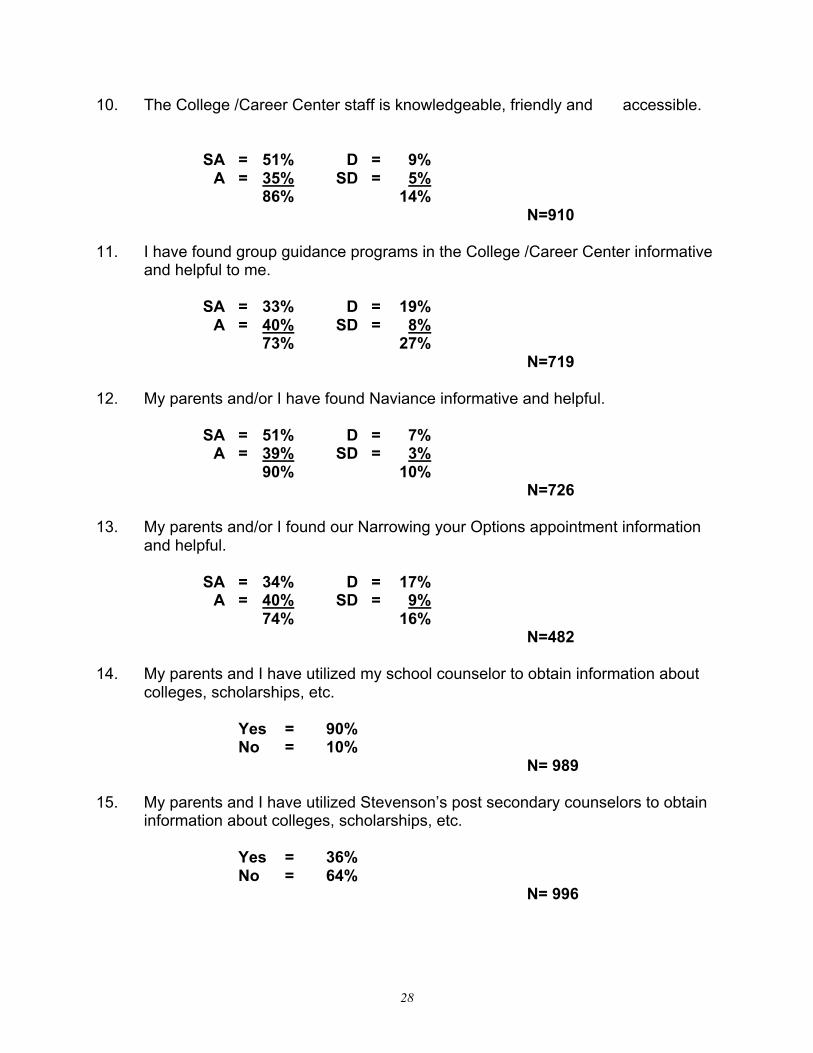
10. The College /Career Center staff is knowledgeable, friendly and accessible. SA = 51% D = 9%
A = 35% SD = 5%
86% 14%
N=910
11. I have found group guidance programs in the College /Career Center informative
and helpful to me. SA = 33% D = 19%
A = 40% SD = 8%
73% 27%
N=719
12. My parents and/or I have found Naviance informative and helpful. SA = 51% D = 7%
A = 39% SD = 3%
90% 10%
N=726
13. My parents and/or I found our Narrowing your Options appointment information and helpful.
SA = 34% D = 17%
A = 40% SD = 9%
74% 16%
N=482
14. My parents and I have utilized my school counselor to obtain information about colleges, scholarships, etc.
Yes = 90%
No = 10%
N= 989
15. My parents and I have utilized Stevenson’s post secondary counselors to obtain
information about colleges, scholarships, etc.
Yes = 36%
No = 64%
N= 996
29
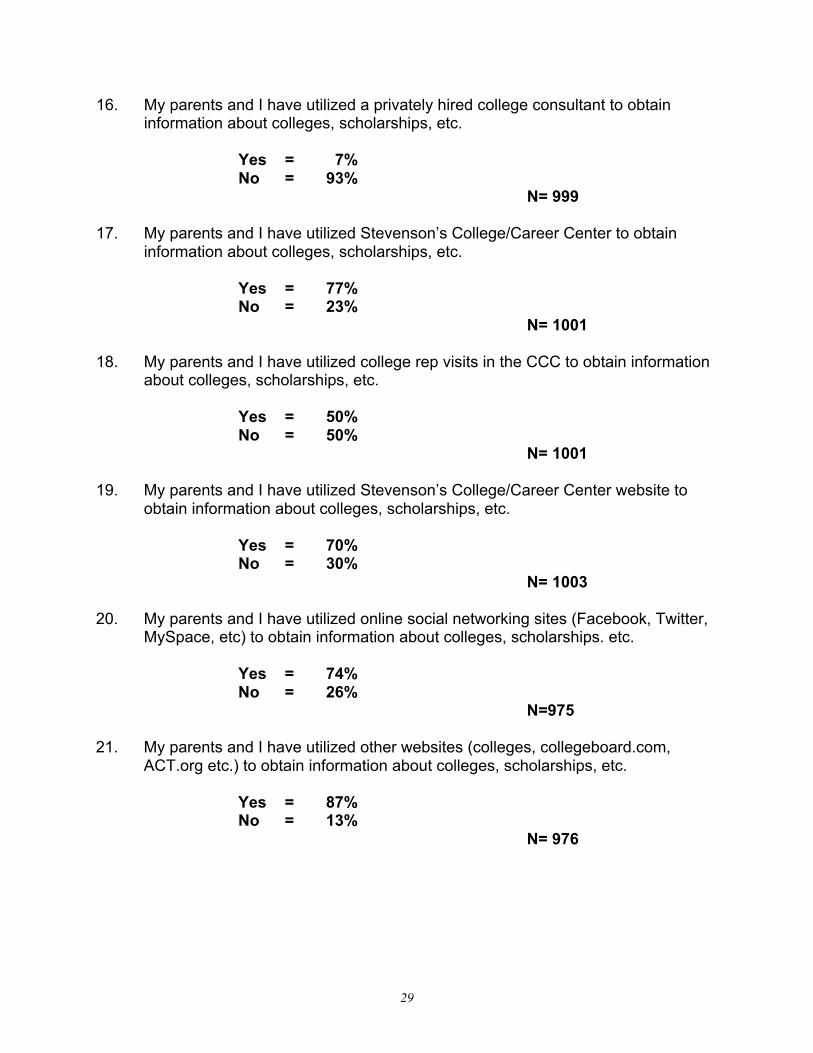
16. My parents and I have utilized a privately hired college consultant to obtain information about colleges, scholarships, etc.
Yes = 7%
No = 93%
N= 999
17. My parents and I have utilized Stevenson’s College/Career Center to obtain information about colleges, scholarships, etc.
Yes = 77%
No = 23%
N= 1001
18. My parents and I have utilized college rep visits in the CCC to obtain information about colleges, scholarships, etc.
Yes = 50%
No = 50%
N= 1001
19. My parents and I have utilized Stevenson’s College/Career Center website to
obtain information about colleges, scholarships, etc.
Yes = 70%
No = 30%
N= 1003
20. My parents and I have utilized online social networking sites (Facebook, Twitter, MySpace, etc) to obtain information about colleges, scholarships. etc. Yes = 74%
No = 26%
N=975
21. My parents and I have utilized other websites (colleges, collegeboard.com, ACT.org etc.) to obtain information about colleges, scholarships, etc.
Yes = 87%
No = 13%
N= 976
30
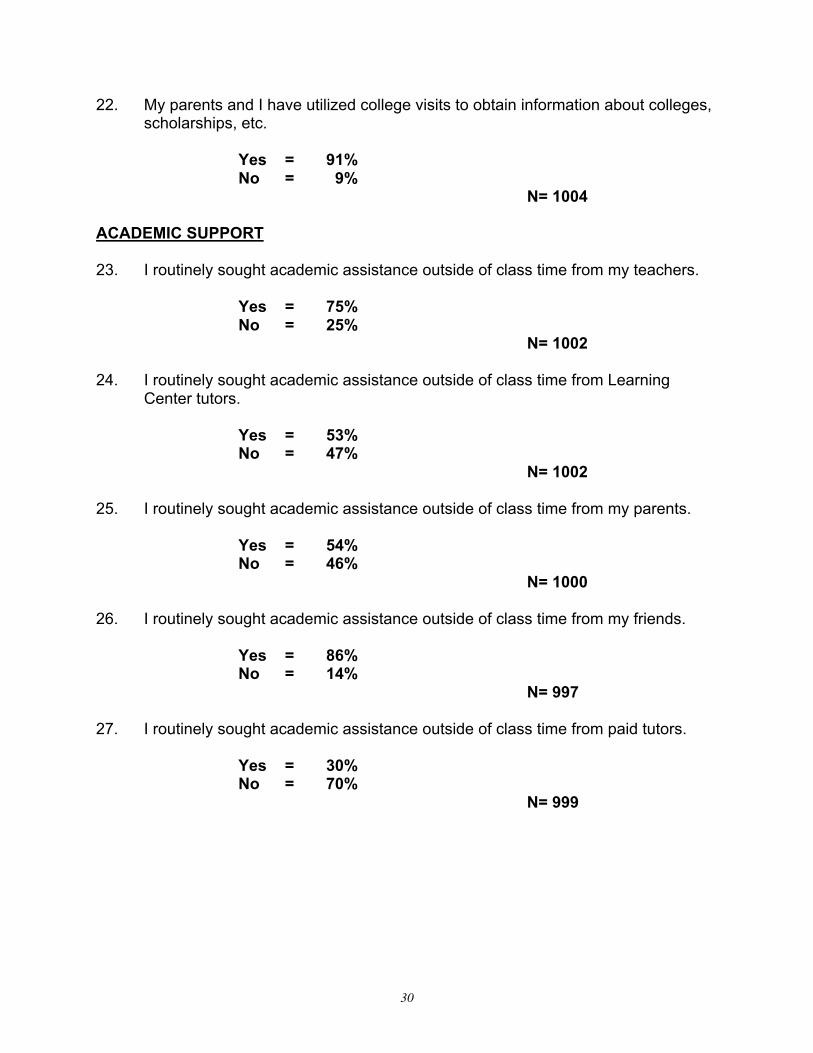
22. My parents and I have utilized college visits to obtain information about colleges, scholarships, etc.
Yes = 91%
No = 9%
N= 1004
ACADEMIC SUPPORT 23. I routinely sought academic assistance outside of class time from my teachers.
Yes = 75%
No = 25%
N= 1002
24. I routinely sought academic assistance outside of class time from Learning Center tutors.
Yes = 53%
No = 47%
N= 1002
25. I routinely sought academic assistance outside of class time from my parents.
Yes = 54%
No = 46%
N= 1000
26. I routinely sought academic assistance outside of class time from my friends.
Yes = 86%
No = 14%
N= 997
27. I routinely sought academic assistance outside of class time from paid tutors.
Yes = 30%
No = 70%
N= 999
31
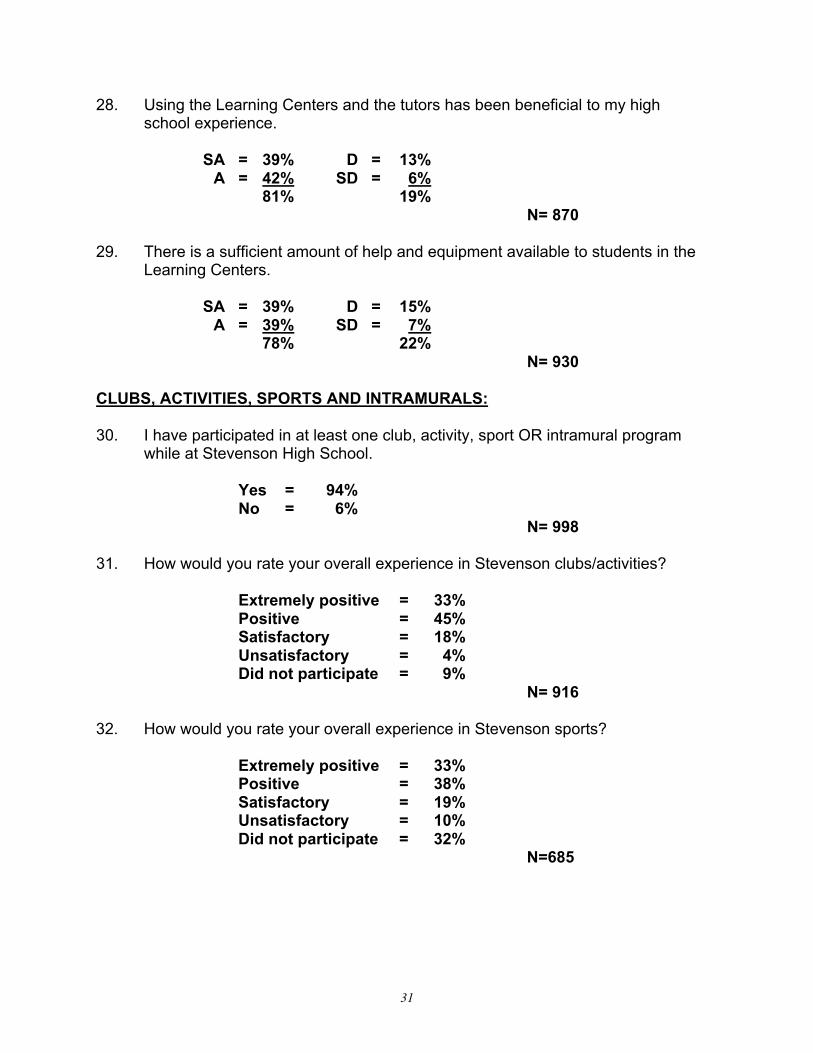
28. Using the Learning Centers and the tutors has been beneficial to my high school experience. SA = 39% D = 13% A = 42% SD = 6% 81% 19% N= 870 29. There is a sufficient amount of help and equipment available to students in the Learning Centers. SA = 39% D = 15% A = 39% SD = 7% 78% 22% N= 930 CLUBS, ACTIVITIES, SPORTS AND INTRAMURALS: 30. I have participated in at least one club, activity, sport OR intramural program while at Stevenson High School. Yes = 94% No = 6% N= 998 31. How would you rate your overall experience in Stevenson clubs/activities? Extremely positive = 33% Positive = 45% Satisfactory = 18% Unsatisfactory = 4% Did not participate = 9% N= 916 32. How would you rate your overall experience in Stevenson sports? Extremely positive = 33% Positive = 38% Satisfactory = 19% Unsatisfactory = 10% Did not participate = 32% N=685
32
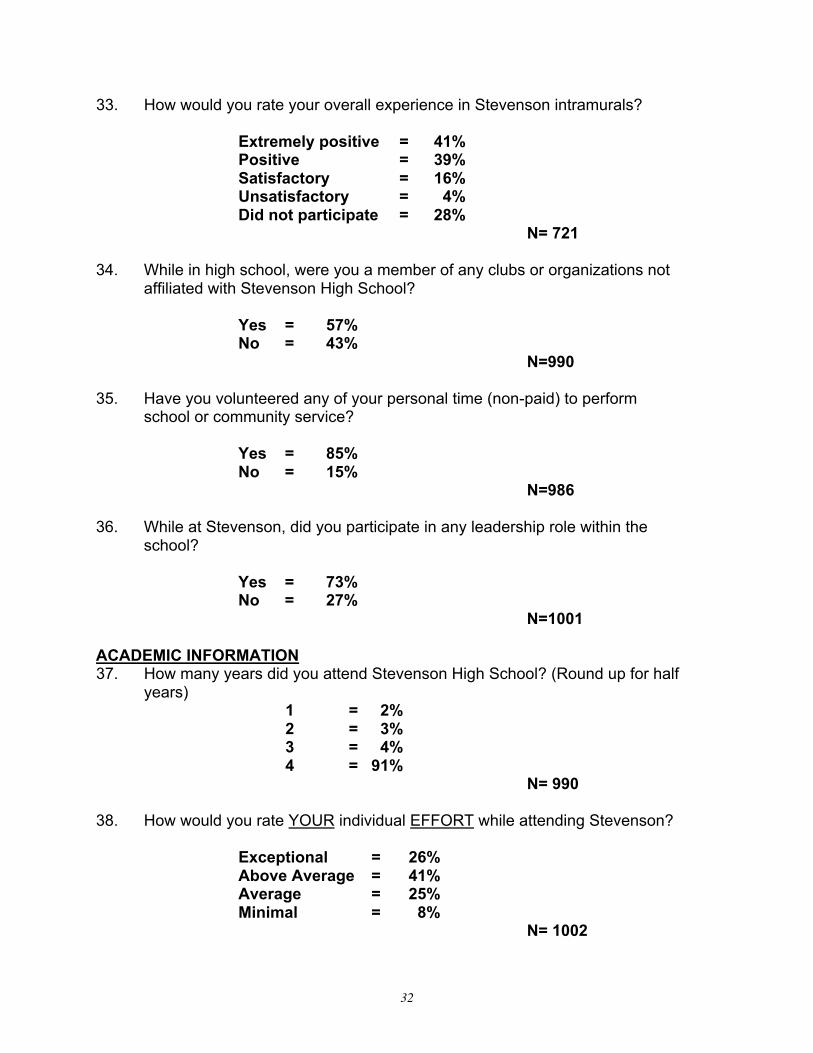
33. How would you rate your overall experience in Stevenson intramurals? Extremely positive = 41% Positive = 39% Satisfactory = 16% Unsatisfactory = 4% Did not participate = 28% N= 721 34. While in high school, were you a member of any clubs or organizations not affiliated with Stevenson High School? Yes = 57% No = 43% N=990 35. Have you volunteered any of your personal time (non-paid) to perform school or community service? Yes = 85% No = 15% N=986 36. While at Stevenson, did you participate in any leadership role within the school? Yes = 73% No = 27% N=1001 ACADEMIC INFORMATION 37. How many years did you attend Stevenson High School? (Round up for half years) 1 = 2% 2 = 3% 3 = 4% 4 = 91% N= 990 38. How would you rate YOUR individual EFFORT while attending Stevenson? Exceptional = 26% Above Average = 41% Average = 25% Minimal = 8% N= 1002
33
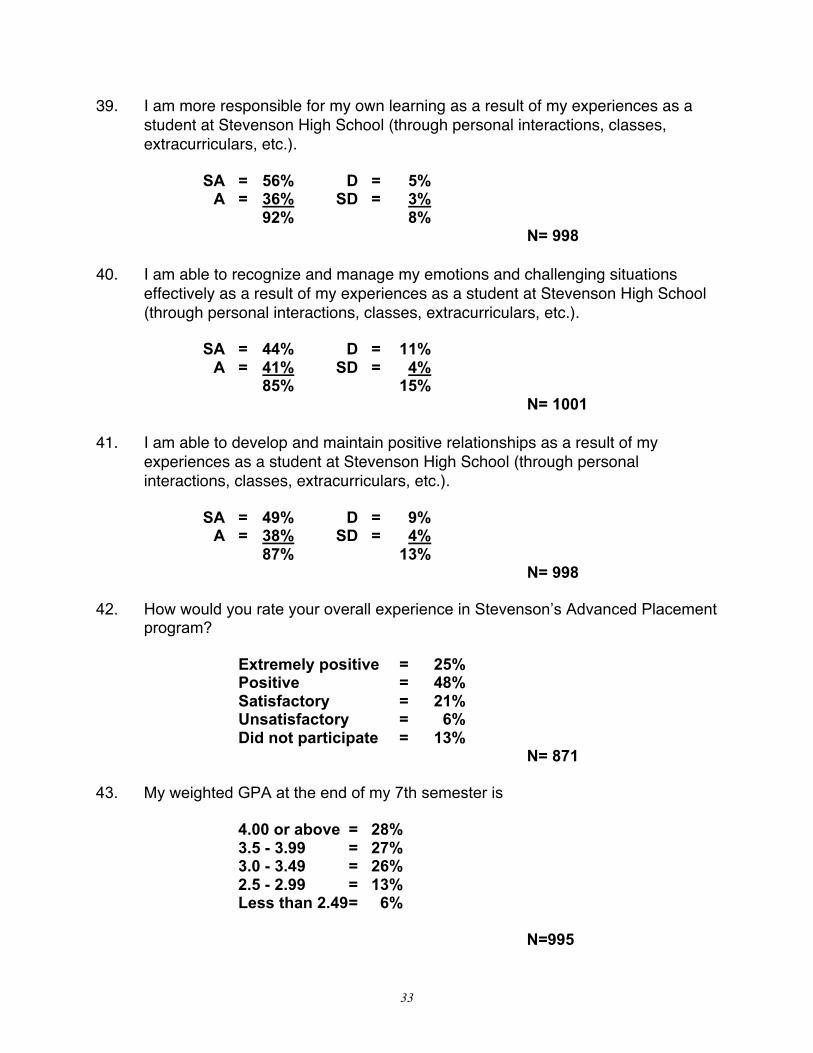
39. I am more responsible for my own learning as a result of my experiences as a
student at Stevenson High School (through personal interactions, classes,
extracurriculars, etc.).
SA = 56% D = 5% A = 36% SD = 3% 92% 8% N= 998
40. I am able to recognize and manage my emotions and challenging situations
effectively as a result of my experiences as a student at Stevenson High School
(through personal interactions, classes, extracurriculars, etc.).
SA = 44% D = 11% A = 41% SD = 4% 85% 15% N= 1001
41. I am able to develop and maintain positive relationships as a result of my
experiences as a student at Stevenson High School (through personal
interactions, classes, extracurriculars, etc.).
SA = 49% D = 9% A = 38% SD = 4% 87% 13% N= 998 42. How would you rate your overall experience in Stevenson’s Advanced Placement
program? Extremely positive = 25% Positive = 48% Satisfactory = 21% Unsatisfactory = 6% Did not participate = 13% N= 871 43. My weighted GPA at the end of my 7th semester is 4.00 or above = 28% 3.5 - 3.99 = 27% 3.0 - 3.49 = 26% 2.5 - 2.99 = 13% Less than 2.49 = 6% N=995
34
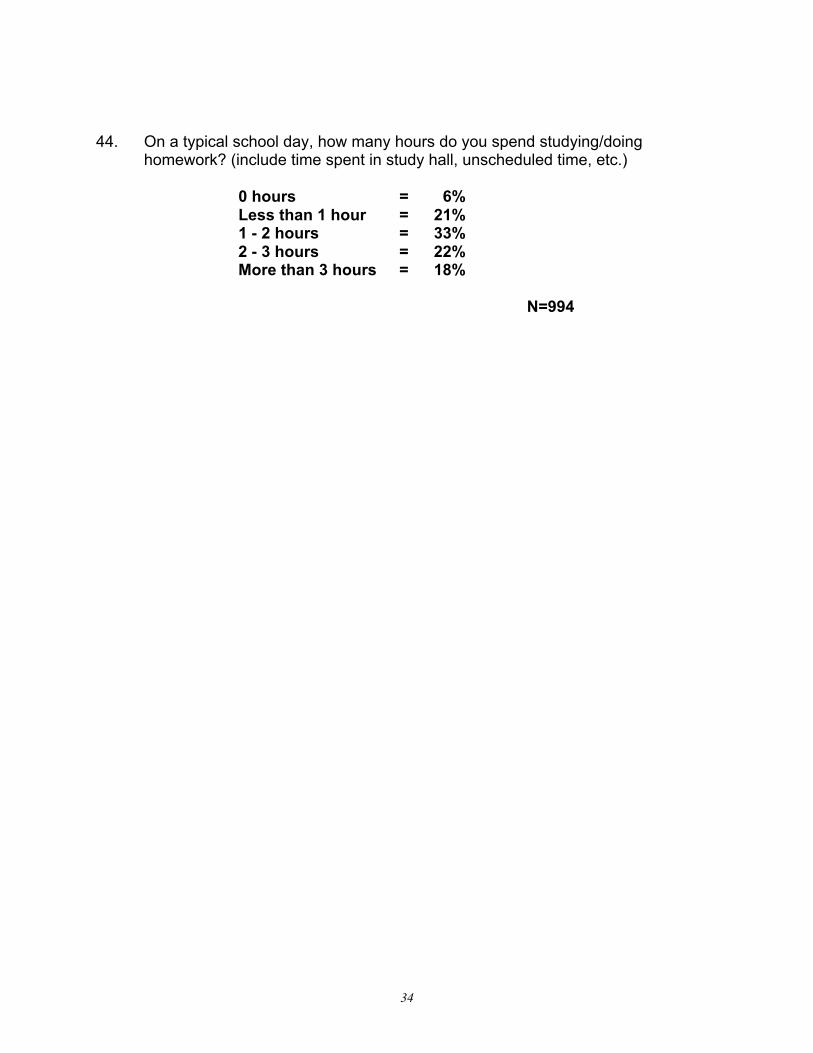
44. On a typical school day, how many hours do you spend studying/doing homework? (include time spent in study hall, unscheduled time, etc.)
0 hours = 6%
Less than 1 hour = 21%
1 - 2 hours = 33%
2 - 3 hours = 22%
More than 3 hours = 18%
N=994
35
Senior Exit Survey Summary
Thoughtful and extensive responses were garnered from 12th graders by continuing the practice of having them first respond to the open-ended portion of the Senior Exit Survey. For the third year in a row, there is a new component to the open-ended questions, which focuses on the district’s goal to increase Social Emotional Learning opportunities to ensure that all students are developing as critical thinkers, effective problem solvers, and good citizens. The first question asked respondents to assess how effective Stevenson was at developing their Social Emotional Learning, which includes being able to demonstrate responsibility, recognize and manage emotions and challenging situations effectively, and developing and maintaining positive relationships. Overall, respondents praised Stevenson’s effective blend of freedom and limits along with its challenging, yet supportive, academic environment where time-management skills were developed and personal initiative was rewarded. Judging by their comments, it is apparent that many students have indeed made the connection that demanding assignments and high expectations have all served to generate positive outcomes, while forcing them to take responsibility for their own learning. This year the largest category of agreement among seniors indicates that they believe the size of the school helped them to maintain friendships even though they didn’t necessarily come in contact with these friends on a consistent basis (164 students). For the past two years, the number one response was that students believed Stevenson did nothing to develop their SEL skills; this year it was the second most popular response (161 students). A third most popular shared sentiment is that they have learned SEL skills from their involvement in Stevenson’s extracurricular activities, sports, and clubs (127 students). Seniors also credit the FMP program as a catalyst in developing SEL skills and providing them with the forum to openly discuss a wide variety of topics (123). The next response gave credit to the talented and dedicated staff members who served as role models in the area of SEL (83). More specifically, seniors credit the counselors, social workers, and case managers as influential in helping them manage their emotions (76). Graduating seniors also felt that these skills were taught in their specific classes (45). Other students thought that Stevenson’s challenging courses and high expectations led them to find ways to cope and manage their workload, as well as their emotions (45). Finally, some seniors claim that the group work in their classes helped them to deal effectively with other people (25).
The second question asked for students’ suggestions: “How could
Stevenson better help students develop SEL skills?” The most popular shared response among recent graduates is to continue what Stevenson is doing (62). This was also last year’s most popular response. The second most popular response is that Stevenson should make getting involved in clubs or sports
36
mandatory for all students (56). Followed closely was the idea of facilitating more school-wide activities, like Odyssey, that foster school spirit and connectedness (52). The fourth most popular response indicates that 50 students feel that this is really up to students and the school should not intervene. Forty-eight students do not know how Stevenson can help students develop better SEL skills. Past surveys have demonstrated that encouraging students’ independence and supporting students’ self-reliance is a popular sentiment among graduates. For the third consecutive year, a popular response is that Stevenson should encourage more independence in the students so that they can display responsible behaviors, as it is ultimately up to the students to be responsible (30). Some students believe that there should be more group work and team building activities in class work (43), while others feel the FMP program can be improved (41), and that teachers need to be able to role model these skills (39).
An all time high number of faculty and staff members (432) are specifically named as having a positive impact on students because of their inspirational teaching, encouragement, and personal interest. The ubiquitous message is that students describe SHS personnel as being agents of change in their lives. These teachers impacted their student’s lives by stimulating intellectual curiosity, encouraging them to reach their fullest potential, and taking their individual needs into consideration at all times. Another major theme is the fact that students were inspired by the teachers’ passions for the subject matter and their ability to make learning fun. In addition, students agree that the care and support that staff members extend to them help them weather difficult times. Students consistently stressed the fact that faculty and staff believe in their potential and are capable of boosting their confidence and self-esteem. They comment that Stevenson personnel helped them achieve at a level of success that many had never believed to be obtainable. They describe staff members as being understanding, concerned, intelligent, passionate, supportive, patient, entertaining, authentic, enthusiastic, engaging, socially aware, funny, influential, and genuine.
Graduates are asked to comment on which sports or intramural activities they would have participated in if they were added to Stevenson’s programs. This year Quidditch (28) took the top spot beating out Rugby, which has continued to be one of the most popular requests in recent years. The second most popular request was Rugby (22) and Ultimate Frisbee (22). The third most popular request is Curling (20) and Boys Badminton (15) followed closely by Cricket (14). Please note that Rugby has been offered over the last five years, and then has been subsequently canceled due to lack of participation.
The overwhelming majority (90%) of senior students believe that faculty
37
members treat students fairly and without discrimination regardless of individual and cultural differences, which is a three-point increase from last year’s survey results. A small percentage of students (3%) have the impression that some teachers favor certain students and do not treat all students the same. The second question inquires about peers’ ability to demonstrate respect of cultural differences. A little more than half of students indicate that fellow students are considerate of each other regardless of differences (67%). This is a significant increase of 15 percentage points from last year’s results. A number of seniors (33%) believe that their peers are inconsiderate and disrespectful of each other. Sixty-five seniors agreed that some students are mean, rude, and disrespectful, while thirteen seniors cited that some students are racist. Another popular response is that cliques are mean to other cliques (19), while some respond that students are stuck up and judgmental.
This year, we made some minor adjustments and additions to the student services exit survey. Most notably, we added a second form which half of the students took. The wording on this new form was more inclusive, adding in social workers and SST coordinators to assess a more comprehensive view of the effectiveness and satisfaction rates of Student Services. The old form was still completed by half of the students, and this wording included only counselors when assessing utilization and satisfaction rates. Based on the results for Form B, seniors perceive counselors as both available (96%) and accessible on an interpersonal level (95%). Form A found that students also feel that their social worker (95%) and SST coordinators (87%) are accessible. To include all members of the SST, Form A asked students if they felt they are able to see their counselor, social workers, and SST coordinator. This wording elicited the highest results indicating that 98 percent of seniors feel they can access at least one member of their SST. Seniors indicate that their counselors know them (88%), in addition to finding them helpful with academic guidance (88%); the latter constitutes a slight increase from last year’s results. More than three quarters of seniors feel comfortable talking to counselors about personal or non-academic issues (83%). This is a staggering 18-point increase from last year’s results. A new question found that 79 percent of seniors are comfortable talking with their social worker about non-academic issues. Another new question found that 71 percent of respondents feel comfortable talking about personal issues with their SST coordinator; however, only 84 seniors answered this question. Form A asks if students feel comfortable discussing personal issues with their counselor, social worker, and SST coordinator. Surprisingly, although this question includes all members of the SST, the results are quite lower than when the question uses only the individual members (70%). Over three quarters of students (85%) believe that the Student Services offices are “user-friendly.” This constitutes a positive increase of eight points. Most transfer students (91%) view their counselors, social workers, and SST coordinators as being helpful in their
38
transition and adjustment to SHS. This question is different from last year because it also includes social workers and SST coordinators. This might help explain why there was a 10-point increase from last year’s results. A little more than half of the class (59%) has had the same counselor for all four years. This is pretty consistent with last year’s results, given recent retirements and personnel changes.
Seniors respond positively about college counseling services. Counselors and college consultants are depicted as being knowledgeable and helpful in the college application and selection process (93%). The College/Career Center staff is viewed as being friendly and accessible (86%). Three new questions were composed to try and capture some of the changes in the CCC curriculum and service delivery. Seniors are now attending more group guidance programs during the school day in the CCC. When asked about these guidance programs, 73 percent of seniors found them to be helpful. Over the past few years, Student Services has been introducing the seniors to an online college search program called Naviance. A large majority (90%) of seniors feel that Naviance has been an effective and informative way to research college information. Another recent change reflects that post-secondary counselors are now primarily responsible for facilitating the Narrowing Your Options college appointments with families. Historically, the counselor shared the responsibility of conducting NYO meetings. Almost three-quarters of seniors (74%) felt that their NYO appointment with a post-secondary counselor was helpful. When asked how they obtain information about colleges and scholarships, 36 percent of seniors utilize the post-secondary counselors, whereas 90 percent of seniors get help from their individual counselor. Students and parents access information about colleges from the CCC (77%) as well as using college links on Stevenson’s home page (70%). This went down slightly this year (6 points); however, last year depicted an eleven-point increase. “Other” websites continue to be a substantial source of information for many of our families (87%). When asked more specifically, almost three quarters of students (74%) access social networking sites, such as Facebook, to obtain post-secondary information. College campus visits continue to be the most popular way families retrieve information about college and scholarships (91%), and this increased by one point this year. Half of the seniors (50%) took advantage of the college rep visits held in the CCC to obtain college information. Families that procure the services of private college consultants have stayed fairly consistent from last year’s results (7%). We continue to see the trend that more students are utilizing online resources to assist them in the college application process. Several new questions were composed to determine how students are getting their academic support. Historically, we’ve only asked questions pertaining to the Learning Center; however, we understand that students are
39
most likely accessing a variety of different sources to obtain academic assistance and support. The most popular response shows that a large majority of students get academic support from their friends (86%). The second most popular response indicates that three quarters of seniors sought out help from their teachers (75%). Next, more than half of the seniors (54%) receive academic support from their parents, followed closely by the Learning Center (53%). Lastly, the fewest students access academic support from paid tutors (30%). It is interesting to see that most students will go to their peers first when they are seeking academic support. More than three quarters (81%) of seniors have found the Learning Centers and their tutors to be beneficial, with almost the same number (78%) reporting the amount of help and equipment to be adequate. A very high percentage of seniors (94%) indicate that they have participated in at least one club, activity, sport, or intramural during their high school tenure. This is only a one-point decrease from last year which constituted an all-time high. More than three quarters (78%) of the students who have participated in clubs/activities feel positive about their experience with just about another 20 percent (18%) simply expressing satisfaction. About seven out of ten (71%) of the interscholastic sport participants view their experiences as positive or extremely positive, while others describe their experience as satisfactory (19%). Most seniors (80%) express that their intramural experience has been positive, while nearly the rest (16%) find some satisfaction in these activities. About seven out of ten of seniors (73%) report that they have achieved a position of leadership within the school; this constitutes a five-point increase from last year. The majority of seniors (57%) are members of a club or organization affiliated with SHS, while a larger percentage of seniors (85%) have volunteered their time to school or community-based organizations. Survey responses portray Stevenson students as being highly involved in a wide variety of co-curricular and community activities.
More than 90 percent (91%) of seniors have attended Stevenson for a full four years. In assessing their own individual effort at Stevenson, well over half of the seniors perceive their directed energy toward school as being exceptional (26%) or above average (41%), with about a quarter (25%) describing their output as average. Although this form of self-assessment is highly subjective, quantitative measures of student achievement at Stevenson; e.g., standardized test scores, results of Advanced Placement exams, widespread summer school enrichment, and the number of students choosing to attend four-year colleges suggest their perceptions are valid.
For the third year in a row, we are asking three questions which are intended to gauge how well Stevenson is equipping the graduating seniors with
40
Social Emotional Learning skills. We did some rewording of these questions to try to facilitate a better understanding as to how these SEL skills relate to their tenure at SHS. The first question depicts that more than 90 percent (92%) of seniors believe that their experiences as a student at SHS taught them to become more responsible for their own learning as they progressed through high school. This constitutes a 5 percent increase from last year’s results. The second question found that more than three quarters of the senior class (85%) believed that their experiences as a student at SHS helped them to recognize and manage emotions and challenging situations effectively. This depicts a dramatic 11 percent increase from last year’s respondents. Finally, the third question shows that more than 80 percent of seniors (87%) believe that their experiences at SHS helped them to develop and maintain positive relationships in their lives. This also depicts a five-point increase from last year. It is positive to see that all of the SEL results increased by five or more points, which lends support to the fact that we are accomplishing the school-wide district goal of ensuring that Stevenson is teaching students these positive, life-long SEL skills. When asked to rate their overall Advanced Placement experience, seven out of ten (73%) of the participants assess their experience as positive, while just under one quarter (21%) express mere satisfaction.
Upon comparing answers among seniors to the previous year’s graduates, upward trends are evident in some categories, while other responses continue to elicit similar results or slight decreases. The current senior survey suggests that students continue to perceive counselors as accessible (two-point increase), amiable (same), helpful in selecting courses (one-point increase), and able to provide a setting whereby students feel comfortable speaking about non-academic concerns (eighteen-point increase). Seniors continue to be highly satisfied with college counseling services. Students are continuing to utilize the resources of the College/Career Center (one-point decrease). A large number of students access information from their counselors (four-point decrease) and college consultants (seven-point decrease). A larger majority of seniors say that they are visiting college campuses (one-point increase). Students are reporting increased levels of satisfaction with the Learning Center’s services and resources (three-point increase). Yearly trends demonstrate that Stevenson students are participating in clubs, activities, sports, and intramurals in greater numbers. Accompanying satisfaction levels remain positive, managing to sustain healthy gains that have been noticed in the past couple of years. In the free response portion of the survey, seniors have delivered a host of positive feedback. Once more, Stevenson’s administration, faculty, and staff are credited with humanizing and enriching their high school experience.
41
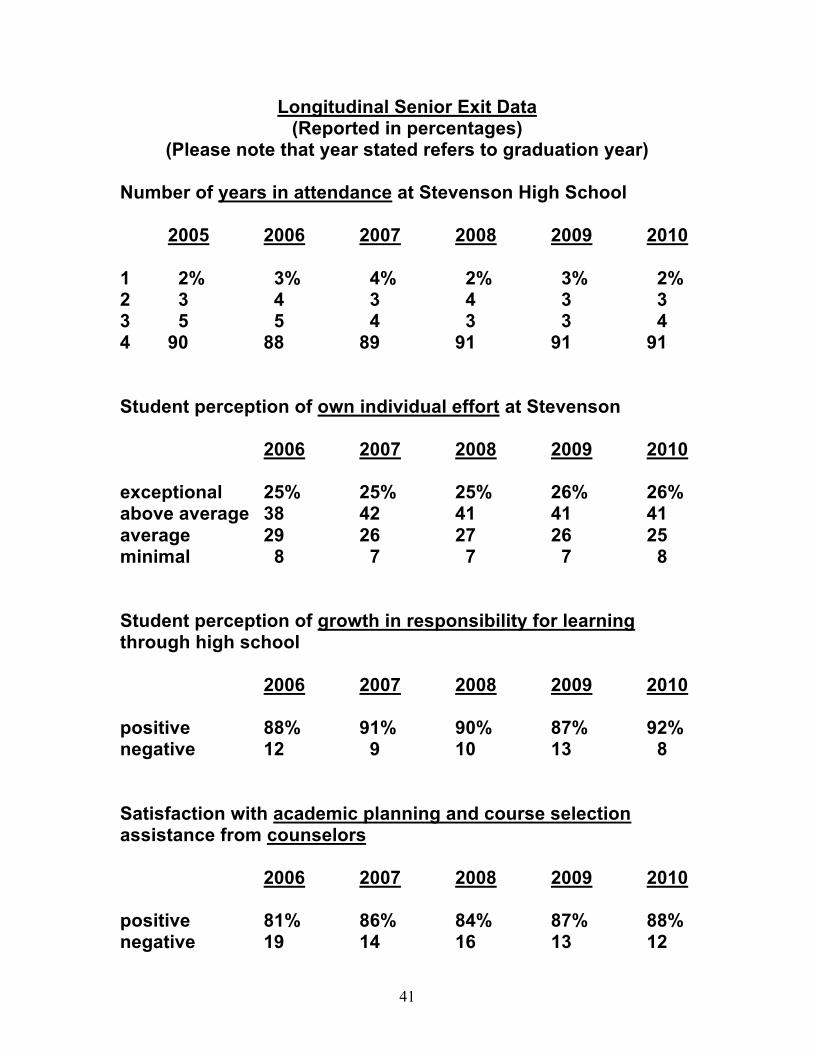
Longitudinal Senior Exit Data (Reported in percentages)
(Please note that year stated refers to graduation year) Number of years in attendance at Stevenson High School 2005 2006 2007 2008 2009 2010 1 2% 3% 4% 2% 3% 2% 2 3 4 3 4 3 3 3 5 5 4 3 3 4 4 90 88 89 91 91 91 Student perception of own individual effort at Stevenson 2006 2007 2008 2009 2010 exceptional 25% 25% 25% 26% 26% above average 38 42 41 41 41 average 29 26 27 26 25 minimal 8 7 7 7 8 Student perception of growth in responsibility for learning through high school 2006 2007 2008 2009 2010 positive 88% 91% 90% 87% 92% negative 12 9 10 13 8 Satisfaction with academic planning and course selection assistance from counselors 2006 2007 2008 2009 2010 positive 81% 86% 84% 87% 88% negative 19 14 16 13 12
42
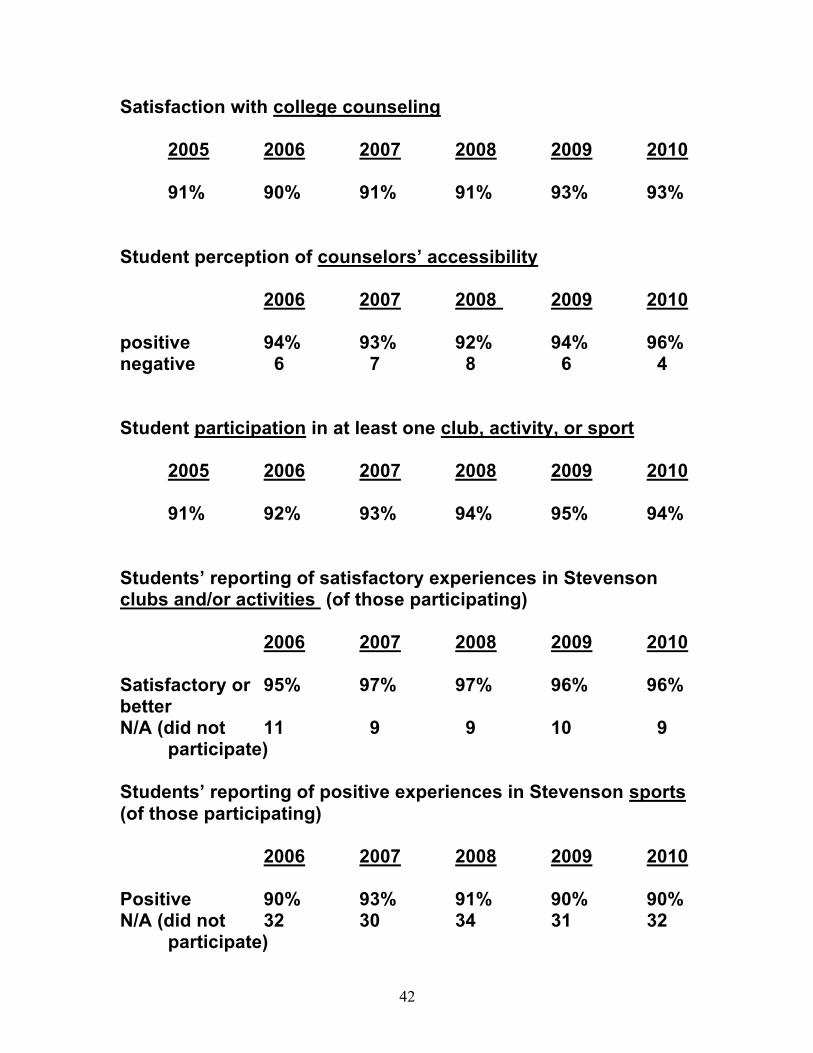
Satisfaction with college counseling 2005 2006 2007 2008 2009 2010 91% 90% 91% 91% 93% 93% Student perception of counselors’ accessibility 2006 2007 2008 2009 2010 positive 94% 93% 92% 94% 96% negative 6 7 8 6 4 Student participation in at least one club, activity, or sport 2005 2006 2007 2008 2009 2010 91% 92% 93% 94% 95% 94% Students’ reporting of satisfactory experiences in Stevenson clubs and/or activities (of those participating) 2006 2007 2008 2009 2010 Satisfactory or 95% 97% 97% 96% 96% better N/A (did not 11 9 9 10 9 participate) Students’ reporting of positive experiences in Stevenson sports (of those participating) 2006 2007 2008 2009 2010 Positive 90% 93% 91% 90% 90% N/A (did not 32 30 34 31 32 participate)
43
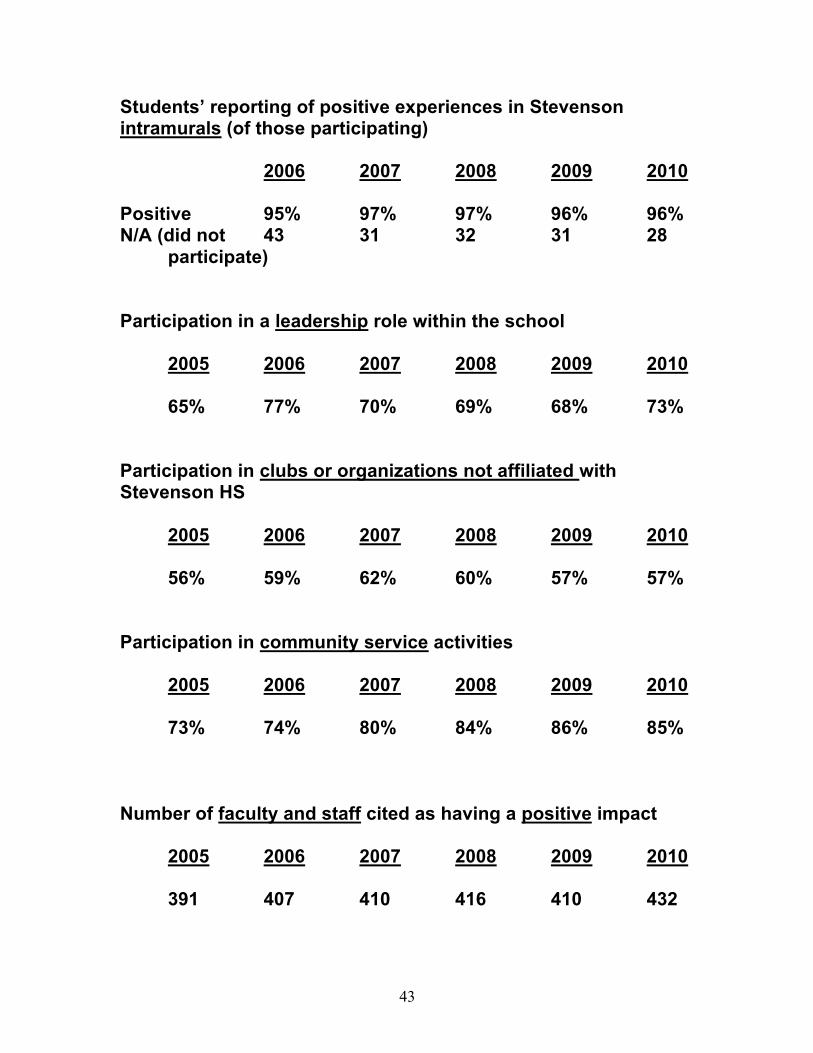
Students’ reporting of positive experiences in Stevenson intramurals (of those participating) 2006 2007 2008 2009 2010 Positive 95% 97% 97% 96% 96% N/A (did not 43 31 32 31 28 participate) Participation in a leadership role within the school
2005 2006 2007 2008 2009 2010 65% 77% 70% 69% 68% 73% Participation in clubs or organizations not affiliated with Stevenson HS 2005 2006 2007 2008 2009 2010 56% 59% 62% 60% 57% 57% Participation in community service activities 2005 2006 2007 2008 2009 2010 73% 74% 80% 84% 86% 85% Number of faculty and staff cited as having a positive impact 2005 2006 2007 2008 2009 2010 391 407 410 416 410 432
44
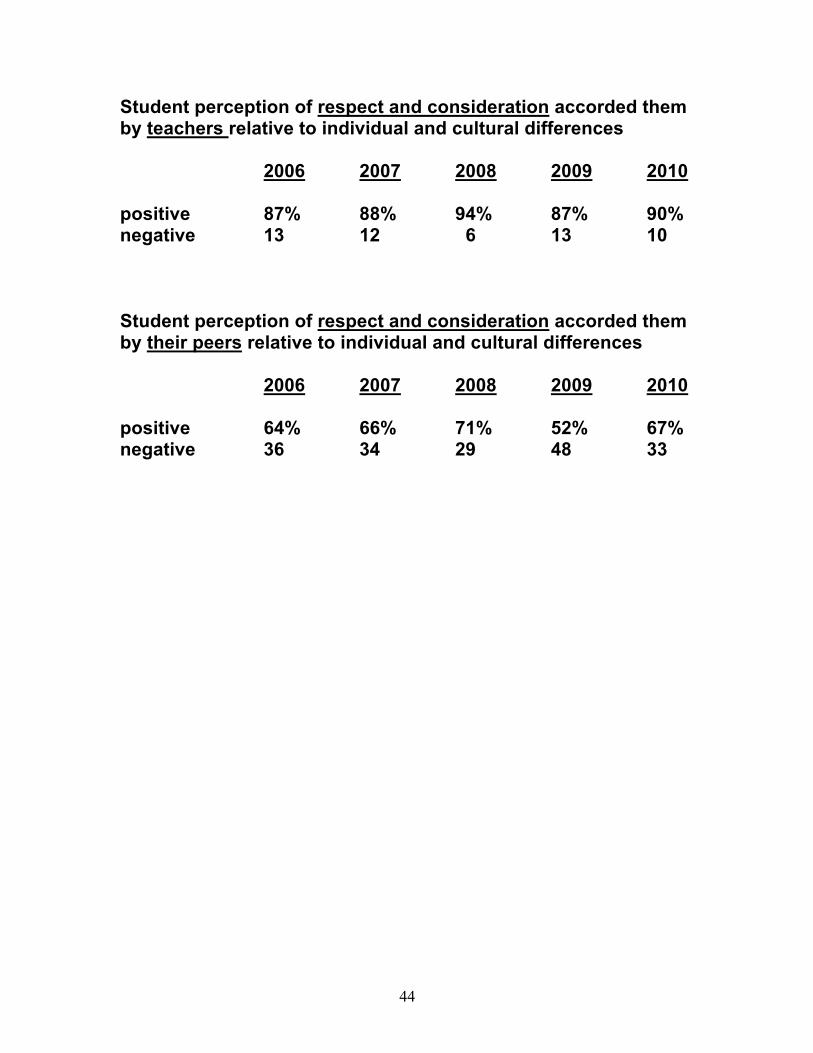
Student perception of respect and consideration accorded them by teachers relative to individual and cultural differences 2006 2007 2008 2009 2010 positive 87% 88% 94% 87% 90% negative 13 12 6 13 10 Student perception of respect and consideration accorded them by their peers relative to individual and cultural differences 2006 2007 2008 2009 2010 positive 64% 66% 71% 52% 67% negative 36 34 29 48 33
45
Summary of Longitudinal Senior Exit Data
Senior exit data has been collected and recorded for over 15 years; however, some survey items have been amended or added during that time. This summary examines and highlights the changes and trends that have been gleaned from the experiences and perceptions of Stevenson’s seniors over the past seven years. The number of seniors reporting that they have attended Stevenson for a full four years remains high, reflecting past historical trends and staying the same as the previous year (91%). It should be noted that this figure does not reflect a 9 percent mobility rate because those students who leave before completing senior year are not included in this survey. Stevenson students continue to feel that they are working diligently. Since 2001, more than six out of ten students have described their individual effort as being “above average” or “exceptional,” echoing the current survey’s data (67%). As a point of comparison, in 1993, a smaller number of seniors, or less than half of all Stevenson students, viewed their effort as “above average” (38%) or “exceptional” (11%). However, recent data has supported the belief that an ever-increasing number of students are challenging themselves academically. For the second year in a row, just a little over one quarter of seniors (26%) described their effort level as “exceptional.” The largest majority described their effort level as “above average” (41%). Moreover, the number of students describing their effort level as “above average” remained the same compared to last year’s results (41%). These slight increases support the continued practice of recent efforts to assess the amount of stress incurred among Stevenson students, even though since 2002, just about one third of students have consistently described their individual effort as average. Current data depicts a slight decline from previous years, with one quarter of students describing their effort as average (25%). Students who describe themselves as exerting a minimal effort (8%), remain a low percentage; however, that increased by one point this year. The percentage of respondents who have described their high school effort as minimal has remained fairly constant over the years, fluctuating between 7-10 percent of the student population. Growth in responsibility for learning throughout high school has remained strong and constant over the past few years, and even increased by five points since the previous year’s survey (92%). This is an all-time high score.
46
Satisfaction with academic counseling, such as receiving course selection assistance from counselors, increased by one point from the previous year (88%) depicting an all-time high. Over the past decade, counselors’ caseloads have gradually increased from roughly 285 students per counselor to 315 students. However, administrative retooling within Student Services, as well as an expected decrease in enrollment, should eventually reduce the size of caseloads. Hopefully, counselors will be able to provide more individualized attention during the course selection process. Student satisfaction with college counseling has remained affirmative and constant over the years. For the past decade, at least nine out of ten students have responded that they are satisfied with college counseling. In comparison to last year, the number of satisfied students remained constant (93%). Most importantly, satisfaction levels remain considerably higher than those experienced early in the 1990s (77%-84%). The high level of satisfaction with college counseling likely reflects an extensive, thorough and varied college counseling program that is constantly endeavoring to evaluate current trends and to improve their services. The perception of counselor accessibility has remained constant, barely changing over the past five years. The current survey reveals an increase of two percentage points since last year (96%) and this matches the highest number posted in 1999 (96%). The current percentage also represents a vast improvement from ten years ago (69%). These gains in accessibility are gratifying considering the significant increase in schedule change traffic at the beginning of each semester. Counselors have worked to craft ways to increase accessibility during times of high student need. Student participation in at least one co-curricular activity has remained one of the most consistent survey statistics. This year the reported participation rate dropped one point, but still remains very high (95%). In contrast in 1993, only 74 percent of respondents were participating in clubs and/or activities. Predictably, this percentage of participation falls within a narrow band of four points that has ranged 90-93 percent for the past 12 years. Satisfaction levels for club and/or activities have also shown very little deviation over the years; in fact, between 2003 and 2006, or for four years, 95 percent of respondents reported that they were satisfied with their experiences in Stevenson clubs and/or activities. The current survey closely mirrors last year’s satisfaction results (96%). From 2007-2008 the satisfaction level was at 97 percent, which was the highest reported percentage of any survey, so a one-point decrease is still close to the all-time high. Positive experiences for athletic participants have wavered from 1996’s high of 95 percent to a low of 84 percent in 2001. This year’s satisfaction level remained the same (90%), still
47
sustaining a healthy trend of improvement. Students’ rate of participation in sports has decreased by one point (68%). The intramural program has maintained a high rate of participation (72%) and even increased three percentage points from last year’s results. Before 2007, the level of participation in intramural programs was much lower than the past two years (2004=48%, 2005=56%, 2006=57%). The intramural program also managed to maintain lofty satisfaction levels, posting similar results from last year’s survey (96%).
The percentage of students who identify themselves as playing a role in school leadership has remained relatively high this year, and even increased by five percentage points from last year’s results (73%). This means that slightly more than seven out of ten respondents of 2010 graduates claim to have held a leadership role (73%), which is the second highest percentage ever reported. Once again, participation in a leadership role was determined by offering students choices from a menu of school leadership activities. We should be cognizant of striving to provide leadership opportunities for students, especially in light of demonstrated interest. Furthermore, universities continue to report that students who can demonstrate leadership experience may enjoy a slight advantage in the competitive college admissions arena.
Given the extensive involvement of Stevenson students in academics and extracurricular activities, it is gratifying that so many individuals make time for community service, even though there was a one-point decline from last year (85%). The number of Stevenson seniors participating in clubs and organizations outside the school domain posted the same results as last year (57%), and this signifies that almost six out of ten seniors are pursuing opportunities outside of the school setting. These impressive statistics show that Stevenson instills in its students a dedication and desire to give back to the community. The number of faculty and staff named as having a positive influence on students has risen dramatically from 144 individuals in 1992 to this year’s number of 432, which happens to be 22 individuals more than last year’s results. This is by far a record number of faculty listed. Even though the composition of staff changes yearly, the number of cited teachers continues to increase. Genuine interest in students and inspirational teaching are themes that continually repeat themselves year after year in the student comment section of the Senior Exit Survey. Positive feedback has not been limited to teachers. Non-teaching staff who serve in a multitude of roles are named with frequency and with
48
commensurate amounts of enthusiasm. Relative to individual and cultural differences, respect and consideration accorded by teachers to students has historically remained steady; this year there was a three-point increase (90%). When asked the same question in terms of students treating one another with respect regardless of their differences, current respondents report a 15 percent increase from last year’s record low scores (67%). This is only four points lower than the all time high of 71 percent. In summary, graduates of 2010 surpassed milestones described by other seniors in four categories: record high satisfaction levels with academic planning and course assistance from counselors (88%); record high perception of growth in responsibility for learning through high school (92%); record high student’s perception of counselor’s accessibility (96%); record high participation in a leadership role (73%); and record high number of faculty and staff listed as having a positive impact. As cited above, in this current survey there were four categories that reached all-time high percentages. This shows that SHS students are continually striving for excellence. Students also continue to articulate unequivocal regard and appreciation for the devotion of Stevenson faculty and staff. While there were five categories that showed slight declines, this year’s senior class either reported very similar responses to the year’s previous group, or reported record numbers of satisfaction and participation.
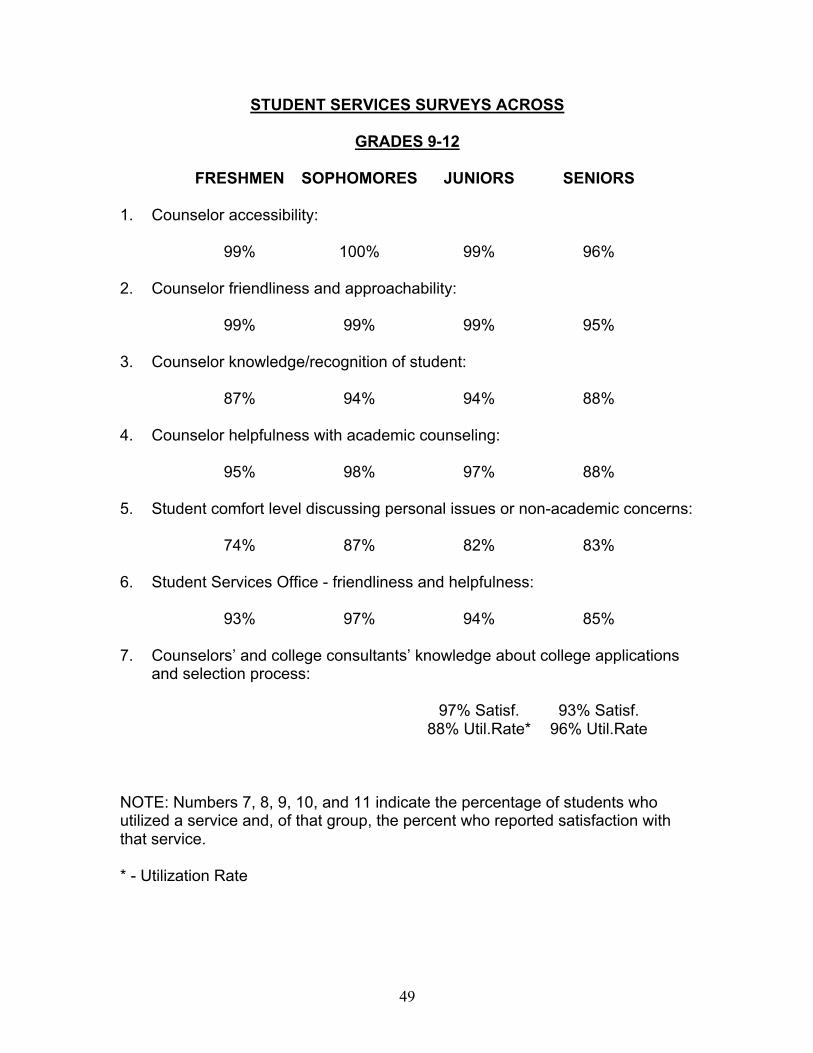
49
STUDENT SERVICES SURVEYS ACROSS
GRADES 9-12
FRESHMEN SOPHOMORES JUNIORS SENIORS
1. Counselor accessibility: 99% 100% 99% 96% 2. Counselor friendliness and approachability: 99% 99% 99% 95% 3. Counselor knowledge/recognition of student: 87% 94% 94% 88% 4. Counselor helpfulness with academic counseling: 95% 98% 97% 88% 5. Student comfort level discussing personal issues or non-academic concerns: 74% 87% 82% 83% 6. Student Services Office - friendliness and helpfulness: 93% 97% 94% 85% 7. Counselors’ and college consultants’ knowledge about college applications
and selection process: 97% Satisf. 93% Satisf. 88% Util.Rate* 96% Util.Rate NOTE: Numbers 7, 8, 9, 10, and 11 indicate the percentage of students who utilized a service and, of that group, the percent who reported satisfaction with that service. * - Utilization Rate
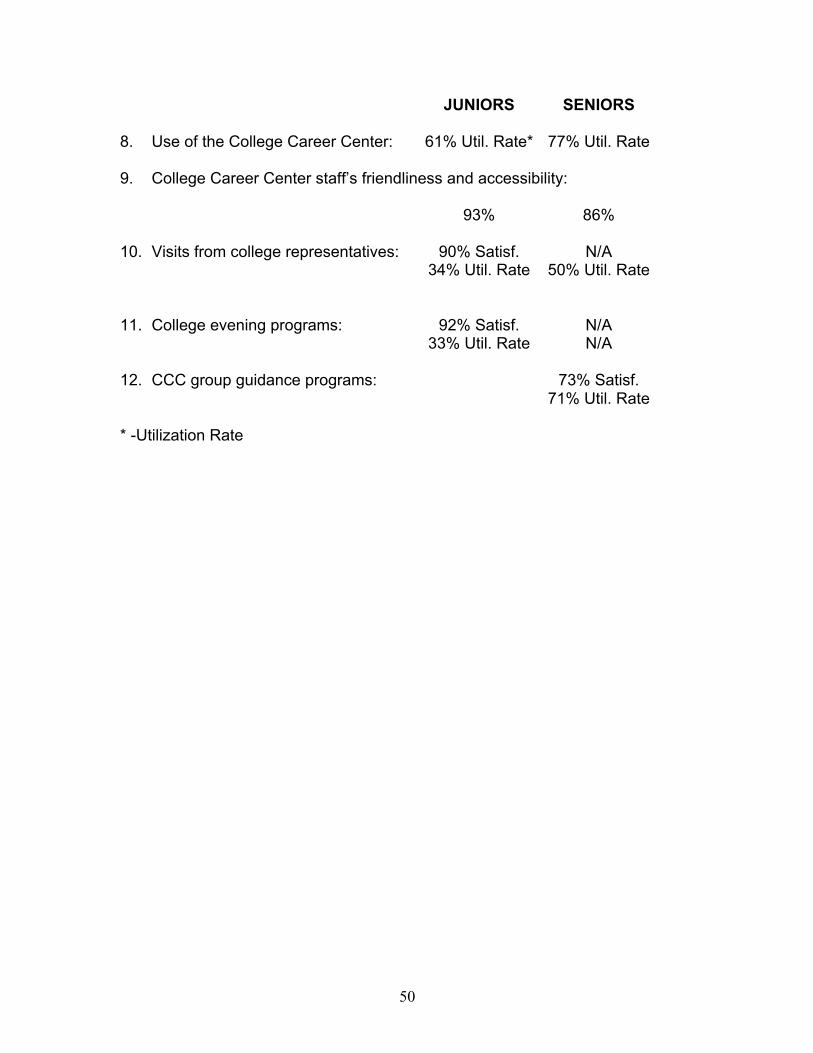
50
JUNIORS SENIORS
8. Use of the College Career Center: 61% Util. Rate* 77% Util. Rate 9. College Career Center staff’s friendliness and accessibility: 93% 86% 10. Visits from college representatives: 90% Satisf. N/A 34% Util. Rate 50% Util. Rate 11. College evening programs: 92% Satisf. N/A 33% Util. Rate N/A 12. CCC group guidance programs: 73% Satisf. 71% Util. Rate * -Utilization Rate
51
Comparison of Student Services Survey - Grades 9-12 Once again, there is little variation between this year’s survey results and data from previous years when comparing responses of freshmen, sophomores, juniors, and seniors in regard to satisfaction with counselors and their accompanying services. Students in each class overwhelmingly view counselors as available, friendly, and open to interaction with students. As reported by students of all four grade levels, counselor accessibility, friendliness, and approachability continue to soar above levels of 90 percent. Almost all freshmen (99%), sophomores (100%), and juniors (99%) agree that counselors are friendly and accessible, while a large majority of seniors concur (96%). Knowledge and recognition of students follow close behind in the upper eighties to mid-nineties among freshmen (87%), sophomores (94%), juniors (94%), and seniors (88%). Counselors are also perceived to be helpful with academic counseling among freshmen (95%), sophomores (98%), juniors (97%), and seniors (88%). These numbers closely resemble trends that were illustrated the previous school year. Relative to comfort levels when discussing personal issues, just about seven out of ten freshmen (74%), sophomores (87%), and juniors (82%) do feel comfortable about discussing non-academic concerns with counselors. These results are somewhat lower than the previous year, with the comfort level of freshmen posting a decrease of 14 percentage points and sophomores posting a decrease of 3 percentage points. This year, seniors (83%) are more inclined than previous years to discuss non-academic concerns; an 18 point increase. Five years ago, over 100 polled seniors revealed that friends, and then teachers, become the preferred sources of assistance for personal problems due to the familiarity that is created by day-to-day contact.
Students are surveyed regarding the friendliness and helpfulness of Student Services personnel. The office is staffed with counselors, deans, social workers, student support team coordinators, and secretaries. Although students may visit the office on their own accord, others are summoned for various reasons (such as disciplinary infractions). Current student satisfaction rates closely resemble the previous year’s percentages, with freshmen showing a four-point decrease in satisfaction levels (93%). Sophomores are a bit more satisfied (97%), and nine out of ten juniors (94%) agree that the Student Services staff is helpful. All three groups’ satisfaction levels have surpassed the nineties. Senior satisfaction remains lower than the other groups, which is a consistent trend (85%); however, this did increase by eight percentage points. Maintaining counseling relationships with juniors and seniors as they progress through the college admissions process continues to be a priority of
52
Student Services personnel. Juniors and seniors were queried about their levels of satisfaction and utilization in five areas of college counseling. Survey results regarding college admissions counseling closely mirror the previous year’s findings. When compared to seniors, juniors expressed higher degrees of satisfaction in conjunction with less usage. Satisfaction levels remain extremely high for juniors (97%) and seniors (93%) who choose to tap the knowledge base of counselors and college consultants. Juniors check in at an 88 percent utilization rate, while seniors log in at 96 percent, closely resembling the previous year’s rate of usage. Sixty-one percent of juniors indicate that they had used the College/Career Center by the end of first semester; by the conclusion of senior year, usage rose to 77 percent. These numbers illustrate a slight decrease in the percentage of junior students who are utilizing services of the College/Career Center, declining eight points. Bear in mind that some students feel confident in their choices and do not feel compelled to research further. The vast majority of juniors (93%) and seniors (86%) who have chosen to use the CCC find it to be friendly and accessible. This satisfaction rate depicts a slight increase for seniors from the previous year’s survey.
Seniors (50%) outpace juniors (34%) when it comes to meeting with college representatives who are visiting Stevenson. Compared to the previous year, senior attendance rate has remained fairly consistent while junior attendance rate has decreased eight percentage points. Based on the changing college career center curriculum and focus, we did not elicit the senior’s satisfaction levels with college rep visits or college evening programs. We did find that 90 percent of juniors thought college rep visits were helpful and even more (92%) were satisfied with the college evening programs. We did ask a new question this year to try and gauge whether students are satisfied with the ever- increasing CCC group guidance programs during the school day. Almost three quarters (73%) of the seniors were satisfied with these informational meetings; whereas only 71 percent claim they have utilized these programs. In addition to soliciting input from students via surveys, personnel of Student Services internally evaluate its programs and services on a continual basis. Identifying needs and adapting practices have long been integral to the mission of Student Services.
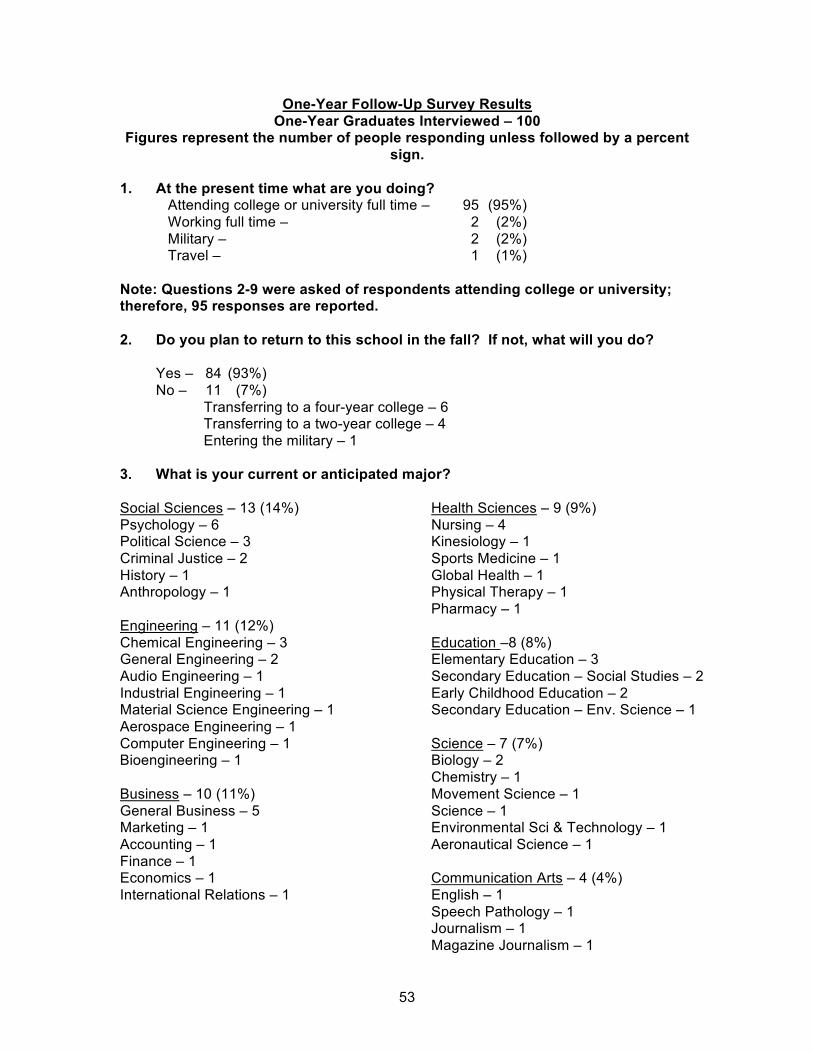
53
One-Year Follow-Up Survey Results
One-Year Graduates Interviewed – 100 Figures represent the number of people responding unless followed by a percent
sign.
1. At the present time what are you doing? Attending college or university full time – 95 (95%)
Working full time – 2 (2%)
Military – 2 (2%) Travel – 1 (1%)
Note: Questions 2-9 were asked of respondents attending college or university; therefore, 95 responses are reported.
2. Do you plan to return to this school in the fall? If not, what will you do?
Yes – 84 (93%)
No – 11 (7%)
Transferring to a four-year college – 6 Transferring to a two-year college – 4
Entering the military – 1
3. What is your current or anticipated major?
Social Sciences – 13 (14%)
Psychology – 6 Political Science – 3
Criminal Justice – 2
History – 1 Anthropology – 1
Engineering – 11 (12%)
Chemical Engineering – 3 General Engineering – 2
Audio Engineering – 1
Industrial Engineering – 1 Material Science Engineering – 1
Aerospace Engineering – 1
Computer Engineering – 1 Bioengineering – 1
Business – 10 (11%)
General Business – 5 Marketing – 1
Accounting – 1
Finance – 1 Economics – 1
International Relations – 1
Health Sciences – 9 (9%)
Nursing – 4 Kinesiology – 1
Sports Medicine – 1
Global Health – 1 Physical Therapy – 1
Pharmacy – 1
Education –8 (8%) Elementary Education – 3
Secondary Education – Social Studies – 2
Early Childhood Education – 2 Secondary Education – Env. Science – 1
Science – 7 (7%) Biology – 2
Chemistry – 1
Movement Science – 1
Science – 1 Environmental Sci & Technology – 1
Aeronautical Science – 1
Communication Arts – 4 (4%)
English – 1
Speech Pathology – 1 Journalism – 1
Magazine Journalism – 1
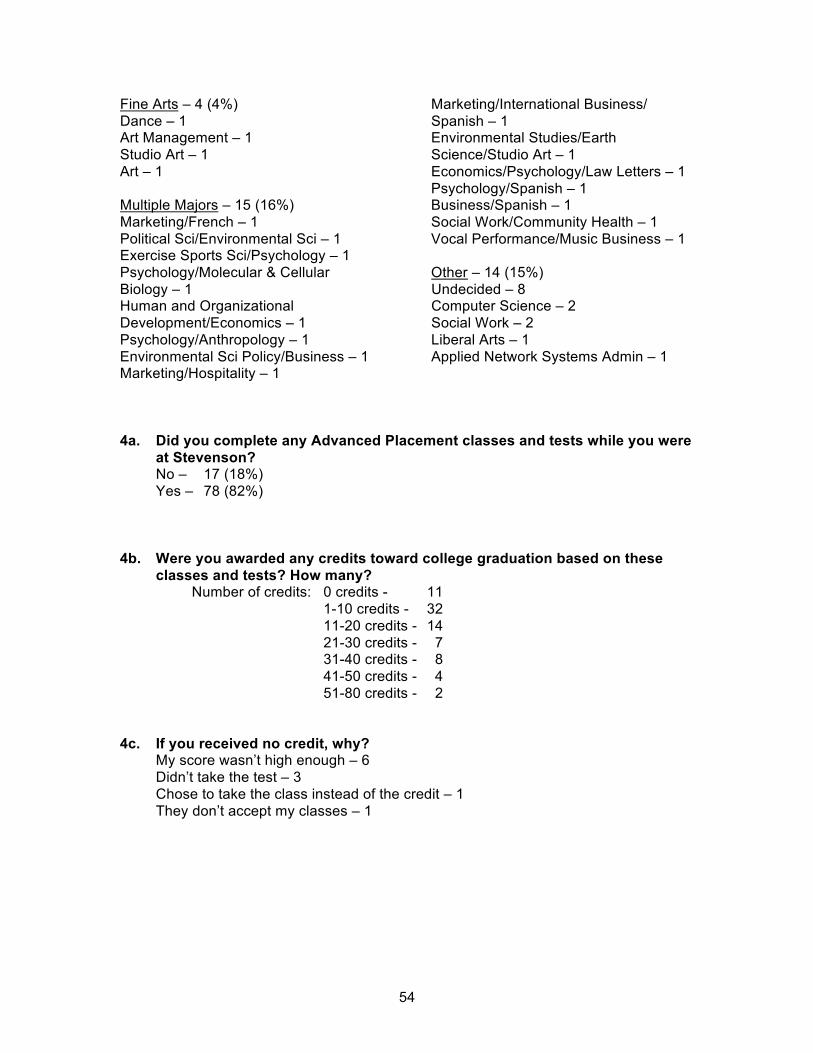
54
Fine Arts – 4 (4%)
Dance – 1 Art Management – 1
Studio Art – 1
Art – 1
Multiple Majors – 15 (16%)
Marketing/French – 1
Political Sci/Environmental Sci – 1 Exercise Sports Sci/Psychology – 1
Psychology/Molecular & Cellular
Biology – 1 Human and Organizational
Development/Economics – 1
Psychology/Anthropology – 1
Environmental Sci Policy/Business – 1 Marketing/Hospitality – 1
Marketing/International Business/
Spanish – 1 Environmental Studies/Earth
Science/Studio Art – 1
Economics/Psychology/Law Letters – 1
Psychology/Spanish – 1 Business/Spanish – 1
Social Work/Community Health – 1
Vocal Performance/Music Business – 1
Other – 14 (15%)
Undecided – 8 Computer Science – 2
Social Work – 2
Liberal Arts – 1
Applied Network Systems Admin – 1
4a. Did you complete any Advanced Placement classes and tests while you were
at Stevenson? No – 17 (18%)
Yes – 78 (82%)
4b. Were you awarded any credits toward college graduation based on these
classes and tests? How many? Number of credits: 0 credits - 11
1-10 credits - 32
11-20 credits - 14
21-30 credits - 7 31-40 credits - 8
41-50 credits - 4
51-80 credits - 2
4c. If you received no credit, why? My score wasn’t high enough – 6
Didn’t take the test – 3
Chose to take the class instead of the credit – 1
They don’t accept my classes – 1
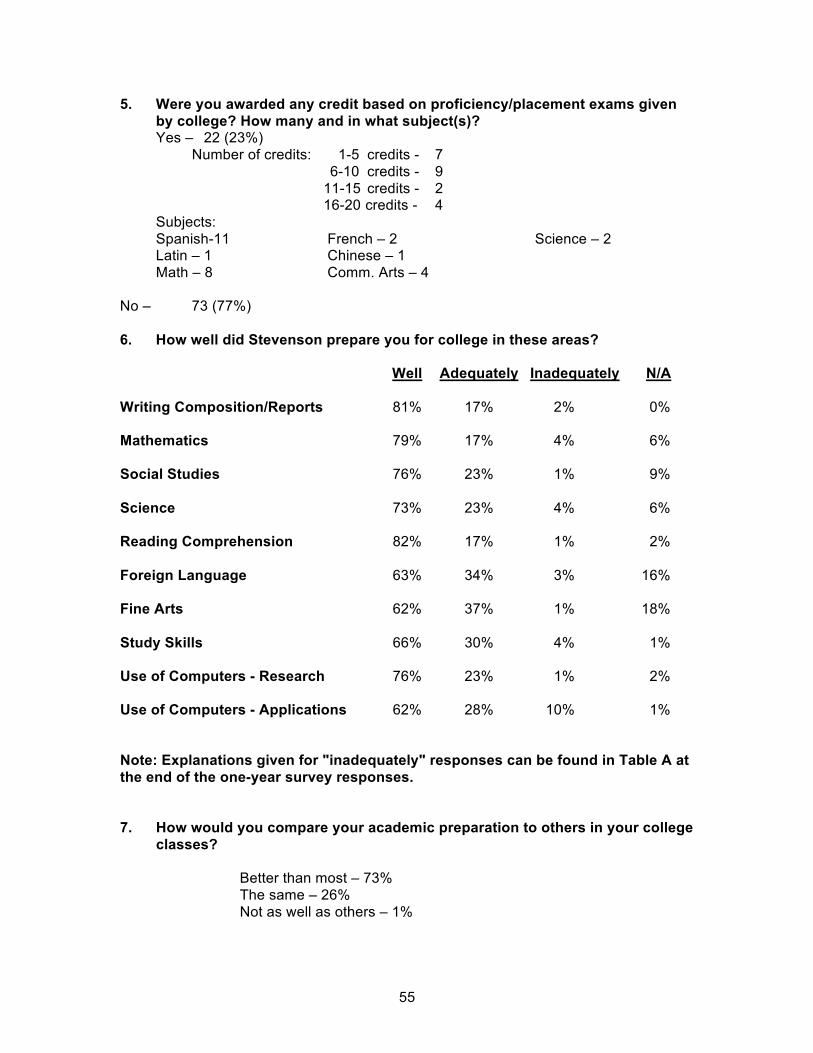
55
5. Were you awarded any credit based on proficiency/placement exams given
by college? How many and in what subject(s)? Yes – 22 (23%)
Number of credits: 1-5 credits - 7
6-10 credits - 9
11-15 credits - 2 16-20 credits - 4
Subjects:
Spanish-11 Latin – 1
Math – 8
French – 2 Chinese – 1
Comm. Arts – 4
Science – 2
No – 73 (77%)
6. How well did Stevenson prepare you for college in these areas?
Well Adequately Inadequately N/A
Writing Composition/Reports 81% 17% 2% 0%
Mathematics 79% 17% 4% 6%
Social Studies 76% 23% 1% 9%
Science 73% 23% 4% 6%
Reading Comprehension 82% 17% 1% 2%
Foreign Language 63% 34% 3% 16%
Fine Arts 62% 37% 1% 18%
Study Skills 66% 30% 4% 1%
Use of Computers - Research 76% 23% 1% 2%
Use of Computers - Applications 62% 28% 10% 1%
Note: Explanations given for "inadequately" responses can be found in Table A at
the end of the one-year survey responses.
7. How would you compare your academic preparation to others in your college
classes?
Better than most – 73%
The same – 26%
Not as well as others – 1%
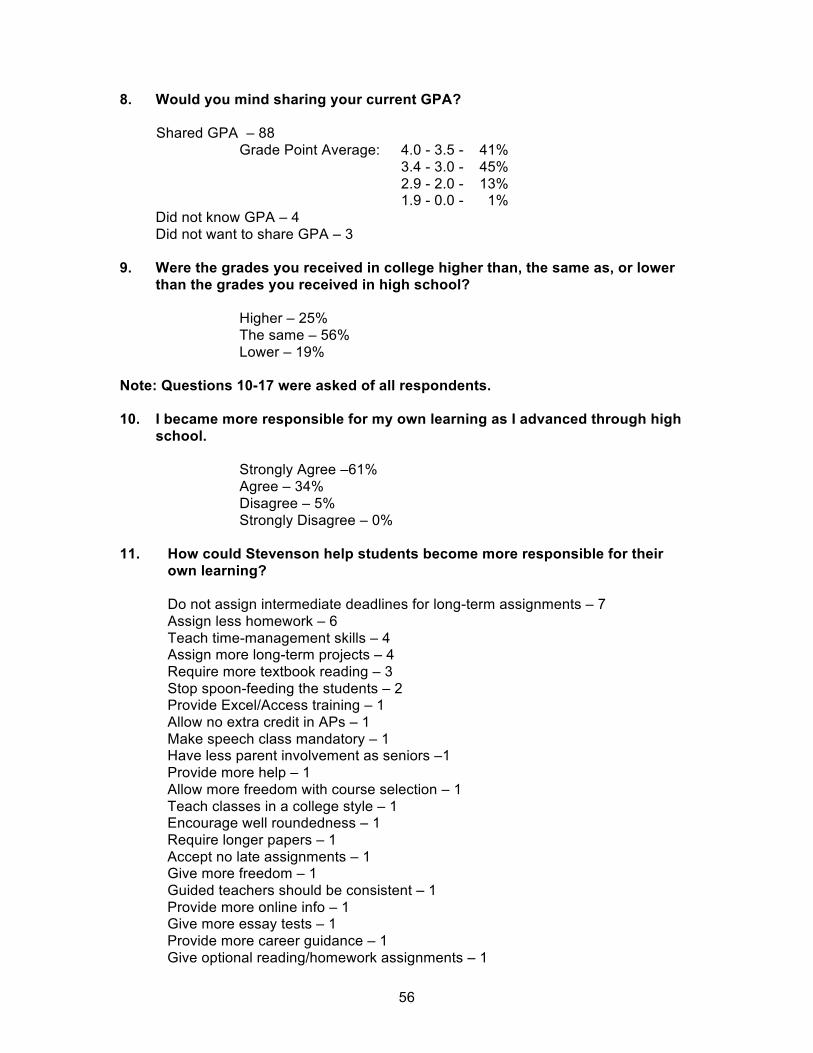
56
8. Would you mind sharing your current GPA?
Shared GPA – 88
Grade Point Average: 4.0 - 3.5 - 41%
3.4 - 3.0 - 45%
2.9 - 2.0 - 13% 1.9 - 0.0 - 1%
Did not know GPA – 4
Did not want to share GPA – 3
9. Were the grades you received in college higher than, the same as, or lower
than the grades you received in high school?
Higher – 25%
The same – 56%
Lower – 19%
Note: Questions 10-17 were asked of all respondents.
10. I became more responsible for my own learning as I advanced through high
school.
Strongly Agree –61%
Agree – 34%
Disagree – 5%
Strongly Disagree – 0%
11. How could Stevenson help students become more responsible for their
own learning?
Do not assign intermediate deadlines for long-term assignments – 7
Assign less homework – 6
Teach time-management skills – 4 Assign more long-term projects – 4
Require more textbook reading – 3
Stop spoon-feeding the students – 2 Provide Excel/Access training – 1
Allow no extra credit in APs – 1
Make speech class mandatory – 1 Have less parent involvement as seniors –1
Provide more help – 1
Allow more freedom with course selection – 1
Teach classes in a college style – 1 Encourage well roundedness – 1
Require longer papers – 1
Accept no late assignments – 1 Give more freedom – 1
Guided teachers should be consistent – 1
Provide more online info – 1 Give more essay tests – 1
Provide more career guidance – 1
Give optional reading/homework assignments – 1

57
Assign more research – 1
Create less stress – 1 Standardize grammar/word choice (APA)– 1
Nothing -- 55
12. Do you feel the counseling department assisted you with your post-secondary plans?
Yes – 82% No – 18%
13. Looking back, would you say the discipline at Stevenson was:
Too strict – 45%
About right – 53%
Not strict enough – 2%
Note: Questions 14 & 15 are reported in the frequency of a particular sentiment.
14. If you could change one aspect of your high school experience, what would
it be?
Become more involved – 19
Take more APs – 8
Have fewer rules and consequences – 5
Study more/try harder – 5 Play sports – 3
Socialize sooner – 2
Change the cell phone policy – 2 Take Teaching Young Children for two years – 1
Take Art earlier – 1
Be nicer to security guards – 1
Take more electives – 1 Get rid of half-period lunches – 1
Take AP Chemistry not AP Biology – 1
Take more sports – 1 Have less homework – 1
Have fewer exams – 1
Have different coaches – 1 Get more gap year info – 1
Take Tech two years – 1
Get more college help – 1
Take different classes – 1 Take Art History – 1
Have an honor system – 1
Have less pressure – 1 Procrastinate less – 1
Go to a different high school – 1
Have more fun – 1 Have less cliques – 1
Study abroad (summer) – 1
Have a more understanding staff – 1
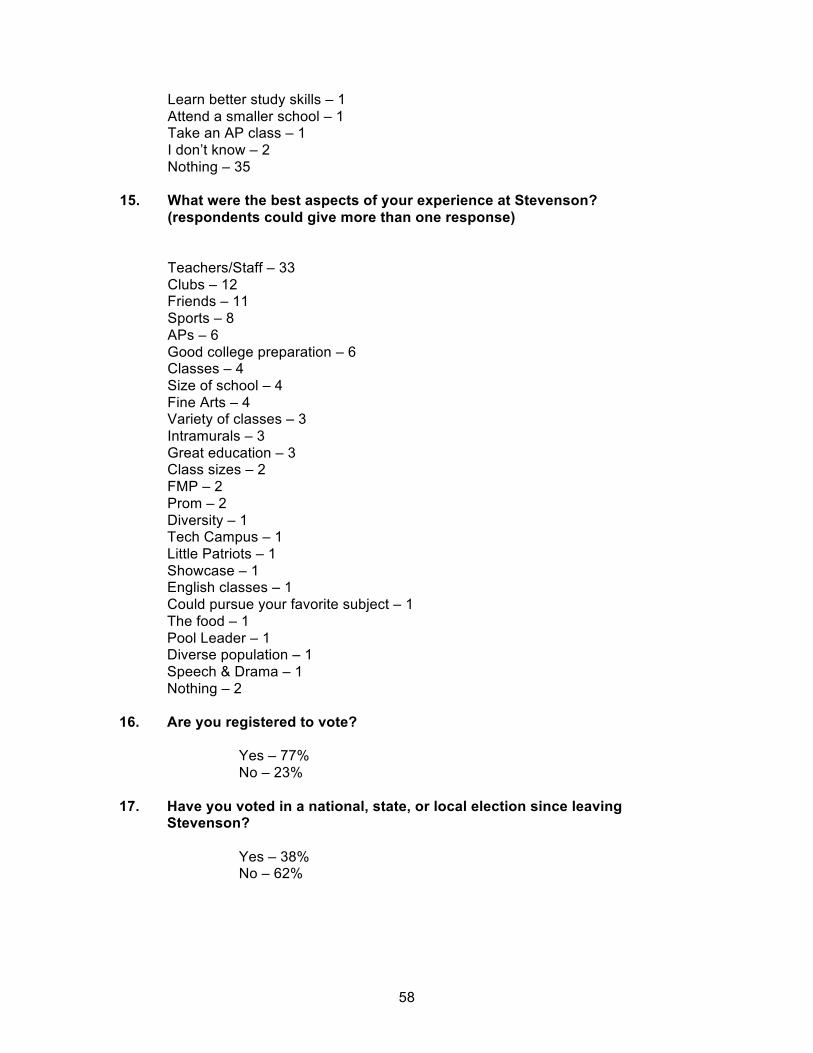
58
Learn better study skills – 1
Attend a smaller school – 1 Take an AP class – 1
I don’t know – 2
Nothing – 35
15. What were the best aspects of your experience at Stevenson?
(respondents could give more than one response)
Teachers/Staff – 33
Clubs – 12 Friends – 11
Sports – 8
APs – 6
Good college preparation – 6 Classes – 4
Size of school – 4
Fine Arts – 4 Variety of classes – 3
Intramurals – 3
Great education – 3 Class sizes – 2
FMP – 2
Prom – 2
Diversity – 1 Tech Campus – 1
Little Patriots – 1
Showcase – 1 English classes – 1
Could pursue your favorite subject – 1
The food – 1
Pool Leader – 1 Diverse population – 1
Speech & Drama – 1
Nothing – 2
16. Are you registered to vote?
Yes – 77%
No – 23%
17. Have you voted in a national, state, or local election since leaving Stevenson?
Yes – 38% No – 62%
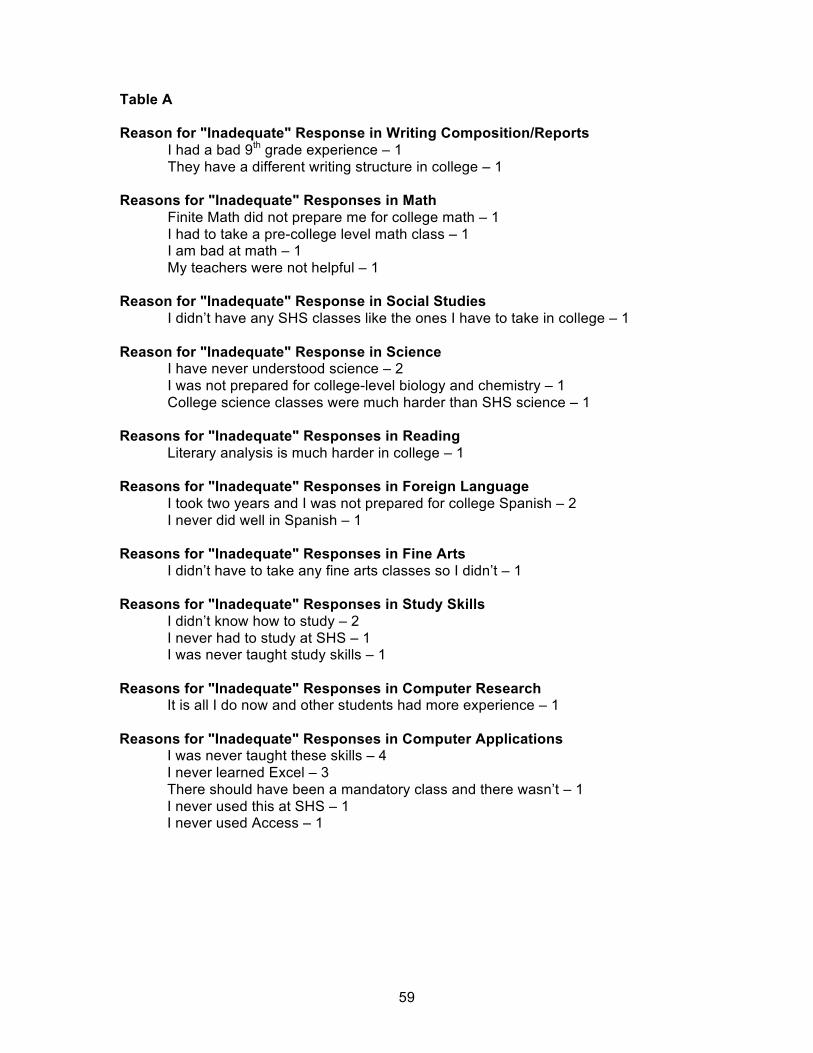
59
Table A
Reason for "Inadequate" Response in Writing Composition/Reports
I had a bad 9th grade experience – 1
They have a different writing structure in college – 1
Reasons for "Inadequate" Responses in Math
Finite Math did not prepare me for college math – 1
I had to take a pre-college level math class – 1 I am bad at math – 1
My teachers were not helpful – 1
Reason for "Inadequate" Response in Social Studies
I didn’t have any SHS classes like the ones I have to take in college – 1
Reason for "Inadequate" Response in Science I have never understood science – 2
I was not prepared for college-level biology and chemistry – 1
College science classes were much harder than SHS science – 1
Reasons for "Inadequate" Responses in Reading
Literary analysis is much harder in college – 1
Reasons for "Inadequate" Responses in Foreign Language
I took two years and I was not prepared for college Spanish – 2
I never did well in Spanish – 1
Reasons for "Inadequate" Responses in Fine Arts
I didn’t have to take any fine arts classes so I didn’t – 1
Reasons for "Inadequate" Responses in Study Skills
I didn’t know how to study – 2
I never had to study at SHS – 1 I was never taught study skills – 1
Reasons for "Inadequate" Responses in Computer Research It is all I do now and other students had more experience – 1
Reasons for "Inadequate" Responses in Computer Applications I was never taught these skills – 4
I never learned Excel – 3
There should have been a mandatory class and there wasn’t – 1
I never used this at SHS – 1 I never used Access – 1
60
One-Year Follow-Up Survey Summary
Data for this year’s survey was garnered from telephone interviews with 100 randomly selected 2009 Stevenson graduates. The purpose of the one-year follow-up is to ascertain the activities of students one year after graduation, to question them about their readiness for college-level work, and to gauge their perception of their Stevenson experience after accruing a year’s worth of post- secondary perspective. The vast majority of 2009 graduates declare that they are attending college full time (95%); however, that is actually two percentage points lower than the previous year’s sample. Two students are employed full-time (2%), and two students are in the military (2%). A large majority of individuals attending college plan to return to the same school in the fall (93%), while some are thinking of changing their plans by either transferring to another four-year college (6%) or transferring to a two-year college (4%). When asked about courses of study, the largest reported category is now multiple majors (16%). This increased by 5 percent from last year’s respondents. When looking at individual majors, social sciences is the most popular with 14 percent of the respondents declaring this as their educational path. The popularity in social sciences increased by 7 percent this year, beating out business (11%), which was the most popular major last year. After social sciences, the identified majors in order of popularity are: engineering (12%), business (11%), health sciences (9%), education (8%), science (7%), communication arts (4%), and fine arts (4%). These results are somewhat similar to last year’s reports, with the exception of business, which dropped from the popular major (28%) to third most popular major (11%). Education continues to decrease in popularity. Two years ago it was the most popular major, last year it was second most popular, and this year it falls to fifth most popular. In addition, more students are reporting that they are in the “other” category (15%); this includes undecided, liberal arts, computer science, etc. This year’s sample of students cited a 10 percent increase in participation rate in AP classes as compared to last year’s senior class (82%). Are students earning credit towards college graduation while in high school? The large majority (86%) of AP participants declare that they have earned credit; this is a 5 percent increase from last year’s respondents. Out of the 86 percent of students who received credit, 35 of them earned more than ten credits. Of the 11 students who did not receive credit, 6 students said that they had earned scores that fell below the criteria set by the college and three students didn’t take the test. Many respondents (23%) report earning additional credit by way of college proficiency exams. Graduates were awarded credit in world languages (15), math (8), communication arts (4), and science (2).
61
Recent graduates were asked to answer whether they felt that Stevenson had prepared them for college in different academic areas. Lofty satisfaction levels of 95 percent or higher were achieved in nine of the ten areas and skills polled, with the exception of use of computers-applications. Four subject areas reached near perfect percentages including social studies (99%), reading comprehension (99%), fine arts (99%), and use of computers-research (99%). These areas were followed closely by writing comprehension/reports (98%), foreign language (97%), mathematics (96%), science (96%), and study skills (96%). Almost three quarters (73%) of one-year respondents said the skills and knowledge that they acquired in high school were greater than that of their college classmates. This is a seven-point increase from the previous year. While some students consistently report that they are equally prepared (26%), it is worthwhile to note that only one person stated he/she felt less prepared than his or her college peers. Of the number of one-year grads (88) that knew or were willing to share grade point average information, the majority (86%) reported college GPA’s of “B” or better. This constitutes a 5 percent decrease from last year’s results. A slightly smaller percentage of students (81%) indicated that their college grades were the same or better than what they had earned at Stevenson. This statistic went up eight percentage points from last year.
A large majority of the sample (95%) responded affirmatively when queried whether they had become more responsible for their own learning as they advanced through high school. This statistic decreased 4 percent from last year’s results. When asked how Stevenson could better foster responsibility, the most frequent response by far was “nothing” (55%). This depicted a five-point decrease. Leading the list of suggestions agreed upon by three students or more are: do not assign intermediate deadlines for long-term assignments (7), give less homework (6), teach time management (4), and assign more long-term projects (4). In comparison to the previous year’s survey, there are few similarities of responses, although both groups have agreed that assigning less homework and more long-term assignments would be a viable manner to foster responsibility.
Looking back, more than three quarters (82%) of one-year graduates related that they had received assistance from their counselors with post-secondary plans. This posts an increase of 1 percent from the previous year. A little more than half of respondents felt discipline was maintained at an appropriate level (53%), while a similar percentage described it as “too strict” (45%). Two students reported that discipline is “not strict enough” (2%). Satisfaction levels on this question have vacillated significantly over the past few years. Current results show an eight-point decrease in describing discipline as being “too strict.” This is the first time in two years this statistic has dropped. When the sample group was asked what one aspect of their high school experience they would change, the most frequent response was “nothing” (35), closely agreeing with the previous sample of graduates. The second most
62
frequent response was getting more involved (19). Other common responses include taking more APs (8), less rules and consequences (5), study more/try harder (5), and play sports (3). In comparison to the previous year’s sample of students, the most common shared feelings among recent graduates seem to be the desire to: become more involved, work harder, and take more AP classes. Relative to highlights, or when asked to describe the best aspects of the Stevenson experience, people and relationships placed in two of the top three spots, echoing the sentiments of the past four year’s sample of students. Faculty (33) garnered the most responses, followed by clubs (12), and friends (11). This is the exact same ranking in areas compared to last year’s responses. Sports (8), APs (6), and good college preparation (6) were other favorable aspects of student’s experiences in high school. Enthusiasm and appreciation for faculty/staff mirrors the annual results from the Senior Exit Survey. Students were queried about their voting status. A large majority of this group (77%) is registered to vote; this is a decrease of 12 percentage points in comparison to last year’s respondents (89%). Last year it may have reached an all-time high because of the 2008 presidential election. The current group has exceedingly dropped from last year’s respondents by 47 percent in level of voter participation in national, state, or local elections (38%). Last year’s results were once again skewed because of the presidential election. In summary, the sample group for the Class of 2009 indicates most are attending college, their preparation for college was effective, and they earned a significant number of college credits while at Stevenson. It appears that grades earned at Stevenson might be a good predictor of success in college, as a large majority of sampled graduates (81%) are earning the same or improved grades at college. Social sciences has surpassed business this year as the most popular college major. However, students are pursuing a variety of majors in the fields of science, communication arts, fine arts, engineering, social science, health sciences, and education. In addition, a healthy number of students, or about one fifth of respondents, have reported that they are tackling double majors. One noticed message is that students believe that less emphasis on homework and more independent, long-term projects would foster the idea of being responsible for one’s learning. Most students are working with counselors to crystallize post-secondary plans. Discipline was perceived as being “about right” by about half of our recent graduates. Some individuals would make changes in their high school experience given the opportunity, although most related that they were pleased with their experience. Positive teacher relationships established during their tenure at Stevenson remains the highlight, being specifically mentioned by a large number of students (33), and consistently ranking a great deal higher than any other category, such as friends, clubs, or resources.
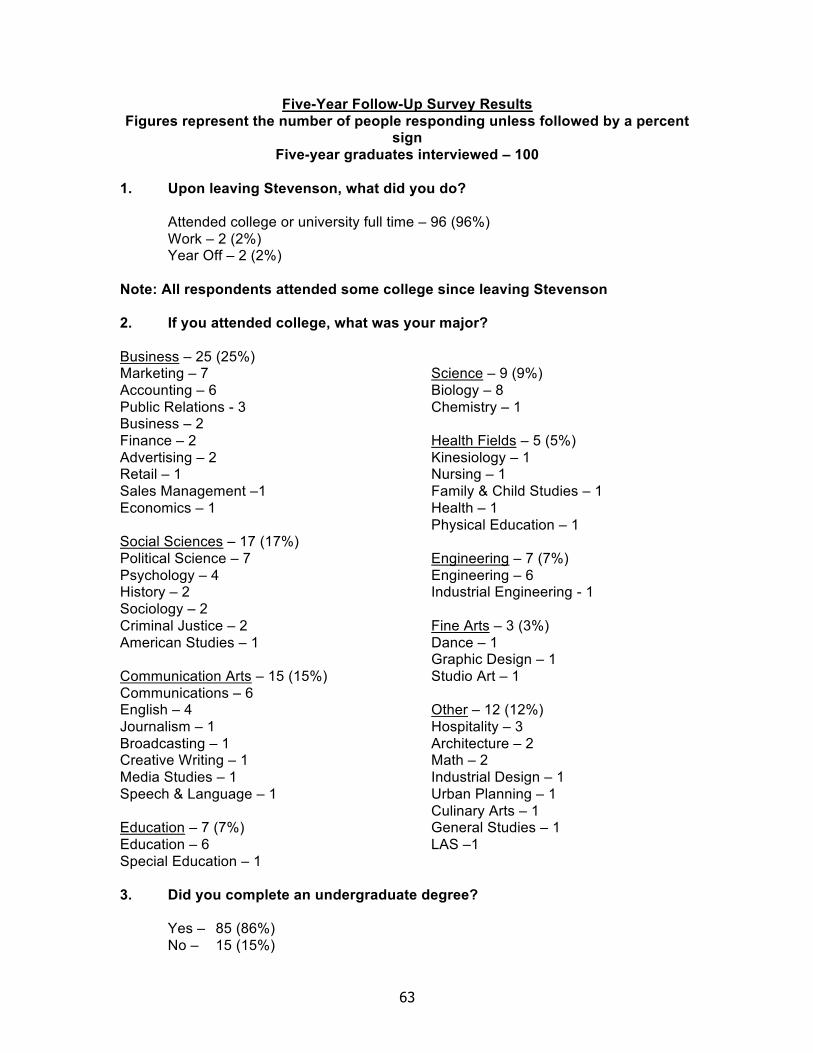
63
Five-Year Follow-Up Survey Results
Figures represent the number of people responding unless followed by a percent sign
Five-year graduates interviewed – 100
1. Upon leaving Stevenson, what did you do?
Attended college or university full time – 96 (96%)
Work – 2 (2%) Year Off – 2 (2%)
Note: All respondents attended some college since leaving Stevenson
2. If you attended college, what was your major?
Business – 25 (25%) Marketing – 7
Accounting – 6
Public Relations - 3 Business – 2
Finance – 2
Advertising – 2 Retail – 1
Sales Management –1
Economics – 1
Social Sciences – 17 (17%)
Political Science – 7
Psychology – 4 History – 2
Sociology – 2
Criminal Justice – 2
American Studies – 1
Communication Arts – 15 (15%)
Communications – 6 English – 4
Journalism – 1
Broadcasting – 1 Creative Writing – 1
Media Studies – 1
Speech & Language – 1
Education – 7 (7%)
Education – 6
Special Education – 1
Science – 9 (9%)
Biology – 8
Chemistry – 1
Health Fields – 5 (5%)
Kinesiology – 1 Nursing – 1
Family & Child Studies – 1
Health – 1
Physical Education – 1
Engineering – 7 (7%)
Engineering – 6 Industrial Engineering - 1
Fine Arts – 3 (3%)
Dance – 1 Graphic Design – 1
Studio Art – 1
Other – 12 (12%)
Hospitality – 3
Architecture – 2 Math – 2
Industrial Design – 1
Urban Planning – 1
Culinary Arts – 1 General Studies – 1
LAS –1
3. Did you complete an undergraduate degree?
Yes – 85 (86%)
No – 15 (15%)
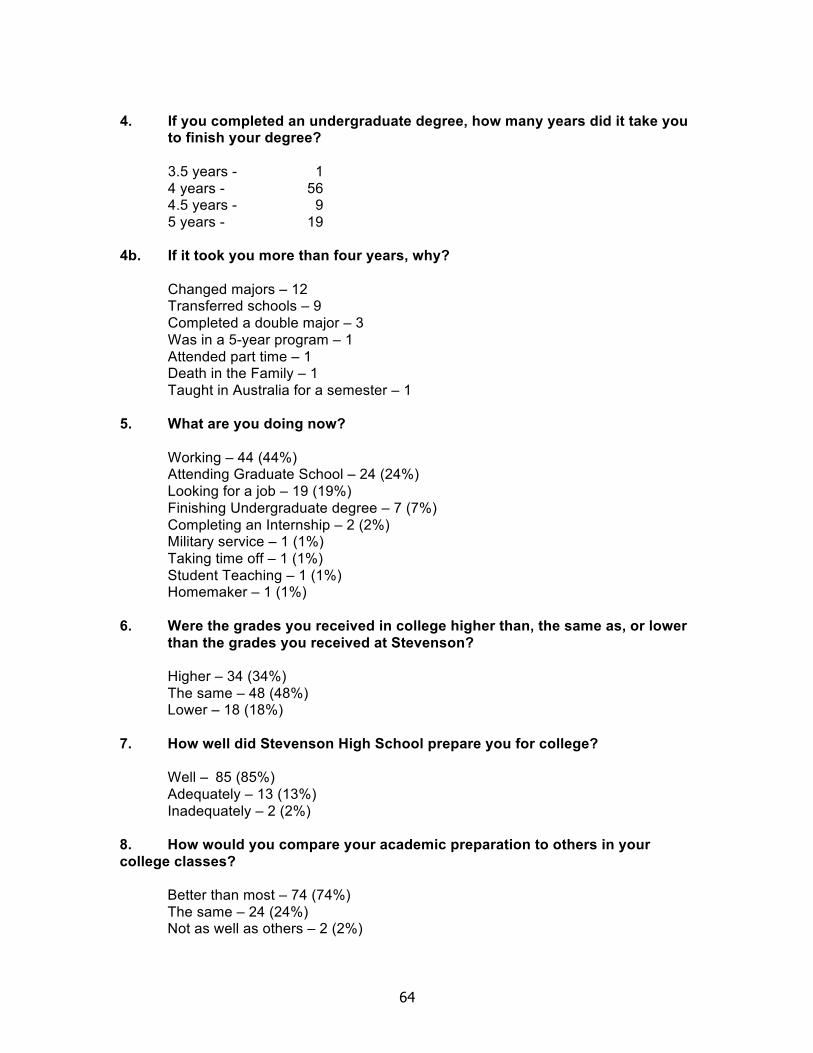
64
4. If you completed an undergraduate degree, how many years did it take you to finish your degree?
3.5 years - 1
4 years - 56 4.5 years - 9
5 years - 19
4b. If it took you more than four years, why?
Changed majors – 12 Transferred schools – 9
Completed a double major – 3
Was in a 5-year program – 1
Attended part time – 1 Death in the Family – 1
Taught in Australia for a semester – 1
5. What are you doing now?
Working – 44 (44%) Attending Graduate School – 24 (24%)
Looking for a job – 19 (19%)
Finishing Undergraduate degree – 7 (7%)
Completing an Internship – 2 (2%) Military service – 1 (1%)
Taking time off – 1 (1%)
Student Teaching – 1 (1%) Homemaker – 1 (1%)
6. Were the grades you received in college higher than, the same as, or lower
than the grades you received at Stevenson?
Higher – 34 (34%)
The same – 48 (48%) Lower – 18 (18%)
7. How well did Stevenson High School prepare you for college?
Well – 85 (85%)
Adequately – 13 (13%)
Inadequately – 2 (2%)
8. How would you compare your academic preparation to others in your
college classes?
Better than most – 74 (74%)
The same – 24 (24%) Not as well as others – 2 (2%)
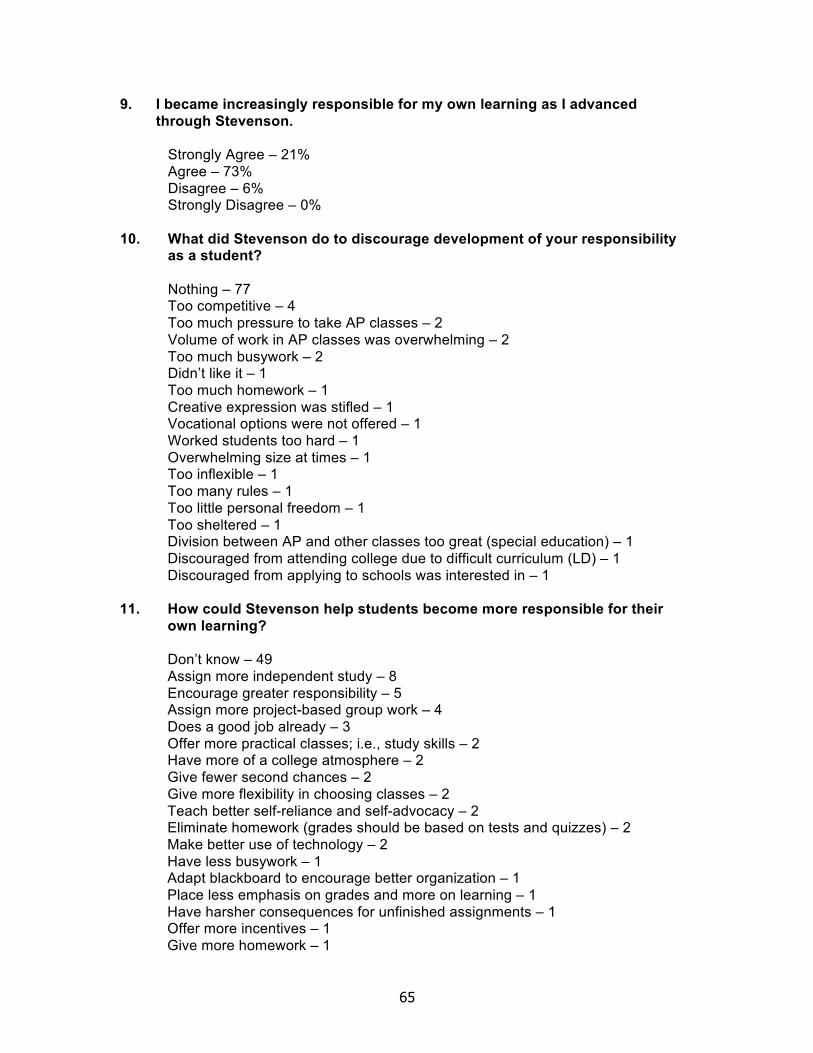
65
9. I became increasingly responsible for my own learning as I advanced
through Stevenson.
Strongly Agree – 21%
Agree – 73%
Disagree – 6% Strongly Disagree – 0%
10. What did Stevenson do to discourage development of your responsibility as a student?
Nothing – 77 Too competitive – 4
Too much pressure to take AP classes – 2
Volume of work in AP classes was overwhelming – 2
Too much busywork – 2 Didn’t like it – 1
Too much homework – 1
Creative expression was stifled – 1 Vocational options were not offered – 1
Worked students too hard – 1
Overwhelming size at times – 1 Too inflexible – 1
Too many rules – 1
Too little personal freedom – 1
Too sheltered – 1 Division between AP and other classes too great (special education) – 1
Discouraged from attending college due to difficult curriculum (LD) – 1
Discouraged from applying to schools was interested in – 1
11. How could Stevenson help students become more responsible for their
own learning?
Don’t know – 49
Assign more independent study – 8
Encourage greater responsibility – 5 Assign more project-based group work – 4
Does a good job already – 3
Offer more practical classes; i.e., study skills – 2 Have more of a college atmosphere – 2
Give fewer second chances – 2
Give more flexibility in choosing classes – 2
Teach better self-reliance and self-advocacy – 2 Eliminate homework (grades should be based on tests and quizzes) – 2
Make better use of technology – 2
Have less busywork – 1 Adapt blackboard to encourage better organization – 1
Place less emphasis on grades and more on learning – 1
Have harsher consequences for unfinished assignments – 1 Offer more incentives – 1
Give more homework – 1
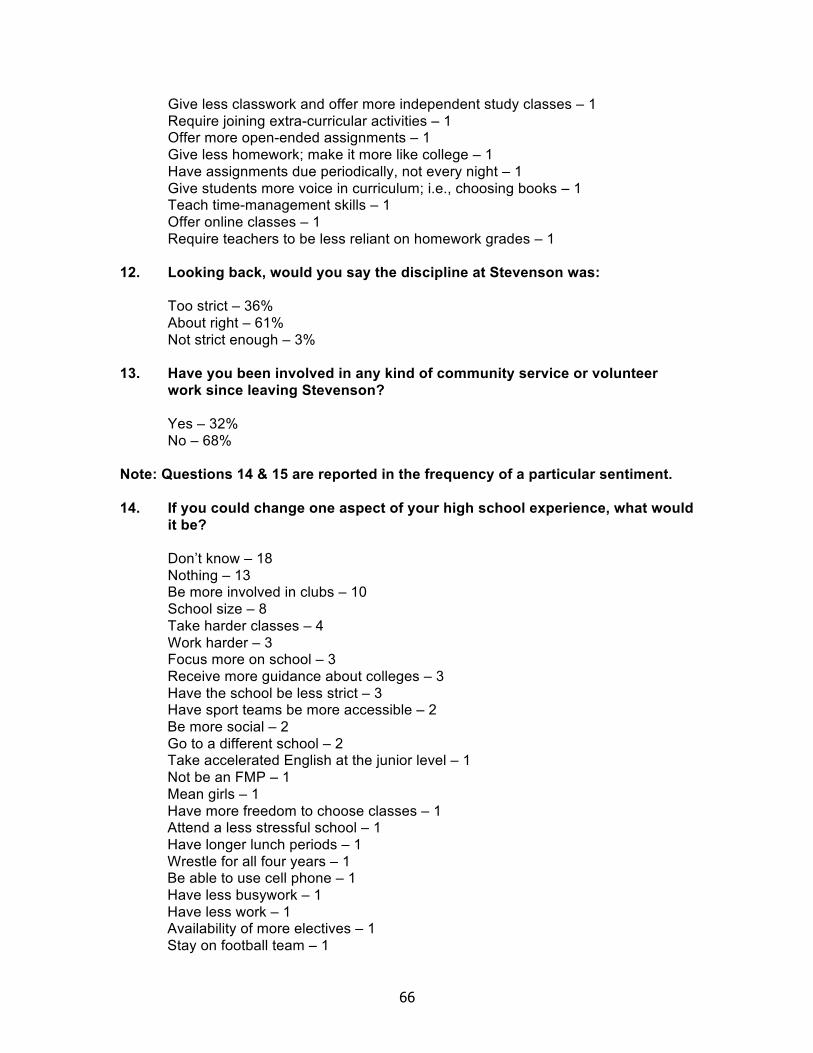
66
Give less classwork and offer more independent study classes – 1
Require joining extra-curricular activities – 1 Offer more open-ended assignments – 1
Give less homework; make it more like college – 1
Have assignments due periodically, not every night – 1
Give students more voice in curriculum; i.e., choosing books – 1 Teach time-management skills – 1
Offer online classes – 1
Require teachers to be less reliant on homework grades – 1
12. Looking back, would you say the discipline at Stevenson was:
Too strict – 36%
About right – 61%
Not strict enough – 3%
13. Have you been involved in any kind of community service or volunteer
work since leaving Stevenson?
Yes – 32%
No – 68%
Note: Questions 14 & 15 are reported in the frequency of a particular sentiment.
14. If you could change one aspect of your high school experience, what would
it be?
Don’t know – 18
Nothing – 13 Be more involved in clubs – 10
School size – 8
Take harder classes – 4
Work harder – 3 Focus more on school – 3
Receive more guidance about colleges – 3
Have the school be less strict – 3 Have sport teams be more accessible – 2
Be more social – 2
Go to a different school – 2 Take accelerated English at the junior level – 1
Not be an FMP – 1
Mean girls – 1
Have more freedom to choose classes – 1 Attend a less stressful school – 1
Have longer lunch periods – 1
Wrestle for all four years – 1 Be able to use cell phone – 1
Have less busywork – 1
Have less work – 1 Availability of more electives – 1
Stay on football team – 1
67
Varsity coach of high school soccer team – 1
Have school prepare students for more practical things in life – 1 Have sports be less competitive – 1
Try to be less stressed – 1
Shorter bus routes – 1
Some counselors – 1 Be more involved in sports – 1
Be able to drive to school more – 1
Staff Member – 1 Better variety of classes – 1
Not have to take school buses – 1
Have more freedom during the school day – 1 Would do one year abroad – 1
Would not go to Ombudsman – 1
Date more – 1
Have harder classes with less extra credit – 1 Assistant principal – 1
15. What were the best aspects of your experience at Stevenson?
Teachers – 18
Opportunities – 14 Friends – 11
AP classes – 8
Extra-curricular clubs and activities – 7
Sports – 7 Education – 5
College preparation – 4
Variety of classes – 3 Diversity – 3
Size – 2
Social aspects – 1
Mother was a school nurse – 1 Computer department – 1
Entire experience – 1
Graduating – 1 Nothing – 1
Preparation for accounting classes – 1
Dance department – 1 Band – 1
Food – 1
Writing preparation – 1
Football – 1 Don’t know – 1
Art department – 1
Support and assistance – 1 Teacher – 1
Challenge – 1
Water polo – 1
68
16. Are you registered to vote?
Yes – 87%
No – 13%
17. Have you voted in a national, state, or local election since leaving Stevenson?
Yes – 77%
No – 23%
69
Five-Year Follow-Up Survey Summary
The five-year follow-up study was conducted by telephone interview with 100 randomly selected Class of 2005 Stevenson graduates. The purpose of the follow up study is to ascertain the activities of students five years after graduation, to gather perceptions about their high school preparation for college, and to solicit input about their overall Stevenson education after having benefited from five years of post-high school experience. Nearly all of the polled students (96%) have responded that they attended college full-time upon leaving Stevenson. This is the same statistic from the previous year’s survey. Two respondents immediately entered the work force upon graduation (2%), and two respondents took a year off (2%). Business (25%) remains the most popular area of concentration for the third year in a row among the college-bound group. Social science (17%) was the second most popular major, followed by communication arts (15%). Science (9%), engineering (7%), and education (7%) ranked in as the fourth and fifth most popular college majors. This year education seemed to have the largest decrease in popularity characterized by four percentage points. Health fields (5%) and fine arts (3%) followed in popularity. A large percentage of these respondents claim to have completed an undergraduate degree (86%); however, this represents a decline of two percentage points compared to 2001 graduates (90%). Less than three quarters (67%) of these students graduated in four years or less, while a considerable amount of graduates report taking longer to complete their degrees (32%). This is a significant decline from last year, depicting an 11 percent decrease in the students who are able to complete college in four years or less. Less than 1 percent of students claimed it took 3.5 years or less to earn their degree. (Nationally, about 48.5 percent of the students graduate in five years). Among Stevenson respondents, nine different reasons for taking longer than four years to complete a degree have been described. The most common reasons cited are: changing majors (12), transferring schools (9), and completing double majors (3), which duplicate last year’s most popular reasons. Relative to current activities, some respondents (24%) are attending graduate school, a four-point decrease from the previous survey. In addition, a large majority (44%) entered the workforce; however, this is a seven-point decrease from last year’s results. Another increase was in the amount of students looking for jobs (19%); this went up by six points. These last three statistics may be indicative of the changing economic landscape. Some students are finishing undergraduate degrees (7%), while a small percentage is involved in military service (1%).
More than one third of respondents (34%) who had attended a college or
a university report receiving higher grades than they had earned at Stevenson, while almost half (48%) managed to earn the same grades. Lower grades prevailed for a smaller percentage (18%) of the respondents who had attended
70
college, which is a one-point decrease from last year’s respondents (19%). When asked, “How well did Stevenson prepare you for college?” the vast majority of respondents (85%) feel “well prepared” for college. This represents a one-point increase from last year. Other students (13%) describe being “adequately” prepared, while two students reported feeling inadequately prepared. When asked to compare themselves to their college peers, a large majority of students perceive themselves as “better prepared than most” (74%), a smaller percentage claim that their preparation is “the same” (24%), while only two students report feeling “not as prepared as others” (2%). Compared to last year’s survey, there was a five-point decrease in the amount of students who felt better prepared than their peers. In regard to fostering student responsibility, five-year graduates were asked if they had experienced growth in this area while in high school. Most graduates agreed that they managed to become increasingly responsible for their own learning (94%), which is a two point decrease from last year’s results. All 100 graduates were asked open-ended questions regarding what Stevenson did to discourage their development in the area of responsibility. Most of them could not think of anything specific the school had done to discourage them (77%). No one common topic was gleaned from the answers. However, four students thought the school was too competitive and two students indicated there was too much pressure with AP classes. Other common themes that stood out were that there was too much busy work, inflexibility, and not enough personal freedom. When solicited for input as to how Stevenson could help students become more responsible for their learning, eight students agreed that Stevenson should assign more independent study opportunities. Five students agreed that SHS should encourage greater responsibility, while four other students thought that project-based work can foster these skills. The largest percentage of graduates (49%) agreed they did not know what SHS could do to enhance responsibility. By and large, no common themes have been noticed from survey to survey, except that a large portion of respondents state that they cannot articulate what SHS could do to help students become responsible for their own learning. Graduates were asked to reflect upon Stevenson’s disciplinary policies and practices. Most graduates agreed that discipline was “just right” (61%), which is a decline from the results of the previous year (68%). Compared to last year’s results, there was a six-point increase in the students who feel that discipline is “too strict” (36%). Just three students reported that discipline was “not strict enough” (3%).
Five-year graduates were asked if they have been involved in some kind of community service/volunteer work since exiting Stevenson. For the first time in several years, there was a significant decline in the percentage of respondents who report that they have participated in community service (32%). This represents a 43 percent decline from last year’s respondents (75%). When asked what one aspect of their high school experience they would change, ten
71
respondents would have been more involved in clubs, eight students would have changed the size of the school, four students would have taken harder classes, and three students would have worked harder. Thirteen students would change “nothing.” For the second year in a row, in relation to what they considered to be the best aspects of their Stevenson experience, the most frequent responses cited were teachers (18), followed closely by the opportunities available (14), and friends (11). This year friends fell to the third most popular response, depicting a ten-point decline. Other popular responses include AP classes (8), extracurriculars (7), and sports (7). Voter registration has decreased by eight percentage points (87%). Last year was an all-time high because of the 2008 presidential elections. Over three quarters (77%) of the respondents reported they had voted in an election. Once again it is a 16-point decrease from last year’s respondents who claimed they voted in an election (93%). In retrospect, the vast majority of this group attended college, and almost nine out of ten students declare that they have completed an undergraduate degree. Grades earned in college were at least as good, and often better, than those received in high school. Furthermore, these former students feel exceptionally well prepared. A large majority of these students are gainfully employed, and many are attending graduate school. A large amount of graduates have learned how to take ownership of their learning and credit Stevenson for fostering that development. Most graduates evaluate Stevenson’s discipline as being appropriate. Generally speaking, the responses of the Class of 2004 affirm the notion that Stevenson is preparing them for success while creating life-long learners.