Embed Size (px)
Citation preview
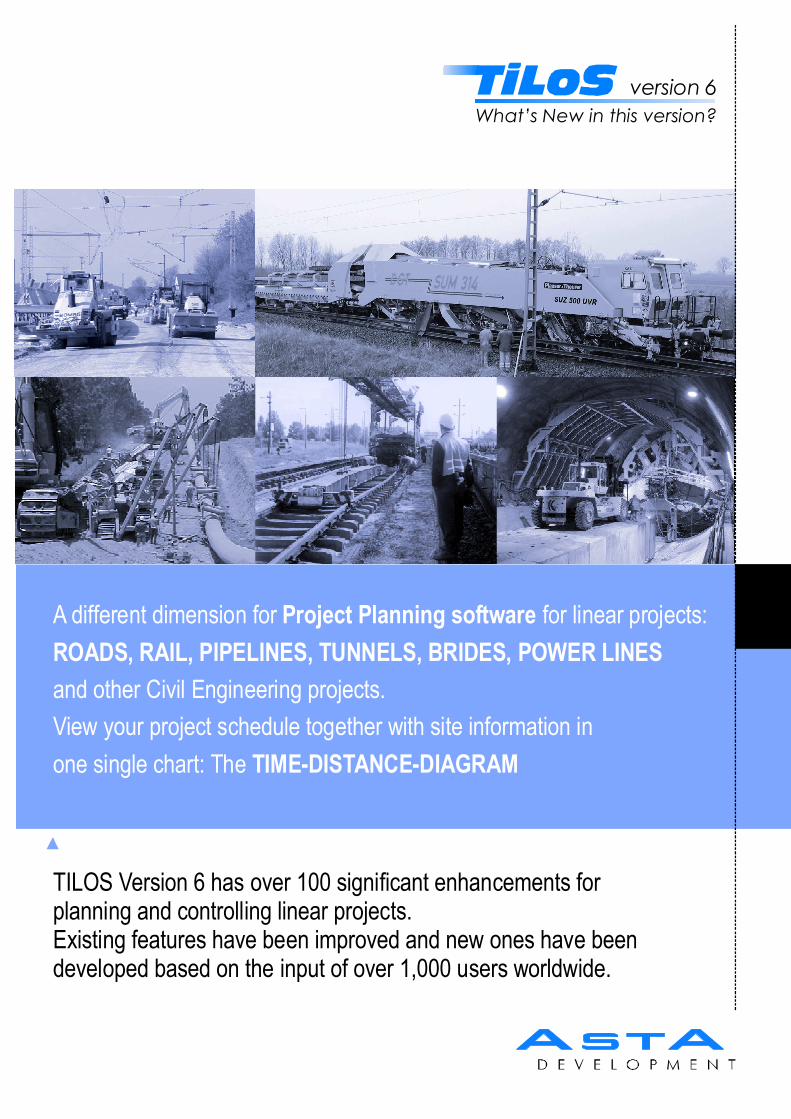
version 6What’s New in this version?
TILOS Version 6 has over 100 significant enhancements forplanning and controlling linear projects.Existing features have been improved and new ones have beendeveloped based on the input of over 1,000 users worldwide.
A different dimension for for linear projects:
and other Civil Engineering projects.View your project schedule together with site information inone single chart: The
Project Planning softwareROADS, RAIL, PIPELINES, TUNNELS, BRIDES, POWER LINES
TIME-DISTANCE-DIAGRAM
version 6
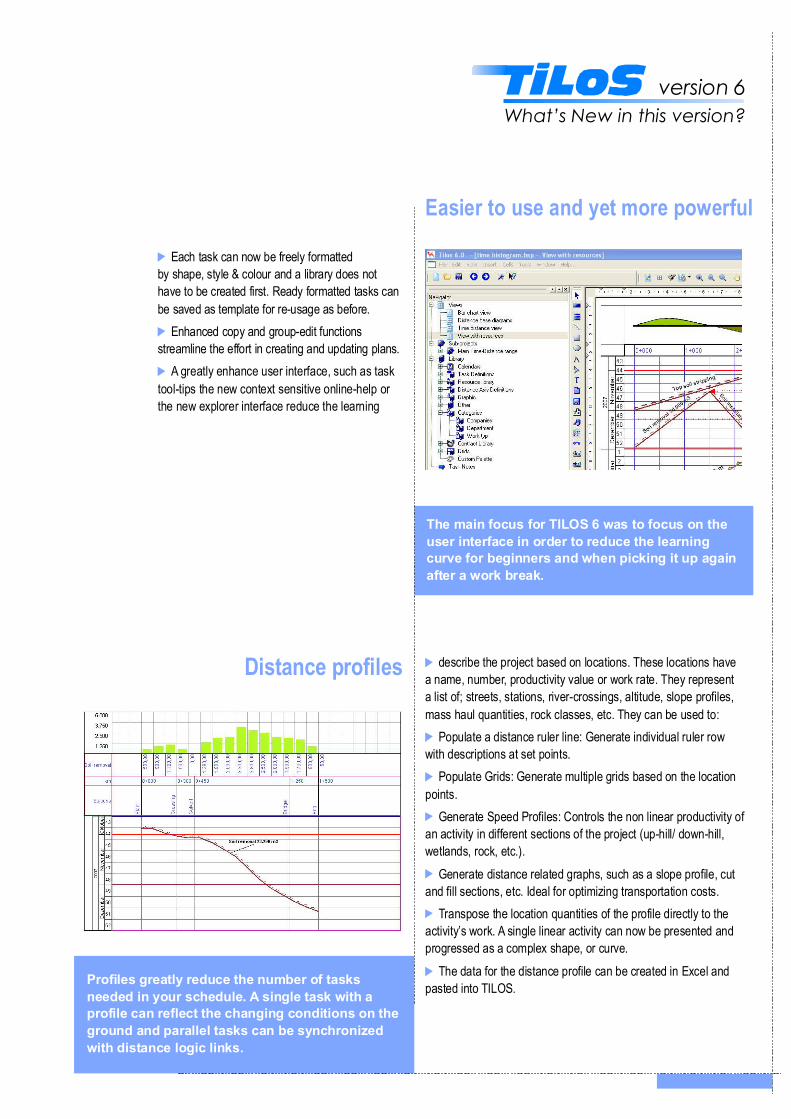
Each task can now be freely formattedby shape, style & colour and a library does nothave to be created first. Ready formatted tasks canbe saved as template for re-usage as before.
Enhanced copy and group-edit functionsstreamline the effort in creating and updating plans.
A greatly enhance user interface, such as tasktool-tips the new context sensitive online-help orthe new explorer interface reduce the learning
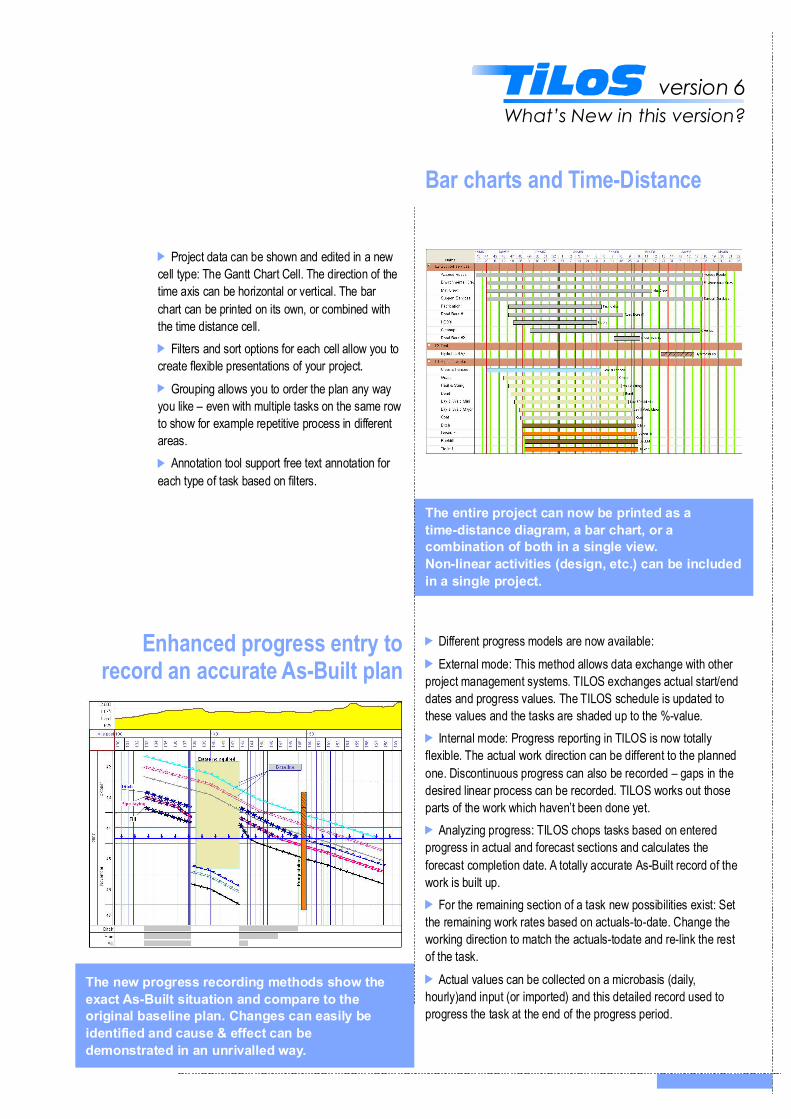
Distance profiles
The main focus for TILOS 6 was to focus on theuser interface in order to reduce the learningcurve for beginners and when picking it up againafter a work break.
describe the project based on locations. These locations havea name, number, productivity value or work rate. They representa list of; streets, stations, river-crossings, altitude, slope profiles,mass haul quantities, rock classes, etc. They can be used to:
Populate a distance ruler line: Generate individual ruler rowwith descriptions at set points.
Populate Grids: Generate multiple grids based on the locationpoints.
Generate Speed Profiles: Controls the non linear productivity ofan activity in different sections of the project (up-hill/ down-hill,wetlands, rock, etc.).
Generate distance related graphs, such as a slope profile, cutand fill sections, etc. Ideal for optimizing transportation costs.
Transpose the location quantities of the profile directly to theactivity’s work. A single linear activity can now be presented andprogressed as a complex shape, or curve.
The data for the distance profile can be created in Excel andpasted into TILOS.
Easier to use and yet more powerful
Profiles greatly reduce the number of tasksneeded in your schedule. A single task with aprofile can reflect the changing conditions on theground and parallel tasks can be synchronizedwith distance logic links.
What’s New in this version?
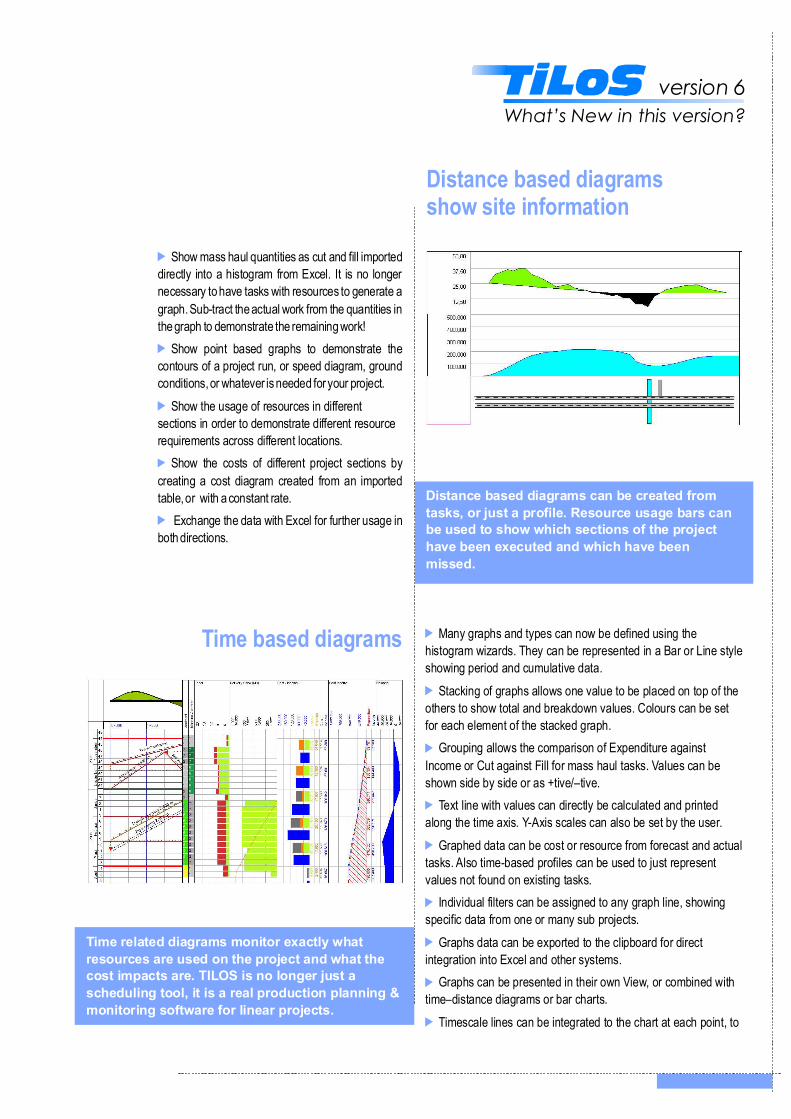
Project data can be shown and edited in a newcell type: The Gantt Chart Cell. The direction of thetime axis can be horizontal or vertical. The barchart can be printed on its own, or combined withthe time distance cell.
Filters and sort options for each cell allow you tocreate flexible presentations of your project.
Grouping allows you to order the plan any wayyou like – even with multiple tasks on the same rowto show for example repetitive process in differentareas.
Annotation tool support free text annotation foreach type of task based on filters.
Bar charts and Time-Distance
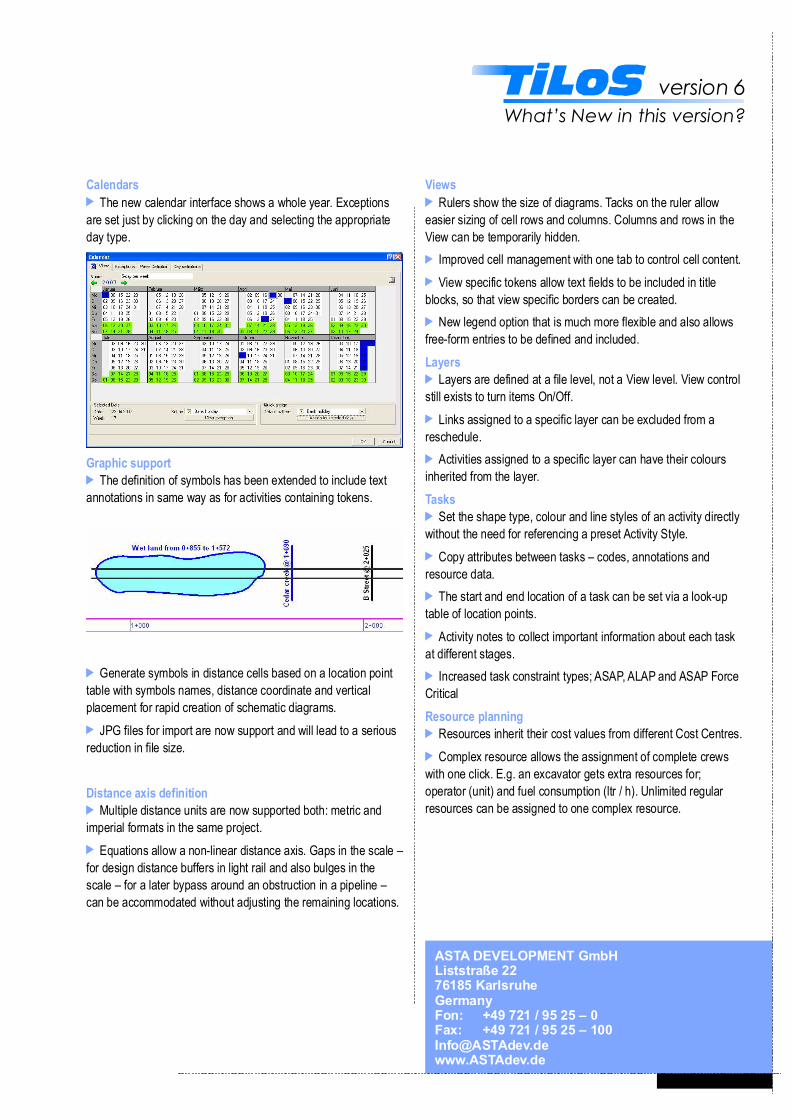
Enhanced progress entry torecord an accurate As-Built plan
Different progress models are now available:External mode: This method allows data exchange with other
project management systems. TILOS exchanges actual start/enddates and progress values. The TILOS schedule is updated tothese values and the tasks are shaded up to the %-value.
Internal mode: Progress reporting in TILOS is now totallyflexible. The actual work direction can be different to the plannedone. Discontinuous progress can also be recorded – gaps in thedesired linear process can be recorded. TILOS works out thoseparts of the work which haven’t been done yet.
Analyzing progress: TILOS chops tasks based on enteredprogress in actual and forecast sections and calculates theforecast completion date. A totally accurate As-Built record of thework is built up.
For the remaining section of a task new possibilities exist: Setthe remaining work rates based on actuals-to-date. Change theworking direction to match the actuals-todate and re-link the restof the task.
Actual values can be collected on a microbasis (daily,hourly)and input (or imported) and this detailed record used toprogress the task at the end of the progress period.
The entire project can now be printed as atime-distance diagram, a bar chart, or acombination of both in a single view.Non-linear activities (design, etc.) can be includedin a single project.
The new progress recording methods show theexact As-Built situation and compare to theoriginal baseline plan. Changes can easily beidentified and cause & effect can bedemonstrated in an unrivalled way.
version 6What’s New in this version?
Time based diagrams
Distance based diagrams can be created fromtasks, or just a profile. Resource usage bars canbe used to show which sections of the projecthave been executed and which have beenmissed.
Many graphs and types can now be defined using thehistogram wizards. They can be represented in a Bar or Line styleshowing period and cumulative data.
Stacking of graphs allows one value to be placed on top of theothers to show total and breakdown values. Colours can be setfor each element of the stacked graph.
Grouping allows the comparison of Expenditure againstIncome or Cut against Fill for mass haul tasks. Values can beshown side by side or as +tive/–tive.
Text line with values can directly be calculated and printedalong the time axis. Y-Axis scales can also be set by the user.
Graphed data can be cost or resource from forecast and actualtasks. Also time-based profiles can be used to just representvalues not found on existing tasks.
Individual filters can be assigned to any graph line, showingspecific data from one or many sub projects.
Graphs data can be exported to the clipboard for directintegration into Excel and other systems.
Graphs can be presented in their own View, or combined withtime–distance diagrams or bar charts.
Timescale lines can be integrated to the chart at each point, to
Time related diagrams monitor exactly whatresources are used on the project and what thecost impacts are. TILOS is no longer just ascheduling tool, it is a real production planning &monitoring software for linear projects.
Show mass haul quantities as cut and fill importeddirectly into a histogram from Excel. It is no longernecessary to have tasks with resources to generate agraph.Sub-tract the actual work from the quantities inthe graph to demonstrate the remaining work!
Show point based graphs to demonstrate thecontours of a project run, or speed diagram, groundconditions,or whatever isneeded foryour project.
Show the usage of resources in differentsections in order to demonstrate different resourcerequirements across different locations.
Show the costs of different project sections bycreating a cost diagram created from an importedtable,or with a constant rate.
Exchange the data with Excel for further usage inboth directions.
Distance based diagramsshow site information
version 6What’s New in this version?
version 6What’s New in this version?
ASTA DEVELOPMENT GmbHListstraße 2276185 KarlsruheGermanyFon: +49 721 / 95 25 – 0Fax: +49 721 / 95 25 – [email protected]
Calendars
Graphic support
Distance axis definition
The new calendar interface shows a whole year. Exceptionsare set just by clicking on the day and selecting the appropriateday type.
The definition of symbols has been extended to include textannotations in same way as for activities containing tokens.
Generate symbols in distance cells based on a location pointtable with symbols names, distance coordinate and verticalplacement for rapid creation of schematic diagrams.
JPG files for import are now support and will lead to a seriousreduction in file size.
Multiple distance units are now supported both: metric andimperial formats in the same project.
Equations allow a non-linear distance axis. Gaps in the scale –for design distance buffers in light rail and also bulges in thescale – for a later bypass around an obstruction in a pipeline –can be accommodated without adjusting the remaining locations.
Views
Layers
Tasks
Resource planning
Rulers show the size of diagrams. Tacks on the ruler alloweasier sizing of cell rows and columns. Columns and rows in theView can be temporarily hidden.
Improved cell management with one tab to control cell content.View specific tokens allow text fields to be included in title
blocks, so that view specific borders can be created.New legend option that is much more flexible and also allows
free-form entries to be defined and included.
Layers are defined at a file level, not a View level. View controlstill exists to turn items On/Off.
Links assigned to a specific layer can be excluded from areschedule.
Activities assigned to a specific layer can have their coloursinherited from the layer.
Set the shape type, colour and line styles of an activity directlywithout the need for referencing a preset Activity Style.
Copy attributes between tasks – codes, annotations andresource data.
The start and end location of a task can be set via a look-uptable of location points.
Activity notes to collect important information about each taskat different stages.
Increased task constraint types; ASAP, ALAP and ASAP ForceCritical
Resources inherit their cost values from different Cost Centres.Complex resource allows the assignment of complete crews
with one click. E.g. an excavator gets extra resources for;operator (unit) and fuel consumption (ltr / h). Unlimited regularresources can be assigned to one complex resource.