Embed Size (px)
Citation preview
Adeyl Khan, Faculty, BBA, NSU
Chapter 9Management
of Quality
Adeyl Khan, Faculty, BBA, NSU
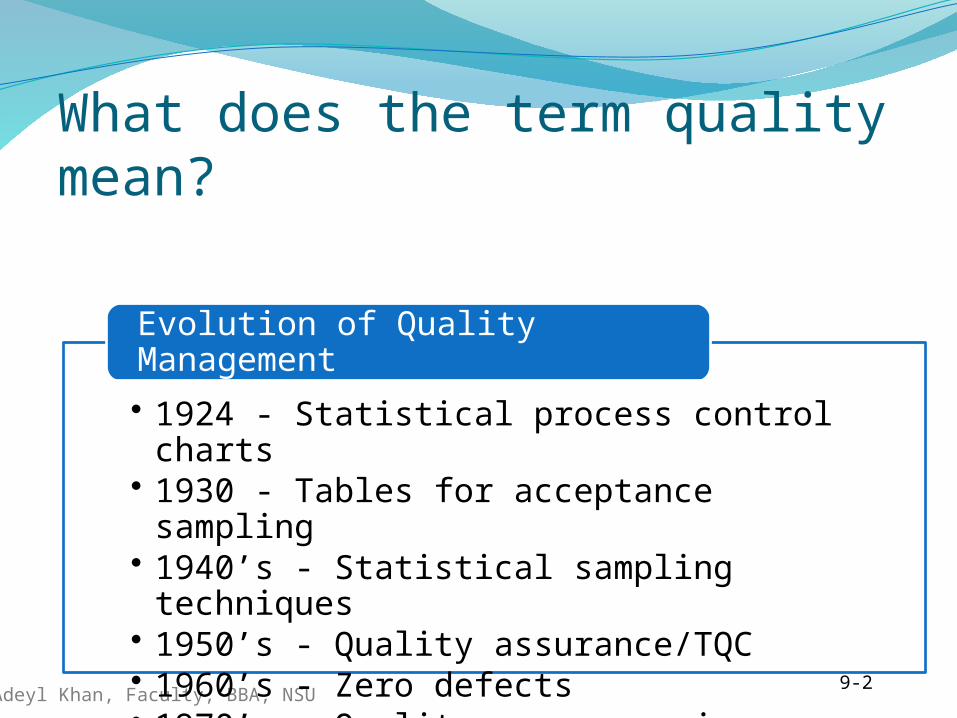
What does the term quality mean?
Quality is the ability of a product or service to consistently meet or exceed customer expectations.
9-2
• 1924 - Statistical process control charts• 1930 - Tables for acceptance sampling• 1940’s - Statistical sampling techniques• 1950’s - Quality assurance/TQC• 1960’s - Zero defects• 1970’s - Quality assurance in services
Evolution of Quality Management
Adeyl Khan, Faculty, BBA, NSU
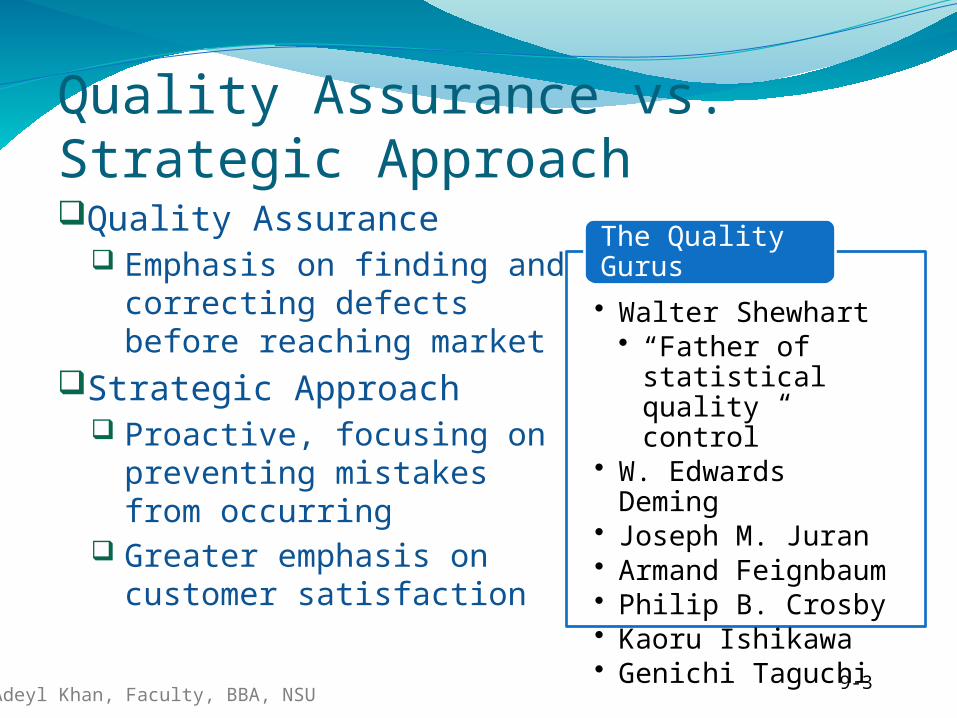
Quality Assurance vs. Strategic ApproachQuality Assurance
Emphasis on finding and correcting defects before reaching market
Strategic Approach Proactive, focusing on
preventing mistakes from occurring
Greater emphasis on customer satisfaction
9-3
• Walter Shewhart• “Father of
statistical quality control”
• W. Edwards Deming
• Joseph M. Juran• Armand
Feignbaum• Philip B. Crosby• Kaoru Ishikawa• Genichi Taguchi
The Quality Gurus
Adeyl Khan, Faculty, BBA, NSU
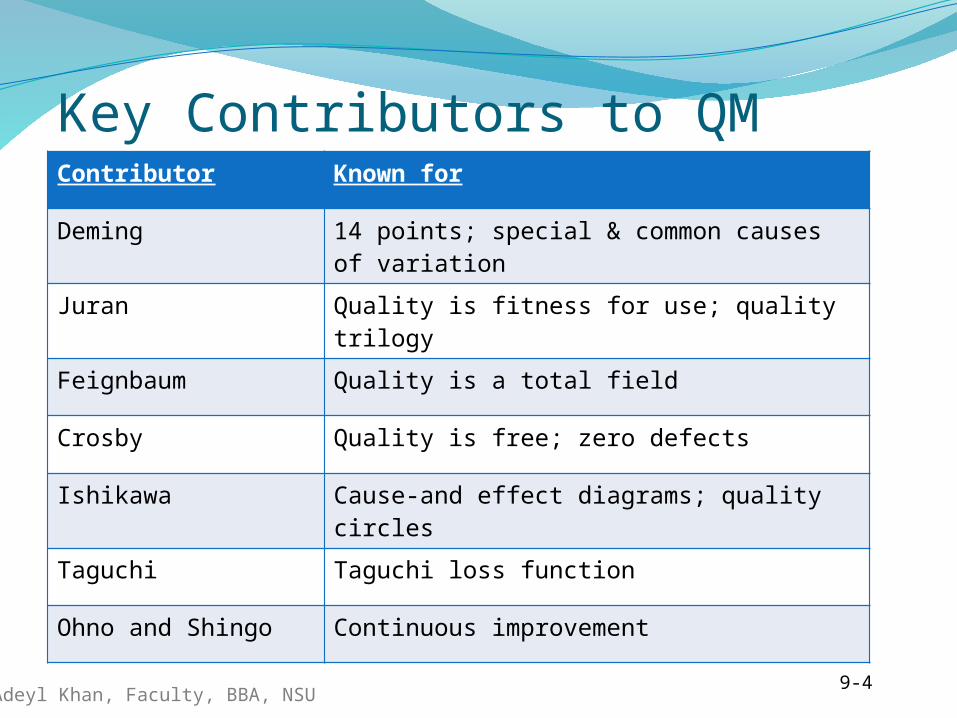
Key Contributors to QMContributor Known for
Deming 14 points; special & common causes of variation
Juran Quality is fitness for use; quality trilogy
Feignbaum Quality is a total field
Crosby Quality is free; zero defects
Ishikawa Cause-and effect diagrams; quality circles
Taguchi Taguchi loss function
Ohno and Shingo Continuous improvement
9-4
Adeyl Khan, Faculty, BBA, NSU
Dimensions of Quality
Performance - main characteristics of the product/serviceAesthetics - appearance, feel, smell, tasteSpecial Features - extra characteristicsConformance - how well product/service conforms to customer’s expectationsReliability - consistency of performanceDurability - useful life of the product/servicePerceived Quality - indirect evaluation of quality (e.g. reputation)Serviceability - service after sale
9-5
Adeyl Khan, Faculty, BBA, NSU
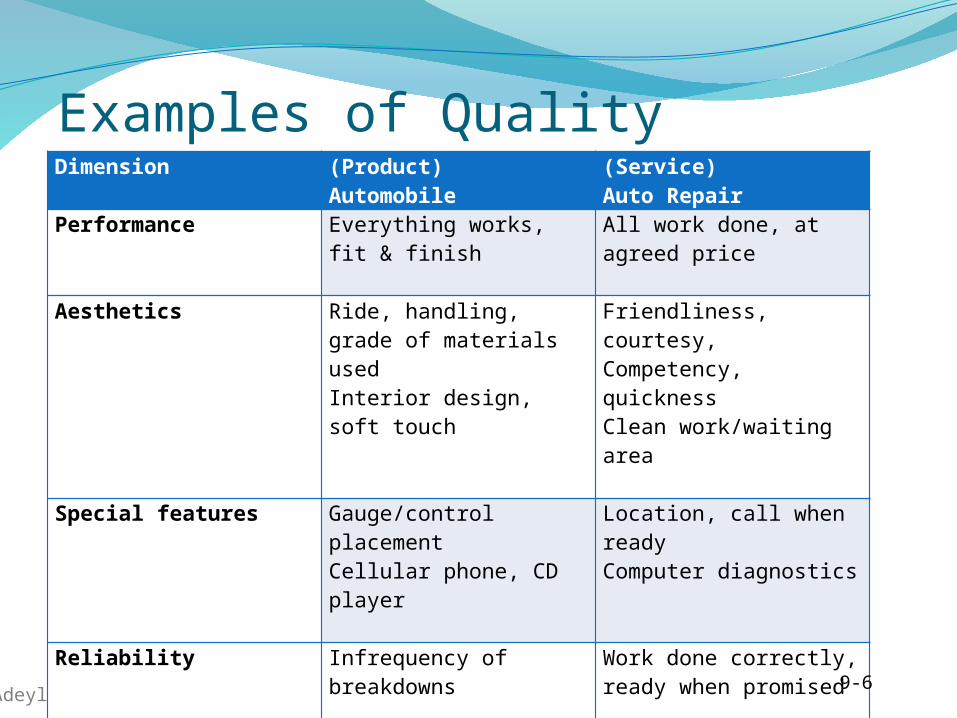
Examples of Quality DimensionsDimension
(Product)Automobile
(Service)Auto Repair
Performance
Everything works, fit & finish
All work done, at agreed price
Aesthetics
Ride, handling, grade of materials usedInterior design, soft touch
Friendliness, courtesy, Competency, quicknessClean work/waiting area
Special features
Gauge/control placementCellular phone, CD player
Location, call when readyComputer diagnostics
Reliability
Infrequency of breakdowns
Work done correctly, ready when promised
Durability Useful life in miles, resistance to rust & corrosion
Work holds up over time
Perceived quality Top-rated car Award-winning service department
Serviceability Handling of complaints and/or requests for information
Handling of complaints
9-6
Adeyl Khan, Faculty, BBA, NSU
Service Quality
ConvenienceReliabilityResponsivenessTimeAssuranceCourtesyTangibles
9-7
Adeyl Khan, Faculty, BBA, NSU
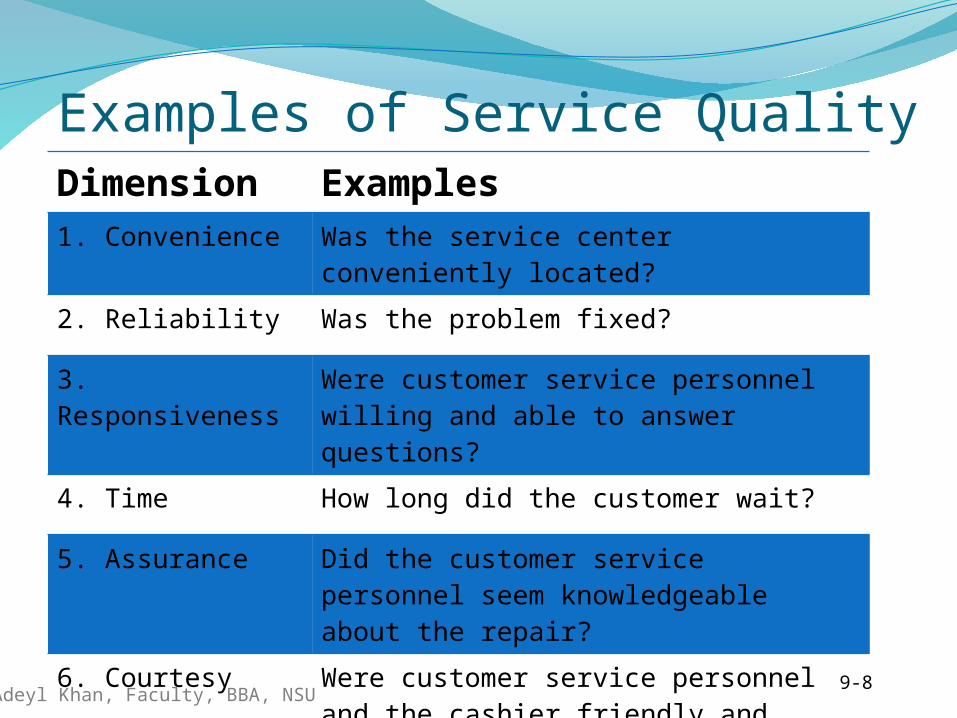
Examples of Service QualityDimension Examples1. Convenience Was the service center conveniently
located?
2. Reliability Was the problem fixed?
3. Responsiveness
Were customer service personnel willing and able to answer questions?
4. Time How long did the customer wait?
5. Assurance Did the customer service personnel seem knowledgeable about the repair?
6. Courtesy Were customer service personnel and the cashier friendly and courteous?
7. Tangibles Were the facilities clean, personnel neat?
9-8
Adeyl Khan, Faculty, BBA, NSU
Challenges with Service Quality
Customer expectations often changeDifferent customers have different expectationsEach customer contact is a “moment of truth”Customer participation can affect perception of qualityFail-safing must be designed into the system
9-9
Adeyl Khan, Faculty, BBA, NSU
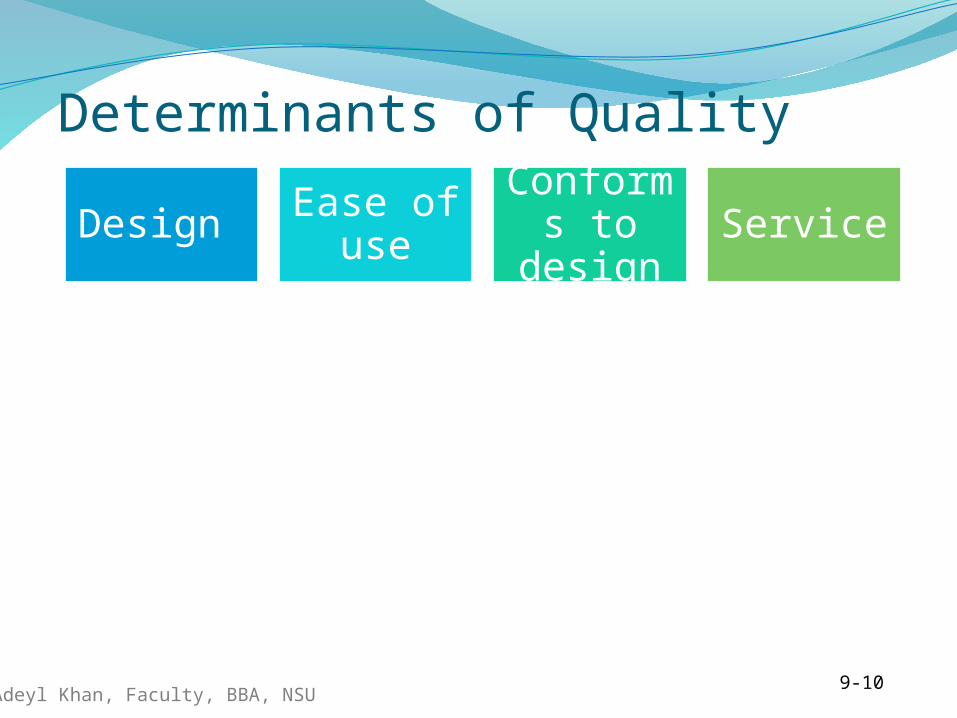
Determinants of QualityQuality of design
Intension of designers to include or exclude features in a product or serviceQuality of conformance
The degree to which goods or services conform to the intent of the designers
9-10
Design Ease of use
Conforms to design
Service
Adeyl Khan, Faculty, BBA, NSU
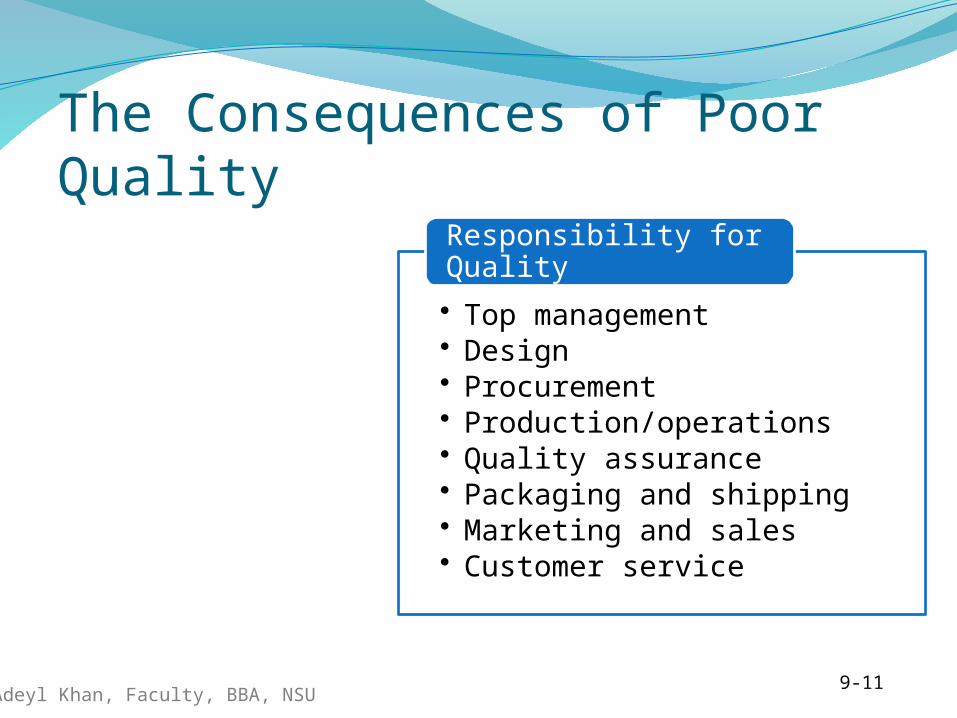
The Consequences of Poor Quality
Loss of businessLiabilityProductivityCosts
9-11
• Top management• Design• Procurement• Production/operations• Quality assurance• Packaging and shipping• Marketing and sales• Customer service
Responsibility for Quality
Adeyl Khan, Faculty, BBA, NSU
Costs of Quality
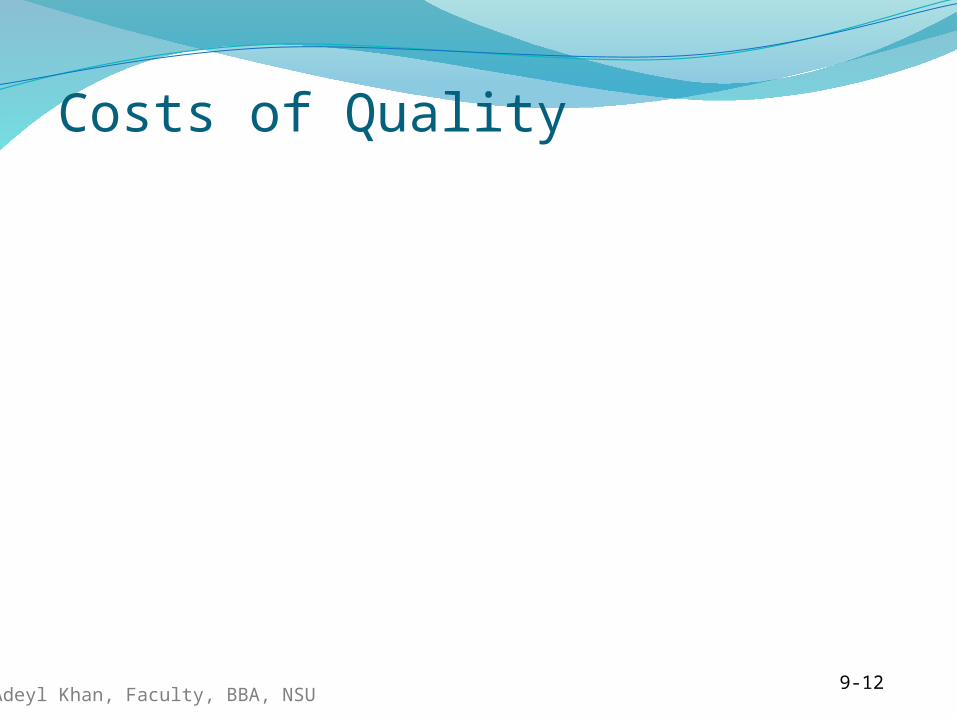
Failure Costs Internal Failure Costs- before customer External Failure Costs- after customer
Appraisal Costs Costs of activities designed to ensure quality or uncover defects
Prevention Costs All TQ training, TQ planning, customer assessment, process control, and quality improvement costs to prevent defects from occurring
9-12

Adeyl Khan, Faculty, BBA, NSU
Ethics and Quality
Having knowledge of this and failing to correct and report it in a timely manner is unethical.
Substandard work Defective products Substandard service Poor designs Shoddy workmanship Substandard parts and materials
9-13
Adeyl Khan, Faculty, BBA, NSU
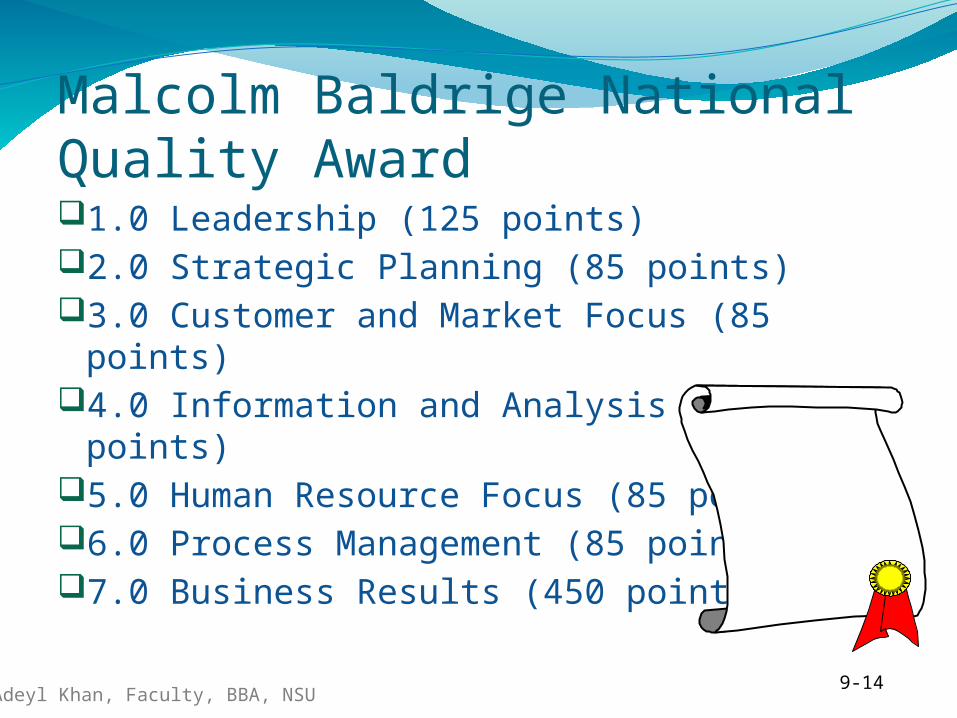
Malcolm Baldrige National Quality Award1.0 Leadership (125 points)2.0 Strategic Planning (85 points)3.0 Customer and Market Focus (85 points)4.0 Information and Analysis (85 points)5.0 Human Resource Focus (85 points)6.0 Process Management (85 points)7.0 Business Results (450 points)
9-14
Quality Awards
Adeyl Khan, Faculty, BBA, NSU
Quality Certification
ISO 9000 Set of international standards on quality management and quality assurance, critical to international business
ISO 14000 A set of international standards for assessing a company’s environmental performance
9-15
Adeyl Khan, Faculty, BBA, NSU
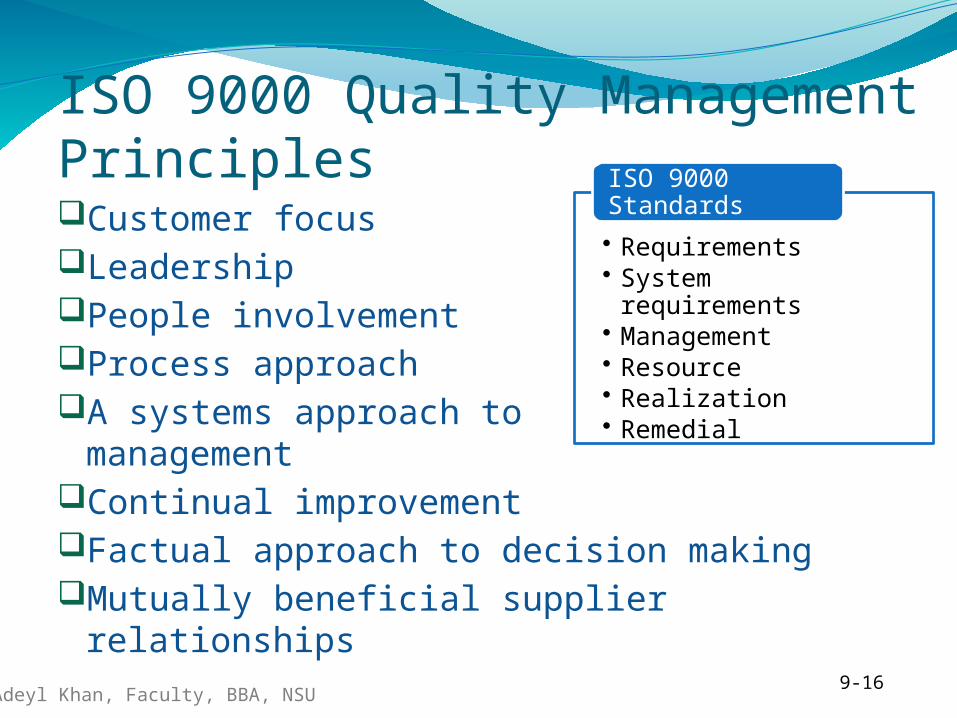
ISO 9000 Quality Management PrinciplesCustomer focusLeadershipPeople involvementProcess approachA systems approach to
managementContinual improvementFactual approach to decision makingMutually beneficial supplier relationships
9-16
• Requirements • System requirements• Management • Resource• Realization• Remedial
ISO 9000 Standards
Adeyl Khan, Faculty, BBA, NSU
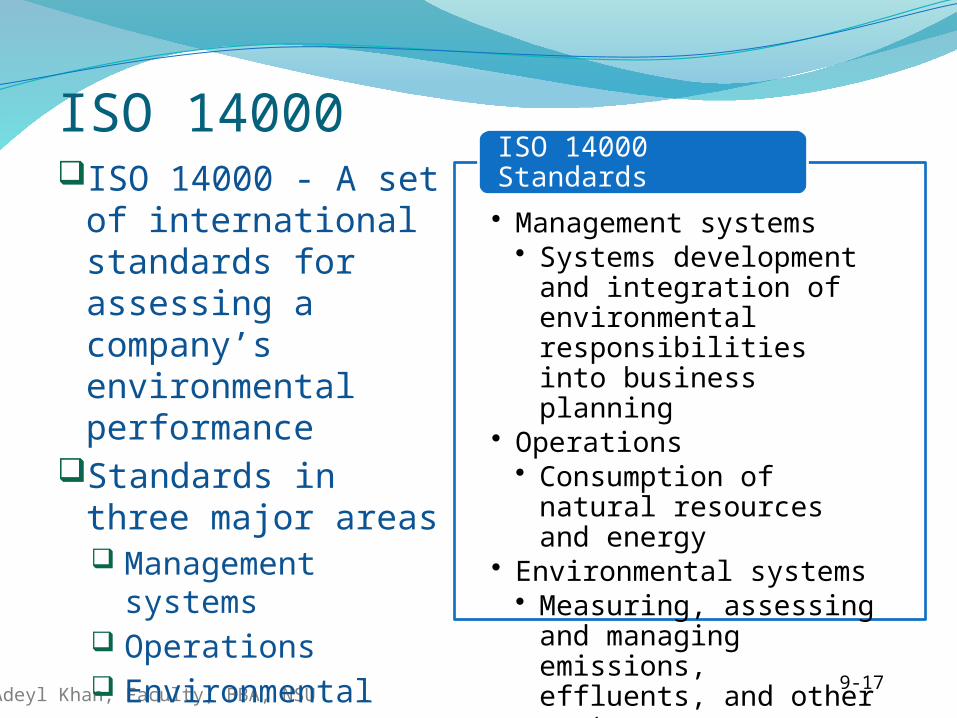
ISO 14000ISO 14000 - A set of
international standards for assessing a company’s environmental performance
Standards in three major areas Management
systems Operations Environmental
systems
9-17
• Management systems
• Systems development and integration of environmental responsibilities into business planning
• Operations• Consumption of natural
resources and energy• Environmental systems
• Measuring, assessing and managing emissions, effluents, and other waste
ISO 14000 Standards
Adeyl Khan, Faculty, BBA, NSU
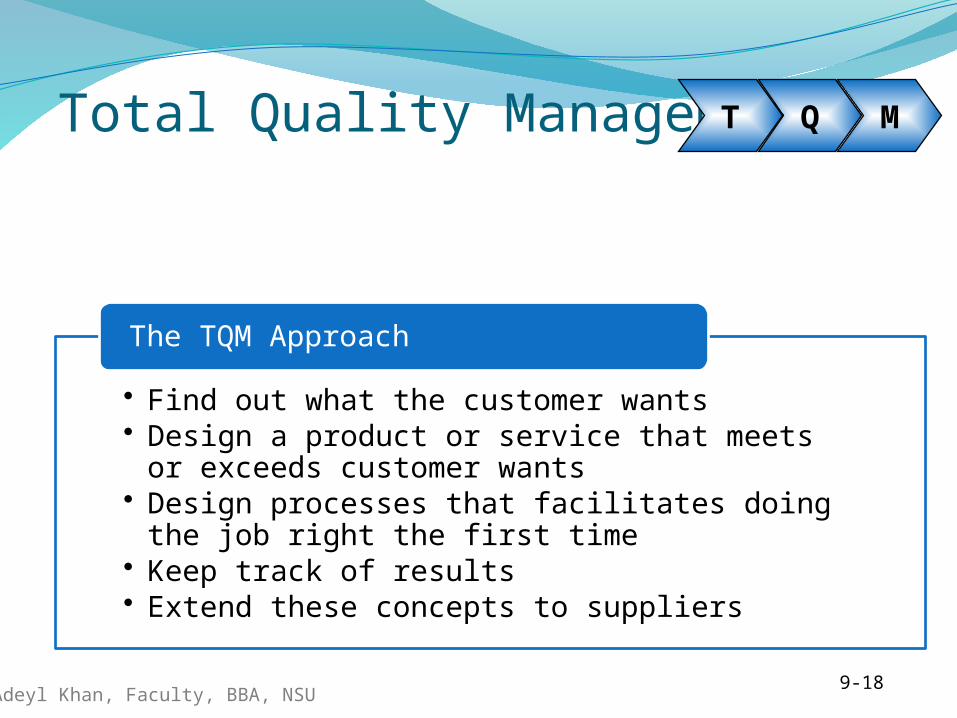
Total Quality Management
A philosophy that involves everyone in an organization in a continual effort to improve quality and achieve customer satisfaction.
9-18
T Q M
• Find out what the customer wants• Design a product or service that meets or
exceeds customer wants• Design processes that facilitates doing the job
right the first time• Keep track of results• Extend these concepts to suppliers
The TQM Approach
Adeyl Khan, Faculty, BBA, NSU
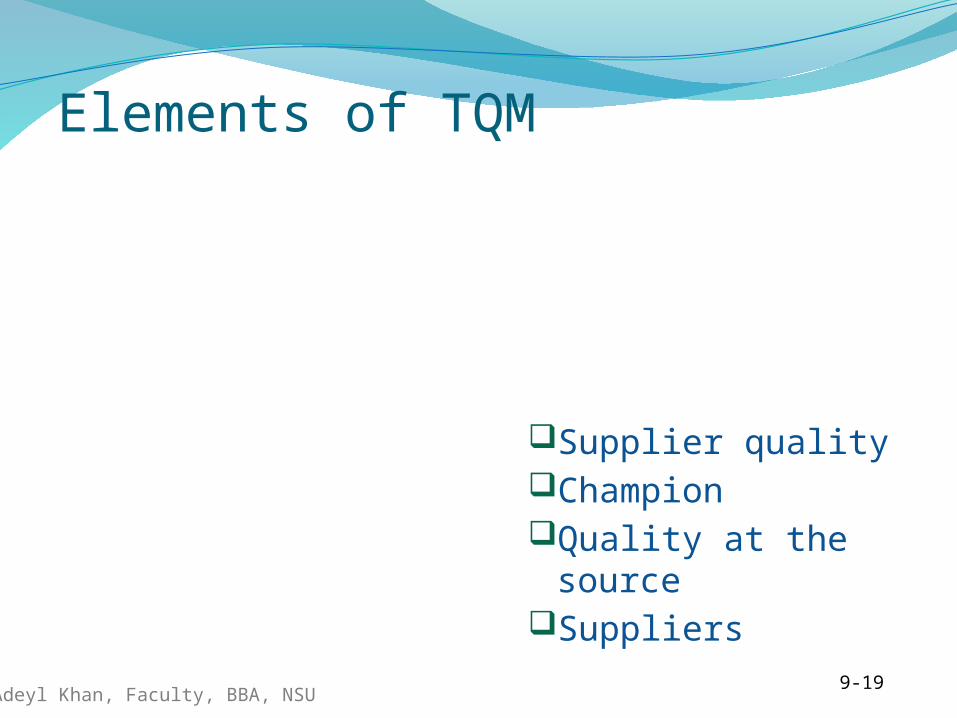
Elements of TQM
Continual improvement Philosophy that seeks to make never-ending improvements to the process of converting inputs into outputs. Kaizen: Japanese word for continuous improvement.
Competitive benchmarkingEmployee empowermentTeam approachDecisions based on factsKnowledge of tools
9-19
Supplier qualityChampionQuality at the
sourceSuppliers
Adeyl Khan, Faculty, BBA, NSU
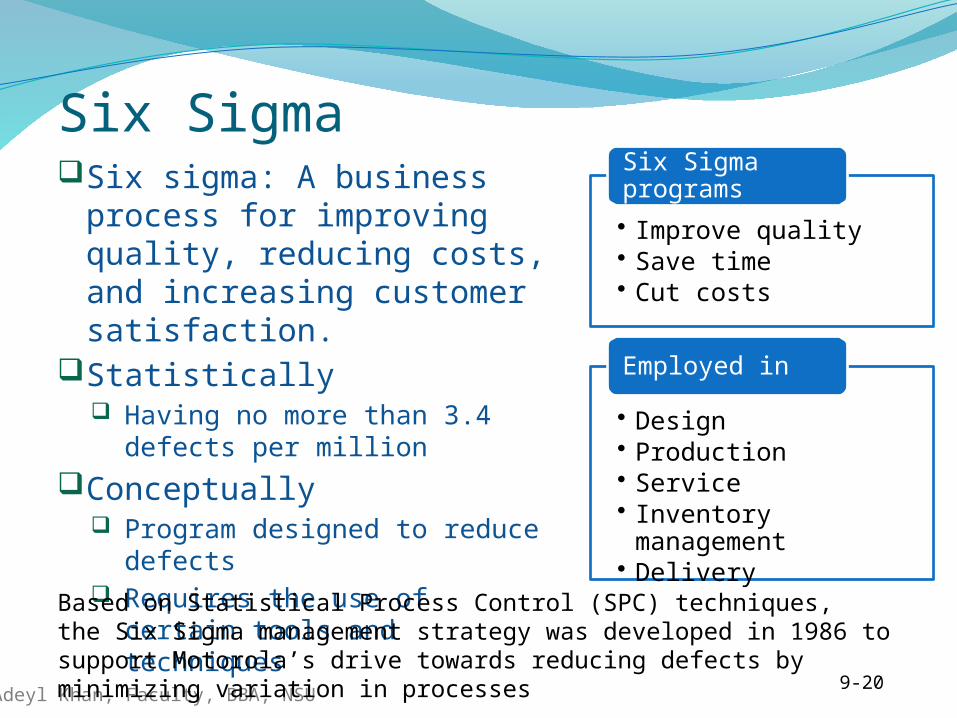
Six SigmaSix sigma: A business
process for improving quality, reducing costs, and increasing customer satisfaction.
Statistically Having no more than 3.4
defects per millionConceptually
Program designed to reduce defects
Requires the use of certain tools and techniques
9-20
• Improve quality• Save time• Cut costs
Six Sigma programs
• Design• Production• Service• Inventory
management• Delivery
Employed in
Based on Statistical Process Control (SPC) techniques, the Six Sigma management strategy was developed in 1986 to support Motorola’s drive towards reducing defects by minimizing variation in processes
Adeyl Khan, Faculty, BBA, NSU9-21
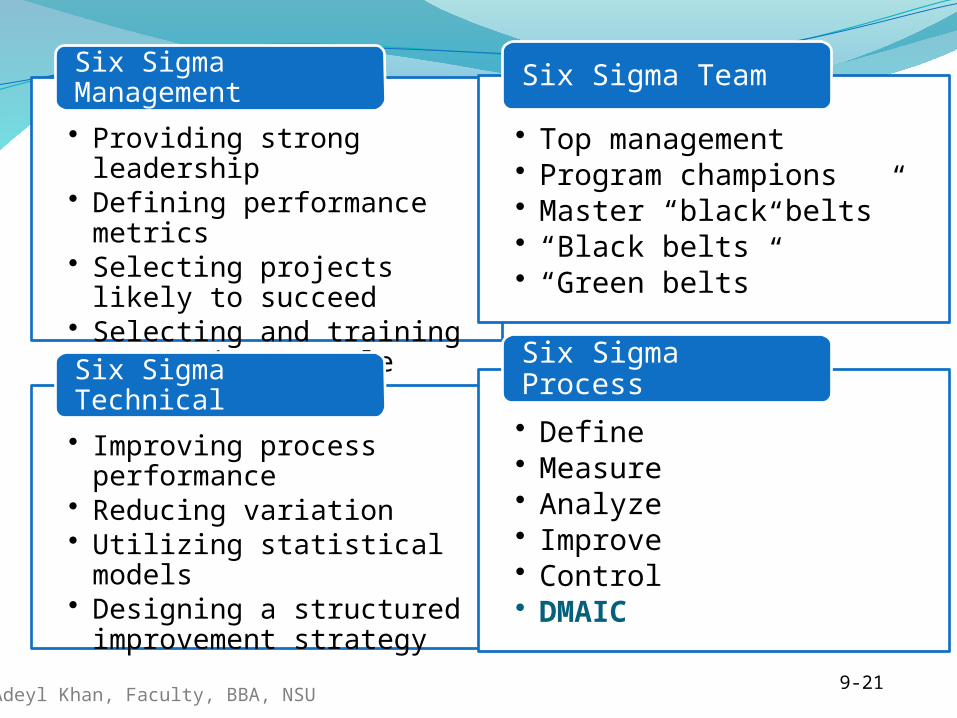
• Providing strong leadership
• Defining performance metrics
• Selecting projects likely to succeed
• Selecting and training appropriate people
Six Sigma Management
• Improving process performance
• Reducing variation• Utilizing statistical
models• Designing a structured
improvement strategy
Six Sigma Technical
• Top management• Program champions• Master “black belts”• “Black belts”• “Green belts”
Six Sigma Team
• Define• Measure• Analyze• Improve• Control• DMAIC
Six Sigma Process
Adeyl Khan, Faculty, BBA, NSU
Obstacles to Implementing TQM
Lack of: Company-wide definition of quality Strategic plan for change Customer focus Real employee empowerment Strong motivation Time to devote to quality initiatives Leadership
Poor inter-organizational communicationView of quality as a “quick fix”Emphasis on short-term financial resultsInternal political and “turf” wars
9-22
Adeyl Khan, Faculty, BBA, NSU
Criticisms of TQM
Blind pursuit of TQM programsPrograms may not be linked to strategiesQuality-related decisions may not be tied to market performanceFailure to carefully plan a program
9-23
Adeyl Khan, Faculty, BBA, NSU
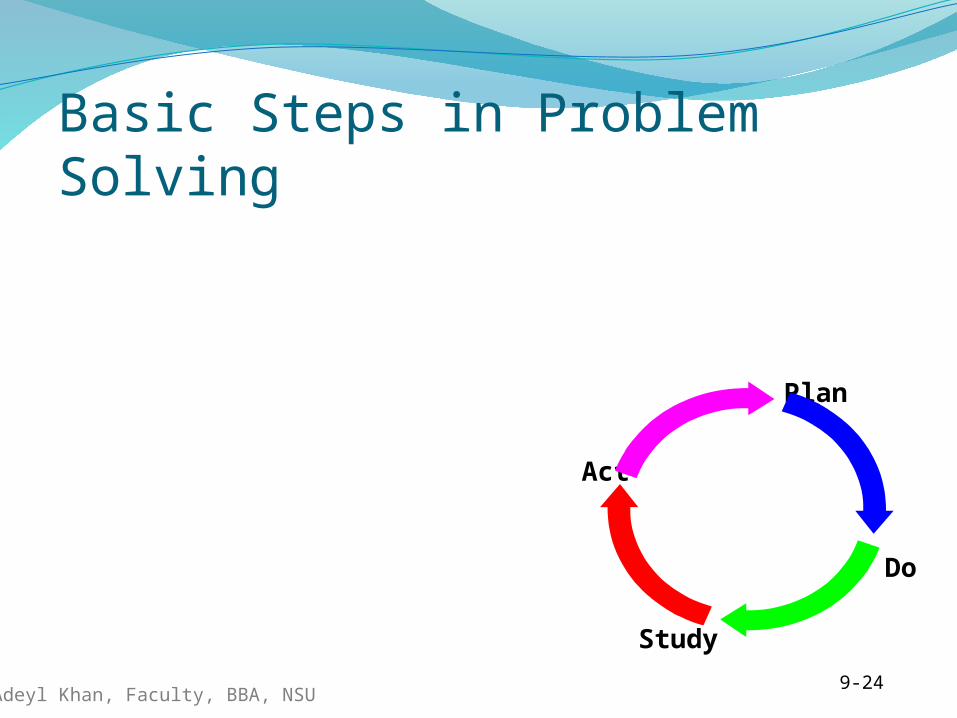
Basic Steps in Problem Solving
Define the problem and establish an improvement goalDefine measures and collect dataAnalyze the problemGenerate potential solutionsChoose a solutionImplement the solutionMonitor the solution to
see if it accomplishes the goal
9-24
Plan
Do
Study
Act
Adeyl Khan, Faculty, BBA, NSU
Process Improvement and Tools
Process improvement - a systematic approach to improving a process Process mapping Analyze the process Redesign the process
Tools There are a number of tools that can be used for problem solving and process improvement Tools aid in data collection and interpretation, and provide the basis for decision making
9-25
Adeyl Khan, Faculty, BBA, NSU
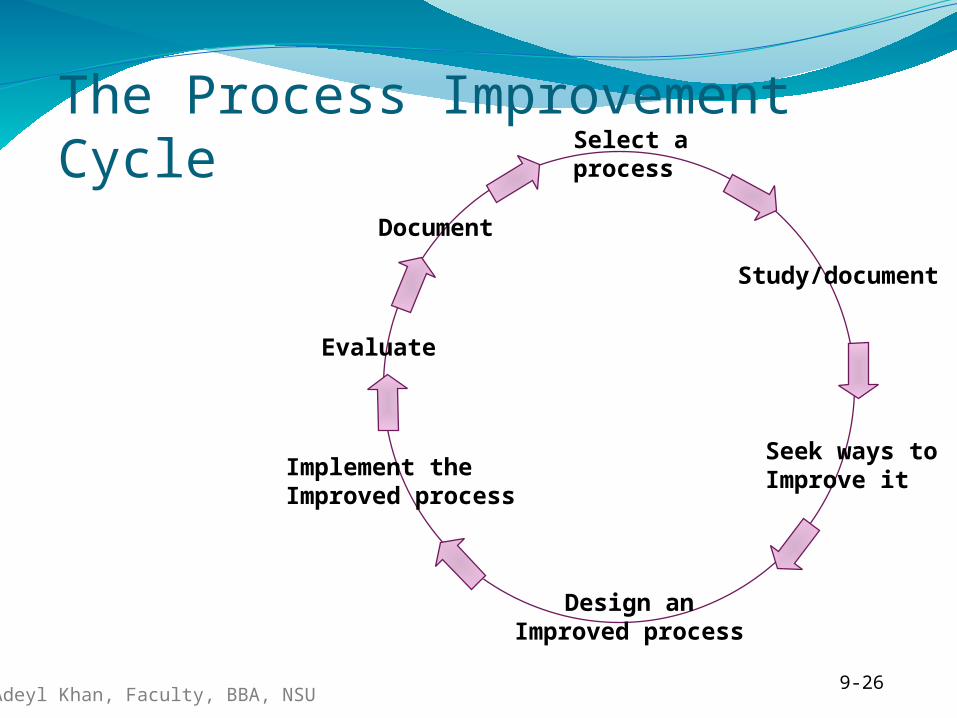
The Process Improvement Cycle
9-26
Implement theImproved process
Select aprocess
Study/document
Seek ways toImprove it
Design anImproved process
Evaluate
Document
Adeyl Khan, Faculty, BBA, NSU
Basic Quality Tools
FlowchartsCheck sheetsHistogramsPareto ChartsScatter diagramsControl chartsCause-and-effect diagramsRun charts
9-27
Adeyl Khan, Faculty, BBA, NSU
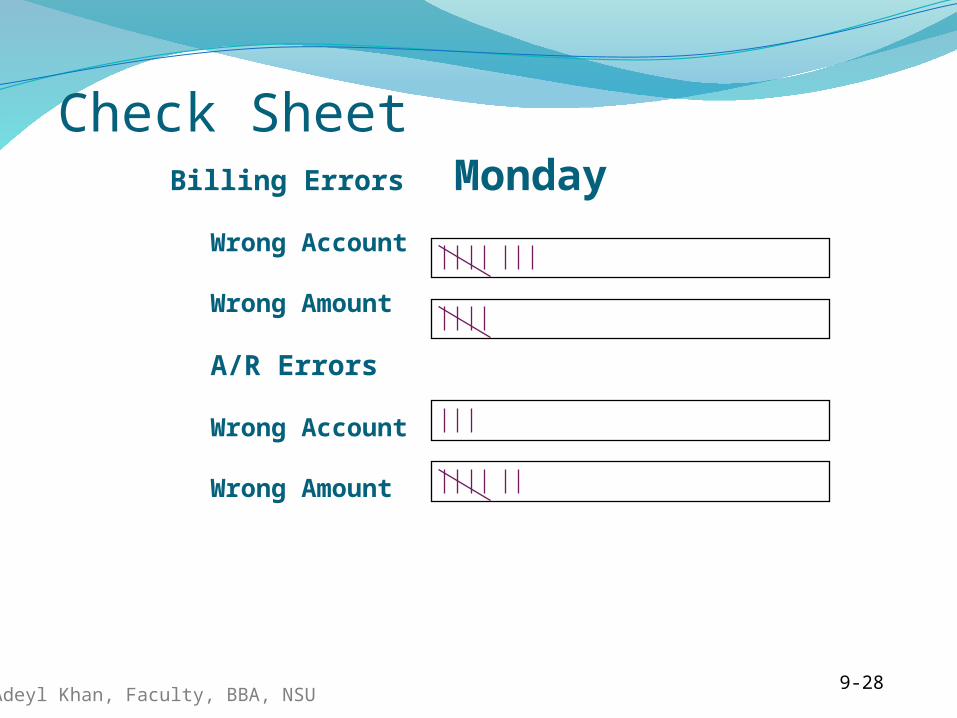
Check Sheet
9-28
Billing Errors
Wrong Account
Wrong Amount
A/R Errors
Wrong Account
Wrong Amount
Monday
Adeyl Khan, Faculty, BBA, NSU
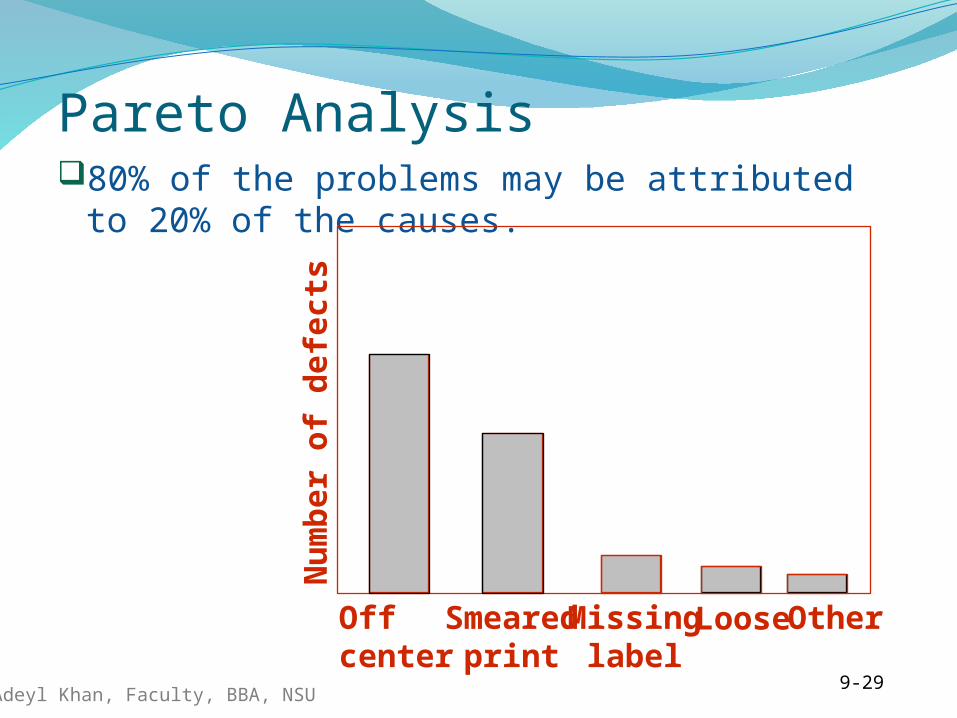
Pareto Analysis80% of the problems may be attributed to
20% of the causes.
9-29
Smearedprint
Nu
mb
er o
f d
efec
ts
Offcenter
Missinglabel
Loose Other
Adeyl Khan, Faculty, BBA, NSU
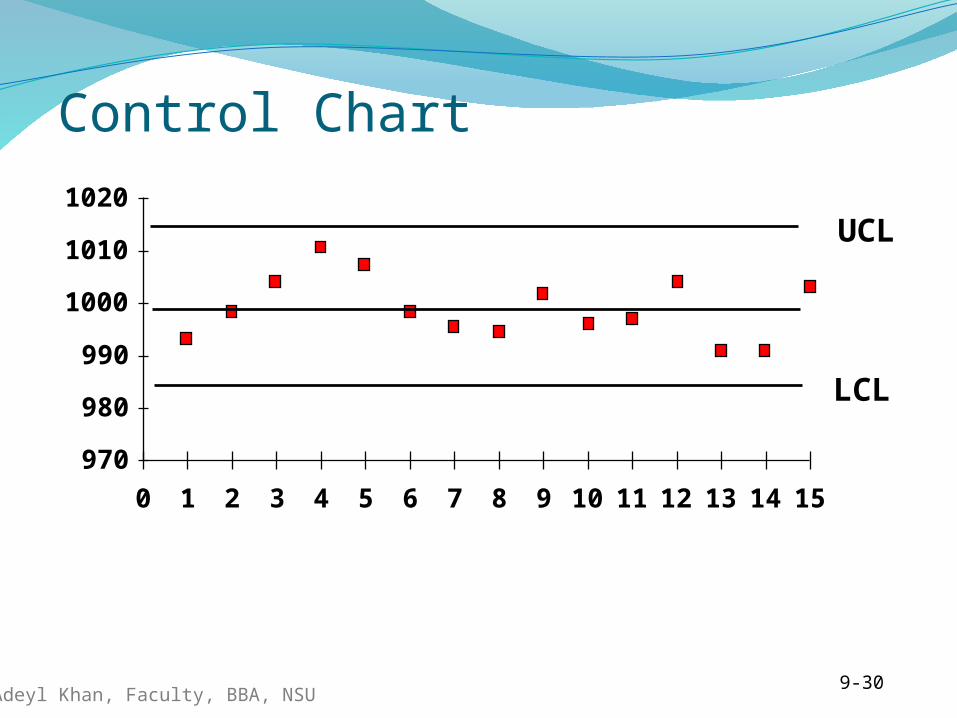
Control Chart
9-30
970
980
990
1000
1010
1020
0 1 2 3 4 5 6 7 8 9 10 11 12 13 14 15
UCL
LCL
Adeyl Khan, Faculty, BBA, NSU
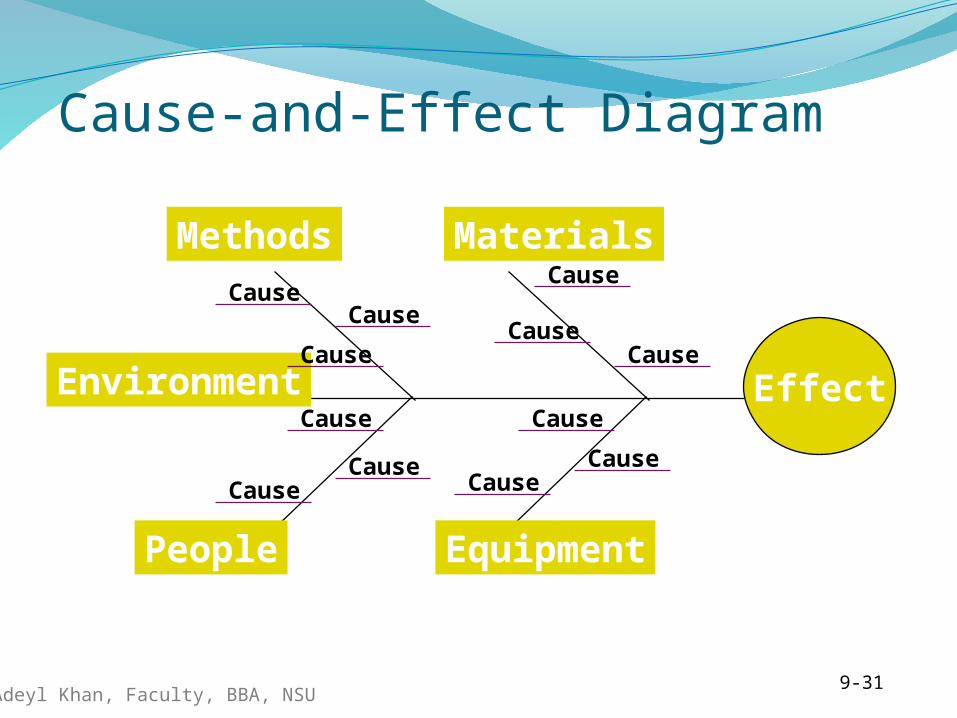
Cause-and-Effect Diagram
9-31
Effect
MaterialsMethods
EquipmentPeople
Environment
Cause
Cause
Cause
Cause
Cause
CauseCause
Cause
CauseCause
Cause
Cause
Adeyl Khan, Faculty, BBA, NSU
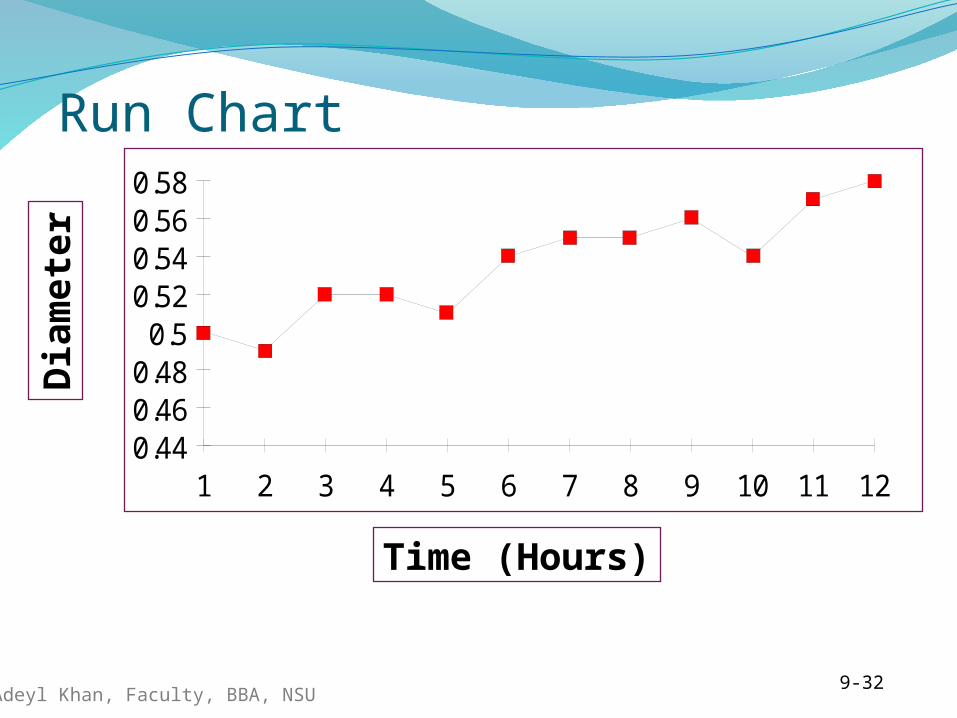
Run Chart
9-32
Time (Hours )
0.440.460.480.50.520.540.560.58
1 2 3 4 5 6 7 8 9 10 11 12
Time (Hours)
Dia
met
er
Adeyl Khan, Faculty, BBA, NSU
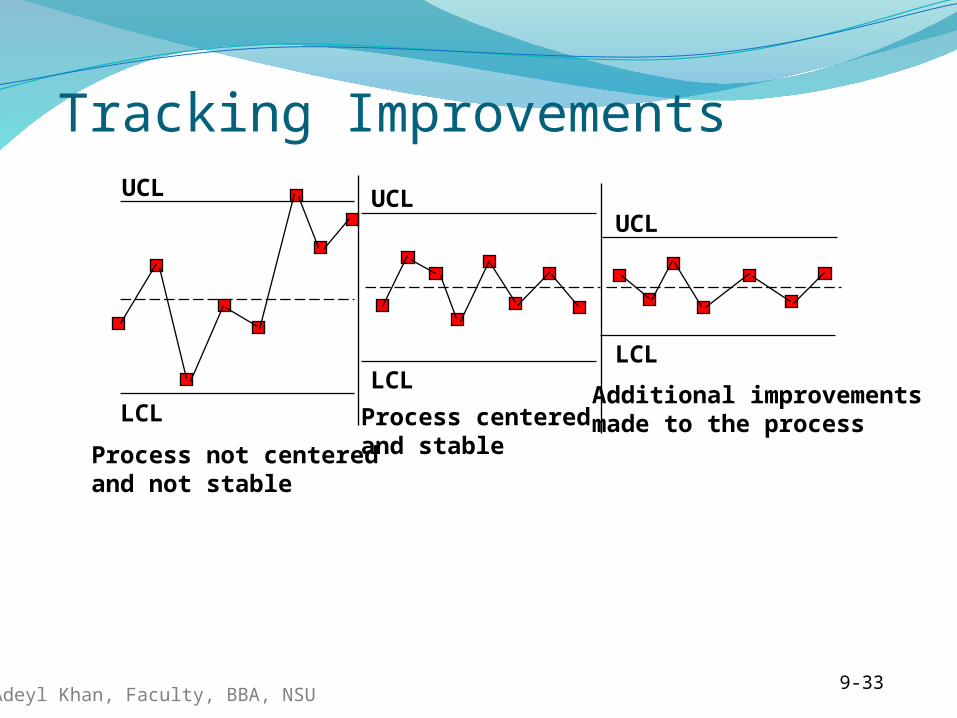
Tracking Improvements
9-33
UCL
LCL
LCLLCL
UCLUCL
Process not centeredand not stable
Process centeredand stable
Additional improvementsmade to the process
Adeyl Khan, Faculty, BBA, NSU
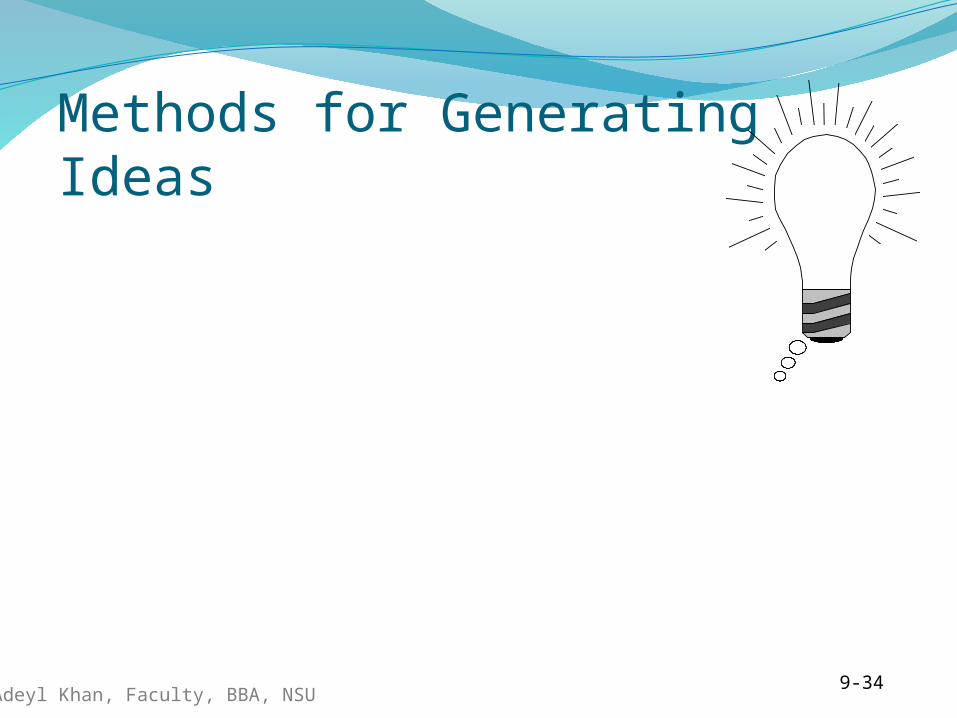
Methods for Generating Ideas
BrainstormingQuality circlesInterviewingBenchmarking5W2H
A method of asking questions about a process that includes what, why, ?, where, who, how and how much.
9-34

Adeyl Khan, Faculty, BBA, NSU
Adeyl Khan, Faculty, BBA, NSU
Quality Circles
Team approach List reduction Balance sheet Paired comparisons
9-36
Adeyl Khan, Faculty, BBA, NSU
Benchmarking Process
Identify a critical process that needs improvingIdentify an organization that excels in this processContact that organizationAnalyze the dataImprove the critical process
9-37