Embed Size (px)
Citation preview
`MODULE 1
ADEQUATE HOUSING AND SLUM UPGRADING
DRAFT DO NOTE CITE OR QUOTEREVIEWED: MARCH 2018
2 | MODULE 1
TARGET 11.1: By 2030, ensure access for all to adequate, safe and affordable housing and basic services and upgrade slums
Indicator 11.1.1: Proportion of urban population living in slums, informal settlements or inadequate housing
ADEQUATE HOUSING AND SLUM UPGRADING
3 | MODULE 1
1. INTRODUCTION
1.1 Background
Sixty per cent of the global population will live
in cities by 2030, with 90% of urban growth
in coming decades likely to occur in low- and
middle-income countries. Current urbanization
trends indicate that an additional three billion
people will be living in cities by 2050, increasing
the urban share of the world’s population to
two-thirds. In fact, 95% of the growth in urban
areas in the next two decades will occur in
cities, making them home to more than 4 billion
people, and translating to about 80% of future
urban population.
The steady trend towards urbanization will
influence virtually every facet of human
endeavor in the coming years, including health,
economic, social, and environmental. In many
parts of the world, especially in developing
countries, high rates of urbanization have
unfolded in context of stagnating economies
and poor planning and governance, creating
a new face of abject poverty concentrated in
slums or informal settlements in major cities.
Indeed, the unprecedented proliferation of slums
and informal settlements in the world especially
in developing countries, and a chronic lack of
adequate housing, continue to be among the
major challenges of urbanization today. Slums,
informal settlements and inadequate housing
remain the visible manifestations of poverty and
inequality in cities.
At present, it is estimated that one in eight
people in the world live in slums or experience
slum-like conditions around their housing
environments’. Over the next 15 years, it is
estimated that more than three billion people
will need adequate housing. The housing and
slum challenge therefore remains a critical
factor in the persistence of poverty in the world,
depriving millions of urban residents their right
to an adequate standard of living and housing,
excluding them from the benefits of sustainable
urbanisation.
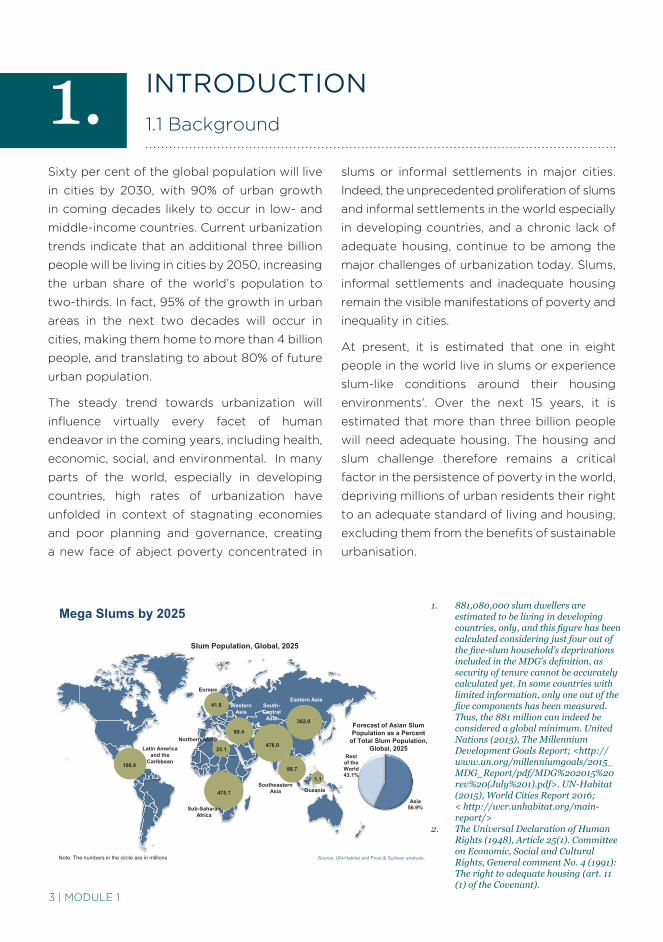
Mega Slums by 2025
Asia 56.9%
Rest of the World43.1%
Slum Population, Global, 2025
1.1
Oceania
25.1
Northern Africa
41.8
88.7
Europe
Southeastern Asia
89.4
Western Asia
196.8
Latin America and the
Caribbean
362.0
Eastern Asia
475.7
476.0
South-Central
Asia
Sub-Saharan Africa
Source: UN-Habitat and Frost & Sullivan analysis.
Forecast of Asian Slum Population as a Percent
of Total Slum Population, Global, 2025
Note: The numbers in the circle are in millions
1. 881,080,000 slum dwellers are estimated to be living in developing countries, only, and this figure has been calculated considering just four out of the five-slum household’s deprivations included in the MDG’s definition, as security of tenure cannot be accurately calculated yet. In some countries with limited information, only one out of the five components has been measured. Thus, the 881 million can indeed be considered a global minimum. United Nations (2015), The Millennium Development Goals Report; <http://www.un.org/millenniumgoals/2015_MDG_Report/pdf/MDG%202015%20rev%20(July%201).pdf>. UN-Habitat (2015), World Cities Report 2016; < http://wcr.unhabitat.org/main-report/>
2. The Universal Declaration of Human Rights (1948), Article 25(1). Committee on Economic, Social and Cultural Rights, General comment No. 4 (1991): The right to adequate housing (art. 11 (1) of the Covenant).
4 | MODULE 1
In order to design and implement appropriate
policies and programs to respond to the housing
challenges worldwide, it is important to identify
and quantify the proportion of the population
that lives in slums within urban areas, those
living in informal settlements or those who have
inadequate housing.
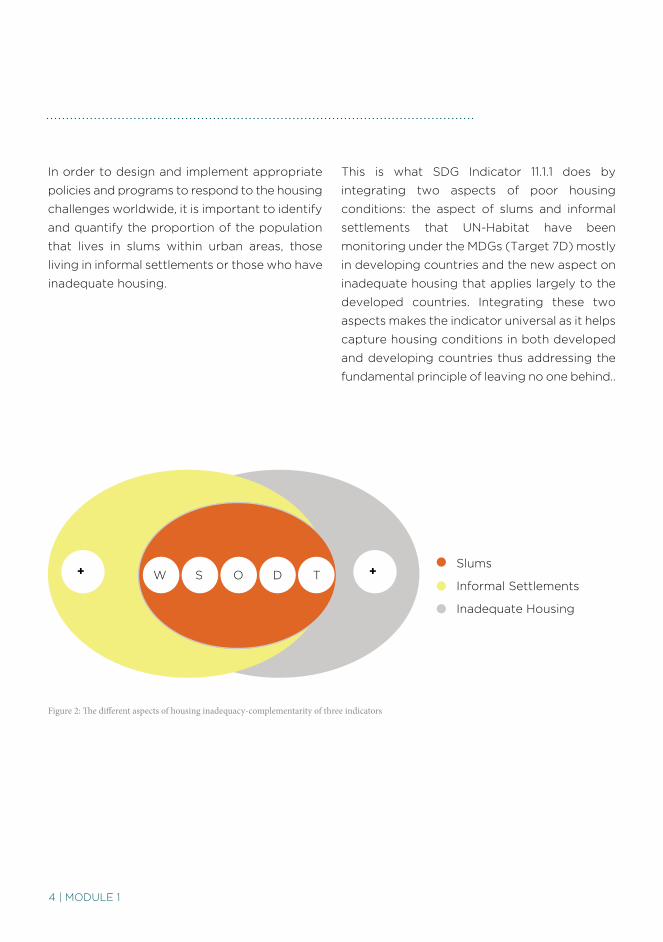
This is what SDG Indicator 11.1.1 does by
integrating two aspects of poor housing
conditions: the aspect of slums and informal
settlements that UN-Habitat have been
monitoring under the MDGs (Target 7D) mostly
in developing countries and the new aspect on
inadequate housing that applies largely to the
developed countries. Integrating these two
aspects makes the indicator universal as it helps
capture housing conditions in both developed
and developing countries thus addressing the
fundamental principle of leaving no one behind..
Figure 2: The different aspects of housing inadequacy-complementarity of three indicators
+ +W S O D TSlums
Informal Settlements
Inadequate Housing
5 | MODULE 1
1.2 Rationale for Monitoring
In general, monitoring promotes higher
accountability, better performance assessment
and strong coordination between central
governments and the regional and local
governments. It enables cities to collect
accurate, timely, disaggregated data and
information, adopting a systemic approach to
the city, with clear policy implications that are
based on evidence. This way, countries and
cities are able to make appropriate decision on
the best actions to adopt, whilst systematically
documenting their performance at the outcome
and impact levels.
The purpose of monitoring progress against
the SDG 11 Target 11.1 is to provide necessary
and timely information to decision makers and
stakeholders in order to make informed decision
to accelerate progress towards access for all
to adequate, safe and affordable housing and
basic services and upgrade slums. A range
of interrelated factors usually underlines the
proliferation of both slums and inadequate
housing. These may vary from weaknesses
in housing policies, poor planning and land
management, urban migration related to urban
densification, disasters, conflicts, long-term
poverty as well as the lack of affordable housing.
All these factors point to the fact that the
measurement of all the aspects of the indicator
will provide a broad field for analysis of the urban
related issues towards achieving Agenda 2030.
As such, monitoring and reporting on Indicator
11.1.1 is extremely relevant as it integrates the
elements of MDG 7 Target 7D with the SDGs
broader spectrum of housing informality and
inadequacy.
6 | MODULE 1
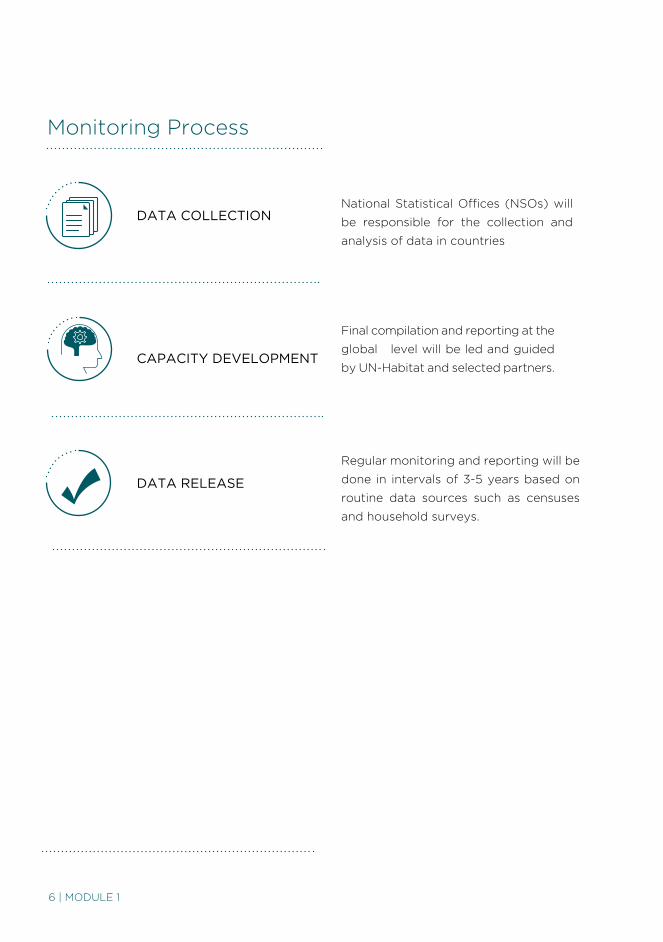
National Statistical Offices (NSOs) will
be responsible for the collection and
analysis of data in countries
Final compilation and reporting at the
global level will be led and guided
by UN-Habitat and selected partners.
Regular monitoring and reporting will be
done in intervals of 3-5 years based on
routine data sources such as censuses
and household surveys.
Monitoring Process
DATA COLLECTION
CAPACITY DEVELOPMENT
DATA RELEASE
7 | MODULE 1
There are a number of interrelated terms
that have to be tackled when considering an
indicator for the SDG Target 11.1. They include
inadequate housing and housing affordability,
informal settlements and slums.
a) Slums
Slum Households are defined as one in which
the inhabitants suffer from one or more of the
following:
1) Lack of access to improved water source,
2) Lack of access to improved sanitation
facilities,
3) Lack of sufficient living area, 4) Lack of
housing durability and 5) Lack of security
of tenure.
UN-Habitat defines a slum household in
operational terms, as lacking one or more of
the following indicators: a durable housing
structure; access to clean water; access to
improved sanitation; sufficient living space; and
secure tenure. The first four rely on conventional
definitions; the last is the most difficult to assess
and is not currently used in slum measurement
(UN-Habitat, 2003).
There is some evidence that the elements that
make up the slum definition feature among slum
dwellers’ chief concerns.
1.3 Concepts and Definitions
Example; in a study of Nairobi slums (World Bank, 2006) respondents identified access to basic infrastructure, such as toilets, water supply, among others, as their priority. A survey conducted in the 1990s by Thailand’s National
Housing Authority showed that tenure insecurity featured among the top concerns for slum dwellers (National
Housing Authority, 1992). Of course, residents of slum settlements require improvements in a number of areas
that go beyond those included in the slum definition (e.g. access to jobs and income-generating opportunities, schools and hospitals and access to other basic infrastructure, such
as streets, roads, street lighting).
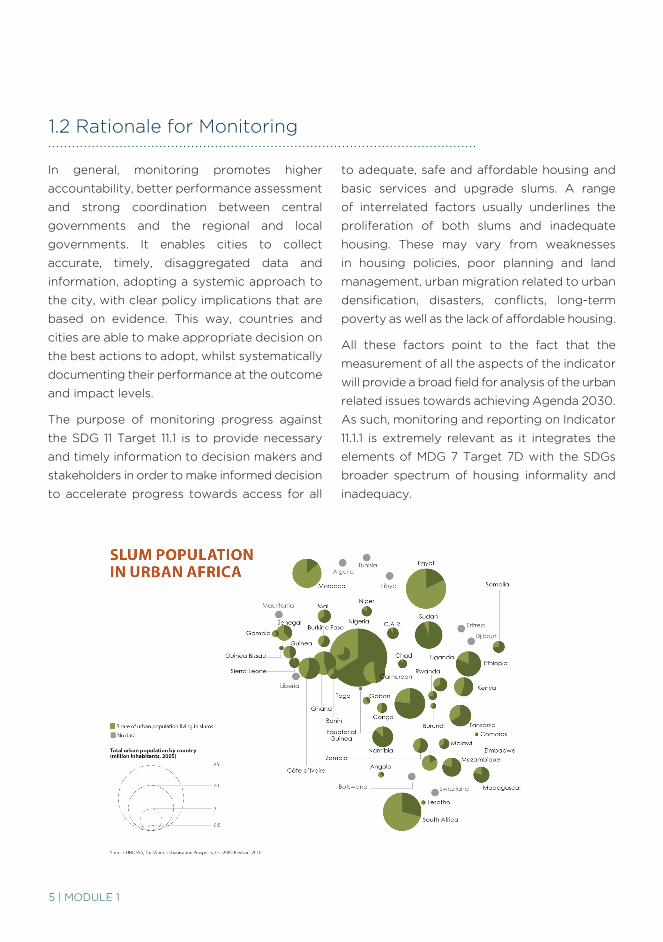
UN-Habitat puts the global estimate of slum populations at 881 million as of 2014 and just under a third of all urban-
dwellers in the developing world (UN-Habitat, 2014).
Sub-Saharan Africa is the region with the highest proportion of the urban population living in slums – over 50% compared to figures ranging between 20% and 31%
for other regions of the world.
Source: Authors’ elaboration based on UN-Habitat (2003), Gilbert
(2007), World Bank (2006), and National Housing Authority
(1992).
Author: Paula Lucci, Tanvi Bhatkal, Amina Khan and Tom
Berliner; Paper: What works in improving the living conditions of
slum dwellers: A review of the evidence across four programmes

8 | MODULE 1
Figure 1.1: Slum Basic Attributes
sanitation
living area
structuretenure
improved water
9 | MODULE 1
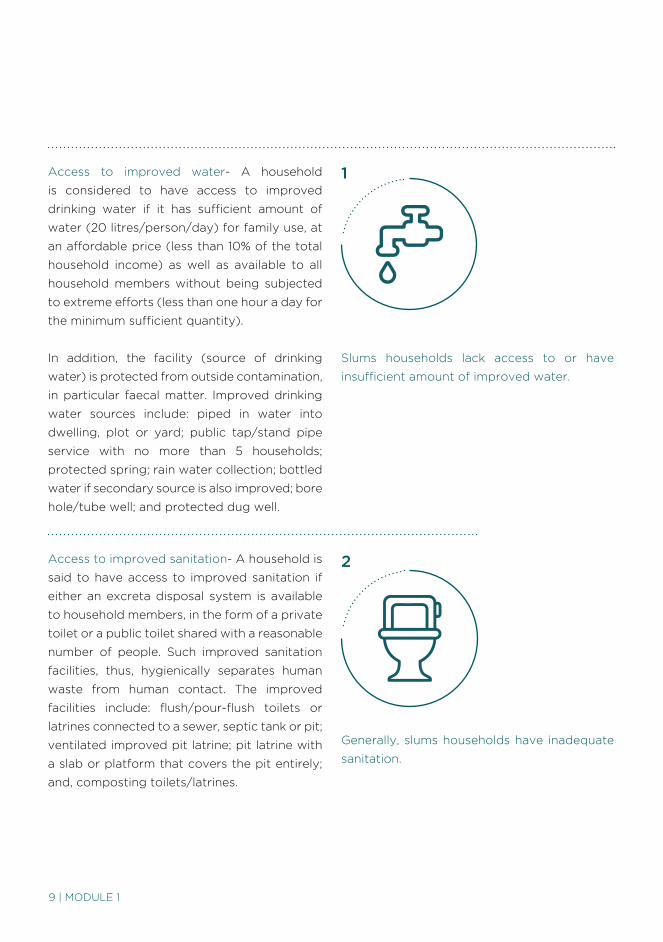
Access to improved water- A household
is considered to have access to improved
drinking water if it has sufficient amount of
water (20 litres/person/day) for family use, at
an affordable price (less than 10% of the total
household income) as well as available to all
household members without being subjected
to extreme efforts (less than one hour a day for
the minimum sufficient quantity).
In addition, the facility (source of drinking
water) is protected from outside contamination,
in particular faecal matter. Improved drinking
water sources include: piped in water into
dwelling, plot or yard; public tap/stand pipe
service with no more than 5 households;
protected spring; rain water collection; bottled
water if secondary source is also improved; bore
hole/tube well; and protected dug well.
Access to improved sanitation- A household is
said to have access to improved sanitation if
either an excreta disposal system is available
to household members, in the form of a private
toilet or a public toilet shared with a reasonable
number of people. Such improved sanitation
facilities, thus, hygienically separates human
waste from human contact. The improved
facilities include: flush/pour-flush toilets or
latrines connected to a sewer, septic tank or pit;
ventilated improved pit latrine; pit latrine with
a slab or platform that covers the pit entirely;
and, composting toilets/latrines.
Slums households lack access to or have
insufficient amount of improved water.
Generally, slums households have inadequate
sanitation.
1
2
10 | MODULE 1
Sufficient living area- Household dwelling unit
provides sufficient living area for the household
members if not more than three people share
the same habitable room.
Structural quality/durability of dwellings–A
house is considered as ‘durable’ if it is built on
a non-hazardous location and has a permanent
and adequate structure able to protect its
inhabitants from the extremes of climatic
conditions such as rain, heat, cold, and humidity.
In order to determine the household durability,
consider the following elements:
1. Permanency of structure (permanent
building material for the walls, roof and
floor; compliance with building codes; the
dwelling is not in a dilapidated state; the
dwelling is not in need of major repair); and
2. Location of house (The house is not located
on or near toxic waste, in a flood plain, not
located on a steep slope, not located in a
dangerous right of way of rail, highway,
airport, and power lines).
Houses in slums are mostly made of
transitory corrugated iron sheets, sacks,
wood and are located on or near toxic
waste, steep slope, or dangerously in the
way of transport lines.
3
4
Slum households are typically squeezed, having
more than three individuals sharing the same
habitable room.
11 | MODULE 1
Security of tenure- A housing structure should
be accompanied by security of tenure. This
means that the members of the household
should have a legal status against arbitrary
unlawful eviction, harassment as well as any
other threats. The housing structure should
have statutory or customary law or informal or
hybrid arrangements that safeguard the house
members against forced evictions.
b) Informal Settlements:
Informal settlements are residential areas where:
1. Inhabitants have no security of tenure vis-
à-vis the land or dwellings they inhabit,
with modalities ranging from squatting to
informal rental housing,
2. The neighbourhoods usually lack, or are
cut off from basic services and formal city
infrastructure,
3. The housing may not comply with current
planning and building regulations, situated
in geographically and environmentally
hazardous areas, and may lack a municipal
permit.
5
Informal settlements can be a form of real estate speculation for all income levels of urban residents, affluent and poor. Among them, slums
are the poorest and most dilapidated form of informal settlements.
Thus, informality should not be understood as an income-based denomination that stigmatises the poor. Rather, informal settlements’ estimates
should be based on a technical compliance relevant to all income levels related to the above criteria.
For example, a valid municipal permit could be a reliable indication of formality.
Most slum residents lack security of tenure for
their housing units.
12 | MODULE 1
c) Inadequate Housing:
A housing unit is considered adequate if at a
minimum it meets the following criteria:
1. Legal security of tenure, which guarantees
legal protection against forced evictions,
harassment and other threats;
2. Availability of services, materials, facilities
and infrastructure, including safe drinking
water, adequate sanitation, energy for
cooking, heating, lighting, food storage or
refuse disposal;
3. Affordability, as housing is not adequate
if its cost threatens or compromises the
occupants’ enjoyment of other human
rights;
4. Habitability, as housing is not adequate
if it does not guarantee physical safety
or provide adequate space, as well as
protection against the cold, damp, heat,
rain, wind, other threats to health and
structural hazards;
5. Accessibility, as housing is not adequate
if the specific needs of disadvantaged and
marginalized groups are not taken into
account (such as the poor, people facing
discrimination; persons with disabilities,
victims of natural disasters);
6. Location, as housing is not adequate if it is cut
off from employment opportunities, health-
care services, schools, childcare centres and
other social facilities, or if located in dangerous
or polluted sites or in immediate proximity to
pollution sources; and
7. Cultural adequacy, as housing is not adequate
if it does not respect and take into account
the expression of cultural identity and ways
of life.
13 | MODULE 1
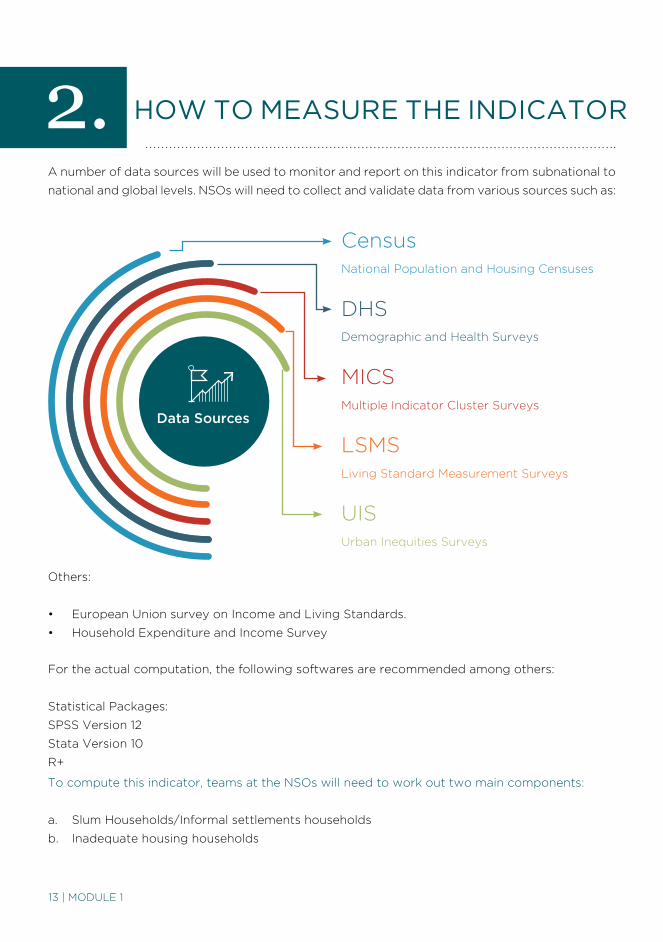
HOW TO MEASURE THE INDICATOR
A number of data sources will be used to monitor and report on this indicator from subnational to
national and global levels. NSOs will need to collect and validate data from various sources such as:
Others:
• European Union survey on Income and Living Standards.
• Household Expenditure and Income Survey
2.
For the actual computation, the following softwares are recommended among others:
Statistical Packages:
SPSS Version 12
Stata Version 10
R+
Data Sources
CensusNational Population and Housing Censuses
DHSDemographic and Health Surveys
MICSMultiple Indicator Cluster Surveys
LSMSLiving Standard Measurement Surveys
UISUrban Inequities Surveys
To compute this indicator, teams at the NSOs will need to work out two main components:
a. Slum Households/Informal settlements households
b. Inadequate housing households
14 | MODULE 1
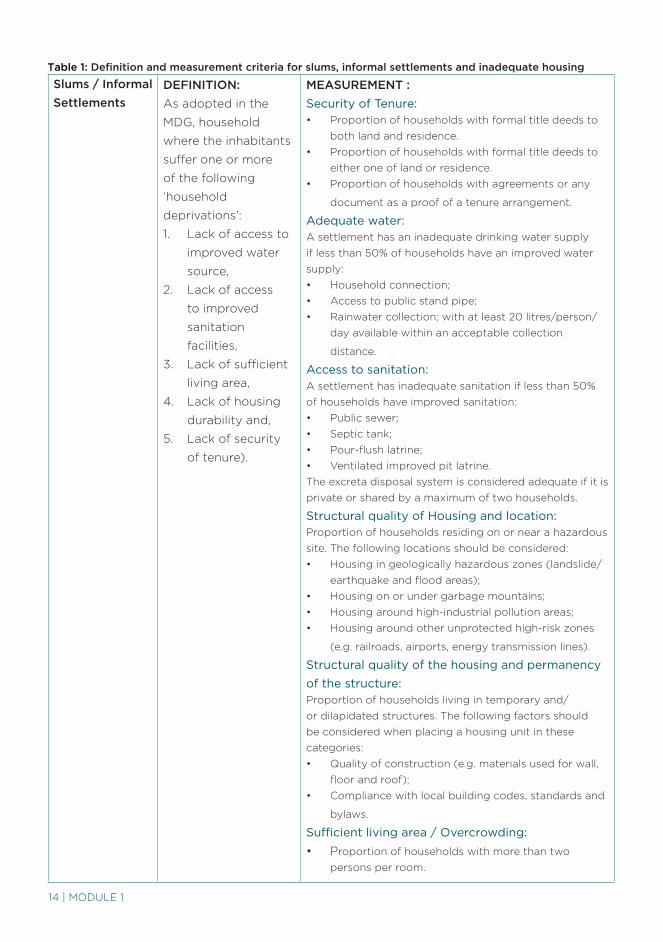
Slums / Informal
Settlements
DEFINITION:
As adopted in the
MDG, household
where the inhabitants
suffer one or more
of the following
‘household
deprivations’:
1. Lack of access to
improved water
source,
2. Lack of access
to improved
sanitation
facilities,
3. Lack of sufficient
living area,
4. Lack of housing
durability and,
5. Lack of security
of tenure).
MEASUREMENT :
Security of Tenure:• Proportion of households with formal title deeds to
both land and residence.• Proportion of households with formal title deeds to
either one of land or residence.• Proportion of households with agreements or any
document as a proof of a tenure arrangement.
Adequate water:A settlement has an inadequate drinking water supply if less than 50% of households have an improved water supply:• Household connection;• Access to public stand pipe;• Rainwater collection; with at least 20 litres/person/
day available within an acceptable collection
distance.
Access to sanitation:A settlement has inadequate sanitation if less than 50% of households have improved sanitation:• Public sewer;• Septic tank;• Pour-flush latrine;• Ventilated improved pit latrine.The excreta disposal system is considered adequate if it is private or shared by a maximum of two households.
Structural quality of Housing and location: Proportion of households residing on or near a hazardous site. The following locations should be considered:• Housing in geologically hazardous zones (landslide/
earthquake and flood areas);• Housing on or under garbage mountains;• Housing around high-industrial pollution areas;• Housing around other unprotected high-risk zones
(e.g. railroads, airports, energy transmission lines).
Structural quality of the housing and permanency
of the structure:Proportion of households living in temporary and/or dilapidated structures. The following factors should be considered when placing a housing unit in these categories: • Quality of construction (e.g. materials used for wall,
floor and roof);• Compliance with local building codes, standards and
bylaws.
Sufficient living area / Overcrowding:
• Proportion of households with more than two persons per room.
Table 1: Definition and measurement criteria for slums, informal settlements and inadequate housing
15 | MODULE 1
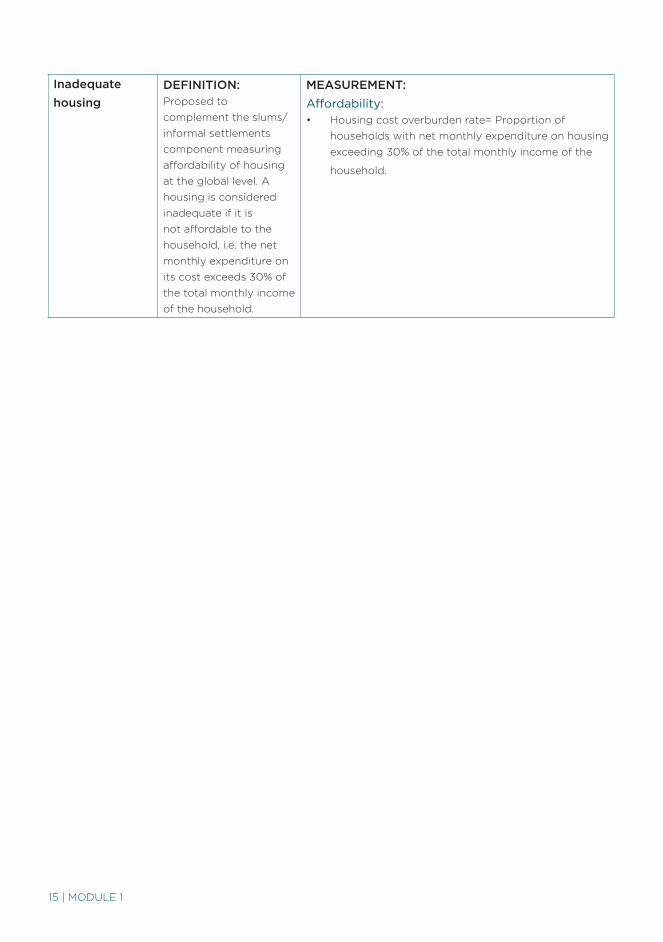
Inadequate
housing
DEFINITION: Proposed to complement the slums/informal settlements component measuring affordability of housing at the global level. A housing is considered inadequate if it is not affordable to the household, i.e. the net monthly expenditure on its cost exceeds 30% of the total monthly income of the household.
MEASUREMENT:
Affordability: • Housing cost overburden rate= Proportion of
households with net monthly expenditure on housing exceeding 30% of the total monthly income of the
household.
16 | MODULE 1
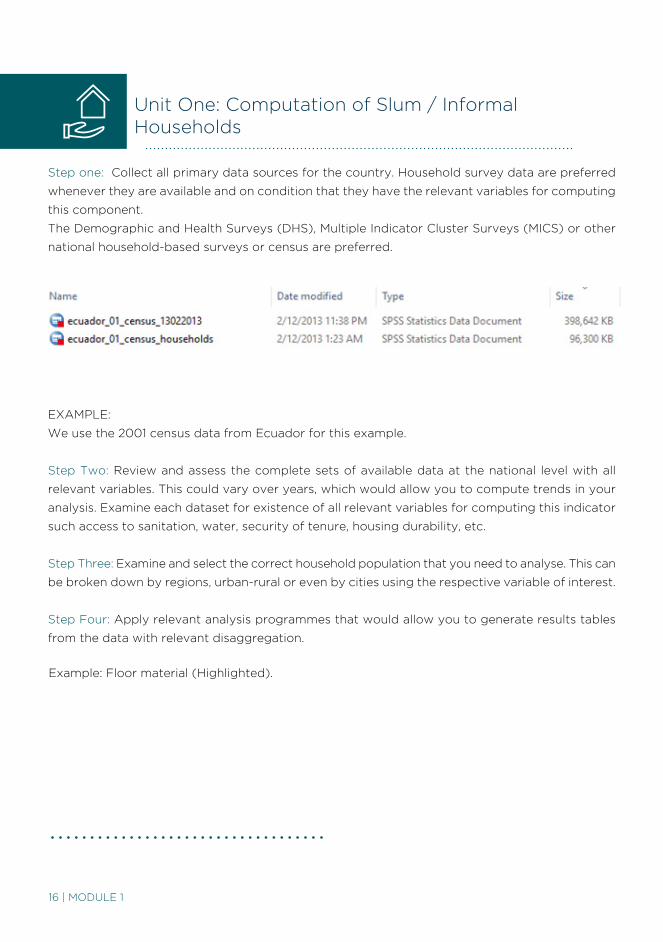
Step one: Collect all primary data sources for the country. Household survey data are preferred
whenever they are available and on condition that they have the relevant variables for computing
this component.
The Demographic and Health Surveys (DHS), Multiple Indicator Cluster Surveys (MICS) or other
national household-based surveys or census are preferred.
EXAMPLE:
We use the 2001 census data from Ecuador for this example.
Step Two: Review and assess the complete sets of available data at the national level with all
relevant variables. This could vary over years, which would allow you to compute trends in your
analysis. Examine each dataset for existence of all relevant variables for computing this indicator
such access to sanitation, water, security of tenure, housing durability, etc.
Step Three: Examine and select the correct household population that you need to analyse. This can
be broken down by regions, urban-rural or even by cities using the respective variable of interest.
Step Four: Apply relevant analysis programmes that would allow you to generate results tables
from the data with relevant disaggregation.
Unit One: Computation of Slum / Informal Households
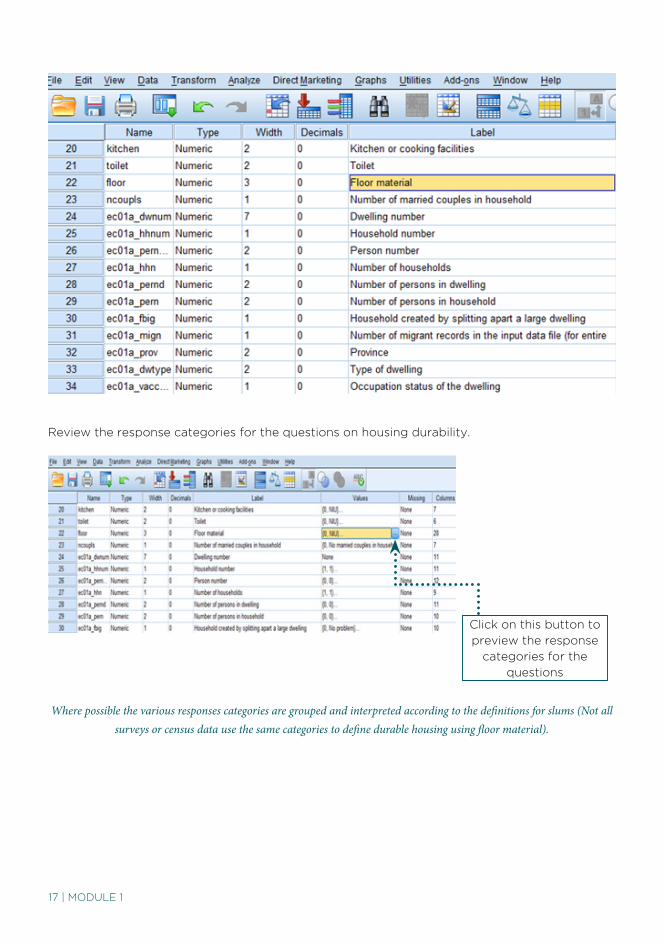
Example: Floor material (Highlighted).
17 | MODULE 1
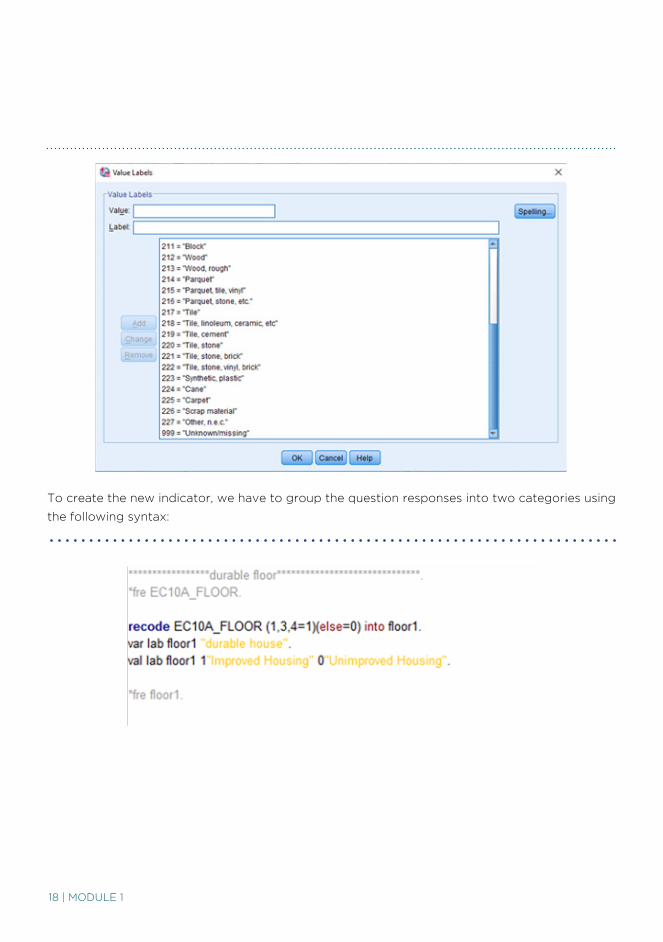
Review the response categories for the questions on housing durability.
Where possible the various responses categories are grouped and interpreted according to the definitions for slums (Not all surveys or census data use the same categories to define durable housing using floor material).
Click on this button to
preview the response
categories for the
questions
18 | MODULE 1
To create the new indicator, we have to group the question responses into two categories using
the following syntax:
19 | MODULE 1
This should be done for the response categories for the questions on access to improved water,
improved sanitation, sufficient living area, improved housing and lack of security of tenure for slums
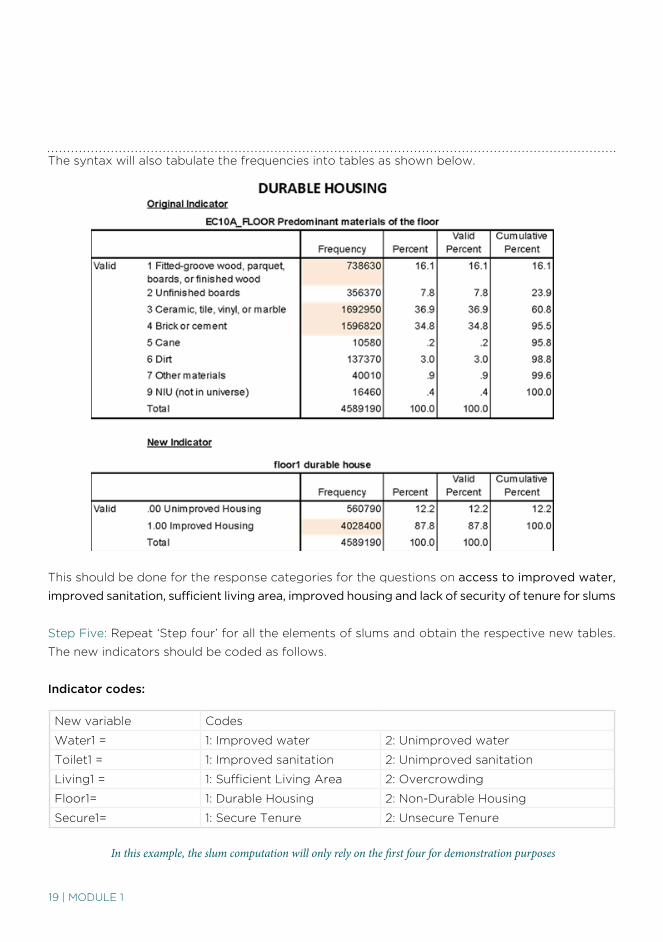
Step Five: Repeat ‘Step four’ for all the elements of slums and obtain the respective new tables.
The new indicators should be coded as follows.
Indicator codes:
In this example, the slum computation will only rely on the first four for demonstration purposes
New variable Codes
Water1 = 1: Improved water 2: Unimproved water
Toilet1 = 1: Improved sanitation 2: Unimproved sanitation
Living1 = 1: Sufficient Living Area 2: Overcrowding
Floor1= 1: Durable Housing 2: Non-Durable Housing
Secure1= 1: Secure Tenure 2: Unsecure Tenure
The syntax will also tabulate the frequencies into tables as shown below.
20 | MODULE 1
Step Six: Using the new variables with focus only on urban households, identified in ‘Step four’, we
compute the slum household by the respective deprivation (These form part of the quantifiable
derivatives for the measurement of target 11.1) as shown below.
Shelter Deprivation measures the number of components a household does not have i.e.:
1. One Shelter Deprivation - household has 3 components and is only missing 1 other component.
2. Two Shelter Deprivation - household has 2 components and is only missing 2 other components.
3. Three Shelter Deprivation - household has 1 component and is only missing 3 other components.
4. Four Shelter Deprivation - household has NONE of the required components
Slum = One Shelter Deprivation + Two Shelter Deprivation + Three Shelter Deprivation
+ Four Shelter Deprivation
The shelter deprivation is computed using four sub-steps.
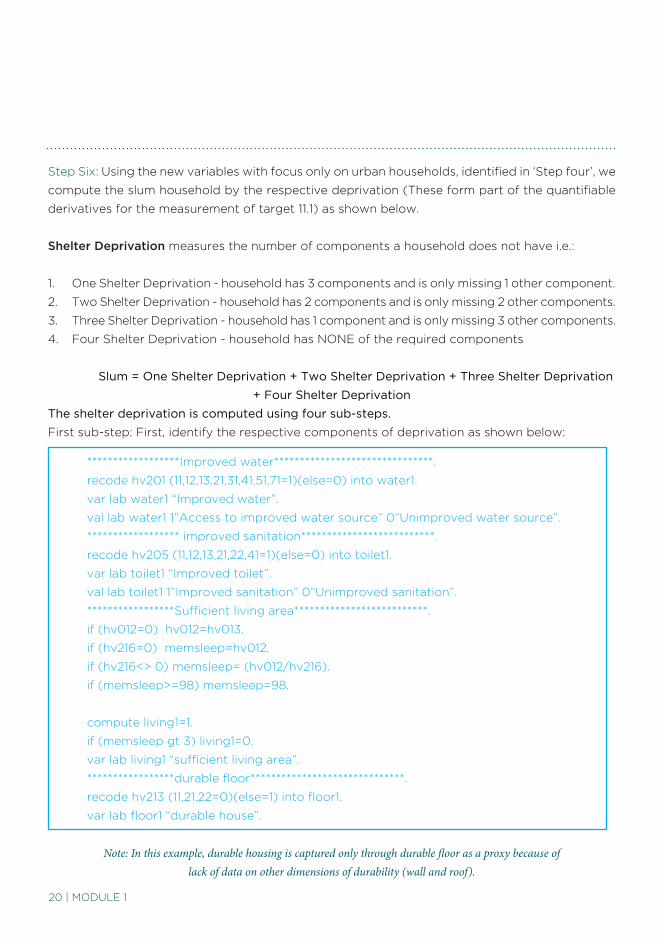
First sub-step: First, identify the respective components of deprivation as shown below:
******************Improved water*******************************.
recode hv201 (11,12,13,21,31,41,51,71=1)(else=0) into water1.
var lab water1 “Improved water”.
val lab water1 1”Access to improved water source” 0”Unimproved water source”.
****************** improved sanitation**************************.
recode hv205 (11,12,13,21,22,41=1)(else=0) into toilet1.
var lab toilet1 “Improved toilet”.
val lab toilet1 1”Improved sanitation” 0”Unimproved sanitation”.
*****************Sufficient living area**************************.
if (hv012=0) hv012=hv013.
if (hv216=0) memsleep=hv012.
if (hv216<> 0) memsleep= (hv012/hv216).
if (memsleep>=98) memsleep=98.
compute living1=1.
if (memsleep gt 3) living1=0.
var lab living1 “sufficient living area”.
*****************durable floor******************************.
recode hv213 (11,21,22=0)(else=1) into floor1.
var lab floor1 “durable house”.
Note: In this example, durable housing is captured only through durable floor as a proxy because of lack of data on other dimensions of durability (wall and roof).
21 | MODULE 1
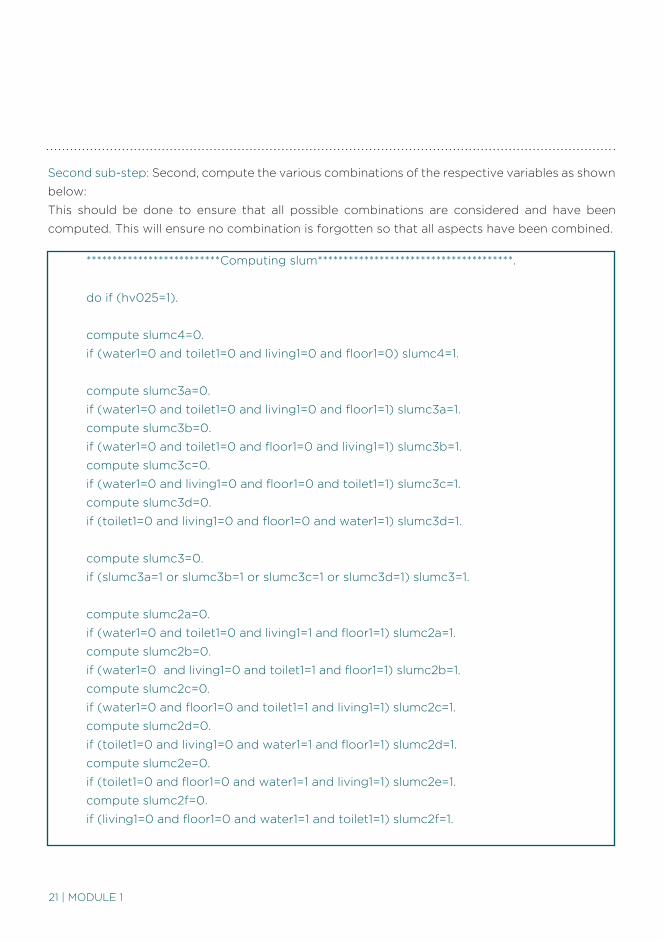
Second sub-step: Second, compute the various combinations of the respective variables as shown
below:
This should be done to ensure that all possible combinations are considered and have been
computed. This will ensure no combination is forgotten so that all aspects have been combined.
**************************Computing slum**************************************.
do if (hv025=1).
compute slumc4=0.
if (water1=0 and toilet1=0 and living1=0 and floor1=0) slumc4=1.
compute slumc3a=0.
if (water1=0 and toilet1=0 and living1=0 and floor1=1) slumc3a=1.
compute slumc3b=0.
if (water1=0 and toilet1=0 and floor1=0 and living1=1) slumc3b=1.
compute slumc3c=0.
if (water1=0 and living1=0 and floor1=0 and toilet1=1) slumc3c=1.
compute slumc3d=0.
if (toilet1=0 and living1=0 and floor1=0 and water1=1) slumc3d=1.
compute slumc3=0.
if (slumc3a=1 or slumc3b=1 or slumc3c=1 or slumc3d=1) slumc3=1.
compute slumc2a=0.
if (water1=0 and toilet1=0 and living1=1 and floor1=1) slumc2a=1.
compute slumc2b=0.
if (water1=0 and living1=0 and toilet1=1 and floor1=1) slumc2b=1.
compute slumc2c=0.
if (water1=0 and floor1=0 and toilet1=1 and living1=1) slumc2c=1.
compute slumc2d=0.
if (toilet1=0 and living1=0 and water1=1 and floor1=1) slumc2d=1.
compute slumc2e=0.
if (toilet1=0 and floor1=0 and water1=1 and living1=1) slumc2e=1.
compute slumc2f=0.
if (living1=0 and floor1=0 and water1=1 and toilet1=1) slumc2f=1.
22 | MODULE 1
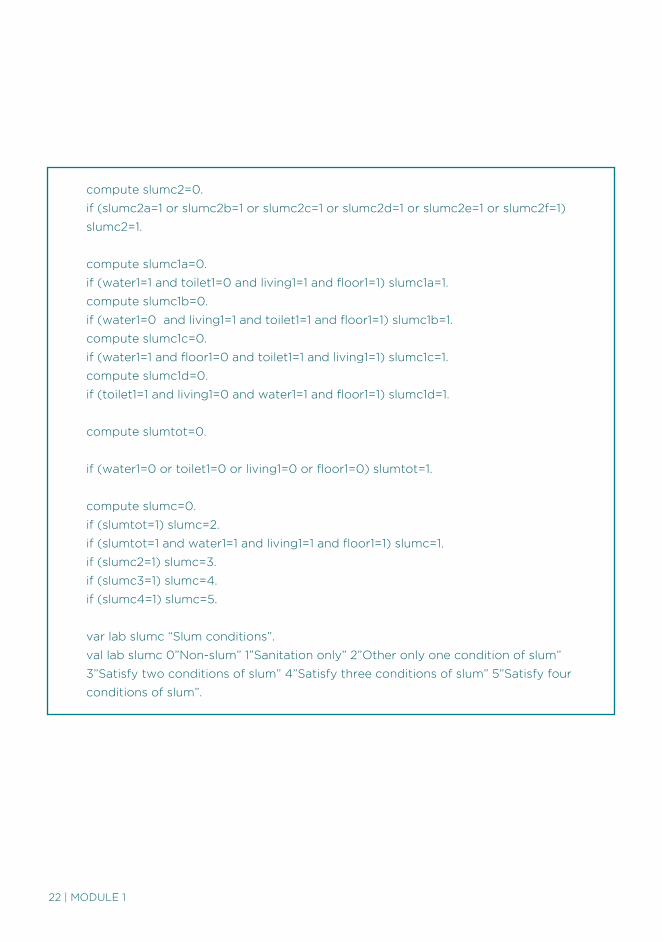
compute slumc2=0.
if (slumc2a=1 or slumc2b=1 or slumc2c=1 or slumc2d=1 or slumc2e=1 or slumc2f=1)
slumc2=1.
compute slumc1a=0.
if (water1=1 and toilet1=0 and living1=1 and floor1=1) slumc1a=1.
compute slumc1b=0.
if (water1=0 and living1=1 and toilet1=1 and floor1=1) slumc1b=1.
compute slumc1c=0.
if (water1=1 and floor1=0 and toilet1=1 and living1=1) slumc1c=1.
compute slumc1d=0.
if (toilet1=1 and living1=0 and water1=1 and floor1=1) slumc1d=1.
compute slumtot=0.
if (water1=0 or toilet1=0 or living1=0 or floor1=0) slumtot=1.
compute slumc=0.
if (slumtot=1) slumc=2.
if (slumtot=1 and water1=1 and living1=1 and floor1=1) slumc=1.
if (slumc2=1) slumc=3.
if (slumc3=1) slumc=4.
if (slumc4=1) slumc=5.
var lab slumc “Slum conditions”.
val lab slumc 0”Non-slum” 1”Sanitation only” 2”Other only one condition of slum”
3”Satisfy two conditions of slum” 4”Satisfy three conditions of slum” 5”Satisfy four
conditions of slum”.
23 | MODULE 1
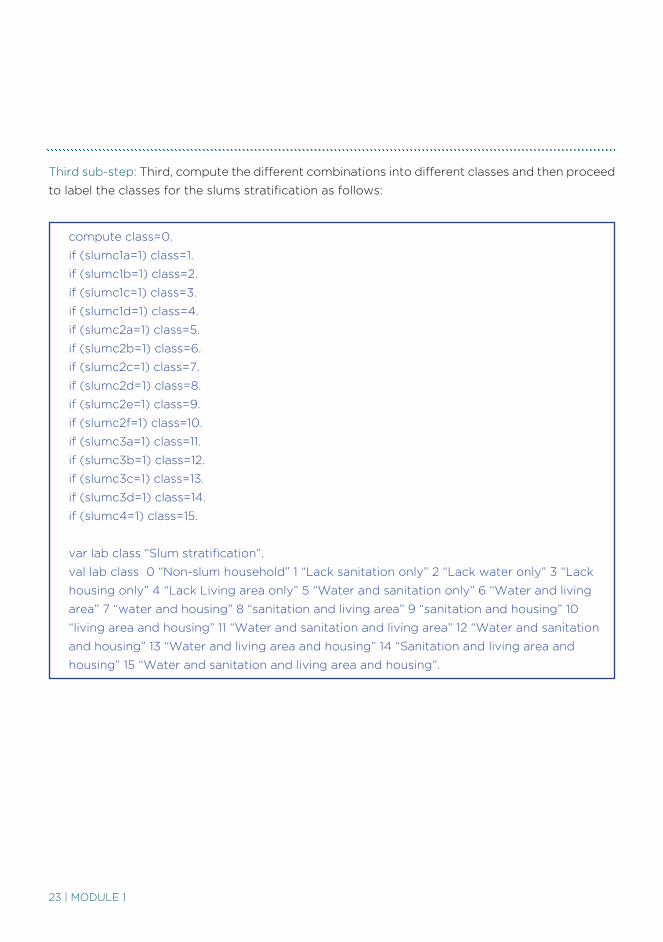
compute class=0.
if (slumc1a=1) class=1.
if (slumc1b=1) class=2.
if (slumc1c=1) class=3.
if (slumc1d=1) class=4.
if (slumc2a=1) class=5.
if (slumc2b=1) class=6.
if (slumc2c=1) class=7.
if (slumc2d=1) class=8.
if (slumc2e=1) class=9.
if (slumc2f=1) class=10.
if (slumc3a=1) class=11.
if (slumc3b=1) class=12.
if (slumc3c=1) class=13.
if (slumc3d=1) class=14.
if (slumc4=1) class=15.
var lab class “Slum stratification”.
val lab class 0 “Non-slum household” 1 “Lack sanitation only” 2 “Lack water only” 3 “Lack
housing only” 4 “Lack Living area only” 5 “Water and sanitation only” 6 “Water and living
area” 7 “water and housing” 8 “sanitation and living area” 9 “sanitation and housing” 10
“living area and housing” 11 “Water and sanitation and living area” 12 “Water and sanitation
and housing” 13 “Water and living area and housing” 14 “Sanitation and living area and
housing” 15 “Water and sanitation and living area and housing”.
Third sub-step: Third, compute the different combinations into different classes and then proceed
to label the classes for the slums stratification as follows:
24 | MODULE 1
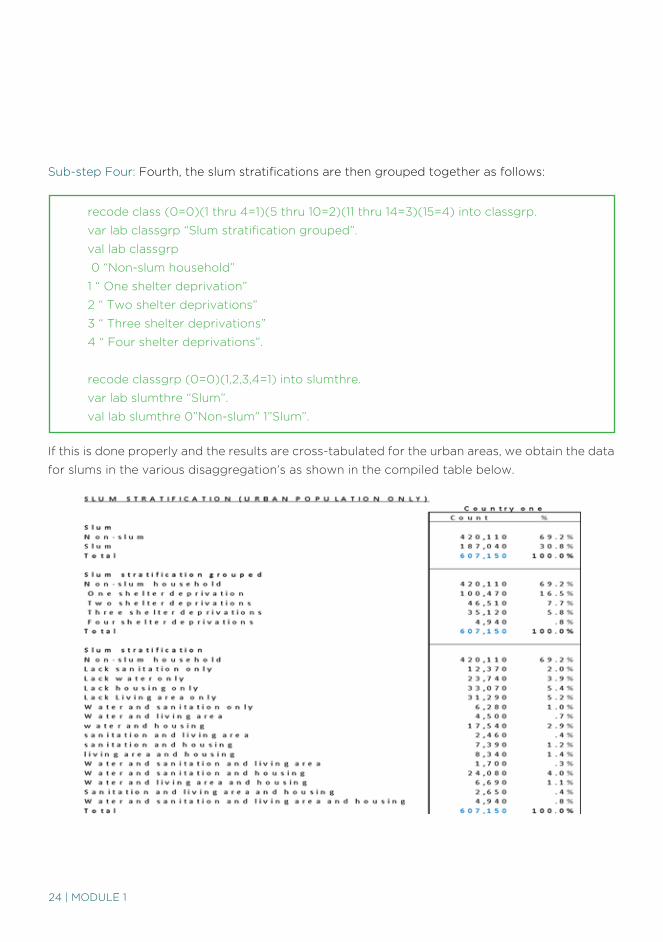
recode class (0=0)(1 thru 4=1)(5 thru 10=2)(11 thru 14=3)(15=4) into classgrp.
var lab classgrp “Slum stratification grouped”.
val lab classgrp
0 “Non-slum household”
1 “ One shelter deprivation”
2 “ Two shelter deprivations”
3 “ Three shelter deprivations”
4 “ Four shelter deprivations”.
recode classgrp (0=0)(1,2,3,4=1) into slumthre.
var lab slumthre “Slum”.
val lab slumthre 0”Non-slum” 1”Slum”.
Sub-step Four: Fourth, the slum stratifications are then grouped together as follows:
If this is done properly and the results are cross-tabulated for the urban areas, we obtain the data
for slums in the various disaggregation’s as shown in the compiled table below.
25 | MODULE 1
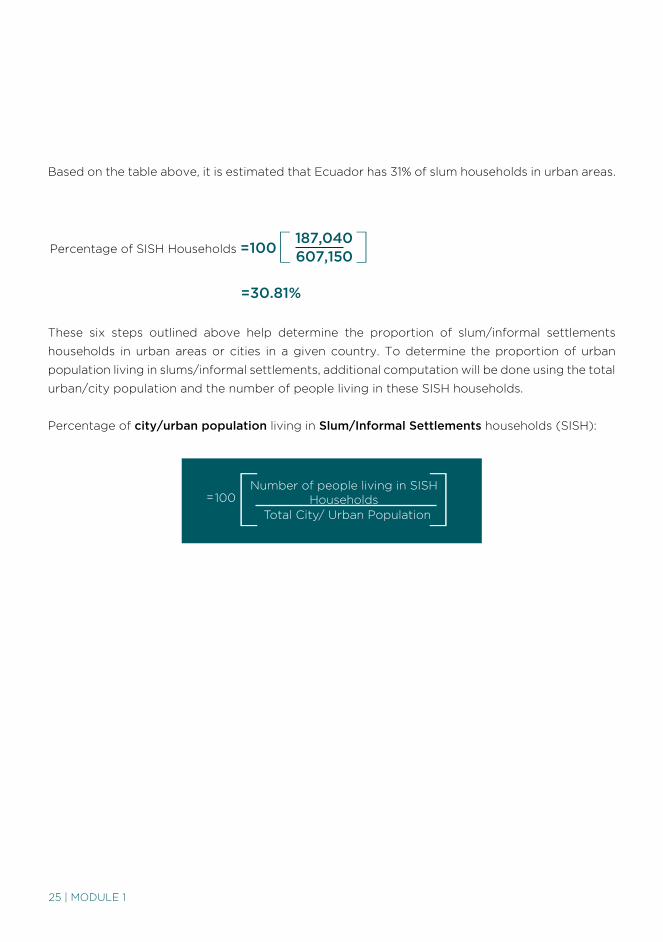
187,040[ ]607,150
Number of people living in SISH Households[ ]Total City/ Urban Population
=100
Percentage of SISH Households =100
Based on the table above, it is estimated that Ecuador has 31% of slum households in urban areas.
=30.81%
These six steps outlined above help determine the proportion of slum/informal settlements
households in urban areas or cities in a given country. To determine the proportion of urban
population living in slums/informal settlements, additional computation will be done using the total
urban/city population and the number of people living in these SISH households.
Percentage of city/urban population living in Slum/Informal Settlements households (SISH):
26 | MODULE 1
Inadequate housing is proposed to be measured
using the housing affordability criteria that may
be captured by the “Housing cost overburden
rate”, i.e. the percentage of households with
net monthly expenditure on housing or total
housing costs (net of housing allowances)
exceeding 30% of the total monthly income
of the household or total disposable household
income (net of housing allowances ).
Data Required
In general, the estimation of people living in
inadequate housing requires special surveys
that collected data on income and living
conditions. All private households and their
current members (persons living in collective
households are excluded from the target
population) are considered as reference
population.
Secondary data sources
This information is regularly collected by some
NSOs or regional bodies such as the European
Union Statistical Office and reported periodically
under housing statistics. The surveys cover
majority of the aspects of living conditions.
Below are some examples of secondary sources
from which the required information can be
obtained. This list will be updated periodically
as data becomes available.
1. Database: Income and Living Conditions
Link: (http://ec.europa.eu/eurostat/web/
income-and-living-conditions/data/main-
tables)
2. Statistical Books and Publications
a. h t t p : / / e c . e u r o p a . e u / e u r o s t a t /
publications/recently-published
b. http ://ec .europa.eu/eurostat/en/
web/products-statistical-books/-/KS-
DZ-14-001
c. http://ec.europa.eu/eurostat/en/web/
products-pocketbooks/-/KS-FP-13-001
d. http://ec.europa.eu/eurostat/en/web/
products-statist ics-in-focus/-/KS-
SF-11-004
ExampleMethodology for computing the indicator of
inadequate housing using the EU Statistics data
The European statistical office permanently
collects information on Housing and living
Conditions for the entire European Union. This
is guided by the European Union ten-year
growth plan ‘Europe 2020’, a strategy for smart,
sustainable and inclusive growth focussing on
the importance of monitoring income and living
conditions. The collected information provides
guidance towards meeting the target of lifting
at least 20 million people in the EU from the risk
of poverty or social exclusion by the year 2020.
We present below how housing cost overburden
rate is calculated using EU methodology to
arrive at the proportion of population with
inadequate housing.
Using EU methodology, this indicator is defined
as the percentage of population living in a
household where total housing costs (net of
housing allowances) represent more than 40%
of the total disposable household income.
Countries within the EU region have data
available to compute this indicator.
Unit Two: Computation of Inadequate Housing
27 | MODULE 1
Housing Statistics Measurement
(EU Statistics)
Definition Results from EU members
Population (2014)
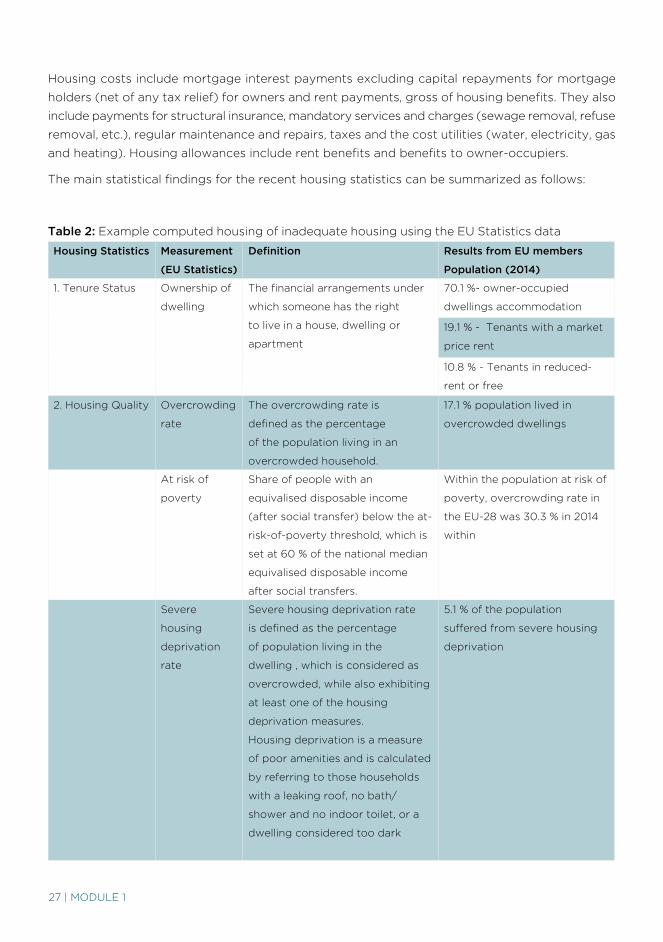
1. Tenure Status Ownership of
dwelling
The financial arrangements under
which someone has the right
to live in a house, dwelling or
apartment
70.1 %- owner-occupied
dwellings accommodation
19.1 % - Tenants with a market
price rent
10.8 % - Tenants in reduced-
rent or free
2. Housing Quality Overcrowding
rate
The overcrowding rate is
defined as the percentage
of the population living in an
overcrowded household.
17.1 % population lived in
overcrowded dwellings
At risk of
poverty
Share of people with an
equivalised disposable income
(after social transfer) below the at-
risk-of-poverty threshold, which is
set at 60 % of the national median
equivalised disposable income
after social transfers.
Within the population at risk of
poverty, overcrowding rate in
the EU-28 was 30.3 % in 2014
within
Severe
housing
deprivation
rate
Severe housing deprivation rate
is defined as the percentage
of population living in the
dwelling , which is considered as
overcrowded, while also exhibiting
at least one of the housing
deprivation measures.
Housing deprivation is a measure
of poor amenities and is calculated
by referring to those households
with a leaking roof, no bath/
shower and no indoor toilet, or a
dwelling considered too dark
5.1 % of the population
suffered from severe housing
deprivation
Housing costs include mortgage interest payments excluding capital repayments for mortgage
holders (net of any tax relief) for owners and rent payments, gross of housing benefits. They also
include payments for structural insurance, mandatory services and charges (sewage removal, refuse
removal, etc.), regular maintenance and repairs, taxes and the cost utilities (water, electricity, gas
and heating). Housing allowances include rent benefits and benefits to owner-occupiers.
The main statistical findings for the recent housing statistics can be summarized as follows:
Table 2: Example computed housing of inadequate housing using the EU Statistics data
28 | MODULE 1
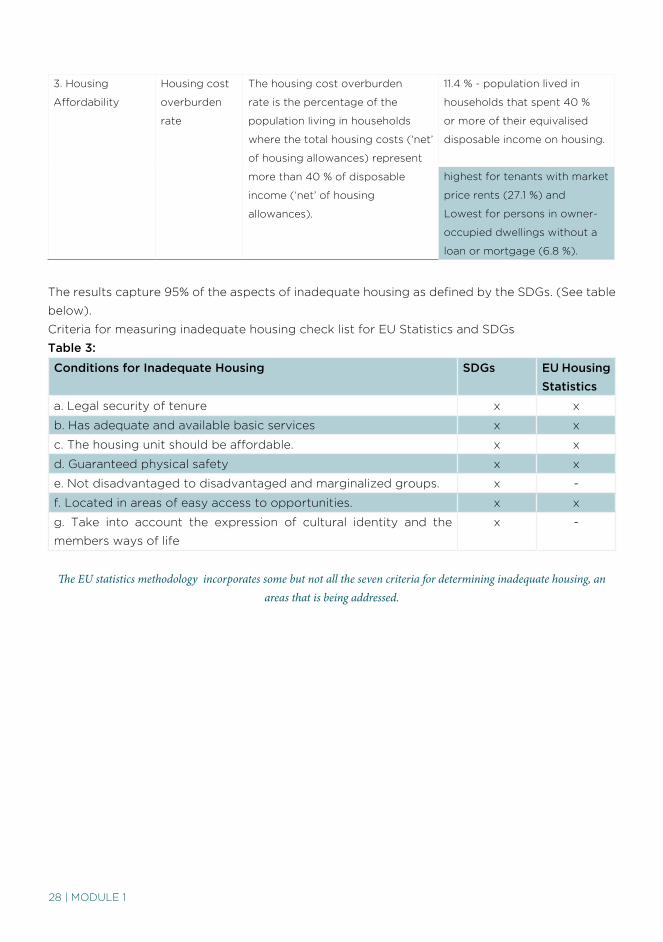
3. Housing
Affordability
Housing cost
overburden
rate
The housing cost overburden
rate is the percentage of the
population living in households
where the total housing costs (‘net’
of housing allowances) represent
more than 40 % of disposable
income (‘net’ of housing
allowances).
11.4 % - population lived in
households that spent 40 %
or more of their equivalised
disposable income on housing.
highest for tenants with market
price rents (27.1 %) and
Lowest for persons in owner-
occupied dwellings without a
loan or mortgage (6.8 %).
The results capture 95% of the aspects of inadequate housing as defined by the SDGs. (See table
below).
Criteria for measuring inadequate housing check list for EU Statistics and SDGs
Table 3:
Conditions for Inadequate Housing SDGs EU Housing
Statistics
a. Legal security of tenure x x
b. Has adequate and available basic services x x
c. The housing unit should be affordable. x x
d. Guaranteed physical safety x x
e. Not disadvantaged to disadvantaged and marginalized groups. x -
f. Located in areas of easy access to opportunities. x x
g. Take into account the expression of cultural identity and the
members ways of life
x -
The EU statistics methodology incorporates some but not all the seven criteria for determining inadequate housing, an areas that is being addressed.
29 | MODULE 1
GENERAL LIMITATIONS
Data Limitations
i. The lack of appropriate tools at national and city levels to measure all the components required
to monitor indicator 11.1 highlights challenges for NSOs to reliably include all components
that measure slums, informality or inadequate housing conditions. This may result in the
underestimation of poor housing conditions. Exploratory work is ongoing on the use of earth
observation technologies to enhance the monitoring of spaces that constitute slums, informality
or inadequate housing. This data would be complemented with other household surveys data
for quality validation and triangulation. Complementarity in data reporting will be key to ensure
that both national and global figures achieve consistencies in the final reported data.
ii. Indicator 11.1.1 does not capture homelessness, as it is not included in household surveys.
However, in most recent years, important progress has been made to integrate the measurement
of this component into major surveys and censuses in several countries and thus more data is
expected to be available in the next 5 years.
iii. Many countries still have limited capacities for data management, data collection and monitoring,
and continue to grapple with limited data on large or densely populated geographical areas.
Several technical workshops and EGMs are scheduled to help build the capacity for reporting
in the first 5 years of the 2030 Agenda for Sustainable Development.
iv. Security of tenure is an aspect that has been difficult to measure and monitor due to lack of
routine data, given its complicated interrelation with land and property that makes difficult
to include in the different related surveys.
v. Slums: MICS, Census and DHS surveys that are part of the primary data sources for the
computation of the indicator for access to improved water do not always collect data on
whether wells and springs are protected or unprotected. Also, they do not always indicate
whether latrines are traditional or improved, covered or uncovered.
vi. Measurement of housing quality not only depends on the quality of the dwelling itself, but
also on the wider residential area. The indicator thus relies heavily on the subjective opinions
of the respondents.
3.
30 | MODULE 1
References
1. United Nations (2007). Indicators of Sustainable Development: Guidelines and Methodologies.
Third Edition, United Nations, New York
2. A/HRC/25/54 (2013), Report of the Special Rapporteur on adequate housing as a component
of the right to an adequate standard of living, and on the right to non-discrimination in this
context
3. UN-Habitat (2002). Urban Indicators Guidelines. Nairobi
4. UN-Habitat, Global Urban Indicators Database 2012 a. Nairobi
5. UN-Habitat (2002). Expert Group Meeting on Urban Indicators, Nairobi, Kenya, November 2002
6. UN-Habitat (2003a). Slums of the World: The face of urban poverty in the new millennium
7. UN-Habitat (2003b). Improving the Lives of 100 Million Slum Dwellers – Guide to Monitoring
Target 11
8. UN-Habitat (1998).Crowding and Health in Low Income Settlements of Guinea Bissau, SIEP
Occasional Series No.1
9. Global report on Human settlement on Slums (2002).21
10. Turkstra, J. and Raithelhuber, M. (2004). Urban slum Monitoring. ESRI User Conference paper
1667
11. Urban Indicators Programme, World Bank and UN-Habitat, Guidelines
12. Habitat for Humanity, Global Housing Indicators
13. Habitat for Humanity, Housing Indicators for the Sustainable Development Goals, 2015
14. McKinsey Global Institute (2014). A Blueprint for Addressing the Global Affordable Housing
Challenge
15. United Nations (2015), Conference on Housing and Sustainable Urban Development – Habitat
III, Issue Paper No. 22 on Informal Settlements
16. UN-Habitat, UN-AIDS (2015a). Ending the Urban Aids Epidemic. Nairobi
17. UN-Habitat (2015b). Slum Almanac 2015-2016
18. UN-Habitat (2016). World Cities Report 2016
URL References:
1. http://www.un.org/esa/sustdev/natlinfo/indicators/methodology_sheets.pdf,
2. http://unhabitat.org/urban-indicators-guidelines/
3. http://mdgs.un.org/unsd/mdg/Metadata.aspx?IndicatorId=0&SeriesId=710,
4. http://unhabitat.org/urban-initiatives/initiatives-programmes/participatory-slum-upgrading/
5. http://unhabitat.org/slum-almanac-2015-2016/
6. http://wcr.unhabitat.org/
7. http://www.unhabitat.org/programmes/guo/documents/EGM final report 4 Dec 02.pdf

31 | MODULE 1
United nations human settlements program
P. O. Box, 30030. Nairobi, 00100 Kenya www.unhabitat.org