Embed Size (px)
Citation preview

1
Adequacy Assessment for the2017 Pacific Northwest Power
Supply
Steering Committee MeetingOctober 26, 2012Portland, Oregon

2
Outline
Final 2017 Resource Adequacy Assessment
Changes since August Draft
Additional Slides (if needed)
3
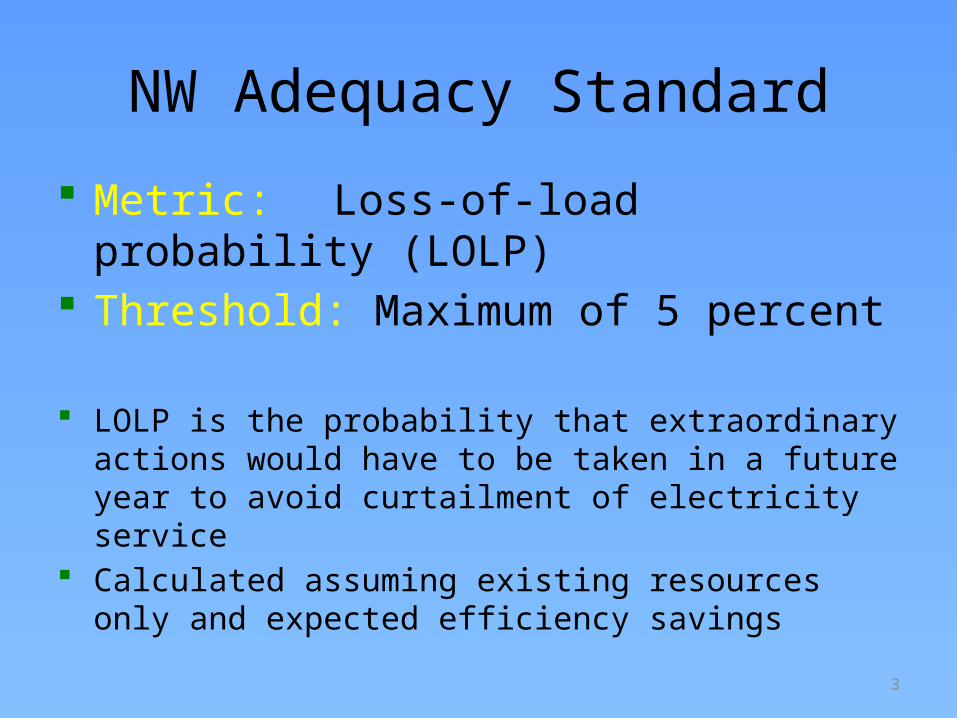
NW Adequacy Standard
Metric: Loss-of-load probability (LOLP)
Threshold: Maximum of 5 percent
LOLP is the probability that extraordinary actions would have to be taken in a future year to avoid curtailment of electricity service
Calculated assuming existing resources only and expected efficiency savings
4
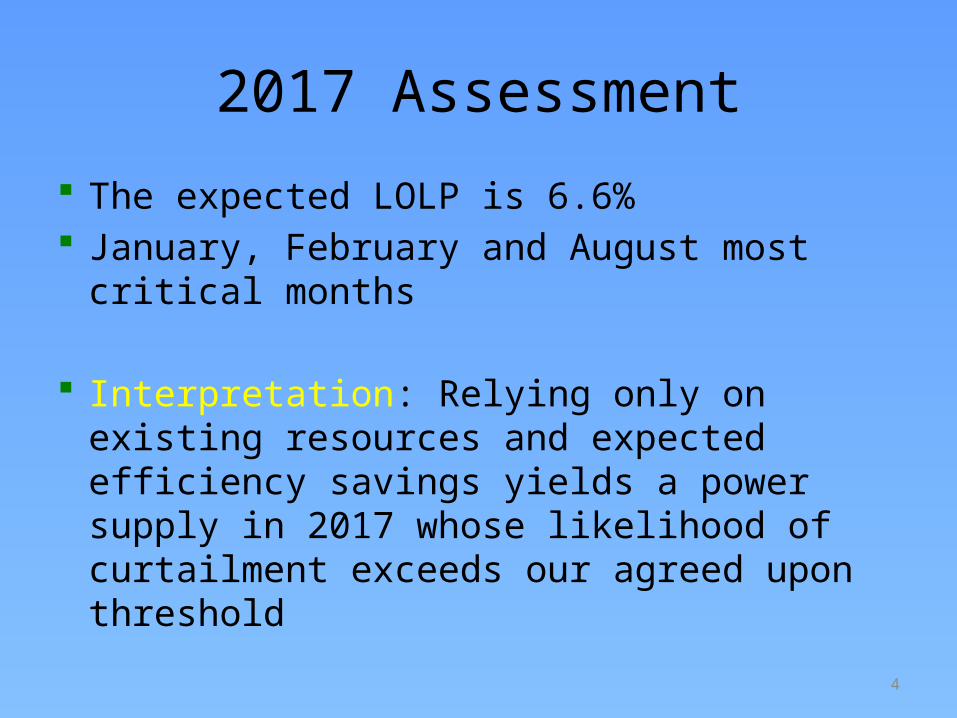
2017 Assessment
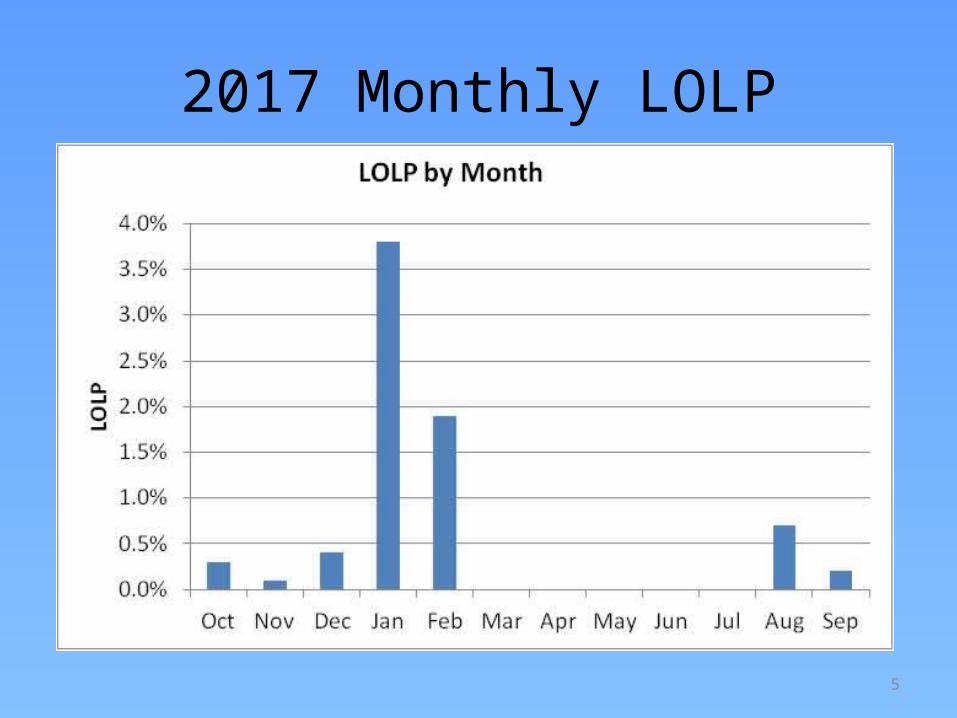
The expected LOLP is 6.6% January, February and August most
critical months
Interpretation: Relying only on existing resources and expected efficiency savings yields a power supply in 2017 whose likelihood of curtailment exceeds our agreed upon threshold
5
2017 Monthly LOLP
6
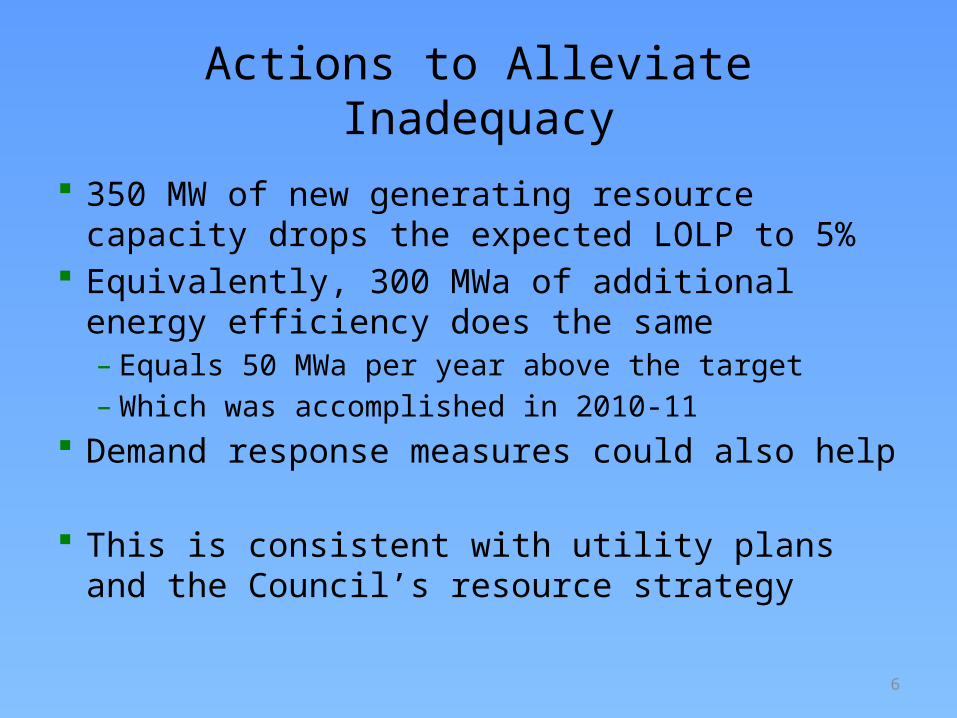
Actions to Alleviate Inadequacy
350 MW of new generating resource capacity drops the expected LOLP to 5%
Equivalently, 300 MWa of additional energy efficiency does the same– Equals 50 MWa per year above the target– Which was accomplished in 2010-11
Demand response measures could also help
This is consistent with utility plans and the Council’s resource strategy
7
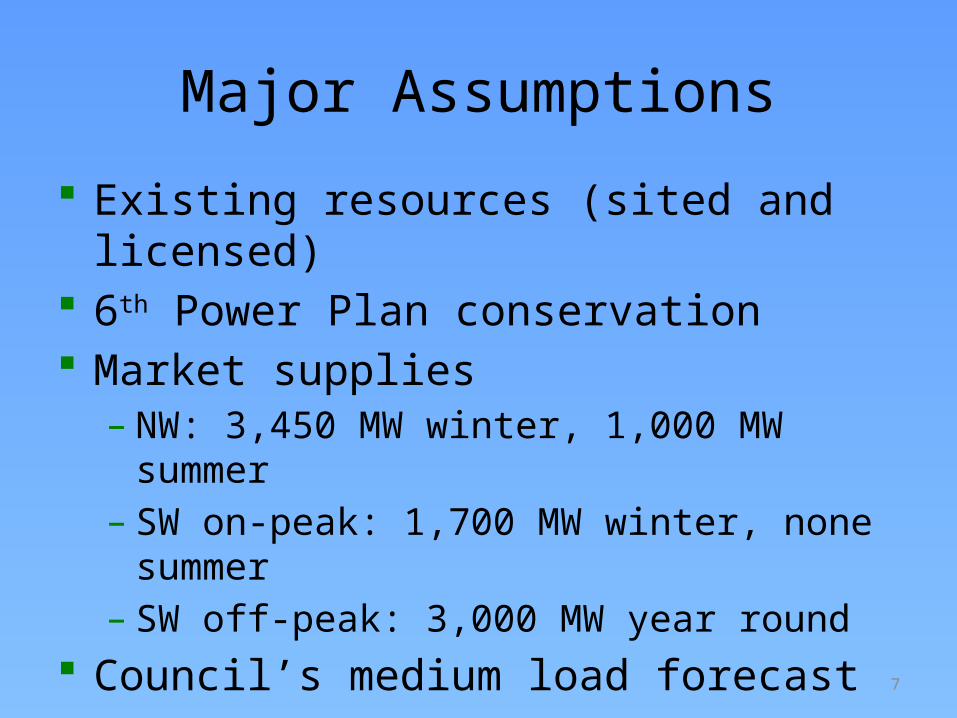
Major Assumptions
Existing resources (sited and licensed)
6th Power Plan conservation Market supplies
– NW: 3,450 MW winter, 1,000 MW summer
– SW on-peak: 1,700 MW winter, none summer
– SW off-peak: 3,000 MW year round Council’s medium load forecast
8
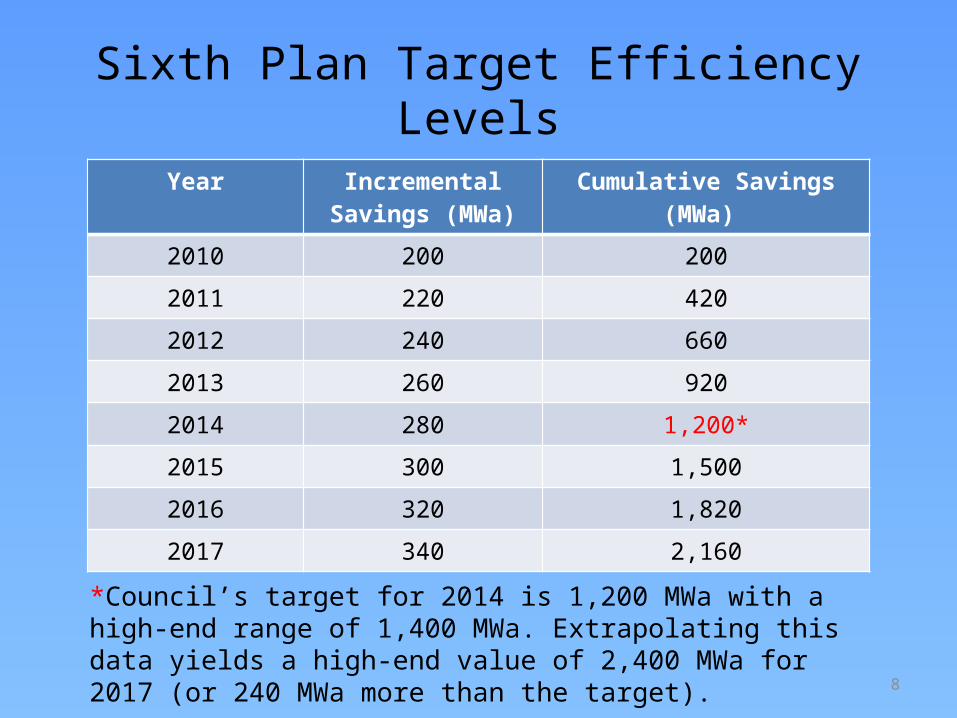
Sixth Plan Target Efficiency Levels
Year Incremental Savings (MWa)
Cumulative Savings(MWa)
2010 200 200
2011 220 420
2012 240 660
2013 260 920
2014 280 1,200*
2015 300 1,500
2016 320 1,820
2017 340 2,160
*Council’s target for 2014 is 1,200 MWa with a high-end range of 1,400 MWa. Extrapolating this data yields a high-end value of 2,400 MWa for 2017 (or 240 MWa more than the target).
9
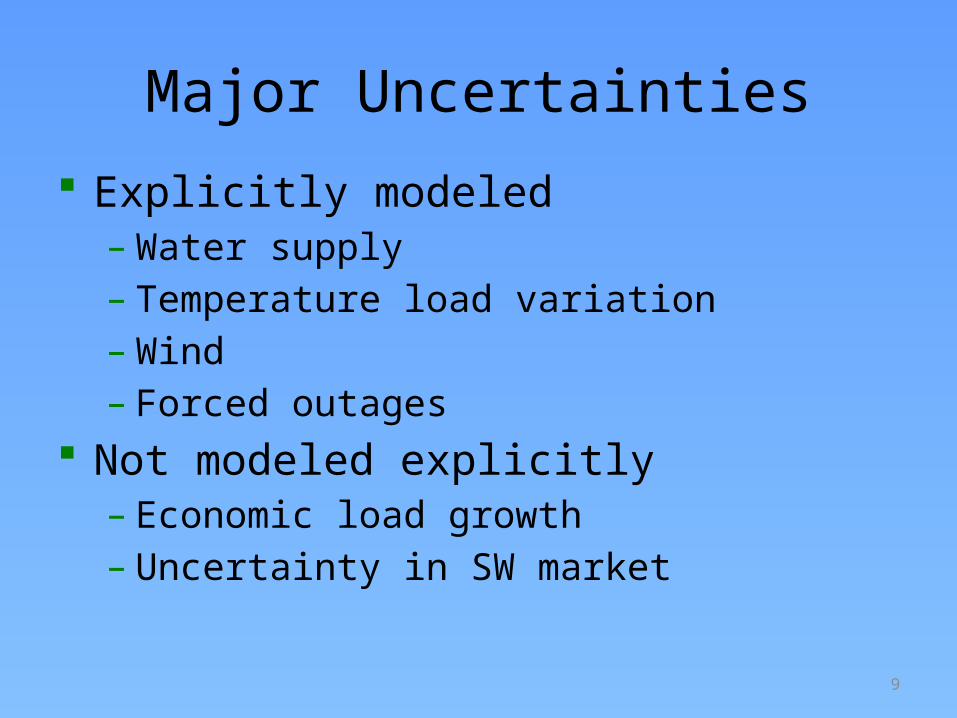
Major Uncertainties
Explicitly modeled– Water supply– Temperature load variation– Wind– Forced outages
Not modeled explicitly– Economic load growth– Uncertainty in SW market
10
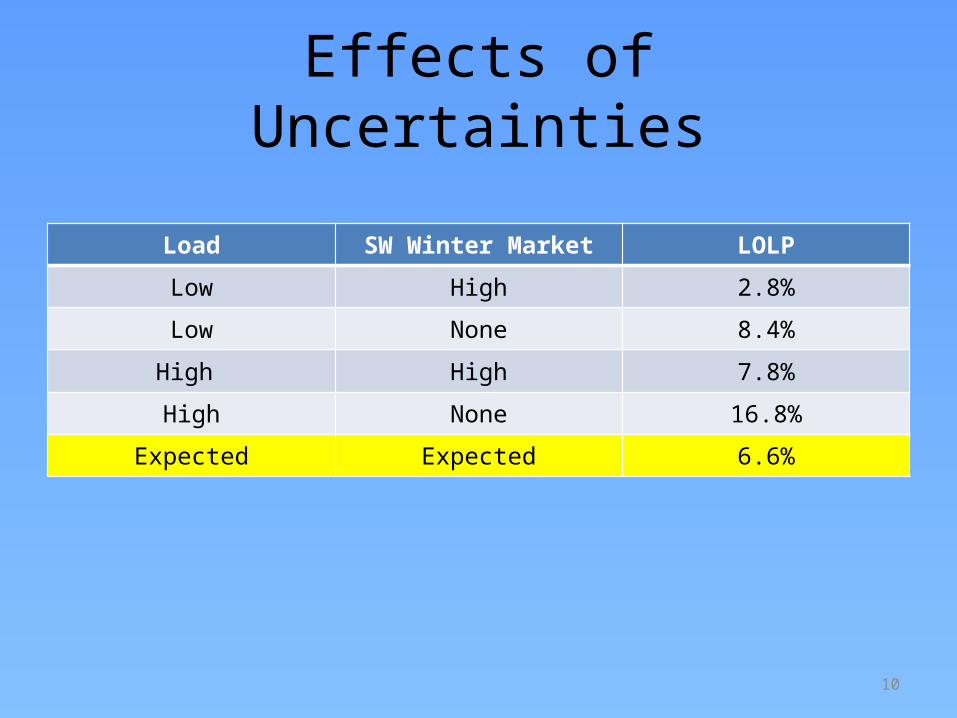
Effects of Uncertainties
Load SW Winter Market LOLP
Low High 2.8%
Low None 8.4%
High High 7.8%
High None 16.8%
Expected Expected 6.6%
11
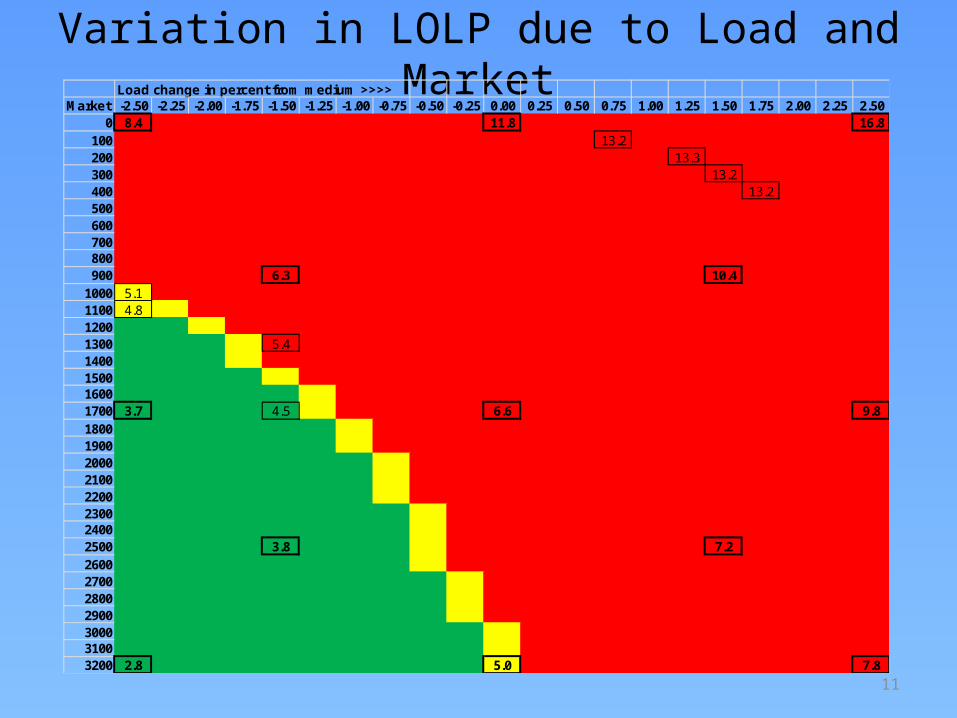
Variation in LOLP due to Load and MarketLoad change in percent from medium >>>>
Market -2.50 -2.25 -2.00 -1.75 -1.50 -1.25 -1.00 -0.75 -0.50 -0.25 0.00 0.25 0.50 0.75 1.00 1.25 1.50 1.75 2.00 2.25 2.500 8.4 11.8 16.8
100 13.2200 13.3300 13.2400 13.2500600700800900 6.3 10.4
1000 5.11100 4.812001300 5.41400150016001700 3.7 4.5 6.6 9.818001900200021002200230024002500 3.8 7.22600270028002900300031003200 2.8 5.0 7.8
12
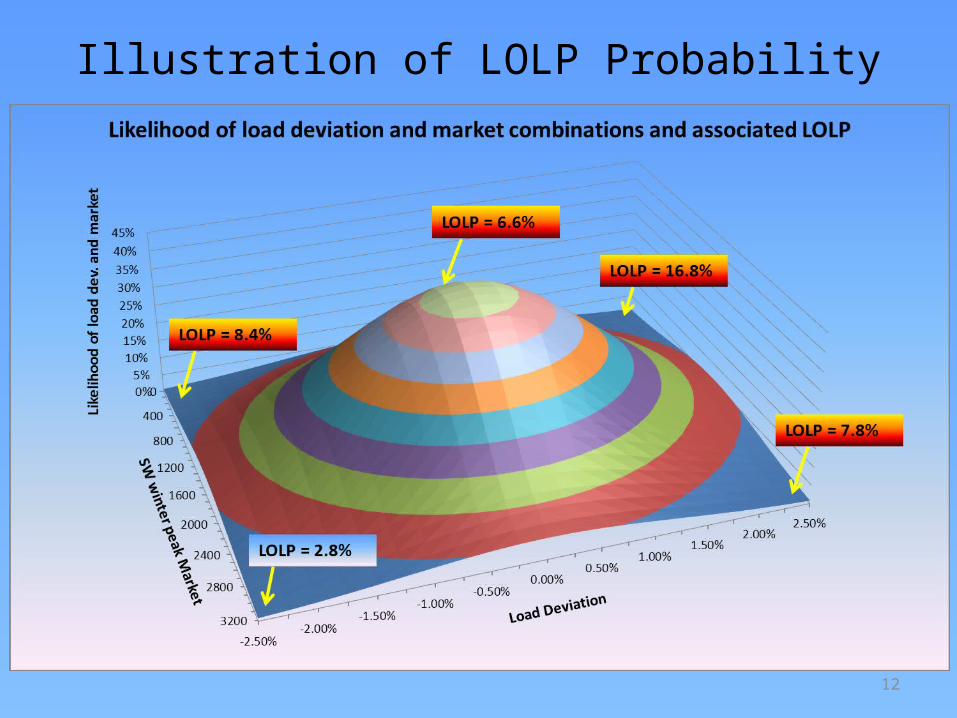
Illustration of LOLP Probability
13
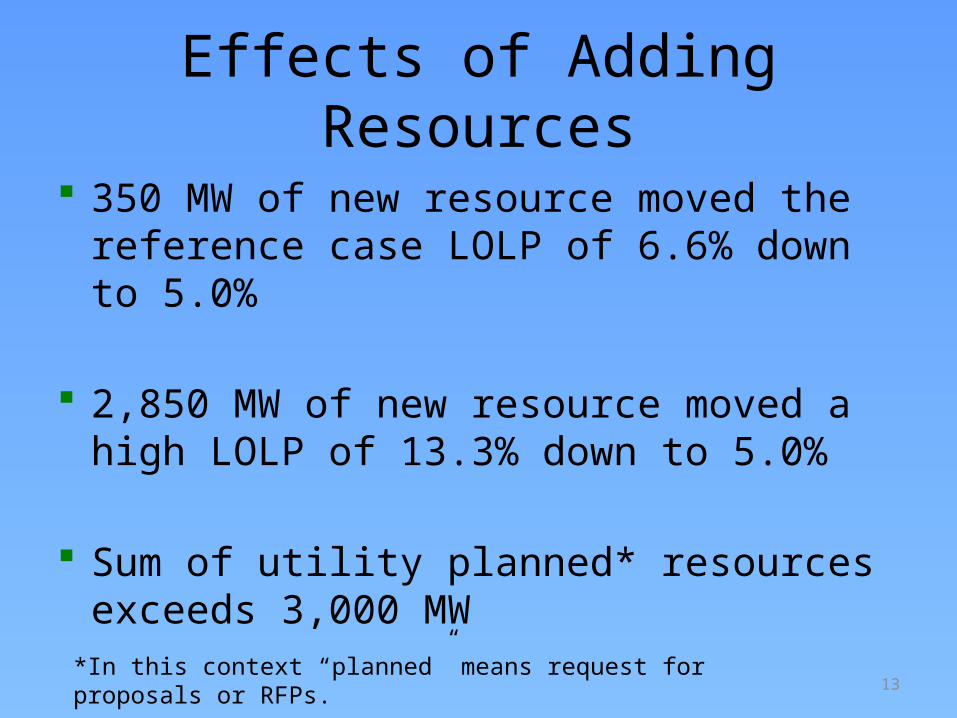
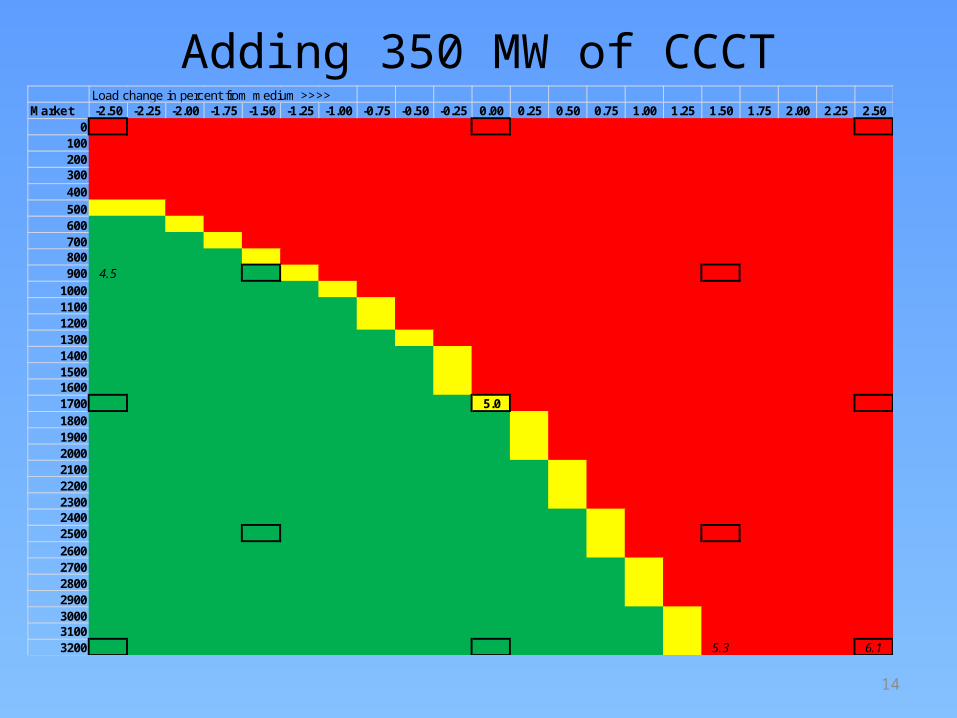
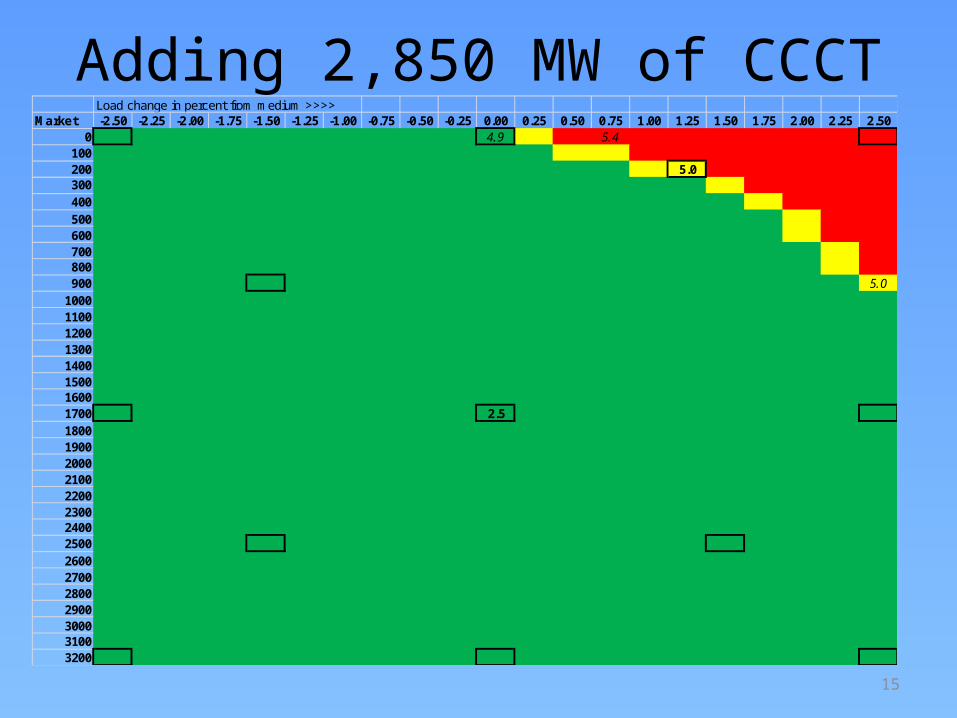
Effects of Adding Resources
350 MW of new resource moved the reference case LOLP of 6.6% down to 5.0%
2,850 MW of new resource moved a high LOLP of 13.3% down to 5.0%
Sum of utility planned* resources exceeds 3,000 MW
*In this context “planned” means request for proposals or RFPs.
14
Adding 350 MW of CCCTLoad change in percent from medium >>>>
Market -2.50 -2.25 -2.00 -1.75 -1.50 -1.25 -1.00 -0.75 -0.50 -0.25 0.00 0.25 0.50 0.75 1.00 1.25 1.50 1.75 2.00 2.25 2.500
100200300400500600700800900 4.5
10001100120013001400150016001700 5.0180019002000210022002300240025002600270028002900300031003200 5.3 6.1
15
Adding 2,850 MW of CCCTLoad change in percent from medium >>>>
Market -2.50 -2.25 -2.00 -1.75 -1.50 -1.25 -1.00 -0.75 -0.50 -0.25 0.00 0.25 0.50 0.75 1.00 1.25 1.50 1.75 2.00 2.25 2.500 4.9 5.4
100200 5.0300400500600700800900 5.0
10001100120013001400150016001700 2.5180019002000210022002300240025002600270028002900300031003200
16
Changes Since the last Draft
Many changes were made based on comments from the technical committee
Expected LOLP changed from 6.9 to 6.6%
17
Revisions since August Draft
Code fix (related to Canadian operations, eliminated anomalous June curtailments)
80 year hydro record and updated Canadian reservoir operations
LLH Summer purchase-ahead changed to 3000 MW (previous value was 1000 MW)
Net regional wind dedicated to serving regional load changed to 4266 MW due to removals, additions and adjustments (previous value was 4421 MW)
18
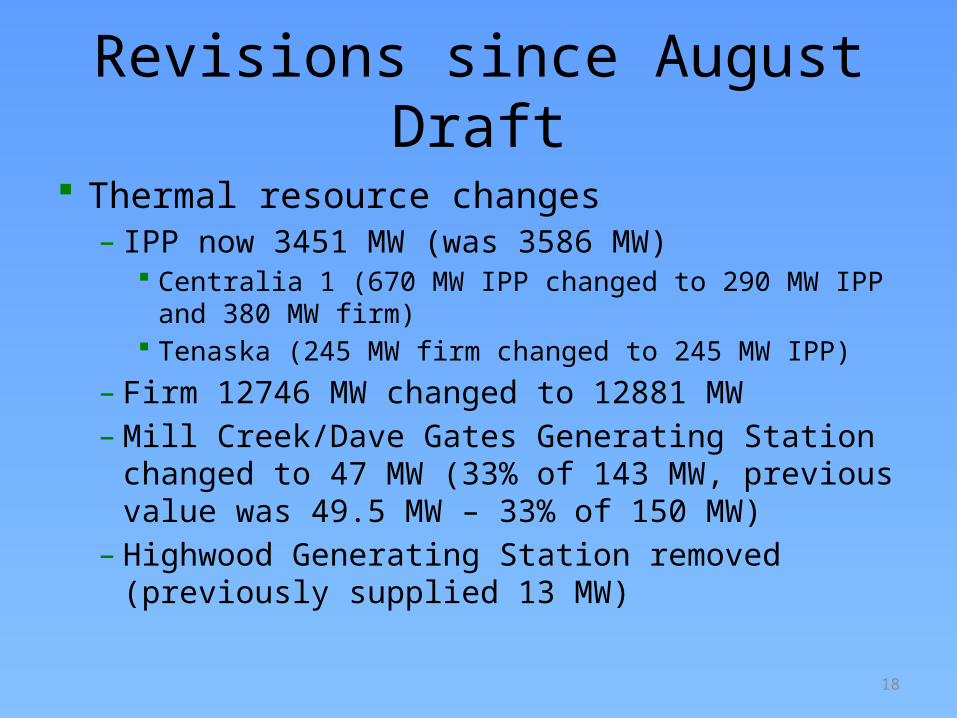
Revisions since August Draft
Thermal resource changes– IPP now 3451 MW (was 3586 MW)
Centralia 1 (670 MW IPP changed to 290 MW IPP and 380 MW firm)
Tenaska (245 MW firm changed to 245 MW IPP)
– Firm 12746 MW changed to 12881 MW– Mill Creek/Dave Gates Generating Station
changed to 47 MW (33% of 143 MW, previous value was 49.5 MW – 33% of 150 MW)
– Highwood Generating Station removed (previously supplied 13 MW)
19
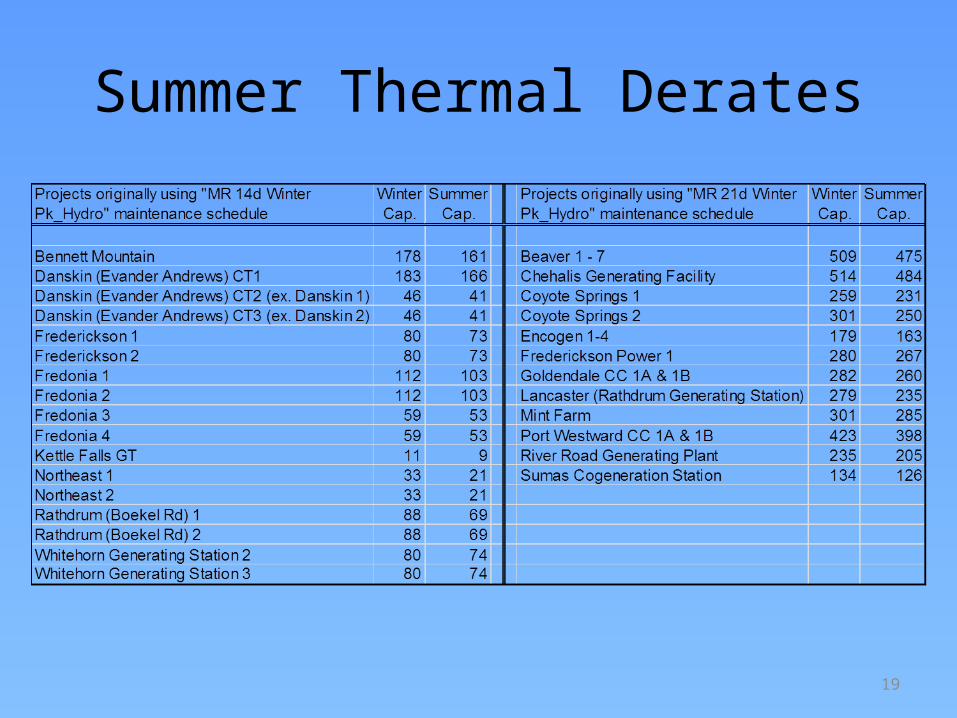
Summer Thermal Derates
20
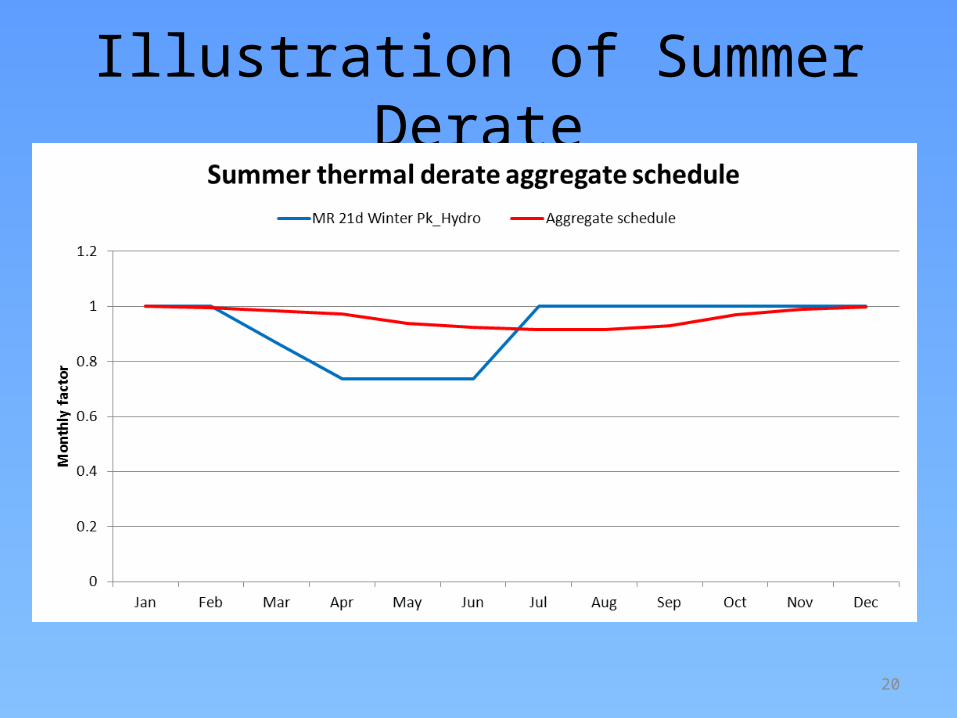
Illustration of Summer Derate
21
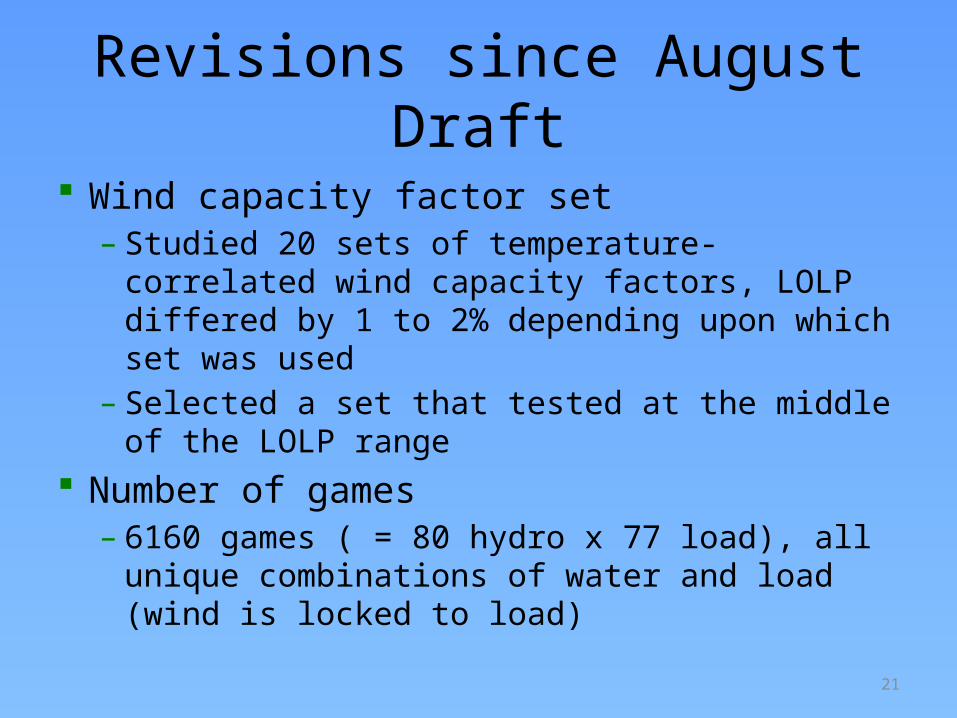
Revisions since August Draft
Wind capacity factor set– Studied 20 sets of temperature-correlated
wind capacity factors, LOLP differed by 1 to 2% depending upon which set was used
– Selected a set that tested at the middle of the LOLP range
Number of games– 6160 games ( = 80 hydro x 77 load), all
unique combinations of water and load (wind is locked to load)
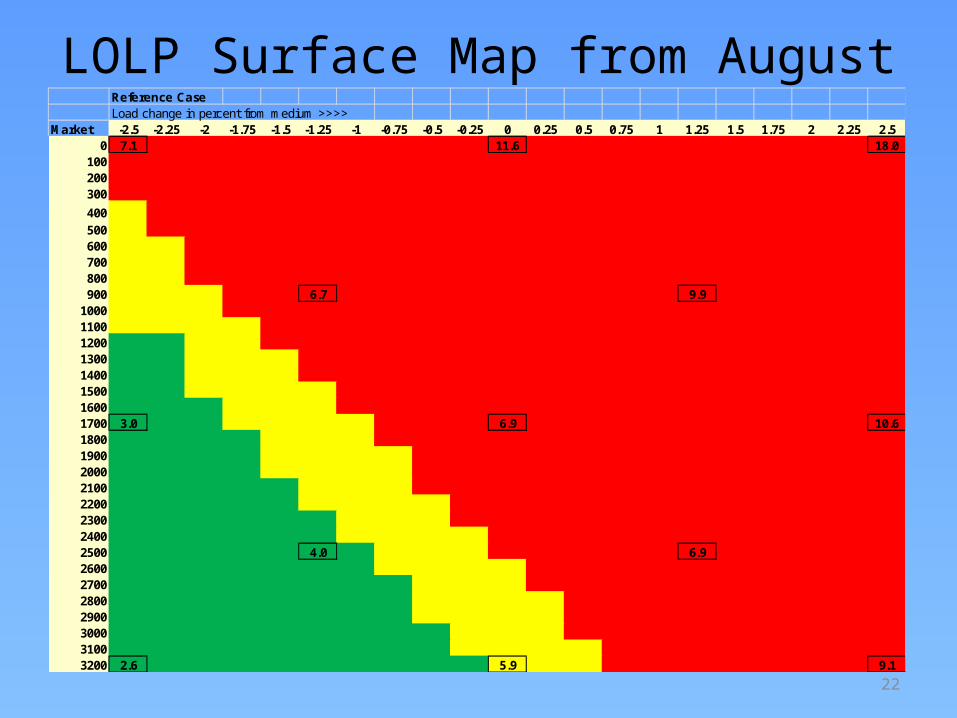
22
LOLP Surface Map from AugustReference CaseLoad change in percent from medium >>>>
Market -2.5 -2.25 -2 -1.75 -1.5 -1.25 -1 -0.75 -0.5 -0.25 0 0.25 0.5 0.75 1 1.25 1.5 1.75 2 2.25 2.50 7.1 11.6 18.0
100200300
400500600700800900 6.7 9.9
10001100120013001400150016001700 3.0 6.9 10.618001900200021002200230024002500 4.0 6.92600270028002900300031003200 2.6 5.9 9.1
23
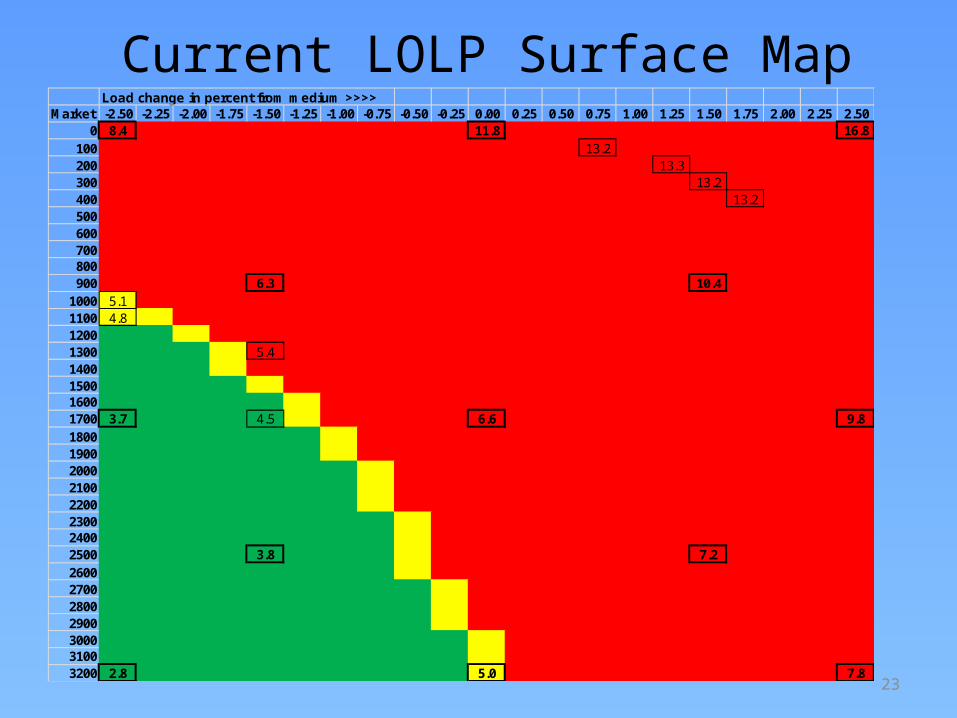
Current LOLP Surface MapLoad change in percent from medium >>>>
Market -2.50 -2.25 -2.00 -1.75 -1.50 -1.25 -1.00 -0.75 -0.50 -0.25 0.00 0.25 0.50 0.75 1.00 1.25 1.50 1.75 2.00 2.25 2.500 8.4 11.8 16.8
100 13.2200 13.3300 13.2400 13.2500600700800900 6.3 10.4
1000 5.11100 4.812001300 5.41400150016001700 3.7 4.5 6.6 9.818001900200021002200230024002500 3.8 7.22600270028002900300031003200 2.8 5.0 7.8
24
Effects of 70-yr vs. 80-yr hydro

25
Additional Slides
26
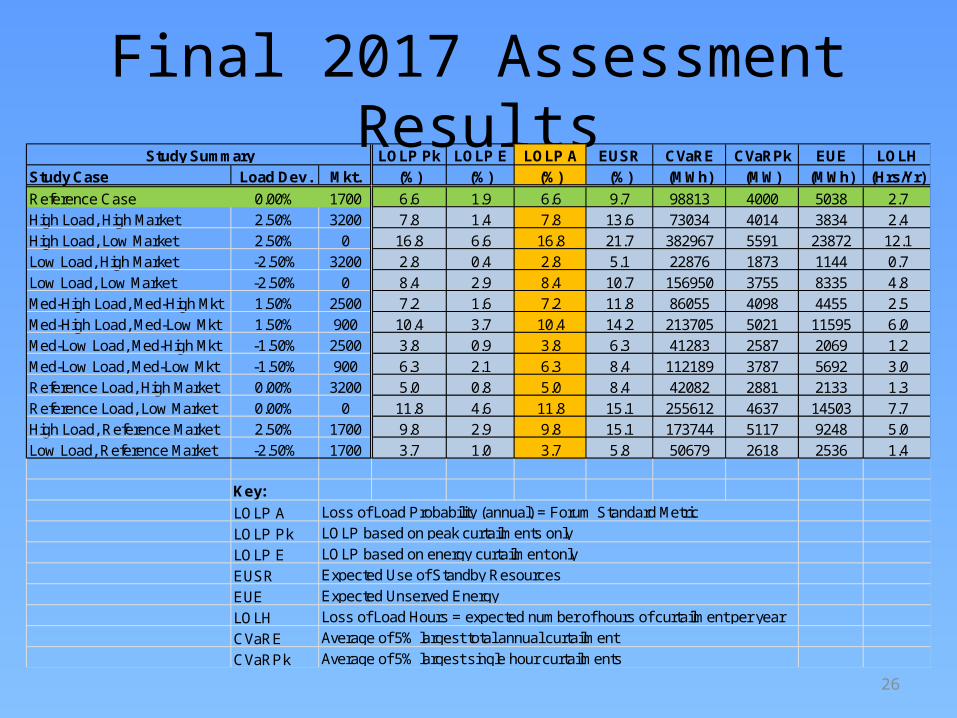
Final 2017 Assessment ResultsLOLP Pk LOLP E LOLP A EUSR CVaRE CVaRPk EUE LOLH
Study Case Load Dev. Mkt. (%) (%) (%) (%) (MWh) (MW) (MWh) (Hrs/Yr)
Reference Case 0.00% 1700 6.6 1.9 6.6 9.7 98813 4000 5038 2.7High Load, High Market 2.50% 3200 7.8 1.4 7.8 13.6 73034 4014 3834 2.4High Load, Low Market 2.50% 0 16.8 6.6 16.8 21.7 382967 5591 23872 12.1Low Load, High Market -2.50% 3200 2.8 0.4 2.8 5.1 22876 1873 1144 0.7Low Load, Low Market -2.50% 0 8.4 2.9 8.4 10.7 156950 3755 8335 4.8Med-High Load, Med-High Mkt 1.50% 2500 7.2 1.6 7.2 11.8 86055 4098 4455 2.5Med-High Load, Med-Low Mkt 1.50% 900 10.4 3.7 10.4 14.2 213705 5021 11595 6.0Med-Low Load, Med-High Mkt -1.50% 2500 3.8 0.9 3.8 6.3 41283 2587 2069 1.2Med-Low Load, Med-Low Mkt -1.50% 900 6.3 2.1 6.3 8.4 112189 3787 5692 3.0Reference Load, High Market 0.00% 3200 5.0 0.8 5.0 8.4 42082 2881 2133 1.3Reference Load, Low Market 0.00% 0 11.8 4.6 11.8 15.1 255612 4637 14503 7.7High Load, Reference Market 2.50% 1700 9.8 2.9 9.8 15.1 173744 5117 9248 5.0Low Load, Reference Market -2.50% 1700 3.7 1.0 3.7 5.8 50679 2618 2536 1.4
Key:
LOLP ALOLP PkLOLP EEUSREUE LOLHCVaRECVaRPk
Average of 5% largest total annual curtailmentAverage of 5% largest single hour curtailments
Loss of Load Probability (annual) = Forum Standard MetricLOLP based on peak curtailments onlyLOLP based on energy curtailment onlyExpected Use of Standby ResourcesExpected Unserved EnergyLoss of Load Hours = expected number of hours of curtailment per year
Study Summary
27
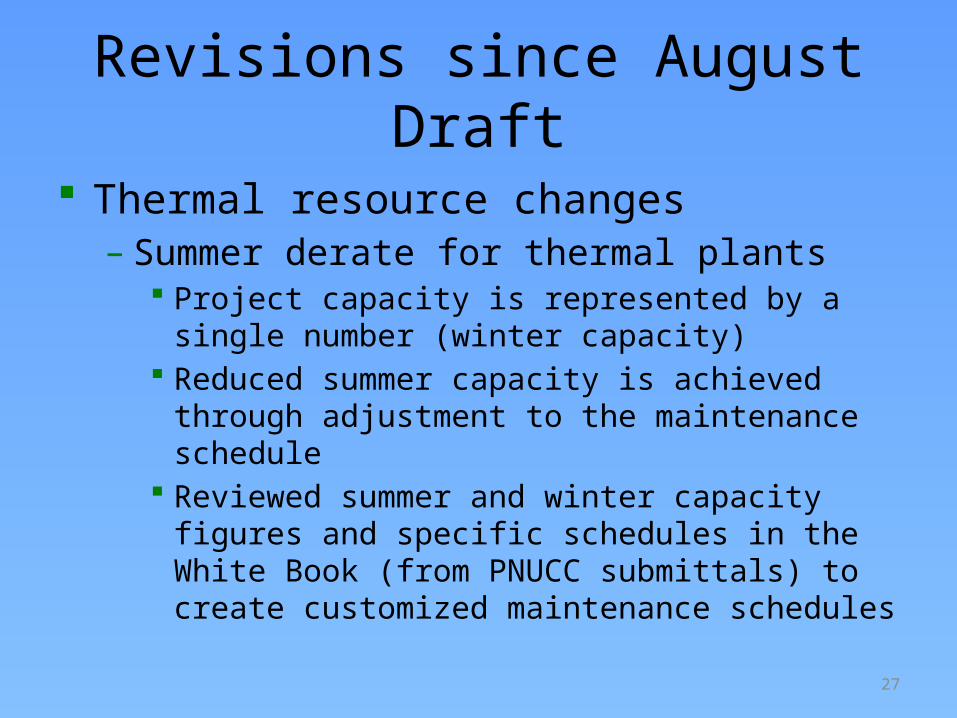
Revisions since August Draft
Thermal resource changes– Summer derate for thermal plants
Project capacity is represented by a single number (winter capacity)
Reduced summer capacity is achieved through adjustment to the maintenance schedule
Reviewed summer and winter capacity figures and specific schedules in the White Book (from PNUCC submittals) to create customized maintenance schedules
28
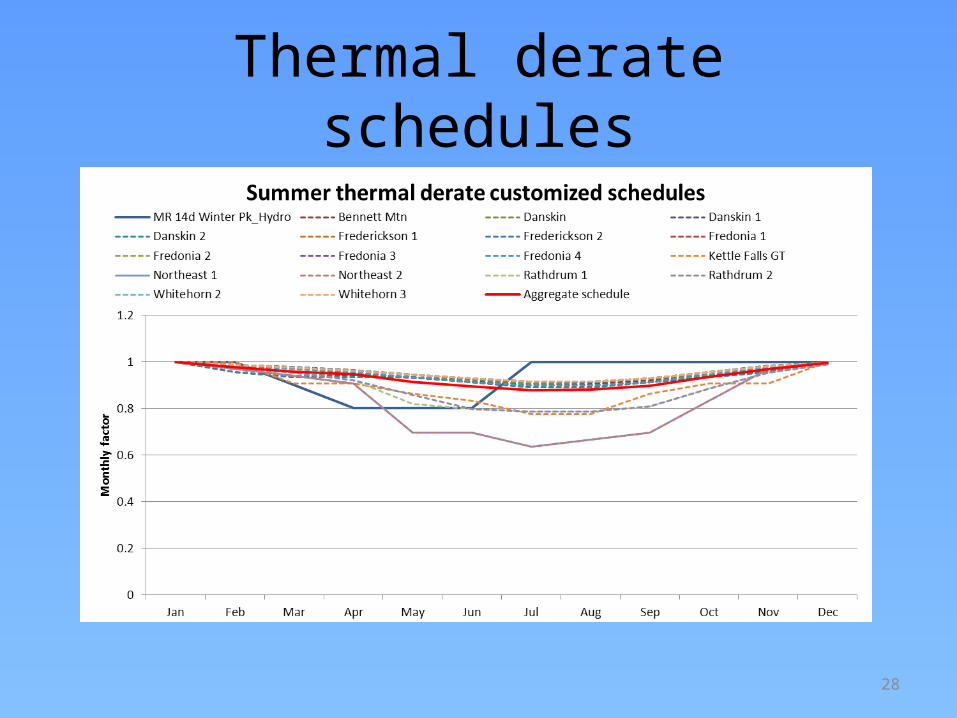
Thermal derate schedules
29
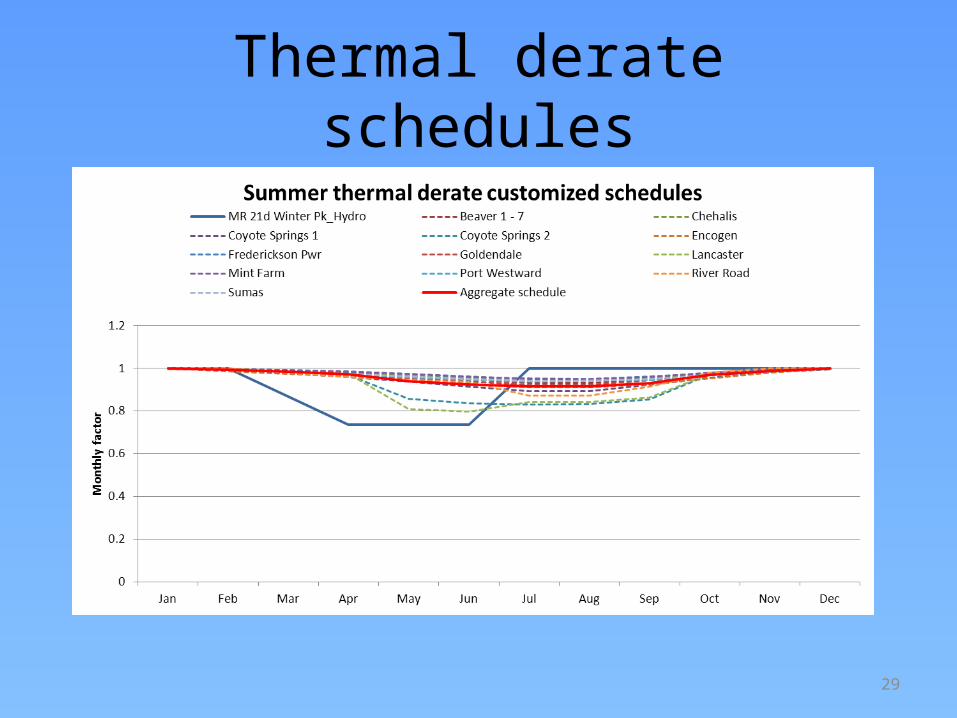
Thermal derate schedules
30
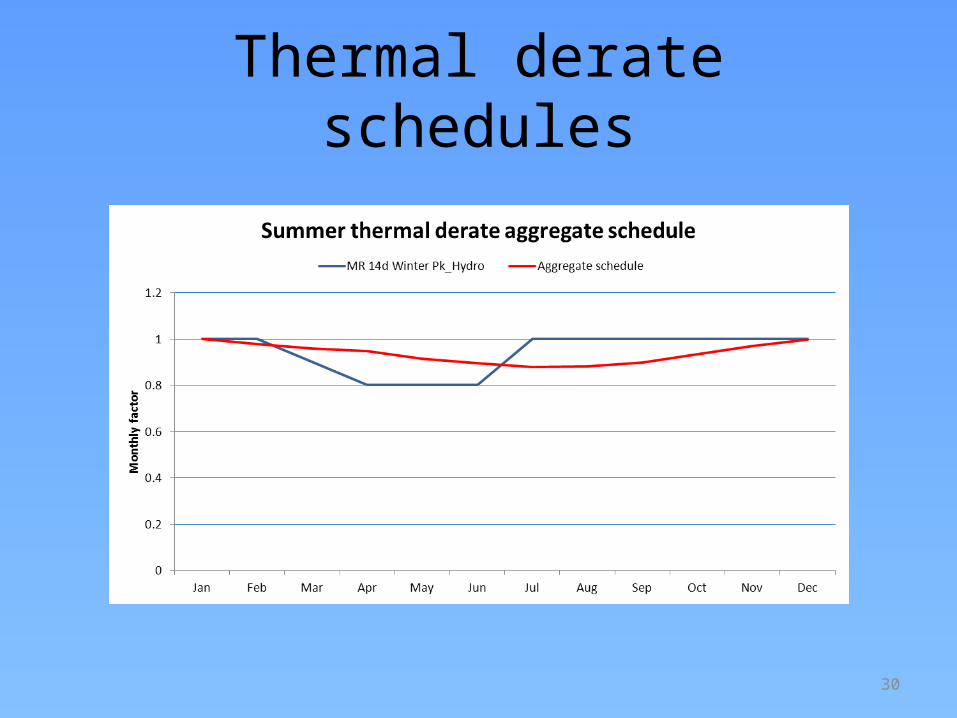
Thermal derate schedules
31
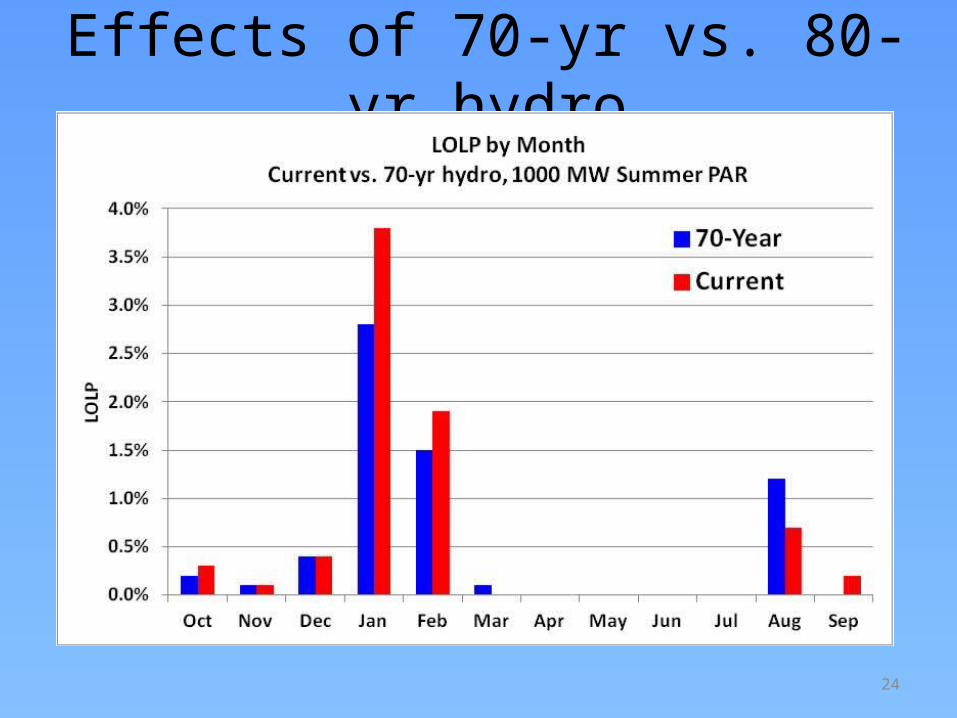
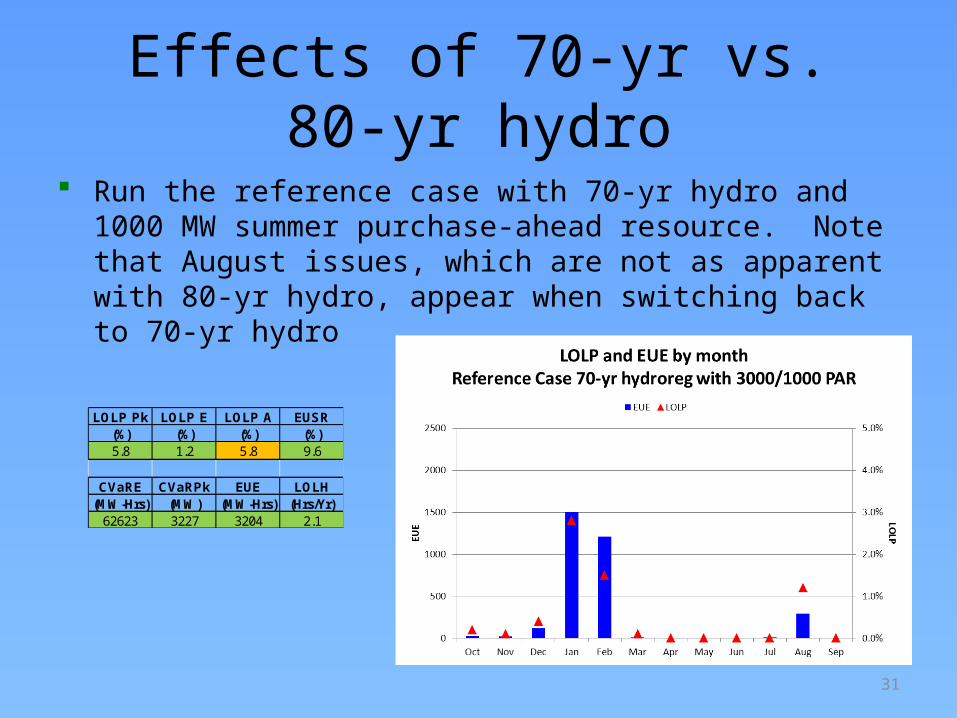
Effects of 70-yr vs. 80-yr hydro
Run the reference case with 70-yr hydro and 1000 MW summer purchase-ahead resource. Note that August issues, which are not as apparent with 80-yr hydro, appear when switching back to 70-yr hydro
LOLP Pk LOLP E LOLP A EUSR(%) (%) (%) (%)5.8 1.2 5.8 9.6
CVaRE CVaRPk EUE LOLH(MW-Hrs) (MW) (MW-Hrs) (Hrs/Yr)
62623 3227 3204 2.1
32
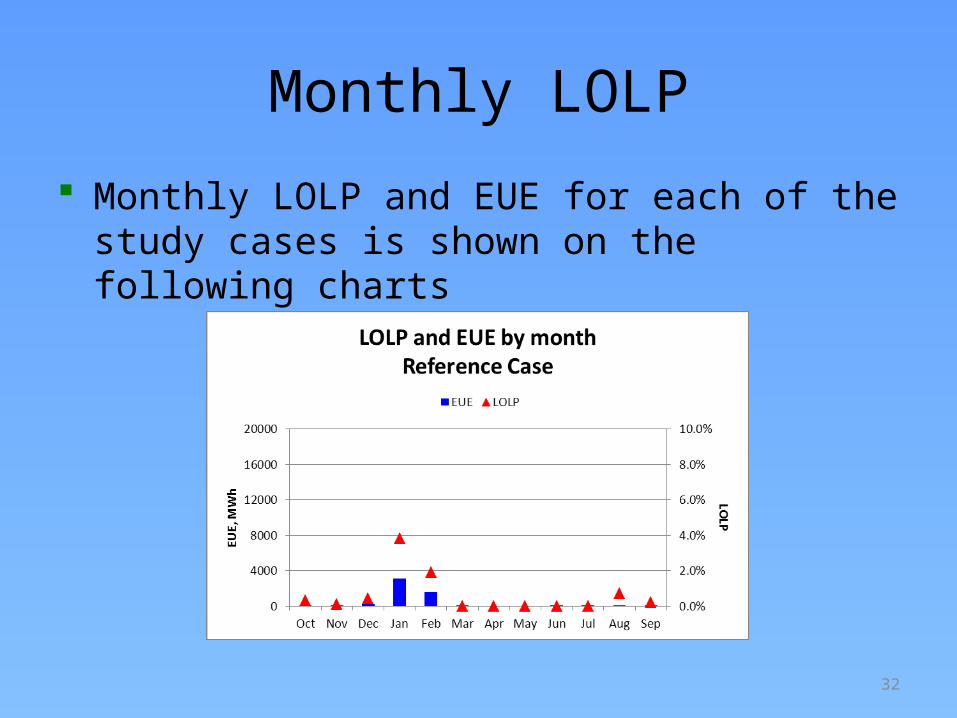
Monthly LOLP
Monthly LOLP and EUE for each of the study cases is shown on the following charts
33
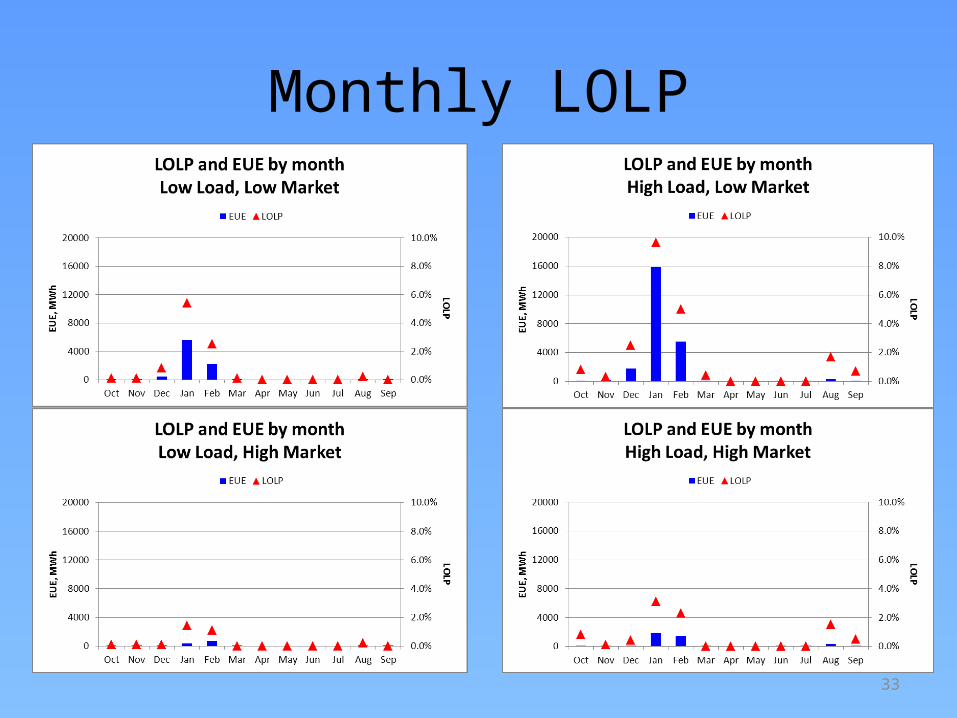
Monthly LOLP
34
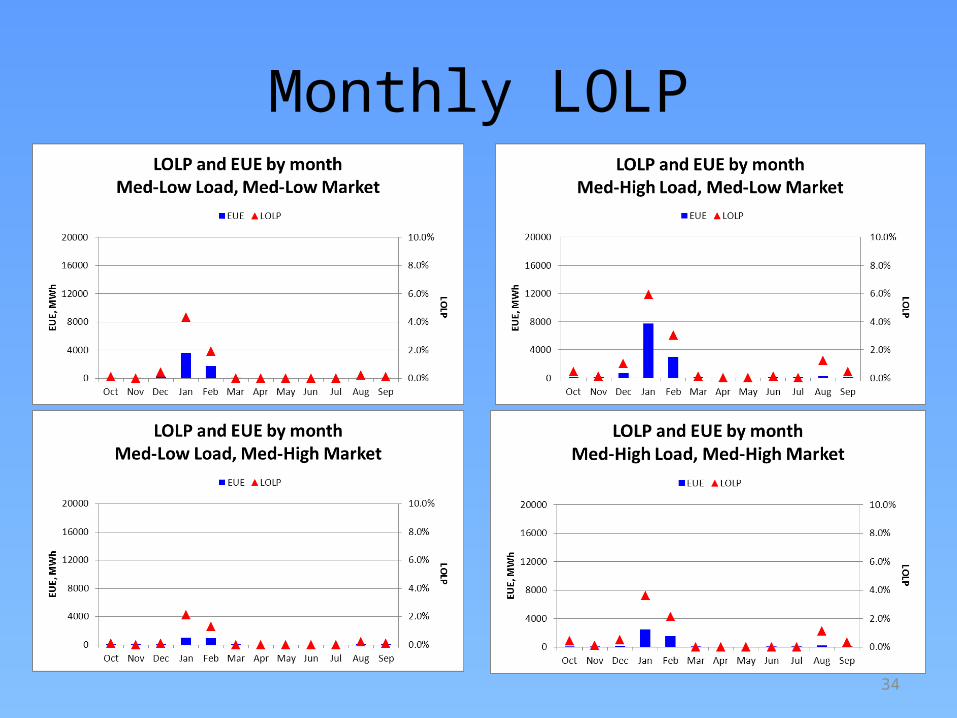
Monthly LOLP
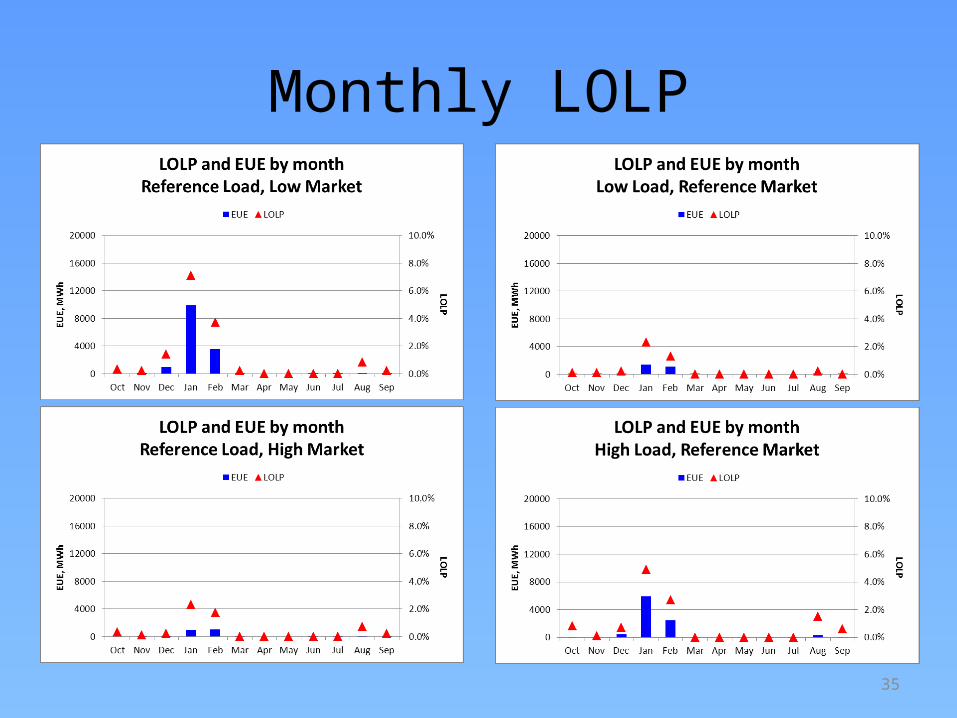
35
Monthly LOLP
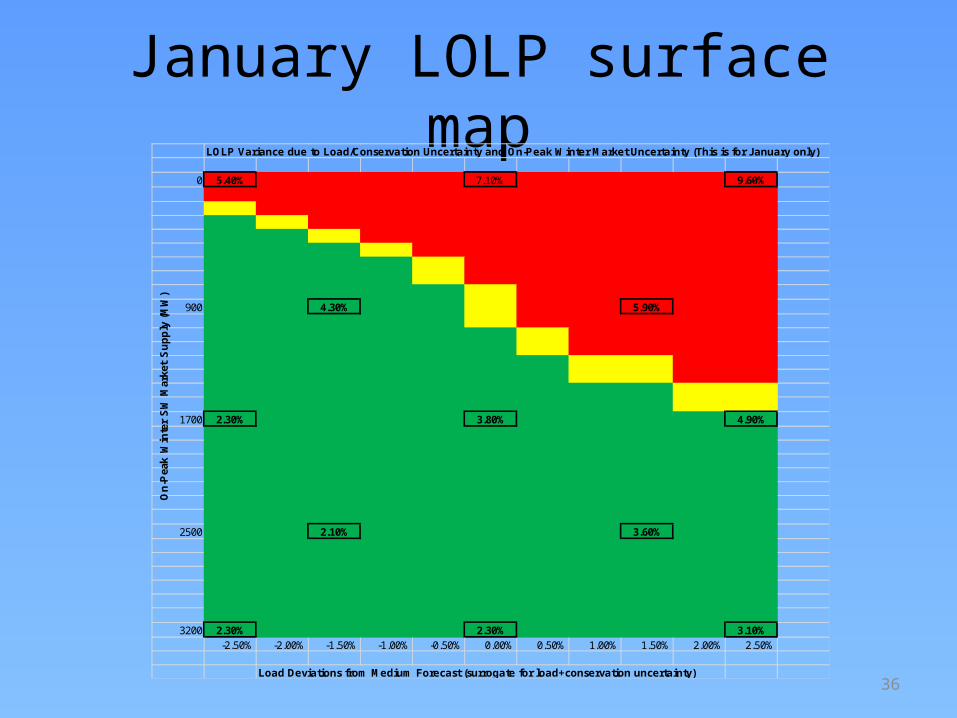
36
January LOLP surface mapLOLP Variance due to Load/Conservation Uncertainty and On-Peak Winter Market Uncertainty (This is for January only)
0 5.40% 7.10% 9.60%
900 4.30% 5.90%
1700 2.30% 3.80% 4.90%
2500 2.10% 3.60%
3200 2.30% 2.30% 3.10%-2.50% -2.00% -1.50% -1.00% -0.50% 0.00% 0.50% 1.00% 1.50% 2.00% 2.50%
Load Deviations from Medium Forecast (surrogate for load+conservation uncertainty)
On
-Pea
k W
inte
r S
W M
arke
t S
up
ply
(M
W)
37
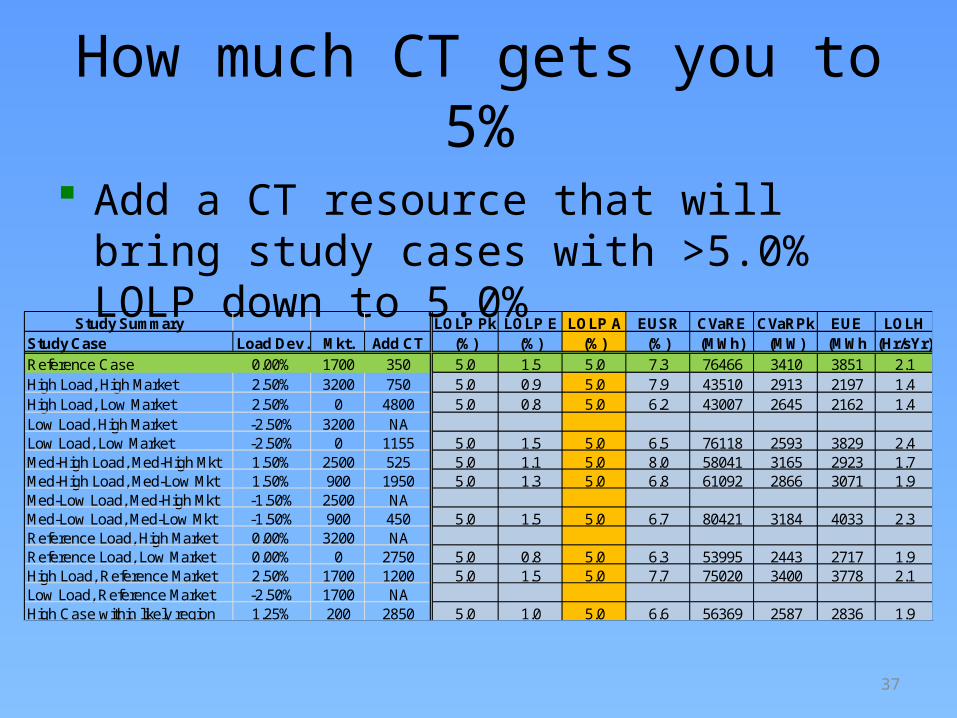
How much CT gets you to 5%
Add a CT resource that will bring study cases with >5.0% LOLP down to 5.0%
Study Summary LOLP Pk LOLP E LOLP A EUSR CVaRE CVaRPk EUE LOLHStudy Case Load Dev. Mkt. Add CT (%) (%) (%) (%) (MWh) (MW) (MWh (Hr/sYr)Reference Case 0.00% 1700 350 5.0 1.5 5.0 7.3 76466 3410 3851 2.1High Load, High Market 2.50% 3200 750 5.0 0.9 5.0 7.9 43510 2913 2197 1.4High Load, Low Market 2.50% 0 4800 5.0 0.8 5.0 6.2 43007 2645 2162 1.4Low Load, High Market -2.50% 3200 NALow Load, Low Market -2.50% 0 1155 5.0 1.5 5.0 6.5 76118 2593 3829 2.4Med-High Load, Med-High Mkt 1.50% 2500 525 5.0 1.1 5.0 8.0 58041 3165 2923 1.7Med-High Load, Med-Low Mkt 1.50% 900 1950 5.0 1.3 5.0 6.8 61092 2866 3071 1.9Med-Low Load, Med-High Mkt -1.50% 2500 NAMed-Low Load, Med-Low Mkt -1.50% 900 450 5.0 1.5 5.0 6.7 80421 3184 4033 2.3Reference Load, High Market 0.00% 3200 NAReference Load, Low Market 0.00% 0 2750 5.0 0.8 5.0 6.3 53995 2443 2717 1.9High Load, Reference Market 2.50% 1700 1200 5.0 1.5 5.0 7.7 75020 3400 3778 2.1Low Load, Reference Market -2.50% 1700 NAHigh Case within likely region 1.25% 200 2850 5.0 1.0 5.0 6.6 56369 2587 2836 1.9
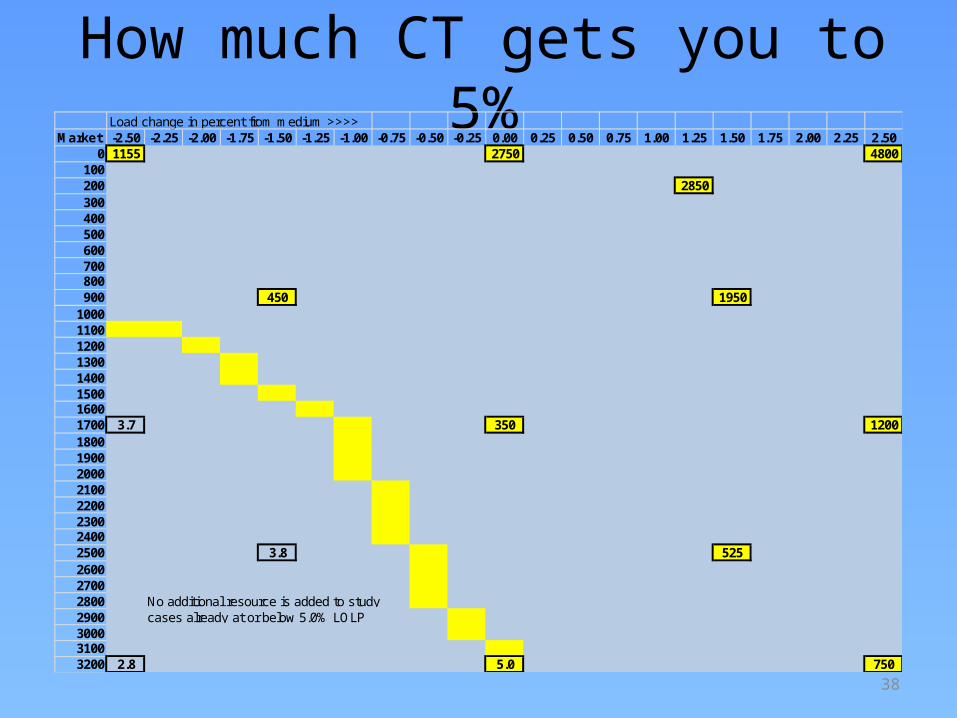
38
How much CT gets you to 5%Load change in percent from medium >>>>
Market -2.50 -2.25 -2.00 -1.75 -1.50 -1.25 -1.00 -0.75 -0.50 -0.25 0.00 0.25 0.50 0.75 1.00 1.25 1.50 1.75 2.00 2.25 2.500 1155 2750 4800
100200 2850300400500600700800900 450 1950
10001100120013001400150016001700 3.7 350 120018001900200021002200230024002500 3.8 525260027002800 No additional resource is added to study2900 cases already at or below 5.0% LOLP300031003200 2.8 5.0 750
39
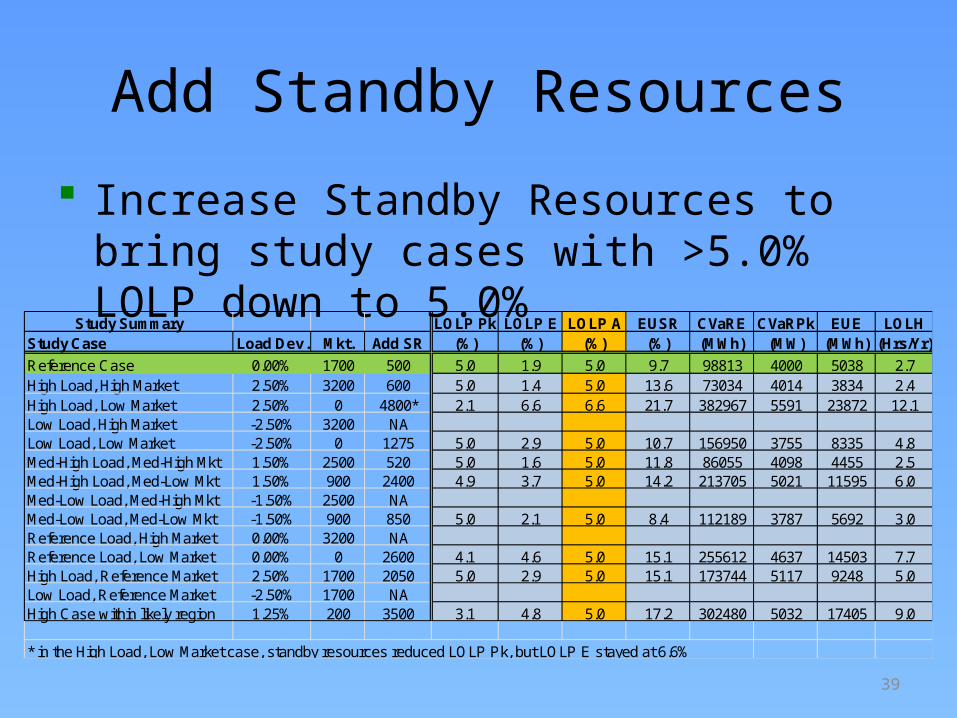
Add Standby Resources
Increase Standby Resources to bring study cases with >5.0% LOLP down to 5.0%
Study Summary LOLP Pk LOLP E LOLP A EUSR CVaRE CVaRPk EUE LOLHStudy Case Load Dev. Mkt. Add SR (%) (%) (%) (%) (MWh) (MW) (MWh) (Hrs/Yr)
Reference Case 0.00% 1700 500 5.0 1.9 5.0 9.7 98813 4000 5038 2.7High Load, High Market 2.50% 3200 600 5.0 1.4 5.0 13.6 73034 4014 3834 2.4High Load, Low Market 2.50% 0 4800* 2.1 6.6 6.6 21.7 382967 5591 23872 12.1Low Load, High Market -2.50% 3200 NALow Load, Low Market -2.50% 0 1275 5.0 2.9 5.0 10.7 156950 3755 8335 4.8Med-High Load, Med-High Mkt 1.50% 2500 520 5.0 1.6 5.0 11.8 86055 4098 4455 2.5Med-High Load, Med-Low Mkt 1.50% 900 2400 4.9 3.7 5.0 14.2 213705 5021 11595 6.0Med-Low Load, Med-High Mkt -1.50% 2500 NAMed-Low Load, Med-Low Mkt -1.50% 900 850 5.0 2.1 5.0 8.4 112189 3787 5692 3.0Reference Load, High Market 0.00% 3200 NAReference Load, Low Market 0.00% 0 2600 4.1 4.6 5.0 15.1 255612 4637 14503 7.7High Load, Reference Market 2.50% 1700 2050 5.0 2.9 5.0 15.1 173744 5117 9248 5.0Low Load, Reference Market -2.50% 1700 NAHigh Case within likely region 1.25% 200 3500 3.1 4.8 5.0 17.2 302480 5032 17405 9.0
* in the High Load, Low Market case, standby resources reduced LOLP Pk, but LOLP E stayed at 6.6%
40
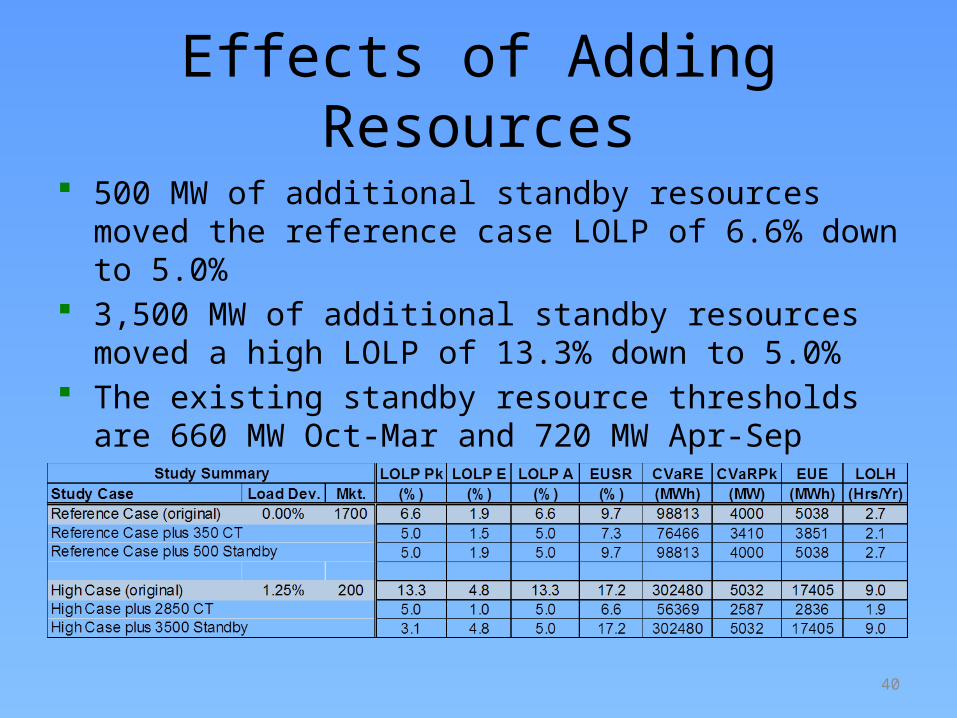
Effects of Adding Resources
500 MW of additional standby resources moved the reference case LOLP of 6.6% down to 5.0%
3,500 MW of additional standby resources moved a high LOLP of 13.3% down to 5.0%
The existing standby resource thresholds are 660 MW Oct-Mar and 720 MW Apr-Sep
41
42
43