Embed Size (px)
Citation preview

A Resource Adequacy Standardfor the
Pacific Northwest
Resource Adequacy Technical Committee
January 17, 2008
Portland Airport
NW Resource Adequacy Standard
2
Outline
• Objectives for a resource adequacy standard
• Guidelines for a standard
• A proposed standard for the Pacific NWFor annual (energy) needs For hourly (capacity) needs
NW Resource Adequacy Standard
3
5th Power Plan Action Items
• ADQ-1: Establish regional and West-wide reporting standards for the assessment of adequacy.
• ADQ-2: Carry out a process to establish adequacy standard. The Council will establish a Northwest Resource Adequacy Forum. This forum will examine alternative adequacy metrics and standards for the Northwest.
NW Resource Adequacy Standard
4
Objectives for aResource Adequacy Standard
• Transparent and easy to calculate• Linked to a more sophisticated analysis (like a
Loss-of-Load-Probability assessment)• Provide adequate protection against
1. Unwanted curtailments (physical standard*) and2. High and/or volatile prices (economic standard*)
*A “physical standard” is equated to minimizing average cost and a “economic standard” is equated to minimizing the risk of high-cost years.
NW Resource Adequacy Standard
5
Guidelines for a Standard• Components:
Metric – a unit of measurement
Target – acceptable value for the metric
• Standards for:Capacity – peak hourly demands
Energy – average annual demand
NW Resource Adequacy Standard
6
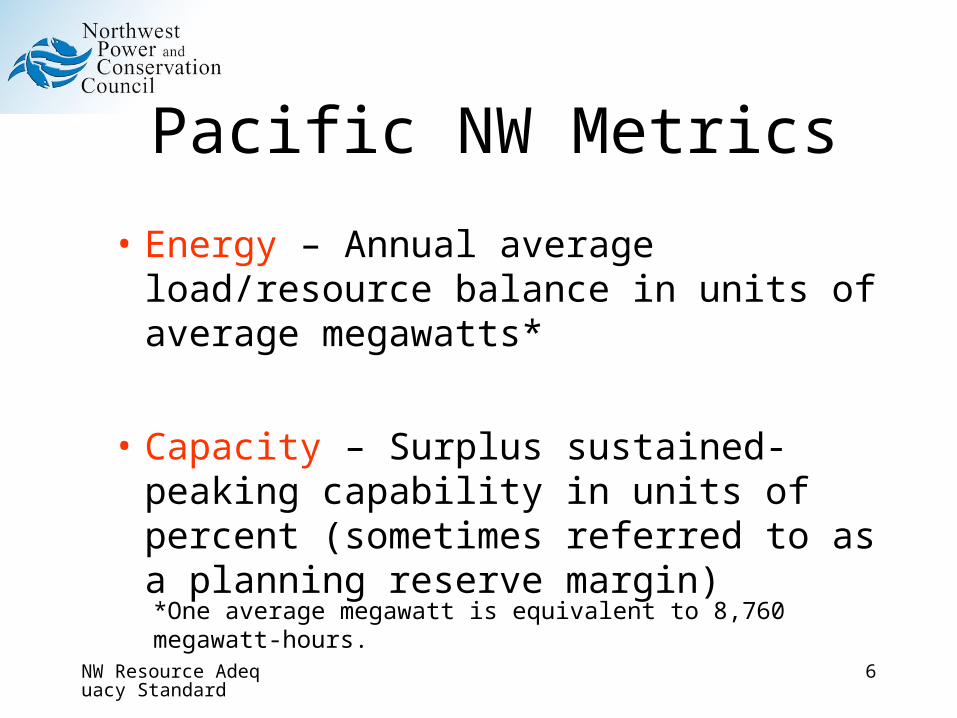
Pacific NW Metrics
• Energy – Annual average load/resource balance in units of average megawatts*
• Capacity – Surplus sustained-peaking capability in units of percent (sometimes referred to as a planning reserve margin)
*One average megawatt is equivalent to 8,760 megawatt-hours.
NW Resource Adequacy Standard
7
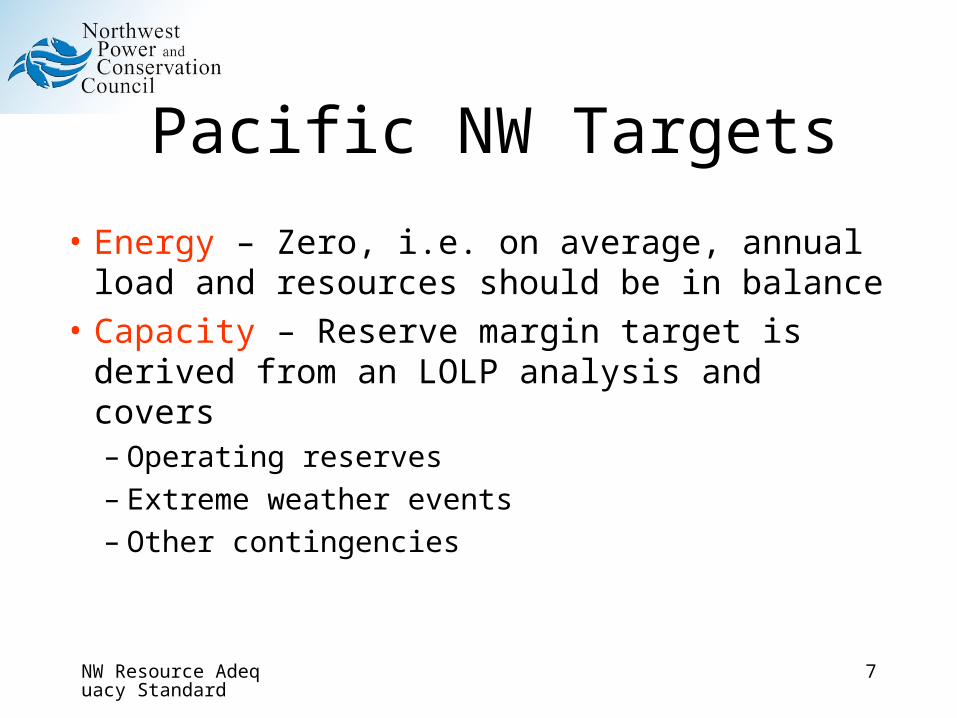
Pacific NW Targets
• Energy – Zero, i.e. on average, annual load and resources should be in balance
• Capacity – Reserve margin target is derived from an LOLP analysis and covers– Operating reserves– Extreme weather events– Other contingencies
NW Resource Adequacy Standard
8
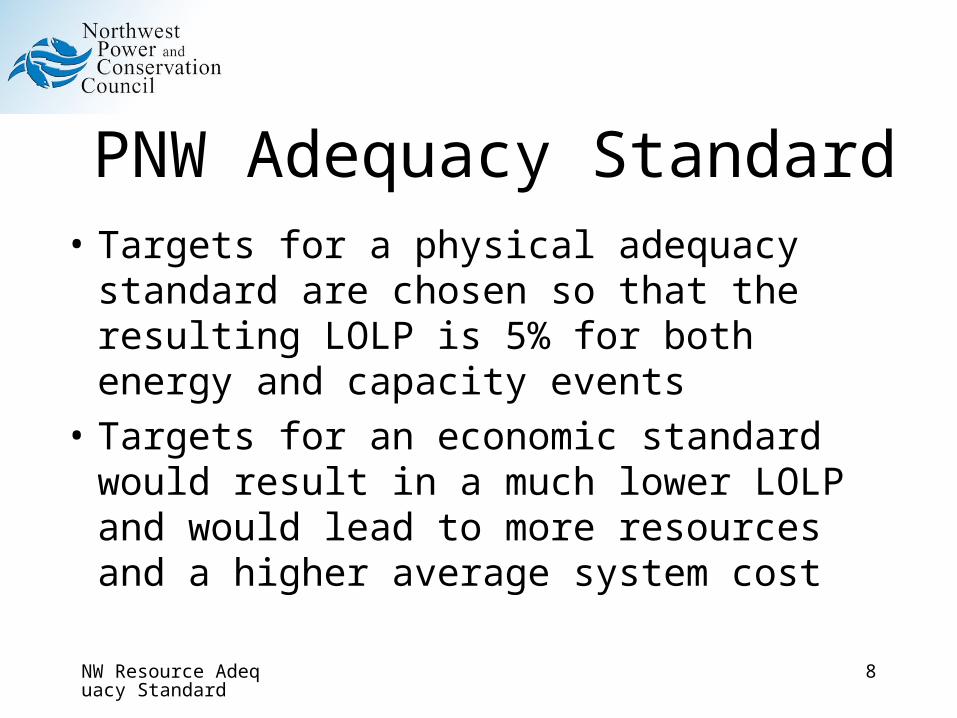
PNW Adequacy Standard• Targets for a physical adequacy standard are
chosen so that the resulting LOLP is 5% for both energy and capacity events
• Targets for an economic standard would result in a much lower LOLP and would lead to more resources and a higher average system cost
NW Resource Adequacy Standard
9
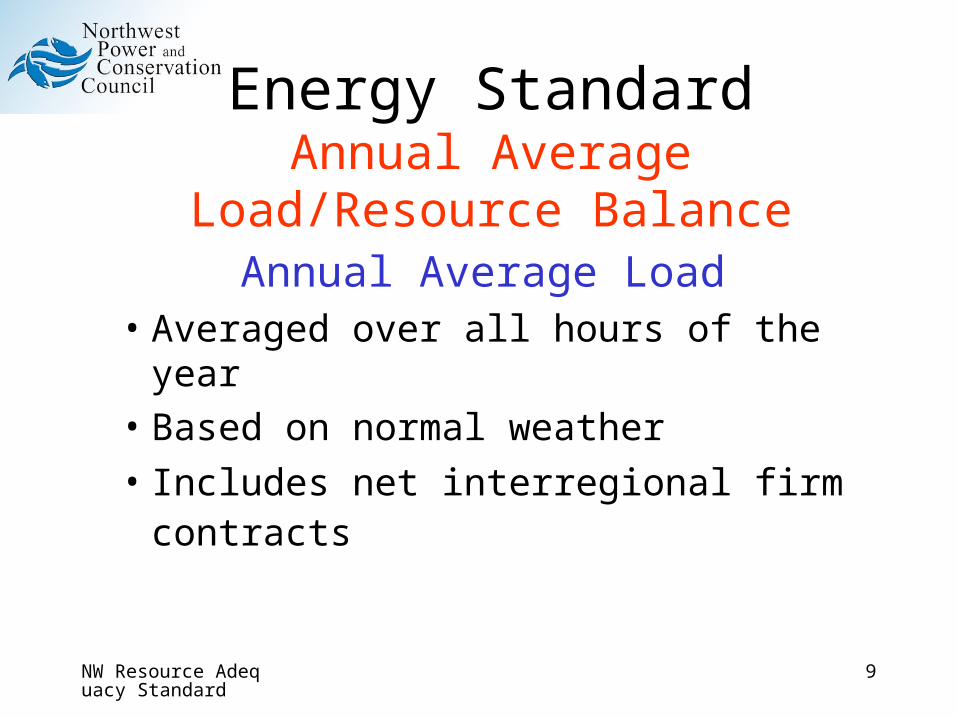
Energy StandardAnnual Average Load/Resource Balance
Annual Average Load• Averaged over all hours of the year• Based on normal weather
• Includes net interregional firm contracts
NW Resource Adequacy Standard
10
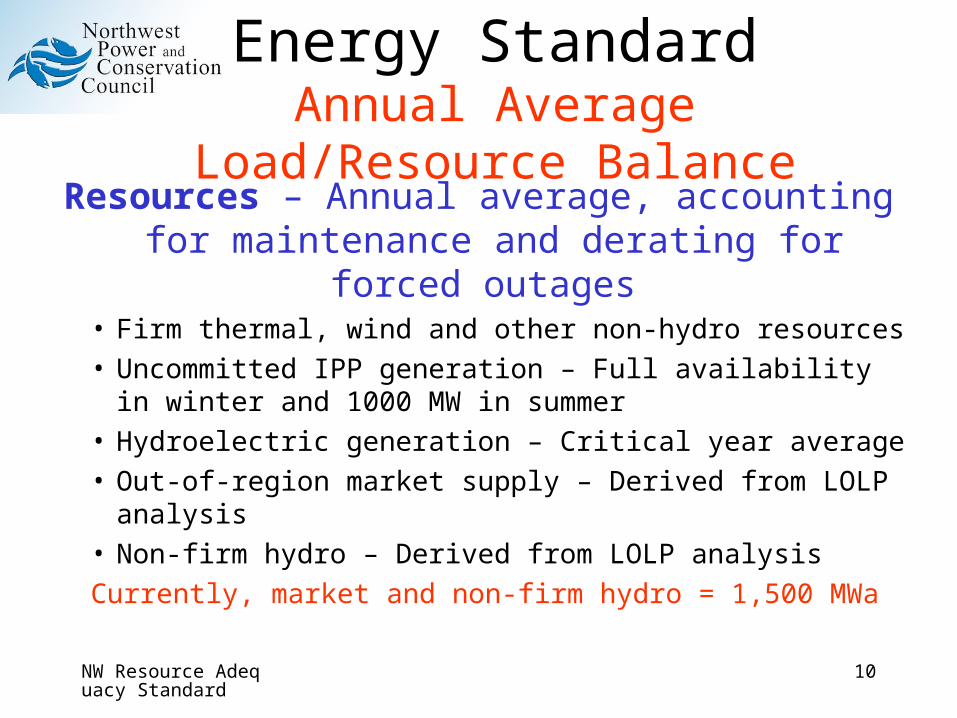
Energy StandardAnnual Average Load/Resource BalanceResources – Annual average, accounting for maintenance and derating for forced outages
• Firm thermal, wind and other non-hydro resources
• Uncommitted IPP generation – Full availability in winter and 1000 MW in summer
• Hydroelectric generation – Critical year average
• Out-of-region market supply – Derived from LOLP analysis
• Non-firm hydro – Derived from LOLP analysis
Currently, market and non-firm hydro = 1,500 MWa
NW Resource Adequacy Standard
11
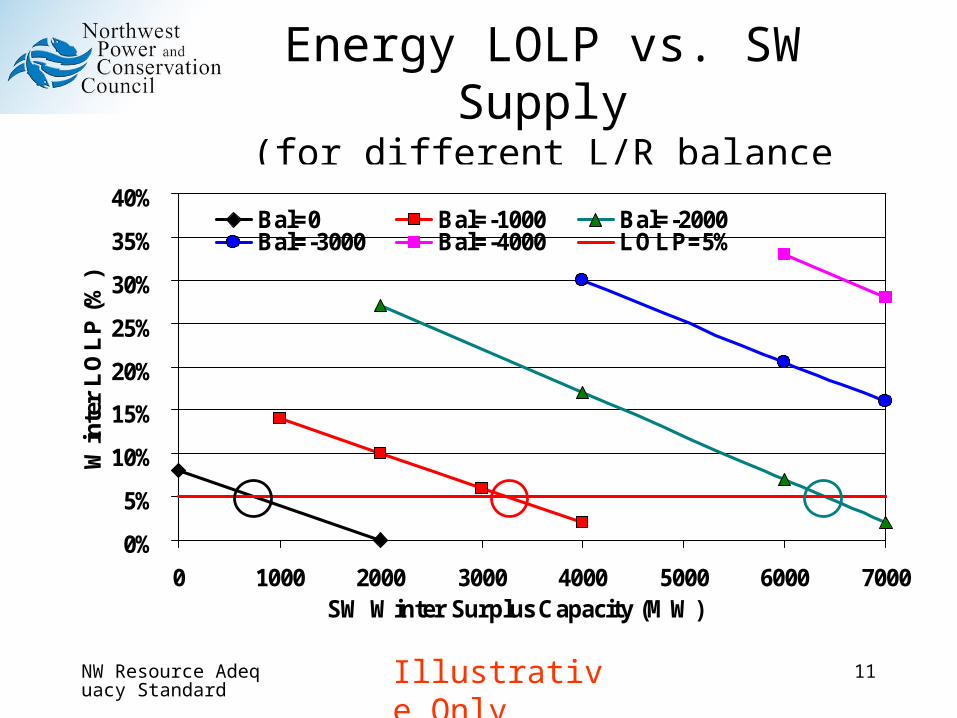
Energy LOLP vs. SW Supply(for different L/R balance values)
0%
5%
10%
15%
20%
25%
30%
35%
40%
0 1000 2000 3000 4000 5000 6000 7000SW Winter Surplus Capacity (MW)
Win
ter
LO
LP
(%
)
Bal=0 Bal=-1000 Bal=-2000Bal=-3000 Bal=-4000 LOLP=5%
Illustrative Only
NW Resource Adequacy Standard
12
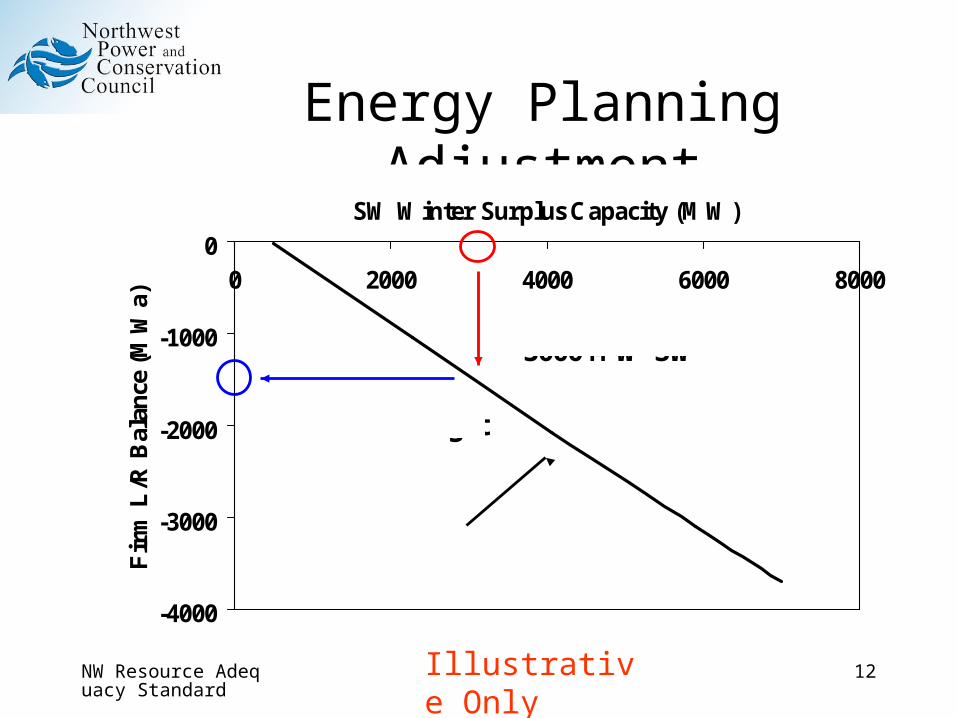
Energy Planning Adjustment
-4000
-3000
-2000
-1000
00 2000 4000 6000 8000
SW Winter Surplus Capacity (MW)
Fir
m L
/R B
alan
ce (
MW
a)
Constant 5% LOLP
1500 MWa Target
3000 MW SW
Illustrative Only
NW Resource Adequacy Standard
13
Energy StandardAnnual Average Load/Resource Balance
The annual average generating capability of firm and some non-firm resources should equal the annual average load.
NW Resource Adequacy Standard
14
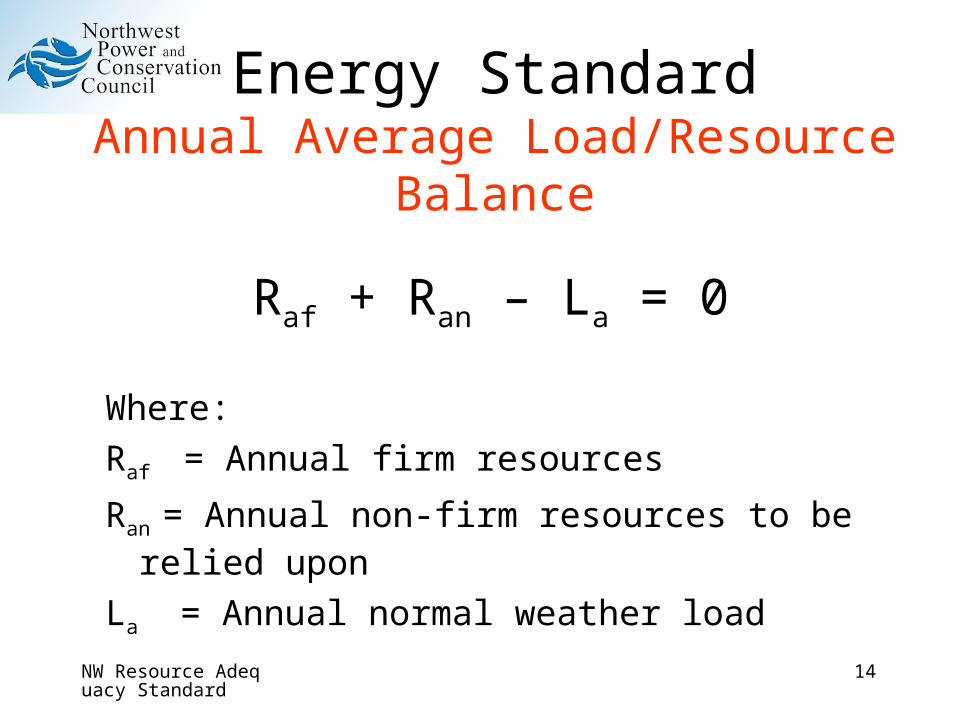
Energy StandardAnnual Average Load/Resource Balance
Raf + Ran – La = 0
Where:
Raf = Annual firm resources
Ran = Annual non-firm resources to be relied upon
La = Annual normal weather load
NW Resource Adequacy Standard
15
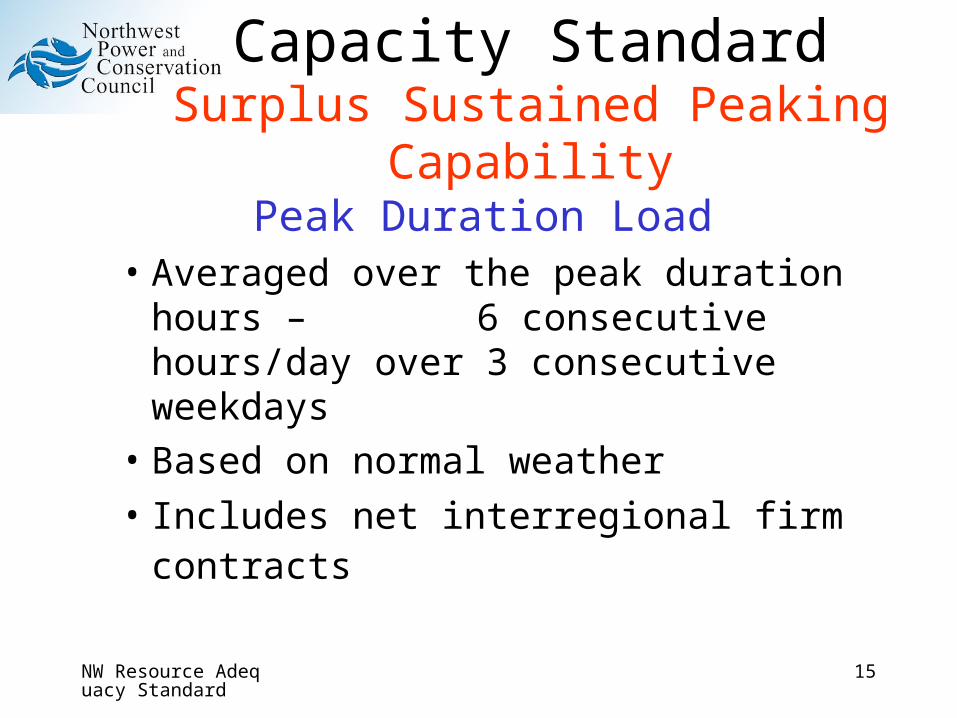
Capacity StandardSurplus Sustained Peaking Capability
Peak Duration Load• Averaged over the peak duration hours –
6 consecutive hours/day over 3 consecutive weekdays
• Based on normal weather
• Includes net interregional firm contracts
NW Resource Adequacy Standard
16
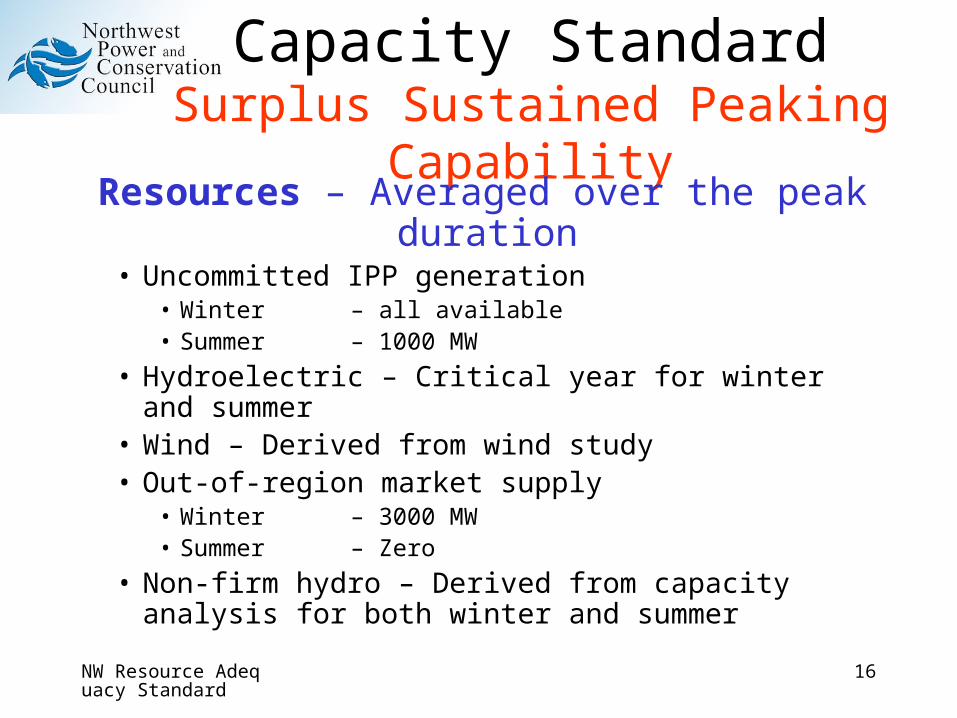
Capacity StandardSurplus Sustained Peaking Capability
Resources – Averaged over the peak duration • Uncommitted IPP generation
• Winter – all available• Summer – 1000 MW
• Hydroelectric – Critical year for winter and summer• Wind – Derived from wind study • Out-of-region market supply
• Winter – 3000 MW• Summer – Zero
• Non-firm hydro – Derived from capacity analysis for both winter and summer
NW Resource Adequacy Standard
17
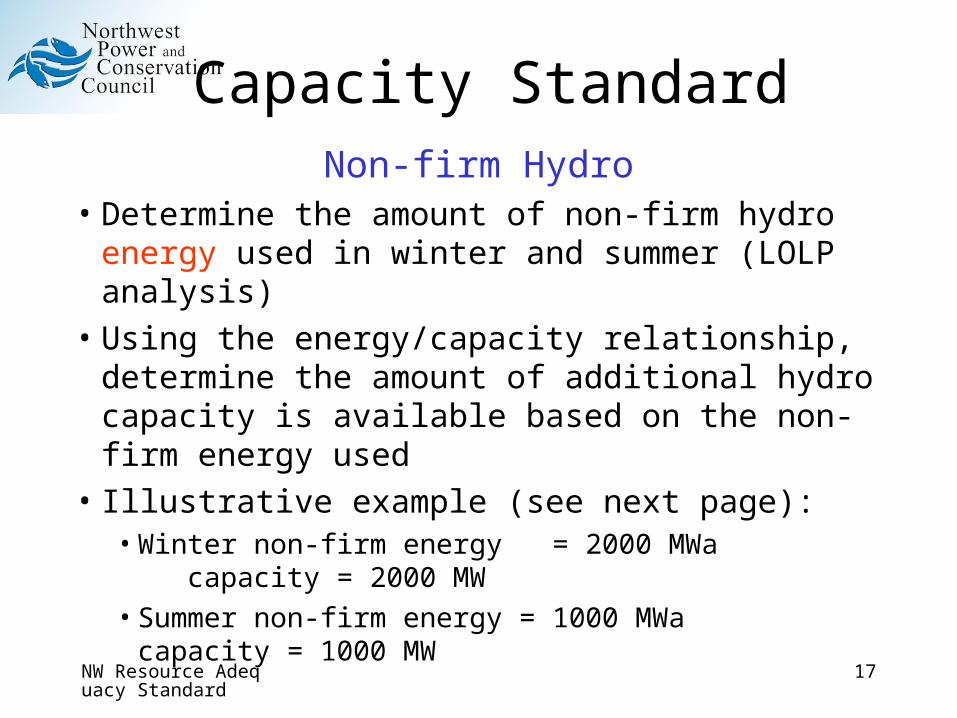
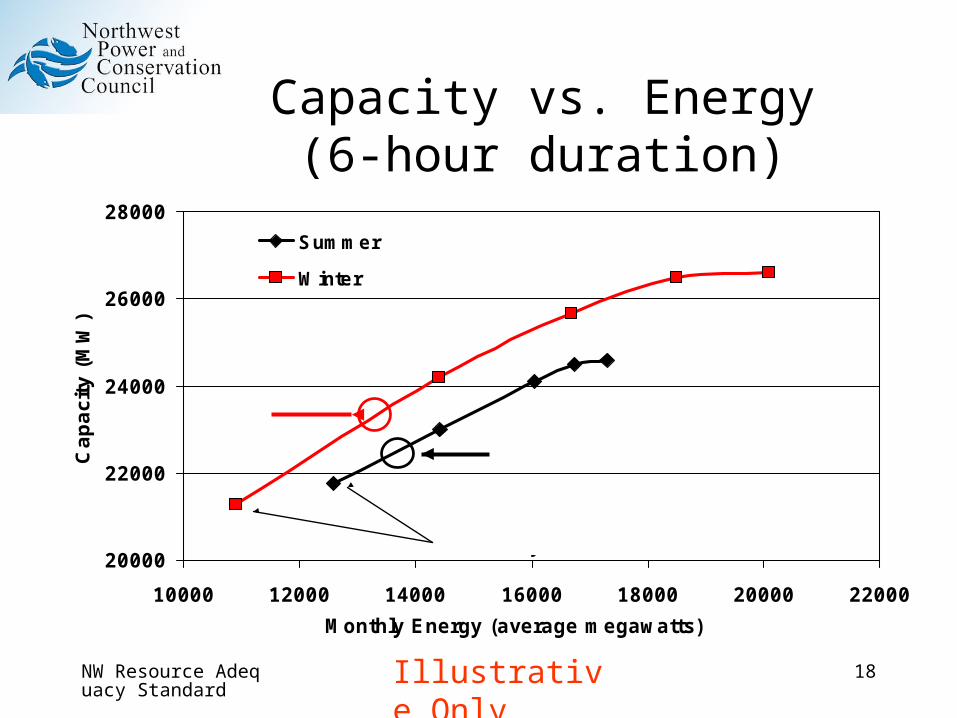
Capacity StandardNon-firm Hydro
• Determine the amount of non-firm hydro energy used in winter and summer (LOLP analysis)
• Using the energy/capacity relationship, determine the amount of additional hydro capacity is available based on the non-firm energy used
• Illustrative example (see next page): • Winter non-firm energy = 2000 MWa
capacity = 2000 MW
• Summer non-firm energy = 1000 MWa capacity = 1000 MW
NW Resource Adequacy Standard
18
Capacity vs. Energy(6-hour duration)
20000
22000
24000
26000
28000
10000 12000 14000 16000 18000 20000 22000
Monthly Energy (average megawatts)
Capaci
ty (
MW
)
Summer
Winter
Critical Hydro
+1000
+2000
Illustrative Only
NW Resource Adequacy Standard
19
Capacity StandardSurplus Sustained Peaking Capability
The peak duration generating capability of firm and some non-firm resources should equal the peak duration load plus a surplus* derived from the LOLP analysis.
*The surplus can be thought of as providing operating reserves and to cover deviations from normal loads due to adverse temperature and/or resource forced outages.
NW Resource Adequacy Standard
20
Capacity StandardSurplus Sustained Peaking Capability
(Rpf + Rpn)/ Lp - 1 = RMWhere:
Rpf = Peak duration firm resources
Rpn = Peak non-firm resources to be relied upon
Lp = Peak duration normal weather load
RM = Peak duration reserve margin derived from an LOLP analysis