Embed Size (px)
Citation preview
Managing Capital Flows: The Case of India
Ajay Shah
Ila Patnaik
May 2008
ADB Institute Discussion Paper No. 98
The authors are senior fellows at the National Institute for Public Finance and Policy, New Delhi. They would like to thank the Centre for Monitoring Indian Economy (CMIE) for assistance with data.
The views expressed in this paper are the views of the authors and do not necessarily reflect the views or policies of ADBI, the Asian Development Bank (ADB), its Board of Directors, or the governments they represent. ADBI does not guarantee the accuracy of the data included in this paper and accepts no responsibility for any consequences of their use. Terminology used may not necessarily be consistent with ADB official terms.
ADBI’s discussion papers reflect initial ideas on a topic, and are posted online for discussion. ADBI encourages readers to post their comments on the main page for each discussion paper (given in the citation below). Some discussion papers may develop into research papers or other forms of publication.
This discussion paper is part of the “Managing Capital Flows: Search for a Model” project.
Suggested citation:
Shah, Ajay and Ila Patnaik. 2008. Managing Capital Flows: The Case of India. ADBI Discussion Paper 98. Tokyo: Asian Development Bank Institute. Available: http://www.adbi.org/discussion-paper/2008/05/21/2540.managing.capital.flows.india/
Asian Development Bank Institute Kasumigaseki Building 8F 3-2-5 Kasumigaseki, Chiyoda-ku Tokyo 100-6008, Japan
Tel: +81-3-3593-5500 Fax: +81-3-3593-5571 URL: www.adbi.org E-mail: [email protected]
© 2008 Asian Development Bank Institute
Abstract
From the early 1990s, India embarked on easing capital controls. Liberalizationemphasized openness towards equity flows, both FDI and portfolio flows. In particular,there are few barriers in the face of portfolio equity flows. In recent years, a massiveincrease in the value of foreign ownership of Indian equities has come about, largelyreflecting improvements in the size, liquidity and corporate governance of Indian firms.While the system of capital controls appears formidable, the de facto openness on theground is greater than is apparent, particularly because of the substantial enlargement ofthe current account. These changes to capital account openness were not accompaniedby commensurate monetary policy reform. The monetary policy regime has consistedessentially of a pegged exchange rate to the US dollar throughout. Increasing opennesson the capital account, coupled with exchange rate pegging, has led to a substantial lossof monetary policy autonomy. The logical way forward now consists of bringing the de jurecapital controls up-to-date with the de facto convertibility, and embarking on reforms of themonetary policy framework so as to shift the focus of monetary policy away from theexchange rate to domestic inflation.
JEL Classification: F21, F34, E42
ADBI Discussion Paper 98 Ajay Shah, Ila Patnaik
Contents1 Types and Magnitude of Capital Flows 2
1.1 The Indian Approach to Capital Controls . . . . . . . . . . . . . . 21.1.1 Inbound FDI . . . . . . . . . . . . . . . . . . . . . . . . 21.1.2 Portfolio Flows . . . . . . . . . . . . . . . . . . . . . . . 41.1.3 Sovereign Debt . . . . . . . . . . . . . . . . . . . . . . . 61.1.4 Debt of Firms . . . . . . . . . . . . . . . . . . . . . . . . 81.1.5 Capital Outflows . . . . . . . . . . . . . . . . . . . . . . 8
1.2 De Jure Capital Controls in an International Context . . . . . . . . 101.3 Evolution of Openness . . . . . . . . . . . . . . . . . . . . . . . 121.4 De Facto Openness Exceeds De Jure Openness . . . . . . . . . . 14
2 Determinants of Portfolio Flows 142.1 The Evolution of Home Bias against India . . . . . . . . . . . . . 152.2 Time-series Evidence . . . . . . . . . . . . . . . . . . . . . . . . 152.3 Explaining the Decline in Home Bias . . . . . . . . . . . . . . . 17
3 Macroeconomic Impact of Capital Flows 193.1 The Backdrop — a Pegged Exchange Rate . . . . . . . . . . . . . 193.2 Extent of Sterilization . . . . . . . . . . . . . . . . . . . . . . . . 223.3 Loss of Monetary Policy Autonomy . . . . . . . . . . . . . . . . 233.4 Impact on Inflation . . . . . . . . . . . . . . . . . . . . . . . . . 233.5 Summary: Pegged Exchange Rate Induced a Loss of Monetary
Policy Autonomy . . . . . . . . . . . . . . . . . . . . . . . . . . 24
4 Appropriate Policy Responses 254.1 Monetary Policy Reform . . . . . . . . . . . . . . . . . . . . . . 264.2 Full Convertibility . . . . . . . . . . . . . . . . . . . . . . . . . . 26
A Statistical Appendix 30
ADBI Discussion Paper 98 Ajay Shah, Ila Patnaik
1 Types and Magnitude of Capital Flows
1.1 The Indian Approach to Capital Controls
In the early 1990s India faced a balance of payments crisis. This crisis was fol-lowed by an IMF structural adjustment program, economic reforms and liberaliza-tion of the trade and capital accounts. Policy makers were, however, very cautiousabout opening up the economy to debt flows. The experience of the Balance ofPayments (BOP) crises as well as the lessons learned from other developing coun-tries suggested that debt flows, especially short term debt flows, could lead to BOPdifficulties if the country faced macroeconomic imbalances and had an inflexibleexchange rate. The emphasis was, therefore, on foreign investment — both for-eign direct investment (FDI) and portfolio investment. Even these were opened upslowly and a system of capital controls remained in place. For a detailed treatmentof the easing of capital controls in the 1990s, see Shah and Patnaik (2007a).
1.1.1 Inbound FDI
India opened up slowly to FDI in the 1990s. The limits on the share of foreignownership was slowly increased in every sector. By 2000, while most sectors wereopen up to 100 percent, sectors where FDI was restricted include retail trading(except single brand product retailing), atomic energy, and betting. Table 1 showsthe areas where FDI caps exist.
While inbound FDI investors have the ability to repatriate capital, so far, in theIndian experience, this reverse flow of capital has been tiny. As an example, in2006–07, it was 0.01% of GDP. Hence, for all practical purposes, inbound FDIhas been a one-way process of capital coming into the country.1
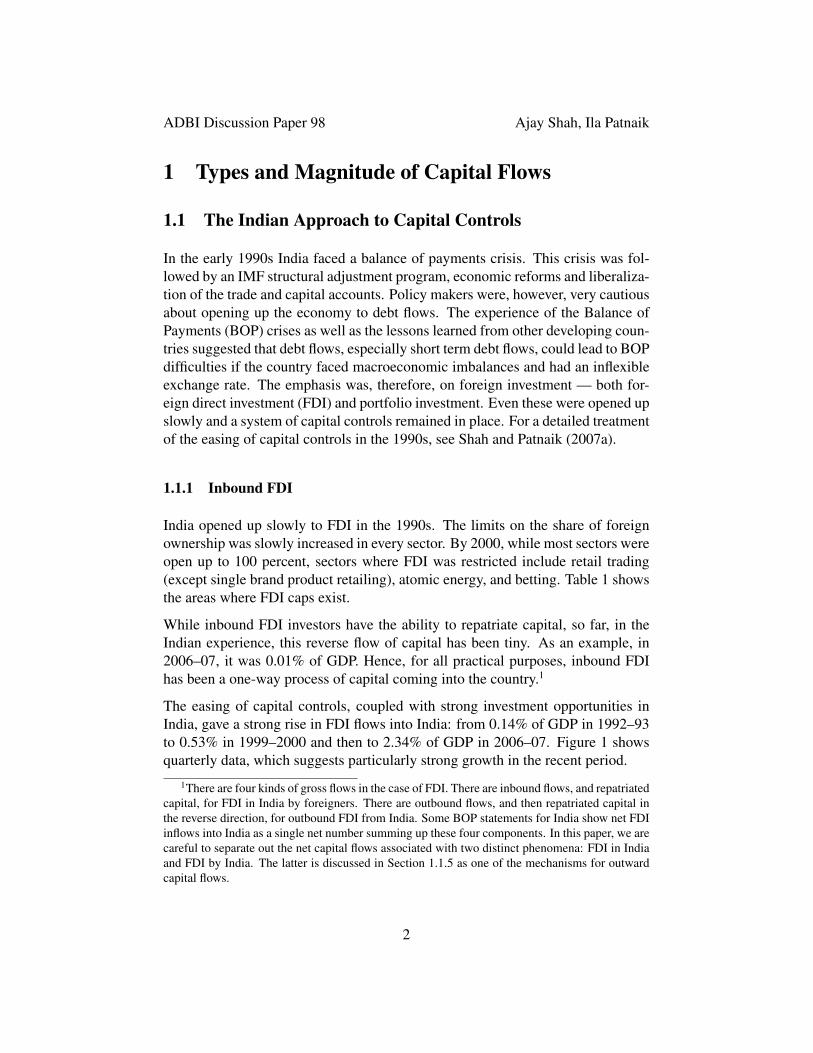
The easing of capital controls, coupled with strong investment opportunities inIndia, gave a strong rise in FDI flows into India: from 0.14% of GDP in 1992–93to 0.53% in 1999–2000 and then to 2.34% of GDP in 2006–07. Figure 1 showsquarterly data, which suggests particularly strong growth in the recent period.
1There are four kinds of gross flows in the case of FDI. There are inbound flows, and repatriatedcapital, for FDI in India by foreigners. There are outbound flows, and then repatriated capital inthe reverse direction, for outbound FDI from India. Some BOP statements for India show net FDIinflows into India as a single net number summing up these four components. In this paper, we arecareful to separate out the net capital flows associated with two distinct phenomena: FDI in Indiaand FDI by India. The latter is discussed in Section 1.1.5 as one of the mechanisms for outwardcapital flows.
2
ADBI Discussion Paper 98 Ajay Shah, Ila Patnaik
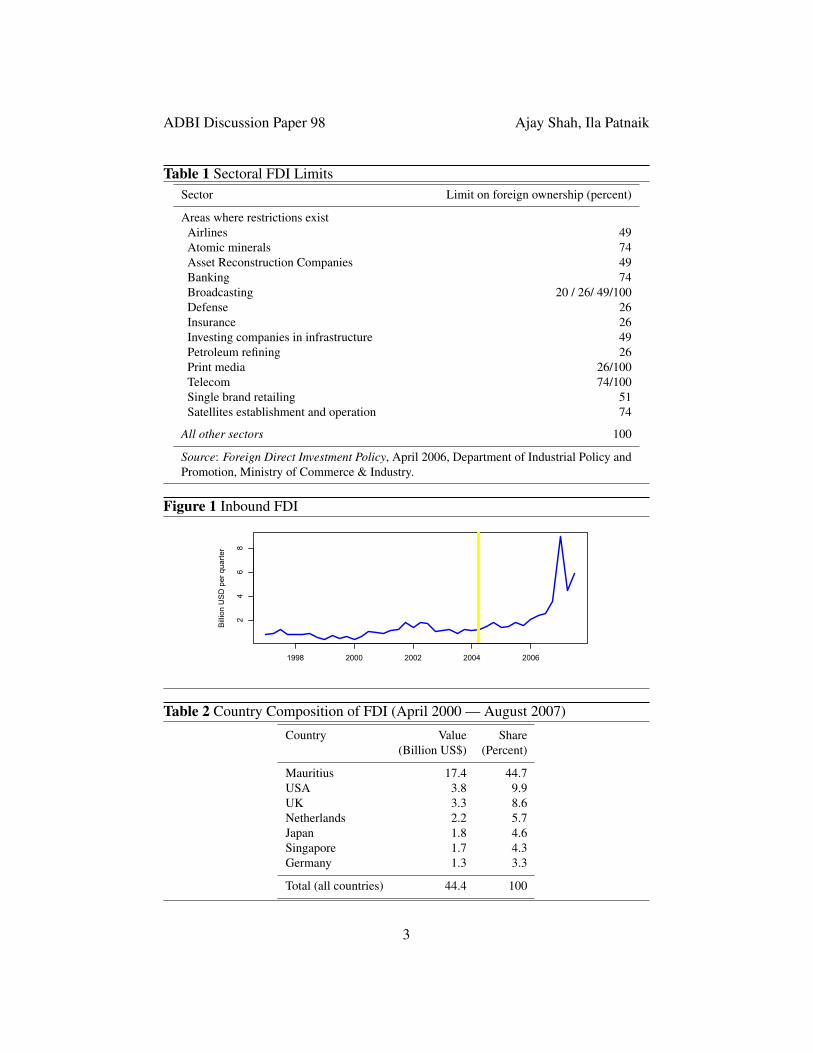
Table 1 Sectoral FDI LimitsSector Limit on foreign ownership (percent)
Areas where restrictions existAirlines 49Atomic minerals 74Asset Reconstruction Companies 49Banking 74Broadcasting 20 / 26/ 49/100Defense 26Insurance 26Investing companies in infrastructure 49Petroleum refining 26Print media 26/100Telecom 74/100Single brand retailing 51Satellites establishment and operation 74
All other sectors 100
Source: Foreign Direct Investment Policy, April 2006, Department of Industrial Policy andPromotion, Ministry of Commerce & Industry.
Figure 1 Inbound FDI
24
68
Bill
ion
US
D p
er q
uarte
r
1998 2000 2002 2004 2006
Table 2 Country Composition of FDI (April 2000 — August 2007)
Country Value Share(Billion US$) (Percent)
Mauritius 17.4 44.7USA 3.8 9.9UK 3.3 8.6Netherlands 2.2 5.7Japan 1.8 4.6Singapore 1.7 4.3Germany 1.3 3.3
Total (all countries) 44.4 100
3
ADBI Discussion Paper 98 Ajay Shah, Ila Patnaik
Table 3 Sectoral composition of inbound FDI (April 2000 — August 2007)
Sector Value Share(Billion US$) (Percent)
Services 8.1 20.6Computer hardware and software 6.2 16.0Telecom 3.5 8.7Automobiles 1.7 8.7Construction including roads 2.1 5.2Electricity 1.3 3.4
Total (all industries) 44.4 100
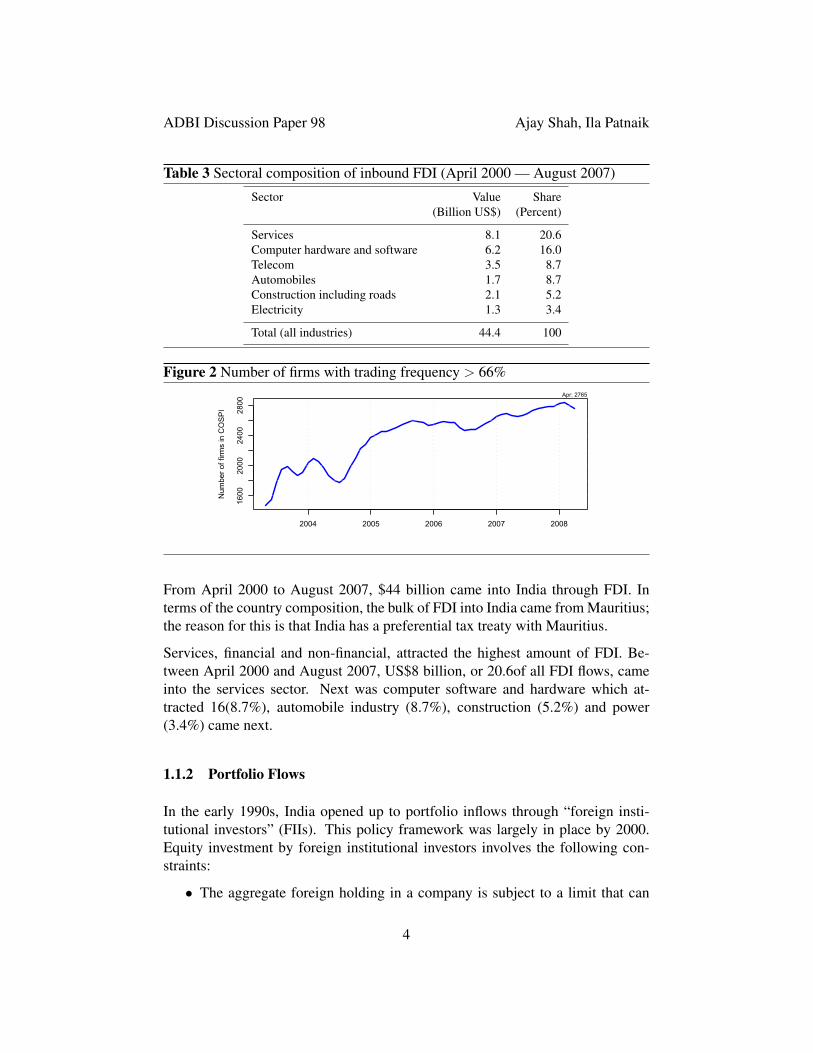
Figure 2 Number of firms with trading frequency > 66%
1600
2000
2400
2800
Num
ber o
f firm
s in
CO
SP
I
2004 2005 2006 2007 2008
Apr: 2765
From April 2000 to August 2007, $44 billion came into India through FDI. Interms of the country composition, the bulk of FDI into India came from Mauritius;the reason for this is that India has a preferential tax treaty with Mauritius.
Services, financial and non-financial, attracted the highest amount of FDI. Be-tween April 2000 and August 2007, US$8 billion, or 20.6of all FDI flows, cameinto the services sector. Next was computer software and hardware which at-tracted 16(8.7%), automobile industry (8.7%), construction (5.2%) and power(3.4%) came next.
1.1.2 Portfolio Flows
In the early 1990s, India opened up to portfolio inflows through “foreign insti-tutional investors” (FIIs). This policy framework was largely in place by 2000.Equity investment by foreign institutional investors involves the following con-straints:
• The aggregate foreign holding in a company is subject to a limit that can
4
ADBI Discussion Paper 98 Ajay Shah, Ila Patnaik
be set by the shareholders of the company. This limit is, in turn, subject to“sectoral limits” which apply in certain sectors.
• No one foreign portfolio investor can own more than 10% of a company.Foreign ownership in certain sectors (telecom, insurance, banking) is cappedat various levels.
Barring these constraints, portfolio investors have convertibility in the sense thatthey are free to bring capital in and out of the country without requiring permis-sions. Unlike the Chinese QFI framework, there are no quantitative restrictions orlimitations on participation by global financial firms in the Indian market. Morethan a thousand global firms are now registered in India as “FIIs.”
In parallel, over the 1992–2001 period, a substantial policy effort took place inreforming the equity market (Thomas, 2006). As an example, Figure 2 shows thenumber of listed firms where trading takes place on at least two-thirds of the daysof the year. By November 2007, the market value of this set of firms stood at $1.6trillion: this value marks a sea change when compared with the level of $0.11trillion found in November 1997. In recent years, the two Indian exchanges (NSEand BSE) have been ranked third and fifth in the world by number of transactions.
In many emerging markets, issuance on the ADR/GDR markets has been an im-portant vehicle for financial globalization. In the case of India, the ADR/GDRmarket was significant in 1994–97 because in 1993, when FII investment intoIndia first surged, the settlement system collapsed. Issuance on the ADR/GDRmarkets was seen as a way to avoid the weak institutions of the domestic stockmarket. However, by 1997 domestic equity market reforms had made substantialprogress.
We express the flow of issuance on the GDR/ADR markets as a fraction of thestock market capitalization at the end of the year. This series showed large valuesaveraging 1.08% over the period from 1993 to 1997. By 1997, the Indian equitymarket reforms had started falling into place. As a consequence, annual issuanceon the GDR/ADR market dropped to 0.4% of market capitalization in the periodfrom 1998 to 2007. In this respect, India’s experience has been different fromthat of many emerging markets, where deepening financial globalization has oftenbeen accompanied by a substantial scale of offshore listing.
The combination of easing capital controls, strong investment opportunities inIndia, and the sophistication of the domestic equity market led to sharp growth inportfolio inflows. These went from 0.11% of GDP in 1992–93 to 0.73% of GDPin 1999–00 and further to 0.84% of GDP in 2006–07.
5
ADBI Discussion Paper 98 Ajay Shah, Ila Patnaik
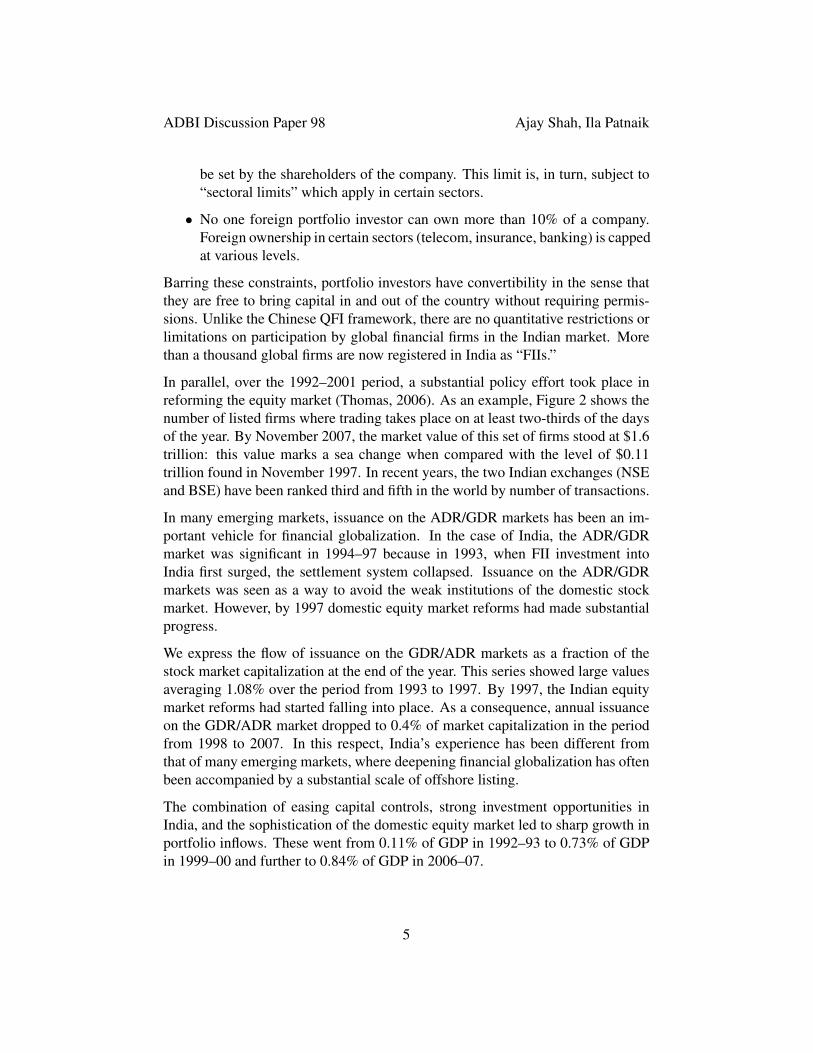
Figure 3 Inbound Portfolio Flows
1990 1995 2000 2005
−10
−50
510
Inbound portfolio flows
Per
cent
to G
DP
InflowNetOutflow
Figure 3 shows the time-series of portfolio flows, expressed as percent to GDP.Unlike FDI, a remarkable feature of portfolio flows has been substantial inboundand outbound flows, which leave a small net inflow. This reflects the de facto
convertibility that has been granted to foreign portfolio investors on the equitymarket.
In 2007, the government introduced fresh capital controls against “participatorynotes,” which are OTC derivatives sold by a financial firm which is a registeredFII to an investor who is not registered. This was sought to be done in order toreduce capital inflows into the country that were inducing difficulties for the im-plementation of the pegged exchange rate. However, the economic impact of thiswas limited, since the capital control was only against the sale of OTC derivatives.Registration of FIIs took place at an accelerated pace, and there was no significantchange in either net portfolio purchases by FIIs, or the role of FIIs in the domesticmarket.2
1.1.3 Sovereign Debt
One element of the policy framework of the early 1990s was encouragement forequity flows but barriers against debt inflows. Technically, the government ofIndia has no sovereign debt program. Aid flows are miniscule. There is a cap onthe stock of ownership of government bonds by FIIs which is set at a minisculenumber of $1.5 billion. Hence, as a practical matter, FII investment into rupee-denominated government bonds is zero.
2For a discussion about participatory notes, see Singh (2007). For a treatment of this episode ofcapital controls against participatory notes, see http://ajayshahblog.blogspot.com/2007/10/middle-muddle.html on the world wide web.
6
ADBI Discussion Paper 98 Ajay Shah, Ila Patnaik
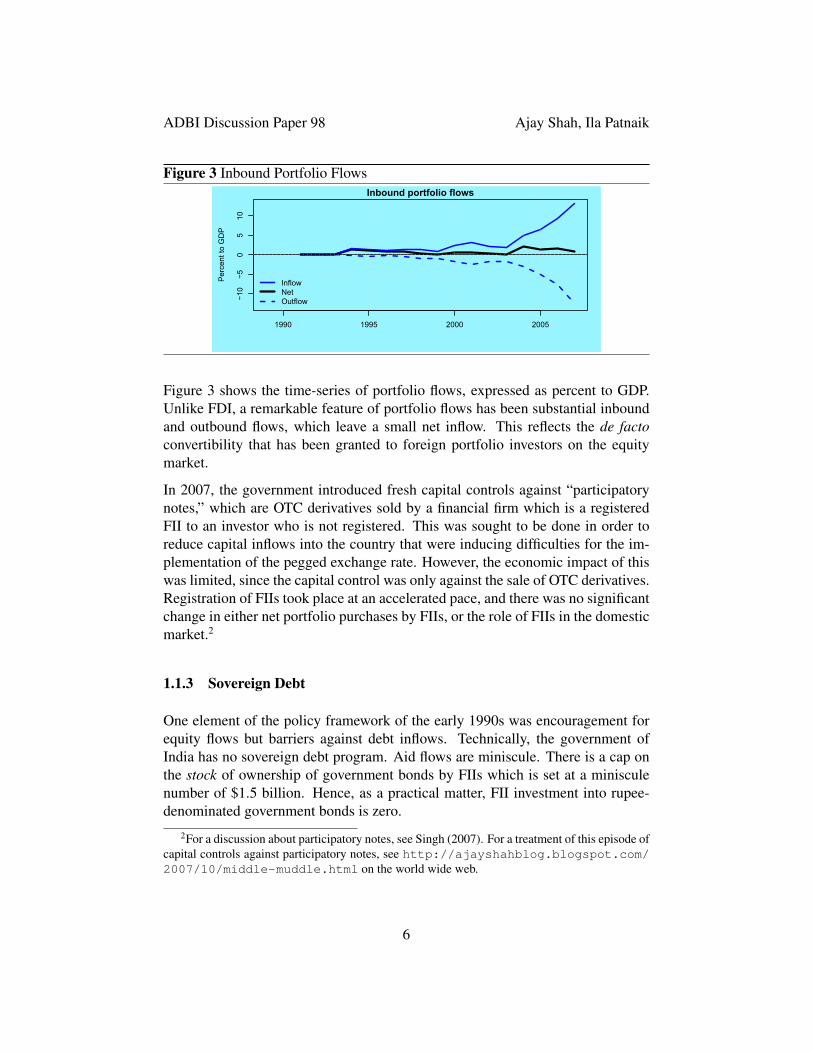
Table 4 The Importance of Quasi-sovereign Borrowing
1992 2000 2007
Stock of debt (Billion US$)Sovereign debt 48.62 45.98 47.24Quasi-sovereign debt 15.96 25.63 45.26Private debt 20.71 26.65 62.54
Total debt 85.29 98.26 155.04
Ratios (in percent)Sovereign debt to GDP 20.20 11.30 6.08Sovereign + quasi sovereign debt to GDP 26.83 17.59 11.90Private debt to GDP 8.60 6.55 8.05Private debt to total debt 24.28 27.12 40.34
However, from time to time, banks have borrowed abroad depending on the gov-ernment’s assessment of the stock of foreign exchange reserves and their ade-quacy. One form this has taken is borrowing in the form of bank deposits ofNon-Resident Indians (NRIs) (Gordon and Gupta, 2004). The interest rates onthese deposits are set by the RBI and fluctuate according to whether the govern-ment wishes to encourage or discourage inflows. Three-quarters of Indian bankdeposits are with government-owned banks, which are explicitly guaranteed bythe government. Even with private banks, there is an implicit liability of the State,for no significant private bank has ever been allowed to fail. The borrowing of anIndian bank is, then, visibly backed by the government.
The authorities claim that a massive reduction in offshore debt, particularly off-shore sovereign debt, took place in the 1990s. By the official classification, theexternal debt of GOI stagnated at between $45 billion and $50 billion over 1998–2007. However, a more accurate rendition of the situation requires addressing aphenomenon that we term “quasi-sovereign” debt.
Table 4 shows statistics for quasi-sovereign borrowing, based on a reclassificationof the detailed statistics for debt stock. While sovereign debt measured in dollarshas stagnated, implying a rapid decline in sovereign debt expressed as percent toGDP (from 20% in 1992 to 6% in 2007), this decline is exaggerated by keepingquasi-sovereign debt out of this reckoning.
Until 2000, the private sector had roughly one-fourth of total debt. Between 2000and 2007, the share of the private sector rose to roughly 40%, reflecting the liber-alization of ECB. However, the economic significance of these changes is limited,for private debt to GDP in 2007 was below the level seen in 1992.
7
ADBI Discussion Paper 98 Ajay Shah, Ila Patnaik
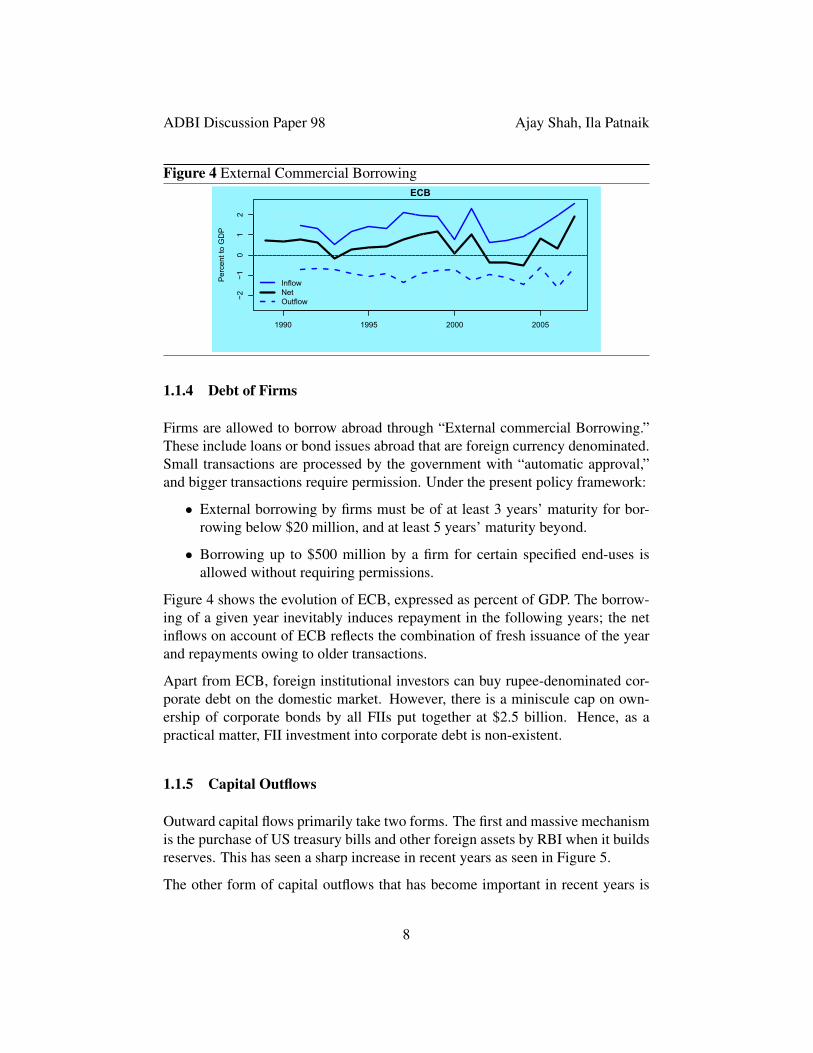
Figure 4 External Commercial Borrowing
1990 1995 2000 2005
−2−1
01
2
ECB
Per
cent
to G
DP
InflowNetOutflow
1.1.4 Debt of Firms
Firms are allowed to borrow abroad through “External commercial Borrowing.”These include loans or bond issues abroad that are foreign currency denominated.Small transactions are processed by the government with “automatic approval,”and bigger transactions require permission. Under the present policy framework:
• External borrowing by firms must be of at least 3 years’ maturity for bor-rowing below $20 million, and at least 5 years’ maturity beyond.
• Borrowing up to $500 million by a firm for certain specified end-uses isallowed without requiring permissions.
Figure 4 shows the evolution of ECB, expressed as percent of GDP. The borrow-ing of a given year inevitably induces repayment in the following years; the netinflows on account of ECB reflects the combination of fresh issuance of the yearand repayments owing to older transactions.
Apart from ECB, foreign institutional investors can buy rupee-denominated cor-porate debt on the domestic market. However, there is a miniscule cap on own-ership of corporate bonds by all FIIs put together at $2.5 billion. Hence, as apractical matter, FII investment into corporate debt is non-existent.
1.1.5 Capital Outflows
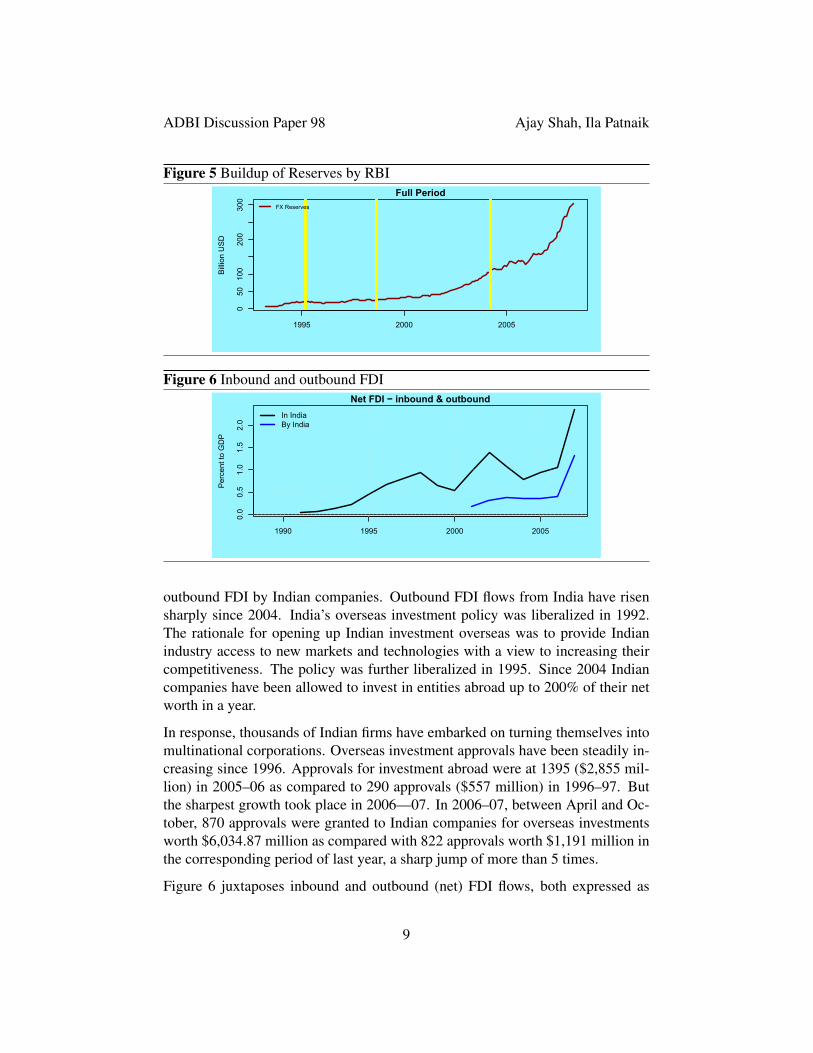
Outward capital flows primarily take two forms. The first and massive mechanismis the purchase of US treasury bills and other foreign assets by RBI when it buildsreserves. This has seen a sharp increase in recent years as seen in Figure 5.
The other form of capital outflows that has become important in recent years is
8
ADBI Discussion Paper 98 Ajay Shah, Ila Patnaik
Figure 5 Buildup of Reserves by RBI
050
100
200
300
Full Period
Bill
ion
US
D
1995 2000 2005
FX Reserves
Figure 6 Inbound and outbound FDI
1990 1995 2000 2005
0.0
0.5
1.0
1.5
2.0
Net FDI − inbound & outbound
Per
cent
to G
DP
In IndiaBy India
outbound FDI by Indian companies. Outbound FDI flows from India have risensharply since 2004. India’s overseas investment policy was liberalized in 1992.The rationale for opening up Indian investment overseas was to provide Indianindustry access to new markets and technologies with a view to increasing theircompetitiveness. The policy was further liberalized in 1995. Since 2004 Indiancompanies have been allowed to invest in entities abroad up to 200% of their networth in a year.
In response, thousands of Indian firms have embarked on turning themselves intomultinational corporations. Overseas investment approvals have been steadily in-creasing since 1996. Approvals for investment abroad were at 1395 ($2,855 mil-lion) in 2005–06 as compared to 290 approvals ($557 million) in 1996–97. Butthe sharpest growth took place in 2006—07. In 2006–07, between April and Oc-tober, 870 approvals were granted to Indian companies for overseas investmentsworth $6,034.87 million as compared with 822 approvals worth $1,191 million inthe corresponding period of last year, a sharp jump of more than 5 times.
Figure 6 juxtaposes inbound and outbound (net) FDI flows, both expressed as
9
ADBI Discussion Paper 98 Ajay Shah, Ila Patnaik
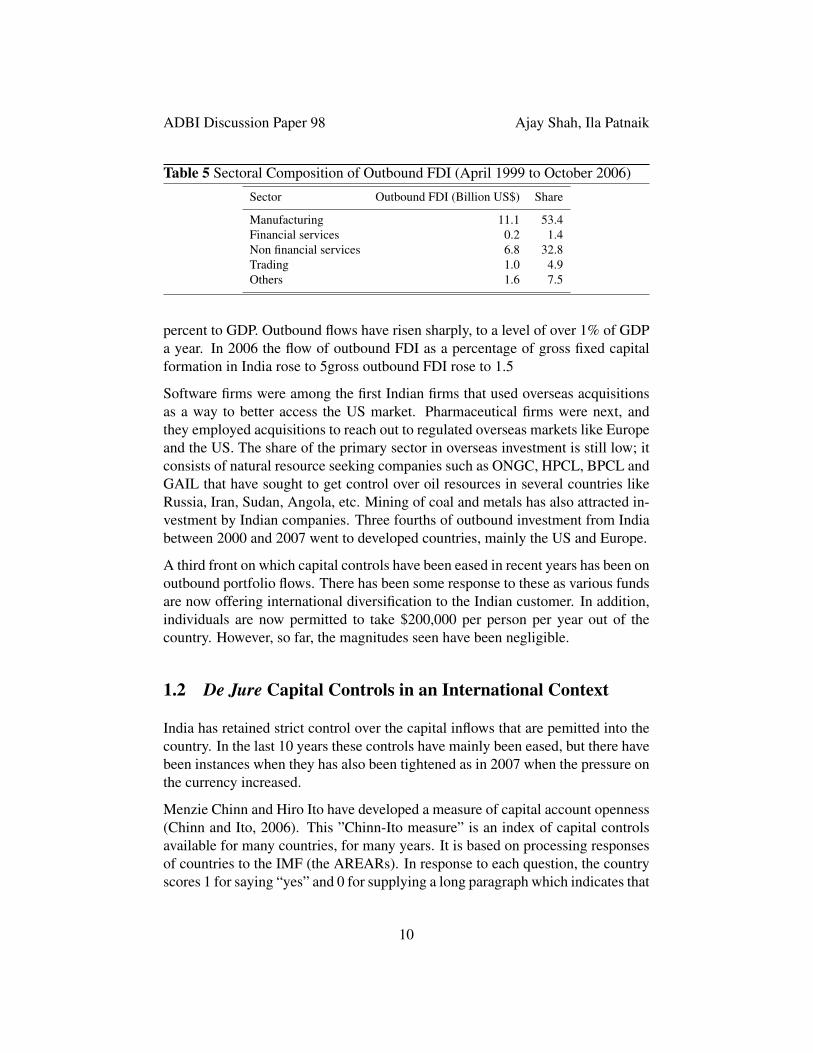
Table 5 Sectoral Composition of Outbound FDI (April 1999 to October 2006)
Sector Outbound FDI (Billion US$) Share
Manufacturing 11.1 53.4Financial services 0.2 1.4Non financial services 6.8 32.8Trading 1.0 4.9Others 1.6 7.5
percent to GDP. Outbound flows have risen sharply, to a level of over 1% of GDPa year. In 2006 the flow of outbound FDI as a percentage of gross fixed capitalformation in India rose to 5gross outbound FDI rose to 1.5
Software firms were among the first Indian firms that used overseas acquisitionsas a way to better access the US market. Pharmaceutical firms were next, andthey employed acquisitions to reach out to regulated overseas markets like Europeand the US. The share of the primary sector in overseas investment is still low; itconsists of natural resource seeking companies such as ONGC, HPCL, BPCL andGAIL that have sought to get control over oil resources in several countries likeRussia, Iran, Sudan, Angola, etc. Mining of coal and metals has also attracted in-vestment by Indian companies. Three fourths of outbound investment from Indiabetween 2000 and 2007 went to developed countries, mainly the US and Europe.
A third front on which capital controls have been eased in recent years has been onoutbound portfolio flows. There has been some response to these as various fundsare now offering international diversification to the Indian customer. In addition,individuals are now permitted to take $200,000 per person per year out of thecountry. However, so far, the magnitudes seen have been negligible.
1.2 De Jure Capital Controls in an International Context
India has retained strict control over the capital inflows that are pemitted into thecountry. In the last 10 years these controls have mainly been eased, but there havebeen instances when they has also been tightened as in 2007 when the pressure onthe currency increased.
Menzie Chinn and Hiro Ito have developed a measure of capital account openness(Chinn and Ito, 2006). This ”Chinn-Ito measure” is an index of capital controlsavailable for many countries, for many years. It is based on processing responsesof countries to the IMF (the AREARs). In response to each question, the countryscores 1 for saying “yes” and 0 for supplying a long paragraph which indicates that
10
ADBI Discussion Paper 98 Ajay Shah, Ila Patnaik
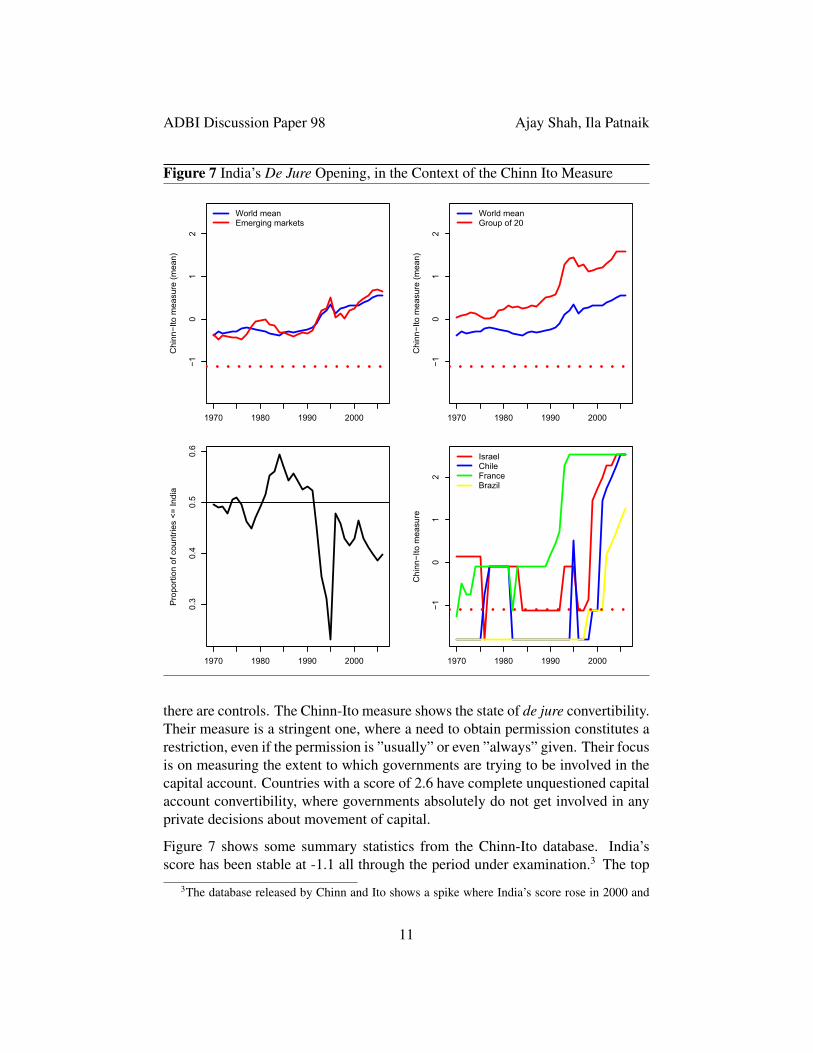
Figure 7 India’s De Jure Opening, in the Context of the Chinn Ito Measure
1970 1980 1990 2000
−10
12
Chi
nn−I
to m
easu
re (m
ean)
World meanEmerging markets
1970 1980 1990 2000
−10
12
Chi
nn−I
to m
easu
re (m
ean)
World meanGroup of 20
1970 1980 1990 2000
0.3
0.4
0.5
0.6
Pro
porti
on o
f cou
ntrie
s <=
Indi
a
1970 1980 1990 2000
−10
12
Chi
nn−I
to m
easu
re
IsraelChileFranceBrazil
there are controls. The Chinn-Ito measure shows the state of de jure convertibility.Their measure is a stringent one, where a need to obtain permission constitutes arestriction, even if the permission is ”usually” or even ”always” given. Their focusis on measuring the extent to which governments are trying to be involved in thecapital account. Countries with a score of 2.6 have complete unquestioned capitalaccount convertibility, where governments absolutely do not get involved in anyprivate decisions about movement of capital.
Figure 7 shows some summary statistics from the Chinn-Ito database. India’sscore has been stable at -1.1 all through the period under examination.3 The top
3The database released by Chinn and Ito shows a spike where India’s score rose in 2000 and
11
ADBI Discussion Paper 98 Ajay Shah, Ila Patnaik
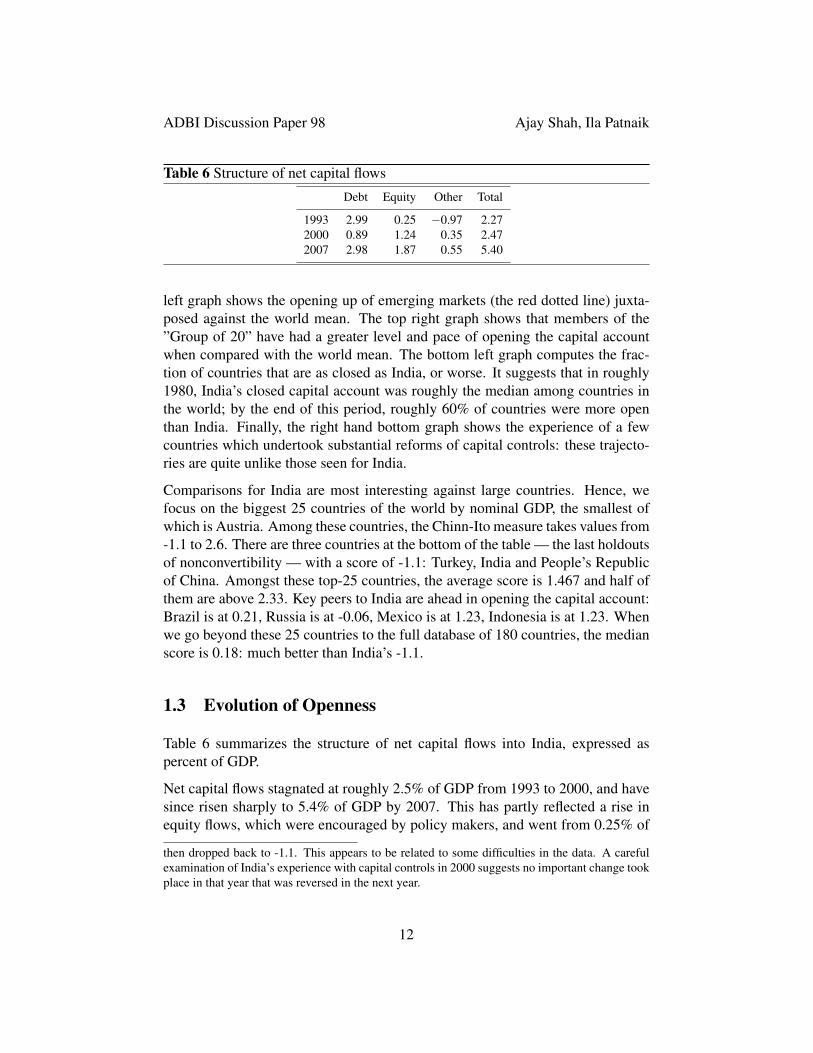
Table 6 Structure of net capital flows
Debt Equity Other Total
1993 2.99 0.25 −0.97 2.272000 0.89 1.24 0.35 2.472007 2.98 1.87 0.55 5.40
left graph shows the opening up of emerging markets (the red dotted line) juxta-posed against the world mean. The top right graph shows that members of the”Group of 20” have had a greater level and pace of opening the capital accountwhen compared with the world mean. The bottom left graph computes the frac-tion of countries that are as closed as India, or worse. It suggests that in roughly1980, India’s closed capital account was roughly the median among countries inthe world; by the end of this period, roughly 60% of countries were more openthan India. Finally, the right hand bottom graph shows the experience of a fewcountries which undertook substantial reforms of capital controls: these trajecto-ries are quite unlike those seen for India.
Comparisons for India are most interesting against large countries. Hence, wefocus on the biggest 25 countries of the world by nominal GDP, the smallest ofwhich is Austria. Among these countries, the Chinn-Ito measure takes values from-1.1 to 2.6. There are three countries at the bottom of the table — the last holdoutsof nonconvertibility — with a score of -1.1: Turkey, India and People’s Republicof China. Amongst these top-25 countries, the average score is 1.467 and half ofthem are above 2.33. Key peers to India are ahead in opening the capital account:Brazil is at 0.21, Russia is at -0.06, Mexico is at 1.23, Indonesia is at 1.23. Whenwe go beyond these 25 countries to the full database of 180 countries, the medianscore is 0.18: much better than India’s -1.1.
1.3 Evolution of Openness
Table 6 summarizes the structure of net capital flows into India, expressed aspercent of GDP.
Net capital flows stagnated at roughly 2.5% of GDP from 1993 to 2000, and havesince risen sharply to 5.4% of GDP by 2007. This has partly reflected a rise inequity flows, which were encouraged by policy makers, and went from 0.25% of
then dropped back to -1.1. This appears to be related to some difficulties in the data. A carefulexamination of India’s experience with capital controls in 2000 suggests no important change tookplace in that year that was reversed in the next year.
12
ADBI Discussion Paper 98 Ajay Shah, Ila Patnaik
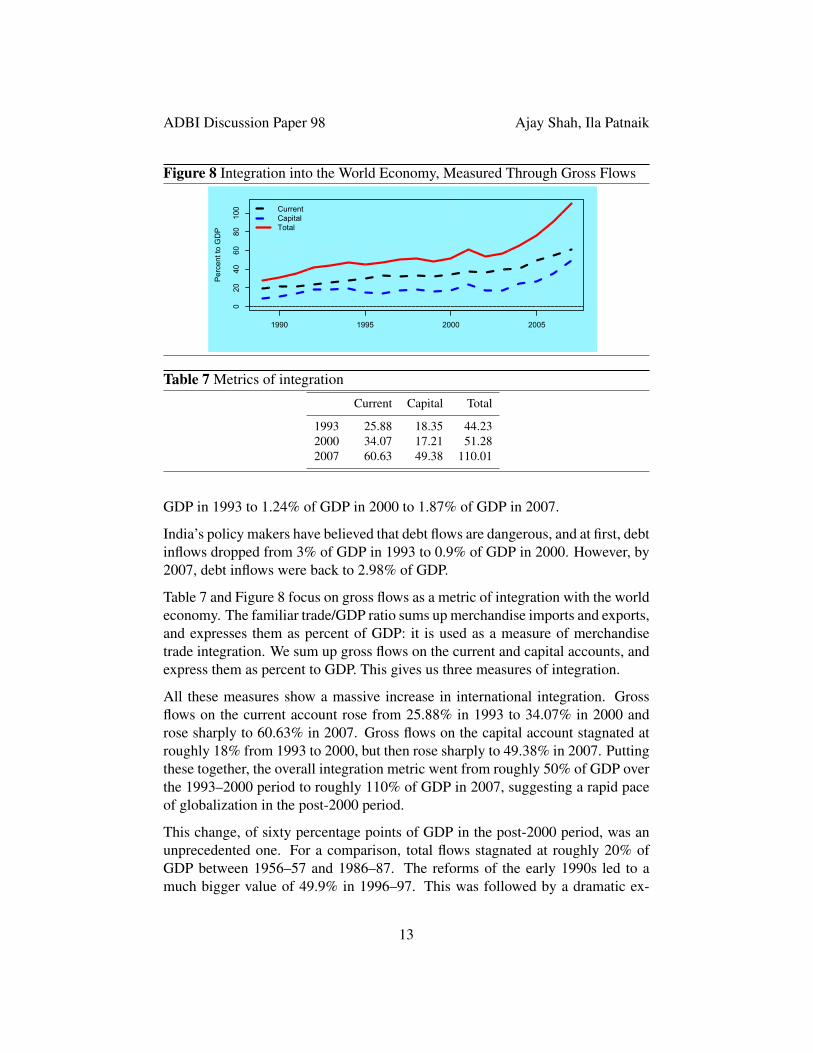
Figure 8 Integration into the World Economy, Measured Through Gross Flows
1990 1995 2000 2005
020
4060
8010
0
Per
cent
to G
DP
CurrentCapitalTotal
Table 7 Metrics of integration
Current Capital Total
1993 25.88 18.35 44.232000 34.07 17.21 51.282007 60.63 49.38 110.01
GDP in 1993 to 1.24% of GDP in 2000 to 1.87% of GDP in 2007.
India’s policy makers have believed that debt flows are dangerous, and at first, debtinflows dropped from 3% of GDP in 1993 to 0.9% of GDP in 2000. However, by2007, debt inflows were back to 2.98% of GDP.
Table 7 and Figure 8 focus on gross flows as a metric of integration with the worldeconomy. The familiar trade/GDP ratio sums up merchandise imports and exports,and expresses them as percent of GDP: it is used as a measure of merchandisetrade integration. We sum up gross flows on the current and capital accounts, andexpress them as percent to GDP. This gives us three measures of integration.
All these measures show a massive increase in international integration. Grossflows on the current account rose from 25.88% in 1993 to 34.07% in 2000 androse sharply to 60.63% in 2007. Gross flows on the capital account stagnated atroughly 18% from 1993 to 2000, but then rose sharply to 49.38% in 2007. Puttingthese together, the overall integration metric went from roughly 50% of GDP overthe 1993–2000 period to roughly 110% of GDP in 2007, suggesting a rapid paceof globalization in the post-2000 period.
This change, of sixty percentage points of GDP in the post-2000 period, was anunprecedented one. For a comparison, total flows stagnated at roughly 20% ofGDP between 1956–57 and 1986–87. The reforms of the early 1990s led to amuch bigger value of 49.9% in 1996–97. This was followed by a dramatic ex-
13
ADBI Discussion Paper 98 Ajay Shah, Ila Patnaik
pansion to 110% of GDP in 2006–07. This suggests a rapid and unprecedentedglobalization of the Indian economy (Kelkar, 2004).
1.4 De Facto Openness Exceeds De Jure Openness
A careful look at the system of capital controls reveals many aspects of opennessthat are not immediately apparent.
One element of this openness lies in remittances. A survey of banks found thatroughly half of remittance flows were used for acquiring financial assets. In recentyears, the correlation coefficient between the rupee–dollar interest rate differen-tial, and remittance inflows, prove to be as high as 0.8. This emphasizes the extentto which capital account considerations shape what is apparently a current accounttransaction.
In terms of absolute magnitude, remittance flows have been roughly as big as netcapital inflows. This suggests that if the capital inflows component of remittanceswere correctly measured, net capital inflows might need to be revised upwards byroughly 50%.
The other major source of openness is the current account. Indian and global firmswith operations in India are able to move capital across the boundary throughmisinvoicing. A firm that is prevented from obtaining offshore debt by the systemof capital controls could contract debt overseas under the name of an offshoresubsidiary, and transfer-price this capital into India. Similar processes could beused for repayment. Given that gross flows on the current account are over 60%of GDP, if misinvoicing of 10% on average takes place in a single direction, thiscould add roughly 6% to net capital flows.
2 Determinants of Portfolio Flows
The most interesting element of capital flows into India that merits exploration isportfolio flows. The reason for this is two-fold. First, this was the first elementwhere liberalization in the form of convertibility for foreign institutional investorscame in, and ample data is available from a mature policy regime. Second, asFigure 3 suggests, the capital flowing in and out of the country on account ofportfolio flows is large; this is the biggest single component of gross flows on thecapital account.
14
ADBI Discussion Paper 98 Ajay Shah, Ila Patnaik
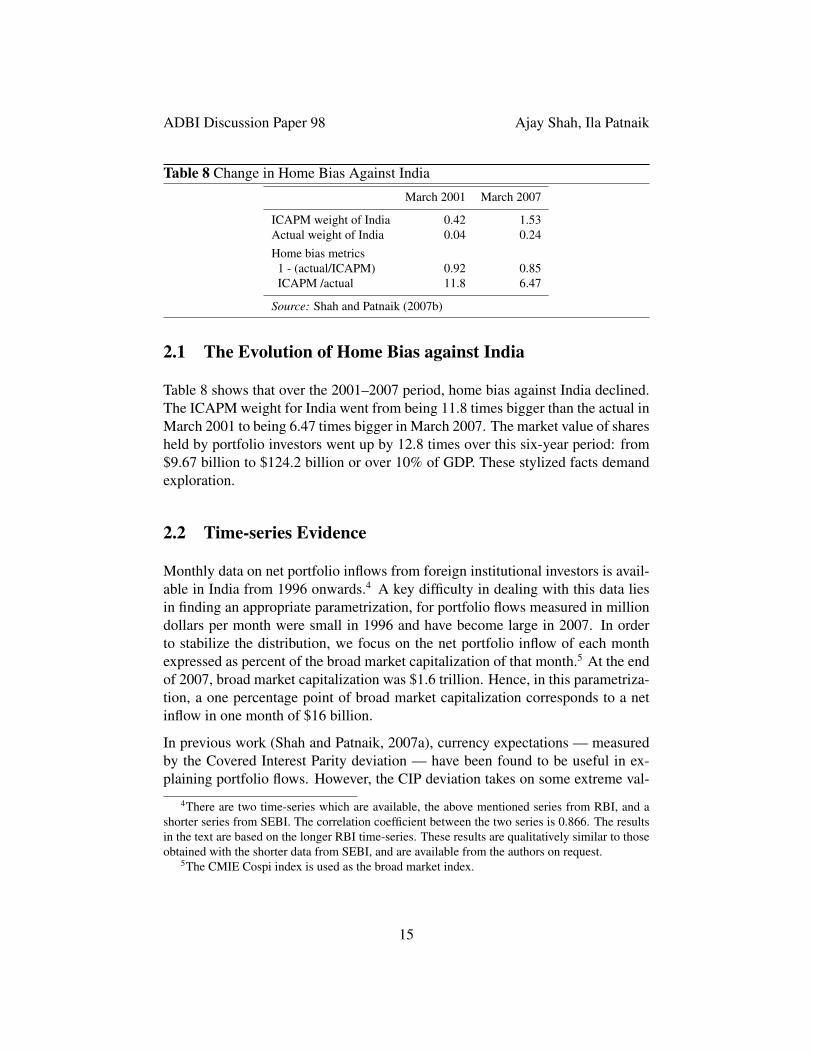
Table 8 Change in Home Bias Against India
March 2001 March 2007
ICAPM weight of India 0.42 1.53Actual weight of India 0.04 0.24Home bias metrics
1 - (actual/ICAPM) 0.92 0.85ICAPM /actual 11.8 6.47
Source: Shah and Patnaik (2007b)
2.1 The Evolution of Home Bias against India
Table 8 shows that over the 2001–2007 period, home bias against India declined.The ICAPM weight for India went from being 11.8 times bigger than the actual inMarch 2001 to being 6.47 times bigger in March 2007. The market value of sharesheld by portfolio investors went up by 12.8 times over this six-year period: from$9.67 billion to $124.2 billion or over 10% of GDP. These stylized facts demandexploration.
2.2 Time-series Evidence
Monthly data on net portfolio inflows from foreign institutional investors is avail-able in India from 1996 onwards.4 A key difficulty in dealing with this data liesin finding an appropriate parametrization, for portfolio flows measured in milliondollars per month were small in 1996 and have become large in 2007. In orderto stabilize the distribution, we focus on the net portfolio inflow of each monthexpressed as percent of the broad market capitalization of that month.5 At the endof 2007, broad market capitalization was $1.6 trillion. Hence, in this parametriza-tion, a one percentage point of broad market capitalization corresponds to a netinflow in one month of $16 billion.
In previous work (Shah and Patnaik, 2007a), currency expectations — measuredby the Covered Interest Parity deviation — have been found to be useful in ex-plaining portfolio flows. However, the CIP deviation takes on some extreme val-
4There are two time-series which are available, the above mentioned series from RBI, and ashorter series from SEBI. The correlation coefficient between the two series is 0.866. The resultsin the text are based on the longer RBI time-series. These results are qualitatively similar to thoseobtained with the shorter data from SEBI, and are available from the authors on request.
5The CMIE Cospi index is used as the broad market index.
15
ADBI Discussion Paper 98 Ajay Shah, Ila Patnaik
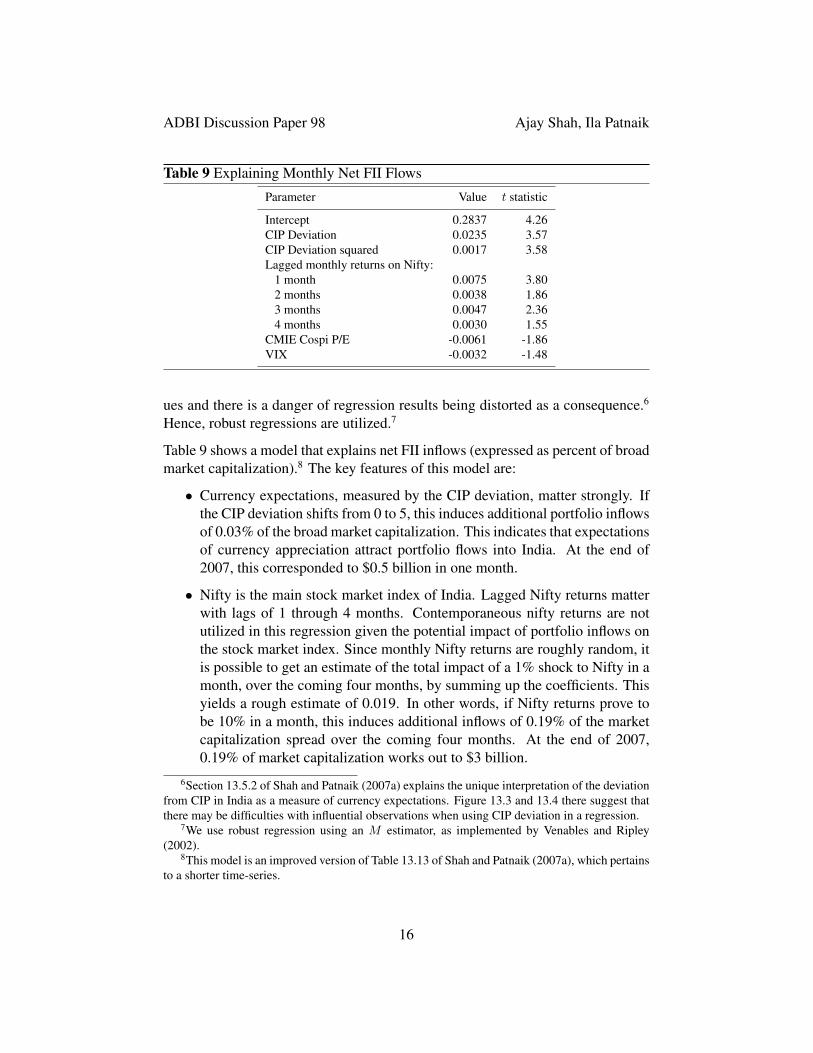
Table 9 Explaining Monthly Net FII Flows
Parameter Value t statistic
Intercept 0.2837 4.26CIP Deviation 0.0235 3.57CIP Deviation squared 0.0017 3.58Lagged monthly returns on Nifty:
1 month 0.0075 3.802 months 0.0038 1.863 months 0.0047 2.364 months 0.0030 1.55
CMIE Cospi P/E -0.0061 -1.86VIX -0.0032 -1.48
ues and there is a danger of regression results being distorted as a consequence.6
Hence, robust regressions are utilized.7
Table 9 shows a model that explains net FII inflows (expressed as percent of broadmarket capitalization).8 The key features of this model are:
• Currency expectations, measured by the CIP deviation, matter strongly. Ifthe CIP deviation shifts from 0 to 5, this induces additional portfolio inflowsof 0.03% of the broad market capitalization. This indicates that expectationsof currency appreciation attract portfolio flows into India. At the end of2007, this corresponded to $0.5 billion in one month.
• Nifty is the main stock market index of India. Lagged Nifty returns matterwith lags of 1 through 4 months. Contemporaneous nifty returns are notutilized in this regression given the potential impact of portfolio inflows onthe stock market index. Since monthly Nifty returns are roughly random, itis possible to get an estimate of the total impact of a 1% shock to Nifty in amonth, over the coming four months, by summing up the coefficients. Thisyields a rough estimate of 0.019. In other words, if Nifty returns prove tobe 10% in a month, this induces additional inflows of 0.19% of the marketcapitalization spread over the coming four months. At the end of 2007,0.19% of market capitalization works out to $3 billion.
6Section 13.5.2 of Shah and Patnaik (2007a) explains the unique interpretation of the deviationfrom CIP in India as a measure of currency expectations. Figure 13.3 and 13.4 there suggest thatthere may be difficulties with influential observations when using CIP deviation in a regression.
7We use robust regression using an M estimator, as implemented by Venables and Ripley(2002).
8This model is an improved version of Table 13.13 of Shah and Patnaik (2007a), which pertainsto a shorter time-series.
16
ADBI Discussion Paper 98 Ajay Shah, Ila Patnaik
• Foreign investors are deterred by a high value of the broad market P/E, andvice versa. When the market P/E is high, foreign investors expect it to godown and therefore flows fall.
• Finally, high levels of the VIX deter portfolio flows into India. The VIXmeasures the market’s view about future volatility reflecting what the mar-ket thinks the volatility of the S&P 500 index, the stock market index for thebiggest 500 US companies, will be over the next one month.9 A low levelof VIX implies that returns from the global market will lie within a narrowband. When the VIX goes up, it suggests that returns on stock prices arelikely to be in a much higher band, in other words, much more volatile.When the market is complacent about the future it suggests that people feelthat it is unlikely that returns from investment will be low. This encouragesthem to invest more in risky assets. And when the VIX goes up, peopleare less willing to take risks. A higher level of the VIX therefore results inlower portfolio flows into an emerging economy like India.
Table 9 shows results of a robust regression. The results are not unlike those foundusing an ordinary OLS.10
Variables which might have been expected to have an impact on portfolio flowsinto India but are not statistically significant in this regression include: the Indianshort rate, the US short rates and the spreads between the two, industrial produc-tion growth, S&P 500 returns, the US long rate, the US Baa corporate bond rate,Nifty volatility, INR/US$ currency volatility, the US term spread and the US creditspread.
2.3 Explaining the Decline in Home Bias
Recent literature has examined the characteristics of firms in emerging marketswhich are able to internationalize their shareholding (Claessens and Schmukler,2006). Shah and Patnaik (2007b) obtain insights through the following decompo-sition of F , the value of foreign ownership of shares in an emerging market. LetF = g(1 − p)M , where M is the market capitalization of the country; p is theinsider shareholding and g is the fraction of outsider shareholding that is held by
9Options on the S&P 500 are traded on the Chicago Board Options Exchange (CBOE). Theoption prices seen on the market imply a value for the future volatility that traders must have ontheir mind when trading the options. This value is reverse engineered out of the observed optionprices, thus giving the VIX in real time.
10Details are available from the authors on request.
17
ADBI Discussion Paper 98 Ajay Shah, Ila Patnaik
foreigners.11 Total differentiation yields:
ΔF ≈ M(1− p)Δg + g(1− p)ΔM − gMΔp
The first term, M(1−p)Δg, can be interpreted as the change in F associated witha change in g holding other things constant. This corresponds to traditional homebias explanations. The second term, g(1 − p)ΔM , measures the rise in foreignownership owing to a higher M , holding other sources of home bias unchanged.It reflects foreign investors preserving their ownership of g(1− p) on a larger M ,reflecting ICAPM-style reasoning while ignoring changes in world market capi-talization. The third term, −gMΔp, may be termed a “Stulz effect,” reflectingthe drop in foreign ownership associated with a rise in insider ownership p, whileholding other things constant.
This decomposition is not an economic model explaining the dynamics of F .Rather, it represents an attempt at accounting for the changes in F and obtain-ing a quantitative sense of the importance of the three forces at work. Shah andPatnaik (2007b) show these calculations with Indian data. As an example, in 2005,F went up by Rs.622 billion. This change breaks down to three elements: Rs.317billion owing to traditional explanations of home bias, Rs.501 billion owing tobigger Indian market capitalization and a decline of Rs.182 billion since insiderincreased their ownership share in 2005.
This focuses interest on understanding g, the fraction of outside shareholding thatis held by foreigners, estimated using firm-level data. Modelling this requires atwo-stage “Heckman-style” model, because there is a large clump of firms withzero foreign ownership. This implies a distinction between selectivity and propen-sity effects.
The key finding of Shah and Patnaik (2007b) concerns the importance of yearcharacteristics after controlling for firm characteristics. After controlling for firmcharacteristics, year fixed effects on the OLS equation exhibit little year-to-yearfluctuation.
This suggests that the recent surge of foreign investment into India was largelyinduced by modified firm characteristics, and not a change in sentiment aboutIndia as a whole. The growth of the economy, economic reforms and particularlythe successful reforms of the equity market have given a transformed situationin terms of firm characteristics. With these modified characteristics in place by
11Stulz (2005) has emphasized that insider ownership limits the extent to which home bias cango down.
18
ADBI Discussion Paper 98 Ajay Shah, Ila Patnaik
2007, firms were much more attractive to global investors than was the case in2001.
3 Macroeconomic Impact of Capital Flows
In India, the monetary policy framework is lightly specified. The RBI Act doesnot clearly specify the goals of monetary policy. Institutional mechanisms forindependence, transparency and accountability are not specified. RBI has gener-ally emphasized a “multiple objectives” framework, where the goals of monetarypolicy are not specified, and the market does not know a monetary policy rule.
The goals of monetary policy change from time to time but are not effectivelycommunicated to the market. Dincer and Eichengreen (2007) score the trans-parency of central banks. On a scale of 0 to 15, Asian central banks have beenimproving as a whole, scoring 5.1 in 2005, compared to 3 in 1998. The People’sRepublic of China’s transparency improved to 4.5 from 1. RBI has stagnated at ascore of 2 all through. RBI in 2005 lagged behind the Asian average of 1998.12
This approach towards monetary policy has come under stress in the context ofa pegged exchange rate and increasing de facto openness. In this section, weexamine the macroeconomic impact of capital flows. Our treatment runs fromthe pegged exchange rate regime, to currency intervention by RBI, to the extentto which sterilization is achieved, the loss of monetary policy autonomy and itsimpact on inflation.
3.1 The Backdrop — a Pegged Exchange Rate
According to RBI, the rupee is a “market determined exchange rate,” in the sensethat there is a currency market and the exchange rate is not administratively deter-mined. India has clearly moved away from fixed exchange rates. However, RBIactively trades on the market with the goal of “containing volatility” and influenc-ing the market price.
In India, as in most developing countries, there has been a distinction betweenthe de facto and the de jure currency regime. In the case of India, Patnaik (2007)shows that that the INR is de facto pegged to the US$. As is typical with such an
12Poirson (2008) analyzes the difficulties of transparency at RBI and offers proposals about howthis can be improved.
19
ADBI Discussion Paper 98 Ajay Shah, Ila Patnaik
exchange rate regime, the nominal INR/US$ exchange rate has had low volatility,while other exchange rates with respect to the rupee have been more volatile.
While the INR currency regime has been de facto pegged to the US$, the extent ofpegging has varied significantly through this period. The exchange rate regression,popularized by Frankel and Wei (1994), involves regressions of weekly percentagechanges of the exchange rate of the INR against the Swiss Franc (a numeraire)against weekly percentage changes against the same numeraire for the US dollar,pounds sterling, the euro and the Japanese yen. The residual volatility of thisregression is a measure of exchange rate flexibility. A mechanism for identifyingstructural breaks in the exchange rate regime that is consonant with this regressionis required. Zeileis et al. (2007) have identified the following phases of the Indiancurrency regime.
Period 1: April 2, 1993 to February 17, 1995 This was the period where trading in theINR first began. For most of this period, there was strong pressure to appreciate,which was blocked by purchases of US$ by the central bank, giving a de facto fixedexchange rate at Rs.31.37 per dollar.
Period 2: February 18, 1995 to August 21, 1998 In this period, which included the pe-riod of the Asian crisis, there was the highest-ever currency flexibility in India’sexperience. Even if the RBI made public statements about “managing volatilityon the currency market,” the credibility of these statements was low in the eyes ofthe market given the small size of foreign exchange reserves. In January 1998, aninterest rate defense was employed to defend the INR: the short interest rate wasraised by 200 bps.
Period 3: August 22, 1998 to March 19, 2004 This was a period of tight pegging, withlow volatility and some appreciation. A substantial reserves accumulation tookplace, which led to considerable distortion of monetary policy.
Period 4: March 20, 2004 to January 31, 2008 In this period, there has been greatercurrency flexibility when compared with Period 3. However, currency flexibilitywas at lower levels when compared with Period 2. With massive reserves and ahectic pace of reserves accumulation, the risk of a large depreciation was absent.
The evolution of the currency regime reflected compulsions rooted in monetarypolicy and the evolution of capital controls (Patnaik, 2005). In turn, the difficul-ties of implementing the exchange rate regime have shaped tactical details of theevolution of capital controls. Since the evolution of the exchange rate regime isof essence in understanding capital flows and monetary policy, many graphs inthis paper show a vertical yellow line at these dates of structural change of theexchange rate regime.
20
ADBI Discussion Paper 98 Ajay Shah, Ila Patnaik
Figure 9 Currency Trading by RBI
−200
000
2000
0
Rs.
Cro
re
2000 2002 2004 2006 2008
RBI fx purchases
Figure 10 Reserves Growth
5010
020
030
0
Bill
ion
US
D
2000 2002 2004 2006 2008
FX Reserves
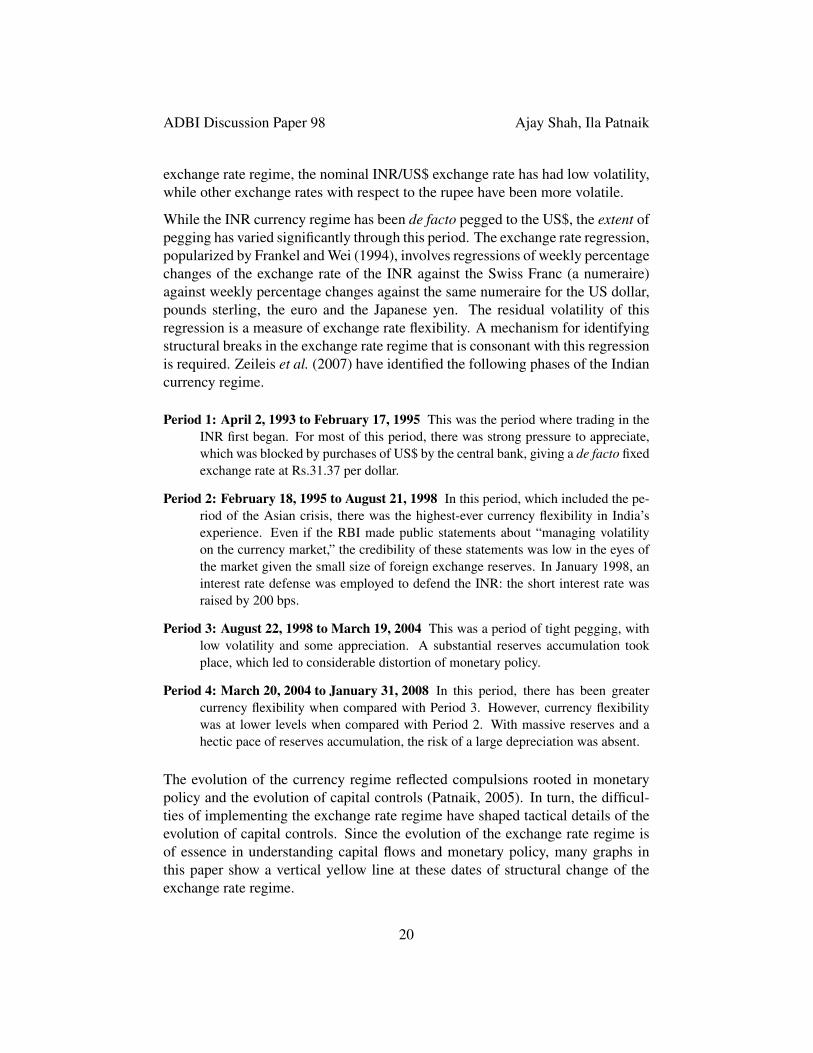
The pegged exchange rate regime has required a massive scale of trading on thecurrency market by the RBI. Figure 9 shows foreign currency purchases of RBIin the units of crore rupees per month.13
Figure 10 shows the time-series of foreign exchange reserves. In the early andmid-1990s, there was a motivation for building reserves in order to insure againstadverse shocks. As demonstrated in Patnaik (2003), by the late 1990s, reserveswere more than adequate for self-insurance, and currency purchases were primar-ily motivated by implementation of the pegged exchange rate. Over the 2003–2008 period, reserves were between eight to nine months of imports of goodsand services, well in excess of what is considered safe. Total short-term externaldebt was between 10% and 15% of reserves over this period, well below what isconsidered dangerous.
This increase in Net Foreign Exchange Assets of the RBI would lead to a sharpincrease in the monetary base. To prevent this from happening, sterilization has
131 crore is 10 million. At an exchange rate of Rs.40 per US$, one billion dollars is Rs.4,000crore.
21
ADBI Discussion Paper 98 Ajay Shah, Ila Patnaik
Figure 11 Incomplete Sterilization
−200
000
2000
0
Rs.
cro
re
2000 2002 2004 2006 2008
OMO+MSSRBI fx purchases
been attempted.
3.2 Extent of Sterilization
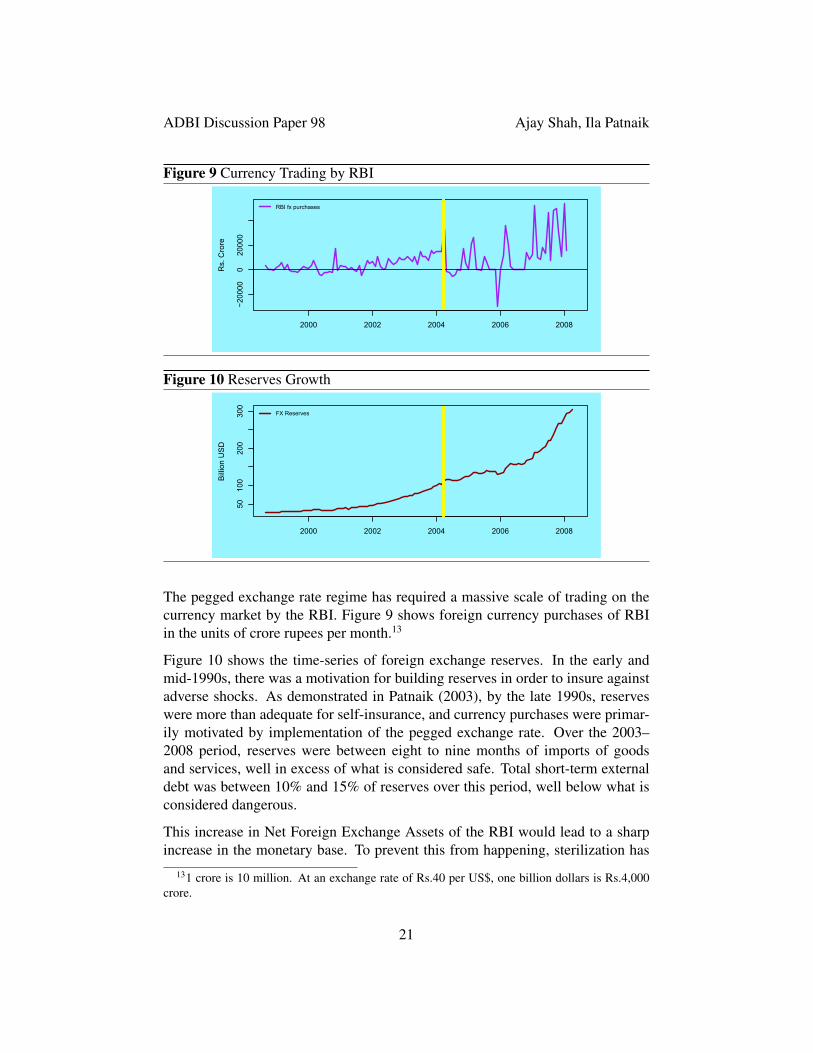
Figure 11 juxtaposes currency trading against sterilization. When sterilization waseffective — as is the case from 2000 to 2004 — the two curves in the graph appearto be mirror images.
The RBI ran out of government bonds for the purpose of sterilization in late 2003.From January 2004 onwards, a new mechanism for sterilization — the MarketStabilization Scheme (MSS) — was put in place. The MSS authorizes RBI to sellbonds on behalf of the government, for the purpose of sterilization. The govern-ment would not utilize the proceeds obtained by the sale of these bonds, so as toensure there was no impact on the monetary system. There was an initial ceilingon the MSS at Rs.0.6 trillion, which has since been raised to Rs.2.5 trillion.
A key strength of MSS lies in the fact that it makes the cost of sterilized interven-tion more transparent. Interest payments for MSS have risen, and these expensesface scrutiny in the budget process. This may have helped keep MSS bond is-suance under check.
As Figure 11 shows, in Period 4, the two curves are generally not mirror images.This underlines the limited sterilization which has taken place. Figure 9, coupledwith Figure 11, shows that it was not possible to decouple RBI’s currency tradingfrom monetary policy; the implementation of the pegged exchange rate has hadimplications for reserve money.
22
ADBI Discussion Paper 98 Ajay Shah, Ila Patnaik
Figure 12 Loss of Monetary Policy Autonomy: High M0 Growth
−200
000
2000
0
Rs.
cro
re
2000 2002 2004 2006 20082000 2002 2004 2006 2008
510
1520
2530
RBI fx purchasesM0 growth (right axis)
Figure 13 This is Feeding on into M3 Despite CRR Hikes
510
1520
2530
Per
cent
age
chan
ge (Y
OY
)
2000 2002 2004 2006 2008
Growth in M0Growth in M3
3.3 Loss of Monetary Policy Autonomy
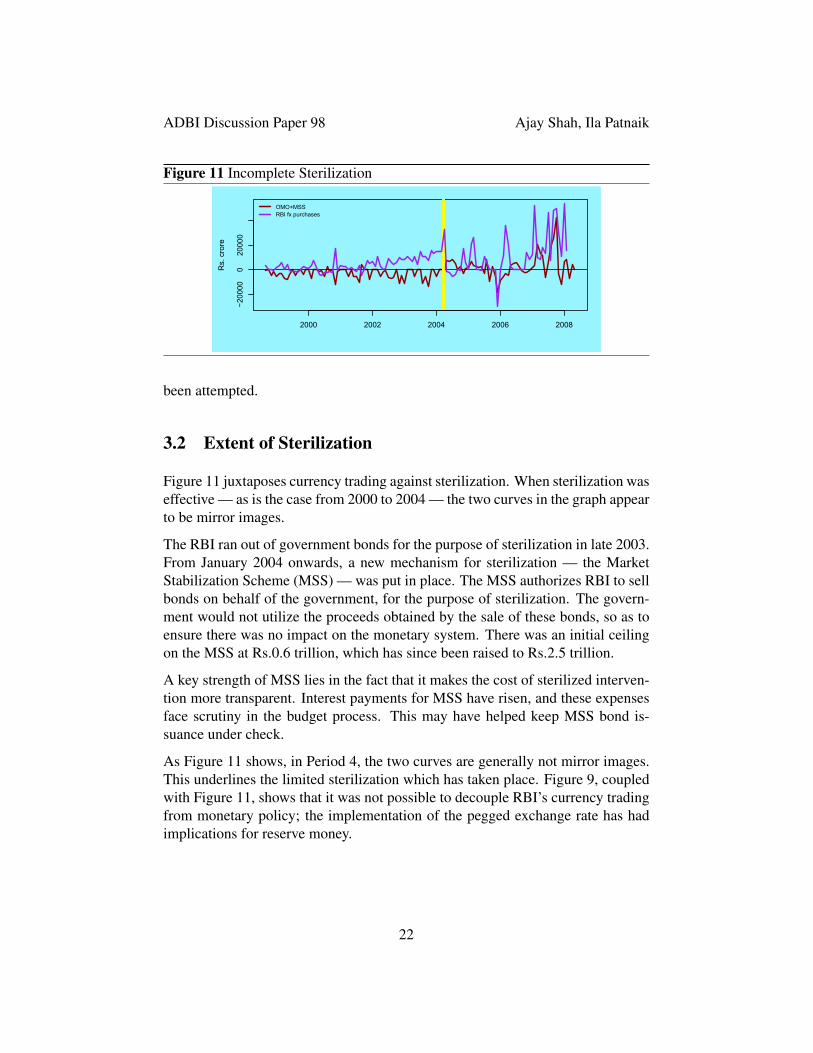
Figure 12 juxtaposes the currency purchases of RBI (left scale, in rupees crore)and year-on-year reserve money growth (right scale, in percent). The incompletesterilization that is visible in Figure 11 in the post-2004 period has led to a pro-nounced acceleration of reserve money growth.
One method through which high M0 growth can be confronted is to raise reserverequirements of banks. While reserve requirements have been raised in India inPeriod 4 — thus reversing a decade-long effort at phasing out reserve requirementswhich were seen as a tax on banking — they have not been able to prevent asignificant acceleration in M3 growth. This is shown in Figure 13.
3.4 Impact on Inflation
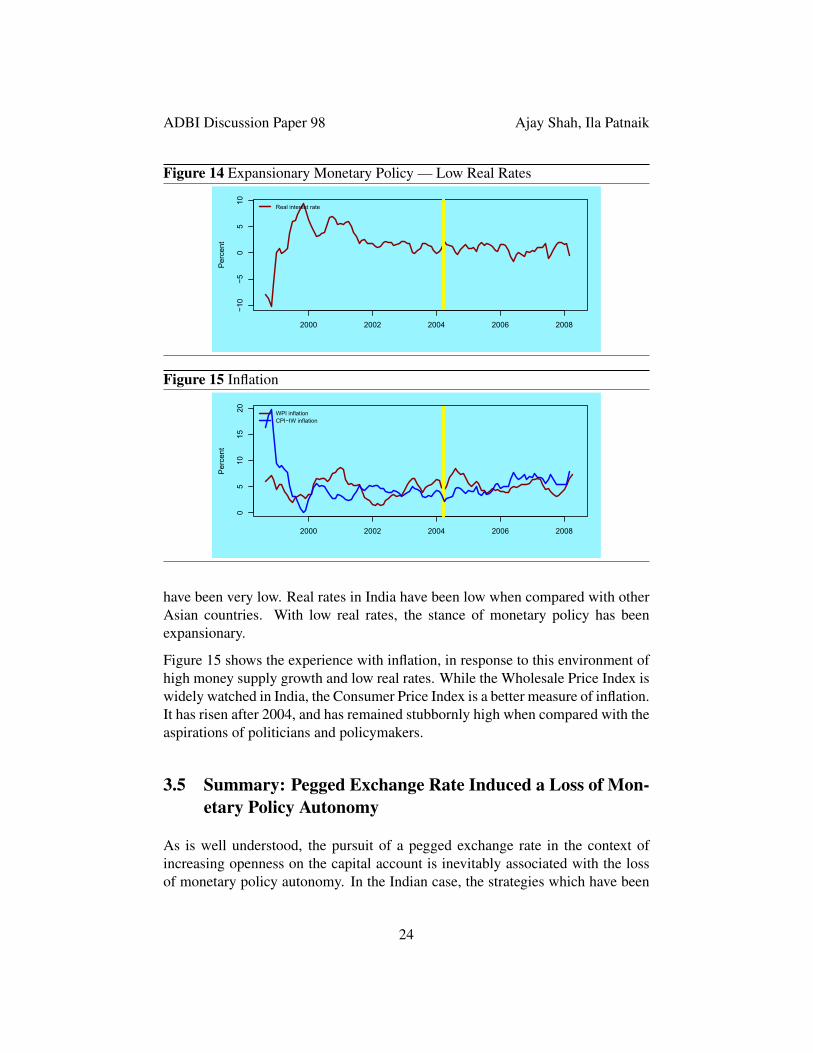
The flip side of the coin of this atmosphere of unsterilized intervention and highmoney supply growth is low interest rates. As Figure 14 shows, real interest rates
23
ADBI Discussion Paper 98 Ajay Shah, Ila Patnaik
Figure 14 Expansionary Monetary Policy — Low Real Rates
−10
−50
510
Per
cent
2000 2002 2004 2006 2008
Real interest rate
Figure 15 Inflation
05
1015
20
Per
cent
2000 2002 2004 2006 2008
WPI inflationCPI−IW inflation
have been very low. Real rates in India have been low when compared with otherAsian countries. With low real rates, the stance of monetary policy has beenexpansionary.
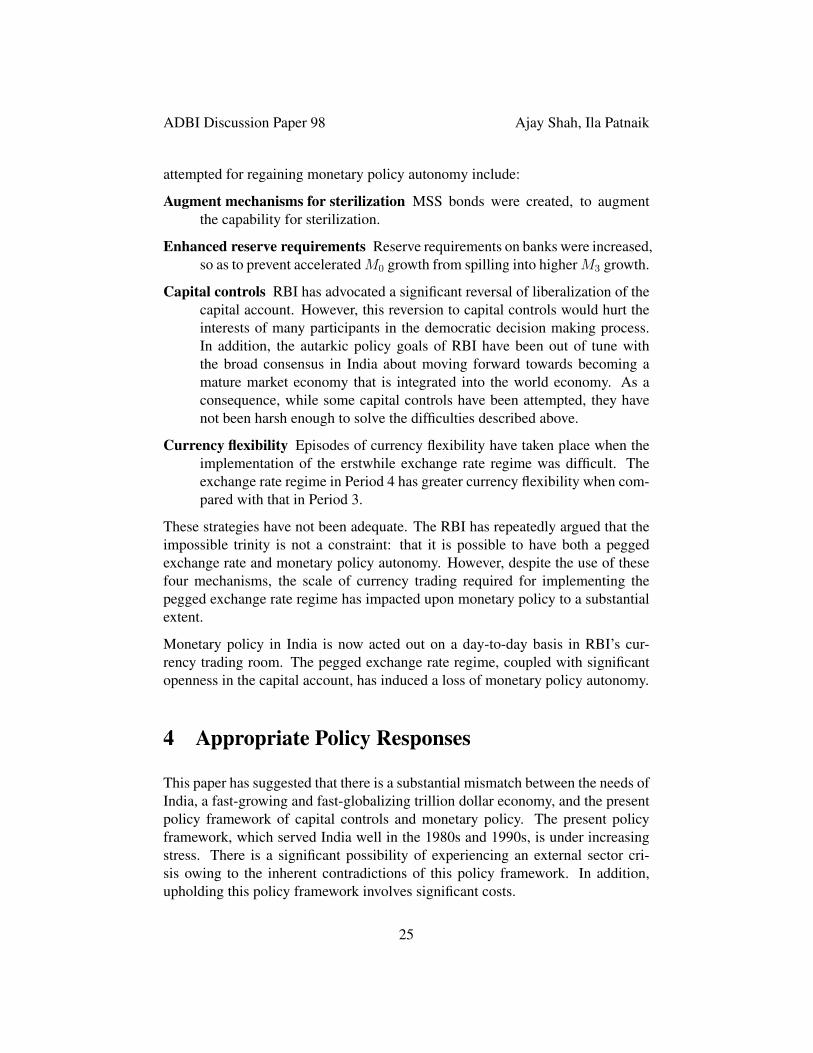
Figure 15 shows the experience with inflation, in response to this environment ofhigh money supply growth and low real rates. While the Wholesale Price Index iswidely watched in India, the Consumer Price Index is a better measure of inflation.It has risen after 2004, and has remained stubbornly high when compared with theaspirations of politicians and policymakers.
3.5 Summary: Pegged Exchange Rate Induced a Loss of Mon-etary Policy Autonomy
As is well understood, the pursuit of a pegged exchange rate in the context ofincreasing openness on the capital account is inevitably associated with the lossof monetary policy autonomy. In the Indian case, the strategies which have been
24
ADBI Discussion Paper 98 Ajay Shah, Ila Patnaik
attempted for regaining monetary policy autonomy include:
Augment mechanisms for sterilization MSS bonds were created, to augmentthe capability for sterilization.
Enhanced reserve requirements Reserve requirements on banks were increased,so as to prevent accelerated M0 growth from spilling into higher M3 growth.
Capital controls RBI has advocated a significant reversal of liberalization of thecapital account. However, this reversion to capital controls would hurt theinterests of many participants in the democratic decision making process.In addition, the autarkic policy goals of RBI have been out of tune withthe broad consensus in India about moving forward towards becoming amature market economy that is integrated into the world economy. As aconsequence, while some capital controls have been attempted, they havenot been harsh enough to solve the difficulties described above.
Currency flexibility Episodes of currency flexibility have taken place when theimplementation of the erstwhile exchange rate regime was difficult. Theexchange rate regime in Period 4 has greater currency flexibility when com-pared with that in Period 3.
These strategies have not been adequate. The RBI has repeatedly argued that theimpossible trinity is not a constraint: that it is possible to have both a peggedexchange rate and monetary policy autonomy. However, despite the use of thesefour mechanisms, the scale of currency trading required for implementing thepegged exchange rate regime has impacted upon monetary policy to a substantialextent.
Monetary policy in India is now acted out on a day-to-day basis in RBI’s cur-rency trading room. The pegged exchange rate regime, coupled with significantopenness in the capital account, has induced a loss of monetary policy autonomy.
4 Appropriate Policy Responses
This paper has suggested that there is a substantial mismatch between the needs ofIndia, a fast-growing and fast-globalizing trillion dollar economy, and the presentpolicy framework of capital controls and monetary policy. The present policyframework, which served India well in the 1980s and 1990s, is under increasingstress. There is a significant possibility of experiencing an external sector cri-sis owing to the inherent contradictions of this policy framework. In addition,upholding this policy framework involves significant costs.
25
ADBI Discussion Paper 98 Ajay Shah, Ila Patnaik
The appropriate strategy for policy involves two key elements: monetary policyreform and a rapid movement to convertibility.
4.1 Monetary Policy Reform
The most important weakness of the Indian policy environment is the monetarypolicy framework. The present framework, which involves a lack of specifica-tion of goals of the central bank, has come under tremendous stress owing to thecombination of exchange rate pegging and increasing de facto openness.
There is now a strong consensus internationally about how monetary policy shouldfunction. Sound monetary policy involves attributes such as independence, trans-parency, predictability, rules rather than discretion, anchoring of inflationary ex-pectations in the eyes of economic agents, and accountability. All these principlesare violated in India. Monetary policy reform is required in India in order toachieve these principles (Mistry, 2007; Shah, 2008).
When monetary policy is structured in these ways, many important benefits areharnessed. Sound monetary policy stabilizes the business cycle, and is made ef-fective by a properly functioning monetary transmission. Sound monetary policyis “speculation proof” in that the central bank completely controls the short-terminterest rate but is not otherwise involved in trading on financial markets. A soundmonetary policy framework stabilizes capital flows, and (in turn) is not attenuatedby fluctuations of capital flows.
4.2 Full Convertibility
India is globalizing at a hectic rate. Gross flows in the current account and capi-tal account stand at 110% of GDP, and have grown by 60 percentage points in adecade. Under this environment, capital controls have become increasingly inef-fective.
The central planning approach that is in use with capital flows, where the gov-ernment believes it knows what kinds of players and what kind of flows are bestfor the country, is reminiscent of the central planning that India once employed inindustrial policy. However, a greater skepticism about this “industrial policy ap-proach” to capital controls is called for. The analytical foundations of such claimsare weak or non-existent, and the ingenuity of the private sector in dodging thesystem of capital controls is remarkable.
26
ADBI Discussion Paper 98 Ajay Shah, Ila Patnaik
At this point in India’s progression towards integration into the world economy,the rapid dismantling of capital controls appears to be the best strategy. The firstelements where full decontrol is immediately feasible are: FDI, portfolio flowsand rupee-denominated debt. In the case of FDI and portfolio flows, there is al-ready convertibility, and all that is needed to be done is the removal of proceduresand frictions. Rupee denominated debt does not involve “original sin” and shouldalso feature in the early stages of opening up. This opening up needs to be ac-companied by a monetary policy reform, a shift towards greater exchange rateflexibility, and the creation of currency derivatives markets. Once these are inplace, liberalization of foreign currency debt and outflows can take place.
27
ADBI Discussion Paper 98 Ajay Shah, Ila Patnaik
ReferencesChinn M, Ito H (2006). “What matters for financial development? Capital controls,
institutions, and interactions.” Journal of Development Economics, 81(1), 163–192.
Claessens S, Schmukler S (2006). “International financial integration through equity mar-kets: Which firms from which countries go global?” Technical report, World Bank.
Dincer NN, Eichengreen B (2007). “Central Bank Transparency: Where, Why, and withWhat Effects?” Working Paper 13003, National Bureau of Economic Research. URLhttp://www.nber.org/papers/w13003.
Frankel J, Wei SJ (1994). “Yen bloc or dollar bloc? Exchange rate policies of the EastAsian countries.” In T Ito, A Krueger (eds.), “Macroeconomic linkage: Savings, ex-change rates and capital flows,” University of Chicago Press.
Gordon J, Gupta P (2004). “Nonresident deposits in India: In search of return?” Technical
report, IMF Working Paper No. 04/48.
Kelkar V (2004). “India; On the growth turnpike.” Technical report, Australian NationalUniversity; K. R. Narayanan Memorial Lecture. URL http://rspas.anu.edu.au/papers/narayanan/2004oration.pdf.
Mistry P (2007). “Making Mumbai an International Financial Centre.” Committee re-
port, Sage Publishing and Ministry of Finance, Government of India. URL http://finmin.nic.in/mifc.html.
Patnaik I (2003). “India’s policy stance on reserves and the currency.” Technical report,ICRIER Working Paper No 108. URL http://www.icrier.org/pdf/wp108.pdf.
Patnaik I (2005). “India’s experience with a pegged exchange rate.” In S Bery,B Bosworth, A Panagariya (eds.), “The India Policy Forum 2004,” pp. 189–226. Brook-ings Institution Press and NCAER. URL http://openlib.org/home/ila/PDFDOCS/Patnaik2004_implementation.pdf.
Patnaik I (2007). “India’s currency regime and its consequences.” Economic and Political
Weekly. URL http://openlib.org/home/ila/PDFDOCS/11182.pdf.
Poirson HK (2008). “Monetary policy communication and transparency.” In “India:Selected issues,” chapter 3. IMF.
Shah A (2008). “New issues in Indian macro policy.” In TN Ninan (ed.), “Busi-ness Standard India,” Business Standard Books. URL http://www.mayin.org/ajayshah/PDFDOCS/Shah2008_whatchanged.pdf.
Shah A, Patnaik I (2007a). “India’s experience with capital flows: The elusive quest fora sustainable current account deficit.” In S Edwards (ed.), “Capital controls and cap-ital flows in emerging economies: Policies, practices and consequences,” chapter 13,
28
ADBI Discussion Paper 98 Ajay Shah, Ila Patnaik
pp. 609–643. The University of Chicago Press. URL http://www.nber.org/papers/w11387.
Shah A, Patnaik I (2007b). “What makes home bias abate? The evolution of foreignownership of Indian firms.” Technical report, NIPFP.
Singh M (2007). “Use of participatory notes in Indian equity market and recent regu-latory changes.” Technical Report 07/291, IMF. URL http://www.imf.org/external/pubs/cat/longres.cfm?sk=21508.0.
Stulz RM (2005). “The limits of financial globalisation.” Journal of Finance, LX(4),1595–1638.
Thomas S (2006). “How the financial sector in India was reformed.” In S Narayan(ed.), “Documenting reforms: Case studies from India,” pp. 171–210. MacmillanIndia, New Delhi. URL http://www.igidr.ac.in/˜susant/PDFDOCS/Thomas2005_financialsectorreforms.pdf.
Venables WN, Ripley BD (2002). Modern applied statistics with S. Springer, 4th edition.
Zeileis A, Shah A, Patnaik I (2007). “Exchange Rate Regime Analysis Using StructuralChange Methods.” Report 56, Department of Statistics and Mathematics, Wirtschaft-suniversitat Wien, Research Report Series. URL http://epub.wu-wien.ac.at/dyn/openURL?id=oai:epub.wu-wien.ac.at:epub-wu-01_c48.
29

ADBI Discussion Paper 98 Ajay Shah, Ila Patnaik
A Statistical Appendix
30
ADBI Discussion Paper 98 Ajay Shah, Ila Patnaik
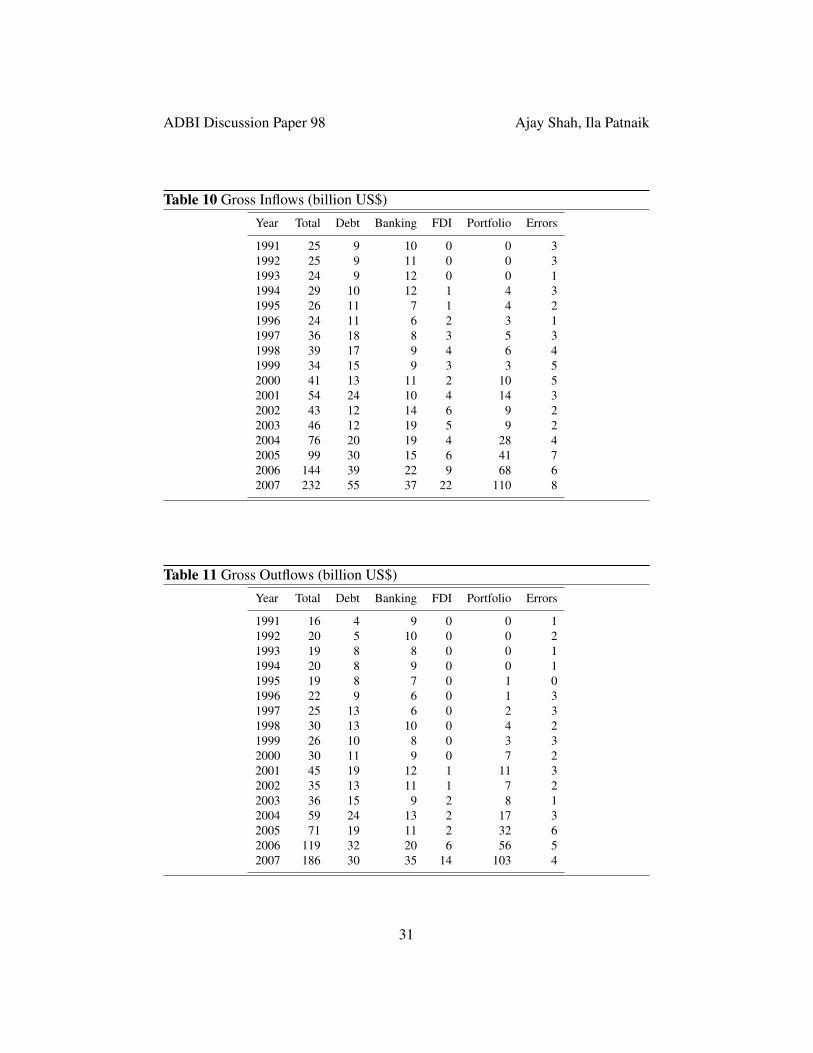
Table 10 Gross Inflows (billion US$)
Year Total Debt Banking FDI Portfolio Errors
1991 25 9 10 0 0 31992 25 9 11 0 0 31993 24 9 12 0 0 11994 29 10 12 1 4 31995 26 11 7 1 4 21996 24 11 6 2 3 11997 36 18 8 3 5 31998 39 17 9 4 6 41999 34 15 9 3 3 52000 41 13 11 2 10 52001 54 24 10 4 14 32002 43 12 14 6 9 22003 46 12 19 5 9 22004 76 20 19 4 28 42005 99 30 15 6 41 72006 144 39 22 9 68 62007 232 55 37 22 110 8
Table 11 Gross Outflows (billion US$)
Year Total Debt Banking FDI Portfolio Errors
1991 16 4 9 0 0 11992 20 5 10 0 0 21993 19 8 8 0 0 11994 20 8 9 0 0 11995 19 8 7 0 1 01996 22 9 6 0 1 31997 25 13 6 0 2 31998 30 13 10 0 4 21999 26 10 8 0 3 32000 30 11 9 0 7 22001 45 19 12 1 11 32002 35 13 11 1 7 22003 36 15 9 2 8 12004 59 24 13 2 17 32005 71 19 11 2 32 62006 119 32 20 6 56 52007 186 30 35 14 103 4
31
ADBI Discussion Paper 98 Ajay Shah, Ila Patnaik
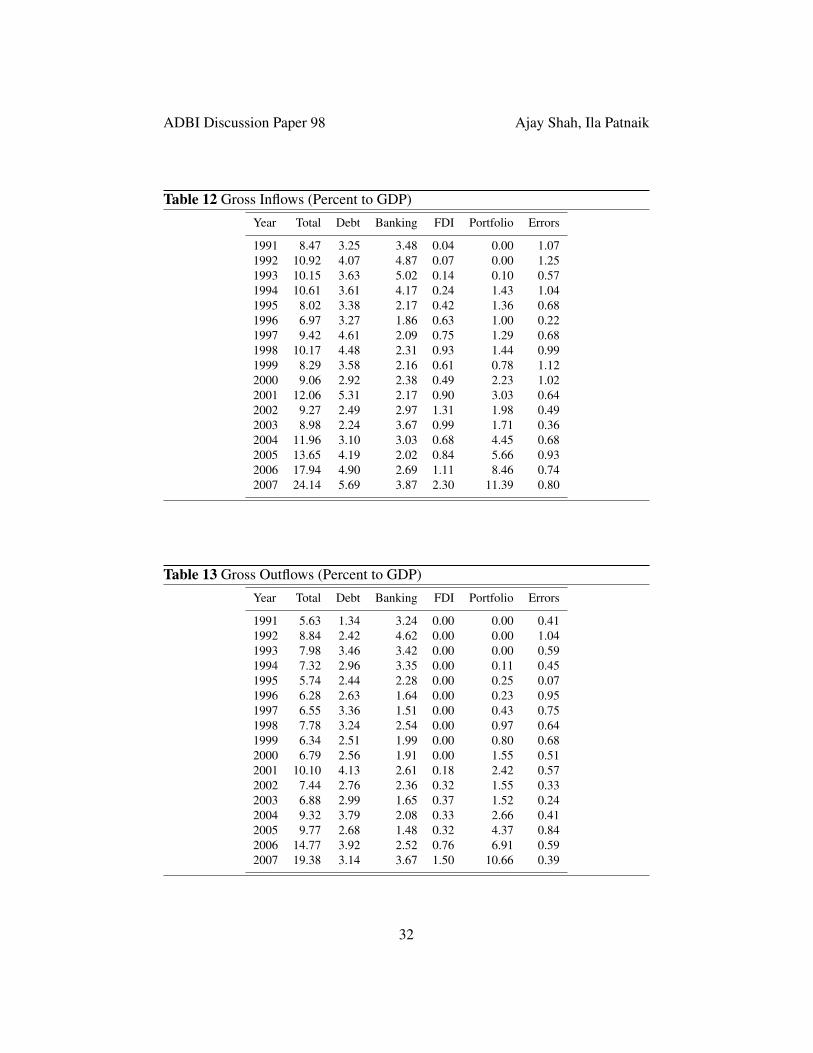
Table 12 Gross Inflows (Percent to GDP)
Year Total Debt Banking FDI Portfolio Errors
1991 8.47 3.25 3.48 0.04 0.00 1.071992 10.92 4.07 4.87 0.07 0.00 1.251993 10.15 3.63 5.02 0.14 0.10 0.571994 10.61 3.61 4.17 0.24 1.43 1.041995 8.02 3.38 2.17 0.42 1.36 0.681996 6.97 3.27 1.86 0.63 1.00 0.221997 9.42 4.61 2.09 0.75 1.29 0.681998 10.17 4.48 2.31 0.93 1.44 0.991999 8.29 3.58 2.16 0.61 0.78 1.122000 9.06 2.92 2.38 0.49 2.23 1.022001 12.06 5.31 2.17 0.90 3.03 0.642002 9.27 2.49 2.97 1.31 1.98 0.492003 8.98 2.24 3.67 0.99 1.71 0.362004 11.96 3.10 3.03 0.68 4.45 0.682005 13.65 4.19 2.02 0.84 5.66 0.932006 17.94 4.90 2.69 1.11 8.46 0.742007 24.14 5.69 3.87 2.30 11.39 0.80
Table 13 Gross Outflows (Percent to GDP)
Year Total Debt Banking FDI Portfolio Errors
1991 5.63 1.34 3.24 0.00 0.00 0.411992 8.84 2.42 4.62 0.00 0.00 1.041993 7.98 3.46 3.42 0.00 0.00 0.591994 7.32 2.96 3.35 0.00 0.11 0.451995 5.74 2.44 2.28 0.00 0.25 0.071996 6.28 2.63 1.64 0.00 0.23 0.951997 6.55 3.36 1.51 0.00 0.43 0.751998 7.78 3.24 2.54 0.00 0.97 0.641999 6.34 2.51 1.99 0.00 0.80 0.682000 6.79 2.56 1.91 0.00 1.55 0.512001 10.10 4.13 2.61 0.18 2.42 0.572002 7.44 2.76 2.36 0.32 1.55 0.332003 6.88 2.99 1.65 0.37 1.52 0.242004 9.32 3.79 2.08 0.33 2.66 0.412005 9.77 2.68 1.48 0.32 4.37 0.842006 14.77 3.92 2.52 0.76 6.91 0.592007 19.38 3.14 3.67 1.50 10.66 0.39
32