Embed Size (px)
Citation preview

ADB Economics Working Paper Series
How Can Food Subsidies Work Better? Answers from India and the Philippines
Shikha Jha and Bharat RamaswamiNo. 221 | September 2010


ADB Economics Working Paper Series No. 221
How Can Food Subsidies Work Better? Answers from India and the Philippines
Shikha Jha and Bharat Ramaswami September 2010
Shikha Jha is Principal Economist, Economics and Research Department, Asian Development Bank; Bharat Ramaswami is Professor, Planning Unit, Indian Statistical Institute, Delhi Centre. This paper was presented in seminars at the Asian Development Bank, Manila and Jawaharlal Nehru University, New Delhi; and at the 12th International Convention of the East Asian Economic Association on “Asia and the Global Economic Recovery” on 2–3 October 2010 in Seoul, Republic of Korea. The authors would like to thank participants for interesting discussion and comments. They also thank Siraj Hussain of the Ministry of Consumer Affairs, Food and Public Distribution, Government of India for facilitating access to data about state-level sales of subsidized foodgrains. They are deeply grateful to David Coady, Bhaskar Dutta, and P. V. Srinivasan for their valuable comments, and to Pilipinas F. Quising and Ronald Tamangan for superb research assistance. The authors take responsibility for any remaining errors.

Asian Development Bank6 ADB Avenue, Mandaluyong City1550 Metro Manila, Philippineswww.adb.org/economics
©2010 by Asian Development BankSeptember 2010ISSN 1655-5252Publication Stock No. WPS102651
The views expressed in this paperare those of the author(s) and do notnecessarily reflect the views or policiesof the Asian Development Bank.
The ADB Economics Working Paper Series is a forum for stimulating discussion and eliciting feedback on ongoing and recently completed research and policy studies undertaken by the Asian Development Bank (ADB) staff, consultants, or resource persons. The series deals with key economic and development problems, particularly those facing the Asia and Pacific region; as well as conceptual, analytical, or methodological issues relating to project/program economic analysis, and statistical data and measurement. The series aims to enhance the knowledge on Asia’s development and policy challenges; strengthen analytical rigor and quality of ADB’s country partnership strategies, and its subregional and country operations; and improve the quality and availability of statistical data and development indicators for monitoring development effectiveness.
The ADB Economics Working Paper Series is a quick-disseminating, informal publication whose titles could subsequently be revised for publication as articles in professional journals or chapters in books. The series is maintained by the Economics and Research Department.

Contents
Abstract v
I. Introduction 1
II. Program Description 3
III. Impact of Food Subsidies on the Poor 7
IV. Computing the Fraction of Subsidy Received by the Poor 8
V. Targeting Errors 10
A. Philippines 10 B. India 12
VI. Leakages Due to Illegal Diversions 15
VII. Excess Costs 16
VIII. Expected Income Gain to the Poor 18
IX. Policy Options 23
References 25


Abstract
This study explores the outcomes of food subsidies to the poor in the case of India and the Philippines. Both countries operate in-kind food subsidy programs with similar mandates, commonalities in functioning, and substantial budgetary outlays. The goal of the study is to quantify the gains to the poor from an additional unit of public spending on food subsidies. We find the expected income impacts on the poor are not more than 5% of incremental spending in either country. Part of the reason for such a low impact is poor participation in the program. But equally, it is also the case that the share of the poor in the total food subsidy is small. The reason why the poor receive such small shares is not just poor targeting. The main factor is program waste (due to fraud and excess costs). Such waste accounts for as much as 71% of the total public spending.


I. Introduction
International prices of most food commodities fell in 2009 from their 2008 heights as markets returned into balance, but have remained elevated compared to historic levels. From late 2009, the prices began an upward trend in tandem with the recovery from the global economic crisis, led by demand from emerging market economies (Figure 1). Nevertheless, the causes of high food prices, including rising food, feed and fuel demand, low stocks, and elevated weather uncertainties due to climate change remain. Indeed, Russia’s announcement to ban exports following the large destruction of crops by drought and fires pushed higher the already volatile wheat prices, reaching a 23-month high in August and raising concerns about an increase in food prices worldwide (Figure 2).
Figure 1: Trends in Global Food Prices (food commodities price indices)
50
100
150
200
250
300
350
Jan 83
May 84
Sep 85
Jan 87
May 88
Sep 89
Jan 91
May 92
Sep 93
Jan 95
May 96
Sep 97
Jan 99
May 00
Sep 01
Jan 03
May 04
Sep 05
Jan 07
May 08
Sep 09
2000=100
Grains Fats and Oils Other Food
Source: World Bank Commodity Price data (Pink Sheet), available: www.worldbank.org, downloaded 16 August 2010.
Food spending accounts for a significant share of budgets of poor households in developing countries (ADB 2008, Banerjee and Duflo 2007). Economic welfare of poor households in developing countries is therefore sensitive to food prices. Not surprisingly, research has shown that higher prices of food staples have a significant adverse effect on the poor (ADB 2008, de Janvry and Sadoulet 2009, Masters and Shievely 2008, Son 2008).

Figure 2: Recent Wheat Prices, 20107.0
6.5
6.0
5.5
5.0
4.5
4.0January February March April May June July August
Russiaannouncesexport ban
Soft White Winter Wheat Spot Price
Hard Red Winter Wheat Spot Price
Glo
bal W
heat
Pric
es($
/bus
hel)
Source: Bloomberg, downloaded 16 August 2010.
It is therefore natural for the government to favor policies that protect poor households from higher food prices. One common response is to institute food subsidies. For many of the poor, food-based safety net programs provide their only hope of survival in the event of steep price rises. Such programs can protect poor segments of society from major shocks, insure them against risks and associated income losses, and provide consumption smoothing. However, the performance of such programs varies widely, reflecting a number of shortcomings that undermine their effectiveness. As they often consume substantial budgetary resources, food subsidies also become a source of anxiety to the government seeking to reign in budgetary deficits. This is especially so in times of rising food prices.
In this paper, we explore the outcomes of food subsidies to the poor in the case of India and the Philippines. Both are large programs in terms of budgetary resources. Are these well spent? Our specific question is the following. What is the gain to the poor from an additional unit of public spending on food subsidies?
We follow the literature in quantifying the benefits to households in terms of income equivalents i.e., the implicit income subsidy that is equal to the product of the quantity purchased of the subsidized commodity, and the difference between the market and subsidized price (Besley and Kanbur 1993; Coady, Grosh, and Hoddinot 2004). The academic and policy literature recognizes that the gains to the poor depend on targeting as well as program delivery. However, most of the studies have only evaluated the targeting performance of subsidies. From this literature, it is well known that most transfer programs are costly because of substantial nontarget beneficiaries. For instance, from a
2 | ADB Economics Working Paper Series No. 221

survey of universal food subsidy schemes, Coady (2002) finds that the median targeting performance implied that the government spent $3.40 to transfer $1.00 to the poor. In their metasurvey of income transfer programs, Coady, Grosh, and Hoddinot (2004) conclude that interventions that use some methods of targeting (e.g., means testing, geographic targeting or self-selection in public works) result in the target group receiving a greater share of benefits. Further, a standard policy prescription, especially from multilateral institutions, is to recommend that governments target subsidies toward the poor and not waste resources subsidizing the nonpoor.
However, there is no generalized theoretical presumption that policy should always aim to reduce inclusion errors. The literature offers examples where targeting is costly both administratively as well as in economic terms because of incentive effects (Besley and Kanbur 1993, Kanbur 2009). In addition, Gelbach and Pritchett (2000) argued that programs that are tightly targeted toward the poor (i.e., low inclusion errors) do not receive political support from the nonpoor and thus are ultimately endangered. In addition, there are the practical difficulties of targeting.
In their metasurvey of studies that evaluate income transfer programs, Coady, Grosh, and Hoddinot (2004) found very few studies that looked at both program costs and benefits. And even such information consisted only of administrative costs, ignoring the costs due to corruption or theft. In this paper, we quantify and compare the gains to the poor from better targeting as well as by improved program delivery. Our principal finding is that the payoffs to program delivery that reduces waste are much larger than the gains from lower inclusion errors. While opportunities for reducing such errors exist in both India and the Philippines, the payoffs from such policies are distinctly secondary to the payoffs from reduction of waste. We shall argue that such a finding is important because reducing inclusion errors is not only contentious politically, but is also a policy recommendation that is accompanied by many caveats in the economics literature. On the other hand, it is straightforward to recommend policies that deliver subsidies more efficiently.
II. Program Description
India and the Philippines operate food subsidy programs (referred to in this paper by their acronyms Targeted Public Distribution System or TPDS and the National Food Authority or NFA, respectively) that have similar mandates and many commonalities in functioning. The mandates are multiple, including price stabilization, ensuring food access by the poor, and supporting farm prices. The commonality in functioning is that both these programs deliver in-kind subsidies. The commodities that are subsidized in these
How Can Food Subsidies Work Better? Answers from India and the Philippines | 3

programs include staple foodgrains. The Philippines program subsidizes mainly rice, while the Indian program offers subsidies on rice and wheat.1
Table 1 is a descriptive summary of the programs in these two countries. Because of in-kind subsidies, both countries have government agencies that source, store, transport, and distribute the grain to designated retail outlets. The TPDS primarily sources grain from domestic procurement while the NFA program depends heavily on imports (over which it has a monopoly).
Table 1: A Comparative Summary of Food Subsidy Programs in India and the Philippines
Program Design and Functioning India Philippines
Main Staple Commodities Rice and wheat Rice
Volume of Grain Distributed 32 million tons(2004–2008)
1.6 million tons(2004–2007)
Targeting Yes at the household level NoUniversal program with small targeted programs
Quota YesFixed per household
NoUnlimited quantities
Subsidized Price Yes Yes
Source of Supply Domestic procurement supplemented by imports in exceptional years
Largely imports (rice) supplemented by domestic procurement
Operations Supply from central government to state warehouses by Food Corporation of India
Supply from state warehouses to ration shops by state governments
Supply from central government to NFA warehouses, then to accredited and licensed private retail outlets, institutions, and government rolling stores
Funding Central government budget Central government budgetOfficial Development Assistance to the Philippine governmentLoans from the public and private sectors
Budgetary Allocation as a Percentage of GDP
0.72%(2004–2007)
0.3%(2005–2008)
Sources: Economic Survey, Government of India; National Food Authority Accomplishment Reports (NFA, various years); National Food Annual Audit Reports (Commission on Audit, various years); CEIC Data Company Ltd., accessed 8 January 2010; author’s computations.
The NFA is supposed to balance producer and consumer interests. Apart from its monopoly of rice imports, the NFA seeks to boost farm gate prices by buying palay or
1 While these programs also subsidize other consumption goods, we focus on these staples as they account for a major share of the subsidies.
4 | ADB Economics Working Paper Series No. 221

paddy rice from growers and their organizations at a relatively high price compared to the market farm price. To assist consumers, the NFA sells rice through accredited retailers at a mandated, below-market price. The retailers receive a fixed margin on the sale. In the past, consumer prices were generally above free-trade prices (Tolentino 2002). In addition to procurement, the NFA also carries out buffer stocking, processing activities, dispersal of palay and milled rice to strategic locations, and distribution to various marketing outlets.
In India, the central and state governments together run a marketing channel solely devoted to the distribution of the subsidized food. At the retail level, this involves a network of “Fair Price Shops” (FPS) that sell subsidized grain to consumers. Subsidized grain is not accessible elsewhere. The FPS is usually run by private agents who receive a fixed percentage as commission for their efforts. The FPS is often restricted to selling only subsidized grain. The central government is responsible for procurement, storage, transportation, and bulk allocation of foodgrains to different states. The state government is responsible for transporting and distributing the grain within the state through the network of FPS.
The NFA rice subsidies are universal with unlimited purchase. However, there are exceptions—within the NFA program is a smaller program called Tindahan Natin Program. This program operates through dedicated outlets that sell only the NFA-subsidized commodities. The program is supposed to favor the setting up of these stores in the poorer regions through geographical targeting. Since 2008, individual-based targeting is also being attempted. In this experiment, which is confined to Metro Manila, the target beneficiaries are families with incomes less than 5000 pesos (P) per month. Such identified households are eligible for 2 kilograms (kg) of rice at subsidized prices.
Despite its universal nature, household expenditure survey data from the 2006 Family Income and Expenditure Survey indicate that out of 12 million households, only about 2 million purchase NFA rice, i.e., about 16% of the population. One reason for this could be self-targeting through inferior quality. According to World Bank (2001), the NFA mixes good-quality rice with poor-quality rice for most of its releases. Moreover, retailers may mix the NFA releases of any good-quality rice with poor-quality rice. Another reason could be the unavailability of the NFA rice in some parts of the country.
India introduced targeted food subsidies in 1997. The current regime is called targeted public distribution system. Subsidies depend on whether the household is classified as above poverty line (APL), below poverty line (BPL), or poorest of the poor (POP or the Antayodaya Yojana program).
All households are entitled to a monthly quota of 35 kg of rice or wheat per month. In principle, the prices of subsidized grain are supposed to be fixed with reference to the government’s “economic cost”, i.e., the cost incurred by government agencies in
How Can Food Subsidies Work Better? Answers from India and the Philippines | 5

procuring, storing, transporting, and distributing grain. BPL households are supposed to receive 50% subsidy (i.e., 50% of economic cost) while APL households are not supposed to be eligible for any subsidy at all.2 The prices for POP households are fixed below that of BPL households and not with reference to economic cost.
Table 2 lists the price of rice and wheat for each category of households and also the economic cost for the most recent years. The subsidized prices in Table 2 were fixed in 2002 on the basis of the principles outlined in the previous paragraph. However, these prices have not yet been subsequently revised. As a result, even the APL households in 2008/2009 received a subsidy in excess of 50% of economic cost. The qualification to this is that the central government does not guarantee full supply to the state governments for its APL requirements. The actual allocation depends on past purchases and ad hoc considerations. The total number of households within a state that are eligible to be classified as BPL is made through an expenditure sample survey administered by the central government.3
Table 2: Subsidized Price of Rice and Wheat in India according to Household Type, 2009 (Rupees/kilogram)
POP BPL APL Economic Cost(2007/8)
Economic Cost (2008/09)
Rice (common variety) 3 5.65 7.95 15.64 17.9
Wheat 2 4.14 6.10 13.53 13.93
POP = poorest of the poor, BPL = below poverty line, APL = above poverty line.Source: Government documents.
The list of BPL beneficiaries is prepared through a BPL census. In the latest census of 2002, households received scores based on 13 criteria. The BPL households were identified as those who fell below a cut-off score (decided by the respective state governments). If the total of BPL identified households exceeds that which is estimated by the central government, the subsidy on the excess households has to be borne by the state government.
Both India and the Philippines expend significant resources in operating their food subsidy programs. In the case of India, the budgetary cost of food subsidy topped 1% of gross domestic product (GDP) in 2002 but later came down to around 0.65% toward the end of the decade. The decline happened because of the rapid growth in GDP since about 2003. The Philippines program is heavily dependent on imports and so the cost of the program varies with world prices. The program cost averaged 0.3% of GDP between
2 In practice, as we shall see later, even APL households receive subsidies and the subsidy to BPL households has exceeded the 50% benchmark.
3 The initial estimates of the state-wise BPL population were done for 1993/1994 as the product of (i) the estimate of the proportion of households that are poor in 1993/1994, and (ii) the total population in 1995. The latter has since been revised to 2000; however the former estimate has not been revised yet.
6 | ADB Economics Working Paper Series No. 221

2005 and 2008. Because of high world prices for food in 2008, the program absorbed 0.6% of GDP that year.
III. Impact of Food Subsidies on the Poor
The simplest way to examine a program for its effectiveness in reaching the poor is to consider its exclusion and inclusion errors. Let pr denote the rate of participation of the poor, i.e., the proportion of the poor who participate and receive benefits from the subsidy program. (1-pr) is the proportion of the poor who do not receive food subsidies, called the exclusion error. The inclusion error is defined as the proportion of subsidy recipients who are not poor. A subsidy regime is said to be targeted well if both these errors are low.
There are several limitations of this approach (Coady and Skoufias 2004, Ravallion 2009). First, it implicitly assigns a welfare weight of 1 to all households below the poverty line and 0 to all households above it. In particular it does not differentiate households according to their distance from the poverty line. Furthermore, inclusion errors only tell us about how many recipients are nonpoor, not how much subsidies they get.
The last problem can be rectified by considering the share of the poor in the income transfer. This is denoted by s. This is the targeting measure that is used most widely in studies evaluating income transfer programs and was therefore used by Coady, Grosh, and Hoddinot (2004) to compare targeting effectiveness across programs in a metasurvey of different studies. This measure can also be justified as the social valuation of income transferred to poor households, when poor households receive a welfare weight of unit and nonpoor households receive a zero welfare weight (Coady, Grosh, and Hoddinot 2004). s is negatively related to the inclusion error (Ravallion 2009). Quite clearly, if the inclusion error is zero then the poor receive the entire subsidy.4 At the other extreme, if the inclusion error is 100%, then the fraction of the subsidy reaching the poor is zero.
It has been shown that s captures the impact of a program on the poverty gap per unit of public spending, provided that the program does not by itself change the headcount measure of poverty, and that there are no fiscal costs other than transfers (Besley and Kanbur 1993, Ravallion 2009). However, the measure does not directly reflect the overall size of the transfer program and hence may not fully capture the impact of the program on poverty . In an examination of income transfer programs in the People’s Republic of China, Ravallion shows that the share measure (and its variants) is poorly correlated with the performance of the program in reducing poverty. The principal reason for this seems to be that the share measure is not positively correlated with the participation rate of
4 The statement assumes that the entire subsidy is spent on income transfers. If, for instance, some of the subsidy is spent on administrative costs, then the share of subsidy going to the poor is less than 1 even when there are no inclusion errors.
How Can Food Subsidies Work Better? Answers from India and the Philippines | 7
the poor (which is highly correlated with poverty impacts). On the other hand, Ravallion shows that a targeting measure defined as the difference between the program’s participation rate for the poor and that for the nonpoor (called the targeting differential) performs better than the share measure.
What is clear, therefore, is that a measure of targeting effectiveness must be a monotonic function of both inclusion and exclusion errors. Ravallion (2009) proposes a measure called the targeting differential, which is the difference between a program’s participation rate for the poor and that for the nonpoor.
Our metric here is the expected income gain to the poor from a unit of public spending on the program (e.g., dollar, peso, or rupee). This can be computed as Y p s p p sp r r r= + − =( ).1 0 .The measure Yp lies between 0 and 1. If either of s or pr is 0, then the expected income gain to the poor is 0 as well. Similarly, the maximum value of Yp is 1, which happens when all of the poor participate and when they receive all of the subsidies. The total expected gain to the poor is the product of Yp and the scale of public spending.
Note that when participation rate is 1, the expected gain to the poor reduces to s. In general, however, s by itself is not a good measure of the impact of the program on poverty because s does not fully accommodate exclusion errors. We could have a well-targeted program with high s but the program may have modest impacts on incomes of the poor because of exclusion errors. As s is a function of the inclusion error, the expected income gain Yp depends both on exclusion and inclusion errors.
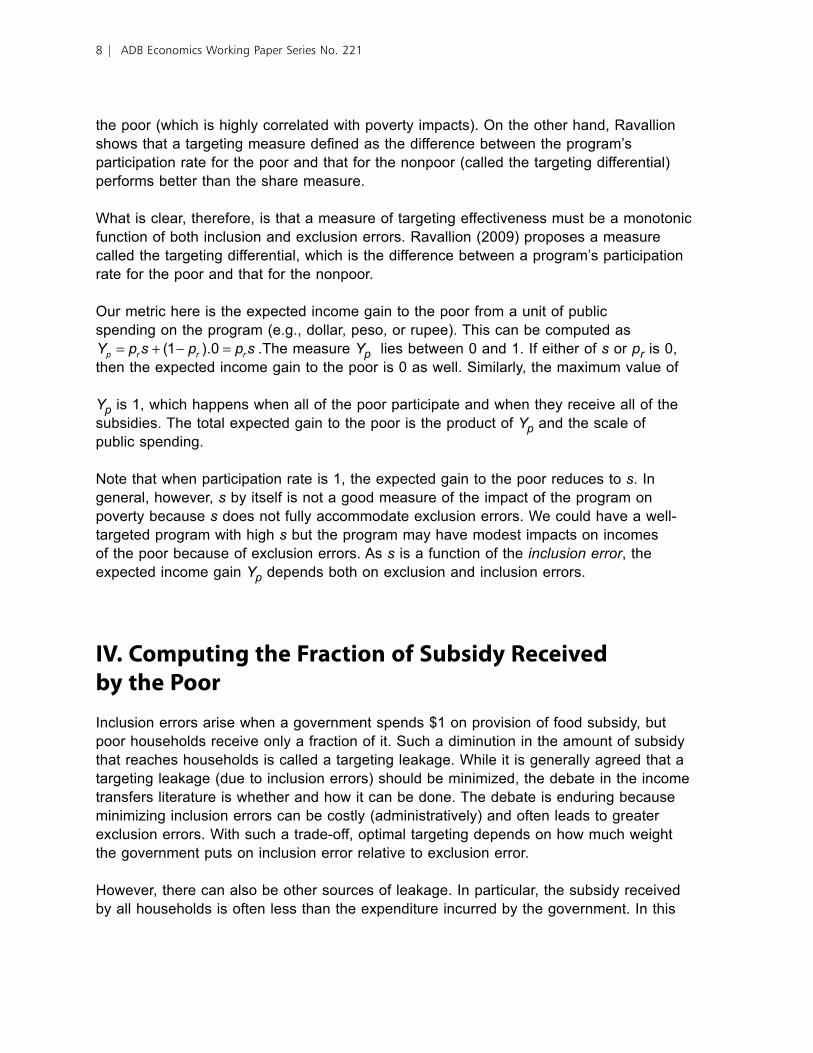
IV. Computing the Fraction of Subsidy Received by the Poor
Inclusion errors arise when a government spends $1 on provision of food subsidy, but poor households receive only a fraction of it. Such a diminution in the amount of subsidy that reaches households is called a targeting leakage. While it is generally agreed that a targeting leakage (due to inclusion errors) should be minimized, the debate in the income transfers literature is whether and how it can be done. The debate is enduring because minimizing inclusion errors can be costly (administratively) and often leads to greater exclusion errors. With such a trade-off, optimal targeting depends on how much weight the government puts on inclusion error relative to exclusion error.
However, there can also be other sources of leakage. In particular, the subsidy received by all households is often less than the expenditure incurred by the government. In this
8 | ADB Economics Working Paper Series No. 221

section, we argue that s, the fraction of subsidy received by the poor, also ought to be adjusted for nontargeting leakages.5
Let p be the market price of the food staple and let k be its subsidy price. If q is the total consumption of the subsidized staple, then the income subsidy received by consumers is
I = (p – k)q (1)
The government’s cost of food subsidy is denoted by C and it can be written as
C a k Q= −( ) (2)
where a is the government’s cost of acquisition and distribution of the food staple and Q is the total supply of subsidized staple that is distributed by the government. Then C can be decomposed as
C a p p k Q a p Q p k q d= − + − = − + − +(( ) ( ) ) ( ) ( )( )
where d Q q= −( ) measures the government supplies that never reach households through the subsidy mechanism. These represent the illegal diversions by intermediaries that profit from arbitraging the difference between the market and subsidy price. Hence, we have
C a p Q p k q p k d I a p Q p k d= − + − + − = + − + −( ) ( ) ( ) ( ) ( ) (3)
In this analysis, the income subsidy received by all households I is less than the government’s cost of providing subsidies because of two components. The second component ( )a p Q− reflects the difference between the government’s cost of purchase and distribution of grain and the price in the market. We call this excess cost. This can arise either because the government buys the food staples at higher prices than the private sector (for example, as a result of price support operations) or because the government is inefficient relative to the private sector, or because of a combination of these reasons. The third component (p – k)d is the cost of illegal diversions.
Finally, I itself can be broken up into two components: the income transfer to the poor (denoted as Yp) and the income transfer to the nonpoor group (denoted as Yn). Hence we can write equation (3) as
C Y Y a p Q p k dp n= + + − + −( ) ( ) (4)
The fraction of budgetary subsidy received by the poor is therefore
5 There is agreement in the literature that this ought to be done (Besley and Kanbur 1993, Coady 2002) but is generally ignored usually because of lack of data.
How Can Food Subsidies Work Better? Answers from India and the Philippines | 9

s Y C a p Q C p k d Cn= − + − + −1 [( / ) (( ) / ) (( ) ) / ] (5)
s is the difference between one and the sum of three kinds of leakages. The first leakage is the targeting leakage, the second source is the leakage due to excess costs, and the third leakage is due to illegal diversions of the subsidized staple to open markets. In the sections that follow, we report on estimates for each of these leakages for India and the Philippines, and the cumulative outcome for s, the expected income gain to the poor per unit of public spending, and Yp , the total income transfer to the poor.
V. Targeting Errors
Evidence on the design and performance of social safety net programs from 47 countries across Africa, Asia, Eastern Europe, and Latin America shows that targeted programs achieve a high proportion of transfers to the poor, with the poor receiving, on average, around 25% more than they would without targeting (Coady 2003). In other words, the inclusion error in targeted programs is on average lower than in untargeted programs.
A. Philippines
The distribution of NFA rice is not targeted. Hence it should be possible in principle to achieve zero exclusion error. Yet, only 25% of the poor received benefits from the subsidy in 2006 (see Table 3). This is a modest improvement over the situation in 2003 where only 20% of the poor participated in the program. Thus the exclusion error of the program is large.
Table 3: Exclusion and Inclusion Errors of the NFA Program
Year Participation Rate(%)
Exclusion Error(%)
Percentage of Recipients Who are Nonpoor (inclusion error)
2006 24.5 75.5 48.3
2003 20.2 79.8 56
Source: Computed from Philippine Family and Income Expenditure surveys.
Table 3 also considers the poor/nonpoor composition of the population that receives NFA rice. Of the beneficiaries in 2006, 52% are poor while 48% are nonpoor. Thus it would seem that the inclusion error is also large even though there has been some improvement from 2003.
Comparing urban and rural areas, the exclusion error is equally large (about 75%) in both urban and rural areas (Table 4). In 2006, the participation rate was 24.6% in
10 | ADB Economics Working Paper Series No. 221

the rural sector and 24.2% in the urban sector. The inclusion error is more serious in urban areas than in rural areas. Table 4 shows that in urban areas, as many as 68% of beneficiaries are nonpoor as against 39% in rural sector. The ease of access to NFA accredited retailers, the better supply of NFA rice, and lower opportunity costs for the urban rich (who can send household domestics to queue up for NFA rice) may be factors that contribute to higher purchases of NFA rice by the urban nonpoor.
Table 4: Inclusion Error of the NFA Program, by Sector of Residence, 2006
Exclusion Error(%)
Percentage of Recipients Who are Nonpoor (inclusion error)
Rural 75.4 39
Urban 75.8 68
Source: Computed from Philippine Family and Income Expenditure surveys.
Inclusion errors may not be consequential if the nonpoor recipient households buy very little NFA rice. To assess this possibility, consider Table 5, which describes the per capita consumption of NFA rice among poor and nonpoor recipients. It shows that both poor and nonpoor recipient households buy about the same quantities of NFA rice. This suggests that inclusion errors are serious. As annual per capita grain consumption varies from 90 kg (for the poorest decile) to 140 kg (for the richest households), NFA rice accounts for more than 50% of the rice consumption of poor recipient households, and more than one third of the rice consumption of nonpoor recipient households.
Table 5: Quantity of NFA Rice Purchased by Poor and Nonpoor Recipient Households, 2006 (per capita and in kilograms per year)
Poor Nonpoor
Rural 53.3 52.9
Urban 57.2 54.4
Source: Computed from Philippine Family and Income Expenditure surveys.
A more comprehensive measure of inclusion errors is to consider the share of the poor in NFA rice distribution. Table 6 shows that the poor do receive a greater share of NFA rice than their proportion in population. The table confirms that inclusion error is a more serious problem in the urban sector than in the rural sector.
How Can Food Subsidies Work Better? Answers from India and the Philippines | 11

Table 6: Share of the Poor in Population and in Distribution of NFA Rice, 2006 (percent)
Share of the Poor in NFA Rice*
Share of the Poor in Population
Rural 0.70 49
Urban 0.40 14
All 0.60 32
Note: The numbers here are ratios of consumption of NFA rice by the poor to total consumption of NFA rice as calculated from the 2006 Family Income and Expenditure Survey.
Source: Computed from Philippine Family and Income Expenditure surveys.
B. India
The consumption expenditure survey of the National Sample Survey provides information about targeting errors. The latest large-scale survey that is available is for 2004/2005. Based on the survey questions, a household is defined to be a recipient of food subsidies if it purchases subsidized rice or wheat or both during the survey reference period. While the targeted PDS was launched in 1997, it is generally agreed that targeting was not accomplished by 1999. Therefore the results from 1999/2000 (when the previous large-scale expenditure survey was carried out) correspond to a pre-targeting regime, while those from 2004/2005 refer to a targeted subsidy regime.
Table 7 compares targeting errors from 1999/2000 to 2004/2005. The table shows a rise in exclusion error and a fall in the inclusion error. However, the changes are small. In 1999/2000, the program was not well targeted. This situation does not change in 2004/2005 despite the introduction of targeting in the design of the program.
Table 7: Exclusion and Inclusion Errors
Participation Rate(%)
Exclusion Error (%)
Percentage of Recipients Who are Nonpoor (inclusion error)
2004/05 30 70 70
1999/00 36 64 76
Source: Computed from India Expenditure surveys of the National Sample Survey.
Table 8 compares exclusion and inclusion errors across urban and rural areas. Exclusion errors are uniformly high at 70% in both sectors while the inclusion errors are higher in rural areas.
12 | ADB Economics Working Paper Series No. 221

Table 8: Exclusion and Inclusion Errors, by Sector of Residence, 2004/2005
Exclusion Error (%)
Percentage of Recipients Who are Nonpoor (inclusion error)
Rural 70 73
Urban 70 59
Source: Computed from India Expenditure surveys of the National Sample Survey.
Exclusion errors could happen either because households chose not to participate in the program or because of mistargeting.6 As mentioned earlier, targeting is based on proxy indicators that are elicited from a household census. Mistargeting could happen in two ways. First, a poor household may not be classified at all. In this case, the household does not receive the food eligibility card7 and cannot make purchases from the public distribution system. Second, even if a household receives a food eligibility card, it may be wrongly classified as an APL household and is not therefore entitled to the larger subsidy offered to households classified as BPL or POP. The consumption expenditure survey reports whether households possess food eligibility cards and of what type.
Let N be the number of poor households. We divide this into three categories: N1, the number of poor households that do not possess a food eligibility card; N2, the number of poor households that are classified as APL, and N3 the number of poor households that are classified as either BPL or POP. Let di , i = 1,2,3 be the number of poor households that purchase food from the PDS in each of these three categories respectively. If d is the total number of poor households that purchase food from the PDS, the participation rate of the poor can be written as
p d N d N N N d N N N d N N Nr = = + +( / ) ( / )( / ) ( / )( / ) ( / )( / )1 1 1 2 2 2 3 3 3 (6)
Equation (6) expresses the overall participation rate as the weighted sum of participation rates of the poor in each of the three categories, with the weights being the proportion of the poor in each of the three categories. Notice that the proportion of the poor in categories one and two is evidence of mistargeting.
Table 9 displays the conditional participation rates and the associated weights for the rural and urban sector. Consider first the rural sector. For poor households that hold either the BPL or POP eligibility card, the participation rate is 61%. This drops sharply to 13% for households with APL eligibility. For households without any eligibility, the participation rate is 4%.8 The associated weights are 0.4, 0.4, and 0.2 respectively. In other words, 60% of the poor are either classified incorrectly as APL or not classified at all (i.e., without eligibility to any subsidy).
6 Households might not participate because of various reasons such as low quality of publicly provided grain, distance to retail outlets, unavailability of supplies, or lack of liquidity.
7 The food eligibility card is popularly referred to as a “ration card” in India. 8 Households without eligibility might still access subsidized food supplies using the ration card of others.
How Can Food Subsidies Work Better? Answers from India and the Philippines | 13

Table 9: Decomposition of Participation Rate of the Poor (percent of the total number of poor households)
Rural Urban
Category Conditional Participation
Rate I
Proportion of Poor
II
Unconditional Participation
RateIII = I x II
Conditional Participation
Rate I
Proportion of Poor
II
Unconditional Participation Rate
III = I x II
BPL + POP 0.61 39.90 24.51 0.77 27.34 20.94
APL 0.13 40.52 5.27 0.18 44.83 8.05
No Card 0.04 19.57 0.86 0.03 27.83 0.92
Sum 100.00 30.64 100.00 29.91
BPL = below poverty line, POP = poorest of the poor, APL = above poverty line.Source: Computations from the Expenditure surveys of the National Sample Survey.
If this kind of mistargeting is eliminated and all poor are classified as either BPL or POP, the participation rate would improve. If the participation conditional on eligibility remains invariant, then the participation rate would nearly double from 31% to 61% in the rural sector. Hence mistargeting is a major reason for the high exclusion error. Notice, however, that participation does not reach 100% because nearly 40% of poor households do not participate despite eligibility. This underscores the fact that there are factors other than eligibility that are also barriers to participation. The analysis for the urban sector is similar: here the gains from correct targeting are greater as the participation rate would rise from 30% to 77%.
If households received subsidized grain, how much did they receive? This question is answered in Table 10, which displays across poor and nonpoor households the amount of grain purchased through TPDS. Table 10 shows that the extent of use does not vary between poor and nonpoor households. As per capita grain consumption for all poor and nonpoor households varies between 10 and 12.5 kg per month, the TPDS on average accounts for about 40% of total grain consumption of the households that receive subsidies. Note also that for an average family of five, total household monthly consumption is nearly 20 kg, which is much less than the entitlement of 35 kg per month.
Table 10: Quantity of Subsidized Grain Purchased by TPDS using Poor and Nonpoor Households, 2004/2005 (per capita and in kilograms per month)
Poor Nonpoor
Rural 4.36 4.73
Urban 4.36 4.69
Source: Computations from India Expenditure surveys of the National Sample Survey.
14 | ADB Economics Working Paper Series No. 221

Table 11 presents the share of poor in total grain quantity distributed through the TPDS.9 This is compared to the share of the poor in total population. Although the quantity share is greater than the population share, the poor receive less than 50% of the total quantity distributed.
Table 11: Share of the Poor in Population and in Distribution of Subsidized Foodgrains, 2004/2005 (percent)
Share in Population
Share in Subsidized Foodgrains
Rural 28 31
Urban 26 46
All 27 33
Source: Computations from India Expenditure surveys of the National Sample Survey.
VI. Leakages Due to Illegal Diversions
Because of the price difference between subsidized grain and grain sold through regular marketing channels, there are powerful incentives to arbitrage and make illegal profits. Both countries have various audit and inspection systems to police such theft. Leakages are the illegal diversions of subsidized grain to regular market channels.10 They are typically estimated by comparing the distribution of subsidized grain from administrative records to the receipt of grain by households calculated from survey data.
For the Philippines, Mehta and Jha (2009) report a 54% gap between the NFA rice supply and reported consumption. While they acknowledge that some of the discrepancy could be because of timing issues in sample survey data, the gap is too large to be due to measurement errors alone. They conclude that the figure “indicates possibly significant pilferage”.
For India, using data from 1986–1987, Howes and Jha (1992) estimated the average ratio of PDS consumption to supply in 18 major states to be 65%, ranging from 5% in Haryana to 94% in Jammu and Kashmir. That is, on an average there was 35% diversion. There does not seem to have been much of an improvement since then as similar estimates have been derived by other researchers. For example, Ahluwalia (1993) estimated that in 1986/1987, 37% of the supply of subsidized rice and 38% of the supply of subsidized wheat were illegally diverted. Dutta and Ramaswami (2001) estimated these figures for 1993/1994 for the states of Andhra Pradesh and Maharashtra. They found illegal diversions to be of the order of 15% for rice in Andhra Pradesh and 30% and 19%,
9 The total quantity distributed through TPDS is computed from the household expenditure survey. It is not the total quantity of grain supplied to the TPDS by the government.
10 Sometimes leakages are also used to refer to the receipt of subsidized grain by nontarget groups. This is a leakage due to targeting error. In this section, we are concerned with leakages due to corruption and fraud.
How Can Food Subsidies Work Better? Answers from India and the Philippines | 15

respectively, for rice and wheat in Maharashtra. A study by Tata Consultancy Services (1998) found illegal diversions to be 31% and 36% for rice and wheat at the all-India level in the late 1990s. The Planning Commission of India (2005) study that examined leakages in India after the implementation of the targeted PDS concludes that illegal diversions of rice and wheat at the all-India level in 2003/2004 was 37% of the total supply of subsidized grain meant for the BPL category.
To get more recent estimates of illegal diversions, we use the National Sample expenditure survey of 2004/2005. In that year, the per capita consumption of subsidized foodgrains was 1.03 kg per month while the per capita supply of subsidized food works out to be 2.27 kg per month. This works out to a leakage of 55% of subsidized foodgrains supply. In 1999/2000, these numbers were 1.01 kg and 1.61 kg per month, respectively.11 These discrepancies are large and suggest a serious problem with diversions.
Table 12 displays the percentage leakages by commodity and according to the subsidy category (POP, BPL, and APL). The aggregate leakage for rice is 40% and expectedly diversions are greatest from POP allocations and least for APL allocations. The aggregate leakage for wheat is 73% and the diversions are high for all the categories.
Table 12: Illegal Diversions as Percentage of Supply, 2004/2005
Rice Wheat
POP 72 78
BPL 44 70
APL 5 77
Total 40 73
POP = poorest of the poor, BPL = below poverty line, APL = above poverty line.Sources: Computed from India Expenditure surveys of the National Sample survey, and data on supply
of subsidized food grains from the Ministry of Consumer Affairs, Food and Public Distribution.
VII. Excess Costs
All government agencies incur costs in purchase, transport, and distribution of subsidized food. Since this is an activity also done by private agents, it is useful to compare government costs with private costs to ascertain the efficiency of government interventions. In their review of literature about distribution costs, Jha and Srinivasan (2004) show that private traders operate at costs lower than those incurred by the government agency in the areas of marketing, storage, trade, and transport despite several controls and restrictions imposed upon them. 12 11 Because of a change in sample design, the 1999/2000 estimates of per capita consumption of subsidized food
could be an overestimate. 12 Jha and Srinivasan (2004) note that the trading costs and wholesale marketing margins of private traders in
2000/2001 were about half those of the government agency for wheat and about three quarters for rice.
16 | ADB Economics Working Paper Series No. 221

In India, the government publishes the “economic cost” of its intervention agency in procuring, transporting, and distributing grain to various stock points. This together with the additional distribution cost to the retail outlets is the government’s cost of delivering grain. By comparing it with retail prices of grain, the efficiency of government operations can be evaluated.
Dutta and Ramaswami (2001) used the above methodology to demonstrate that in 1993/1994, 27% of government budgetary expenditure on food subsidy in the state of Andhra Pradesh was wasted by inefficiency of government agencies. The figure for the state of Maharashtra in the same year was 16%. A more recent study by the Planning Commission of India (2005) finds that in the year 2003/2004, delivery through the private sector was more efficient in all states except Kerala. The evidence indicates that at the all-India level, the government’s food subsidy costs would have been lower by 35% if the government costs matched that of the private sector.
In 2004/2005, the central government’s economic cost of distributing rice and wheat were Rs. 13.29 and Rs. 10.19, respectively. To this must be added margins for wholesalers and retailers and transportation charges at the retail level. We do not have estimates of these costs for 2004/2005. A comparison of economic costs with retail prices will therefore give a lower bound to the “excess” costs incurred by the government. The NSS consumption expenditure data for 2004/2005 provides information about quantities and expenditures on various items by households. A unit value can be derived from this information. As richer households buy higher-quality grain, their unit values are higher. Table 13 displays mean unit values for POP, BPL, and APL households. Because of large quality variations in rice prices, purchase costs for rice are lowest for POP households and highest for APL households. In wheat, mean prices are about the same between BPL and APL households but are lower for POP households.
Table 13: Consumer Prices (retail) for Rice and Wheat in India, 2004/2005
Household Type Price Paid for Rice (Rs/kg)
Price Paid for Wheat (Rs/kg)
POP 9.98 8.58
BPL 10.5 9.34
APL 12.03 9.28
POP = poorest of the poor, BPL = below poverty line, APL = above poverty line.Note: Prices here refer to unit values.Source: Computed from India Expenditure surveys of the National Sample Survey.
As TPDS grain quality is generally considered to be below average, we take the price paid by BPL households to be representative for such quality grain.13 Comparing with the economic costs of the state agencies in 2004/2005 (Rs. 13.29 per kg for rice and 13 The data also shows that for both commodities at least 75% of the reported unit values are below the economic
cost.
How Can Food Subsidies Work Better? Answers from India and the Philippines | 17

Rs. 10.19 for wheat) we obtain the difference as excess cost. The excess cost for rice is Rs. 2.80 per kg, and Rs. 0.85 per kg for wheat.
Direct measures of excess costs do not exist for the Philippines. We construct these measures from the NFA’s financial statements. Adding the cost of imported rice, operating expenses and interest, we get the total cost as P40,090 million (Table 14). Dividing by the volume of grain distributed (1.57 million metric tons), we get the per unit cost of NFA’s rice distribution as P25.5 per kg. The NFA also publishes the market price as P23.56. Hence the excess cost is P1.95 per kg of rice.
Table 14: Excess Cost in the NFA Program, 2006
Volume of rice sold (million metric tons) 1.57
Cost of sales (P billion) 31.82
Operating expenses (P billion) 3.6
Interest (P billion) 4.7
Total cost (P billion) 40.12
Per unit acquisition and distribution cost (P/kg) 25.48
Market price (P/kg) 23.56
Per unit excess cost (P/kg) 1.92
P = pesos, kg = kilograms.Sources: National Food Authority 2006 Accomplishment Report (NFA 2006); authors computations.
VIII. Expected Income Gain to the Poor
In this section, we bring together the various components to fit into the conceptual framework outlined in Sections III and IV. Table 15 summarizes the targeting performance, illegal diversions, and excess cost of the food subsidy schemes in India and the Philippines. It is interesting to note that India’s TPDS, despite being a targeted program, brings only one third of the total subsidy to the poor in contrast to the Philippines’s universal program that gives as much as 60% of the subsidy. The latter also includes relatively fewer nonpoor among the beneficiaries while incurring lower excess costs that capture the inefficiency of the government-run program vis-à-vis the private sector. However, the food subsidy programs in both the countries have similar exclusion errors and diversion of subsidized grain supplies to the market.
18 | ADB Economics Working Paper Series No. 221

Table 15: Summary of Targeting Performance, Illegal Diversions, and Excess Cost
India Philippines
Exclusion Error (% of poor) 70 76
Inclusion Error (% of beneficiaries) 70 48
Share of Poor in Subsidized Grain 33 60
Diversion (% of supplies) 55 54
Excess Cost (% of government cost, rice) 21 8
Excess Cost (% of government cost, wheat) 8 -
The last five rows of Table 16 present the components of equation (4) for the Philippines. Note that the total cost figures obtained here are lower than the published food subsidy figures because the latter includes other items such as the cost of maintaining stocks. In the Indian case, the calculations are a little more cumbersome because of the three layers of subsidy and because of multiple commodities. Tables 17, 18, and 19 lay out the computations and numbers for diversion costs, excess costs, and income transfers. The decomposition of subsidy costs into its components is presented in Table 20.
Table 16: Decomposition of Subsidy Costs in the Philippines, 2006
Market Price (P/kg) 23.56
Value of Sales (P billion) 26.61
Volume of Sales (million tons) 1.57
Unit Price of Sales (P/kg) (item 2/item 3) 16.92
Consumer Subsidy (P/kg) (items 1–4) 6.64
Per Unit Excess Cost (from Table 14) 1.92
Illegal Diversions (million tons) (54% of item 3) 0.85
Subsidized Rice Consumed by Households (million tons) 0.72
Share of Poor in Subsidized Rice (from Table 6) 0.6
Income Transfer to Poor (P billion) (item 5 * item 8 * item 9) 2.9
Income Transfer to Nonpoor (P billion) 1.9
Cost of Illegal Diversions of Rice (P billion) (item 5 * item 7) 5.6
Total Excess Cost (P billion) (item 3 * item 6) 3.02
Total Cost of Subsidy (P billion) (item 3 * item 6 of Table 14) 13.5
P = pesos, kg = kilograms.Sources: National Food Authority 2006 Accomplishment Report (NFA 2006); CEIC Data Company Ltd., accessed 8 January 2010; authors‘ computations.
How Can Food Subsidies Work Better? Answers from India and the Philippines | 19

Table 17: Diversion Costs in India, 2004/2005
Rice POP BPL APL All
Market Price (Rs/ton) 10500 10500 10500
Sales Price (Rs/ton) 3000 5650 7950
Consumer Subsidy (Rs/ton) 7500 4850 2550
Illegal Diversions (million tons) 2.3 4.38 0.15
Cost of Illegal Diversions of rice (Rs million) 17250 21243 382.5 38875.5
Wheat
Market Price (Rs/ton) 9340 9340 9340
Sales Price (Rs/ton) 2000 4140 6100
Consumer Subsidy (Rs/ton) 7340 5200 3240
Illegal Diversions (million tons) 1.77 5.23 2.47
Cost of Illegal Diversions of Wheat (Rs Million) 13021.16 27196 8002.8 48219.96
Total cost of illegal diversions 87095.46Rs = rupees, POP = poorest of the poor, BPL = below poverty line, APL = above poverty line.Sources: Economic Survey, Government of India; authors’ computations.
Table 18: Excess Cost in India, 2004/2005
Rice Wheat All
Economic Cost (Rs/ton) 13296 10190
Market Price (Rs/ton) 10500 9340
Per Unit Excess Cost (Rs/ton) 2796 850
Quantity Sold (million tons) 16.46 12.89
Total Excess cost (Rs million) 46033.34 10956.5 56989.84Rs = rupees.Source: Economic Survey, Government of India; authors’ computations.
20 | ADB Economics Working Paper Series No. 221

Table 19: Income Transfers in India, 2004/2005
Rice POP BPL APL All
Market Price (Rs/ton) 10500 10500 10500
Sales Price (Rs/ton) 3000 5650 7950
Consumer Subsidy (Rs/ton) 7500 4850 2550
Consumption of Subsidized Rice (million tons) 0.90 5.65 3.15
Share of Poor 0.47 0.34 0.21
Income Transfer to Poor (Rs million) 3193.30 9415.55 1646.83 14255.68
Income Transfer to Nonpoor (Rs million) 3549.20 17986.95 6385.67 27921.82
Wheat
Market Price (Rs/ton) 9340 9340 9340
Sales Price (Rs/ton) 2000 4140 6100
Consumer Subsidy (Rs/ton) 7340 5200 3240
Consumption of Subsidized Wheat (million tons) 0.50 2.19 0.73
Share of Poor 0.53 0.41 0.22
Income Transfer to Poor (Rs million) 1922.26 4663.72 509.89 7095.87
Income Transfer to Nonpoor (Rs million) 1718.38 6724.28 1855.31 10297.97
Total Income Transfer to Poor (Rs million) 21351.55
Total Income Transfer to Nonpoor (Rs million) 38219.79
Rs = rupees, POP = poorest of the poor, BPL = below poverty line, APL = above poverty line.Sources: National Food Authority 2006 Accomplishment Report (NFA 2006); CEIC Data Company Ltd., accessed 8 January 2010;
Economic Survey, Government of India; author’s computations.
Table 20: Decomposition of Subsidy Costs in India, 2004/2005
Income Transfer to Poor (Rs million) 21352
Income Transfer to Nonpoor (Rs million) 38220
Illegal Diversion Cost (Rs million) 87095
Excess Cost (Rs million) 56990
Total Cost of Subsidy (Rs million) 203657
Rs = rupees.Source: Tables 17–19.
Table 21 displays for India and the Philippines the expected income impact on the poor from a unit of public spending on the poor. The share of subsidy going to the poor is 11% and 21%, respectively, in India and the Philippines. Multiplied by the participation rate, the expected income impact from a unit of public spending is 0.05 or less.
How Can Food Subsidies Work Better? Answers from India and the Philippines | 21

Table 21: Expected Income Impact on the Poor
India Philippines
Total Subsidy Rs. 204 billion P13.5 billion
Income Subsidy to the Poor Rs. 21 billion P2.9 billion
s - Share of Subsidy Received by the Poor 0.105 0.214
Participation Rate (% of the poor) 30 24.5
Expected Income Impact on the Poor Rs. 0.03 P0.05
Rs = rupees, P = pesos..Source: Authors' computations.
The pie charts in Figures 3 and 4 display how the subsidy is spent on various components. These figures show that even if inclusion errors were minimized to zero, the share of the poor would rise at most to 35% in Philippines and to 29% in India. This means that the expected income impact would rise to 0.09, which is a significant rise over the existing situation. However, in absolute numbers, the expected income impact is still very low, reflecting the low participation rates as well as large share of diversion and excess costs in the subsidy. For India, Bloomberg Businessweek reports that the newly defined poverty line—which makes an additional 100 million people eligible—requires an estimated Rp. 100 billion more in food subsidies, giving the need for minimizing the costs of inefficiency and diversion extra urgency (Dhara 2010).
Figure 3: Decomposition of Subsidy in the Philippines
Income Transfer to Poor (21%)
Income Transfer to Nonpoor (14%)
Illegal Diversion Cost (43%)
Excess Cost (22%)
Source: Table 16.
22 | ADB Economics Working Paper Series No. 221

Figure 4: Decomposition of Subsidy in IndiaIncome Transfer to Poor
(10%)
Income Transfer to Nonpoor (19%)
Illegal Diversion Cost (43%)
Excess Cost (28%)
Source: Table 20.
IX. Policy Options
The impact of the program on the poor can be increased either by increasing the participation rate, or by enhancing the fraction of subsidy going to the poor, or a combination of the two. Policies aimed at the latter will save resources that could be used to increase the participation rate.
In the Philippines, participation rates are low despite the universal nature of the program. Geographical access seems to be an issue especially in rural areas. The Tindahan Natin Program that uses geographical targeting to channel supplies is one attempt to address the problem. In India, participation rates of the poor are held back partly because of poor targeting, which renders many poor households ineligible for subsidies. One response to this situation could be to drop targeting and move to a universal system (indeed, many indicators of the universal Philippine program seem to perform better as discussed in the last section). But even conditional on eligibility, the participation rate of poor households in rural India is only 61%. Previous research has shown that lack of sufficient liquidity and erratic store timing (of the dedicated subsidized food outlets) are some reasons that dampen participation (Ramaswami 2002).
The debate on a targeted versus universal transfer scheme misses the point that there are huge savings to be had from trimming diversions and excess costs, i.e., program waste.14 Our findings suggest that the efficiency of subsidy delivery is the primary issue. How can that be improved? The Indian state of Chhattisgarh has claimed significant reduction in corruption by computerizing the supply chain, from paddy procurement to the distribution of rice in 2007/2008; and by making public the movement of grain from 14 The Indian state of Tamil Nadu has adopted a universal food subsidy scheme. This has increased participation rates
of the poor. However, it has also been criticized for being inefficient and corrupt (Swaminathan 2009).
How Can Food Subsidies Work Better? Answers from India and the Philippines | 23

warehouses to retail outlets. It is suggested that this has improved transparency and governance (Dhand et al. 2009).
An alternative to in-kind transfers are food coupons or restricted cash transfers. As opposed to general cash transfers, food coupons are conditional or tied grants that allow consumers to purchase limited quantity of foodgrains at a subsidized price. Even with this conditionality, coupons can potentially improve targeting efficiency by improving economic access as consumers can use these coupons in any of the various retail outlets. Such a system is not compatible with universal food subsidy systems that rely on self-targeting alone. However, as long as there is some kind of administrative targeting (even of the most generous kind), food coupons are feasible. Both diversions and excess costs do not arise in a food coupon system.
In the Indian case, a food coupon alternative would eliminate the dual marketing system (of private and government), which would resolve the endemic issue of the viability of the government marketing system.15 If there are staples other than rice (or wheat), a food coupon system could easily accommodate it without the need for physical and institutional infrastructure (procurement and distribution) that is specially set up for that purpose. In parts of India, poor consume “inferior” coarse grains such as sorghum and pearl millet, which are not subsidized by the current regime. Food coupons could allow consumers to spend their budget on their preferred commodities and would therefore be less distortionary in consumption, reducing their costs of participation. This could also happen through improved economic access as consumers would be able to use these coupons at a more convenient retail outlet. While there are potential issues of fraud in food coupons as well in terms of counterfeiting and improper use, it seems far easier to track and audit numerically coded coupons than to do so for physical stocks of grain. Governments sometimes balk at the costs of investing in technologies such as smart cards. The payoffs must, however, be seen in relation to the resources lost in diversions and excess costs.
Conditional cash transfers are another alternative to food subsidies. Such transfers have been widely and successfully used in many Latin American countries. In these transfers, the conditionality is of a different form to that of food coupons—relating to the use of social programs of education and health. Here cash transfers are conditional on attendance in schools and health clinics. Program benefits are designed to contribute to long-term human capital development and to provide immediate poverty relief. These benefits are in effect like negative user fees that are paid instead of charged to program participants who attend schools or visit clinics.
Evaluation studies suggest that the majority of program benefits accrued to poor families, and that the program made significant contributions to health, nutrition, education, and poverty outcomes. As expected, a major implementation challenge has been the
15 The retail outlets that sell subsidized grain are usually restricted from selling other unsubsidized grain. With low volumes, retailers complain it is not economically viable (Government of India 2002, 151).
24 | ADB Economics Working Paper Series No. 221
identification of target beneficiaries. Another challenge has been in assuring timely payment of benefits. Other issues involved the complexity of keeping the list of eligible households up to date; and monitoring the effectiveness and integrity of the procedures used to identify and pay beneficiaries. The applicability of health and education-related conditions in the Asian context has to be judged with reference to the availability of such infrastructure.
Is conditionality necessary? Conditionality can be a useful targeting mechanism as in the case of food-for-work programs where food subsidy is conditional on the person working at the public works program, or school feeding programs where food subsidy is conditional on the child attending school. The work requirement in food-for-work programs acts as a self-targeting mechanism. However, this creates a bias against certain segments of the population especially those families with elderly and children who are not physically capable of working but nevertheless poor. Food-for-work programs are also likely to be more costly to implement than a cash transfer program because it requires management and other resources to create productive work that add to administrative expenses.
Cash transfers, whether restricted (like food coupons) or unconditional, are often criticized for being mere income transfer programs. In-kind transfers are regarded as more appropriate if the objective is to meet specific targets of food intake. It can be debated whether paternalism should be the guiding principle or whether consumer sovereignty ought to be respected. This debate, however, should not obscure the pressing and immediate issue of the efficiency of the subsidy delivery mechanism.
ReferencesADB. 2008. Special Report—Food Prices and Inflation in Developing Asia: Is Poverty Reduction
Coming to an End? Asian Development Bank, Manila.Ahluwalia, D. 1993. “Public Distribution of Food in India.” Food Policy February:33–54.Banerjee, A. V., and E. Duflo. 2007. “The Economic Lives of the Poor.” Journal of Economic
Perspectives 21(1):141–67.Besley, T., and R. Kanbur. 1993. “The Principles of Targeting.” In M. Lipton and J. Van der Gaag,
eds., Including the Poor. The World Bank, Washington, DC. Coady, D. 2002. Designing and Evaluating Social Safety Nets: Theory, Evidence and Policy
Conclusions. FCND Discussion Paper No. 172, International Food Policy Research Institute, Washington, DC.
———. 2003. “Choosing Social Safety Net Programmes and Targeting Methods in LDCs.” International Food Policy Research Institute, Washington, DC. Processed.
Coady, D., and E. Skoufias. 2004. “On the Targeting and Redistributive Efficiencies of Alternative Transfer Instruments.” Review of Income and Wealth 50(1):11–27.
Coady, D., M. Grosh, and J. Hoddinott. 2004. “Targeting Outcomes Redux.” The World Bank Research Observer 19(1):61–85.
Commission on Audit. Various years. National Food Annual Audit Reports. Manila.
How Can Food Subsidies Work Better? Answers from India and the Philippines | 25
de Janvry, A., and E. Sadoulet. 2009. “The Impact of Rising Food Prices on Household Welfare in India.” Institute for Research on Labor and Employment, UC Berkeley. Available: http://escholarship.org/uc/item/7xj9n1qq.
Dhand, V. K., D. K. Srivastav, A. K. Somasekhar, and R. Jaiswal. 2009. “Computerization of Paddy Procurement and Public Distribution System in Chhatisgarh.”Available: www.csi- sigegov.org/egovernance_pdf/26_216-223.pdf.
Dhara, T. 2010. “India Definition of Poor May Raise Subsidy Cost by $2.2 Billion.” Available: www.businessweek.com/news/2010-04-19/india-definition-of-poor-may-raise-subsidy-cost-by-2-2-billion.html.
Dutta B., and B. Ramaswami. 2001. “Targeting and Efficiency in the Public Distribution System: Case of Andhra Pradesh and Maharashtra.” Economic and Political Weekly 36(18):1524–32.
Gelbach, J., and L. Pritchett. 2000. “Indicator Targeting in a Political Economy: Leakier can be Better.” Journal of Policy Reform 4:113–45.
Government of India. 2002. Report of the High Level Committee on Long-Term Grain Policy, Department of Food and Public Distribution, Ministry of Consumer Affairs, Food and Public Distribution. New Delhi.
Howes, S., and S. Jha. 1992. “Urban Bias in Indian Public Distribution System.” Economic and Political Weekly, May 9. Pages 1022–30.
Jha, S., and P. V. Srinivasan. 2004. Achieving Food Security in a Cost Effective Way: Implications of Domestic Deregulation and Reform under Liberalized Trade, MTID Discussion Paper No. 67, International Food Policy Research Institute, Washington, DC. Available: www.ifpri.org/publication/achieving-food-security-cost-effective-way.
Kanbur, R. 2009. “Macro Crises and Targeting Transfers to the Poor.” Cornell University, New York. Processed.
Masters, W. A., and G. E.Shively, eds. 2008. “Special Issue on the World Food Crisis.” Agricultural Economics 39(1):373–550.
Mehta, A., and S. Jha. 2009. Governance and Hunger: A Case Study from the Philippines. University of California-Santa Barbara Center of Global Studies Working Paper No. 07, California.
———. Various years. National Food Authority Accomplishment Reports. National Food Authority, Manila.
Planning Commission of India. 2005. Performance Evaluation of Targeted Public Distribution System. Programme Evaluation Organization Report No. 189, Planning Commission, Government of India.
Ramaswami, B.2002. “Special Article: Efficiency and Equity of Food Market Interventions.” Economic and Political Weekly 37(12):1129–35.
Ravallion, M. 2009. “How Relevant is Targeting to the Success of an Antipoverty Program.” The World Bank Research Observer 24(2):205–31.
Son, H. H. 2008. Has Inflation Hurt the Poor? Regional Analysis in the Philippines. ERD Working Paper Series No. 112, Economics and Research Department, Asian Development Bank, Manila.
Swaminathan, A. M. 2009. Food Security Policy Options for Tamil Nadu. New Delhi: Academic Foundation.
Tata Economic Consultancy Services. 1998. “Study to Ascertain the Extent of Diversion of PDS Commodities.” Ministry of Food and Consumer Affairs, Government of India.
Tolentino, V. B. J. 2002. “The Globalization of Food Security: Rice Policy Reforms in the Philippines.” Philippine Journal of Development 29(2):27–61.
World Bank. 2001. Philippines: Filipino Report Card on Pro-Poor Services. Report No. 22181-PH, Washington, DC.
26 | ADB Economics Working Paper Series No. 221

About the PaperShikha Jha and Bharat Ramaswami examine the gains to the poor from public spending on food subsidies in India and the Philippines. They estimate the effectiveness of targeting in terms of exclusion and inclusion errors; and the effectiveness of program delivery in terms of leakage from pilferage or illegal diversions, and leakage due to excess costs (relative to the private sector, or inefficiency of the public program). Their findings show that elimination of targeting errors would transfer less than 10 cents to the poor from an additional dollar of public spending, but if excess and diversion costs too are eliminated, then the transfer would rise to between 25 and 30 cents.
About the Asian Development BankADB’s vision is an Asia and Pacific region free of poverty. Its mission is to help its developing member countries substantially reduce poverty and improve the quality of life of their people. Despite the region’s many successes, it remains home to two-thirds of the world’s poor: 1.8 billion people who live on less than $2 a day, with 903 million struggling on less than $1.25 a day. ADB is committed to reducing poverty through inclusive economic growth, environmentally sustainable growth, and regional integration. Based in Manila, ADB is owned by 67 members, including 48 from the region. Its main instruments for helping its developing member countries are policy dialogue, loans, equity investments, guarantees, grants, and technical assistance.
Asian Development Bank6 ADB Avenue, Mandaluyong City1550 Metro Manila, Philippineswww.adb.org/economicsISSN: 1655-5252Publication Stock No. WPS102651 Printed in the Philippines
< 0 1 0 2 6 5 1 1 >