Embed Size (px)
Citation preview
ADB Economics Working Paper Series
Rural–Urban Migration and Employment Quality: A Case Study from Thailand
Mulubrhan Amare, Lena Hohfeld, Somchai Jitsuchon, and Hermann Waibel No. 309 | April 2012
ADB Economics Working Paper Series No. 309
Rural–Urban Migration and Employment Quality: A Case Study from Thailand
Mulubrhan Amare, Lena Hohfeld, Somchai Jitsuchon, and Hermann Waibel April 2012
Mulubrhan Amare is Research Associate, Lena Hohfeld is Research Assistant, and Hermann Waibel is the Director of Institute of Development and Agricultural Economics, Faculty of Economics and Management, Leibniz University Hannover. Somchai Jitsuchon is Research Director, Inclusive Development, Thailand Development Research Institute (TDRI), Bangkok, Thailand. The authors would like to thank Natalie Chun, Peter Warr, and Anil Deolalikar for insightful comments. This paper was presented at the ADB Conference on Quality Employment in Asia.

Asian Development Bank6 ADB Avenue, Mandaluyong City1550 Metro Manila, Philippineswww.adb.org/economics
©2012 by Asian Development BankApril 2012ISSN 1655-5252Publication Stock No. WPS124706
The views expressed in this paperare those of the author(s) and do notnecessarily reflect the views or policiesof the Asian Development Bank.
The ADB Economics Working Paper Series is a forum for stimulating discussion and eliciting feedback on ongoing and recently completed research and policy studies undertaken by the Asian Development Bank (ADB) staff, consultants, or resource persons. The series deals with key economic and development problems, particularly those facing the Asia and Pacific region; as well as conceptual, analytical, or methodological issues relating to project/program economic analysis, and statistical data and measurement. The series aims to enhance the knowledge on Asia’s development and policy challenges; strengthen analytical rigor and quality of ADB’s country partnership strategies, and its subregional and country operations; and improve the quality and availability of statistical data and development indicators for monitoring development effectiveness.
The ADB Economics Working Paper Series is a quick-disseminating, informal publication whose titles could subsequently be revised for publication as articles in professional journals or chapters in books. The series is maintained by the Economics and Research Department.

Contents
Abstract v
I. Introduction 1
II. Conceptual Framework 2
III. Description of the Data 4
IV. Methodology 5
A. Empirical Model 1: Determinants of Migration and its Impact on the Well-being of Rural Households 5
B. Empirical Model 2: Quality of Migrant Employment and its Impact 7
V. Results and Discussion 9
A. Descriptive Results on Various Aspects of Migration 9 B. Econometric Results 12 C. Effects of Migration on Rural Household Well-Being 14 D. Determinants of Employment Quality 15 E. Impact of Quality Employment on Rural Household Well-Being 17
VI. Conclusions and Policy Recommendations 18
References 20
Abstract
This study investigates the effects of rural–urban migration on economic development in Thailand. It draws upon a panel database of 2,000 rural households collected from 2008 to 2010 in three provinces from Northeast Thailand and a survey of 650 migrants in the Greater Bangkok area conducted in 2010. The study offers some new findings on migration in Thailand. First, there is evidence that there is a need for better social protection for urban migrants. Second, the study shows that migration offers the benefit of income growth for rural households but is less effective in reducing inequality and relative poverty in rural areas. Generally, migrants are more educated albeit at an overall low education level in the rural areas. The message emerging from this paper is that poor rural households tend to produce poor migrants which could be one of the reasons for the continuous existence of a wide rural–urban divide in welfare. The crucial importance of good quality education for migrants to achieve higher quality employment calls for more investment in education quality in rural areas.

I. Introduction
The movement of rural people out of agriculture in order to find jobs in urban centers is a major ingredient of the development process especially in emerging market economies. Thailand is a particularly good example not only because of its long history of rural–urban migration, high rates of economic growth, and good records of poverty reduction, but also because of its experience with economic and political shocks and a still large share of the population living in rural areas. The country has developed social protection policies for the poor, but empirical evidence on their success is still sparse.
Migration has profound consequences for the rural areas, i.e., the migrants’ natal villages. For a household in a rural village, temporary out-migration is a labor-diversification-based livelihood strategy, as migrants send remittances to their natal household. For migrants, the rural household remains the nucleus. Mostly, migrants are still members of the rural household regardless of their duration of absence, frequency of home visits, or place of official registration. However, not all migration decisions lead to the expected success. Sometimes migrants end up in so-called “bad employment” including prostitution and child labor. Policy makers tend to accept these negative externalities as an unavoidable by-product of development with the notion that it is still better to be “poor in the city” than “poor in the village”.
The aggregate effect of migration can have strong implications for the institutional and social conditions in the village. When the younger and economically more active population moves out of agriculture a decline in production and productivity can result unless structural change and agricultural modernization is facilitated. Most empirical studies on migration investigate either the impact on urban development or on the rural areas (e.g., Brown and Jimenez 2008, Shen et al. 2010, Goedecke and Waibel 2011). Hence, there is a need for more empirical evidence of the effects of migration on both the rural village and on the prospects of the migrants in their urban environment.
Both aspects are addressed in this paper by asking the following three questions. First, what are the underlying forces that motivate rural households to send some of their members to urban industrial centers for work? Second, what determines the success of such livelihood strategies from the point of view of the rural household and from the point of view from of a migrant? The third question is to what extent the migrant’s success of finding quality employment is supportive to the welfare of her natal household.
The empirical basis of this study is a rural household panel database that includes over 2,000 rural households from three provinces in Northeast Thailand combined with a migrant tracking survey carried out in the Greater Bangkok area. The database is unique as it combines comprehensive household level data and information on migrant household members.
The paper proceeds as follows. In Section II, a brief review of the migration literature in the context of economic development is provided. This allows establishing some hypotheses for this study. In Section III the database used for the descriptive and econometric analysis is introduced. Section IV describes the methodology including the econometric models, while Section V presents the results of the study including the factors that determine migration and migration success. Section VI concludes and identifies remaining gaps.
II. Conceptual Framework
Quantitative modeling of migration processes date back to Harris and Todaro (1970) who emphasized the wage differential hypothesis. Microeconomic models of migration (e.g., Sjaastad 1962, Todaro and Maruszko 1987) consider migration as an investment in human capital. Traveling costs, costs of job search and training, and also psychological costs are included on the cost side. On the benefit side, the expected wage differential as well as nonmarket benefits of migration such as better access to health are considered. In later papers, e.g., Taylor and Fletcher (2007) and Hagen-Zanker (2008), migration is seen as a measure of ex ante risk mitigation and ex post coping, hypothesizing that the risks in rural areas are mostly uncorrelated or negatively correlated with those in urban areas. The net benefits of migration are also influenced by social network variables (Massey 1990), e.g., interpersonal relationships among, as well as between, migrants and their natal household. Lucas (2004) in a seminal article has proposed thinking of rural–urban migration in terms of “life learning”. In his models, urban areas are places where migrants can accumulate the skills required by modern production technologies. Thus, he introduces the notions of a skills differentiation with high skills jobs available for people who migrated some time ago and low skills jobs for new arrivals. He also points to the aspect of timing and speed on migration with returns to the migrant’s human capital investment as a major factor.
Models of migration provide a good benchmark for the factors that can determine the success of migration. However, few studies have established the impact of migration on rural households and the impact of the migrant’s employment quality on migration success. In theory, if migration is successful after several decades of migration one should be able to observe a declining gap in welfare between rural and urban areas.
2 | ADB Economics Working Paper Series No. 309

However, as shown in the 2008 World Development Report (World Bank 2007), this is not the case, and Thailand remains among the countries with a very high rural–urban divide.
Inequality as a result of economic growth of poor countries was first postulated by Kuznets (1955). It has been shown that industrialization and urbanization change the distribution of income in a developing economy. Urbanization through rural–urban migration raises the gap in per capita income between the urban and the rural population as productivity in urban areas grows faster than in rural areas. During the first stages of industrialization, urbanization pursued by the migration process inherently raises inequality. Invariably, this process has implications for poverty. As the population moves from rural to urban areas, a change in aggregate poverty incidence will occur even if respective poverty incidences for rural and urban areas remain constant. Overall poverty is expressed as the shares in population and poverty incidence between rural and urban areas:
P Np N NPR NP
U N RPp UPU= = + = +/ ( ) / a a (1)
where P is the ratio of the poor in the population N, R stands for the rural population and U for the urban population, while a is the proportion of the poor in these groups.
Consequently, a change in the poverty (dP) of a country can be viewed subject to the change in population shares and the changes in the relative rates of poverty:
dP RdPp UdPU PP PU d R= + + −a a a( ) (2)
and can be decomposed as the change in rural poverty and the change in urban poverty. The reduction in poverty is adjusted by the movement of populations from rural to urban areas and is weighted by the difference in poverty. Kuznets hypothesized that migration will benefit the rural population and eventually close the gap in poverty between urban and rural areas. However, Lipton (1980) has pointed out that rural–urban migration tends to increase inter-household inequality within and between villages. Rodriguez (1998) found that migration increases inequality in the Philippines while Brown and Jimenez (2008) showed that remittances helped to decrease poverty in Fiji and Tonga with little impact on reducing inequality.
Rural–urban linkages have received considerable attention in Thailand and have been explicitly mentioned in the Ninth Development Plan of Thailand. Official data are problematic however. For example in 2000, only some 20% of the population of Thailand resided in urban areas according to United Nations data (Yap 2002). The problem was that many migrants residing in urban areas did not change their civil registration and were therefore counted as part of the rural population. Many studies on female labor migration in Thailand focus on the country’s sex industry (e.g. Pasuk et al. 1998). Mills (1999) complements this line of research with a study of female migrants working in less
Rural-Urban Migration and Employment Quality: A Case Study from Thailand | 3
visible occupations such as factories and sweatshops in the Bangkok metropolis. To our knowledge, none of the studies on migration in Thailand has explicitly addressed the question of employment quality as a means to assess long-term migrant success from an economic point of view. This paper therefore provides an empirical test for this hypothesis by comparing rural households with migrants and without migrants from three provinces in Thailand.
In the next section we describe the data that we used in the analysis of migration and migration success both for the migrant and the rural household.
III. Description of the Data
We use data from the 2008 and 2010 panel waves of a household survey carried out in the context of the DFG FOR 756 Research Grant project “Vulnerability to poverty in Thailand and Vietnam” which also includes interviews with the village headmen and a migrant survey in 2010.1 Initially, 2,200 rural households were selected in a three-stage sampling process. The sample was designed in such a way that it is representative of the target population and would allow drawing conclusions for the vulnerability of rural households in the selected provinces and areas with similar conditions. The sampling procedure consists of a three-stage cluster sampling design with district, subdistrict, and village classifications. The ultimate cluster size of 10 households in a village was chosen based on organizational aspects of the survey. The primary sampling unit was the subdistrict, assuming homogeneity within a province, which is quite reasonable for the northeastern region of Thailand especially with regards to the natural resource conditions.
The survey was conducted in three provinces, namely Buriram, Nakhon Phanom, and Ubon Ratchathani. All three provinces belong to the northeastern region, still considered the “poverty pocket” of Thailand (Healy and Jitsuchon 2007). In all three provinces, income from agriculture and natural resources is less than from other income sources including nonfarm wage employment, self employment and remittances (Hardeweg et al. 2012). This suggests that migration is an important component of the livelihood strategies of these households.
The migrant survey applied in this study followed the concept of tracking surveys such as those carried out in the Nang Rong project in Thailand (Rindfuss et al. 2004) and in World Bank health studies in Tanzania (Beegle et al., 2008). Based on national statistics (NSO 2008), over 80% of migration from the northeastern region of Thailand is directed to Bangkok or its surrounding areas. This general pattern of migration was also confirmed by the results of the second panel in 2008 of the rural household survey in the three provinces. Hence, in our migrant database, the survey was limited to the Greater
1 http://www.vulnerability-asia.uni-hannover.de/
4 | ADB Economics Working Paper Series No. 309
Bangkok metropolitan area including the surrounding provinces of Samut Sakhon, Samut Prakan, Samut Songkhram, Nonthaburi, Nakhon Pathom, Pathum Thani, Ayutthaya, Saraburi, Nakhon Nayok, Chachoengsao, and Chonburi. For the tracking survey, migrants were already identified during the parallel household interviews based on the information provided by the respondent. The survey took place during the height of a political crisis, which nearly paralyzed parts of Thailand’s capital city during May to July 2010. This severely constrained the implementation of the survey and therefore restricted the number of interviews to 643 out of nearly 1100 migrants in the database.
IV. Methodology
To address the research objectives, we have developed two models. We use a difference- in-difference matching estimator to examine the drivers of rural–urban migration and estimate the impact of migration on rural household well-being. Furthermore, we establish the relationship between household and migrant characteristics and finding better employment in urban areas. Finally, we quantify the impact of finding better employment on rural household well-being. This triangulation method will help to articulate who benefits from migration and clarify the implication for inequality.
A. Empirical Model 1: Determinants of Migration and its Impact on the Well-being of Rural Households
In the first model we investigate the factors that influence the decision of a rural household in rural Thailand to send one or more members to the Greater Bangkok area for employment. To choose the variables to be included in the model, one can refer to the review of the micro economic migration theories as summarized in Section II. In the migration literature, the decision of a rural household to send one or several of its members to an urban center for employment is driven by the expectation of increasing welfare for the entire household. The literature summarizes that demographic characteristics (household level human capital and demographic variables), economic indicators (wealth and income), location (access to information), and risk diversification are the main drivers of migration.
One problem of assessing the impact of migration on the well-being of rural households is a potential selection bias, which stems from the fact that we cannot measure the well-being of households with migrants in comparison to their situation without a migrant. In complete experimental designs, the outcome of non-migrant households can serve as a good counterfactual. However, if migrant households’ characteristics differ from those of non-migrant households, the comparison of the outcome between the two groups will be biased. One way to minimize this problem is to use a difference-in-difference propensity
Rural-Urban Migration and Employment Quality: A Case Study from Thailand | 5
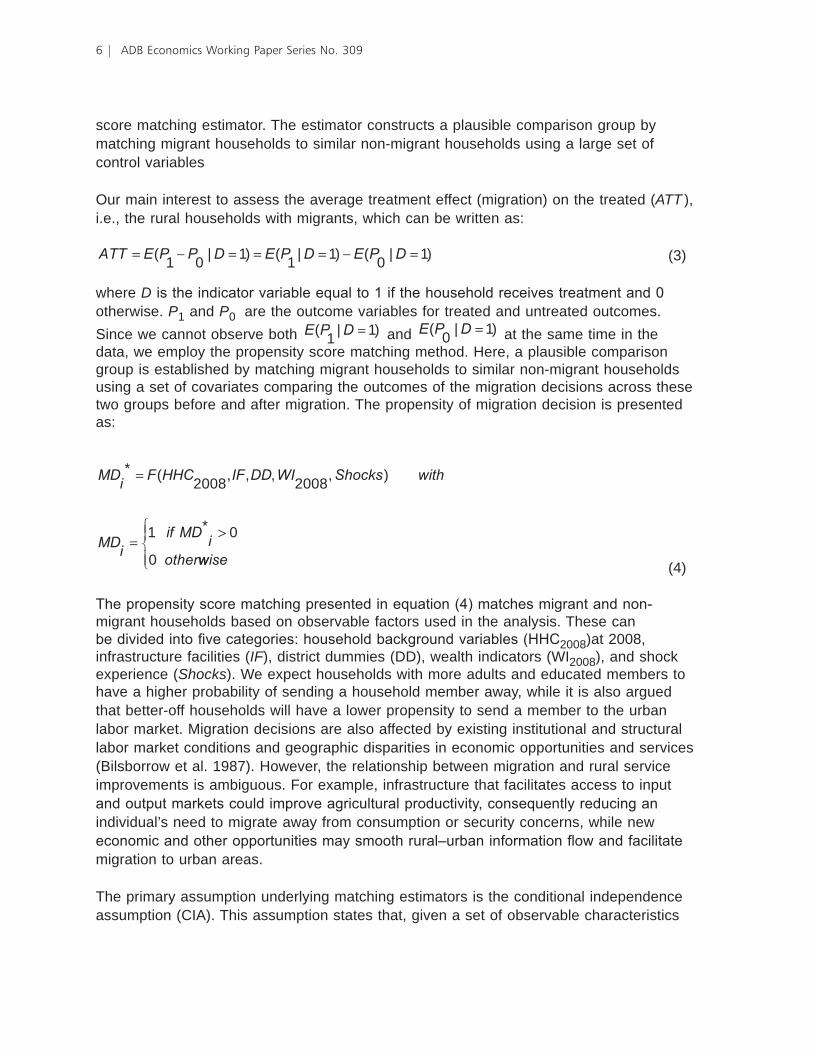
score matching estimator. The estimator constructs a plausible comparison group by matching migrant households to similar non-migrant households using a large set of control variables
Our main interest to assess the average treatment effect (migration) on the treated (ATT ), i.e., the rural households with migrants, which can be written as:
ATT E P P D E P D E P D= − = = = − =( | ) ( | ) ( | )1 0
11
10
1 (3)
where D is the indicator variable equal to 1 if the household receives treatment and 0 otherwise. P1 and P0 are the outcome variables for treated and untreated outcomes. Since we cannot observe both E P D( | )
11= and E P D( | )
01= at the same time in the
data, we employ the propensity score matching method. Here, a plausible comparison group is established by matching migrant households to similar non-migrant households using a set of covariates comparing the outcomes of the migration decisions across these two groups before and after migration. The propensity of migration decision is presented as:
MDi F HHC IF DD WI Shocks with
MDiif MD iother
* ( , , , , )
*
=
=>
2008 2008
1 0
0 wwise
(4)
The propensity score matching presented in equation (4) matches migrant and non-migrant households based on observable factors used in the analysis. These can be divided into five categories: household background variables (HHC2008)at 2008, infrastructure facilities (IF), district dummies (DD), wealth indicators (WI2008), and shock experience (Shocks). We expect households with more adults and educated members to have a higher probability of sending a household member away, while it is also argued that better-off households will have a lower propensity to send a member to the urban labor market. Migration decisions are also affected by existing institutional and structural labor market conditions and geographic disparities in economic opportunities and services (Bilsborrow et al. 1987). However, the relationship between migration and rural service improvements is ambiguous. For example, infrastructure that facilitates access to input and output markets could improve agricultural productivity, consequently reducing an individual’s need to migrate away from consumption or security concerns, while new economic and other opportunities may smooth rural–urban information flow and facilitate migration to urban areas.
The primary assumption underlying matching estimators is the conditional independence assumption (CIA). This assumption states that, given a set of observable characteristics
6 | ADB Economics Working Paper Series No. 309
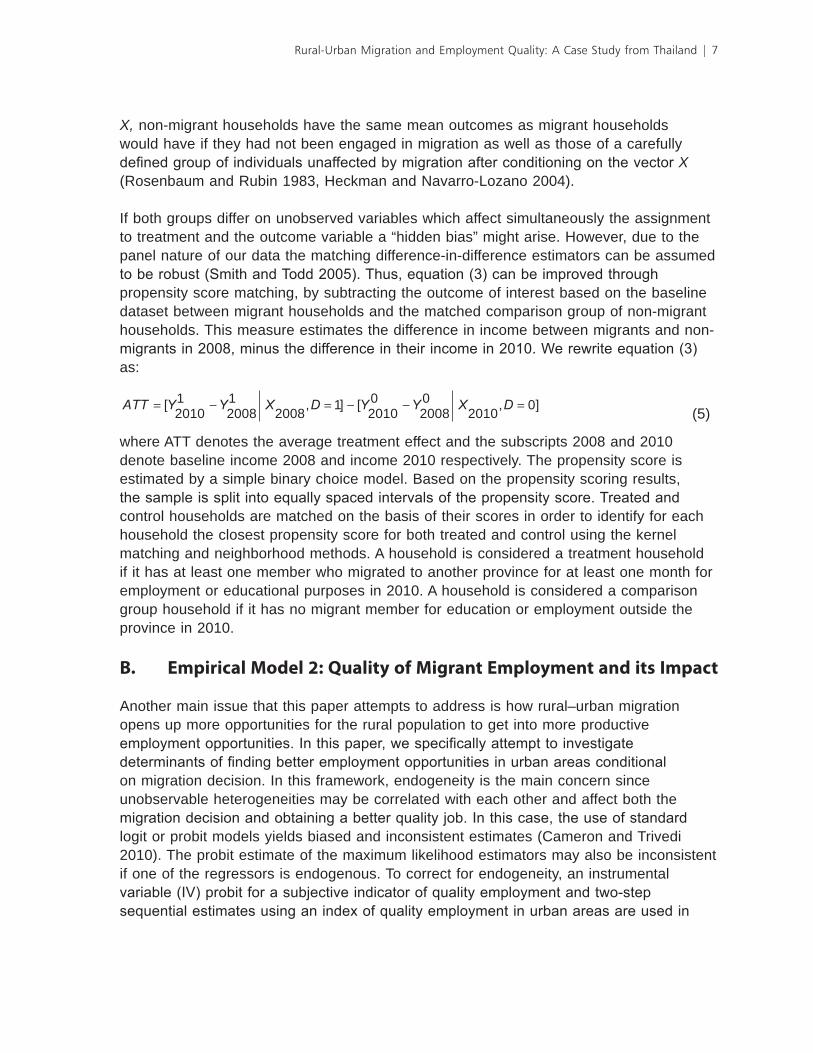
X, non-migrant households have the same mean outcomes as migrant households would have if they had not been engaged in migration as well as those of a carefully defined group of individuals unaffected by migration after conditioning on the vector X (Rosenbaum and Rubin 1983, Heckman and Navarro-Lozano 2004).
If both groups differ on unobserved variables which affect simultaneously the assignment to treatment and the outcome variable a “hidden bias” might arise. However, due to the panel nature of our data the matching difference-in-difference estimators can be assumed to be robust (Smith and Todd 2005). Thus, equation (3) can be improved through propensity score matching, by subtracting the outcome of interest based on the baseline dataset between migrant households and the matched comparison group of non-migrant households. This measure estimates the difference in income between migrants and non-migrants in 2008, minus the difference in their income in 2010. We rewrite equation (3) as:
ATT Y Y X D Y Y X D= − = − − =[ , ] [ , ]20101
20081
20081
20100
20080
20100 (5)
where ATT denotes the average treatment effect and the subscripts 2008 and 2010 denote baseline income 2008 and income 2010 respectively. The propensity score is estimated by a simple binary choice model. Based on the propensity scoring results, the sample is split into equally spaced intervals of the propensity score. Treated and control households are matched on the basis of their scores in order to identify for each household the closest propensity score for both treated and control using the kernel matching and neighborhood methods. A household is considered a treatment household if it has at least one member who migrated to another province for at least one month for employment or educational purposes in 2010. A household is considered a comparison group household if it has no migrant member for education or employment outside the province in 2010.
B. Empirical Model 2: Quality of Migrant Employment and its Impact
Another main issue that this paper attempts to address is how rural–urban migration opens up more opportunities for the rural population to get into more productive employment opportunities. In this paper, we specifically attempt to investigate determinants of finding better employment opportunities in urban areas conditional on migration decision. In this framework, endogeneity is the main concern since unobservable heterogeneities may be correlated with each other and affect both the migration decision and obtaining a better quality job. In this case, the use of standard logit or probit models yields biased and inconsistent estimates (Cameron and Trivedi 2010). The probit estimate of the maximum likelihood estimators may also be inconsistent if one of the regressors is endogenous. To correct for endogeneity, an instrumental variable (IV) probit for a subjective indicator of quality employment and two-step sequential estimates using an index of quality employment in urban areas are used in
Rural-Urban Migration and Employment Quality: A Case Study from Thailand | 7
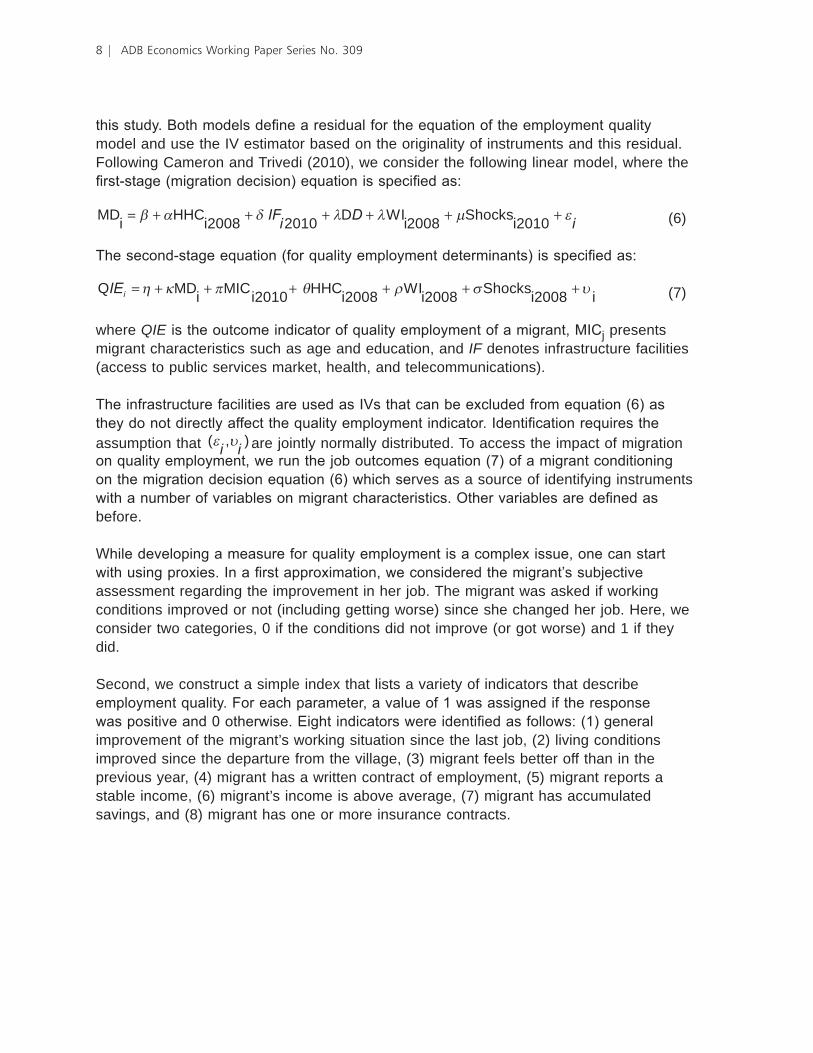
this study. Both models define a residual for the equation of the employment quality model and use the IV estimator based on the originality of instruments and this residual. Following Cameron and Trivedi (2010), we consider the following linear model, where the first-stage (migration decision) equation is specified as:
MDi
HHCi2008
D WIi2008
Shocksi2010
= + + + + + +β α δ λ λ µ εIFi D i2010 (6)
The second-stage equation (for quality employment determinants) is specified as:
Q MDi
MICi2010
HHCi2008
WIi2008
Shocksi2008 i
IEi = + + + + + +η κ π θ ρ σ υ (7)
where QIE is the outcome indicator of quality employment of a migrant, MICj presents migrant characteristics such as age and education, and IF denotes infrastructure facilities (access to public services market, health, and telecommunications).
The infrastructure facilities are used as IVs that can be excluded from equation (6) as they do not directly affect the quality employment indicator. Identification requires the assumption that ( , )ε υi i are jointly normally distributed. To access the impact of migration on quality employment, we run the job outcomes equation (7) of a migrant conditioning on the migration decision equation (6) which serves as a source of identifying instruments with a number of variables on migrant characteristics. Other variables are defined as before.
While developing a measure for quality employment is a complex issue, one can start with using proxies. In a first approximation, we considered the migrant’s subjective assessment regarding the improvement in her job. The migrant was asked if working conditions improved or not (including getting worse) since she changed her job. Here, we consider two categories, 0 if the conditions did not improve (or got worse) and 1 if they did.
Second, we construct a simple index that lists a variety of indicators that describe employment quality. For each parameter, a value of 1 was assigned if the response was positive and 0 otherwise. Eight indicators were identified as follows: (1) general improvement of the migrant’s working situation since the last job, (2) living conditions improved since the departure from the village, (3) migrant feels better off than in the previous year, (4) migrant has a written contract of employment, (5) migrant reports a stable income, (6) migrant’s income is above average, (7) migrant has accumulated savings, and (8) migrant has one or more insurance contracts.
8 | ADB Economics Working Paper Series No. 309
V. Results and Discussion
In the following, the results of our analysis using the rural household panel database and the corresponding migrant survey are presented. As a first step, a descriptive analysis from the 2010 migrant survey is presented. In the second part of the section, the econometric results are discussed.
A. Descriptive Results on Various Aspects of Migration
The selected descriptive statistics in this section illustrate important characteristics of the migrants and the migration process that can support some of the underlying hypotheses of the study and further qualify variables for the later modeling exercise. Summary statistics comparing migrant and non-migrant households are presented in Table 1. Some important variables which are used in the model estimates in the later section show statistically significant differences in mean values. Migrant households have more educated household members. This supports the notion of human capital drain from rural to urban areas. Income from remittances (in 2008) was higher for households engaged in migration than for households that did not engage in migration in 2010. This may indicate that remittance income motivates households to participate in migration insistently. Total income (in terms of PPP$ in 2010) is significantly higher for migrants compared to non-migrant households. Health shocks occur more frequently in non-migrant households, which may suggest that household members stay behind because of caregiving for those with ill health.
For describing the migration process, we asked the migrants their main reasons for migrating (Table 2). While it is recognized that the decision to migrate is not necessarily an independent decision of the migrant herself, the answer categories provide some insight for the push and pull factors of migration. As expected, the most frequent reason was employment, which may also be a part of the other remaining categories of answers. Quite obviously, pull factors are dominant.
Rural-Urban Migration and Employment Quality: A Case Study from Thailand | 9
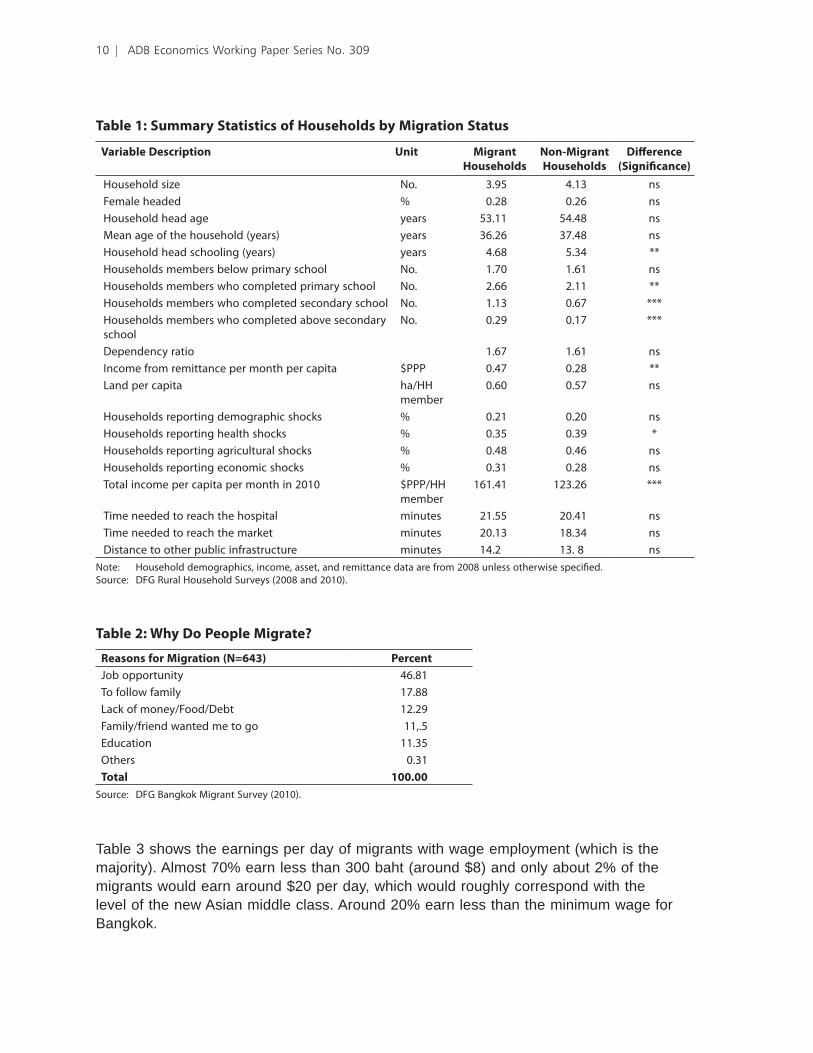
Table 1: Summary Statistics of Households by Migration Status
Variable Description Unit Migrant Households
Non-Migrant Households
Difference (Significance)
Household size No. 3.95 4.13 nsFemale headed % 0.28 0.26 nsHousehold head age years 53.11 54.48 nsMean age of the household (years) years 36.26 37.48 nsHousehold head schooling (years) years 4.68 5.34 **Households members below primary school No. 1.70 1.61 nsHouseholds members who completed primary school No. 2.66 2.11 **Households members who completed secondary school No. 1.13 0.67 ***Households members who completed above secondary school
No. 0.29 0.17 ***
Dependency ratio 1.67 1.61 nsIncome from remittance per month per capita $PPP 0.47 0.28 **Land per capita ha/HH
member0.60 0.57 ns
Households reporting demographic shocks % 0.21 0.20 nsHouseholds reporting health shocks % 0.35 0.39 *Households reporting agricultural shocks % 0.48 0.46 nsHouseholds reporting economic shocks % 0.31 0.28 nsTotal income per capita per month in 2010 $PPP/HH
member161.41 123.26 ***
Time needed to reach the hospital minutes 21.55 20.41 nsTime needed to reach the market minutes 20.13 18.34 nsDistance to other public infrastructure minutes 14.2 13. 8 ns
Note: Household demographics, income, asset, and remittance data are from 2008 unless otherwise specified. Source: DFG Rural Household Surveys (2008 and 2010).
Table 2: Why Do People Migrate?
Reasons for Migration (N=643) Percent Job opportunity 46.81To follow family 17.88Lack of money/Food/Debt 12.29Family/friend wanted me to go 11,.5Education 11.35Others 0.31Total 100.00
Source: DFG Bangkok Migrant Survey (2010).
Table 3 shows the earnings per day of migrants with wage employment (which is the majority). Almost 70% earn less than 300 baht (around $8) and only about 2% of the migrants would earn around $20 per day, which would roughly correspond with the level of the new Asian middle class. Around 20% earn less than the minimum wage for Bangkok.
10 | ADB Economics Working Paper Series No. 309

Table 3: Daily Wage Income of Migrants
Daily Wage Income (in baht) Percent<200 19.4201–300 48.8301–400 16.0401–600 11.1601–800 2.5>800 2.3Median of Wage Income 264.29Mean Wage Income 350.45Minimum Wage, Bangkok Area, 2010 206
Source: DFG Bangkok Migrant Survey (2010).
Table 4 presents the results regarding the employment quality proxy and the employment quality index. It shows that over 77% of the migrants judged that their working conditions had improved since their last job. Looking at the index, migrants at first glance seem to have improved their conditions since they left their village. However, the picture is bleaker when looking at some indicators of social protection. For example, almost 70% of migrants do not have any written work contract and only less than one-fourth have an unlimited written contract. Also, only 21% have a private insurance contract in addition to the government-provided health schemes.
Table 4: Employment Quality Proxy and Employment Quality Index: Selected Indicators for Migrants’ Working and Living Conditions
Number Indicator Percent
Employment Quality Proxy
I. Working conditions improved since last job 80
Employment Quality Index:
I. Working conditions improved since last job 80
II. Living conditions improved since leaving the rural area
67
III. Feels better off than last year 59
IV. Written and unlimited work contract 24
V. Migrant reports stable income 60
VI. Income above mean 40
VII. Have savings 80
VIII. Private Insurance contract 21
Source: DFG Bangkok Migrant Survey (2010).
Rural-Urban Migration and Employment Quality: A Case Study from Thailand | 11
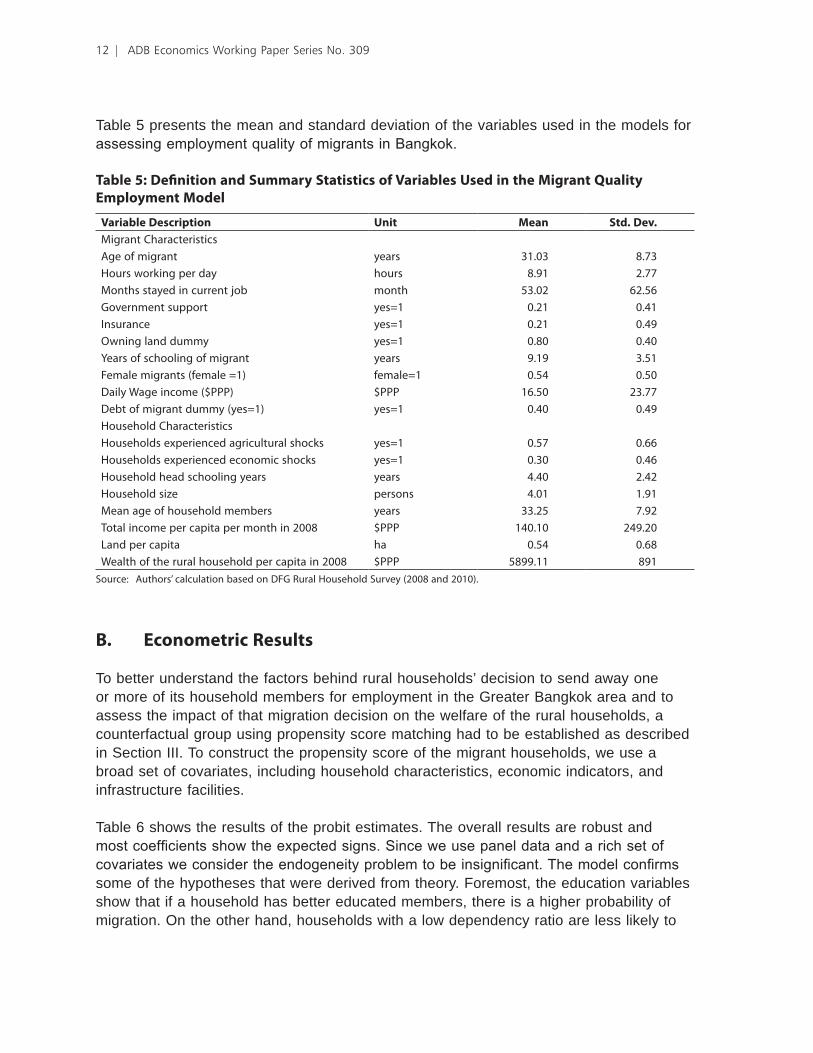
Table 5 presents the mean and standard deviation of the variables used in the models for assessing employment quality of migrants in Bangkok.
Table 5: Definition and Summary Statistics of Variables Used in the Migrant Quality Employment Model
Variable Description Unit Mean Std. Dev.Migrant CharacteristicsAge of migrant years 31.03 8.73Hours working per day hours 8.91 2.77Months stayed in current job month 53.02 62.56Government support yes=1 0.21 0.41Insurance yes=1 0.21 0.49Owning land dummy yes=1 0.80 0.40Years of schooling of migrant years 9.19 3.51Female migrants (female =1) female=1 0.54 0.50Daily Wage income ($PPP) $PPP 16.50 23.77Debt of migrant dummy (yes=1) yes=1 0.40 0.49Household CharacteristicsHouseholds experienced agricultural shocks yes=1 0.57 0.66Households experienced economic shocks yes=1 0.30 0.46Household head schooling years years 4.40 2.42Household size persons 4.01 1.91Mean age of household members years 33.25 7.92Total income per capita per month in 2008 $PPP 140.10 249.20Land per capita ha 0.54 0.68Wealth of the rural household per capita in 2008 $PPP 5899.11 891
Source: Authors’ calculation based on DFG Rural Household Survey (2008 and 2010).
B. Econometric Results
To better understand the factors behind rural households’ decision to send away one or more of its household members for employment in the Greater Bangkok area and to assess the impact of that migration decision on the welfare of the rural households, a counterfactual group using propensity score matching had to be established as described in Section III. To construct the propensity score of the migrant households, we use a broad set of covariates, including household characteristics, economic indicators, and infrastructure facilities.
Table 6 shows the results of the probit estimates. The overall results are robust and most coefficients show the expected signs. Since we use panel data and a rich set of covariates we consider the endogeneity problem to be insignificant. The model confirms some of the hypotheses that were derived from theory. Foremost, the education variables show that if a household has better educated members, there is a higher probability of migration. On the other hand, households with a low dependency ratio are less likely to
12 | ADB Economics Working Paper Series No. 309

engage in migration. This confirms the typical age pyramid found for rural households in the three provinces with a gap in the age group comprising those 20 to 35 years old (Hardeweg et al. 2012). The household income variable “log total income” is significant and negative, which suggests that one of the motivating factors for migration is poverty. Community variables such as the time needed to reach district or provincial infrastructures are included to assess the push factors that can motivate migration. Two infrastructure variables are negative and significant, one is positive. For example, access to markets and other infrastructures is negative, while access to health care (hospital) is positive. This may indicate that, on one hand, remoteness is not a push factor for migration as such households may have less incentives to leave, while on the other, the prospects of better health care in urban areas could be a pull factor for migration. .
Table 6: Determinants of Migration Decision (Probit estimates)
Variables Coef. Std. ErrFemale headed 0.09 0.07Total number of households members who completed primary school
0.14*** 0.01
Total number of households members who completed secondary school
0.05*** 0.00
Total number of households members who completed above secondary school
0.09*** 0.02
Mean age of the household –0.30*** 0.03Household head schooling 0.02 0.04Dependency ratio –0.09*** 0.03Log total income per capita –0.05*** 0.02Income from Remittance 0.28*** 0.08Time to reach the hospital 0.13** 0.06Time to reach the market –0.23* 0.13Distance to other public infrastructure (log) –0.27*** 0.09Ubon province 0.09 0.10Buriram province –0.05* 0.03Land per capita 0.03 0.04Log-Wealth per Capita –0.01 0.08Households experienced demographic shocks –0.15** 0.06Households experienced health shocks –0.02 0.06Households experienced agricultural shocks 0.04 0.07cons –0.38 0.61LR chi-square (24) 501.58Log likelihood –1178.54R2 0.18N 2096
Note: Household demographics, income, asset and remittance data are from 2008 unless otherwise specified. *** = significant at the 1% level, ** = significant at the 5% level, * = significant at the 10% level.Source: Authors’ calculation based on the DFG Rural Household Survey (2008 and 2010).
Rural-Urban Migration and Employment Quality: A Case Study from Thailand | 13
The migration model suggests that generally it is the poorer households who tend to have migrants. However, migrants tend to have better formal education, which is consistent with the results of Cherdchuchai and Otsuka (2006).
The next question is whether migrants are successful in urban settings and will be able to support their native household.
C. Effects of Migration on Rural Household Well-Being
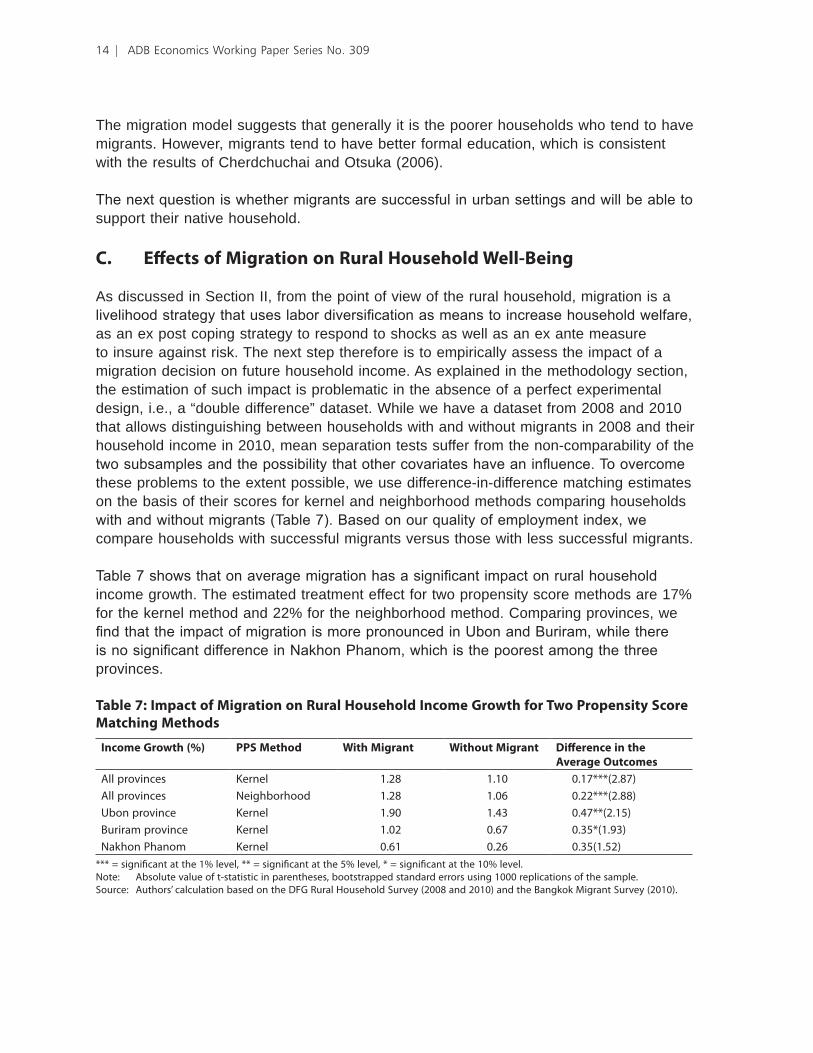
As discussed in Section II, from the point of view of the rural household, migration is a livelihood strategy that uses labor diversification as means to increase household welfare, as an ex post coping strategy to respond to shocks as well as an ex ante measure to insure against risk. The next step therefore is to empirically assess the impact of a migration decision on future household income. As explained in the methodology section, the estimation of such impact is problematic in the absence of a perfect experimental design, i.e., a “double difference” dataset. While we have a dataset from 2008 and 2010 that allows distinguishing between households with and without migrants in 2008 and their household income in 2010, mean separation tests suffer from the non-comparability of the two subsamples and the possibility that other covariates have an influence. To overcome these problems to the extent possible, we use difference-in-difference matching estimates on the basis of their scores for kernel and neighborhood methods comparing households with and without migrants (Table 7). Based on our quality of employment index, we compare households with successful migrants versus those with less successful migrants.
Table 7 shows that on average migration has a significant impact on rural household income growth. The estimated treatment effect for two propensity score methods are 17% for the kernel method and 22% for the neighborhood method. Comparing provinces, we find that the impact of migration is more pronounced in Ubon and Buriram, while there is no significant difference in Nakhon Phanom, which is the poorest among the three provinces.
Table 7: Impact of Migration on Rural Household Income Growth for Two Propensity Score Matching Methods
Income Growth (%) PPS Method With Migrant Without Migrant Difference in the Average Outcomes
All provinces Kernel 1.28 1.10 0.17***(2.87)All provinces Neighborhood 1.28 1.06 0.22***(2.88)Ubon province Kernel 1.90 1.43 0.47**(2.15)Buriram province Kernel 1.02 0.67 0.35*(1.93)Nakhon Phanom Kernel 0.61 0.26 0.35(1.52)
*** = significant at the 1% level, ** = significant at the 5% level, * = significant at the 10% level.Note: Absolute value of t-statistic in parentheses, bootstrapped standard errors using 1000 replications of the sample.Source: Authors’ calculation based on the DFG Rural Household Survey (2008 and 2010) and the Bangkok Migrant Survey (2010).
14 | ADB Economics Working Paper Series No. 309
Taking income growth as criteria, migration on average is a beneficial livelihood strategy for rural households. However, as we can observe from the descriptive analysis above, not all migrants will be engaged in employment activities that enable them to contribute to the well-being of their natal households. Therefore the next question is to assess the impact of a migrant’s employment quality on income growth of her rural household.
D. Determinants of Employment Quality
In addressing the question of employment quality we first identify the factors that are responsible for a migrant’s employment quality. We have used two indicators to describe employment quality—first, the migrant’s subjective assessment on the change of her working conditions as a proxy for employment quality; and second, an employment quality index based on the eight criteria described above.
The first column in Table 8 shows the results of the model for the employment quality proxy, while the second column presents the results for the model for the employment quality index. The first model is an IV probit model. The dependent variable takes the value 1 if the migrant perceives her condition to have improved and 0 otherwise. The second model is a two-stage sequential estimation for the index of quality of employment of migrants. In the first stage, the migration model is estimated and the predicted values for migration are used in the second stage. In Table 8 only the second stage estimates are presented.
For the IV probit model, we can show that the following migrant characteristics significantly increase the chances for better quality employment conditional on migration: the level of migrant’s education, if they have a job with longer working hours per day, and if they received government support. Indebtedness, meanwhile, negatively influences employment quality. Also, characteristics of the natal household observed in 2008 affect the chances of a migrant for better quality employment. Households with relatively higher income have higher odds of migrants finding better employment, while economic shocks have the opposite effect. However, a gender effect could not be detected. The significant positive coefficients of the two provincial dummies suggest that there are regional differences in the probability of finding quality employment.
The model results suggest that migration in 2008, which was the year of the financial and economic crisis, nevertheless was still a good strategy for some households, as migrants were able to find quality employment. This might suggest that the crisis was less severe than initially expected, and that government support might have absorbed some of the negative effects of the crisis.
For the two-step sequential estimate model using the employment index as dependent variable (second column in Table 8), the results of the probit model are largely confirmed except for a few variables. Overall, one could say that if a rural household has a migrant,
Rural-Urban Migration and Employment Quality: A Case Study from Thailand | 15
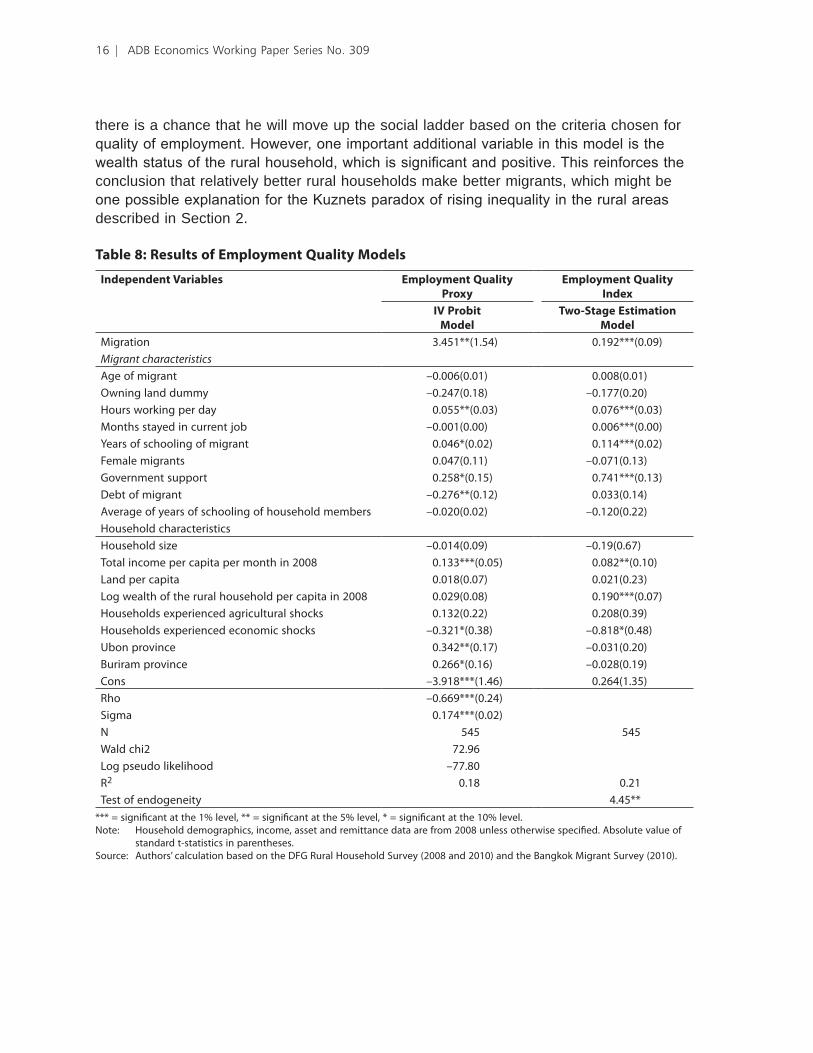
there is a chance that he will move up the social ladder based on the criteria chosen for quality of employment. However, one important additional variable in this model is the wealth status of the rural household, which is significant and positive. This reinforces the conclusion that relatively better rural households make better migrants, which might be one possible explanation for the Kuznets paradox of rising inequality in the rural areas described in Section 2.
Table 8: Results of Employment Quality Models
Independent Variables Employment Quality Proxy
Employment Quality Index
IV Probit Model
Two-Stage Estimation Model
Migration 3.451**(1.54) 0.192***(0.09)Migrant characteristicsAge of migrant –0.006(0.01) 0.008(0.01)Owning land dummy –0.247(0.18) –0.177(0.20)Hours working per day 0.055**(0.03) 0.076***(0.03)Months stayed in current job –0.001(0.00) 0.006***(0.00)Years of schooling of migrant 0.046*(0.02) 0.114***(0.02)Female migrants 0.047(0.11) –0.071(0.13)Government support 0.258*(0.15) 0.741***(0.13)Debt of migrant –0.276**(0.12) 0.033(0.14)Average of years of schooling of household members –0.020(0.02) –0.120(0.22)Household characteristicsHousehold size –0.014(0.09) –0.19(0.67)Total income per capita per month in 2008 0.133***(0.05) 0.082**(0.10)Land per capita 0.018(0.07) 0.021(0.23)Log wealth of the rural household per capita in 2008 0.029(0.08) 0.190***(0.07)Households experienced agricultural shocks 0.132(0.22) 0.208(0.39)Households experienced economic shocks –0.321*(0.38) –0.818*(0.48)Ubon province 0.342**(0.17) –0.031(0.20)Buriram province 0.266*(0.16) –0.028(0.19)Cons –3.918***(1.46) 0.264(1.35)Rho –0.669***(0.24)Sigma 0.174***(0.02)N 545 545Wald chi2 72.96Log pseudo likelihood –77.80R2 0.18 0.21Test of endogeneity 4.45**
*** = significant at the 1% level, ** = significant at the 5% level, * = significant at the 10% level.Note: Household demographics, income, asset and remittance data are from 2008 unless otherwise specified. Absolute value of
standard t-statistics in parentheses.Source: Authors’ calculation based on the DFG Rural Household Survey (2008 and 2010) and the Bangkok Migrant Survey (2010).
16 | ADB Economics Working Paper Series No. 309
E. Impact of Quality Employment on Rural Household Well-Being2
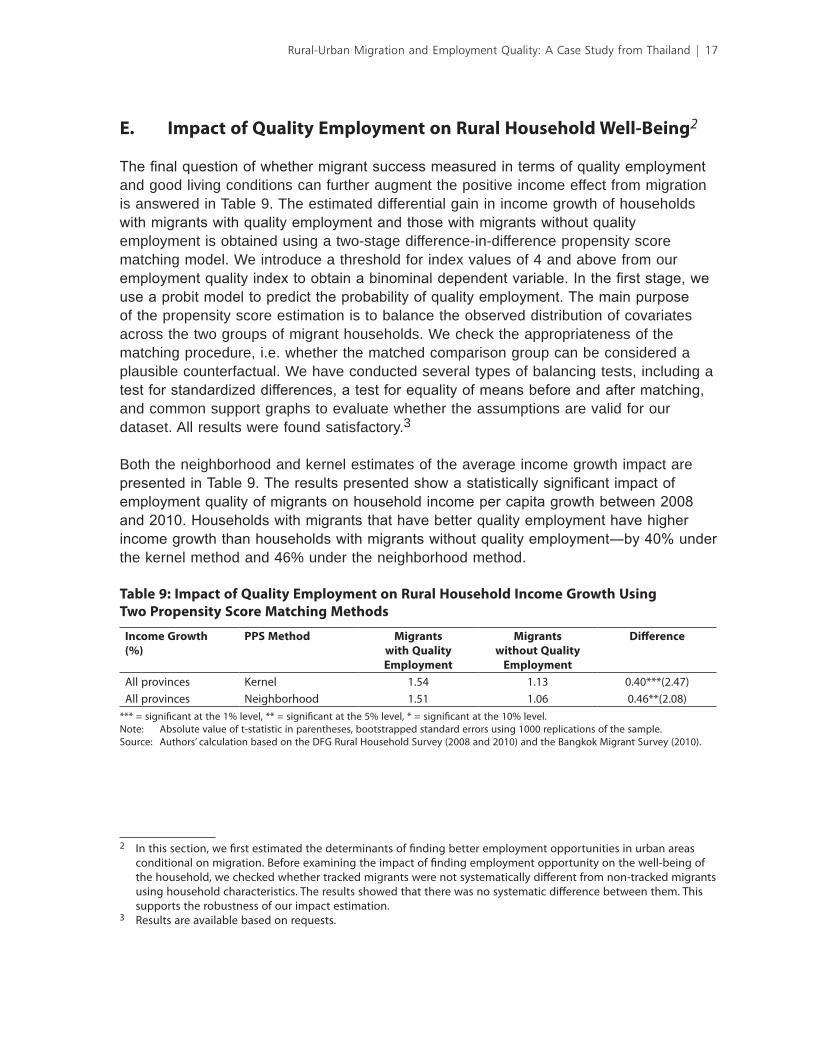
The final question of whether migrant success measured in terms of quality employment and good living conditions can further augment the positive income effect from migration is answered in Table 9. The estimated differential gain in income growth of households with migrants with quality employment and those with migrants without quality employment is obtained using a two-stage difference-in-difference propensity score matching model. We introduce a threshold for index values of 4 and above from our employment quality index to obtain a binominal dependent variable. In the first stage, we use a probit model to predict the probability of quality employment. The main purpose of the propensity score estimation is to balance the observed distribution of covariates across the two groups of migrant households. We check the appropriateness of the matching procedure, i.e. whether the matched comparison group can be considered a plausible counterfactual. We have conducted several types of balancing tests, including a test for standardized differences, a test for equality of means before and after matching, and common support graphs to evaluate whether the assumptions are valid for our dataset. All results were found satisfactory.3
Both the neighborhood and kernel estimates of the average income growth impact are presented in Table 9. The results presented show a statistically significant impact of employment quality of migrants on household income per capita growth between 2008 and 2010. Households with migrants that have better quality employment have higher income growth than households with migrants without quality employment―by 40% under the kernel method and 46% under the neighborhood method.
Table 9: Impact of Quality Employment on Rural Household Income Growth Using Two Propensity Score Matching Methods
Income Growth(%)
PPS Method Migrants with Quality Employment
Migrants without Quality
Employment
Difference
All provinces Kernel 1.54 1.13 0.40***(2.47)All provinces Neighborhood 1.51 1.06 0.46**(2.08)
*** = significant at the 1% level, ** = significant at the 5% level, * = significant at the 10% level.Note: Absolute value of t-statistic in parentheses, bootstrapped standard errors using 1000 replications of the sample.Source: Authors’ calculation based on the DFG Rural Household Survey (2008 and 2010) and the Bangkok Migrant Survey (2010).
2 In this section, we first estimated the determinants of finding better employment opportunities in urban areas conditional on migration. Before examining the impact of finding employment opportunity on the well-being of the household, we checked whether tracked migrants were not systematically different from non-tracked migrants using household characteristics. The results showed that there was no systematic difference between them. This supports the robustness of our impact estimation.
3 Results are available based on requests.
Rural-Urban Migration and Employment Quality: A Case Study from Thailand | 17
VI. Conclusions and Policy Recommendations
This study presents empirical evidence on the effects of rural–urban migration for economic development in Thailand using a panel database of some 2,000 rural households in three provinces from Northeast Thailand and a migrant tracking survey in the Greater Bangkok area conducted in 2010.
The data were analyzed by means of selected descriptive statistics from the migrant survey and two econometric models. The descriptive statistics provide some information on the reasons for migration and their living and employment conditions. A probit model was developed to help identify the factors that make rural households in Thailand decide in favor of or against the migration of one or more of their household members. We also built a model that specifically looks at the quality of employment of migrants, identifying the factors behind a migrant’s relative success in terms of employment quality and living conditions. To achieve this objective, we have defined two different variables―a binary variable that measures short-term improvements in migrant conditions over their previous employment and an employment quality index consisting of eight indicators. Finally, a difference-in-difference treatment effects model with a propensity score matching estimator was used to assess the income effect of migration and migration success on the welfare of rural households.
Summarizing the results of this study, a number of interesting points are found that can improve our understanding on the role of migration for development:
(i) The decision of a rural household in Northeast Thailand to send one or more members for work or education to the Bangkok metropolitan area is strongly related to household characteristics. Generally, it is rural households with lower resource endowments that send mostly younger family members away for work in the Greater Bangkok area. Also, there seem to be strong push factors of migration embedded in poor access to social and physical infrastructure at district or provincial levels. Most importantly and consistent with previous studies, education is an important factor. Clearly, it is the more educated people who migrate, though this must be judged against the overall low quality of education among most of the rural population in Thailand.
(ii) Employment quality and relative improvement in migrants’ conditions are affected by both characteristics of the migrant and of the native household. Once again, education of the migrant along with economic conditions of the rural household is decisive. The two models set up to explain migration success rather consistently show that it is in the better rural households with the relatively better educated migrants where migrants’ chances of obtaining better quality employment are higher.
18 | ADB Economics Working Paper Series No. 309
(iii) In general, migration is positive for the well-being of the rural household. The income of rural households with migrants grows faster than that of households without migrants. We find significant average treatment effects of migration on the growth of per capita income of the rural household ranging from 17% to 22%. Disaggregating the results by province reveals that for the poorest province, the effect of migration is insignificant.
(iv) Migrant success also means stronger positive welfare effects for natal rural households. The impact on income growth between 2008 and 2010 was 40% higher if the migrant had been above average in terms of an index that includes eight indicators of employment quality and living circumstances in the urban environment.
(v) The information obtained from the migrant survey also provides some evidence that there is a need to review social protection policies for urban migrants. As most migrants do not have written employment contracts, legal protection is low. Also, since only a small proportion of the migrants have insurance contracts, health service is still an issue as it is not always clear to what the extent they are covered by the government schemes given that they are often registered in their natal village.
The study prompts some conclusions that might be useful for policy design and implementation. Most but not all rural households in Northeast Thailand do have migrant members. There is a certain profile that one can attribute to migrant households. They tend to be the ones who rely on remittances and therefore, are not likely to see much future in developing agricultural sources of livelihood. They tend to send the more educated household members away, though this must be seen against the background of generally poor quality education in the rural areas. Among households with migrants, the better ones tend to have more successful migrants, such that migration ultimately has a tendency to increase inequality. In fact, this may provide some explanation for why the decline of poverty in some rural areas is unequal within the rural areas and overall much slower in rural than in urban areas (Warr 2001). In other words, migration seems to do little to narrow the urban–rural divide. The fact that the impact among the three provinces differs, with the poorest province not significantly gaining, underlines this fact. Additional geographic or administrative differentiation might further sharpen this picture.
In terms of policy recommendations, two aspects seem to emerge from these results. First, the Thai government should pay more attention to education quality in the rural areas. Based on anecdotal evidence, the current scheme of adult education, which is popular among the poor since eventually everyone can get a high school degree (M-6 level), raises some doubts regarding its quality. The second recommendation runs along the same lines as the first one. On paper, the Thai government may have introduced health insurance, pension schemes, allowances, etc., but the question is to what extent these are really implemented. For example, if a person is not formally employed (e.g., in a household or a small or medium-sized enterprise) and not backed by a legally binding written contract, then social protection schemes may not be as effective as intended.
Rural-Urban Migration and Employment Quality: A Case Study from Thailand | 19
References Beegle, K., J.D. Weerdt, and S. Dercon, 2008. “Migration and Economic Mobility in Tanzania
- Evidence from a Tracking Survey.” Policy Research Working Paper 4798, World Bank, Washington, D.C.
Bilsborrow, R., T. McDevitt, S. Kossoudji, and R. Fuller, 1987. “The Impact of Origin Community Characteristics on Rural–Urban Out-Migration in a Developing Country.” Demography 24(2):191–210.
Brown, R., and E. Jimenez, 2008. “Estimating the Net Effects of Migration and Remittances on Poverty and Inequality Comparison of Fiji and Tonga.” Journal of International Development 20(4):547–571.
Cameron, A.C., and P.K. Trivedi, 2010. Microeconometrics using Stata. Revised edition. College Station, Texas: Stata Press.
Cherdchuchai, S., and K. Otsuka, 2006. “Rural Income Dynamics and Poverty Reduction in Thai Villages from 1987 to 2004.” Agricultural Economics 35(3):409–423.
Goedecke, T., and H. Waibel, 2011. “Rural–Urban Transformation and Village Economy in Emerging Market Economies during Economic Crisis: Empirical Evidence from Thailand.” Cambridge Journal of Regions, Economy and Society 4(2):205–219.
Hagen-Zanker, J., 2008. “Why Do People Migrate? A Review of the Theoretical Literature.” Working Paper No. 2008/WP002, Maastricht Graduate School of Governance, Maastricht.
Healy, A.J., and S. Jitsuchon, 2007. “Finding the Poor in Thailand.” Journal of Asian Economics 18(3):739–759.
Hardeweg, B., S. Klasen, and H. Waibel, forthcoming 2012. “Establishing a Database for Vulnerability Assessment.” In S. Klasen and H. Waibel, eds., Vulnerability to Poverty-Theory, Measurement, and Determinants. Palgrave Macmillan.
Harris, J. R., and M.P. Todaro, 1970. “Migration, Unemployment and Development: A Two-Sector Analysis.” American Economic Review 60(1):126–142.
Heckman, J., and S. Navarro-Lozano, 2004. “Using Matching, Instrumental Variables and Control Functions to Estimate Economic Choice Models.” Review of Economics and Statistics 86(1):30–57.
Kuznets, S., 1955. “Economic Growth and Income Inequality.” American Economic Review 45(1):1–28.
Lipton, M., 1980. “Migration from Rural Areas of Poor Countries: The Impact on Rural Productivity and Income Distribution.” World Development 8(1):1–24
Lucas, R.E., 2004. “Life Earnings and Rural–Urban Migration.” Journal of Political Economy 112(1):S29-S59.
Massey, D. S., 1990. “Social Structure, Household Strategies, and Cumulative Causation of Migration.” Population Index 56(1):3–26.
Mills, M.B., 1999. Thai Women in the Global Labor Force: Consuming Desires, Contested Selves. New Brunswick: Rutgers University Press.
National Statistics Office Thailand (NSO), 2008. The 2008 Migration Survey. Bangkok: National Statistics Office Thailand.
Phongpaichit, P., S. Piriyarangsan, and N. Treerat, 1998. Guns, girls, gambling and ganja: Thailand’s illegal economy and public policy. Chiangmai: Silkworm Books.
Rindfuss, R.R., A. Jampaklay, B. Entwisle, Y. Sawangdee, K. Faust, and P. Prasartkul, 2004. “The Collection and Analysis of Social Network Data in Nang Rong, Thailand.” In M. Morris, ed., Network Epidemiology: A Handbook for Survey Design and Data Collection. Oxford, England: Oxford University Press.
Rodriguez, E.R., 1998. “International Migration and Income Distribution in the Philippines.” Economic Development and Cultural Change 46(2):329–350.
20 | ADB Economics Working Paper Series No. 309
Rosenbaum, P.R., and D.B. Rubin, 1983. “The Central Role of the Propensity Score in Observational Studies for Causal Effects.” Biometrika 70(1):41–55.
Shen, I., F. Docquier, and H. Rapoport, 2010. “Remittance and Inequality: A Dynamic Migration Model.” Journal of Economic Inequality 8(2):197–220.
Smith, J.A., and P. E. Todd, 2005. “Does Matching Overcome LaLonde’s Critique of Experimental Estimators?” Journal of Econometrics 125(1–2):305–353.
Sjaastad, L.A., 1962. “The Costs and Returns of Human Migration.” Journal of Political Economy 70(5):80–93.
Todaro, M.P., and L. Maruszko, 1987. “Illegal Migration and US Immigration Reform: A Conceptual Framework.” Population and Development Review 13(1):101–114.
Taylor, J. E., and P. L. Fletcher, 2007. Remittances and Development in Mexico Part One: The New Labor Economics of Migration: A Critical Review. In P.L. Fletcher, ed., Rural Mexico Research Review. Davis: University of California.
Yap, M.T., 2002. “Population Ageing in the ASEAN Countries” Quarterly Journal of the International Institute on Ageing 12(2):3–13.
Warr, P., 2001. “Poverty Reduction and Economic Growth: The Asian Experience.” Paper presented at the Asia and Pacific Forum on Poverty: Reforming Policies and Institutions for Poverty Reduction, 5-9 February, Asian Development Bank, Manila, Philippines.
World Bank, 2007. World Development Report 2008: Agriculture for Development. Washington, D.C: The World Bank.
Rural-Urban Migration and Employment Quality: A Case Study from Thailand | 21
About the PaperThis study uses a panel database of rural households in Thailand collected from 2008–2010 to investigate the effects of rural–urban migration on economic development. One finding is that social protection policies for the rural poor in Thailand may be less effective for urban migrants. Another is that while migration increases income growth among rural households, it is less effective in reducing inequality and relative poverty in rural areas.
About the Asian Development BankADB’s vision is an Asia and Pacific region free of poverty. Its mission is to help its developing member countries reduce poverty and improve the quality of life of their people. Despite the region’s many successes, it remains home to two-thirds of the world’s poor: 1.8 billion people who live on less than $2 a day, with 903 million struggling on less than $1.25 a day. ADB is committed to reducing poverty through inclusive economic growth, environmentally sustainable growth, and regional integration. Based in Manila, ADB is owned by 67 members, including 48 from the region. Its main instruments for helping its developing member countries are policy dialogue, loans, equity investments, guarantees, grants, and technical assistance.
Asian Development Bank6 ADB Avenue, Mandaluyong City1550 Metro Manila, Philippineswww.adb.org/economicsISSN: 1655-5252Publication Stock No. WPS124706
April 2012
Printed on recycled paper Printed in the Philippines
< 0 1 2 4 7 0 6 0 >