Embed Size (px)
Citation preview
IEEE TRANSACTIONS ON BIOMEDICAL ENGINEERING, VOL. 47, NO. 6, JUNE 2000 773
Adaptive Time-Frequency Analysis of KneeJoint Vibroarthrographic Signals for Noninvasive
Screening of Articular Cartilage PathologySridhar Krishnan, Member, IEEE, Rangaraj M. Rangayyan*, Senior Member, IEEE, G. Douglas Bell, and
Cyril B. Frank
Abstract—Vibroarthrographic (VAG) signals emitted by humanknee joints are nonstationary and multicomponent in nature; time-frequency distributions (TFD’s) provide powerful means to ana-lyze such signals. The objective of this paper is to construct adap-tive TFD’s of VAG signals suitable for feature extraction. An adap-tive TFD was constructed by minimum cross-entropy optimizationof the TFD obtained by the matching pursuit decomposition algo-rithm. Parameters of VAG signals such as energy, energy spread,frequency, and frequency spread were extracted from their adap-tive TFD’s. The parameters carry information about the combinedTF dynamics of the signals. The mean and standard deviation ofthe parameters were computed, and each VAG signal was repre-sented by a set of just six features. Statistical pattern classificationexperiments based on logistic regression analysis of the parametersshowed an overall normal/abnormal screening accuracy of 68.9%with 90 VAG signals (51 normals and 39 abnormals), and a higheraccuracy of 77.5% with a database of 71 signals with 51 normalsand 20 abnormals of a specific type of patellofemoral disorder. Theproposed method of VAG signal analysis is independent of jointangle and clinical information, and shows good potential for non-invasive diagnosis and monitoring of patellofemoral disorders suchas chondromalacia patella.
Index Terms—Cartilage pathology, joint sounds, matching pur-suit, time-frequency analysis, vibroarthrography.
I. INTRODUCTION
V IBROARTHROGRAPHY (VAG), the recording of humanknee joint vibration or acoustic signals during active
movement of the leg, can be used as a noninvasive diagnostictool to detect articular cartilage degeneration. The currentlyused “gold standard” for assessment of cartilage surface degen-eration is arthroscopy, where the cartilage surface is inspectedwith a fiber-optic cable. The disadvantage with arthroscopy isthat it cannot be applied to patients whose knees are in a highlydegenerated state due to osteoarthritis, ligamentous instability,meniscectomy, or patellectomy. Imaging-based noninvasivetechniques such as X-ray imaging, computed tomography (CT),
Manuscript received July 1, 1999; revised February 2, 2000. This work wassupported by the Alberta Heritage Foundation for Medical Research and theArthritis Society of Canada.Asterisk indicates corresponding author.
S. Krishnan is with the Department of Electrical and Computer Engineering,Ryerson Polytechnic University, Toronto, ON, M5B 2K3, Canada.
*R. M. Rangayyan is with the Departments of Electrical and Computer En-gineering and Surgery, University of Calgary, 2500 University Drive, N.W. Cal-gary, AB, T2N 1N4, Canada (e-mail: [email protected]).
G. D. Bell and C. B. Frank are with the Departments of Electrical and Com-puter Engineering and Surgery and the Sport Medicine Centre, University ofCalgary, Calgary, AB, T2N 1N4, Canada.
Publisher Item Identifier S 0018-9294(00)04413-X.
and magnetic resonance imaging (MRI) can capture only grosscartilage defects, and may not be useful for early detection ofcartilage pathology. The drawbacks with arthroscopy and thelimitations of imaging techniques have motivated researchersto look for alternative tools such as VAG.
The diagnostic potential of knee joint sounds in noninva-sively characterizing articular cartilage disorders was first re-ported by Blodgett [1] in 1902. The first measurement of VAGwas reported by Erb in 1933 [2]. Since then significant progresshas been made in data-acquisition setup and signal processing[3]–[8], adaptive cancellation of muscle interference from theVAG signal [9], localization of sound source and pathology [10],and parametric representation and screening of VAG signals[11]–[13].
The important characteristics of VAG signals are summarizedas follows.
• VAG signals are nonstationary due to the fact that thequality of joint surfaces coming in contact may not be thesame from one angular position (point of time) to anotherduring articulation of the joint.
• The cartilage surfaces of a normal knee are smooth andslippery. Vibrations generated due to friction between thearticulating surfaces of degenerated cartilage are expectedto be different in amplitude and frequency from those ofnormal knees. Identification of such frequency dynamicsmay help in classification of normal and abnormal knees.
• The VAG signal is expected to be a multicomponentsignal due to the possibility that, during movement of theknee, the rubbing of the femoral condyle on the (possiblynonuniform) surface of the patella provides multiplesources of vibration. Further, the signal from a singlesource can propagate through different channels of tissueto the mid-patella (recording) position, thus giving rise tomultiple-energy components at different frequencies fora given joint angle (or time).
• Although the accelerometer sensor placed at themid-patella position has excellent immunity to back-ground noise, random noise is expected to combine withthe VAG signal during leg movement and data acquisition.The range of the signal-to-noise ratio (SNR) of VAGsignals is not knowna priori.
From the characteristics of VAG signals listed above, one couldobserve that VAG signals cannot be easily analyzed by commonsignal processing techniques such as the Fourier transform.
0018–9294/00$10.00 © 2000 IEEE
774 IEEE TRANSACTIONS ON BIOMEDICAL ENGINEERING, VOL. 47, NO. 6, JUNE 2000
Also, techniques such as autoregressive (AR) modeling cannotaccurately characterize a nonstationary signal. To overcomethese difficulties, a nonstationary signal analysis tool such as ajoint time-frequency distribution (TFD) could be used.
II. M OTIVATION
Previous approaches tackled the nonstationarity of VAG sig-nals by adaptively segmenting the signals into stationary parts[7], [11], [12]; each segment was parametrically representedusing a separate set of AR model coefficients, dominant poles,or cepstral coefficients. Dominant poles (corresponding to dom-inant spectral peaks in the signal) of each segment have pro-vided good discriminant information for classifying signals intonormal and abnormal groups [13], validating the assumptionthat the spectral envelope and resonant frequency characteristicsof abnormal VAG signals differ from those of normal signals.
A major drawback of the segmentation-based techniquelies in associating the clinical information obtained duringarthroscopy or auscultation with the segments of the corre-sponding VAG signal. It is extremely difficult to accuratelydefine joint angles intraoperatively due to the presence ofdrapes, equipment, etc. Further, it is difficult to assess actualpoints of cartilage contact during load on the joint, sincearthroscopy, by design, is performed in an unloaded positionwith the scope inserted between the joint surfaces. Also,visualization of a cartilage defect or injury is achieved when itis not in contact with the corresponding articulating surface;when contact is made, the defect is out of view. The angleestimated is a best guess by extrapolating from the arthroscopicvisualization the probable joint angle at which contact betweenthe cartilage surfaces under consideration is maximal. Theseproblems combine to make the estimation of joint anglerelated to contact of specific cartilage positions very difficult.Segmentation and joint angle estimation may be avoided byusing true nonstationary signal analysis tools such as TFD’s.
The right TFD for VAG signals would be one that can givean accurate display of VAG characteristics with reasonable TFresolution and cross-term suppression, and can emphasize inthe TF plane the expected characteristics of VAG signals. SuchTFD’s could be later used for automatic feature extraction andidentification applications.
III. D ATA ACQUISITION
Each subject sat on a rigid table in a relaxed position with theleg being tested freely suspended in air. The VAG signal wasrecorded by placing an accelerometer at the mid-patella posi-tion of the knee as the subject swung the leg over an approximateangle range of 135 0 135 in 4s. The mid-patella posi-tion has been shown by Ladlyet al.[14] to be a reproducible lo-cation. Informed consent was obtained from every subject. Theexperimental protocol has been approved by the Conjoint HealthResearch Ethics Board of the University of Calgary.
The VAG signal was prefiltered (10 Hz to 1 kHz) and ampli-fied before digitizing at a sampling rate of 2 kHz. The details ofdata acquisition may be found in Krishnanet al. [12]. The data-base consists of 90 signals (51 normal and 39 abnormal). The ab-normal signals were collected from symptomatic patients sched-
uled to undergo arthroscopy. There was no restriction imposedon the type of pathology, and the abnormal signals include chon-dromalacia of different grades at the patella, meniscal tear, tibialchondromalacia, and anterior cruciate ligament injuries (as con-firmed during arthroscopic examination).
IV. DESIREDCHARACTERISTICS OFTFD’s
If is a signal and is its joint TFD, then theimportant criteria that the TFD is expected to satisfy are as listedbelow [15]:
• C1—Total Energy:, where is the Fourier transform of
. This criterion indicates that at a particularandgives the fractional energy of the signal.
Further, may be viewed as a two-dimensionalprobability density function (PDF), with and consid-ered to be random variables.
• C2—Invariance:The TFD should be invariant to linearshifts in time and frequency. In most cases it is alsoexpected that the TFD is scale-invariant. The invariancecriterion helps in understanding the TF localization, andhelps in extracting meaningful features.
• C3—Positivity:For a TFD to be positive, it is required thatfor all and . The positivity criterion
helps in treating the TFD as a PDF. If a TFD possessesnegative values, it could pose severe interpretation prob-lems, and may not be suitable for objective feature extrac-tion and identification purposes.
• C4—Marginals: The interpretation of TFD’s as PDF’shelps in extracting the marginal distributions by inte-grating either in the time or the frequency direction.Integration along frequency gives the instantaneousenergy of the signal: .Integration along time gives the power spectral density ofthe signal: .
• C5—Global Expectation Values:Global expecta-tion values may give an idea about signal behaviorat a particular time and frequency.
.expresses a generalized moment of a TFD.
The function is chosen according to the desiredmoment.
• C6—Local Expectation Values:Local expectation valuesmay be obtained by applying the expectation operator withrespect to time or frequency, and help in tracking non-stationary features such as instantaneous frequency andgroup delay of a signal. The instantaneous mean frequencyis given by the time-varying first moment of the TFD alongfrequency
The group delay is given as the frequency-varying firstmoment of the TFD along time
KRISHNAN et al.: ADAPTIVE TIME-FREQUENCY ANALYSIS OF KNEE JOINT VAG SIGNALS 775
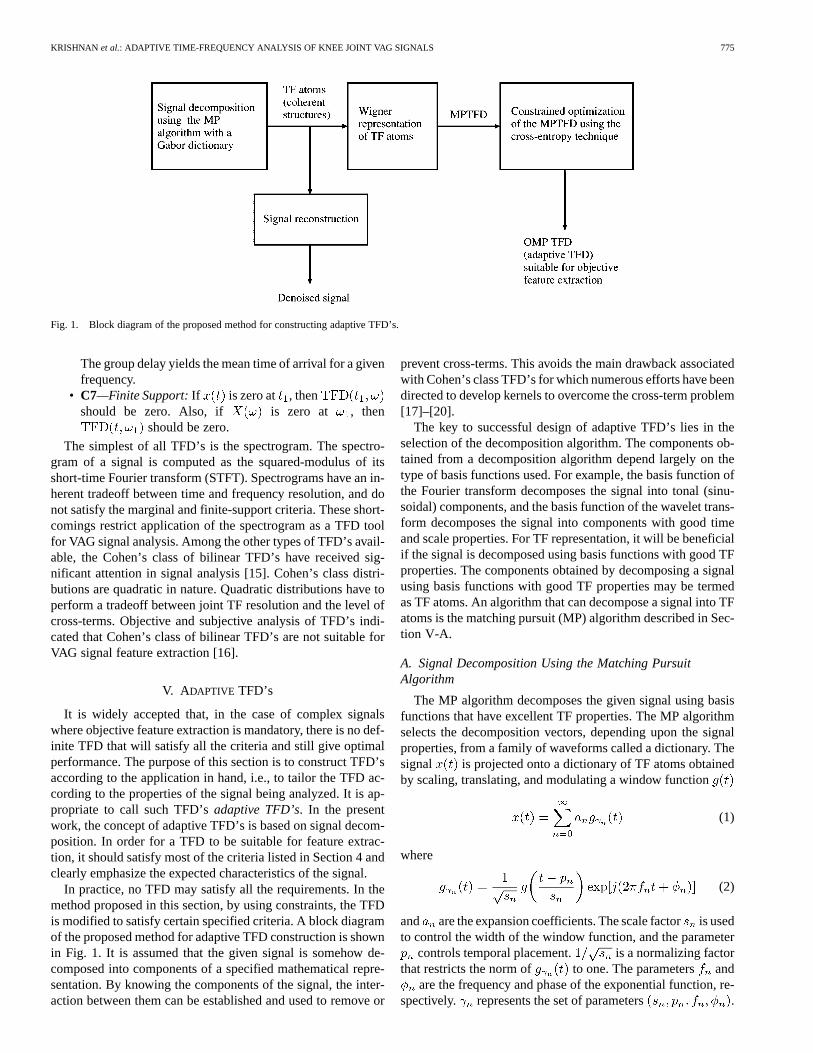
Fig. 1. Block diagram of the proposed method for constructing adaptive TFD’s.
The group delay yields the mean time of arrival for a givenfrequency.
• C7—Finite Support:If is zero at , thenshould be zero. Also, if is zero at , then
should be zero.
The simplest of all TFD’s is the spectrogram. The spectro-gram of a signal is computed as the squared-modulus of itsshort-time Fourier transform (STFT). Spectrograms have an in-herent tradeoff between time and frequency resolution, and donot satisfy the marginal and finite-support criteria. These short-comings restrict application of the spectrogram as a TFD toolfor VAG signal analysis. Among the other types of TFD’s avail-able, the Cohen’s class of bilinear TFD’s have received sig-nificant attention in signal analysis [15]. Cohen’s class distri-butions are quadratic in nature. Quadratic distributions have toperform a tradeoff between joint TF resolution and the level ofcross-terms. Objective and subjective analysis of TFD’s indi-cated that Cohen’s class of bilinear TFD’s are not suitable forVAG signal feature extraction [16].
V. ADAPTIVE TFD’s
It is widely accepted that, in the case of complex signalswhere objective feature extraction is mandatory, there is no def-inite TFD that will satisfy all the criteria and still give optimalperformance. The purpose of this section is to construct TFD’saccording to the application in hand, i.e., to tailor the TFD ac-cording to the properties of the signal being analyzed. It is ap-propriate to call such TFD’sadaptive TFD’s. In the presentwork, the concept of adaptive TFD’s is based on signal decom-position. In order for a TFD to be suitable for feature extrac-tion, it should satisfy most of the criteria listed in Section 4 andclearly emphasize the expected characteristics of the signal.
In practice, no TFD may satisfy all the requirements. In themethod proposed in this section, by using constraints, the TFDis modified to satisfy certain specified criteria. A block diagramof the proposed method for adaptive TFD construction is shownin Fig. 1. It is assumed that the given signal is somehow de-composed into components of a specified mathematical repre-sentation. By knowing the components of the signal, the inter-action between them can be established and used to remove or
prevent cross-terms. This avoids the main drawback associatedwith Cohen’s class TFD’s for which numerous efforts have beendirected to develop kernels to overcome the cross-term problem[17]–[20].
The key to successful design of adaptive TFD’s lies in theselection of the decomposition algorithm. The components ob-tained from a decomposition algorithm depend largely on thetype of basis functions used. For example, the basis function ofthe Fourier transform decomposes the signal into tonal (sinu-soidal) components, and the basis function of the wavelet trans-form decomposes the signal into components with good timeand scale properties. For TF representation, it will be beneficialif the signal is decomposed using basis functions with good TFproperties. The components obtained by decomposing a signalusing basis functions with good TF properties may be termedas TF atoms. An algorithm that can decompose a signal into TFatoms is the matching pursuit (MP) algorithm described in Sec-tion V-A.
A. Signal Decomposition Using the Matching PursuitAlgorithm
The MP algorithm decomposes the given signal using basisfunctions that have excellent TF properties. The MP algorithmselects the decomposition vectors, depending upon the signalproperties, from a family of waveforms called a dictionary. Thesignal is projected onto a dictionary of TF atoms obtainedby scaling, translating, and modulating a window function
(1)
where
(2)
and are the expansion coefficients. The scale factoris usedto control the width of the window function, and the parameter
controls temporal placement. is a normalizing factorthat restricts the norm of to one. The parameters and
are the frequency and phase of the exponential function, re-spectively. represents the set of parameters .
776 IEEE TRANSACTIONS ON BIOMEDICAL ENGINEERING, VOL. 47, NO. 6, JUNE 2000
In the present work, the window is a Gaussian function, i.e.,; the TF atoms are then called Gabor
atoms, and provide optimal TF resolution in the TF plane.In practice, the algorithm works as follows. The signal is it-
eratively projected onto a Gabor function dictionary. The firstprojection decomposes the signal into two parts
(3)
where denotes the inner product (projection) ofwith the first TF atom . The term is the residueafter approximating in the direction of . This processis continued by projecting the residue onto the subsequent func-tions in the dictionary, and after iterations
(4)
with . There are two ways of stopping the itera-tive process: one is to use a prespecified limiting numberofthe TF atoms, and the other is to check the energy of the residue
. A high value of and a zero value for the residualenergy will decompose the signal completely at the expense ofincreased computation. In this work, decomposition is stoppedafter extracting the first coherent structures of the signal, de-termined using a decay parameter [21]
(5)
In (5), denotes the residual energy level at theth iter-ation. The decomposition is continued until the decay parameterdoes not reduce any further. At this stage, the selected compo-nents represent coherent structures and the residue representsincoherent structures in the signal with respect to the dictionary.The residue may be assumed to be due to random noise, sinceit does not show any TF localization. The signal reconstructedusing coherent structures, i.e.,
(6)
will denote the MP-denoised version of the original signal.
B. Matching Pursuit TFD
A signal-decomposition-based TFD may be obtained bytaking the Wigner–Ville distribution (WVD) of the TF atomsin (6), and is given as [21]
(7)
where is the WVD of the Gaussian windowfunction. The double sum corresponds to the cross-terms of the
WVD indicated by , and should be rejectedin order to obtain a cross-term-free energy distribution ofin the TF plane. Thus, only the first term is retained, and theresulting TFD is given by
(8)
This cross-term-free TFD, from now on referred to as thematching pursuit TFD (MPTFD), has very good readability andis appropriate for analysis of nonstationary, multicomponentsignals. The extraction of coherent structures makes MP anattractive tool for TF representation of signals with unknownSNR.
As the adaptive TFD is constructed using the WVD of TFatoms, most of the properties of the WVD are applicable toMPTFD’s.
• They satisfy the total energy requirement. This is because, where
is the energy of the normalized Gaussian functions.(The subscript has been dropped as the expressionis valid for all .)
• The MPTFD is always a positive distribution. This is be-cause the TFD is free of cross-terms, and the Wigner distri-bution of a Gaussian function is always a positive quantity[15].
• The MPTFD does not satisfy the marginal prop-erties. That is, and
.In terms of the other properties, the MPTFD behaves similar tothe WVD.
If a TFD is positive and satisfies the marginals, it may be con-sidered to be a proper TFD for feature extraction and identifica-tion applications. This is because positivity coupled with correctmarginals ensures that the TFD is a true PDF, and the parame-ters extracted are meaningful [22]. In Section V-C, a method tomodify the MPTFD to satisfy both the positivity and marginalcriteria is explored.
C. Minimum Cross-Entropy Optimization of the MPTFD
One of the drawbacks of the MPTFD is that it does not satisfythe marginal properties. The MPTFD may be modified to satisfythe marginal requirements, and still preserve its other importantcharacteristics. One way to optimize the MPTFD is by usingthe cross-entropy minimization method [23], [24]. Cross-en-tropy minimization is a general method of inference about anunknown PDF when there exists a prior estimate of the func-tion and new information in the form of constraints on expectedvalues is available. If theoptimizedMPTFD or OMP TFD (anunknown PDF) is denoted by , then it should satisfy themarginals
(9)
and
(10)
KRISHNAN et al.: ADAPTIVE TIME-FREQUENCY ANALYSIS OF KNEE JOINT VAG SIGNALS 777
Equations (9) and (10) may be treated as constraint equations(new information) for optimization. Now, may be ob-tained from (a prior estimate of the function) by min-imizing the cross-entropy between them, given by
(11)
As we are interested only in the marginals, the OMP TFD maybe written as [24]
(12)
where the ’s and ’s are Lagrange multipliers which may bedetermined using the constraint equations. An iterative algo-rithm to obtain the Lagrange multipliers and solve foris presented next.
At the first iteration, we define
(13)
As the marginals are to be satisfied, the time marginal constrainthas to be imposed in order to solve for . By imposing thetime marginal constraint given by (9) on (13), we obtain
(14)
where is the desired time marginal and is the timemarginal estimated from . Now, (13) can be rewrittenas
(15)
At this point, is a modified MPTFD with the desiredtime marginal; however, it may not necessarily have the desiredfrequency marginal . In order to obtain the desired fre-quency marginal, the following equation has to be solved:
(16)
Note that the TFD obtained after the first iterationis used as the incoming estimate in (16). By imposing the fre-quency marginal constraint given by (10) on (16), we obtain
(17)
where is the desired frequency marginal, and is thefrequency marginal estimated from . Now, (17) can berewritten as
(18)
By incorporating the desired marginal constraint, theTFD may be altered and may not necessarily give the desiredtime marginal. Successive iteration could overcome thisproblem and modify the desired TFD to get closer to .This follows from the fact that the cross-entropy between the
desired TFD and the estimated TFD decreases with the numberof iterations [24].
As the iterative procedure is started with a positive distribu-tion , the TFD at the th iteration is guar-anteed to be a positive distribution. Such a class of distribu-tions belongs to the Cohen–Posch class of positive distributions[22]. The OMP TFD’s are adaptive TFD’s because they are con-structed on the basis of the properties of the signal being ana-lyzed.
A method for constructing a positive distribution using thespectrogram asa priori knowledge was developed by Loughlinet al. [25]. The major drawback of using the spectrogram asapriori knowledge is the loss of TF resolution; this effect maybe minimized by taking multiple spectrograms with analysiswindows of different sizes as initial estimates of the desireddistribution. The method proposed in this section starts withthe MPTFD, overcomes the problem of using multiple spectro-grams as initial estimates, and produces a high-resolution TFDtailored to the characteristics of the signal on hand. The OMPTFD may be used to derive higher order moments by estimatingthe higher order Lagrange multipliers. Such measures are notnecessary in the present work, and are beyond the scope of thispaper.
VI. FEATURE EXTRACTION
Time-varying parameters with discriminant information maybe computed from a TFD. Four TF features of interest that arederived from the OMP TFD’s of VAG signals in the presentwork are the energy parameter, the energy spread parameter, thefrequency parameter, and the frequency spread parameter [26].
The energy parameter (EP) was computed as the mean ofalong each time slice, which gives a representation of
energy variation with time
(19)
where is the maximum frequency present in the signal.Signals generated by pathological knees will be time-variant(i.e., they are nonstationary) because of the differences incartilage roughness and nonuniformity. Thus, of anabnormal signal is expected to show large variations with time.Note that may be computed directly from the signal;computation as above from the OMP TFD includes the benefitsof adaptive denoising [27], [28] as only the coherent structuresare retained.
The energy spread parameter (ESP) measures the spread ofenergy over frequency for each time slice. This was computedas the standard deviation of along each time slice
(20)
ESP could be a good feature to analyze multicomponent signals.Abnormal VAG signals generated as a result of friction betweenrough cartilage surfaces may have more components becauseof the nonuniformity of the surfaces, and a high signal energyspread is expected.
778 IEEE TRANSACTIONS ON BIOMEDICAL ENGINEERING, VOL. 47, NO. 6, JUNE 2000
The frequency parameter (FP), also known as the instanta-neous mean frequency (IMF), was computed as the first momentof along each time slice, given by
(21)
FP characterizes the frequency dynamics of the signal. Move-ment of the knee during signal acquisition may cause linear ornonlinear frequency modulation of the signal, with the modula-tion index depending on the state of lubrication, stiffness, androughness of the cartilage surfaces. Pathological knees have lesslubricated and rougher cartilage surfaces than normal knees, andhence the FP of pathological knees is expected to be differentfrom that of normal knees.
The frequency spread parameter (FSP) is given by the secondcentral moment of along each time slice as
(22)
FSP gives the spread of frequency about the mean frequency foreach time instant. The spread of frequency at a time instant couldarise as a result of amplitude modulation. Amplitude modulationis possible in VAG signals, and may be dependent on the qualityand intensity of the sound produced due to joint vibration. FSPcould be a good feature in identifying noisy knees.
The four parameter arrays described above are dependent onthe functional state of the cartilage surfaces in the knee joint, andare expected to be suitable for discriminating pathological kneesfrom normal knees. (The parameters should also assist in devel-oping models for the genesis of VAG signals based on analysisof signals from cadaver knees with controlled lesions createdvia arthroscopy [10]; this is left for future work.) The EP arraycomputed from the OMP TFD denotes the energy waveform ofthe denoised signal. The other parameter waveforms can be esti-mated only via a TFD. Although considerable research has beendevoted toward extracting frequency parameters directly fromthe signal, the frequency parameters so extracted are often bi-ased and pose severe problems in interpretation [29]. This is oneof the reasons for not including higher-moment constraints suchas IMF in minimum cross-entropy optimization of the MPTFDas described in Section V-C.
In order to facilitate a global decision on each signal, the meanand standard deviation of each of the four parameter arrays werecalculated. The mean and standard deviation provide the centraltendency and dispersion measures of the nonstationary param-eters. Each VAG signal was thus represented by eight features.
VII. SCREENING OFVAG SIGNALS BASED ONTF FEATURES
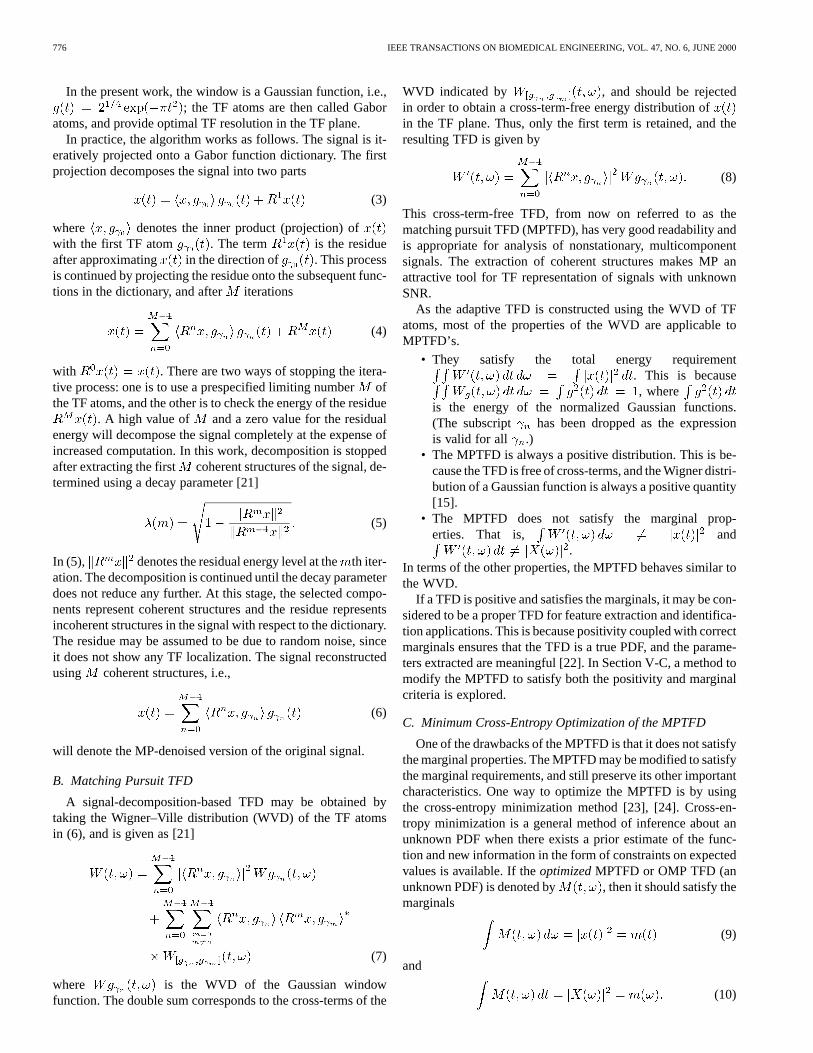
Objective evaluation of different types of TFD’s such as theAR-model-based TFD, Cohen’s class TFD, and the OMP TFDwith synthetic signals of known TF characteristics indicated su-perior performance of the OMP TFD in extracting the requiredfeatures [16]. For the sake of illustration, two VAG signals andtheir OMP TFD’s are considered here. The VAG signal of anormal subject is shown in Fig. 2. The signal denotes a normalnoisy knee with a click and grinding sound heard during aus-cultation. The OMP TFD of the signal is shown in Fig. 3. The
Fig. 2. VAG signal of a normal subject. A click and a grinding soundwere heard during auscultation of the knee.au—arbitrary acceleration units.Sampling rate= 2 kHz.
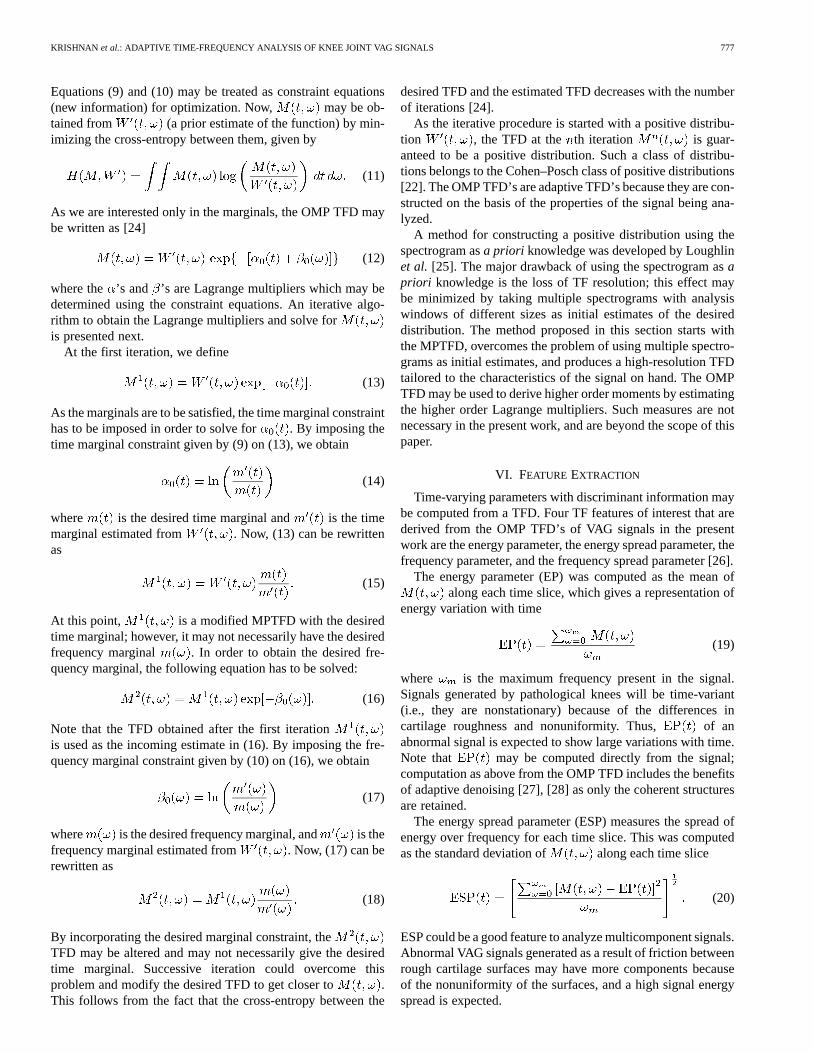
Fig. 3. OMP TFD of the normal VAG signal in Fig. 2.
TFD was constructed using only the coherent structures of thesignal, and the number of TF atoms was 588. The optimizationof the marginals was achieved in two iterations. The click andgrinding sound are shown as high-frequency activities and havebeen represented with good TF localization. The TFD obtainedis a positive distribution, and is free of cross-terms.
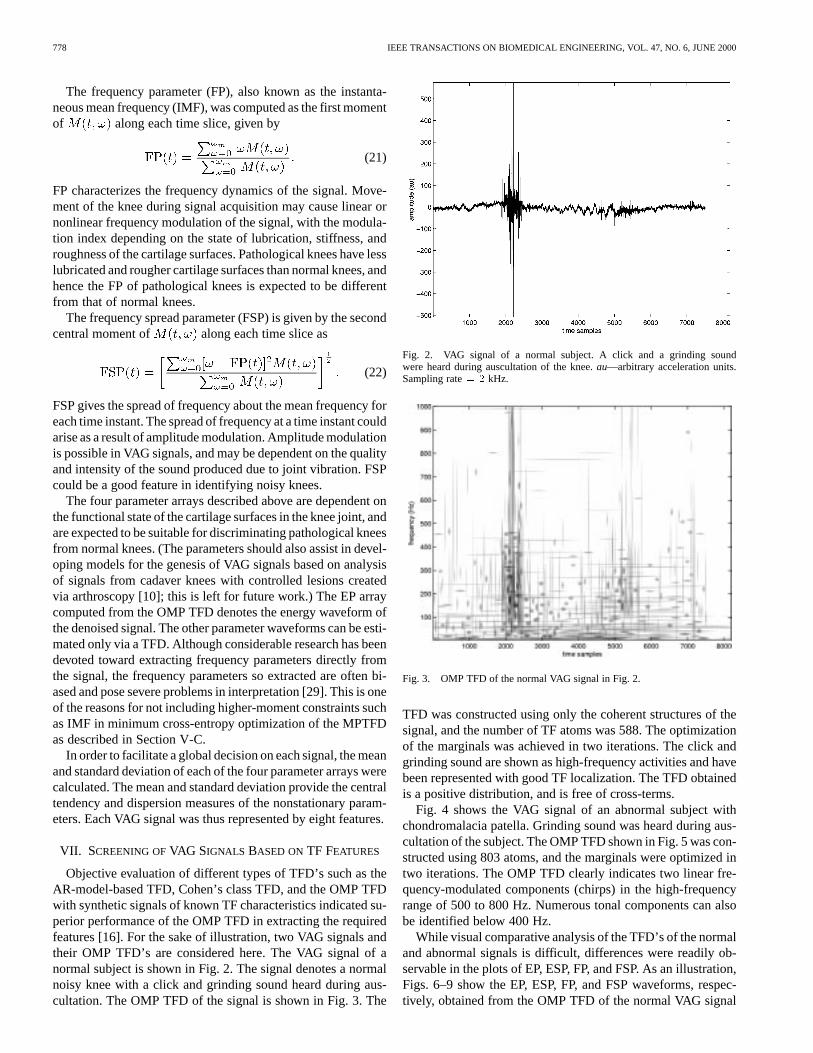
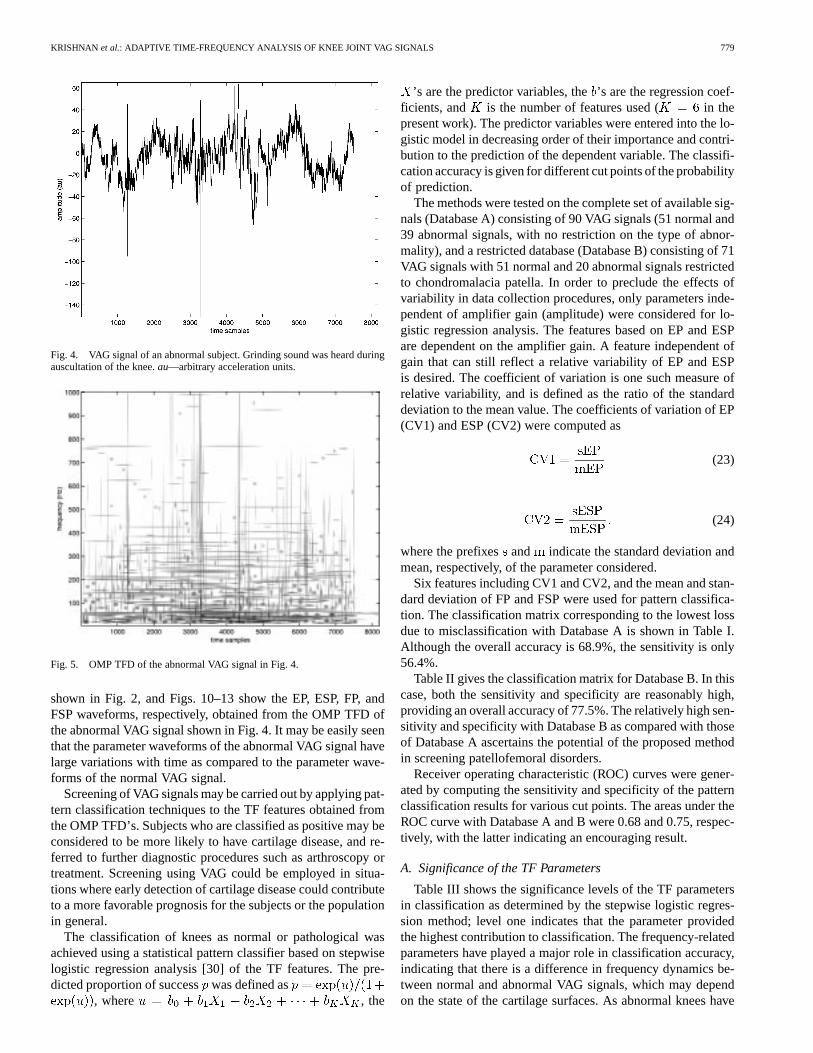
Fig. 4 shows the VAG signal of an abnormal subject withchondromalacia patella. Grinding sound was heard during aus-cultation of the subject. The OMP TFD shown in Fig. 5 was con-structed using 803 atoms, and the marginals were optimized intwo iterations. The OMP TFD clearly indicates two linear fre-quency-modulated components (chirps) in the high-frequencyrange of 500 to 800 Hz. Numerous tonal components can alsobe identified below 400 Hz.
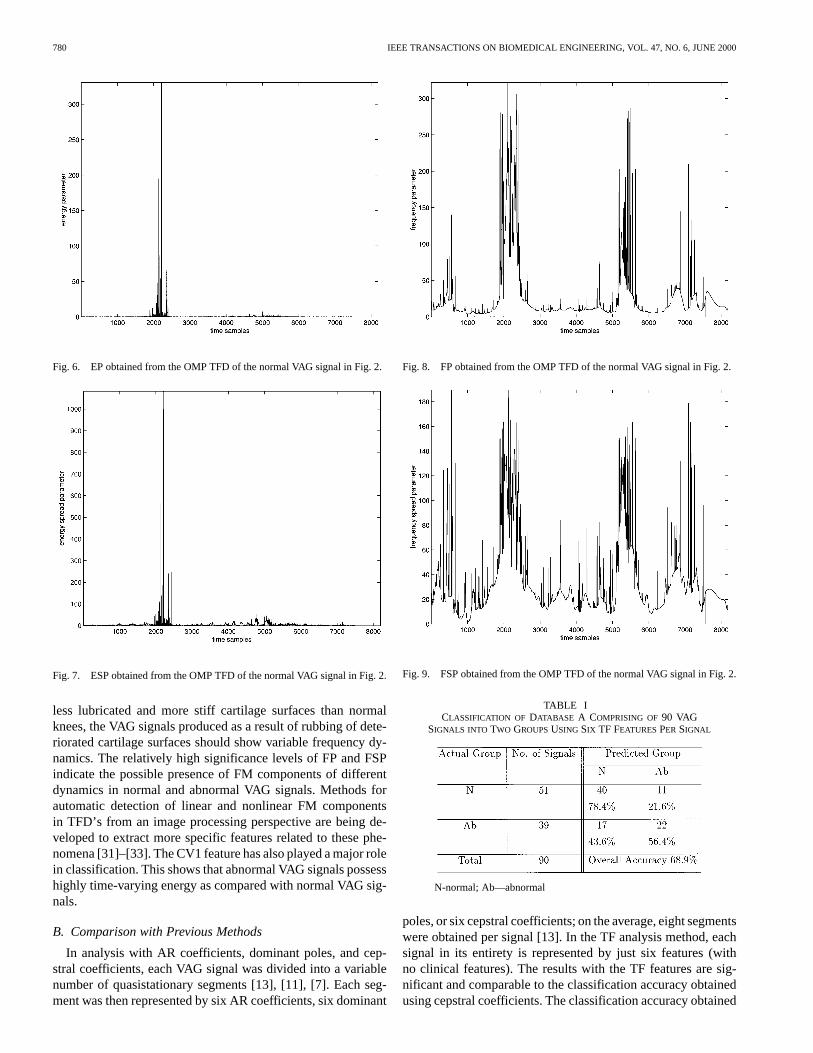
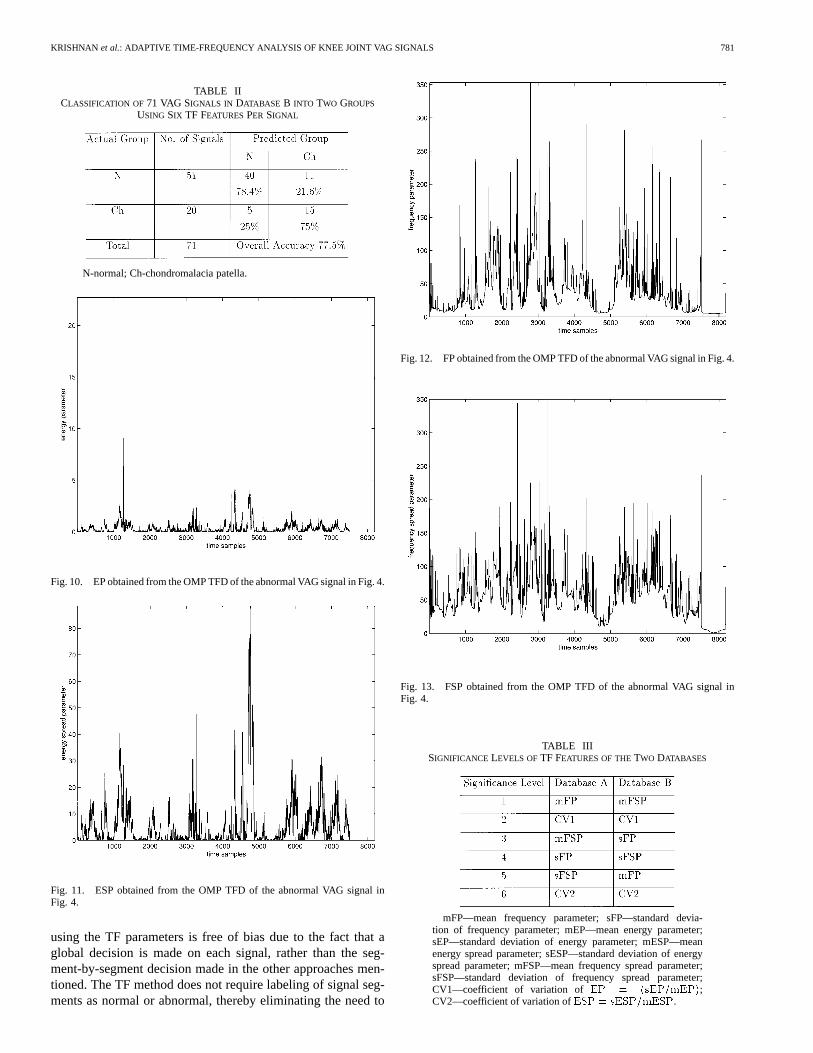
While visual comparative analysis of the TFD’s of the normaland abnormal signals is difficult, differences were readily ob-servable in the plots of EP, ESP, FP, and FSP. As an illustration,Figs. 6–9 show the EP, ESP, FP, and FSP waveforms, respec-tively, obtained from the OMP TFD of the normal VAG signal
KRISHNAN et al.: ADAPTIVE TIME-FREQUENCY ANALYSIS OF KNEE JOINT VAG SIGNALS 779
Fig. 4. VAG signal of an abnormal subject. Grinding sound was heard duringauscultation of the knee.au—arbitrary acceleration units.
Fig. 5. OMP TFD of the abnormal VAG signal in Fig. 4.
shown in Fig. 2, and Figs. 10–13 show the EP, ESP, FP, andFSP waveforms, respectively, obtained from the OMP TFD ofthe abnormal VAG signal shown in Fig. 4. It may be easily seenthat the parameter waveforms of the abnormal VAG signal havelarge variations with time as compared to the parameter wave-forms of the normal VAG signal.
Screening of VAG signals may be carried out by applying pat-tern classification techniques to the TF features obtained fromthe OMP TFD’s. Subjects who are classified as positive may beconsidered to be more likely to have cartilage disease, and re-ferred to further diagnostic procedures such as arthroscopy ortreatment. Screening using VAG could be employed in situa-tions where early detection of cartilage disease could contributeto a more favorable prognosis for the subjects or the populationin general.
The classification of knees as normal or pathological wasachieved using a statistical pattern classifier based on stepwiselogistic regression analysis [30] of the TF features. The pre-dicted proportion of successwas defined as
, where , the
’s are the predictor variables, the’s are the regression coef-ficients, and is the number of features used ( in thepresent work). The predictor variables were entered into the lo-gistic model in decreasing order of their importance and contri-bution to the prediction of the dependent variable. The classifi-cation accuracy is given for different cut points of the probabilityof prediction.
The methods were tested on the complete set of available sig-nals (Database A) consisting of 90 VAG signals (51 normal and39 abnormal signals, with no restriction on the type of abnor-mality), and a restricted database (Database B) consisting of 71VAG signals with 51 normal and 20 abnormal signals restrictedto chondromalacia patella. In order to preclude the effects ofvariability in data collection procedures, only parameters inde-pendent of amplifier gain (amplitude) were considered for lo-gistic regression analysis. The features based on EP and ESPare dependent on the amplifier gain. A feature independent ofgain that can still reflect a relative variability of EP and ESPis desired. The coefficient of variation is one such measure ofrelative variability, and is defined as the ratio of the standarddeviation to the mean value. The coefficients of variation of EP(CV1) and ESP (CV2) were computed as
(23)
(24)
where the prefixes and indicate the standard deviation andmean, respectively, of the parameter considered.
Six features including CV1 and CV2, and the mean and stan-dard deviation of FP and FSP were used for pattern classifica-tion. The classification matrix corresponding to the lowest lossdue to misclassification with Database A is shown in Table I.Although the overall accuracy is 68.9%, the sensitivity is only56.4%.
Table II gives the classification matrix for Database B. In thiscase, both the sensitivity and specificity are reasonably high,providing an overall accuracy of 77.5%. The relatively high sen-sitivity and specificity with Database B as compared with thoseof Database A ascertains the potential of the proposed methodin screening patellofemoral disorders.
Receiver operating characteristic (ROC) curves were gener-ated by computing the sensitivity and specificity of the patternclassification results for various cut points. The areas under theROC curve with Database A and B were 0.68 and 0.75, respec-tively, with the latter indicating an encouraging result.
A. Significance of the TF Parameters
Table III shows the significance levels of the TF parametersin classification as determined by the stepwise logistic regres-sion method; level one indicates that the parameter providedthe highest contribution to classification. The frequency-relatedparameters have played a major role in classification accuracy,indicating that there is a difference in frequency dynamics be-tween normal and abnormal VAG signals, which may dependon the state of the cartilage surfaces. As abnormal knees have
780 IEEE TRANSACTIONS ON BIOMEDICAL ENGINEERING, VOL. 47, NO. 6, JUNE 2000
Fig. 6. EP obtained from the OMP TFD of the normal VAG signal in Fig. 2.
Fig. 7. ESP obtained from the OMP TFD of the normal VAG signal in Fig. 2.
less lubricated and more stiff cartilage surfaces than normalknees, the VAG signals produced as a result of rubbing of dete-riorated cartilage surfaces should show variable frequency dy-namics. The relatively high significance levels of FP and FSPindicate the possible presence of FM components of differentdynamics in normal and abnormal VAG signals. Methods forautomatic detection of linear and nonlinear FM componentsin TFD’s from an image processing perspective are being de-veloped to extract more specific features related to these phe-nomena [31]–[33]. The CV1 feature has also played a major rolein classification. This shows that abnormal VAG signals possesshighly time-varying energy as compared with normal VAG sig-nals.
B. Comparison with Previous Methods
In analysis with AR coefficients, dominant poles, and cep-stral coefficients, each VAG signal was divided into a variablenumber of quasistationary segments [13], [11], [7]. Each seg-ment was then represented by six AR coefficients, six dominant
Fig. 8. FP obtained from the OMP TFD of the normal VAG signal in Fig. 2.
Fig. 9. FSP obtained from the OMP TFD of the normal VAG signal in Fig. 2.
TABLE ICLASSIFICATION OF DATABASE A COMPRISING OF90 VAG
SIGNALS INTO TWO GROUPSUSING SIX TF FEATURESPER SIGNAL
N-normal; Ab—abnormal
poles, or six cepstral coefficients; on the average, eight segmentswere obtained per signal [13]. In the TF analysis method, eachsignal in its entirety is represented by just six features (withno clinical features). The results with the TF features are sig-nificant and comparable to the classification accuracy obtainedusing cepstral coefficients. The classification accuracy obtained
KRISHNAN et al.: ADAPTIVE TIME-FREQUENCY ANALYSIS OF KNEE JOINT VAG SIGNALS 781
TABLE IICLASSIFICATION OF 71 VAG SIGNALS IN DATABASE B INTO TWO GROUPS
USING SIX TF FEATURESPER SIGNAL
N-normal; Ch-chondromalacia patella.
Fig. 10. EP obtained from the OMP TFD of the abnormal VAG signal in Fig. 4.
Fig. 11. ESP obtained from the OMP TFD of the abnormal VAG signal inFig. 4.
using the TF parameters is free of bias due to the fact that aglobal decision is made on each signal, rather than the seg-ment-by-segment decision made in the other approaches men-tioned. The TF method does not require labeling of signal seg-ments as normal or abnormal, thereby eliminating the need to
Fig. 12. FP obtained from the OMP TFD of the abnormal VAG signal in Fig. 4.
Fig. 13. FSP obtained from the OMP TFD of the abnormal VAG signal inFig. 4.
TABLE IIISIGNIFICANCE LEVELS OFTF FEATURES OF THETWO DATABASES
mFP—mean frequency parameter; sFP—standard devia-tion of frequency parameter; mEP—mean energy parameter;sEP—standard deviation of energy parameter; mESP—meanenergy spread parameter; sESP—standard deviation of energyspread parameter; mFSP—mean frequency spread parameter;sFSP—standard deviation of frequency spread parameter;CV1—coefficient of variation ofEP = (sEP=mEP);CV2—coefficient of variation ofESP = sESP=mESP.
782 IEEE TRANSACTIONS ON BIOMEDICAL ENGINEERING, VOL. 47, NO. 6, JUNE 2000
estimate the joint angle corresponding to the pathology as ob-served during arthroscopy.
VIII. C ONCLUSION
TFD’s of VAG signals facilitate true nonstationary analysisand can depict their important characteristics. It is difficult tovisually interpret VAG TFD’s. Therefore, TFD’s should be de-signed so as to facilitate objective feature identification and ex-traction. Analysis of the performances of a few different TFD’savailable shows that the OMP TFD proposed in the presentpaper is the most suitable TFD for VAG signal analysis [34],[16].
Results of classification of VAG signals suggest that TFparameters extracted from the OMP TFD provide good dis-criminant information. Compared with our previous methods[11]–[13], the TF method does not require any joint angle in-formation to label the segments of a VAG signal; is independentof patient information such as age, activity level, and gender;and shows good potential for noninvasive diagnosis of articularcartilage pathology. The proposed procedure represents animproved approach to analyze nonstationary VAG signals usingan advanced TF method, and is a novel method for parametricanalysis of biomedical signals using TFD’s. Currently, we areinvestigating the use of image analysis techniques such as theHough and Radon transforms to automatically identify TFpatterns in VAG TFD’s.
REFERENCES
[1] W. E. Blodgett, “Auscultation of the knee joint,”Boston Med. Surg.J., vol. 146, no. 3, pp. 63–66, 1902.
[2] K. H. Erb, “Uber die moeglichkeit der registrierung von gelenkger-aeuschen,”Deutsche Z. Chir., vol. 241, pp. 237–245, 1933.
[3] M. L. Chu, I. A. Gradisar, and R. Mostardi, “A noninvasive electroa-coustical evalution technique of cartilage damage in pathological kneejoints,” Med. Biol. Eng. Comput., vol. 16, pp. 437–442, 1978.
[4] J. Inoue, Y. Nagata, and K. Suzuki, “Measurement of knee jointsounds by microphone,”Sangyo Ika Daigaku Zasshi, vol. 8, no. 3,pp. 307–316, 1986.
[5] G. F. McCoy, J. D. McCrea, D. E. Beverland, W. G. Kernohan, and R.A. B. Mollan, “Vibration arthrography as a diagnostic aid in diseaseof the knee,”J. Bone Joint Surg., vol. 69-B, no. 2, pp. 288–293, 1987.
[6] Y. Nagata, “Joint-sounds in gonoarthrosis—Clinical application ofphonoarthrography for the knees,”J. UOEH, vol. 10, no. 1, pp. 47–58,1988.
[7] S. Tavathia, R. M. Rangayyan, C. B. Frank, G. D. Bell, K. O. Ladly,and Y. T. Zhang, “Analysis of knee vibration signals using linear pre-diction,” IEEE Trans. Biomed. Eng., vol. 39, pp. 959–970, Sept. 1992.
[8] N. P. Reddy, B. M. Rothschild, M. Mandal, V. Gupta, and S. Surya-narayanan, “Noninvasive acceleration measurements to characterizeknee arthritis and chondromalacia,”Ann. Biomed. Eng., vol. 23, pp.78–84, 1995.
[9] Y. T. Zhang, R. M. Rangayyan, C. B. Frank, and G. D. Bell, “Adap-tive cancellation of muscle contraction interference from knee jointvibration signals,”IEEE Trans. Biomed. Eng., vol. 41, pp. 181–191,Feb. 1994.
[10] Y. Shen, R. M. Rangayyan, G. D. Bell, C. B. Frank, Y. T. Zhang,and K. O. Ladly, “Localization of knee joint cartilage pathology bymultichannel vibroarthrography,”Med. Eng. Phys., vol. 17, no. 8, pp.583–594, 1995.
[11] Z. M. K. Moussavi, R. M. Rangayyan, G. D. Bell, C. B. Frank, K. O.Ladly, and Y. T. Zhang, “Screening of vibroarthrographic signals viaadaptive segmentation and linear prediction modeling,”IEEE Trans.Biomed. Eng., vol. 43, pp. 15–23, Jan. 1996.
[12] S. Krishnan, R. M. Rangayyan, G. D. Bell, C. B. Frank, and K. O.Ladly, “Adaptive filtering, modeling, and classification of knee jointvibroarthrographic signals for noninvasive diagnosis of articular carti-lage pathology,”Med. Biol. Eng. Comput., vol. 35, pp. 677–684, Nov.1997.
[13] R. M. Rangayyan, S. Krishnan, G. D. Bell, C. B. Frank, and K.O. Ladly, “Parametric representation and screening of knee jointvibroarthrographic signals,”IEEE Trans. Biomed. Eng., vol. 44, pp.1068–1074, Nov. 1997.
[14] K. O. Ladly, “Analysis of Patellofemoral Joint Vibration Signals,”masters thesis, Univ. Calgary, Calgary, AB, Canada, 1992.
[15] L. Cohen, “Time-frequency distributions—A review,”Proc. IEEE,vol. 77, pp. 941–981, 1989.
[16] S. Krishnan, “Adaptive signal processing techniques for analysis ofknee joint vibroarthrographic signals,” Ph.D. dissertation, Univ, Cal-gary, Calgary, AB, Canada, June 1999.
[17] H. I. Choi and W. J. Williams, “Improved time-frequency represen-tation of multicomponent signals using exponential kernels,”IEEETrans. Acoust., Speech, Signal Processing, vol. 37, pp. 862–871, June1989.
[18] J. Jeong and W. J. Williams, “Kernel design for reduced interferencedistributions,”IEEE Trans. Signal Processing, vol. 40, pp. 402–412,Feb. 1992.
[19] Z. Guo, L. G. Durand, and H. C. Lee, “The time-frequency distribu-tions of nonstationary signals based on a Bessel kernel,”IEEE Trans.Signal Processing, vol. 42, pp. 1700–1707, July 1994.
[20] R. G. Baraniuk and D. L. Jones, “Signal-dependent time-frequencyrepresentation: Optimal kernel design,”IEEE Trans. Signal Pro-cessing, vol. 41, pp. 1589–1602, Apr. 1993.
[21] S. G. Mallat and Z. Zhang, “Matching pursuit with time-frequencydictionaries,”IEEE Trans. Signal Processing, vol. 41, pp. 3397–3415,Dec. 1993.
[22] L. Cohen and T. Posch, “Positive time-frequency distributionfunctions,” IEEE Trans. Acoust., Speech, Signal Processing, vol.ASSP-33, pp. 31–38, Feb. 1985.
[23] J. Shore and R. Johnson, “Axiomatic derivation of the principle ofmaximum entropy and the principle of minimum cross entropy,”IEEETrans. Inform. Theory, vol. IT-26, pp. 26–37, Jan. 1980.
[24] , “Properties of cross-entropy minimization,”IEEE Trans. In-form. Theory, vol. IT-27, pp. 472–482, Apr. 1981.
[25] P. Loughlin, J. Pitton, and L. Atlas, “Construction of positive time-frequency distributions,”IEEE Trans. Signal Processing, vol. 42, pp.2697–2705, Oct. 1994.
[26] S. Krishnan, R. M. Rangayyan, G. D. Bell, C. B. Frank, and K.O. Ladly, “Time-frequency signal feature extraction and screeningof knee joint vibroarthrographic signals using the matching pur-suit method,” inProc.19th Annu. Int. Conf. IEEE Engineering inMedicine and Biology Society, Chicago, IL, Oct. 1997. Available:[CD-ROM]. Paper 664 .
[27] S. Krishnan and R. M. Rangayyan, “Denoising knee joint vibroarthro-graphic signals using adaptive time-frequency representations,” inProc. Canadian Conf. Electrical and Computer Engineering, Ed-monton, AB, Canada, May 1999, pp. 1405–1411.
[28] , “Automatic denoising of knee joint vibration signals usingadaptive time-frequency representations,”Med. Biol. Eng. Comput.,vol. 38, pp. 2–8, Jan. 1999.
[29] B. Boashash, “Estimating and interpreting the instantaneous fre-quency of a signal—Part 1: Fundamentals,”Proc. IEEE, vol. 80, pp.519–538, Apr. 1992.
[30] A. P. Afifi and S. P. Azen,Statistical Analysis: A Computer OrientedApproach, 2nd ed. New York: Academic., 1979.
[31] S. Krishnan and R. M. Rangayyan, “Detection of chirp and other com-ponents in the time-frequency plane using the Hough and Radon trans-forms,” inProc. 1997 IEEE Pacific Rim Conf. Communications, Com-puters, and Signal Processing, Victoria, BC, Canada, Aug. 1997, pp.138–141.
[32] , “Detection of nonlinear frequency modulated components inthe time-frequency plane by using an array of accumulators,” inProc.IEEE-SP Int. Symp. Time-Frequency and Time-Scale Analysis, Pitts-burgh, PA, Oct. 1998, pp. 557–560.
[33] , “Feature identification in the time-frequency distributions ofknee joint vibroarthrographic signals using Hough and Radon trans-forms,” in Proc. Int. Conf. Robotics, Vision, and Parallel Processing,Tronoh, Malaysia, July 1999, pp. 82–89.
KRISHNAN et al.: ADAPTIVE TIME-FREQUENCY ANALYSIS OF KNEE JOINT VAG SIGNALS 783
[34] , “Knee joint vibration signal analysis using adaptive time-fre-quency representations,” inProc. Eur. Medical and Biological Engi-neering Conf., Vienna, Austria, Nov. 1999, pp. 466–467.
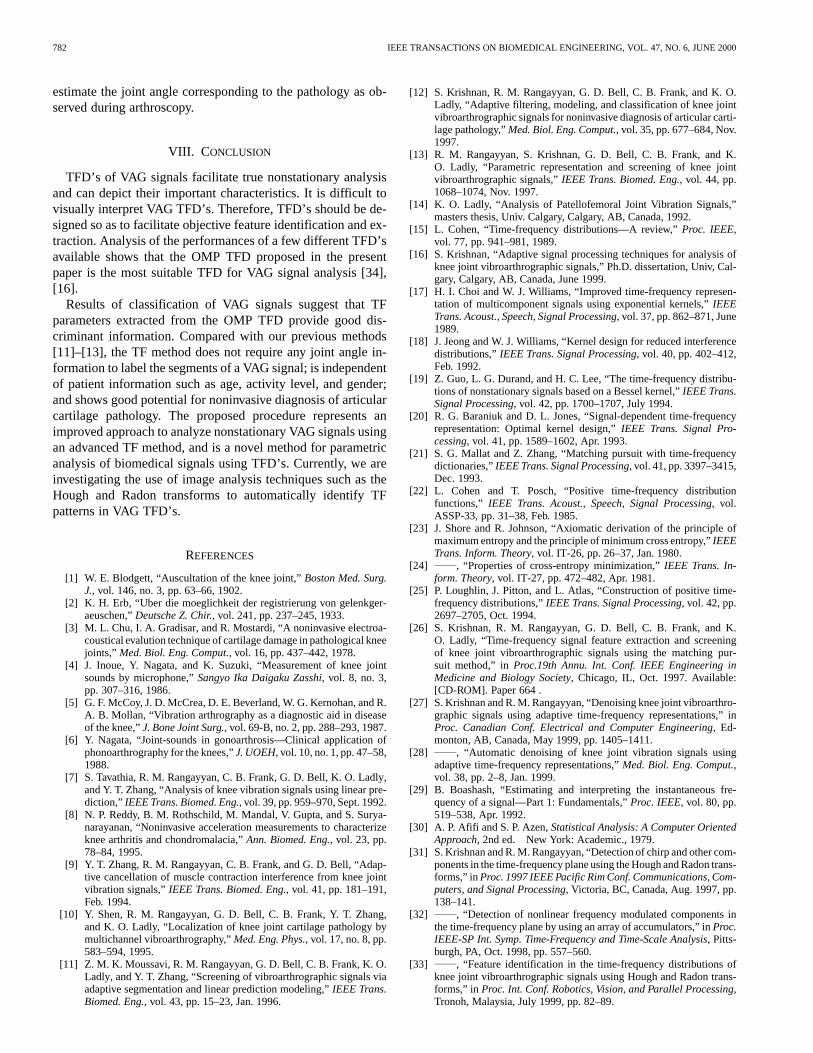
Sridhar Krishnan (S’95–M’00) was born in Erode,Tamil Nadu, India, on June 6, 1972. He receivedthe B.E. degree in electronics and communicationengineering from Anna University, Madras, India, in1993, and the M.Sc. and Ph.D. degrees in electricaland computer engineering from the University ofCalgary, Calgary, AB, Canada, in 1996 and 1999,respectively.
He is currently an Assistant Professor in Elec-trical and Computer Engineering at the RyersonPolytechnic University, Toronto, ON, Canada. His
research interests include nonstationary signal processing, biomedical signalanalysis, and telecommunications.
Dr. Krishnan received a full-time studentship award from the Alberta HeritageFoundation for Medical Research during his graduate studies at the Universityof Calgary.
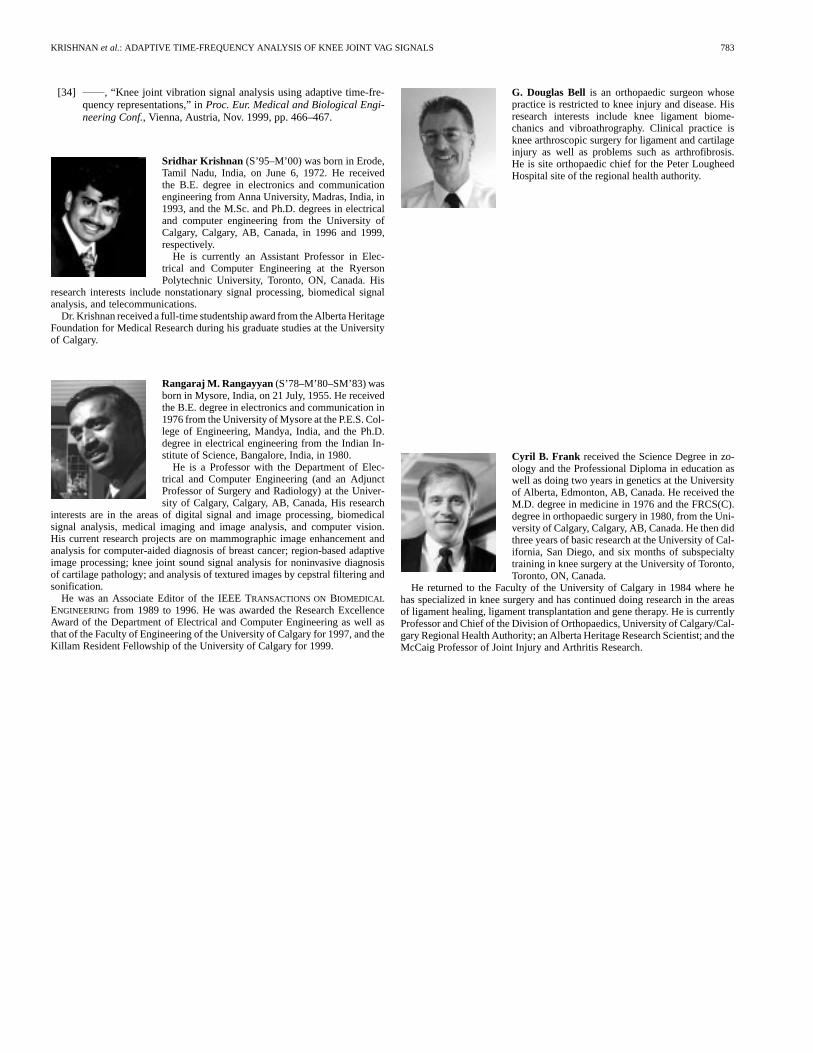
Rangaraj M. Rangayyan(S’78–M’80–SM’83) wasborn in Mysore, India, on 21 July, 1955. He receivedthe B.E. degree in electronics and communication in1976 from the University of Mysore at the P.E.S. Col-lege of Engineering, Mandya, India, and the Ph.D.degree in electrical engineering from the Indian In-stitute of Science, Bangalore, India, in 1980.
He is a Professor with the Department of Elec-trical and Computer Engineering (and an AdjunctProfessor of Surgery and Radiology) at the Univer-sity of Calgary, Calgary, AB, Canada, His research
interests are in the areas of digital signal and image processing, biomedicalsignal analysis, medical imaging and image analysis, and computer vision.His current research projects are on mammographic image enhancement andanalysis for computer-aided diagnosis of breast cancer; region-based adaptiveimage processing; knee joint sound signal analysis for noninvasive diagnosisof cartilage pathology; and analysis of textured images by cepstral filtering andsonification.
He was an Associate Editor of the IEEE TRANSACTIONS ON BIOMEDICAL
ENGINEERING from 1989 to 1996. He was awarded the Research ExcellenceAward of the Department of Electrical and Computer Engineering as well asthat of the Faculty of Engineering of the University of Calgary for 1997, and theKillam Resident Fellowship of the University of Calgary for 1999.
G. Douglas Bell is an orthopaedic surgeon whosepractice is restricted to knee injury and disease. Hisresearch interests include knee ligament biome-chanics and vibroathrography. Clinical practice isknee arthroscopic surgery for ligament and cartilageinjury as well as problems such as arthrofibrosis.He is site orthopaedic chief for the Peter LougheedHospital site of the regional health authority.
Cyril B. Frank received the Science Degree in zo-ology and the Professional Diploma in education aswell as doing two years in genetics at the Universityof Alberta, Edmonton, AB, Canada. He received theM.D. degree in medicine in 1976 and the FRCS(C).degree in orthopaedic surgery in 1980, from the Uni-versity of Calgary, Calgary, AB, Canada. He then didthree years of basic research at the University of Cal-ifornia, San Diego, and six months of subspecialtytraining in knee surgery at the University of Toronto,Toronto, ON, Canada.
He returned to the Faculty of the University of Calgary in 1984 where hehas specialized in knee surgery and has continued doing research in the areasof ligament healing, ligament transplantation and gene therapy. He is currentlyProfessor and Chief of the Division of Orthopaedics, University of Calgary/Cal-gary Regional Health Authority; an Alberta Heritage Research Scientist; and theMcCaig Professor of Joint Injury and Arthritis Research.