Embed Size (px)
Citation preview
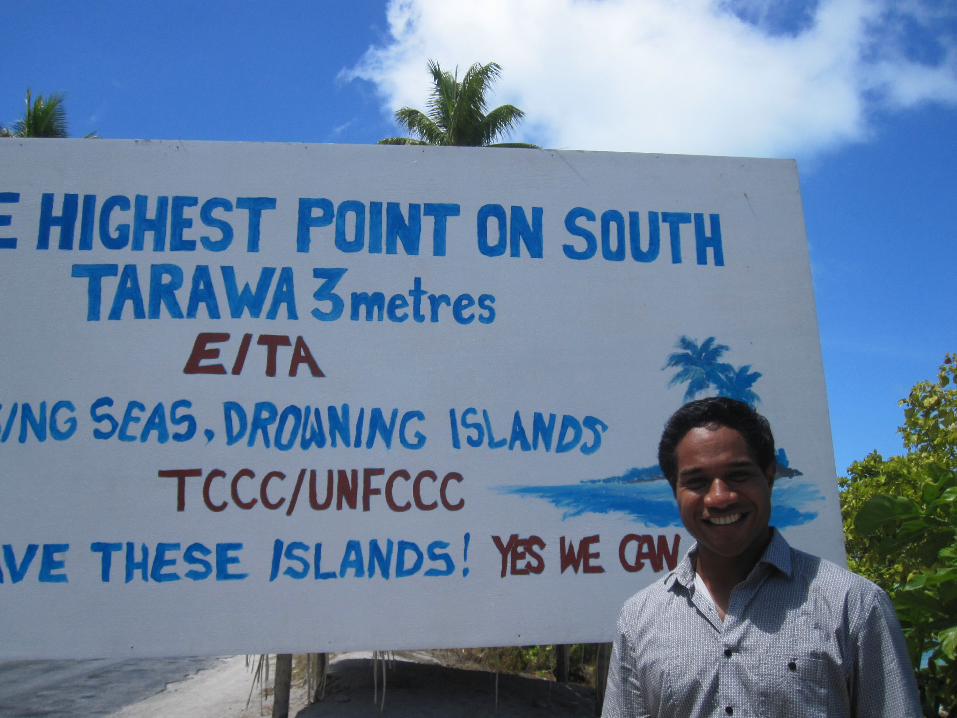
Adapting to climate change to protect health – a Pacific view
Alistair WoodwardSchool of Population Health
University of Auckland
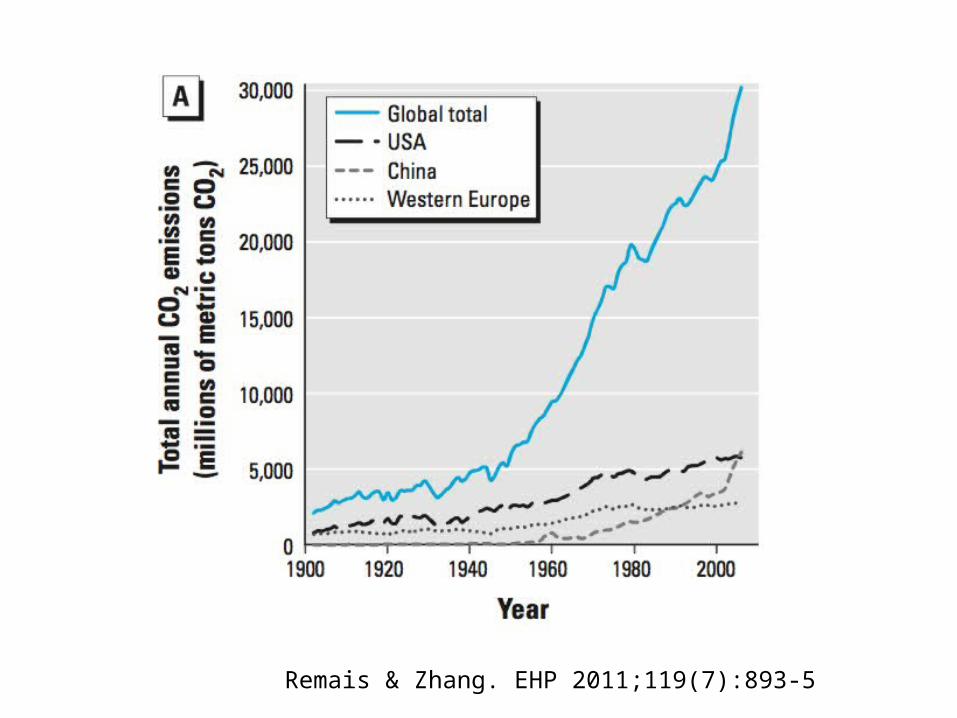
Remais & Zhang. EHP 2011;119(7):893-5
Climate change and health: why an extra degree or two (or 4) matters
• Variability and frequency of extreme events more important than average conditions
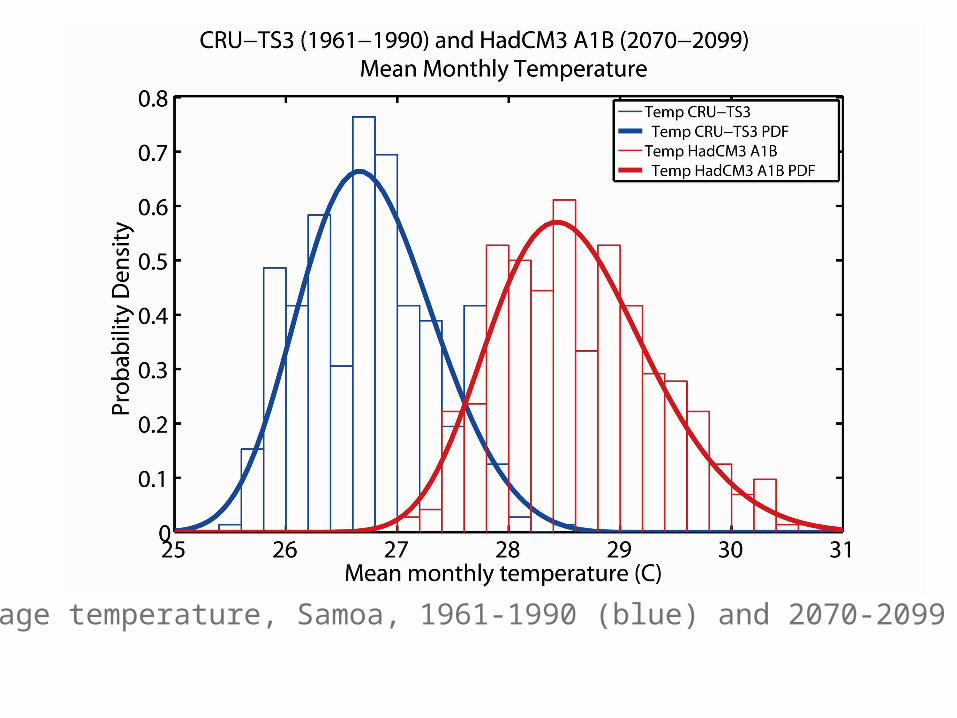
Average temperature, Samoa, 1961-1990 (blue) and 2070-2099 (red)
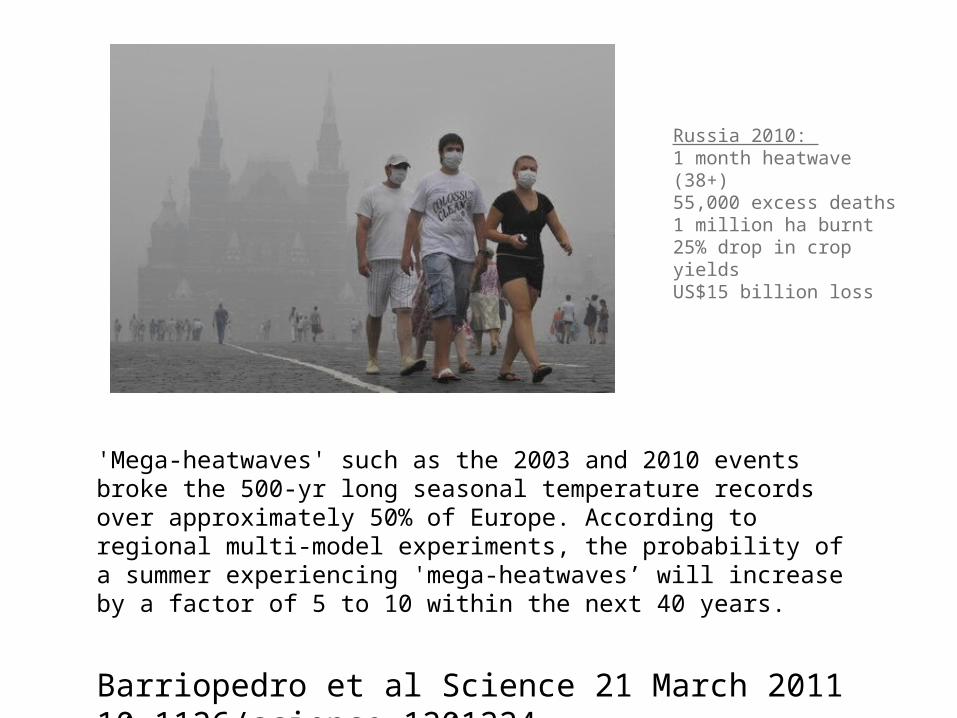
'Mega-heatwaves' such as the 2003 and 2010 events broke the 500-yr long seasonal temperature records over approximately 50% of Europe. According to regional multi-model experiments, the probability of a summer experiencing 'mega-heatwaves’ will increase by a factor of 5 to 10 within the next 40 years.
Barriopedro et al Science 21 March 2011 10.1126/science.1201224
Russia 2010: 1 month heatwave (38+)55,000 excess deaths1 million ha burnt25% drop in crop yieldsUS$15 billion loss
Climate change and health: why should an extra degree or two (or 4) matter?
• Compared with human populations, physical and ecological systems are relatively open to environmental change and may be exquisitely sensitive to temperature rise
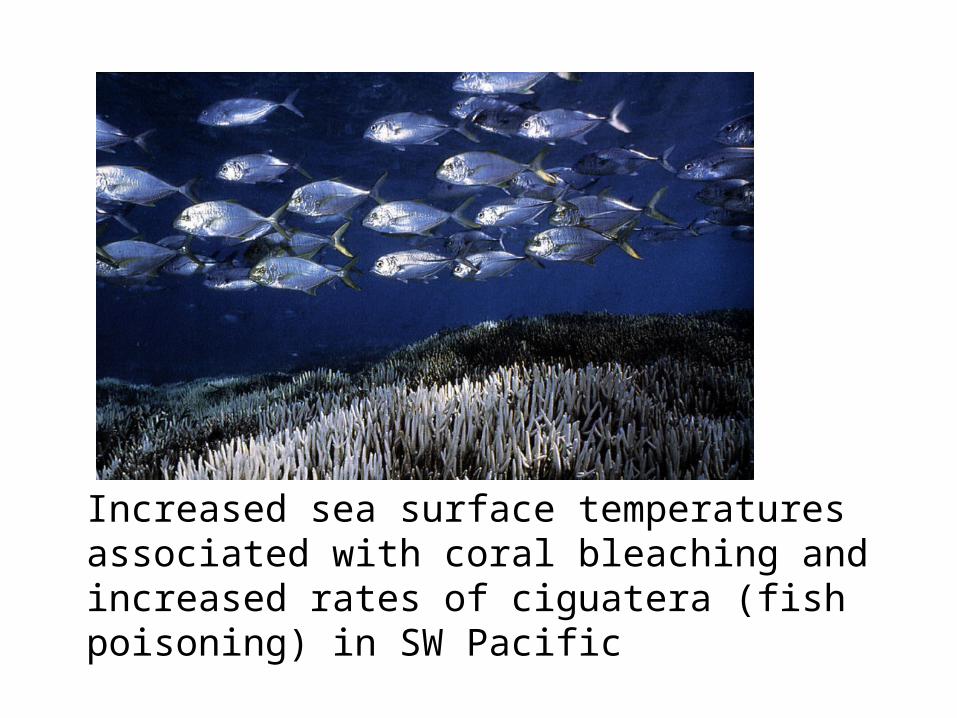
Increased sea surface temperatures associated with coral bleaching and increased rates of ciguatera (fish poisoning) in SW Pacific
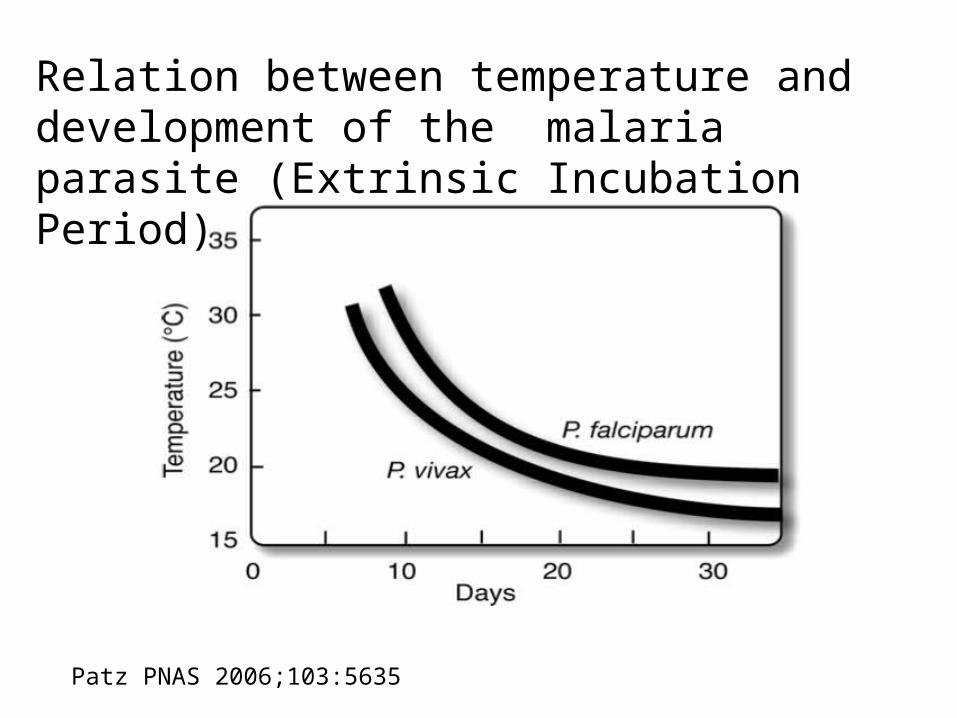
Patz PNAS 2006;103:5635
Relation between temperature and development of the malaria parasite (Extrinsic Incubation Period)
Climate change and health: why should an extra degree or two (or 4) matter?
• Sea level rise, storms, drought and crop failure may displace millions of people, causing poverty, conflict and violence

11
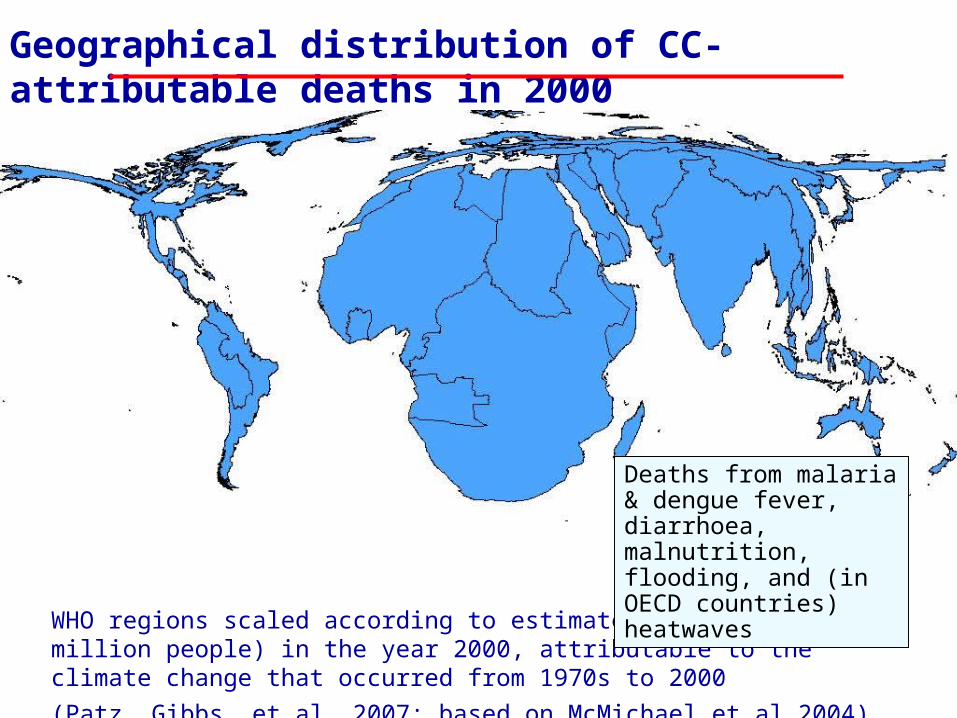
Geographical distribution of CC-attributable deaths in 2000
WHO regions scaled according to estimated mortality (per million people) in the year 2000, attributable to the climate change that occurred from 1970s to 2000 (Patz, Gibbs, et al, 2007: based on McMichael et al 2004)
Deaths from malaria & dengue fever, diarrhoea, malnutrition, flooding, and (in OECD countries) heatwaves
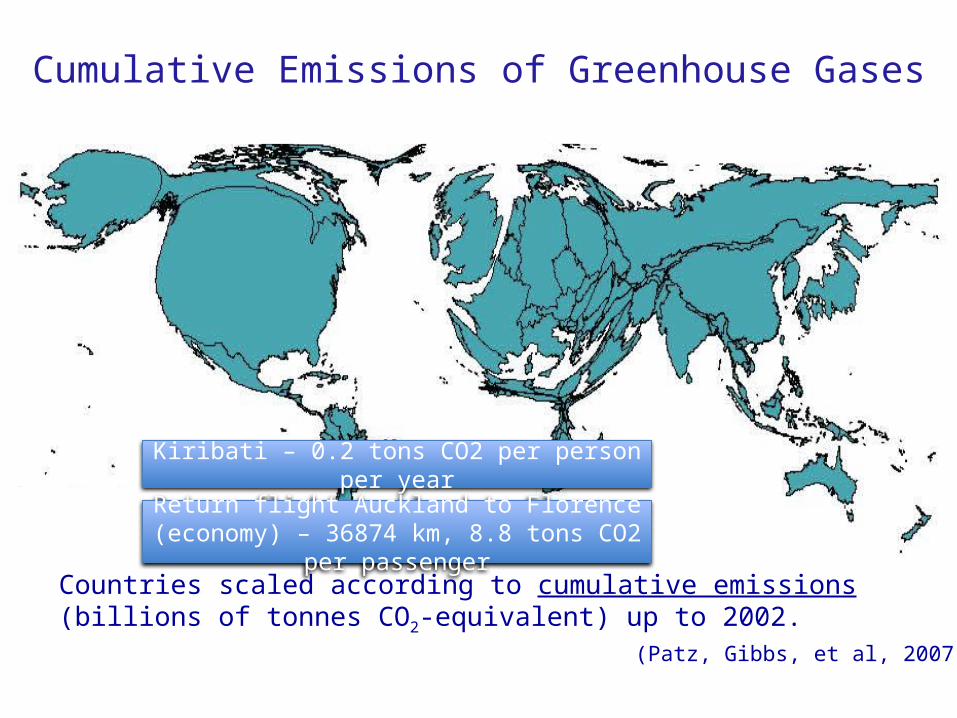
Cumulative Emissions of Greenhouse Gases
Countries scaled according to cumulative emissions (billions of tonnes CO2-equivalent) up to 2002.
(Patz, Gibbs, et al, 2007)
Kiribati – 0.2 tons CO2 per person per year
Return flight Auckland to Florence (economy) – 36874 km, 8.8 tons CO2 per passenger

Geographical distribution of CC-attributable deaths in 2000
WHO regions scaled according to estimated mortality (per million people) in the year 2000, attributable to the climate change that occurred from 1970s to 2000 (Patz, Gibbs, et al, 2007: based on McMichael et al 2004)
Deaths from malaria & dengue fever, diarrhoea, malnutrition, flooding, and (in OECD countries) heatwaves
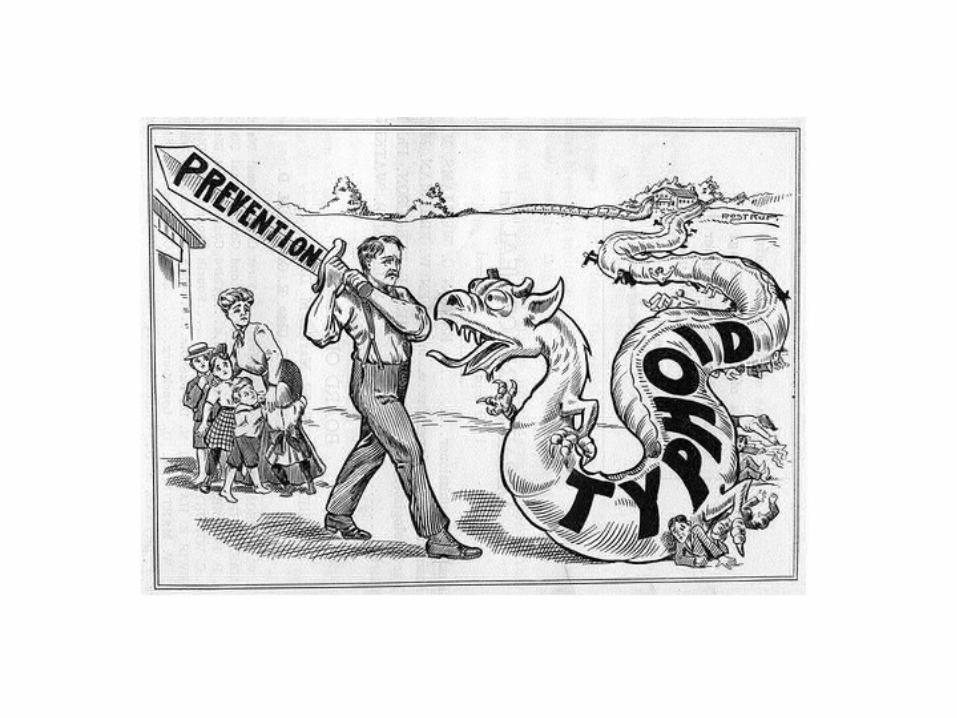
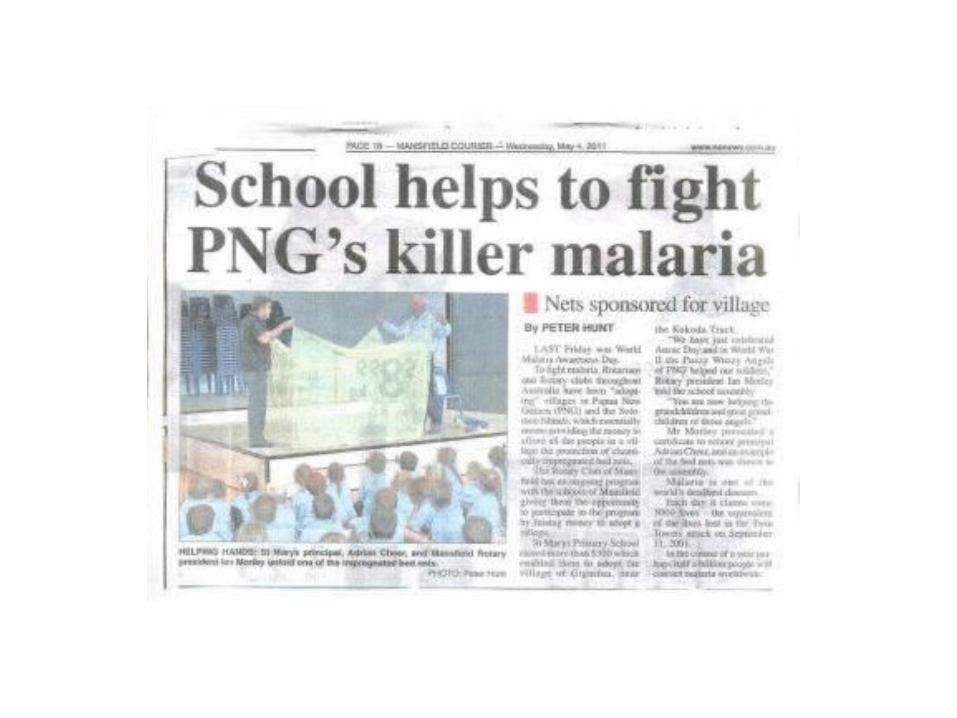
Examples of health adaptations

17
Adaptation is important, but so is mitigation
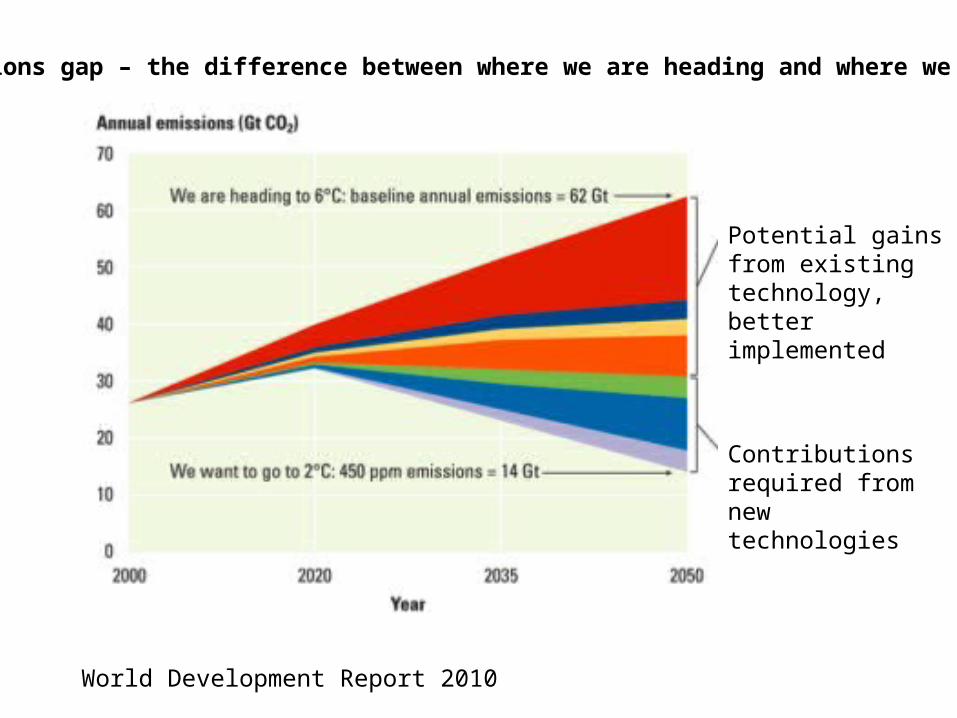
The emissions gap – the difference between where we are heading and where we need to go
Potential gains from existing technology, better implemented
Contributions required from new technologies
World Development Report 2010
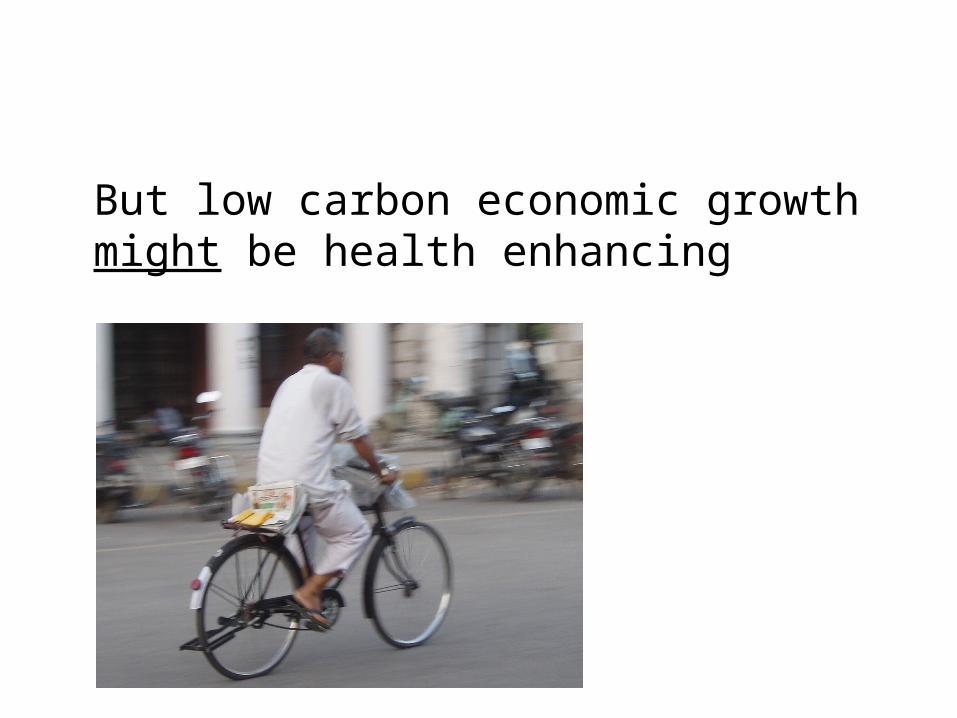
But low carbon economic growth might be health enhancing

Adapting to climate change to protect health – a Pacific view
Alistair WoodwardSchool of Population Health
University of Auckland