Embed Size (px)
Citation preview
ADAM II 2009 AN N U A L RE P O R T
ARRESTEE DRUG ABUSE MONITORING PROGRAM II
OFFICE OF NATIONAL DRUG CONTROL POLICY
EXECUTIVE OFFICE OF THE PRESIDENT
WASHINGTON, DC
June 2010

Acknowledgments
This report was prepared for the Office of National Drug Control Policy (ONDCP), Executive Office of the President, by Abt Associates Inc. Work by Abt Associates was performed under Contract No. GS-10F-0086K. Contributors and reviewers at Abt Associates listed alphabetically include Meg Chapman, Sara Collins, Chris Flygare, Dana Hunt, Sarah Kuck Jalbert, Ryan Kling, Richard Kulka, Caroline Nobo, and William Rhodes. Contributors at ONDCP listed alphabetically include Maria Fe Caces, Robert Cohen, and Terry Zobeck.

Contents
Executive Summary ...........................................................................................................................vii Methodology..............................................................................................................................viii ADAM II Sample Demographics ................................................................................................. x Drug Use and Drug Market Participation ...................................................................................xii Use of Any Drug/Multiple Drugs ...............................................................................................xii Marijuana Use and Market Participation ...................................................................................xiii Cocaine Use...............................................................................................................................xiv Crack Use and Market Participation..........................................................................................xiv Cocaine Powder Use and Market Participation .......................................................................... xv Heroin Use and Market Participation ........................................................................................xvi Methamphetamine Use and Market Participation .....................................................................xvi Other Drugs ..............................................................................................................................xvii Report Format..........................................................................................................................xviii
1. An Overview of the Arrestee Drug Abuse Monitoring (ADAM II) Program .......................... 1 What Is ADAM?........................................................................................................................... 1 Why Are ADAM Data Important? ............................................................................................... 2 What Is the ADAM II Methodology?........................................................................................... 4
How Does ADAM II Continue the Methods of the Original ADAM Program?............... 4 How Are Facilities and Arrestees Sampled? ..................................................................... 5 How Are Cases Weighted?................................................................................................ 8 How Does ADAM II Account for Critical Data on Arrestees Who Do Not Provide a Test Sample?................................................................................................................... 9 How Are Trends over Time Estimated? .......................................................................... 10 How Does ADAM II Account for a Biannual Sample? .................................................. 11
2. Who Constitutes the ADAM II Sample?.................................................................................... 13 What Are the Demographic Characteristics of ADAM II Arrestees? ........................................ 13 What Are Arrestees’ Histories with the Criminal Justice System? ............................................ 14 How Do Arrestees Testing Positive for Any Drugs Compare with All Other Arrestees?.......... 16 What Are the Substance Abuse and Mental Health Treatment Experiences among ADAM II Arrestees? ................................................................................................................................... 16
3. What Is the Drug Use and Drug Market Activity among Arrestees? ..................................... 18 Are Arrestees Telling the Truth about Drug Use?...................................................................... 18
Congruence between Self-report and Test Results .......................................................... 18 What Are the Test Results for the Presence of Illicit Drugs? ..................................................... 21
Marijuana......................................................................................................................... 24 Prevalence of Use: Marijuana.......................................................................................... 24 Buying and Selling: Marijuana Markets.......................................................................... 27 Cocaine: Crack and Powder ............................................................................................ 29 Prevalence of Use: Self-reported Crack Use ................................................................... 30 Buying and Selling: Crack Markets................................................................................. 33 Prevalence of Use: Self-reported Powder Cocaine Use .................................................. 33 Buying and Selling: Cocaine Powder Markets................................................................ 35
ADAM II 2009 Annual Report Contents i
Heroin .............................................................................................................................. 36 Prevalence of Use: Heroin............................................................................................... 36 Buying and Selling: Heroin Markets ............................................................................... 39 Methamphetamine ........................................................................................................... 40 Prevalence of Use: Methamphetamine ............................................................................ 40 Buying and Selling: Methamphetamine Markets ............................................................ 42 Injection........................................................................................................................... 43 Other Drugs ..................................................................................................................... 44
4. Summary and Conclusions.......................................................................................................... 45
Appendix A: Data Tables................................................................................................................... 47 Table 1.1: ADAM Completed Interviews, Urine Specimens, and Weighted Case
Numbers (2000-2009).......................................................................................... 47 Table 2.1: ADAM II Characteristics of Adult Male Arrestees, 2007 to 2009: Age,
Marital Status, Citizenship, Employment, Education, Insurance, Housing......... 49 Table 2.2: Race/Ethnicity of Adult Male Arrestees, 2007 to 2009 ....................................... 51 Table 2.3: Arrest History of Adult Male Arrestees, 2000 to 2003 and 2007 to 2009,
Any Prior Arrest................................................................................................... 52 Table 2.4: Arrest History of Adult Male Arrestees Who Reported Drug Use in Prior Year,
2000 to 2003 and 2007 to 2009: Two or More Arrests in Past 12 Months.......... 53 Table 2.5: ADAM II Adult Male Arrestee Arrest Charges, 2007 to 2009............................ 54 Table 2.6: ADAM II Arrestee Characteristics for Arrestees Testing Positive for Any Illicit
Substance and Arrestees Testing Negative, 2009: Age, Marital Status, Citizenship, Employment, Education, Insurance, Housing ................................. 55
Table 2.7: ADAM II Housing and Prior Arrests for Arrestees Testing Positive for Any Illicit Substance and Arrestees Testing Negative, 2009: Housing Detail and Prior Arrests......................................................................................................... 57
Table 2.8: Lifetime Drug, Alcohol, and Mental Health Treatment Status among All Arrestees, 2007 to 2009 ....................................................................................... 59
Table 2.9: Drug, Alcohol, and Mental Health Treatment Received in the Past 12 Months among Arrestees Reporting Prior 12 Month Drug Use, 2007 to 2009 ................ 60
Table 2.10: Past 12 Month Drug and Alcohol Treatment Admissions among Arrestees Reporting Prior 12 Month Drug Use, 2000 to 2003 and 2007 to 2009................ 61
Table 2.11: Past 12 Month Drug, Alcohol, and Mental Health Inpatient Treatment Nights among Arrestees Reporting Prior 12 Month Drug Use, 2000 to 2003 and 2007 to 2009 ........................................................................................................ 62
Table 2.12: Past 12 Month Mental Health Inpatient Treatment Nights among Arrestees Reporting Prior 12 Month Drug Use, 2000 to 2003 and 2007 to 2009................ 63
Table 3.1: Proportion of All Arrestees with Agreement in Self-report and Urine Test by Site, 2009 ............................................................................................................. 64
Table 3.2: Proportion of Arrestees Testing Positive and Self-reporting Use by Site, 2009.. 64 Table 3.3: Urine Test Results on Any or Multiple Drug among Adult Male Arrestees,
2000 to 2003 and 2007 to 2009 ........................................................................... 65 Table 3.4: Urine Test Results for Marijuana and Cocaine Use Among Adult Male
Arrestees, 2000 to 2003 and 2007 to 2009 .......................................................... 66 Table 3.5: Urine Test Results for Opiates and Methamphetamine Use Among Adult
Male Arrestees, 2000 to 2003 and 2007 to 2009 ................................................. 67
ADAM II 2009 Annual Report Contents ii
Table 3.6: Self- Reported Drug Use for Past 30 Days, 2007 to 2009 ................................... 68 Table 3.7: Self-reported Use of Marijuana among Adult Male Arrestees, 2007 to 2009 ..... 69 Table 3.8: Average Age at First Use for Those Who Admit Use in Prior 30 Days, 2000
to 2003 and 2007 to 2009: Marijuana, Crack Cocaine, Powder Cocaine ............ 70 Table 3.9: Average Age at First Use for Those Who Admit Use in Prior 30 Days, 2000
to 2003† and 2007 to 2009: Heroin and Methamphetamine ................................ 71 Table 3.10: Acquisition of Marijuana and Crack Cocaine Drugs by Adult Male Arrestees,
2000 to 2003 and 2007 to 2009 ........................................................................... 72 Table 3.11: Acquisition of Powder Cocaine and Heroin Drugs by Adult Male Arrestees,
2000 to 2003 and 2007 to 2009 ........................................................................... 73 Table 3.12: Acquisition of Methamphetamine by Adult Male Arrestees, 2000 to 2003
and 2007 to 2009.................................................................................................. 74 Table 3.13: Percent of Arrestees Who Acquired Drugs Reporting Cash Buys in Past 30
Days, 2007 to 2009 .............................................................................................. 75 Table 3.14: Percent of Arrestees Who Acquired Drugs Reporting Noncash Acquisitions in
Past 30 Days, 2007 to 2009 ................................................................................. 76 Table 3.15: Average Number of Days Acquiring Selected Drugs Through Cash and
Noncash by Adult Male Arrestees, 2009 ............................................................. 77 Table 3.16: Average Number of Purchases by Drug in Past 30 Days, 2007 to 2009:
Marijuana, Crack and Powder Cocaine ............................................................... 78 Table 3.17: Average Number of Purchases by Drug in Past 30 Days, 2007 to 2009:
Heroin and Methamphetamine............................................................................. 79 Table 3.18: Percent Reporting Last Drug Buy was Directly from Dealer, 2007 to 2009:
Marijuana, Crack and Powder Cocaine ............................................................... 80 Table 3.19: Percent Reporting Last Drug Buy was Directly from Dealer, 2007 to 2009:
Heroin and Methamphetamine............................................................................. 81 Table 3.20: Percent Reporting Last Drug Buy was from Regular Source, 2007 and 2009:
Marijuana, Crack and Powder Cocaine ............................................................... 82 Table 3.21: Percent Reporting Last Drug Buy was from Regular Source, 2007 to 2009:
Heroin and Methamphetamine............................................................................. 83 Table 3.22: Percent Reporting Last Drug Buy with Cash was Outdoors, 2007 to 2009:
Marijuana, Crack and Powder Cocaine ............................................................... 84 Table 3.23: Percent Reporting Last Drug Buy with Cash was Outdoors, 2007 to 2009:
Heroin and Methamphetamine............................................................................. 85 Table 3.24: Percent Reporting Any Failed Drug Buy in the Past 30 Days, 2007 to 2009 ...... 86 Table 3.25 Percent Reporting Failed Drug Buy Due to Police Activity in Past 30 Days,
2007 and 2009...................................................................................................... 87 Table 3.26: Percent Reporting Failed Drug Buy Due to Unavailability of Drug in Past 30
Days, 2007 to 2009 .............................................................................................. 88 Table 3.27: Self-reported Use of Crack Cocaine among Adult Male Arrestees,
2007 to 2009 ........................................................................................................ 89 Table 3.28: Self-reported Use of Powder Cocaine among Adult Male Arrestees,
2007 to 2009 ........................................................................................................ 90 Table 3.29: Self-reported Use of Heroin among Adult Male Arrestees, 2007 to 2009........... 91 Table 3.30: Self-reported Use of Methamphetamine among Adult Male Arrestees,
2007 to 2009 ........................................................................................................ 92 Table 3.31: Injected Drug Use at Most Recent Use (%), 2000 to 2003 and 2007 to 2009 ..... 93
ADAM II 2009 Annual Report Contents iii
Table 3.32: Percent Testing Positive for Other Drugs, 2007 to 2009: Barbiturates, Darvon, Methadone ........................................................................................................... 94
Table 3.33: Percent Testing Positive for Other Drugs, 2008 and 2009: Oxycodone, PCP, Valium ................................................................................................................. 95
Table 3.34: Percent Admitting to Secondary Drug Use in the Past 3 Days, 2009.................. 96
Appendix B: ADAM II Program Methodology ............................................................................... 97 Site Sampling.............................................................................................................................. 97
Sampling within a County ............................................................................................... 97 Sampling within a Facility............................................................................................... 99
Weighting the ADAM II Data .................................................................................................. 101 Imputation of Missing Test Sample Data ................................................................................. 101 Estimating Trends..................................................................................................................... 102 2009 Data Collection ................................................................................................................ 103
Sample Sizes.................................................................................................................. 103 Interview Completion Goals.......................................................................................... 103 Disposition of Sampled Arrestees ................................................................................. 103 Interview Response Rates.............................................................................................. 104 Urine Response Rates.................................................................................................... 106 Indicators of Responding to the Survey ........................................................................ 107 Examination of the Congruence between Self-reported Recent Drug Use and a Positive or Negative Urine Test..................................................................................... 112 Determining Test Thresholds ........................................................................................ 114
: Site Fact Sheets .......................................................................................................... 115Appendix CAtlanta, GA (Fulton County) ........................................................................................116 Charlotte, NC (Mecklenberg County) ...........................................................................120 Chicago, IL (Cook County)...........................................................................................124 Denver, Co (Denver County) ........................................................................................128 Indianapolis, IN (Marion County).................................................................................132 Minneapolis, MN (Hennepin County)...........................................................................136 New York, NY (Borough of Manhattan) ......................................................................140 Portland, OR (Multnomah County)...............................................................................144 Sacramento, CA (Sacramento County) .........................................................................148 Washington, DC (District of Columbia) .......................................................................152
ADAM II 2009 Annual Report Contents iv
List of Figures
Figure 3.1: Rate of Congruence between Self-reports and Urine Tests for Selected Drug Use, 2009 .. 19
Figure 3.2: Percent Admitting to Use When Testing Positive, 2009............................................ 20
Figure 3.3: Percent Testing Positive for Any Drug ...................................................................... 23
Figure 3.4: Percent Testing Positive for Multiple Drugs .............................................................. 24
Figure 3.5a: Percent Testing Positive for Marijuana—East and South .......................................... 26
Figure 3.5b: Percent Testing Positive for Marijuana—Midwest and West .................................... 26
Figure 3.6: Percent Self-reporting Use of Marijuana, Past 30 Days............................................. 27
Figure 3.7a: Percent Testing Positive for Cocaine—East and South ............................................. 31
Figure 3.7b: Percent Testing Positive for Cocaine—Midwest and West........................................ 31
Figure 3.8: Percent Self-reporting Use of Crack Cocaine, Past 30 Days...................................... 32
Figure 3.9: Percent Self-reporting Use of Powder Cocaine, Past 30 days.................................... 34
Figure 3.10a: Percent Testing Positive for Opiates—East and South .............................................. 37
Figure 3.10b: Percent Testing Positive for Opiates—Midwest and West ........................................ 37
Figure 3.11: Percent Self-reporting Use of Heroin, Past 30 Days .................................................. 38
Figure 3.12a: Percent Testing Positive for Methamphetamine—East and South............................. 41
Figure 3.12b: Percent Testing Positive for Methamphetamine—Midwest and West....................... 41
Figure 3.13: Percent Self-Reporting Use of Methamphetamine, Past 30 Days .............................. 42
ADAM II 2009 Annual Report Contents v

Executive Summary
The Arrestee Drug Abuse Monitoring (ADAM II) program is a unique data collection program that
conducts interviews and collects urine specimens in police booking facilities with adult male arrestees
within 48 hours of their arrest. Now in 10 U.S. counties, the ADAM II program is a continuation of
the ADAM program that operated in 35 sites from 2000 to 2003 under the auspices of the National
Institute of Justice (NIJ). Since 2007 ADAM II has been sponsored by the Office of National Drug
Control Policy (ONDCP). Between 2000 and 2009, the ADAM and ADAM II programs1 have
collected over 36,000 interviews in the current 10 sites, representing when weighted over 350,000
arrests; over these years, 89 percent of those interviewed supplied a sample for urinalysis.
The ADAM program is a critical source of information for policymakers dealing with the problems of
drug use. It captures data on a population not well-represented in any other survey, males 18 years
and older at the point of their involvement in the criminal justice system. It is also the only survey
that offers a biological marker of recent use (urinalysis), which when linked to interview data,
validates information about recent drug use. In 2009, 86 percent of arrestees interviewed voluntarily
provided a urine sample for testing. The data are also unique in that interview and urine test data are
collected within 48 hours of arrest, unlike surveys of post adjudicated offenders conducted in jails or
prisons long after the offense has occurred.
ADAM data reflect a population that is quite different from that captured in general population
surveys. Compared to their counterparts (males 18 or older) in the National Survey on Drug Use and
Health (NSDUH), the nation’s primary population survey on drug use, ADAM respondents are more
likely to be unemployed, uninsured and living in transient living arrangements. ADAM respondents
are also more involved with drugs and more experienced with crime. In 20082 only 8 percent of males
18 years or older responding to the NSDUH reported they had used marijuana in the prior 30 days.
Across the 10 ADAM II sites in 2008, from 34 percent (Washington, DC) to 52 percent (Chicago) of
arrestees reported marijuana use in the prior 30 days and from 31 percent (Washington, DC) to 51
percent (Charlotte) tested positive for the presence of marijuana in their systems at arrest. This was a
pattern found with many other drugs: in 2008, 20 percent of males in NSDUH admitted to ever
having used cocaine powder and 5 percent to ever having used crack, while anywhere from 17
1 Henceforth, ADAM II refers to the 10 county data collection program that began in 2007.
2 While this report focuses on 2009 data, the comparable year is not yet available for the NSDUH. Therefore, comparisons are made with the 2008 ADAM II data.
ADAM II 2009 Annual Report Executive Summary vii
(Sacramento) to 44 (Chicago) percent of arrestees tested positive in 2008 for cocaine3 in their system
at the time of arrest, indicating use in the past few days. Heroin, a drug rarely reported in the general
population (.2 percent among 2008 NSDUH comparable males) was detected in urinalysis in
anywhere from 1 percent (Charlotte) to 29 percent (Chicago) in 2008. Any involvement with the
criminal justice system is also far more prevalent among ADAM II respondents. Only 27 percent of
the comparable 2008 NSDUH sample had ever been arrested and only 5 percent in the prior year. By
contrast, anywhere from 59 percent (Washington, DC) to 94 percent (Chicago) of the ADAM II
arrestees had been arrested at least once prior to the current arrest in 2008. ADAM respondents
represent a high proportion of drug users who, due to transient living arrangements and/or frequent
periods of residency that make them ineligible for inclusion in the HSDUH, are somewhat hidden to
traditional data collection efforts.
Finally, ADAM is an important source of information on the local or regional nature of drug
problems. Across the 10 ADAM II sites it is evident that what is a serious problem in Sacramento (31
percent tested positive for methamphetamine in 2009) can be virtually non-existent in New York (0
tested positive). Even in relatively close geographic areas, drug problems can be quite different: 18
percent of Chicago arrestees tested positive for opiates in 2009, while 200 miles away in Indianapolis
only 7 percent tested positive.
This is ONDCP’s third annual report for ADAM II, providing interview and urine test data collected
from a probability-based sample of over 4,700 arrestees from April 1 to September 30, 2009.
Methodology
The ADAM II program continues all data collection protocols used in the 2000–2003 ADAM
program, though it is now limited to 10 of the former ADAM counties. All interview data are
collected by the professional interview staff of Abt Associates in face-to-face interviews conducted in
the booking area of large urban police stations and jails. Each arrestee interviewed is also asked to
supply a urine sample for analysis of 10 substances; and 86 percent of all arrestees interviewed in
2009 agreed to supply a sample. The ADAM program collects these samples and links the results to
answers arrestees supply on patterns of use. All data collected are confidential and provided
voluntarily with informed consent. As in the past, data collected in the consecutive 14-day periods are
Testing for cocaine does not distinguish the form which it is ingested (crack or powder). The ADAM interview asks the respondent to report use of each form in different time frames (ever, 3 day, 7 day, 30 day and 12 month).
ADAM II 2009 Annual Report Executive Summary viii
3
weighted to represent the county in which the primary city sits and annualized to represent the entire
year of arrests.
The sample of arrestees is drawn from all males arrested over the course of each 24-hour period
during the 14 days of collection. In 2009, the program collected 4,746 interviews and 4,077 urine
specimens in the 10 counties, representing 33,725 men arrested in 2009. Across the counties, 7,791
eligible arrestees were sampled from the rosters of those who had been arrested in the appropriate
time period. Eligible arrestees are defined as all males over 18 arrested within the county jurisdiction
on any charge in the prior 48 hours. Not all arrestees sampled are physically available for interview,
however. Some have been released or taken to court by the time the typical eight-hour interview shift
begins (4 PM), or some are in the facility medical unit. In 2009, of the 7,791 arrestees sampled, 5,540
were available for interview; 86 percent of those sampled and available agreed to be interviewed.
As with the original ADAM program, ADAM II data come from two sources: a 20–25 minute
interview and a urinalysis of a specimen for the presence of 10 drugs and/or their metabolites.4 The
interview covers basic demographics (age, employment, housing, education, and insurance coverage),
drug use history, current use, alcohol use, participation in buying and selling drugs in the prior month,
prior drug and mental health treatment, and prior arrests. For those arrestees who report use of any
drugs in the prior 12-month period, additional information is taken on arrests, drug and alcohol use,
and drug, alcohol, and mental health treatment in that year. All arrestees consenting to provide urine
are given a bar-coded specimen cup and escorted to a nearby lavatory. After the process is completed,
respondents are given water and a snack for their participation.
While ADAM sites are not a probability-based sample of U.S. counties, the sample of arrestees
within each county is probability based and weighted to represent all arrests during that time period.
Sampling plans are developed for each site both at the county level and at the facility level. County-
level plans take into account all booking facilities and stratify by size where there is more than one
booking facility. In six of the ten sites there is a single central intake facility that captures all county
arrests. When this is not the case, a stratified sample is created for that county with the sample
allocated proportionate to the size of the facility. This is the case in Atlanta and Washington, DC. In
Atlanta (Fulton County) there are two booking facilities: the Atlanta Detention Center and the Fulton
County Jail. Since these two facilities are approximately equal in terms of arrest volume, interviews
Each sample is bar-coded to match the corresponding interview data. A national laboratory tests all samples for the presence of marijuana, cocaine, opiates, amphetamine/methamphetamine, propoxyphene, phencyclidine, benzodiazepines, methadone, barbiturates, and oxycodone.
ADAM II 2009 Annual Report Executive Summary ix
4
are conducted over seven days in each. In Washington, DC there are seven police districts, each of
which books all arrestees in their jurisdiction. The Washington, DC collection days are assigned to
each district proportional to the volume of arrestees that are booked in each district. The county level
sampling in Hennepin County (Minneapolis), Cook County (Chicago) and Manhattan (New York) are
also somewhat different. Hennepin and Cook Counties have some small suburban facilities and New
York has one mid-town court where a small number of arrestees may be taken. However, the large
central jail in both cases captures the overwhelming majority of county bookings, and data collection
for these sites is conducted only in the large facilities.
In all sites the facility level sampling is the same: within each facility, the 24-hour booking period is
divided into the period before interviewers arrive (termed the stock period) and the period when the
interviewers are present (termed the flow period). The number of stock and flow cases to be sampled
that are assigned in each site to each period is based on current data on the distribution of arrests each
day. Stock cases are sampled from the list of all arrestees processed during that period regardless of
where they are when interviewers arrive. Flow cases are sampled from the flow of arrestees booked
during the interview shift. If a sampled stock arrestee is not available (i.e., not in the facility at the
time of the interview shift) or the sampled arrestee refuses to participate, the reason for non-response
is recorded and the next sampled arrestee is approached. If the sampled flow arrestee is not available
or declines, the reason is recorded and the adjacent arrestee in time is selected. This process continues
until all sampled cases are completed and the shift has ended.
In ADAM II, propensity scores are developed for each site to weight each case, based on detailed
information on all bookings that occurred during the data collection period and known factors that
have an impact on the probability that a case is sampled—arrest charge, time of day, and day of the
week. For example, arrestees with more serious charges are held longer for processing and have a
greater likelihood of still being in the facility when interviewing occurs. Arrestees brought in the
morning hours or during low volume arrest days of the week also are more likely to have been
processed already by the time the interview shift begins. Weighting with these factors in mind
balances the sample.
ADAM II Sample Demographics
Although each site participating in the ADAM II program reflects a unique region of the country, in
many cases the populations of arrestees entering the criminal justice system are more similar than
different. In all sites, the average age of arrestees in 2009 in each site was between 32 and 37;
arrestees were significantly older by roughly two years in 2009 than the sample was in 2007 in New
ADAM II 2009 Annual Report Executive Summary x
York, Sacramento and Portland. The majority of arrestees in all sites were single, ranging from 61
percent (Portland) to 82 percent (Washington, DC) in 2009. Over 84 percent of arrestees were U.S.
citizens in 2009, though this percentage declined significantly in three sites since 2007 (Charlotte,
Minneapolis, and Indianapolis) and in one site since 2008 (Sacramento), but increased significantly in
Portland from 2008 and in Washington, DC from 2007.
In all ADAM II sites, over 65 percent of arrestees had a high school diploma or its equivalency in
2009, ranging from 66 percent (Chicago and Atlanta) to 75 percent (Portland and Washington, DC).
Over 40 percent of arrestees in 9 of the 10 sites (the exception is Portland) reported they worked at
least part time, though this reflected a significant decline in employment since 2007 in 7 of the 10
sites. Employment among arrestees in Portland had the steepest decline since 2007: from 45 percent
in 2007 to 27 percent in 2009. Additionally, in 8 of 10 sites less than half of all arrestees had any form
of health insurance in 2009, including state-sponsored programs such as Medicaid and Medicare,
employer-based, Veterans Affairs, union, or other plans.
Across all sites, experience with the criminal justice system prior to the current arrest was common.
In 2009, 78 percent or more of arrestees in all sites reported at least one arrest prior to the current one,
ranging from 78 percent in Charlotte and New York to 93 percent in Chicago. In some sites, more
arrestees in 2009 had arrest histories than was true in the early years of ADAM (2000-2003)—
Chicago, Atlanta, and Washington, DC. In other sites, the proportion with prior arrests was currently
lower than in prior years—Indianapolis, Charlotte, Minneapolis and Sacramento.
Interviewers record the three most serious charges for all arrestees from the official booking record of
each arrestee. The percentage of arrestees charged with violent crimes was over 15 percent in 9 of the
10 sites (the exception is Washington, DC), ranging from 17 percent of cases in Atlanta to 31 percent
in Chicago. The percentage of arrestees charged with drug-related charges was over 20 percent in all
sites in 2009, reaching almost 50 percent in Chicago and Washington, DC. Arrests for property
crimes ranged from 11 percent of arrestees in Washington, DC to 34 percent in New York, while
assorted “other” crimes, including probation/parole violations, disturbing the peace, traffic-related
offenses, and other more minor crimes, made up over 40 percent of charges in 6 of the 10 sites.
Comparisons between those arrestees who tested positive for drugs and those who did not in 2009
indicate that those testing positive were significantly more likely than non-users to report an arrest
prior to the current one in 9 of the 10 sites; were more likely to be a US citizen in 9 of the 10 sites;
were less likely to be employed in 6 of the 10 sites; and were significantly younger in half of the sites.
ADAM II 2009 Annual Report Executive Summary xi
Drug Use and Drug Market Participation
One of the advantages of the ADAM II program is its ability to test the veracity of answers about
drug use through the use of the urine test. Arrestees’ answers to questions about their drug use within
the appropriate windows of detection for each drug are matched to the laboratory results for each
case. In 2009, the percentage of overall truthful answers on drug use (that is, the total of arrestees who
used a drug and admitted it, and those who did not use and answered negatively) was high 83 percent
or more arrestees responded truthfully regarding use of marijuana and cocaine, and over 95 percent
responded truthfully about heroin and methamphetamine.
There were differences, however, when looking at the truthfulness of those who both actually used
the drugs and admitted it. This varied by the drug used. In 2009, users of more highly stigmatized
drugs like heroin, cocaine, and methamphetamine were less likely to admit use than users of
marijuana. In 2009, marijuana was more universally admitted (81 percent or greater congruence in all
10 sites), but admitting cocaine use varied from 30 percent of users testing positive and admitting use
in Indianapolis to over half of users in Portland, Washington, DC, and Denver. Opiate use admission
was even more variable—only 15 percent of those testing positive in Charlotte (where opiate use was
fairly rare) admitted to use compared to over half of the opiate users in Chicago and New York and
81 percent of users admitting use in Portland, where opiate use was more common.
Use of Any Drug/Multiple Drugs
The results of urinalysis indicating the presence of any test substance showed that in 2009 anywhere
from 56 percent (Charlotte) to 82 percent (Chicago) of arrestees across sites tested positive for the
presence of some substance in their system at the time of arrest. In 2009, in 9 out of the 10 sites, 60
percent or more of arrestees tested positive. From 2000 and 2001 to 2009 the percentage testing
positive for any substance declined in Charlotte, New York and Sacramento. While many sites
experienced significant shifts from year to year, only Atlanta, Chicago, Indianapolis and New York
showed significant declines over the 9 year period.
Many arrestees were also likely to have more than one drug in their system at the time of arrest: in
2009 anywhere from 12 percent (Charlotte) to 28 percent (Chicago) of arrestees tested positive for
multiple drugs. This represented a significant decline in both of these sites that began in 2000.
ADAM II 2009 Annual Report Executive Summary xii
Marijuana Use and Market Participation
In 2009, marijuana continued to be the most commonly used illegal substance among booked
arrestees in all sites but Atlanta, where the same percentage of arrestees tested positive for cocaine.
Over 40 percent of arrestees in 8 of the 10 sites tested positive for marijuana in 2009, ranging from 36
percent testing positive for marijuana in Charlotte to 49 percent in Chicago. Most sites have remained
at high levels of marijuana use over the nine years of data collection. The exceptions are Minneapolis
and Sacramento that experienced a significant decline over that time period, and Denver and Portland
that have shown a significant increasing trend.
When asked about use of marijuana in the prior 30 days, anywhere from 35 percent of male arrestees
in Charlotte and Minneapolis to 48 percent in Denver admitted that they had used in the prior 30 days.
These reports were significantly lower in 2009 than in 2007 or 2008 in Charlotte, Minneapolis and
Chicago. More arrestees admitted to use in the past 12 months—over 40 percent in all sites and 50
percent or more in three sites (Portland, Sacramento, and Denver). Arrestees who admitted that they
used marijuana in the prior 30 days also admitted frequent use, ranging from 12 out of the prior 30
days on average in Charlotte to 18 out of 30 in Chicago and New York. In 6 of the 10 sites, marijuana
users reported that they used on more than half of the prior 30 days.
All arrestees are asked if they acquired each of the five major drugs in the prior 30 days, regardless of
whether it was for their own use.5 If the answer is “yes,” they are then asked a series of questions
about how, where, and from whom (regular source, new source, etc.) they acquired the drug, the unit
purchased, and the price paid (or value of the barter).
In 2009, marijuana remained the most commonly acquired drug, with over 30 percent of arrestees in
all sites reporting that they acquired it in the prior 30 days and more than half of those arrestees in 9
sites reporting acquiring it through cash purchases in the past 30 days. Overall participation in the
marijuana market (cash and noncash transactions) in the past 30 days by arrestees has remained
constant in 8 sites; two sites, however, experienced significant declines since 2008—from 46 percent
of arrestees reporting acquiring marijuana in Charlotte in 2008 to 33 percent in 2009, and from 44
percent in 2008 to 31 percent in 2009 in Minneapolis. Some sites showed significant shifts from the
early years of ADAM. For example, in Minneapolis in 2000-2002, 45 to 54 percent of arrestees
reported acquiring marijuana, significantly greater than the 2009 reports (31 percent). In Charlotte
Arrestees may acquire a drug to save, sell or give to someone else.
ADAM II 2009 Annual Report Executive Summary xiii
5
between 2001 and 2009 the proportion of arrestees acquiring marijuana remained anywhere from 43
to 49 percent, significantly higher than the 2009 reports (33 percent).
Cocaine Use6
Cocaine, either in the form of powder or crack, was the second most commonly used substance
among arrestees in 2009 in all but Sacramento and Atlanta. In Sacramento, 46 percent of arrestees
tested positive for marijuana, 31 percent for methamphetamine and 11 percent of arrestees for
cocaine. Atlanta (37 percent) led the sites in 2009 in the proportion of arrestees testing positive for
cocaine, the same proportion that tested positive for marijuana. Chicago (33 percent) and New York
(32 percent) were the next two highest proportions. It was considerably less common in arrestees in
two Western sites (16 percent in Portland and 11 percent in Sacramento).
While still high, in all 8 sites that collected data in 2000 and 2001, the proportion of arrestees testing
positive for cocaine had significantly declined by 2009. In cases like New York, the trend was both
significant and dramatic—from 52 percent of arrestees testing positive in 2000 to 32 percent in 2009.
There have been more shifts in cocaine use among arrestees over the prior nine years than found with
marijuana. Many sites like Atlanta and Chicago maintained high levels of use (over 40 percent testing
positive) until 2009, when the percent testing positive declined to 37 in Atlanta and 33 percent in
Chicago. Significant declining trends over the nine years were also evident in Indianapolis and
Minneapolis.
Across all sites, the majority of arrestees who tested positive for cocaine in 2009 reported using crack.
While many arrestees testing positive for cocaine did not admit use in either form over the prior three
days, of those testing positive and willing to specify, crack was identified as the form used 2 to 10
times as often.
Crack Use and Market Participation
The popularity of crack varies across sites, though self reported use in the prior 30 days since 2007 in
general has declined in 8 of the 10 sites. In 2009, the Atlanta site had the greatest proportion of
arrestees who admitted using crack in the prior 30 days (19 percent) and prior year (21 percent).
Note that the test results shown in these figures represent cocaine in both powder and crack form, as either form produces a positive drug test result. Across all sites, the majority of arrestees who tested positive for cocaine reported being crack users.
ADAM II 2009 Annual Report Executive Summary xiv
6
Denver and Chicago follow, with 14-15 percent reporting use in the prior 30 days, and 16–19 percent
in the prior 12 months. Eight of the 10 sites showed statistically significant reductions since 2007 in
the self-report of crack use in the prior 30 days, and four sites (Charlotte, Chicago, Minneapolis and
Sacramento) continued to decrease significantly from 2008 to 2009. In only one site (New York) did
self-reported crack use increase significantly in 2009 from 2008.
In 2009, four sites showed significant decreases in self-reported participation in the crack cocaine
market from 2008 levels. Charlotte dropped from 15 percent to 8 percent of arrestees who reported
acquiring crack cocaine in the past month; Chicago dropped from 26 percent to 17 percent;
Minneapolis dropped from 16 percent to 9 percent; and Sacramento dropped from 10 percent to 5
percent. Activity in acquiring crack was significantly lower from earlier years in all sites. For all eight
of the current sites that collected data in 2000 and 2001, the proportions of arrestees who acquired
crack in the prior 30 days was significantly lower in 2009 than in those first years of the program. The
two sites that began collection in 2002 (Washington, DC and Atlanta) both also had significantly
larger proportions of arrestees acquiring crack in 2002 or 2003 than found in 2009.
Cocaine Powder Use and Market Participation
Fewer arrestees reported recent use (past three days) of cocaine in powder form than reported more
distant use. Self-reported use of powder cocaine in the prior three days ranged from 1 percent or less
in Indianapolis and Washington, DC to 7 percent in Denver. More powder users admitted some use in
the prior 30 days (ranging from 2 percent in DC to 10 percent in Denver) or in the prior 12 months
(ranging from 2 percent in DC to 17 percent in Denver). Only one site (Chicago) experienced a
significant change (increase) in the proportion of arrestees reporting use in the prior 30 days since
2008 in any site, though there were significant declines between 2007 levels in Charlotte, Denver,
Portland and Sacramento.
The proportion of arrestees who reported obtaining powder cocaine in the past month remained
unchanged in 2009 compared to 2008. Between 1 and 11 percent of arrestees across sites reported
acquiring powder cocaine. The proportion of arrestees reporting acquiring cocaine powder in the prior
30 days was at the lowest point in 2009 in 8 of the 10 sites than seen in all ADAM years. Sacramento
showed comparable levels from 2000-2003, reached a significantly higher point in 2007 and fell
significantly in 2009 to 4 percent. Cocaine powder acquisition in Chicago has remained essentially
unchanged for the prior nine years, varying from 4 to 9 percent.
ADAM II 2009 Annual Report Executive Summary xv
Heroin Use and Market Participation
There was considerable variation in the proportion of arrestees testing positive for opiates across the
ADAM years. Chicago again led the 10 sites in 2009 in opiate use (18 percent tested positive), though
there has been a significant decline from 29 percent testing positive in 2008. Washington, DC, by
contrast, showed a significant increase in the proportion of opiate positives from 2008 to 2009 (from
12 to 15 percent). In 2009, Charlotte had the lowest proportion testing positive for opiates (2 percent)
of all sites followed by Atlanta (3 percent). Most sites have remained relatively constant since 2000,
with from 5 percent to 7 percent of arrestees testing positive for opiates. Notable exceptions are New
York and Portland, which peaked at 20 and 16 percent, respectively, in 2000 and 2003, declined
significantly over the next two years, and remained around 10 percent in 2009. Sites with few opiate
positives like Atlanta, Charlotte, Minneapolis and Sacramento remained relatively unchanged from
2000 to 2009.
The proportion of arrestees who reported acquiring heroin in the past month continued to vary across
sites and over time. In some sites in 2009 (Atlanta and Charlotte), less than 1 percent reported
acquiring heroin, while in others (Chicago and Portland) the proportion was 12 percent or greater.
There have been some significant changes in some sites: in Chicago heroin acquisition continued a
significant decline from the high of 32 percent in 2000 to 15 percent in 2009. In Denver and Portland,
acquisition rose significantly from 2008 to 2009, from 2 percent to 4 percent in Denver and 8 percent
to 12 percent in Portland.
While the proportion of arrestees reporting obtaining heroin fluctuated in some sites, the average
number of purchases each month remained steady across all sites between 2008 and 2009, with the
exception of Atlanta (this estimate, however, reflects less than 1 percent of the arrestee sample). For
most sites, the average number of heroin purchases was much higher than for other drugs (between 9
and 26 in the past month), indicating heavy market participation for these arrestees, despite their
relatively small representation in the sample as a whole.
Methamphetamine Use and Market Participation
Methamphetamine use remained concentrated in two of the Western ADAM II sites. In 2009, positive
tests for the presence of methamphetamine were highest in Sacramento (31 percent test positive) and
Portland (13 percent) and 1 percent or less in Indianapolis, Atlanta, Charlotte, Chicago, Washington,
DC and New York. Though still high, the proportion of arrestees testing positive for
methamphetamine in Portland and Sacramento was significantly lower when compared to earlier
ADAM II 2009 Annual Report Executive Summary xvi
ADAM collections. In Portland, over 20 percent of arrestees tested positive from 2000 to 2007,
significantly higher than found in 2009. In Sacramento use reached a high point in 2003 at 46 percent
positive, significantly higher than found in 2009 (31 percent).
Self-reported methamphetamine use was also highest in the two Western sites: 25 percent of arrestees
in Sacramento and 13 percent in Portland admitted to use in the prior month—significantly higher
compared to 2007 for Portland. Only Denver came even marginally close to those figures: 5 percent n
Denver admitted prior 30-day use and 7 percent admitted prior year use. There was no significant
change in any self-reported use in any site from 2008 to 2009.
Methamphetamine market participation remained limited in most ADAM sites. In six sites less than 1
percent of arrestees reported obtaining methamphetamine in the previous month; in 2009 in two other
sites, Denver (5 percent) and Minneapolis (1 percent), 5 percent of arrestees or fewer reported any
past month acquisition. In Portland (14 percent) and Sacramento (26 percent), there was no change in
arrestee reports of methamphetamine acquisition since 2008 but a significant decline since earlier
peak years in both sites.
Other Drugs
In addition to the five major drugs mentioned above, arrestees are tested for the presence of other
drugs (barbiturates, Darvon, methadone, oxycodone, PCP, and benzodiazepines) and also asked to
identify which drugs from a list of drugs they have used without a prescription7 in the prior month.
The results of testing for other drugs indicated that in all sites, compared to the five major drugs of
interest, there were fewer positive tests for the other drug categories. Methadone was most often
found in New York (7 percent). PCP, a drug once popular in many areas and one of the NIDA-5 test
drugs, was detected in only a few individuals in half of the ADAM II sites. Oxycodone, the synthetic
narcotic that has gained popularity as a street drug, appeared in 8 of the 10 sites, and in New York the
proportion rose significantly to 2 percent in 2009. There were no significant changes from 2008 to
2009 in any of the other drugs for which ADAM II tests.
Self-reports of other drugs indicated that other opiate painkillers (for example, Demerol, Dilaudid,
Percodan, Vicoden) were the most commonly named “other drugs” in most sites. Four percent of
The list contains both prescription drugs that may be abused (barbiturates, sedative/tranquilizers, and oxycodone) and nonprescription drugs of abuse (GBH, MDMA, LSD, and PCP).
ADAM II 2009 Annual Report Executive Summary xvii
7
arrestees mentioned illicit use of other opiate painkillers in the prior 30 days in 9 of the 10 sites,
ranging from 2 percent in New York to 10 percent in Portland and Indianapolis.
Report Format
The ADAM II 2009 Report is divided into four sections. Section 1 presents information on the
ADAM II program, comparing it to the earlier ADAM program funded by the National Institute of
Justice from 2000 to 2003, and provides a brief description of the program methodology. Section 2
provides a description of the ADAM II sample, including demographics, arrest histories, and
treatment experiences. Section 3 presents findings on drug use and drug market activity among
booked adult male arrestees. Section 4 offers a brief summary and conclusions. These are divided by
different drug types—marijuana, cocaine (in powder and crack form), heroin, methamphetamine, and
selected other drugs.
Figures illustrating results are included in the main body of the report. All data tables are referenced
in text, but are presented in Appendix A. Data in Appendix A are annualized, and the significance of
trends is estimated using regression models.8 Appendix B presents more detailed information on the
program methodology, and Appendix C provides 2009 results for each site in site-specific “Fact
Sheets.”
This report presents 2009 findings from all 10 ADAM II sites. The same sites participated in 2000-
20039, 2007 and 2008 ADAM II data collection. Some 2000-2003, 2007 and 2008 results are
included in this report to examine trends. As was the case in 2007 and 2008, data were collected for
two calendar quarters and then used to generate annualized estimates for each site. Data are not
aggregated across sites, but presented site by site. In general, the samples collected in each site are
adequate for reporting and data analysis. However, in some instances, depending on the analysis, (for
example, methamphetamine market activity in some Eastern sites) there are too few cases to serve as
the basis of reliable estimates. The site is then excluded from cross-site comparisons, and an “n/a” is
noted for that site in the relevant table.
8 Data from 2000-2003 were re-estimated using the methodology utilized in 2007-2009 for ADAM II.
9 Eight of the 10 sites began data collection in 2000: New York, Charlotte, Indianapolis, Minneapolis, Denver, Chicago, Portland and Sacramento. Atlanta and Washington, DC joined ADAM in 2002.
ADAM II 2009 Annual Report Executive Summary xviii
Throughout the report, when comparisons are made to results from prior ADAM collections (2000-
2003, 2007, and 2008). Differences between those years and 2009 that are statistically significant at
the .10, .05, and .01 levels are identified. Otherwise, comparisons reported do not yield significant
differences. The report includes the less stringent .10 significance level to provide more flexibility
when considering possible trends over time.
One of the primary goals of the ADAM II program is to provide trend information on how drug use
and related behavior among arrestees may have changed over time. The consistency in methodologies
between ADAM and ADAM II supports this goal. However, ensuring data remain representative of
the arrestee population requires continuous review and, if necessary, changes to enhance the
representativeness of the sample, which can result in some adjustments to the analysis over time.
There were no changes to the samples collected in 2007 through 2009 in any of the 10 ADAM II
sites. However, some changes took place between 2003 and 2007 that necessarily affect trend
analysis. These changes were discussed in more detail in ONDCP’s 2007 annual report on ADAM II
and are not repeated here.
ADAM II 2009 Annual Report Executive Summary xix

1. An Overview of the Arrestee Drug Abuse Monitoring (ADAM II) Program
What Is ADAM?
The Arrestee Drug Abuse Monitoring (ADAM II) program is a unique data collection program that
conducts interviews and collects urine specimens in police booking facilities with adult male arrestees
within 48 hours of their arrest. Now in 10 U.S. counties, the ADAM II program is a continuation of
the ADAM program that operated in 35 sites from 2000 to 2003 under the auspices of the National
Institute of Justice (NIJ). Since 2007 ADAM II has been sponsored by the Office of National Drug
Control Policy (ONDCP). Between 2000 and 2009, the ADAM and ADAM II programs1 have
collected over 36,000 interviews in the current 10 sites, representing when weighted over 350,000
arrests; over these years 89 percent of those interviewed supplied a sample for urinalysis.
The original ADAM program was initiated by NIJ to address a critical need for valid information on
the extent of drug use among persons involved in the criminal justice system. An earlier NIJ effort,
the Drug Use Forecasting program (DUF, 1988–2000), conducted brief interviews and collected urine
specimens from a convenience sample of arrestees in 23 cities. While DUF was a landmark effort, it
was not able to support either analyses of trends in drug use or estimations of prevalence. From 1997
to 1999, NIJ redesigned DUF to address its limitations, and the program was renamed ADAM. The
redesigned program established probability-based sampling of booking facilities and arrestees in the
targeted counties, introduced an expanded survey instrument that covered new topics such as drug
market activity and treatment experience, and expanded the data collection counties from 23 to 35.
ADAM provided county level estimates of drug use and related behaviors among arrestees from 2000
to 2003, but it was terminated by NIJ in 2003 due to lack of funding. In 2007, ONDCP, recognizing
the need for these data, reinstated the program as ADAM II in 10 former ADAM sites (Exhibit 1.1).
While ADAM sites do not constitute a probability-based sample of all U.S. counties, as all sites were
originally selected purposively, the data do represent arrestees in the counties from which they were
drawn, and the program provides consistent data that support statistical trend analysis in those 10
counties from 2000 to 2009.
Henceforth, ADAM II refers to the 10 county data collection program that began in 2007.
ADAM II 2009 Annual Report An Overview of ADAM II 1
1
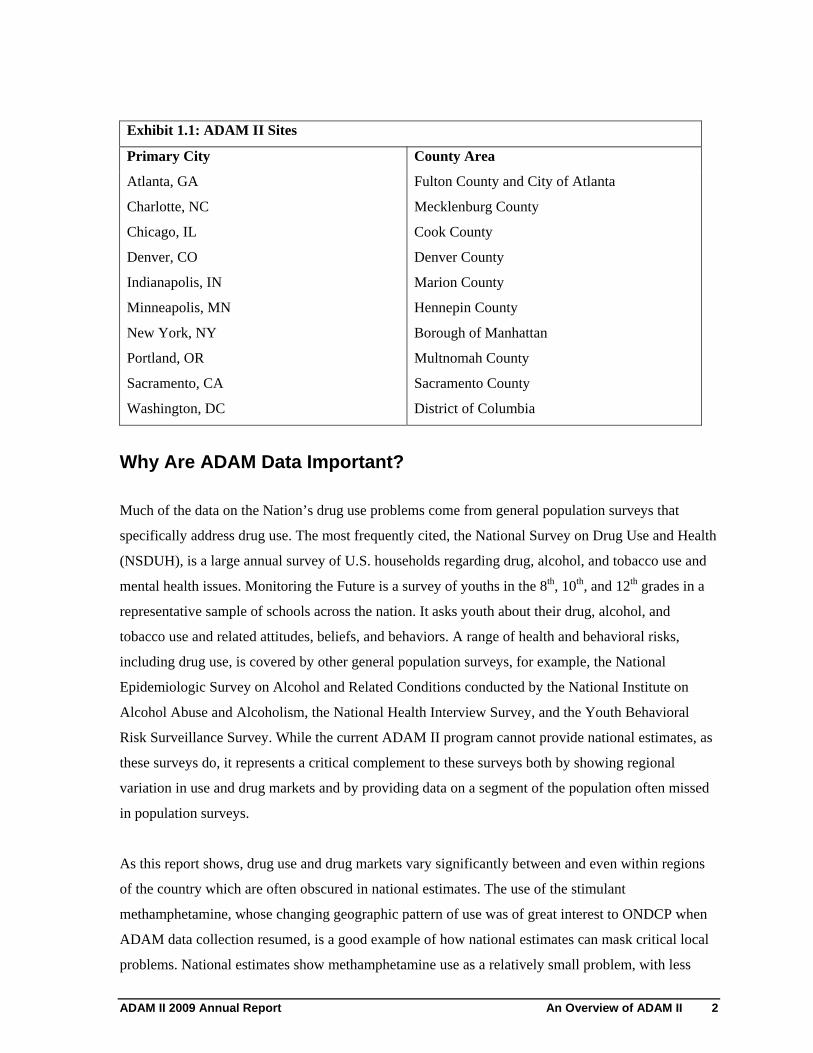
Exhibit 1.1: ADAM II Sites
Primary City
Atlanta, GA
Charlotte, NC
Chicago, IL
Denver, CO
Indianapolis, IN
Minneapolis, MN
New York, NY
Portland, OR
Sacramento, CA
Washington, DC
County Area
Fulton County and City of Atlanta
Mecklenburg County
Cook County
Denver County
Marion County
Hennepin County
Borough of Manhattan
Multnomah County
Sacramento County
District of Columbia
Why Are ADAM Data Important?
Much of the data on the Nation’s drug use problems come from general population surveys that
specifically address drug use. The most frequently cited, the National Survey on Drug Use and Health
(NSDUH), is a large annual survey of U.S. households regarding drug, alcohol, and tobacco use and
mental health issues. Monitoring the Future is a survey of youths in the 8th, 10th, and 12th grades in a
representative sample of schools across the nation. It asks youth about their drug, alcohol, and
tobacco use and related attitudes, beliefs, and behaviors. A range of health and behavioral risks,
including drug use, is covered by other general population surveys, for example, the National
Epidemiologic Survey on Alcohol and Related Conditions conducted by the National Institute on
Alcohol Abuse and Alcoholism, the National Health Interview Survey, and the Youth Behavioral
Risk Surveillance Survey. While the current ADAM II program cannot provide national estimates, as
these surveys do, it represents a critical complement to these surveys both by showing regional
variation in use and drug markets and by providing data on a segment of the population often missed
in population surveys.
As this report shows, drug use and drug markets vary significantly between and even within regions
of the country which are often obscured in national estimates. The use of the stimulant
methamphetamine, whose changing geographic pattern of use was of great interest to ONDCP when
ADAM data collection resumed, is a good example of how national estimates can mask critical local
problems. National estimates show methamphetamine use as a relatively small problem, with less
ADAM II 2009 Annual Report An Overview of ADAM II 2
than 1 percent of persons in the general population reporting recent use. By contrast, data from
treatment admissions in Western states indicate a methamphetamine problem three to four times
larger.2 ADAM data have always reflected the dramatic regional pockets of methamphetamine use;
the number of arrestees testing positive for methamphetamine at the time of arrest has been more than
30 percent in Sacramento since 2000, though methamphetamine levels in New York and Chicago
arrestees have never risen above 1 percent.
ADAM data on drug use are also often dramatically different from general population data, where
serious drug use and participation in the drug market are more rare events. For example, there were
considerable differences between 2008 ADAM II data and data for males 18 and older from the
general population in NSDUH about the use of crack cocaine in the prior month.3 The NSDUH found
that 0.3 percent of males over 18 reported using crack cocaine in the prior month, compared to
ADAM II 2008 findings of anywhere from 7 percent (New York) to 23 percent (Atlanta and Chicago)
of arrestees who reported crack use in the previous 30 days. Substantial differences like this were
evident for all of the illegal drugs reported in ADAM II when compared to general population
surveys, emphasizing the unique nature of the arrestee population. It is certainly true that differences
between ADAM II respondents and comparable NSDUH respondents may stem from ADAM’s
regional focus. However, basic differences in the populations were also apparent. ADAM II
respondents in all sites were less likely to be employed: anywhere from 44 percent of arrestees in
Portland in 2008 to 61 percent in Indianapolis were working either full or part time compared to 75
percent of the 18 or over males in NSDUH. ADAM II respondents were also more involved in crime.
Obviously, all of the ADAM II sample had been arrested at least once, but only 27 percent of the
comparable NSDUH sample had ever been arrested.
Why are ADAM respondents different than general population samples? First, a substantial portion of
arrestees in ADAM II reported transient living arrangements: that is, they lived temporarily with
friends or relatives and change residence throughout the year, and thus they were more likely to be
ineligible for inclusion in the household survey. In 2009, between 2 percent (Chicago) and 29 percent
(Portland) of arrestees reported that they had been homeless or institutionalized in the prior 30 days.
Second, drug use is a highly stigmatized behavior, and users may be less likely to admit use when
interviewed in their homes, particularly when they know there is no means of verifying the
2 Office of Applied Studies, Substance Abuse and Mental Health Services Administration, “The DASIS Report,” January 17, 2008.
3 The NSDUH data are not yet available for 2009. These numbers represent online analysis of males 18 and over.
ADAM II 2009 Annual Report An Overview of ADAM II 3
information. In ADAM II, the jail provides a more anonymous setting than a respondent’s home, and
no identifying information is taken from or attached to the arrestee. In addition, arrestees are informed
that a urine sample will be requested to test for the presence of drugs, providing a validation of
use/non-use answers.
For these reasons ADAM II provides an important window into a part of the population not readily
accessed through traditional population surveys, but one which is heavily involved in drug use. As
this report indicates, this segment is more involved in the criminal justice system, both at the moment
of interview and in the past, and more involved in illegal drug use.
What Is the ADAM II Methodology?
This section provides a brief overview of the methodology used in ADAM II, including a description
of sampling, case weighting, imputation, trend estimates, and drug testing. For a complete
explanation of ADAM II methodology, please refer to ADAM II Technical Documentation Report
available on Interuniversity Consortium for Political and Social Research (ICPSR)
www.icpsr.umich.edu.
How Does ADAM II Continue the Methods of the Original ADAM Program?
Since 2007, the ADAM II program has replicated all instrumentation, sampling, and data collection
protocols that were utilized in the NIJ-funded ADAM program from 2000 to 2003. This has
supported a time series of data on drug use and related behaviors in the 10 ADAM II sites, all former
ADAM sites (Exhibit 1.1). As the exhibit indicates, each site is named for the primary city of the
county in which it exists. In most cases, booking of all arrestees occurs in a central county jail. In
other instances, such as Atlanta, Chicago, and Washington, DC, booking occurs in more than one
facility, and sampling plans differ somewhat in those counties.
The ADAM II program follows the same protocols established in ADAM. The program:
Obtains voluntary consent for the interview and urine testing from each arrestee.
Collects data in voluntary, confidential, face-to-face interviews lasting 20–25 minutes in the holding area of sampled booking facilities.
Collects a voluntary urine sample from arrestees at the conclusion of the interview and ships all samples to a central laboratory for testing; each sample is bar-coded to match an arrestee’s interview data.
Utilizes a systematic sampling process to identify eligible arrestees who are approached for interviews.
ADAM II 2009 Annual Report An Overview of ADAM II 4
Collects data in each site in two 14-day periods in two quarters of the year.
Offers an incentive (candy, chips, water) for participation.
Makes no changes in the data collection protocols for ADAM II, although there are refinements to some of the analytic strategies, made to improve the precision of estimate and the explanatory source of the data.
Estimates significance of trends over time using model-based procedures.
Uses propensity scores in case weighting.
Imputes missing urine test data.
How Are Facilities and Arrestees Sampled?
The ADAM II sites are not a probability-based sample of all U.S. counties. In the original ADAM
program, sites were selected by NIJ from local areas that submitted grants to participate. In ADAM II,
10 sites were chosen by ONDCP from the original 35 with four things in mind: geographic
distribution, quality of data from ADAM years, some over-representation of sites east of the
Mississippi to examine any spread of methamphetamine, and a preference for sites with simple
booking arrangements; that is, central intake facilities versus multiple booking locations in a county.
The result is 10 sentinel sites, each with adequate data to estimate trends from 2000 forward. Within
each site, however, arrestees are a probability-based sample of those booked in the facilities for the
two quarterly 14-day periods, and data are annualized to represent the year of arrests in those
facilities.
Sampling plans are created at the county and facility levels. County-level plans document the total
number of booking facilities and identify the facilities selected for data collection. In most ADAM II
counties, regardless of the arresting agency, all persons arrested are taken for booking to a central jail.
In other counties, there are multiple jails where bookings take place. In some multiple jail situations
(as in Atlanta and Washington, DC), the number of facilities is small, all are included in the sampling
frame, and the site constitutes a stratified random sample. In other instances, as in the Borough of
Manhattan and Hennepin County, there is a single, very large facility where the majority of arrestees
are booked, and for reasons of cost the small facilities are excluded. The case of Cook County is
somewhat different in that misdemeanor bookings can occur in any of the 96 police precincts and
many towns in the county, but all serious misdemeanor and felony offenders are brought to the central
Cook County Jail, where the ADAM II program conducts interviews.
Conducting a survey of arrestees within 48 hours of their arrest raises methodological and logistical
challenges. The facilities are dynamic, with arrestees being brought in, booked, transferred, or held
ADAM II 2009 Annual Report An Overview of ADAM II 5
throughout every 24-hour period, seven days a week. Developing representative samples in this
environment is challenging.
Ideally, researchers might randomly sample all time periods during the two-week period, station
interviewers in jails, and allow those interviewers to systematically sample and collect data for new
arrestees as they are booked. In reality, however, individual jails place restrictions on data collection,
based on their local regulations and operational inconvenience, and limit access to arrestees during
certain hours. And, in fact, bookings are concentrated during certain periods and are infrequent during
other periods, resulting in off-peak periods during which interviewers would be idle.
As a result, the original sampling plan developed for ADAM and continued in ADAM II partitions a
24-hour sampling frame into two strata: an existing stock of arrestees present in the facility when a
data collection period begins, and a flow of arrestees who enter the jail after data collection has begun.
Interviewers, working the same eight-hour period every day, systematically sample from the stock of
offenders who were arrested during the previous 16 hours and from the flow of arrestees who arrive at
the jail during the eight-hour work shift. Sampling rates are set based on a review of all recent
bookings over a two-week period so that the sample is roughly balanced, meaning that every offender
would have about the same probability of being selected into the sample.
However, the sample is not perfectly balanced because not all arrestees sampled are still in the facility
when scheduled for interviews. Some have been taken to court and/or been released. Those who were
booked just after the last data collection shift ended have a greater likelihood of being released
already; those who were booked closer to data collection shifts are more likely to still be in the
facility. In addition, arrestees with more serious charges, outstanding warrants, or illnesses are also
more likely to still be in the facility. If a sampled arrestee is not available, he is replaced with his
nearest neighbor with respect to booking time. Still, these factors lead to variations in the probability
of being interviewed, and these have to be factored into sampling weights. Variation in the sampling
probability is less of a problem with the cases in the flow period, as they are a continual set of persons
being booked, and if a replacement is needed, the nearest temporal neighbor to the interview time is
selected, thus representing the entire shift period. It is the stock sample where sampling rates are most
variable.
The result of the sampling procedure is that each arrestee in the sample has an estimated probability
of being selected into the sample that varies with arrest charge, the number of bookings during
ADAM II 2009 Annual Report An Overview of ADAM II 6
different times of day, and the time of bookings. Propensity scores, discussed in the section that
follows, are developed to weight each case based on these factors.
Professional interviewers at each site manage the sampling process and interview the sampled
arrestees. Just prior to the beginning of the shift the lead interviewer receives from the law
enforcement agency a list of all persons who have been booked since the end of the prior data
collection shift (the prior day in ongoing collection, or the prior 24 hours on Day 1 of collection): the
stock period. Using the guide supplied by ADAM sampling staff for the target number of cases to be
sampled from the stock period, the lead interviewer selects every nth case from a list sorted by
booking time and completes a study facesheet. The interviewer assigned to the stock sample proceeds
through the sampled cases, requesting that officers bring the selected arrestee to the interview area. If
an arrestee has been released or is not available (for example, if the arrestee is in court or in the
medical unit, or if the arrestee, once brought to the interviewer, refuses), he remains part of the
sample but is replaced with the nearest neighbor and the reason for no interview is recorded. This
process continues until the target stock number is reached.
Cases in the flow period are sampled using the continuously accumulating booking records of those
arrested during the shift. Information is filled in for the sampled case, and the arrestee is approached
by the interviewer. If he refuses, he remains part of the sample, the reason for refusal is recorded, the
nearest case in time is selected as a substitute, and the interviewer approaches the replacement
arrestee. As interviewers finish a case, the most recently booked arrestee becomes the next case to
approach. This process continues until the data collection shift is over.
The ADAM II interview occurs in varying locations, depending on the site. In most sites,
interviewing occurs in an area or room that is isolated from other detainees. In Sacramento and
Indianapolis, for example, cells not in use in the booking area are utilized. In Manhattan, the
interviewing occurs at the bars of the large holding cells in the booking area. In each case, the
interviewer and respondent are within eyesight, but not hearing, of the officer assigned to the program
for the shift. The 20–25 minute interview is recorded in paper and pencil format due to security
requirements that preclude use of any electronic equipment in most facilities. The reading of a
consent statement and an explanation of the study precedes any interviewing, and all participation is
voluntary. Interviews are conducted in either English or Spanish, and each site team includes at least
one bilingual interviewer.
ADAM II 2009 Annual Report An Overview of ADAM II 7
At the conclusion of the interview, the arrestee is asked again if he is willing to provide a urine
sample for testing. If he consents, he is escorted to a nearby lavatory4 and given a urine cup bar-coded
with the numeric identifier that is also placed on the facesheet and interview form. The sample is
transported to the central laboratory for testing (See Exhibit 1.2). No identifying information on the
arrestee is retained, included on any data collection tool, or shared with law enforcement.
Exhibit 1.2: ADAM II Drug Testing
ADAM II is the only U.S. survey of drug use that provides verification of self-report data on drug
use through the testing of a biological sample that is linked to a respondent's answers. At the
initiation of the interview the arrestee is asked if he will provide a sample for testing. He may
continue with the interview regardless of the answer, though the reverse is not true—a sample
cannot be taken without an interview. Interview questions are designed to match the approximate
windows of detection for the drugs in question (3 days, 7 days, and 30 days). The samples are tied
to interview data through a common bar code placed on the interview form and the sample bottle.
All samples are shipped to Kroll Laboratories for testing using immunoassay for the presence of 10
drugs (cocaine, marijuana, opiates, PCP, amphetamines, barbiturates, benzodiazepines, methadone,
propoxyphene, and oxycodone), using the same cutoff or threshold detection levels as used
previously in ADAM. Any positive amphetamine sample is confirmed for methamphetamine. If a
sample is negative, it means the drug was either not present or present at a level too low to be
detected. (See Appendix B, “Determining Drug Test Thresholds.”)
How Are Cases Weighted?
The goal of each site’s sampling plan is for every arrestee to have roughly the same probability of
being sampled and interviewed. However, a number of factors produce variation in the rate at which
arrestees are sampled—notably the time of day they are arrested, the day of the week, and the charge.
Arrestees brought in earlier in the day or on busy arrest flow days have a lower probability of being in
the facility during interviews. Those charged with more serious crimes and/or have outstanding
warrants that need to be checked are more likely to be retained longer in the facility. The weighting
protocols developed in ADAM and ADAM II compensate for the sampling rate variance that occurs.
The lavatory in the Manhattan site is not separate from the booking cell. In this site the arrestee moves to the rear of the holding cell and uses a lavatory that sits behind a shoulder-high cement barrier.
ADAM II 2009 Annual Report An Overview of ADAM II 8
4
Table 1.1 in Appendix A presents the 10 ADAM and ADAM II sites, the number of facilities in the
county, interviews completed and specimens collected from 2000-2009, and the number of arrestees
that the sample represents. As this indicates, 4,746 interviews were conducted and 4,077 urine
specimens taken, representing 33,725 arrests in the 10 counties in 2009. Across all years, 36,000
interviews have been conducted representing over 350,000 arrests. The reader will note the larger
numbers of interviews in the 2000-2003 years when data were collected in all four quarters of the 5year.
In the original ADAM program, case weights were developed using traditional poststratification
weighting. Each case’s sampling probability was determined by stratifying the sample by jail, the
stock and flow periods of collection, the day of the week, and the charge. The arrestees’ estimated
probability of being sampled was then the number of interviews done in the stratum divided by the
total number of bookings in the strata according to the census data. The case weights were then the
inverse of that estimated sampling probability. Two sets of weights were developed: one for the
interviews and one for the urine test data.
However, case weighting based on poststratification often lost precision because strata had to be
collapsed due to empty or sparse cells. Therefore, for ADAM II the program began using propensity
score weighting. This weighting procedure uses logistic regression to estimate an arrestee’s
probability of being sampled conditional on factors that cause sampling probabilities to vary: charge
at arrest, number of bookings, time of day, and day of the week of the booking. Predictions based on
the logistic regressions are the estimated propensity scores, and the inverse of these propensity scores
are the case weights.
How Does ADAM II Account for Critical Data on Arrestees Who Do Not Provide
a Test Sample?
The original ADAM program reported two sets of results—those based on only an interview response
and those based on the paired interview and test result responses—inadvertently confusing readers at
times. In ADAM II, analysts were concerned that ignoring the interview data when urine test results
were missing would result in losing valuable information and likely introduce some bias: that is, those
who fail to provide a urine sample (about 15 percent of arrestees in 2009) are likely different than
those who agree to provide a sample.
5 Numbers also vary in some years when the site was collecting in fewer than all four quarters.
ADAM II 2009 Annual Report An Overview of ADAM II 9
ADAM II uses a statistical imputation approach that is based on the probability that an arrestee will
test positive or negative for the presence of a specific test when answering “Yes” or “No” to the
relevant question; that is, imputation is not simply made on the basis of the self report of the
respondent who refused. The approach estimates these probabilities based on existing data, draws a
random sample from a Bernoulli distribution, and assigns a value of 1 (positive ) or 0 (negative) to
replace the missing test value. More information on the process is available in the ADAM II Technical
Documentation Report which can be accessed via www.icpsr.umich.edu .
The proportion of arrestees who do not provide urine samples varies by site—in 2009 from 37 percent
in Washington, DC to 8 percent in Chicago. For the Washington, DC site in ADAM II, missing urine
data cases are matched to urine test data taken by DC Pretrial Services when arrestees are moved
from the districts to the next stage of processing. Of the 29 missing data cases in 2009, 17 could be
matched with results from that source, leaving 12 cases to be imputed in Washington, DC using the
method described above.
Again, while the number of missing test results in most sites is not substantial, the likelihood that
those cases may differ from others exists as potential bias. The imputation method employed in
ADAM II helps overcome that problem.
How Are Trends over Time Estimated?
When the ADAM program was reestablished in 2007 there was a strong interest in developing
estimates for the significance of trends from year to year and bridging the gap in collection between
2003 and 2007.6 Developing trend statistics might at first seem straightforward. An analyst can
develop a point estimate for each year and a confidence interval for that point estimate, and then test
whether drug use has remained the same between any two pairs of years.
The problem is that police arrest practices and pretrial processing practices change over time.7 For
example, in one year police may target open-air markets and consequently arrest many drug users, but
in another year the police may focus their attention on other crimes. As another example, during one
year arrests for minor crimes may result in bookings and detention pending an arraignment, but in
another year police may rely on citations for minor offenses. The consequence is that the mixture of
In both DUF and the original ADAM there was no attempt to develop statistical trends from the data. In 2007 ONDCP required ADAM II to develop trend statistics.
ADAM II 2009 Annual Report An Overview of ADAM II 10
6
the booking population changes over time. Although illegal drug use is widely distributed across the
booking population, it is more heavily concentrated in certain types of offenses and offenders.
Apparent trends in drug use may be nothing more than actual trends in arrest practices and pretrial
processes.
To avoid confounding trends in drug use with trends in arrest practices and pretrial processes, ADAM
II uses model-based estimates of trends. The utility of those models is that they allow data analysts to
hold arrest types (and cycles, as noted earlier) constant and ask the question, “What would the trend
in drug use have been had the same mix of offenses and offenders been booked into local jails?”
ADAM II provides trends in drug use that can be attributed confidently to drug use among arrestees.
One of the issues to be dealt with, however, in the gap between the ADAM and ADAM II data was
the difference in the two data collection schedules. In ADAM sites collected data during all four
quarters of the calendar year for 14 days each quarter. In ADAM II sites collect data in one 14-day
collection period in each of two calendar quarters.
Even the jails themselves change. For ADAM in Atlanta, data were collected in 2000, 2002, and
2003. In 2000 data were collected from the Atlanta Detention Facility. Beginning in 2002 data were
collected from both the Atlanta Detention Facility and Fulton County Jail. Since ADAM II collects
data in both facilities, we wanted to present trends based upon comparable data. Therefore, we
elected to compute trends for only 2002-2009, the years where data were collected in consistent
facilities and ADAM II report tables may differ from those reported under NIJ.
How Does ADAM II Account for a Biannual Sample?
Moving from a quarterly sample to a biannual sample would not be important if there were no
seasonal or cyclical patterns in drug use or arrests. Unfortunately, at least in some sites, cyclical
patterns appear. Because ADAM II collects data during the same two periods every year, there is no
problem comparing estimates from year to year and cyclical patterns do not matter; but the original
ADAM program collected during different quarters. Often an ADAM program collected data during
each of four quarters, but in later years the ADAM program collected data during only one, two, or
three quarters. In this case, cyclical patterns do matter. Not only can one not readily compare ADAM
II estimates to ADAM estimates, one cannot even compare ADAM estimates from year-to-year.
ADAM II 2009 Annual Report An Overview of ADAM II 11
Currently, ADAM II deals with this problem by using a model-based routine that estimates weighted
regressions, where urine test results are the dependent variable and year, the offense, seasonality
factors, and other factors that vary from site to site (shifts in booking policy, addition of a jail, and so
forth) are the independent or predictor variables. ADAM II refers to this adjustment as annualizing
the data and uses these data for cross site comparisons reported here.
ADAM II 2009 Annual Report An Overview of ADAM II 12
2. Who Constitutes the ADAM II Sample?
One of the advantages of the ADAM program has been that, in addition to asking arrestees about drug
use and local drug markets, it collects information on arrestee demographics (age, education, race,
and marital status), immigration status, employment, insurance coverage, and housing status. The
program supplements this with information from official records on the charges for which the
respondent was booked. The interview also asks all arrestees about prior arrests and incarcerations as
well as lifetime and recent substance abuse and mental health treatment experiences. This information
helps describe the population entering the criminal justice system in each of the 10 sites. Chapter 2
describes the characteristics of the sampled population in each site, highlighting significant shifts in
characteristics found in 2009 from those found in 2007 and 2008.1 This section also presents
significant differences in demographics and arrest and treatment histories between arrestees who test
positive for drugs and those who do not.
What Are the Demographic Characteristics of ADAM II Arrestees?
Although each site participating in the ADAM II program reflects a unique region of the country, in
many cases the populations of arrestees entering the criminal justice system are more similar than
different. Tables 2.1 and 2.2 in Appendix A present demographic information on all arrestees in the
10 ADAM II counties from 2007 through 2009. In all sites, the average age of arrestees was between
32 and 37 years old in 2009. Over 60 percent of arrestees in all sites were single, ranging from 61
percent (Portland) to 82 percent (Washington, DC). Over 80 percent of arrestees in all sites were U.S.
citizens, though there were significantly more non-US citizens arrested in three sites since 2008
(Charlotte, Minneapolis, and Sacramento) and significantly fewer in Portland. From 2007 to 2009 in
Charlotte and Minneapolis there has been a significant increase in the percentage of arrestees who
were not U.S. citizens.
In all ADAM II sites in 2009, over 65 percent of arrestees had a high school diploma or its
equivalency, ranging from 66 percent (Chicago and Atlanta) to 75 percent (Portland and Washington,
DC). Many arrestees were not employed and not insured. In 7 of the 10 sites half or more of arrestees
reported they were not working at least part time, a significant decrease since either 2007 or 2008 in 8
It should be noted that demographic shifts in the ADAM II sample do not necessarily reflect shifts in the demographics of those who commit crime; rather, some shifts may be attributed to policing practices and enforcement strategies.
ADAM II 2009 Annual Report Who Constitutes the ADAM II Sample? 13
1

of the 10 sites. In 8 of 10 sites less than a half of all arrestees had any form of health insurance,
including state-sponsored programs such as Medicaid and Medicare, employer-based, Veterans
Affairs, union, or other plans. In the two other sites (Washington, DC and New York) one-half to
three-quarters of arrestees were insured.
While the number of arrestees with stable living arrangements (living in own or someone else’s
house, mobile home, or apartment or in a residential hotel, dormitory, or group home) in the prior 30
days was over 70 percent or more in all sites, between 2 percent of arrestees (Chicago) and 28 percent
(Portland) were living either in institutional settings or were homeless. In Chicago, Sacramento, and
Washington, DC, the percentage of arrestees with stable living arrangements increased significantly
from 2008 to 2009, while in Minneapolis and Portland the percentage decreased significantly.
For the most part, there was little change between 2008 and 2009 in the demographic makeup of
arrestees across sites. However, one site stands out as having experienced a greater shift in the
arrestee population than others. Since 2008, arrestees in Portland have been significantly older, more
likely to be U.S. citizens, and less likely to be working at least part-time, have any form of health
insurance, or have stable living situations.
Given the geographic diversity of sites, it is not surprising to find that the racial/ethnic makeup of
arrestees varies across geographic areas (Table 2.2). Less than a third of arrestees identified
themselves as Hispanic in 8 of the 10 sites in 2009. The exceptions were Denver (45 percent
Hispanic) and New York (46 percent). In Charlotte, Minneapolis, and Sacramento, the proportion of
arrestees who identified themselves as Hispanic rose significantly between 2008 and 2009, as well as
between 2007 and 2009. In 4 of the 10 sites, over half of the arrestees identified themselves as
African American, ranging from 57 percent in Charlotte to 85 percent in Atlanta. The proportion of
African-American arrestees decreased significantly between 2008 and 2009 in Minneapolis, increased
significantly in Atlanta, and remained unchanged elsewhere. The proportion of arrestees that
identified themselves as White ranged from 11 percent in Atlanta and Chicago to 49 percent in
Portland.
What Are Arrestees’ Histories with the Criminal Justice System?
Across all sites, arrestees’ experience with the criminal justice system prior to the current arrest was
common. In 2009, more than three-quarters of arrestees in each site reported at least one arrest prior
to the current one, ranging from 78 percent in Charlotte and New York to 93 percent in Chicago. Four
ADAM II 2009 Annual Report Who Constitutes the ADAM II Sample? 14
of the 10 sites (Chicago, Denver, Indianapolis, and Portland) have remained stable over the past two
or three years, with 80 percent or more arrestees having reported at least one arrest prior to the current
one. Charlotte and Minneapolis both returned to 2000 - 2003 levels after peaking in 2007 and 2008.
Atlanta, New York, and Washington, DC continued an upward trend that began between 2000 and
2003, and the proportion of arrestees reporting an arrest prior to the current one has been fluctuating
since 2000 in Sacramento, with a significant decline in 2009 after peaking in 2003 (see Table 2.3).
Among arrestees who admitted any drug use during the prior year, users in all sites were also more
likely to have been arrested two or more times in that year, with the proportion of users with multiple
arrests ranging from 4 percent (Washington, DC) to 19 percent (Atlanta) (see Table 2.4). Seven of the
10 sites (the exceptions are Atlanta, New York and Washington, DC) have experienced a decline over
the past two or three years in the proportion of users arrested multiple times in the past year. With the
exception of Sacramento the downward trend began between 2000 and 2003.
Interviewers record the three most serious charges for all arrestees from the official booking record of
each arrestee. In 2009, the percentage of arrestees charged with violent crimes was over 15 percent in
9 of the 10 sites (the exception is Washington, DC), ranging from 17 percent of cases in Atlanta to 31
percent in Chicago. The percentage of arrestees charged with drug crime charges was over 20 percent
in all sites, reaching almost 50 percent in Chicago and Washington, DC. Arrests for property crimes
ranged from 11 percent of arrestees in Washington, DC to 34 percent in New York, while assorted
“other” crimes, including probation/parole violations, disturbing the peace, traffic-related offenses,
and other more minor crimes, made up over 40 percent of charges in 6 of the 10 sites (Table 2.5).
There were some significant changes from 2008 to 2009 in the types of charges for which offenders
were arrested. While the proportion of arrestees with violent charges increased significantly in only
two sites in 2009 (Chicago and Sacramento), drug violations decreased significantly in two sites
(Chicago and Minneapolis) and increased significantly in Sacramento. When extended to 2007, a
similar pattern emerges. Only one additional site (Washington, DC) experienced a significant change
(decrease) in the proportion of arrestees with violent charges between 2007 and 2009. Charlotte
experienced a significant decrease and New York a significant increase in the proportion of arrestees
charged with drug violations between 2007 and 2009.
ADAM II 2009 Annual Report Who Constitutes the ADAM II Sample? 15
How Do Arrestees Testing Positive for Any Drugs Compare with All
Other Arrestees?
The fact that the ADAM II program samples all males arrested (not just those using drugs or with
drug charges) allows for comparisons between persons involved in the criminal justice system who
test positive for any illicit drug with arrestees who do not test positive for any illicit drug at the time
of their arrest. This section compares these two populations on demographic characteristics and
criminal history.
Table 2.6 presents demographic information for both arrestees who tested positive for some illicit
substance at arrest and those who tested negative. There are some significant differences between
these two groups in many sites. In half of the sites, users were significantly younger than non-users,
and in six sites they were more likely to be single. In 9 of the 10 sites, users were significantly more
likely than non-users to be U.S. citizens, and in 6 of the sites they were less likely to be working at
least part-time. Compared to arrestees not using drugs, significantly fewer users in 4 of the 10 sites
were insured and in Minneapolis, New York, and Portland users were less likely to be in a stable
living situation. Finally, in 9 of the 10 sites, arrestees who tested positive for drugs also were more
likely than non-users to have been arrested before the current arrest (see Table 2.7 in Appendix A).
What Are the Substance Abuse and Mental Health Treatment
Experiences among ADAM II Arrestees?
The ability to understand treatment needs among current and recent drug users who have recently
been arrested is another important advantage of the ADAM II program. Given the large number of
drug users arrested, the criminal justice system is a potentially important point of identification of the
need for treatment among a hard-to-reach population. In the ADAM II interview, all arrestees are
asked whether they have ever been admitted to inpatient and/or outpatient treatment programs for
drugs or alcohol or a facility for mental health treatment.2 Arrestees admitting to any drug use in the
prior year also are asked specifically about types of drug and alcohol treatment (inpatient, outpatient)
over the year, the number of times they had been admitted to each type, and the number of nights they
spent in inpatient or mental health treatment.
Respondents are told not to include self-help outpatient programming such as Alcoholics Anonymous, Narcotics Anonymous, or Cocaine Anonymous.
ADAM II 2009 Annual Report Who Constitutes the ADAM II Sample? 16
2
Across ADAM II sites in 2009, the proportion of all arrestees who reported any prior outpatient drug
or alcohol treatment ranged from a low of 10 percent in Washington, DC to a high of 36 percent in
Portland (see Table 2.8). Questions about more recent (prior 12 months) outpatient treatment were
asked of arrestees who reported using drugs in the past year. In 2009, the percentage of these arrestees
who had participated in outpatient treatment in the prior year ranged from 1 percent in Washington,
DC to 10 percent in Portland (see Table 2.9). Similar numbers of arrestees admitting drug use in the
past year also reported receiving inpatient drug or alcohol treatment in the past year, ranging from 2
percent in Indianapolis and Sacramento to 10 percent in Denver and Minneapolis.
Recent treatment utilization numbers among arrestees admitting drug use in the past year have
remained stable since 2007 and 2008 in all sites except Chicago, Charlotte, and Sacramento. Charlotte
arrestees reported significantly fewer recent outpatient treatment experiences between 2009 and 2008
and fewer inpatient treatment experiences between 2009 and both 2008 and 2007 as well as a lower
average number of reported nights of inpatient treatment between 2009 and 2007. Sacramento
arrestees reported significantly fewer recent inpatient treatment experiences and a lower average
number of nights in treatment between 2009 and both 2008 and 2007. Chicago arrestees reported
fewer recent inpatient treatment experiences and a lower average number of nights of treatment
between 2007 and 2009 (Tables 2.9 and 2.12).
All arrestees are also asked whether they had ever stayed at least overnight for mental health
treatment at a psychiatric unit of a hospital or special mental health facility. The proportion of all
arrestees who reported any overnight stay in a mental health facility during their lifetime ranged from
7 percent in Washington, DC to 16 percent in Portland (Table 2.8). Arrestees who reported drug use
in the past 12 months also were asked about mental health treatment in the prior year. Across all sites,
3 percent or fewer arrestees who admitted past-year drug use said they received inpatient mental
health treatment in the past year (Table 2.9).
ADAM II 2009 Annual Report Who Constitutes the ADAM II Sample? 17
3. What Is the Drug Use and Drug Market Activity among Arrestees?
Are Arrestees Telling the Truth about Drug Use?
Congruence between Self-report and Test Results
Debate over the reliability and validity of self-reported drug use has gone on for decades. Because
illegal drug use is a highly stigmatized behavior, many respondents are likely to deny use, particularly
in settings where they may feel vulnerable. One of the most significant features of the ADAM II
survey is that it is designed to substantiate self-report responses about recent drug use with an
independent biological test to detect the presence of each drug within the time periods respondents are
asked about. Each drug has a unique window of detection: the time period in which it or its
metabolites can be detected in the urine of the user. Some drugs, like marijuana, remain detectable for
weeks or even as long as a month, depending on the frequency and intensity of use. Other drugs, like
cocaine and methamphetamines, are metabolized more quickly, and those metabolites are detectable
for a far shorter period of time, one to three days, again depending on the frequency and intensity of
use. ADAM and ADAM II rely on two sources of information on recent drug use: a urine sample
taken at the end of each interview that tests for a panel of drugs and the arrestee’s self-reported use of
a number of drugs over several different time frames (3 days, 7 days, 30 days, and 12 months). The
advantage of two sources is that each source can be used to verify or validate the other, resulting in a
more accurate picture of actual use of illegal substances.
Across all 10 ADAM II sites, there is a high congruence between the self-report of drug use and the
urinalysis results. One might expect a high rate of refusal to provide a sample, given the nature of the
behavior, and, among those who do provide a sample, less than truthful answers about recent use of
illegal drugs. In fact, the ADAM II data collection process produces high rates of consent to
providing a sample as well as high congruence between the arrestees’ self-reports and urine test
results. Overall, 86 percent of arrestees interviewed in 2009 consented to provide a sample. With the
exception of arrestees in Washington, DC (63 percent), from 78 to 92 percent of interviewed arrestees
in the other sites provided a sample for testing (Table B.3).
Figure 3.1 (see also related Table 3.1) indicates the percentage of overall truthful answers on drug use
by specific drug for 2009; that is, the total of arrestees who used a drug and admitted it, and those
ADAM II 2009 Annual Report What Is the Drug Use and Drug Market Activity among Arrestees? 18
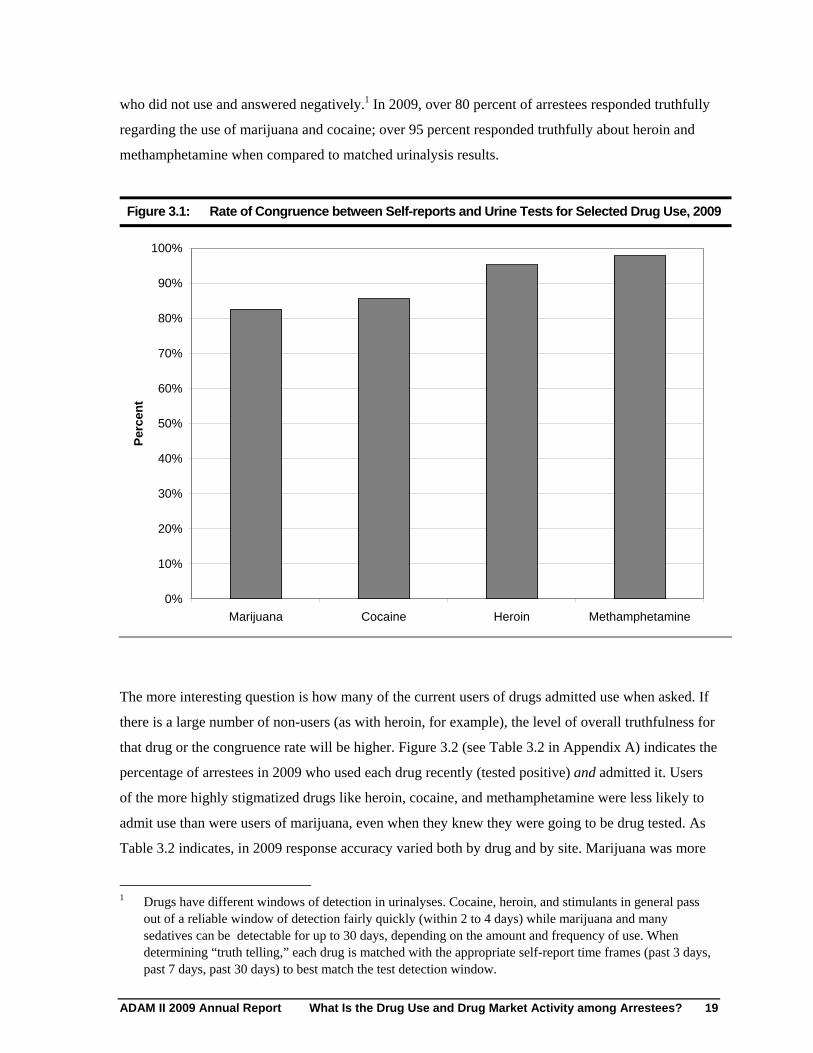
who did not use and answered negatively.1 In 2009, over 80 percent of arrestees responded truthfully
regarding the use of marijuana and cocaine; over 95 percent responded truthfully about heroin and
methamphetamine when compared to matched urinalysis results.
Figure 3.1: Rate of Congruence between Self-reports and Urine Tests for Selected Drug Use, 2009
0%
10%
20%
30%
40%
50%
60%
70%
80%
90%
100%
Per
cen
t
Marijuana Cocaine Heroin Methamphetamine
The more interesting question is how many of the current users of drugs admitted use when asked. If
there is a large number of non-users (as with heroin, for example), the level of overall truthfulness for
that drug or the congruence rate will be higher. Figure 3.2 (see Table 3.2 in Appendix A) indicates the
percentage of arrestees in 2009 who used each drug recently (tested positive) and admitted it. Users
of the more highly stigmatized drugs like heroin, cocaine, and methamphetamine were less likely to
admit use than were users of marijuana, even when they knew they were going to be drug tested. As
Table 3.2 indicates, in 2009 response accuracy varied both by drug and by site. Marijuana was more
Drugs have different windows of detection in urinalyses. Cocaine, heroin, and stimulants in general pass out of a reliable window of detection fairly quickly (within 2 to 4 days) while marijuana and many sedatives can be detectable for up to 30 days, depending on the amount and frequency of use. When determining “truth telling,” each drug is matched with the appropriate self-report time frames (past 3 days, past 7 days, past 30 days) to best match the test detection window.
ADAM II 2009 Annual Report What Is the Drug Use and Drug Market Activity among Arrestees? 19
1
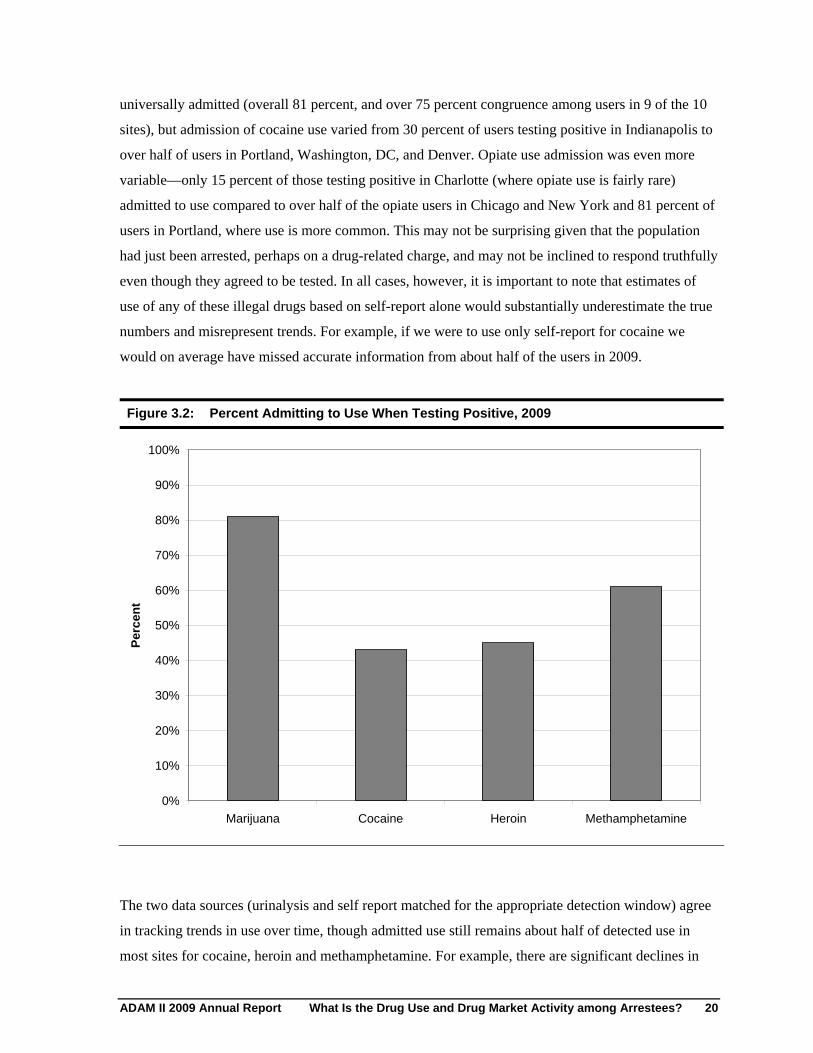
universally admitted (overall 81 percent, and over 75 percent congruence among users in 9 of the 10
sites), but admission of cocaine use varied from 30 percent of users testing positive in Indianapolis to
over half of users in Portland, Washington, DC, and Denver. Opiate use admission was even more
variable—only 15 percent of those testing positive in Charlotte (where opiate use is fairly rare)
admitted to use compared to over half of the opiate users in Chicago and New York and 81 percent of
users in Portland, where use is more common. This may not be surprising given that the population
had just been arrested, perhaps on a drug-related charge, and may not be inclined to respond truthfully
even though they agreed to be tested. In all cases, however, it is important to note that estimates of
use of any of these illegal drugs based on self-report alone would substantially underestimate the true
numbers and misrepresent trends. For example, if we were to use only self-report for cocaine we
would on average have missed accurate information from about half of the users in 2009.
Figure 3.2: Percent Admitting to Use When Testing Positive, 2009
0%
10%
20%
30%
40%
50%
60%
70%
80%
90%
100%
Per
cen
t
Marijuana Cocaine Heroin Methamphetamine
The two data sources (urinalysis and self report matched for the appropriate detection window) agree
in tracking trends in use over time, though admitted use still remains about half of detected use in
most sites for cocaine, heroin and methamphetamine. For example, there are significant declines in
ADAM II 2009 Annual Report What Is the Drug Use and Drug Market Activity among Arrestees? 20
cocaine positives in Atlanta from 2002 to 2009 (46 percent to 37 percent of arrestees) and significant
declines in admitting crack use (23 percent to 15 percent) and cocaine powder use (5 percent to 2
percent). This pattern is repeated in 8 of the 10 sites for cocaine, e.g., decreasing positive tests and
decreasing 3-day self report, though at half the rate.
Admitting heroin use and testing positive follows a similar pattern. In Chicago positive opiate tests
declined from 2000 to 2009 (36 percent to 18 percent) as did 3-day self reports, albeit at a lower level
(19 percent to 11 percent).
Methamphetamine positives in Portland declined from a high of 27 percent in 2003, declining to 20
percent in 2007 and 13 percent in 2009; self report data on prior 3 day and 7 day use from 2007 to
2009 showed the same significant decline, though at a somewhat more reluctant admission level.
The data collection setting in ADAM II is quite different from that found in other drug surveys. First,
the arrestee is told at the beginning of the interview that he will be asked to voluntarily provide a
urine sample for testing. This may make falsifying answers about use less likely than in settings
where the respondent knows there is no potential independent check on his answers. In addition,
ADAM II interviewers collect no information about who specifically the arrestee is or where he lives.
Interviewers are often asked by arrestees how their name was selected out of all of the people in the
holding area; interviewers then explain that selection is simply a random draw based on the time
people are arrested. It may also be that the arrestee population is more experienced with drugs and
criminal activity than the general population and that discussing use is less stigmatizing for them than
for respondents in general population surveys. Whatever the reason, ADAM II respondents appear
willing to provide a urine sample for testing and, even when using, to tell the truth about drug use
about half the time.
What Are the Test Results for the Presence of Illicit Drugs?
The sections that follow present data on the drug use and drug market participation of arrestees from
the 10 ADAM II sites for 2009. In these sections we present data on the use of any illegal drug by
interviewed arrestees and then examine drug test results, self-report information, and reports of drug
market activity, focusing on each of the major drugs of interest one at a time.
Arrestees eligible for ADAM II are arrested on the full spectrum of charges, ranging from a traffic
violation to burglary to homicide. These charges may include drug possession, manufacture, and
ADAM II 2009 Annual Report What Is the Drug Use and Drug Market Activity among Arrestees? 21
distribution, but are not limited to drug-related charges. For each arrestee, the interviewer records the
top (most serious) three charges that appear on the arrestee’s booking sheet. As is evident from
ADAM data, over the years (regardless of charge), a large number of arrestees in all sites have tested
positive for at least one substance in their system at the time of arrest, and many have tested positive
for more than one.
Figure 3.3 shows the results of urinalysis indicating the presence of any test substance for male
arrestees for 2007, 2008 and 2009. (Table 3.3 in Appendix A displays all years, 2000–2003 and
2007–2009.) In 2009, anywhere from 56 percent (Charlotte) to 82 percent (Chicago) of arrestees
across sites tested positive for the presence of some substance at the time of arrest. In 9 out of the 10
sites in 2009, 60 percent or more of arrestees tested positive. Since 2007, the proportion of arrestees
testing positive for illicit drugs in their system at arrest has declined in Charlotte, Portland, and
Sacramento, but increased in Washington, DC (from 2008 to 2009). Over the entire nine-year period
of ADAM collection (see Table 3.3) there have been significant decreasing trends in Atlanta,
Chicago, Indianapolis, Minneapolis, and New York. For example, New York has shown a
consistently steady decline—from 84 percent of arrestees testing positive in 2000 to 69 percent in
2009.
Many arrestees have more than one drug in their system at the time of arrest. In 2009, anywhere from
12 percent (Charlotte) to 28 percent (Chicago) of arrestees tested positive for multiple drugs, though
for both of these sites this represents a significant decline in arrestees with multiple positive tests
from 2007 and 2008 (Figure 3.4, Table 3.3). Five of the sites that participated in 2000 had
significantly fewer arrestees testing positive for multiple drugs in 2009. The percentage in Chicago,
for example, fell from 56 percent in 2000 to 28 percent in 2009.
ADAM II 2009 Annual Report What Is the Drug Use and Drug Market Activity among Arrestees? 22
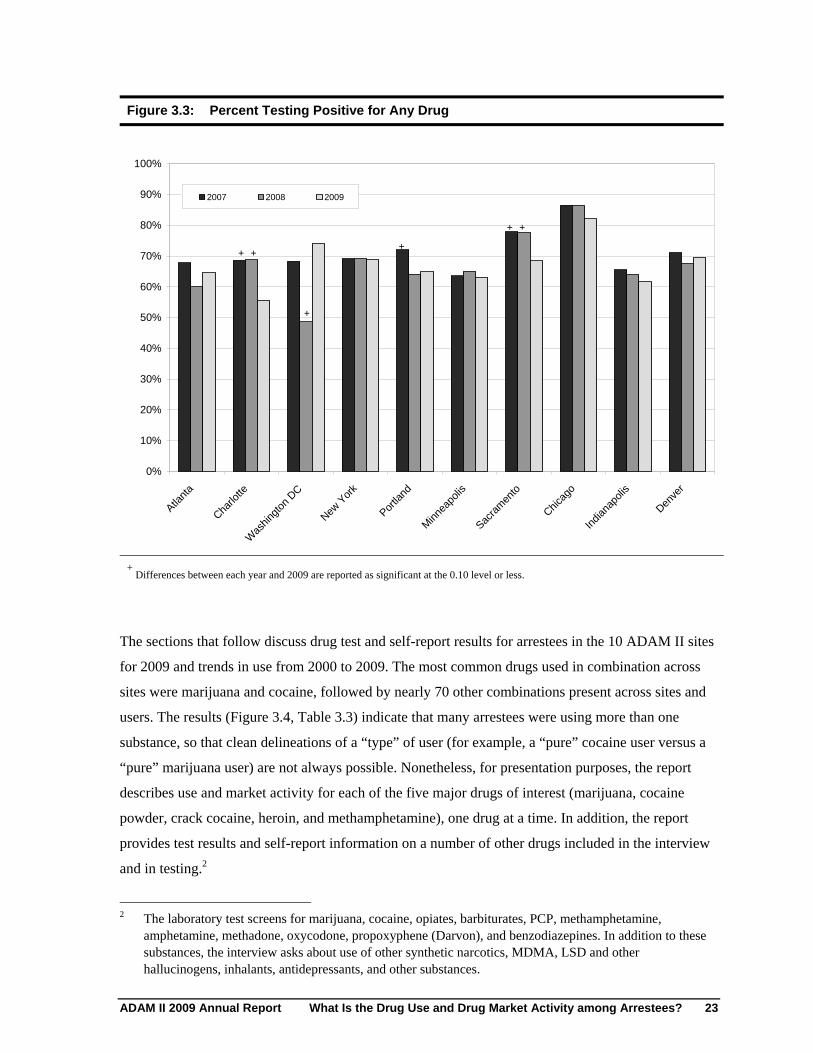
Atlant
a
Charlo
tte
Was
hingt
on D
C
New Y
ork
Portla
nd
Minn
eapo
lis
Sacra
men
to
Chicag
o
India
napo
lis
Denve
r
Figure 3.3: Percent Testing Positive for Any Drug
0%
10 %
20 %
30 %
40 %
50 %
60 %
70 %
80 %
90 %
100%
20 07 20 08 2 009
+
+ ++
+
+
+ Differences between each year and 2009 are reported as significant at the 0.10 level or less.
The sections that follow discuss drug test and self-report results for arrestees in the 10 ADAM II sites
for 2009 and trends in use from 2000 to 2009. The most common drugs used in combination across
sites were marijuana and cocaine, followed by nearly 70 other combinations present across sites and
users. The results (Figure 3.4, Table 3.3) indicate that many arrestees were using more than one
substance, so that clean delineations of a “type” of user (for example, a “pure” cocaine user versus a
“pure” marijuana user) are not always possible. Nonetheless, for presentation purposes, the report
describes use and market activity for each of the five major drugs of interest (marijuana, cocaine
powder, crack cocaine, heroin, and methamphetamine), one drug at a time. In addition, the report
provides test results and self-report information on a number of other drugs included in the interview
and in testing.2
The laboratory test screens for marijuana, cocaine, opiates, barbiturates, PCP, methamphetamine, amphetamine, methadone, oxycodone, propoxyphene (Darvon), and benzodiazepines. In addition to these substances, the interview asks about use of other synthetic narcotics, MDMA, LSD and other hallucinogens, inhalants, antidepressants, and other substances.
ADAM II 2009 Annual Report What Is the Drug Use and Drug Market Activity among Arrestees? 23
2
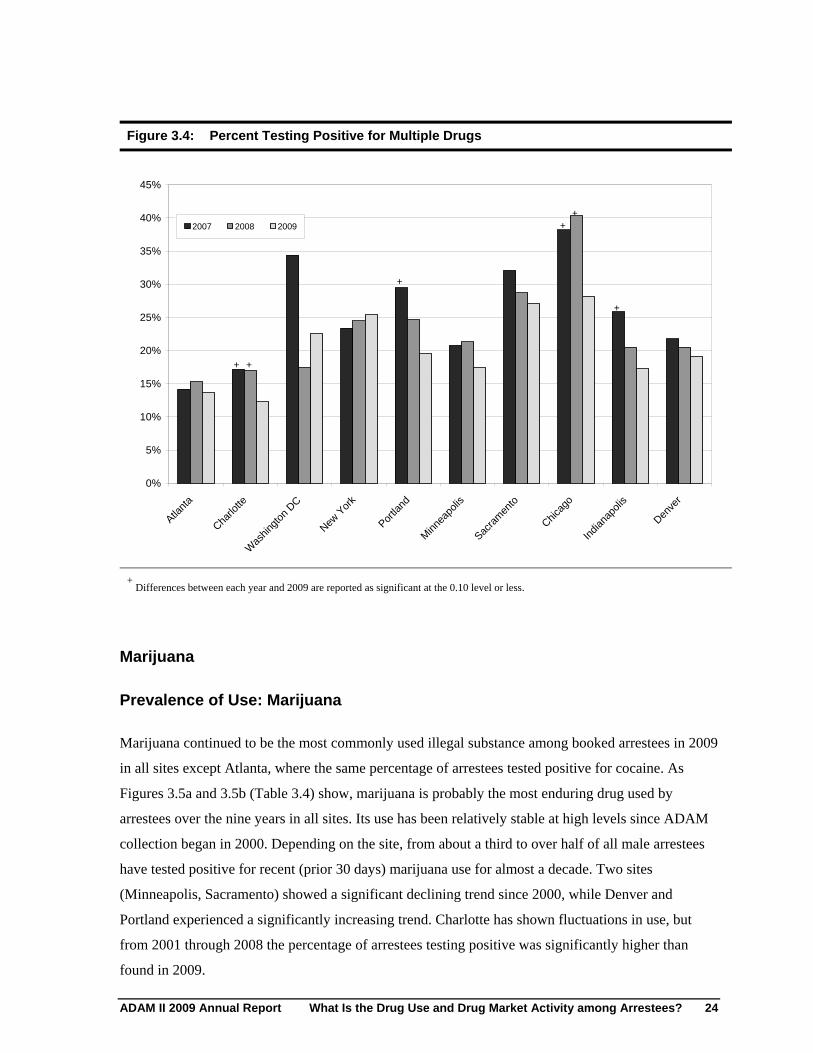
Atlant
a
Charlo
tte
Was
hingt
on D
C
New Y
ork
Portla
nd
Minn
eapo
lis
Sacra
men
to
Chicag
o
India
napo
lis
Denve
r
Figure 3.4: Percent Testing Positive for Multiple Drugs
0%
5%
10%
15%
20%
25%
30%
35%
40%
45%
2 007 20 08 20 09
++
+ +
+
+
+ Differences between each year and 2009 are reported as significant at the 0.10 level or less.
Marijuana
Prevalence of Use: Marijuana
Marijuana continued to be the most commonly used illegal substance among booked arrestees in 2009
in all sites except Atlanta, where the same percentage of arrestees tested positive for cocaine. As
Figures 3.5a and 3.5b (Table 3.4) show, marijuana is probably the most enduring drug used by
arrestees over the nine years in all sites. Its use has been relatively stable at high levels since ADAM
collection began in 2000. Depending on the site, from about a third to over half of all male arrestees
have tested positive for recent (prior 30 days) marijuana use for almost a decade. Two sites
(Minneapolis, Sacramento) showed a significant declining trend since 2000, while Denver and
Portland experienced a significantly increasing trend. Charlotte has shown fluctuations in use, but
from 2001 through 2008 the percentage of arrestees testing positive was significantly higher than
found in 2009.
ADAM II 2009 Annual Report What Is the Drug Use and Drug Market Activity among Arrestees? 24
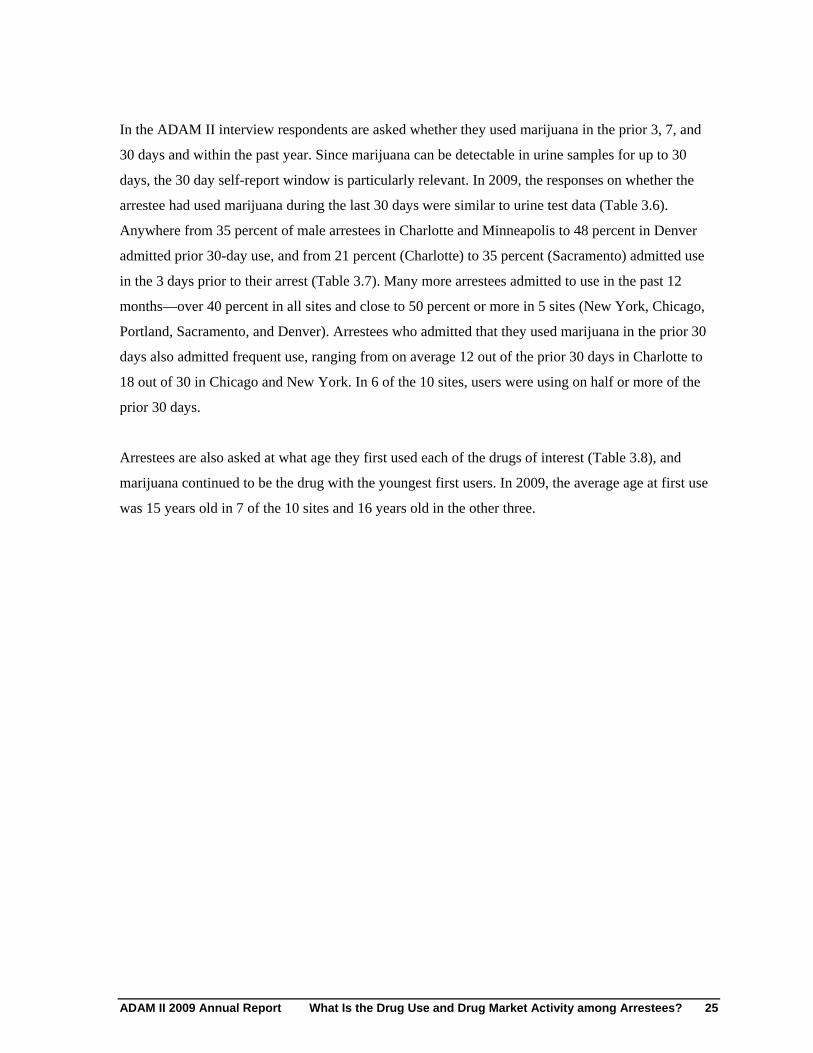
In the ADAM II interview respondents are asked whether they used marijuana in the prior 3, 7, and
30 days and within the past year. Since marijuana can be detectable in urine samples for up to 30
days, the 30 day self-report window is particularly relevant. In 2009, the responses on whether the
arrestee had used marijuana during the last 30 days were similar to urine test data (Table 3.6).
Anywhere from 35 percent of male arrestees in Charlotte and Minneapolis to 48 percent in Denver
admitted prior 30-day use, and from 21 percent (Charlotte) to 35 percent (Sacramento) admitted use
in the 3 days prior to their arrest (Table 3.7). Many more arrestees admitted to use in the past 12
months—over 40 percent in all sites and close to 50 percent or more in 5 sites (New York, Chicago,
Portland, Sacramento, and Denver). Arrestees who admitted that they used marijuana in the prior 30
days also admitted frequent use, ranging from on average 12 out of the prior 30 days in Charlotte to
18 out of 30 in Chicago and New York. In 6 of the 10 sites, users were using on half or more of the
prior 30 days.
Arrestees are also asked at what age they first used each of the drugs of interest (Table 3.8), and
marijuana continued to be the drug with the youngest first users. In 2009, the average age at first use
was 15 years old in 7 of the 10 sites and 16 years old in the other three.
ADAM II 2009 Annual Report What Is the Drug Use and Drug Market Activity among Arrestees? 25
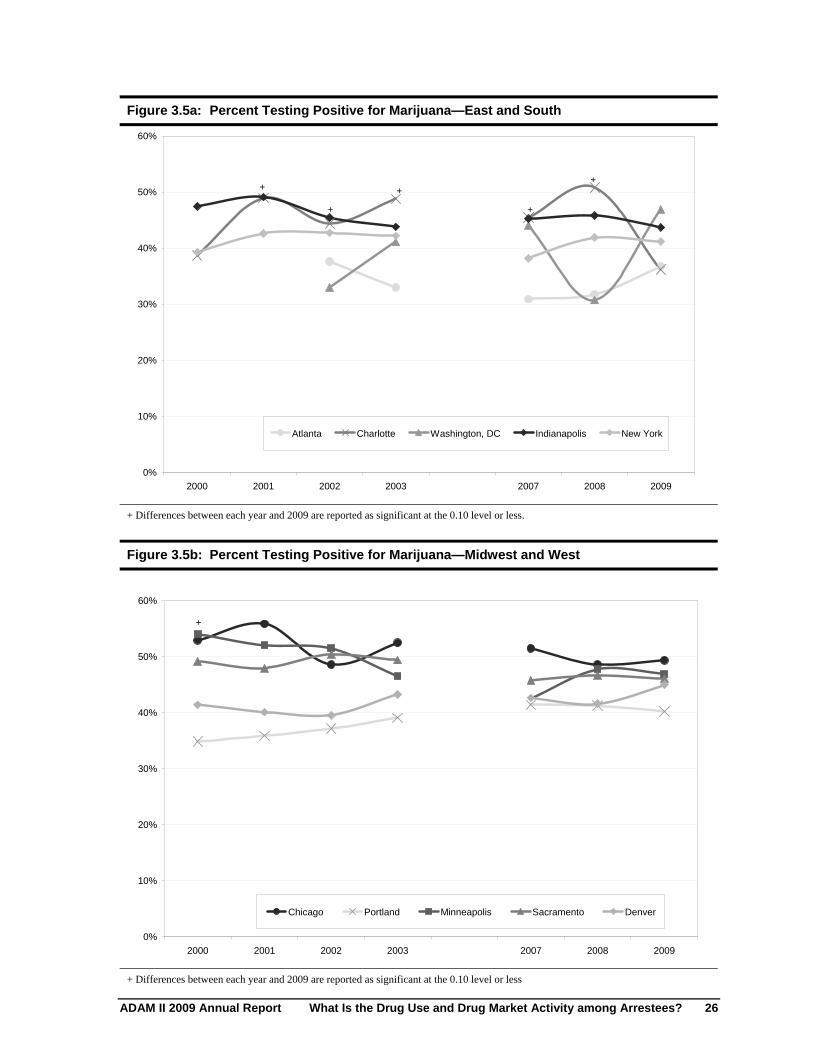
Figure 3.5a: Percent Testing Positive for Marijuana—East and South
60%
50% +
+
+
+
+
40%
30%
20%
10%
Atlanta Charlotte Washington, DC Indianapolis New York
0%
2000 2001 2002 2003 2007 2008 2009
+ Differences between each year and 2009 are reported as significant at the 0.10 level or less.
Figure 3.5b: Percent Testing Positive for Marijuana—Midwest and West
60%
50%
40%
30%
20%
10%
0%
+
Chicago Portland Minneapolis Sacramento Denver
2000 2001 2002 2003 2007 2008 2009
+ Differences between each year and 2009 are reported as significant at the 0.10 level or less
ADAM II 2009 Annual Report What Is the Drug Use and Drug Market Activity among Arrestees? 26
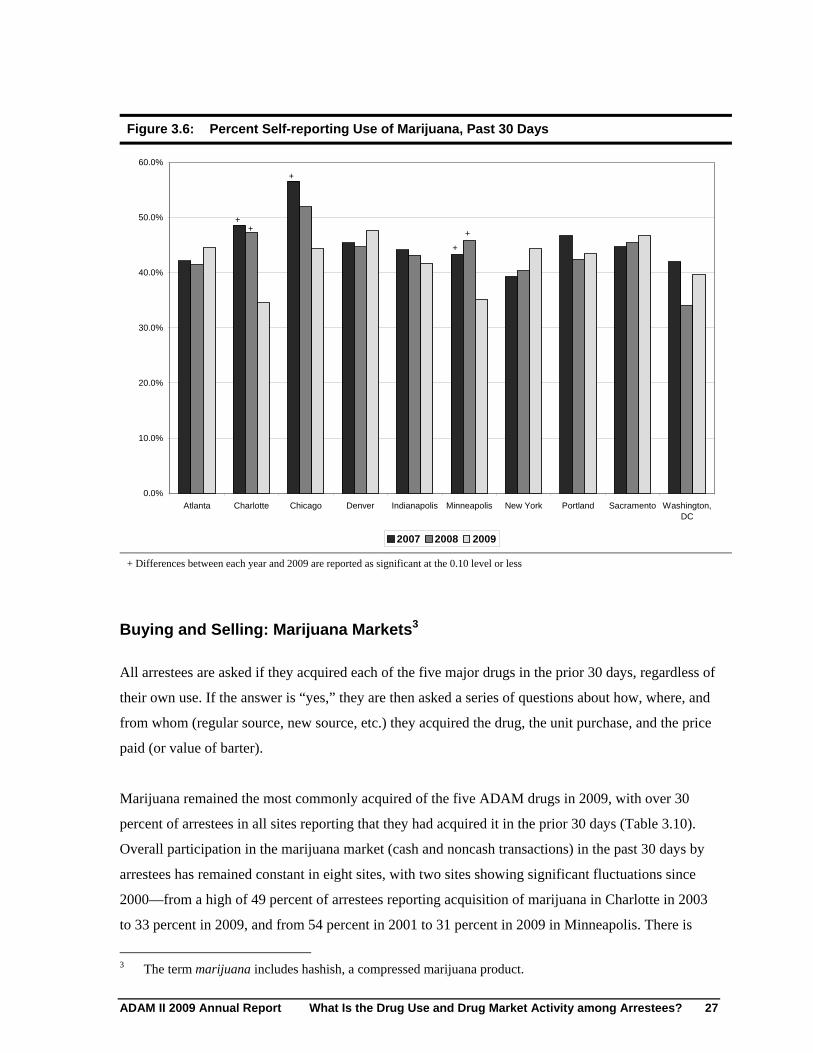
Figure 3.6: Percent Self-reporting Use of Marijuana, Past 30 Days
60.0%
50.0%
40.0%
30.0%
20.0%
10.0%
0.0%
+ +
+
+
+
Atlanta Charlotte Chicago Denver Indianapolis Minneapolis New York Portland Sacramento Washington, DC
2007 2008 2009
+ Differences between each year and 2009 are reported as significant at the 0.10 level or less
Buying and Selling: Marijuana Markets3
All arrestees are asked if they acquired each of the five major drugs in the prior 30 days, regardless of
their own use. If the answer is “yes,” they are then asked a series of questions about how, where, and
from whom (regular source, new source, etc.) they acquired the drug, the unit purchase, and the price
paid (or value of barter).
Marijuana remained the most commonly acquired of the five ADAM drugs in 2009, with over 30
percent of arrestees in all sites reporting that they had acquired it in the prior 30 days (Table 3.10).
Overall participation in the marijuana market (cash and noncash transactions) in the past 30 days by
arrestees has remained constant in eight sites, with two sites showing significant fluctuations since
2000—from a high of 49 percent of arrestees reporting acquisition of marijuana in Charlotte in 2003
to 33 percent in 2009, and from 54 percent in 2001 to 31 percent in 2009 in Minneapolis. There is
The term marijuana includes hashish, a compressed marijuana product.
ADAM II 2009 Annual Report What Is the Drug Use and Drug Market Activity among Arrestees? 27
3
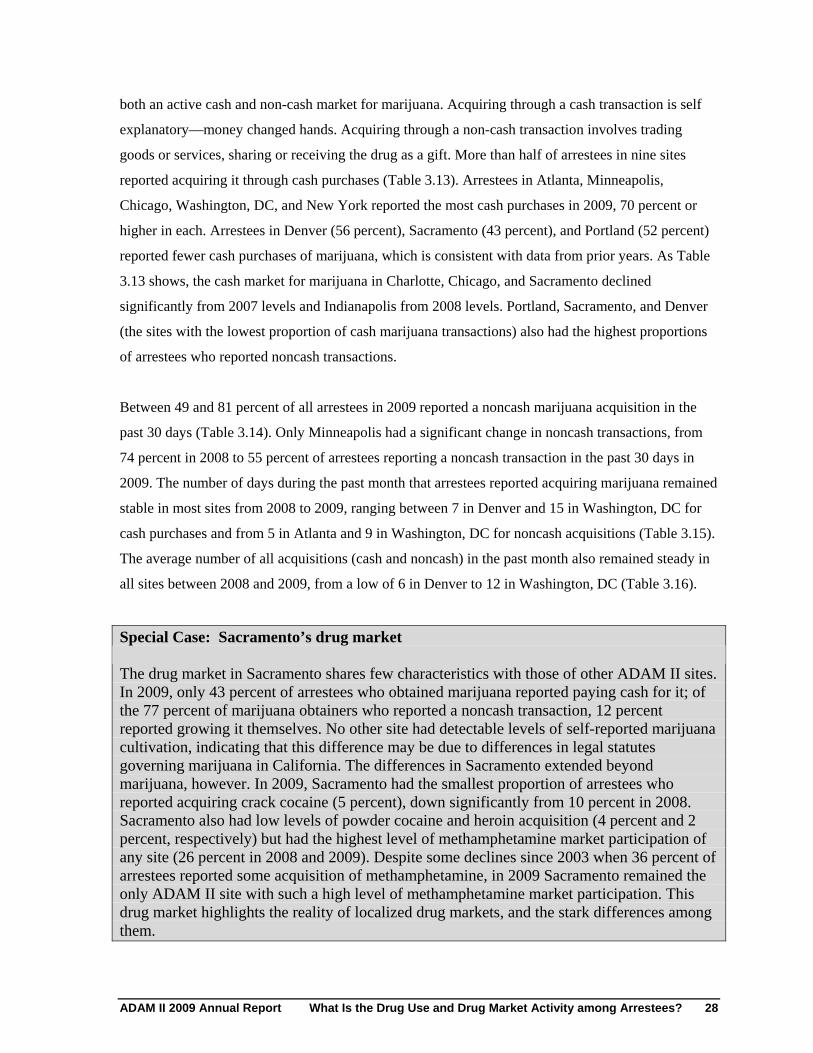
both an active cash and non-cash market for marijuana. Acquiring through a cash transaction is self
explanatory—money changed hands. Acquiring through a non-cash transaction involves trading
goods or services, sharing or receiving the drug as a gift. More than half of arrestees in nine sites
reported acquiring it through cash purchases (Table 3.13). Arrestees in Atlanta, Minneapolis,
Chicago, Washington, DC, and New York reported the most cash purchases in 2009, 70 percent or
higher in each. Arrestees in Denver (56 percent), Sacramento (43 percent), and Portland (52 percent)
reported fewer cash purchases of marijuana, which is consistent with data from prior years. As Table
3.13 shows, the cash market for marijuana in Charlotte, Chicago, and Sacramento declined
significantly from 2007 levels and Indianapolis from 2008 levels. Portland, Sacramento, and Denver
(the sites with the lowest proportion of cash marijuana transactions) also had the highest proportions
of arrestees who reported noncash transactions.
Between 49 and 81 percent of all arrestees in 2009 reported a noncash marijuana acquisition in the
past 30 days (Table 3.14). Only Minneapolis had a significant change in noncash transactions, from
74 percent in 2008 to 55 percent of arrestees reporting a noncash transaction in the past 30 days in
2009. The number of days during the past month that arrestees reported acquiring marijuana remained
stable in most sites from 2008 to 2009, ranging between 7 in Denver and 15 in Washington, DC for
cash purchases and from 5 in Atlanta and 9 in Washington, DC for noncash acquisitions (Table 3.15).
The average number of all acquisitions (cash and noncash) in the past month also remained steady in
all sites between 2008 and 2009, from a low of 6 in Denver to 12 in Washington, DC (Table 3.16).
Special Case: Sacramento’s drug market
The drug market in Sacramento shares few characteristics with those of other ADAM II sites. In 2009, only 43 percent of arrestees who obtained marijuana reported paying cash for it; of the 77 percent of marijuana obtainers who reported a noncash transaction, 12 percent reported growing it themselves. No other site had detectable levels of self-reported marijuana cultivation, indicating that this difference may be due to differences in legal statutes governing marijuana in California. The differences in Sacramento extended beyond marijuana, however. In 2009, Sacramento had the smallest proportion of arrestees who reported acquiring crack cocaine (5 percent), down significantly from 10 percent in 2008. Sacramento also had low levels of powder cocaine and heroin acquisition (4 percent and 2 percent, respectively) but had the highest level of methamphetamine market participation of any site (26 percent in 2008 and 2009). Despite some declines since 2003 when 36 percent of arrestees reported some acquisition of methamphetamine, in 2009 Sacramento remained the only ADAM II site with such a high level of methamphetamine market participation. This drug market highlights the reality of localized drug markets, and the stark differences among them.
ADAM II 2009 Annual Report What Is the Drug Use and Drug Market Activity among Arrestees? 28
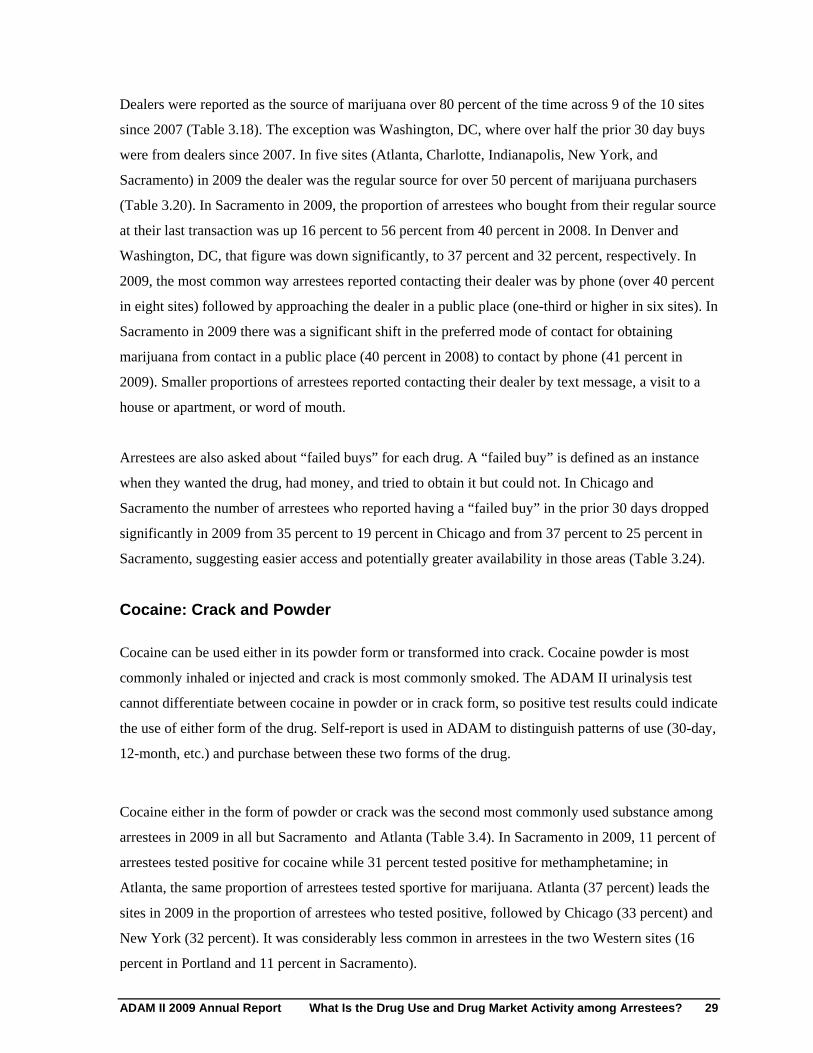
Dealers were reported as the source of marijuana over 80 percent of the time across 9 of the 10 sites
since 2007 (Table 3.18). The exception was Washington, DC, where over half the prior 30 day buys
were from dealers since 2007. In five sites (Atlanta, Charlotte, Indianapolis, New York, and
Sacramento) in 2009 the dealer was the regular source for over 50 percent of marijuana purchasers
(Table 3.20). In Sacramento in 2009, the proportion of arrestees who bought from their regular source
at their last transaction was up 16 percent to 56 percent from 40 percent in 2008. In Denver and
Washington, DC, that figure was down significantly, to 37 percent and 32 percent, respectively. In
2009, the most common way arrestees reported contacting their dealer was by phone (over 40 percent
in eight sites) followed by approaching the dealer in a public place (one-third or higher in six sites). In
Sacramento in 2009 there was a significant shift in the preferred mode of contact for obtaining
marijuana from contact in a public place (40 percent in 2008) to contact by phone (41 percent in
2009). Smaller proportions of arrestees reported contacting their dealer by text message, a visit to a
house or apartment, or word of mouth.
Arrestees are also asked about “failed buys” for each drug. A “failed buy” is defined as an instance
when they wanted the drug, had money, and tried to obtain it but could not. In Chicago and
Sacramento the number of arrestees who reported having a “failed buy” in the prior 30 days dropped
significantly in 2009 from 35 percent to 19 percent in Chicago and from 37 percent to 25 percent in
Sacramento, suggesting easier access and potentially greater availability in those areas (Table 3.24).
Cocaine: Crack and Powder
Cocaine can be used either in its powder form or transformed into crack. Cocaine powder is most
commonly inhaled or injected and crack is most commonly smoked. The ADAM II urinalysis test
cannot differentiate between cocaine in powder or in crack form, so positive test results could indicate
the use of either form of the drug. Self-report is used in ADAM to distinguish patterns of use (30-day,
12-month, etc.) and purchase between these two forms of the drug.
Cocaine either in the form of powder or crack was the second most commonly used substance among
arrestees in 2009 in all but Sacramento and Atlanta (Table 3.4). In Sacramento in 2009, 11 percent of
arrestees tested positive for cocaine while 31 percent tested positive for methamphetamine; in
Atlanta, the same proportion of arrestees tested sportive for marijuana. Atlanta (37 percent) leads the
sites in 2009 in the proportion of arrestees who tested positive, followed by Chicago (33 percent) and
New York (32 percent). It was considerably less common in arrestees in the two Western sites (16
percent in Portland and 11 percent in Sacramento).
ADAM II 2009 Annual Report What Is the Drug Use and Drug Market Activity among Arrestees? 29
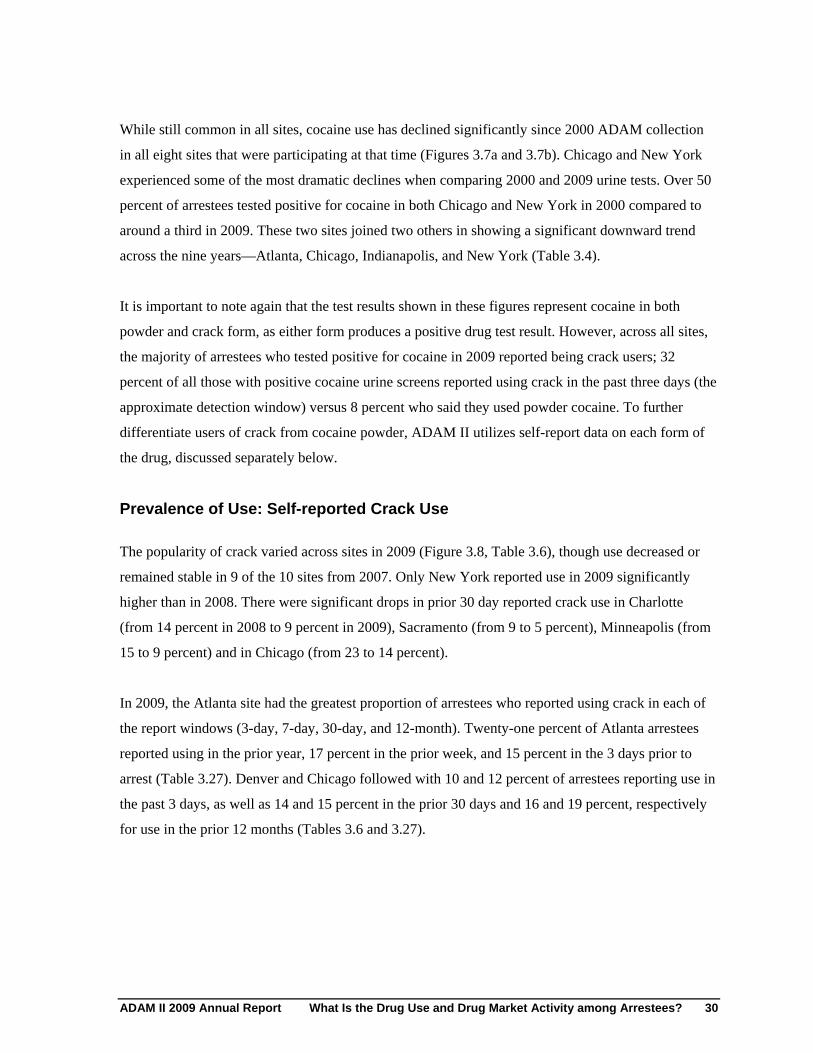
While still common in all sites, cocaine use has declined significantly since 2000 ADAM collection
in all eight sites that were participating at that time (Figures 3.7a and 3.7b). Chicago and New York
experienced some of the most dramatic declines when comparing 2000 and 2009 urine tests. Over 50
percent of arrestees tested positive for cocaine in both Chicago and New York in 2000 compared to
around a third in 2009. These two sites joined two others in showing a significant downward trend
across the nine years—Atlanta, Chicago, Indianapolis, and New York (Table 3.4).
It is important to note again that the test results shown in these figures represent cocaine in both
powder and crack form, as either form produces a positive drug test result. However, across all sites,
the majority of arrestees who tested positive for cocaine in 2009 reported being crack users; 32
percent of all those with positive cocaine urine screens reported using crack in the past three days (the
approximate detection window) versus 8 percent who said they used powder cocaine. To further
differentiate users of crack from cocaine powder, ADAM II utilizes self-report data on each form of
the drug, discussed separately below.
Prevalence of Use: Self-reported Crack Use
The popularity of crack varied across sites in 2009 (Figure 3.8, Table 3.6), though use decreased or
remained stable in 9 of the 10 sites from 2007. Only New York reported use in 2009 significantly
higher than in 2008. There were significant drops in prior 30 day reported crack use in Charlotte
(from 14 percent in 2008 to 9 percent in 2009), Sacramento (from 9 to 5 percent), Minneapolis (from
15 to 9 percent) and in Chicago (from 23 to 14 percent).
In 2009, the Atlanta site had the greatest proportion of arrestees who reported using crack in each of
the report windows (3-day, 7-day, 30-day, and 12-month). Twenty-one percent of Atlanta arrestees
reported using in the prior year, 17 percent in the prior week, and 15 percent in the 3 days prior to
arrest (Table 3.27). Denver and Chicago followed with 10 and 12 percent of arrestees reporting use in
the past 3 days, as well as 14 and 15 percent in the prior 30 days and 16 and 19 percent, respectively
for use in the prior 12 months (Tables 3.6 and 3.27).
ADAM II 2009 Annual Report What Is the Drug Use and Drug Market Activity among Arrestees? 30
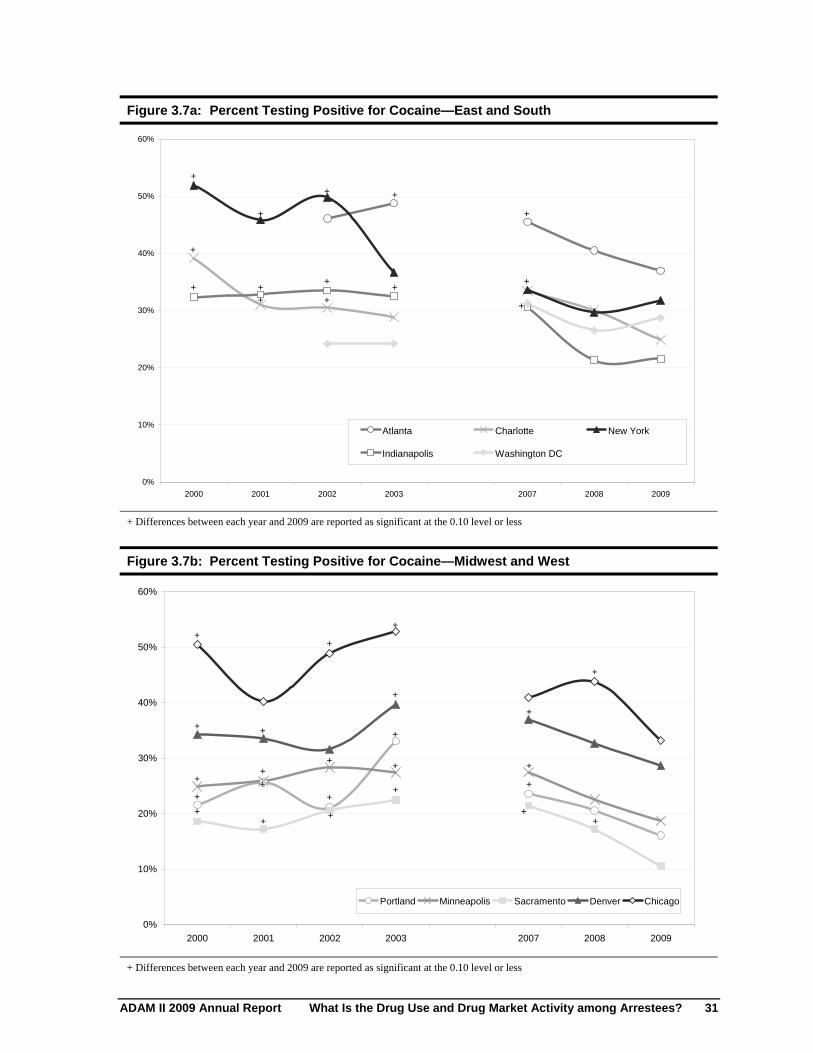
Figure 3.7a: Percent Testing Positive for Cocaine—East and South
60%
+
+50% +
+ +
+40%
+ ++ + +
+ + +30%
20%
10% Atlanta Charlotte New York
Indianapolis Washington DC
0%
2000 2001 2002 2003 2007 2008 2009
+ Differences between each year and 2009 are reported as significant at the 0.10 level or less
Figure 3.7b: Percent Testing Positive for Cocaine—Midwest and West
60%
50%
40%
30%
20%
10%
0%
+
+
+
+
+
+
+ +
+
+
+
+
+
Portland
+
+
+
+
+
Minneapolis Sacramento
+
+
+
+
Denver
+
+
Chicago
2000 2001 2002 2003 2007 2008 2009
+ Differences between each year and 2009 are reported as significant at the 0.10 level or less
ADAM II 2009 Annual Report What Is the Drug Use and Drug Market Activity among Arrestees? 31
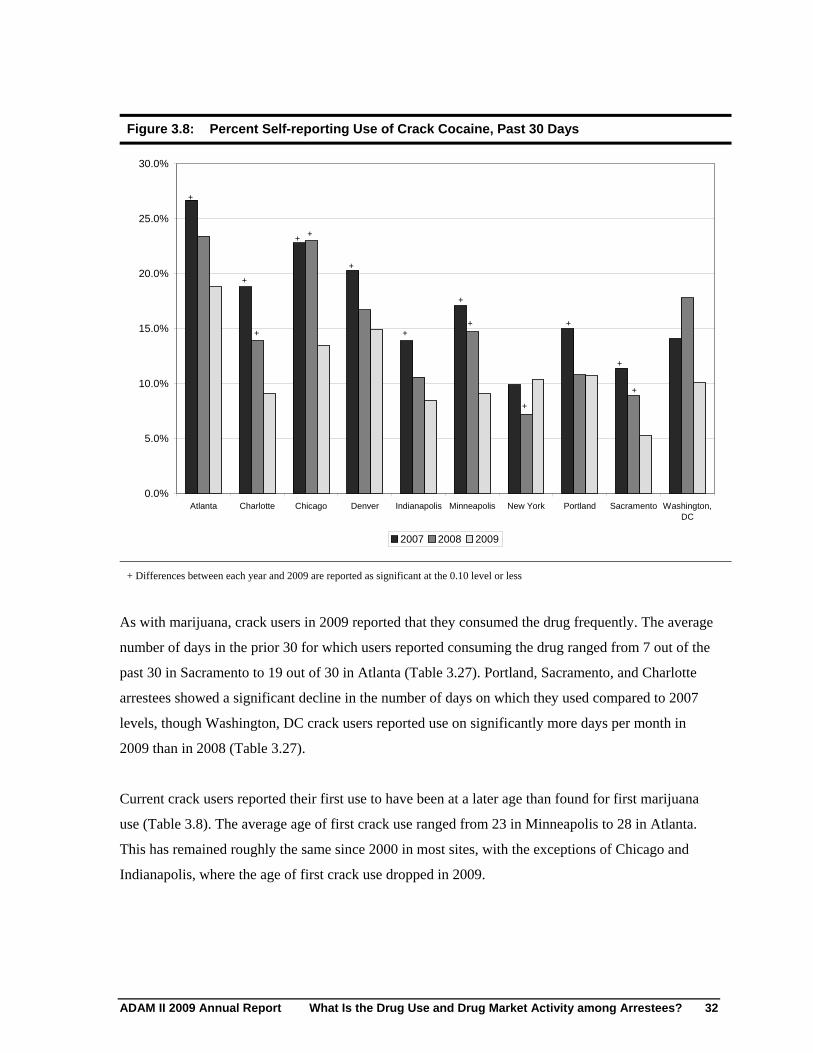
Figure 3.8: Percent Self-reporting Use of Crack Cocaine, Past 30 Days
30.0%
25.0%
20.0%
15.0%
10.0%
5.0%
0.0% Atlanta Charlotte Chicago Denver Indianapolis Minneapolis New York Portland Sacramento Washington,
DC
2007 2008 2009
+
+
+
++
+
+ +
+
+
+
+
+
+ Differences between each year and 2009 are reported as significant at the 0.10 level or less
As with marijuana, crack users in 2009 reported that they consumed the drug frequently. The average
number of days in the prior 30 for which users reported consuming the drug ranged from 7 out of the
past 30 in Sacramento to 19 out of 30 in Atlanta (Table 3.27). Portland, Sacramento, and Charlotte
arrestees showed a significant decline in the number of days on which they used compared to 2007
levels, though Washington, DC crack users reported use on significantly more days per month in
2009 than in 2008 (Table 3.27).
Current crack users reported their first use to have been at a later age than found for first marijuana
use (Table 3.8). The average age of first crack use ranged from 23 in Minneapolis to 28 in Atlanta.
This has remained roughly the same since 2000 in most sites, with the exceptions of Chicago and
Indianapolis, where the age of first crack use dropped in 2009.
ADAM II 2009 Annual Report What Is the Drug Use and Drug Market Activity among Arrestees? 32
Buying and Selling: Crack Markets
In 7 of the 8 sites that collected information in 2000 there were significant decreases compared to
2009 in the proportion of arrestees reporting they acquired crack in the prior 30 days (Table 3.10).
Since 2008 Charlotte dropped from 15 percent to 8 percent of arrestees who reported acquiring crack
cocaine in the past month; Chicago dropped from 26 percent to 17 percent; Minneapolis dropped
from 16 percent to 9 percent; and Sacramento dropped from 10 percent to 5 percent. The crack
cocaine market is largely a cash market (Table 3.13). In 9 of the 10 sites in 2009, over 75 percent of
those who acquired crack reported making at least one cash transaction in the past month. In 2009, the
proportion of noncash buys was consistently lower in all but Minneapolis (74 percent), ranging from
9 percent in Washington, DC to 61 percent in Portland (Table 3.14). In 2009, the average number of
purchases (Table 3.16) in the prior 30 days (cash and noncash) declined over 2008 in many sites,
dropping significantly in Atlanta (18 to 14), Indianapolis (11 to 7), Portland (10 to 7), and Sacramento
(10 to 7). In Minneapolis the average rose, from 10 to 14 purchases in the past 30 days. The decline in
purchases does not seem to be related to failed buys or problems obtaining crack cocaine; no site
recorded a significant increase in failed buys for crack cocaine in 2009. New York had a significant
decrease in reported failed buys, from 63 percent to 37 percent, suggesting somewhat greater
availability (Table 3.24).
For those who did acquire crack cocaine in 2009, most reported buying directly from a dealer (70–96
percent across sites), rather than through a go-between (Table 3.18), and in many sites the majority
reported buying crack cocaine from a regular source (Table 3.20). In 2009, in six sites, outdoor
purchases were the most common; in four (Charlotte, Indianapolis, Portland, and Sacramento) less
than 40 percent of arrestees reported that their most recent purchase was made outside. There were
significantly more outdoor sales of crack in 2009 compared to those reported in 2007 in three sites
(Atlanta, Denver, and Washington, DC) and significantly fewer in Charlotte (Table 3.21). In those
sites where outdoor purchases were most common (Atlanta, Chicago, Denver, New York, and
Washington, DC), arrestees reported contacting a dealer most frequently by approaching him/her in
public, indicating that the market may still be an open air, retail market for crack cocaine.
Prevalence of Use: Self-reported Powder Cocaine Use
Self reported use of cocaine powder was less prevalent in all sites than crack use. The range of self-
reports of use of powder cocaine in the prior three days was from 1 percent or less in Indianapolis and
Washington, DC to 7 percent in Denver (Table 3.28). As compared to 2007, fewer powder cocaine
users reported use in the prior 30 days in 2009, in 4 of the 10 sites (Figure 3.9, Table 3.6). In 2009,
ADAM II 2009 Annual Report What Is the Drug Use and Drug Market Activity among Arrestees? 33
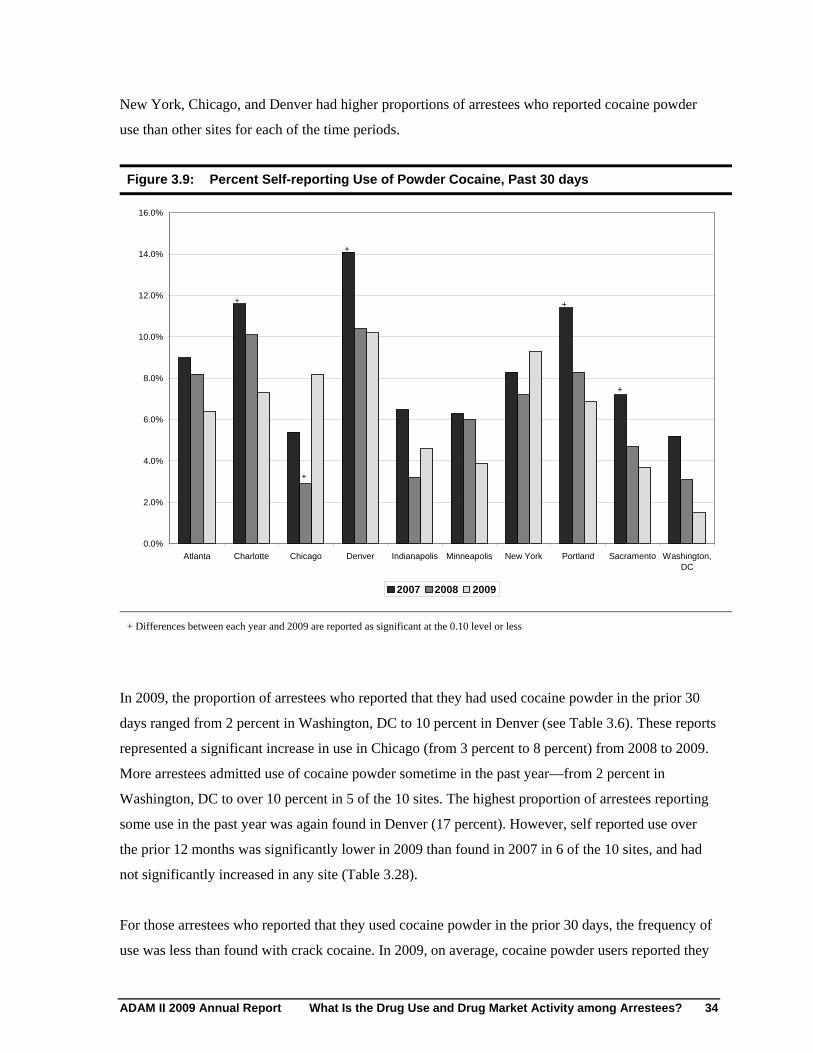
New York, Chicago, and Denver had higher proportions of arrestees who reported cocaine powder
use than other sites for each of the time periods.
Figure 3.9: Percent Self-reporting Use of Powder Cocaine, Past 30 days
Atlanta Charlotte Chicago Denver Indianapolis Minneapolis New York Portland
2007 2008 2009
Sacramento Washington, DC
0.0%
2.0%
4.0%
6.0%
8.0%
10.0%
12.0%
14.0%
16.0%
+
+
+
+
+
+ Differences between each year and 2009 are reported as significant at the 0.10 level or less
In 2009, the proportion of arrestees who reported that they had used cocaine powder in the prior 30
days ranged from 2 percent in Washington, DC to 10 percent in Denver (see Table 3.6). These reports
represented a significant increase in use in Chicago (from 3 percent to 8 percent) from 2008 to 2009.
More arrestees admitted use of cocaine powder sometime in the past year—from 2 percent in
Washington, DC to over 10 percent in 5 of the 10 sites. The highest proportion of arrestees reporting
some use in the past year was again found in Denver (17 percent). However, self reported use over
the prior 12 months was significantly lower in 2009 than found in 2007 in 6 of the 10 sites, and had
not significantly increased in any site (Table 3.28).
For those arrestees who reported that they used cocaine powder in the prior 30 days, the frequency of
use was less than found with crack cocaine. In 2009, on average, cocaine powder users reported they
ADAM II 2009 Annual Report What Is the Drug Use and Drug Market Activity among Arrestees? 34
used from only 1 day in the past month (Sacramento) to 10 days in the month (New York) (Table
3.28).
Buying and Selling: Cocaine Powder Markets
In 2009, between 4 and 11 percent of arrestees across 9 of 10 sites reported acquiring powder cocaine,
with significant declines observed in 5 sites from 2007 (Table 3.11). Four sites (Charlotte, Denver,
Sacramento and Minneapolis) showed the highest percentage of arrestees acquiring cocaine powder
in 2007, all with significant decreases in 2009. All other sites except Chicago showed their greatest
market participation in 2000-2003. For example, in 2000, 17 percent of arrestees in New York
reported they had acquired cocaine powder within the prior 30 days, declining to 9 percent in 2009.
In 2009, those who reported obtaining powder cocaine participated in the market less frequently than
did those who acquired crack cocaine, with the average number of purchases in the past month
ranging from two in Sacramento to nine in New York.4 In Chicago and Minneapolis the average
purchases rose from two to seven in each, but for the remaining sites the numbers were not
significantly different when compared to 2008 (Table 3.16). Unlike the case with crack cocaine,
which arrestees reported obtaining with cash most commonly, less than 75 percent of arrestees
reported making any cash purchase for powder cocaine in 6 of the 10 sites. New York and
Indianapolis are the only sites where more than 80 percent of arrestees who obtained powder cocaine
did so with a cash transaction (Table 3.13). Conversely, in six sites over 50 percent of those who
obtained powder cocaine reported at least one noncash transaction (Table 3.14). New York was the
only site where that proportion was less than 40 percent.
The proportion of arrestees who reported any failed buy in the past 30 days (Table 3.24) also
remained steady in all sites but New York, where it fell from 63 to 43 percent. Among arrestees who
obtained powder cocaine, the primary mode of initial contact with a dealer was by phone (over 50
percent in seven sites). Most users reported buying powder cocaine directly from a dealer (Table
3.18), though the proportion that reported that the dealer was their regular source varies across sites,
as was the case in 2007 and 2008. In most sites, the majority of arrestees who bought powder cocaine
reported making the purchase indoors (Table 3.20).
We have not included the Washington purchase data (29) as it represents only one case.
ADAM II 2009 Annual Report What Is the Drug Use and Drug Market Activity among Arrestees? 35
4
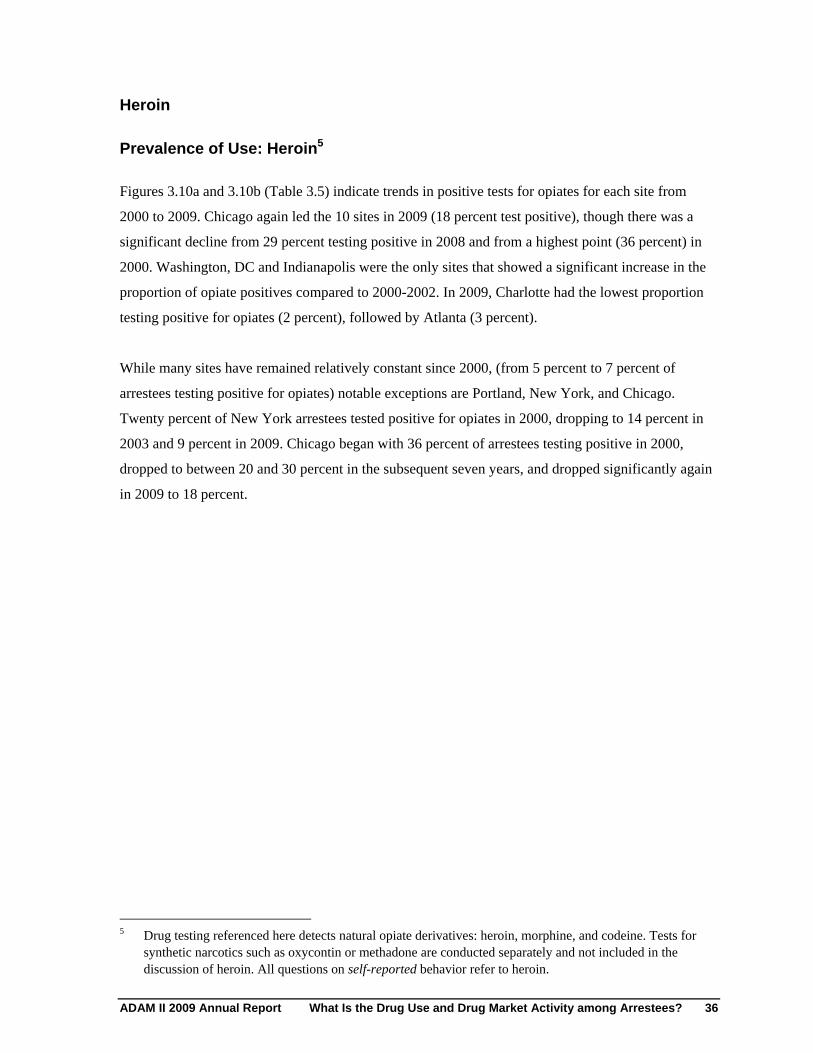
Heroin
Prevalence of Use: Heroin5
Figures 3.10a and 3.10b (Table 3.5) indicate trends in positive tests for opiates for each site from
2000 to 2009. Chicago again led the 10 sites in 2009 (18 percent test positive), though there was a
significant decline from 29 percent testing positive in 2008 and from a highest point (36 percent) in
2000. Washington, DC and Indianapolis were the only sites that showed a significant increase in the
proportion of opiate positives compared to 2000-2002. In 2009, Charlotte had the lowest proportion
testing positive for opiates (2 percent), followed by Atlanta (3 percent).
While many sites have remained relatively constant since 2000, (from 5 percent to 7 percent of
arrestees testing positive for opiates) notable exceptions are Portland, New York, and Chicago.
Twenty percent of New York arrestees tested positive for opiates in 2000, dropping to 14 percent in
2003 and 9 percent in 2009. Chicago began with 36 percent of arrestees testing positive in 2000,
dropped to between 20 and 30 percent in the subsequent seven years, and dropped significantly again
in 2009 to 18 percent.
Drug testing referenced here detects natural opiate derivatives: heroin, morphine, and codeine. Tests for synthetic narcotics such as oxycontin or methadone are conducted separately and not included in the discussion of heroin. All questions on self-reported behavior refer to heroin.
ADAM II 2009 Annual Report What Is the Drug Use and Drug Market Activity among Arrestees? 36
5
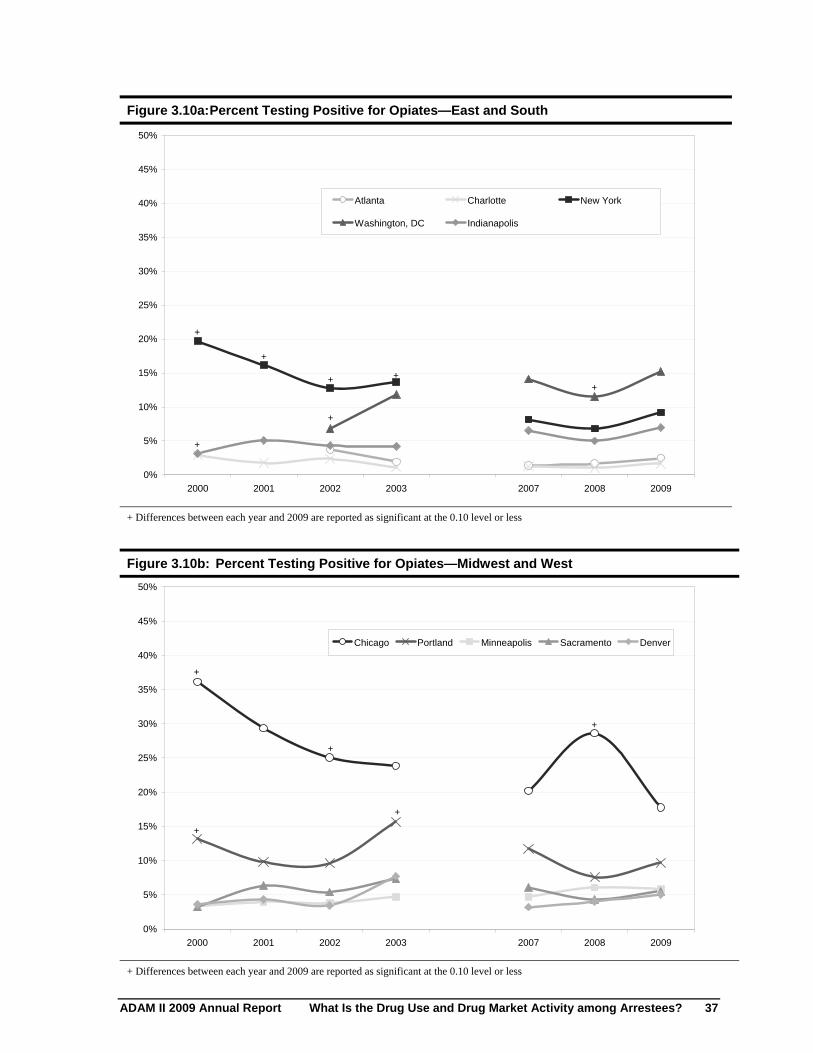
Figure 3.10a: Percent Testing Positive for Opiates—East and South
0%
5%
10%
15%
20%
25%
30%
35%
40%
45%
50%
Atlanta Charlotte New York
Washington, DC Indianapolis
+
++
+
+
+
+
2000 2001 2002 2003 2007 2008 2009
+ Differences between each year and 2009 are reported as significant at the 0.10 level or less
Figure 3.10b: Percent Testing Positive for Opiates—Midwest and West
50%
45%
40%
35%
30%
25%
20%
15%
10%
5%
0%
+
+
+
Chicago
+
Portland Minneapolis Sacramento
+
Denver
2000 2001 2002 2003 2007 2008 2009
+ Differences between each year and 2009 are reported as significant at the 0.10 level or less
ADAM II 2009 Annual Report What Is the Drug Use and Drug Market Activity among Arrestees? 37
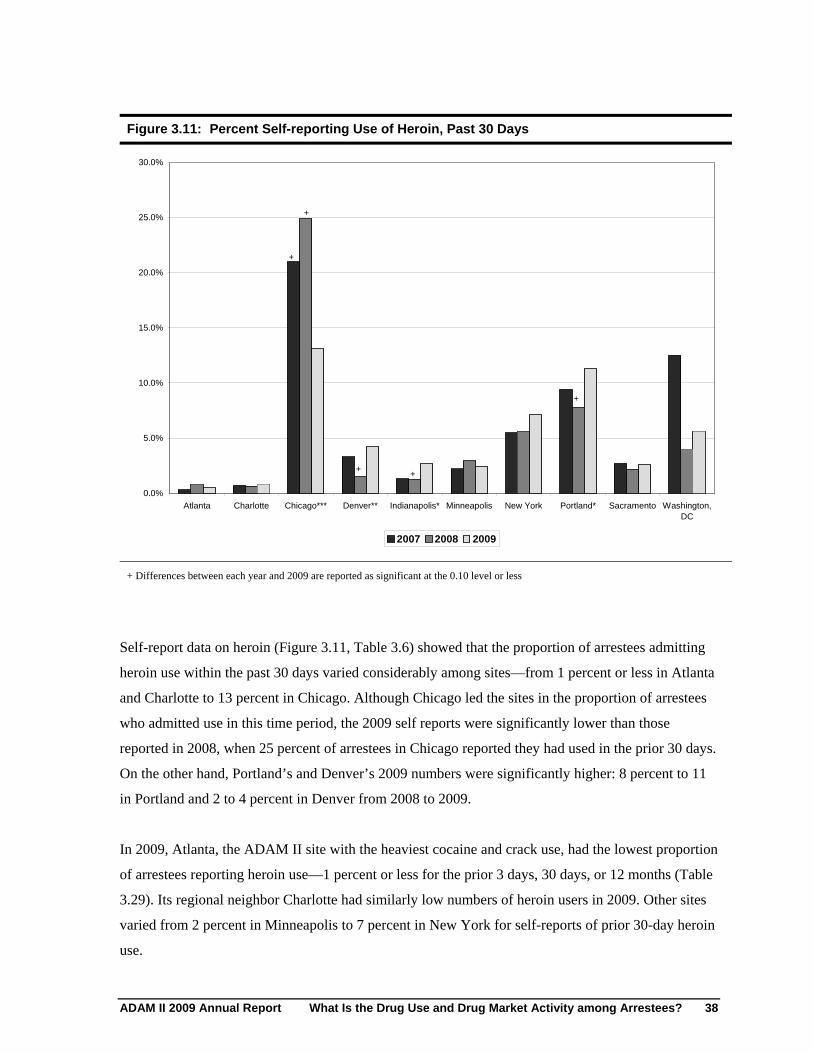
Figure 3.11: Percent Self-reporting Use of Heroin, Past 30 Days
30.0%
0.0%
5.0%
10.0%
15.0%
20.0%
25.0% +
+
+ +
+
Atlanta Charlotte Chicago*** Denver** Indianapolis* Minneapolis New York Portland* Sacramento Washington, DC
2007 2008 2009
+ Differences between each year and 2009 are reported as significant at the 0.10 level or less
Self-report data on heroin (Figure 3.11, Table 3.6) showed that the proportion of arrestees admitting
heroin use within the past 30 days varied considerably among sites—from 1 percent or less in Atlanta
and Charlotte to 13 percent in Chicago. Although Chicago led the sites in the proportion of arrestees
who admitted use in this time period, the 2009 self reports were significantly lower than those
reported in 2008, when 25 percent of arrestees in Chicago reported they had used in the prior 30 days.
On the other hand, Portland’s and Denver’s 2009 numbers were significantly higher: 8 percent to 11
in Portland and 2 to 4 percent in Denver from 2008 to 2009.
In 2009, Atlanta, the ADAM II site with the heaviest cocaine and crack use, had the lowest proportion
of arrestees reporting heroin use—1 percent or less for the prior 3 days, 30 days, or 12 months (Table
3.29). Its regional neighbor Charlotte had similarly low numbers of heroin users in 2009. Other sites
varied from 2 percent in Minneapolis to 7 percent in New York for self-reports of prior 30-day heroin
use.
ADAM II 2009 Annual Report What Is the Drug Use and Drug Market Activity among Arrestees? 38
Arrestees who reported that they had ever used heroin began that use, on average, in their early to
mid-twenties, a pattern like that found with cocaine (Table 3.9). In Chicago the average age of first
heroin use dropped significantly, from 25 years old in 2000, to 20 years old in 2009 (Table 3.9) but
rose in 2009 in Minneapolis and Portland from 2002-2004 levels. Arrestees who reported current
heroin use were also frequent consumers in 2009. Heroin users reported they had used on 20 days or
more out of the prior 30 in five sites, and as many as 26 days in the past 30 in Chicago in 2009 (Table
3.29).
Buying and Selling: Heroin Markets
The proportion of arrestees who reported acquiring heroin in the past month continued to vary across
sites. In some sites (Atlanta and Charlotte) in 2009 only, 1 percent reported acquiring heroin, while in
others (Chicago and Portland) the proportion was over 10 percent. In Chicago, reported heroin
acquisition continued to decline significantly, falling from 32 percent in 2000 to 15 percent in 2009
(Table 3.11). New York showed a similar steep decline—from 18 percent of arrestees reporting they
acquired heroin in the prior 30 days in 2000 to 7 percent in 2009.
While the proportion of arrestees reporting acquisition fluctuated in some sites, the average number of
purchases among those who acquired heroin remained steady across all sites (Table 3.17), with the
exception of Atlanta (this estimate, however, reflects less than 1 percent of the arrestee sample). For
most sites, the average number of purchases for heroin was much higher than for other drugs
(between 9 and 21 in the past month), indicating very heavy market participation for these arrestees,
despite their relatively small representation in the sample as a whole. Like that for crack cocaine, the
market for heroin is largely a cash market. In 2009, in the three sites with the highest proportion of
arrestees who reported heroin market participation, the average number of days in the past 30 for
which arrestees paid cash for the drug was also high—26 in Chicago, 22 in New York, and 19 in
Portland (Table 3.15). In 2009, in Chicago and Portland, over 95 percent of arrestees who reported
acquiring heroin reported making a cash heroin purchase in the preceding month, and in New York 84
percent reported a recent cash purchase (Table 3.13). These numbers have remained basically
unchanged since 2007. The percentage that reported a noncash heroin transaction in 2009 remained
steady in most sites, with the exception of Portland, where it fell from 74 percent in 2008 to 56
percent in 2009 (Table 3.14). Over 75 percent of arrestees in all sites with active heroin markets
reported purchasing heroin directly from a regular source (Table 3.21). With the exception of
arrestees in Chicago (38 percent), the majority of arrestees reported purchasing it outdoors (Table
3.23).
ADAM II 2009 Annual Report What Is the Drug Use and Drug Market Activity among Arrestees? 39
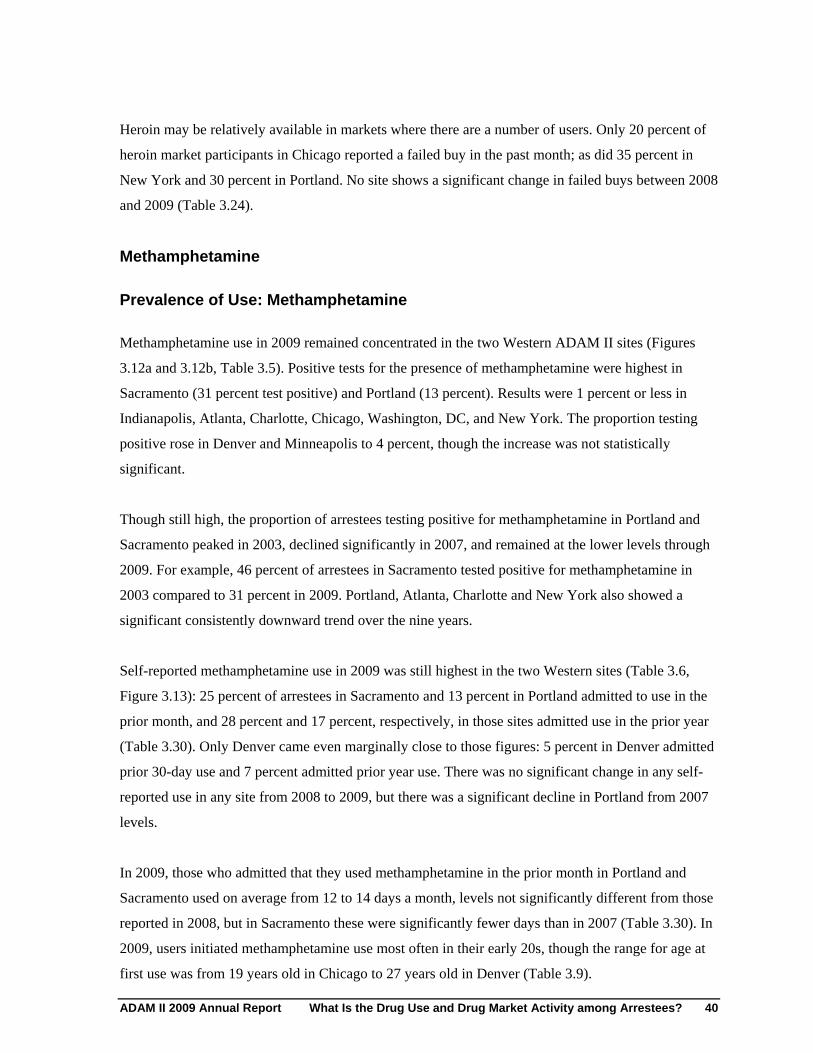
Heroin may be relatively available in markets where there are a number of users. Only 20 percent of
heroin market participants in Chicago reported a failed buy in the past month; as did 35 percent in
New York and 30 percent in Portland. No site shows a significant change in failed buys between 2008
and 2009 (Table 3.24).
Methamphetamine
Prevalence of Use: Methamphetamine
Methamphetamine use in 2009 remained concentrated in the two Western ADAM II sites (Figures
3.12a and 3.12b, Table 3.5). Positive tests for the presence of methamphetamine were highest in
Sacramento (31 percent test positive) and Portland (13 percent). Results were 1 percent or less in
Indianapolis, Atlanta, Charlotte, Chicago, Washington, DC, and New York. The proportion testing
positive rose in Denver and Minneapolis to 4 percent, though the increase was not statistically
significant.
Though still high, the proportion of arrestees testing positive for methamphetamine in Portland and
Sacramento peaked in 2003, declined significantly in 2007, and remained at the lower levels through
2009. For example, 46 percent of arrestees in Sacramento tested positive for methamphetamine in
2003 compared to 31 percent in 2009. Portland, Atlanta, Charlotte and New York also showed a
significant consistently downward trend over the nine years.
Self-reported methamphetamine use in 2009 was still highest in the two Western sites (Table 3.6,
Figure 3.13): 25 percent of arrestees in Sacramento and 13 percent in Portland admitted to use in the
prior month, and 28 percent and 17 percent, respectively, in those sites admitted use in the prior year
(Table 3.30). Only Denver came even marginally close to those figures: 5 percent in Denver admitted
prior 30-day use and 7 percent admitted prior year use. There was no significant change in any self-
reported use in any site from 2008 to 2009, but there was a significant decline in Portland from 2007
levels.
In 2009, those who admitted that they used methamphetamine in the prior month in Portland and
Sacramento used on average from 12 to 14 days a month, levels not significantly different from those
reported in 2008, but in Sacramento these were significantly fewer days than in 2007 (Table 3.30). In
2009, users initiated methamphetamine use most often in their early 20s, though the range for age at
first use was from 19 years old in Chicago to 27 years old in Denver (Table 3.9).
ADAM II 2009 Annual Report What Is the Drug Use and Drug Market Activity among Arrestees? 40
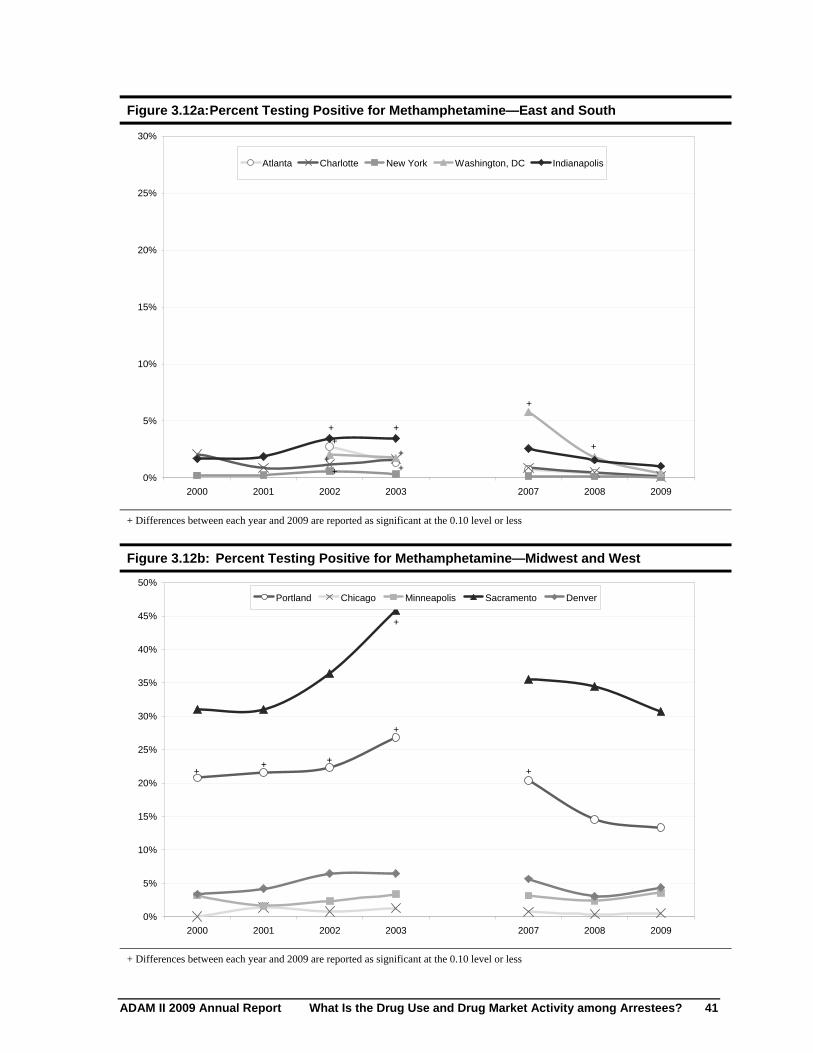
Figure 3.12a: Percent Testing Positive for Methamphetamine—East and South
30%
25%
20%
15%
10%
5%
0%
Atlanta Charlotte
+
+
+
+
New York
+
+
+
Washington, DC
+
Indianapolis
+
2000 2001 2002 2003 2007 2008 2009
+ Differences between each year and 2009 are reported as significant at the 0.10 level or less
Figure 3.12b: Percent Testing Positive for Methamphetamine—Midwest and West
50%
45%
40%
35%
30%
25%
20%
15%
10%
5%
0%
+
Portland
+
Chicago
+
Minneapolis
+
+
Sacramento
+
Denver
2000 2001 2002 2003 2007 2008 2009
+ Differences between each year and 2009 are reported as significant at the 0.10 level or less
ADAM II 2009 Annual Report What Is the Drug Use and Drug Market Activity among Arrestees? 41

Figure 3.13: Percent Self-Reporting Use of Methamphetamine, Past 30 Days
Atlanta Charlotte Chicago Denver Indianapolis Minneapolis New York Portland Sacramento Washington, DC
2007 2008 2009
0.0%
5.0%
10.0%
15.0%
20.0%
25.0%
30.0%
35.0%
+
Differences between each year and 2009 are reported as significant at the 0.10 level or less
Buying and Selling: Methamphetamine Markets
In 2009, methamphetamine market participation remained limited in most ADAM sites. In six sites
fewer than 1 percent of arrestees reported obtaining methamphetamine in the previous month; in two
other sites, Denver and Minneapolis, 5 percent or less reported any past month acquisition. In
Portland (14 percent) and Sacramento (26 percent), there has been a decline since the high point in
2003 of 26 percent and 36 percent respectively in arrestee reports of methamphetamine acquisition
(Table 3.12). As with data on use, methamphetamine market activity was also highest in 2003 in
Minneapolis and Indianapolis and significantly lower for those sites in 2009.
In 2009, Portland, arrestees who reported methamphetamine acquisition obtained the drug on an
average of seven days in the previous month (Table 3.17), and 62 percent reported at least one cash
transaction in that period, down from 77 percent in 2008 (Table 3.13). There was a commensurate rise
in the proportion of arrestees who reported a noncash transaction in 2009, up from 61 percent in 2008
ADAM II 2009 Annual Report What Is the Drug Use and Drug Market Activity among Arrestees? 42
to 76 percent (Table 3.14). Eighty-two percent of Portland arrestees who bought methamphetamine in
2009 did so directly from a dealer (Table 3.19), though only 45 percent reported that the dealer was
their regular source for the drug (Table 3.21). Seventeen percent reported purchasing
methamphetamine outdoors (Table 3.23), and the primary mode of initial contact with the dealer was
either by phone or at a house or apartment. The proportion of arrestees who reported a failed buy for
methamphetamine fell from 47 percent in 2008 to 23 percent in 2009 (Table 3.24).
In Sacramento in 2009, arrestees reported purchasing methamphetamine on fewer days in the past
month, dropping from an average of 10 in 2008 to 7 in 2009 (Table 3.17). Sixty-three percent of
arrestees in Sacramento who reported obtaining methamphetamine reported a cash purchase in the
previous month, significantly lower than 2007 levels; 65 percent reported a noncash transaction in
that period. Most (75 percent) reported that their last purchase was made directly from a dealer, and
43 percent said this dealer was their regular source (Tables 3.19 and 3.21). Thirty-two percent
reported making that purchase outdoors, and approaching a dealer in public was the primary way 29
percent of arrestees reported contacting the dealer. Forty-one percent of arrestees who reported
participating in the methamphetamine market in the past month also reported a failed buy during that
period, a figure consistent with 2008 (Table 3.24).
Injection
Three of the major drugs of interest can be injected (heroin, methamphetamine, and cocaine),
presenting the added public health issue of disease transmission. In ADAM II, arrestees are asked to
identify each of the drugs they admitted using in the prior 12 months and to report how they used
each at the last use (smoke, sniff or snort, inject, or eat/swallow). The most commonly injected
substance (Table 3.31) in all years of ADAM was heroin. Four sites (Charlotte, Indianapolis,
Portland, and Sacramento) reported over 75 percent of heroin users injecting in 2009. New York and
Chicago, sites with a substantial number of arrestees testing positive for opiates, show considerably
less injection in 2009 at last use (44 and 28 percent, respectively), indicating use by another route,
such as inhalation or smoking.
In sites where methamphetamine use was prevalent there was also variation in method of ingestion. In
2009, in Portland 38 percent of users injected at last use, while in Denver 17 percent reported
injecting. In Sacramento, where the greatest number of methamphetamine users were found, only 8
percent reported injecting in 2009, compared to 29 percent in 2000.
ADAM II 2009 Annual Report What Is the Drug Use and Drug Market Activity among Arrestees? 43
Cocaine in powder form was injected less than 10 percent of the time in 2009 in all but two sites. In
Portland 19 percent of users reported injection at last use (though this was significantly lower than the
highs of over 50 percent in earlier years), and in Minneapolis 12 percent reported injection at last use.
The New York site showed a statistically significant decline in the number of injectors of powder
cocaine from 2008—dropping from 27 percent to 8 percent.
Other Drugs
In addition to the five major drugs mentioned above, arrestees were tested for the presence of other
drugs (barbiturates, Darvon, methadone, oxycodone, PCP, and benzodiazepines) and also asked to
identify which drugs from a series of drugs they have used without a prescription in the prior month.6
Tables 3.32 and 3.33 indicate the results of testing for other drugs among arrestees in each site.
Compared to the five major drugs of interest, there were fewer positive tests for the other drug
categories in all sites. Methadone was most often found in New York (7 percent), a city with many
public methadone programs. PCP, a drug once popular in many areas and one of the NIDA-5 test
drugs, was detected in only a few individuals in half of the ADAM II sites. Oxycodone, the synthetic
narcotic that has gained popularity as a street drug, appeared in 8 of the 10 sites, and in New York the
proportion rose significantly to 2 percent. There were no significant changes in any of the other drugs
for which ADAM II tests from 2008 to 2009
Self-report of other drugs (Table 3.34) indicated that other opiate painkillers (Percodan, Vicodin,
Percocet, Dilaudid, Codeine) were the most commonly named “other drugs” in most sites.7 Arrestees
mentioned the use of other opiate painkillers in the prior 30 days in all of the 10 sites, ranging from 2
percent in New York to 10 percent in Portland and Indianapolis.
6 The list contains both prescription drugs that may be abused (barbiturates, sedative/tranquilizers, and oxycodone) and nonprescription drugs of abuse (GBH, MDMA, LSD, and PCP).
7 A number of arrestees report use of a range of drugs that are recorded as “other.” The drugs recorded in this category include legal substances like Tylenol, cough medicines, Advil, and aspirin.
ADAM II 2009 Annual Report What Is the Drug Use and Drug Market Activity among Arrestees? 44
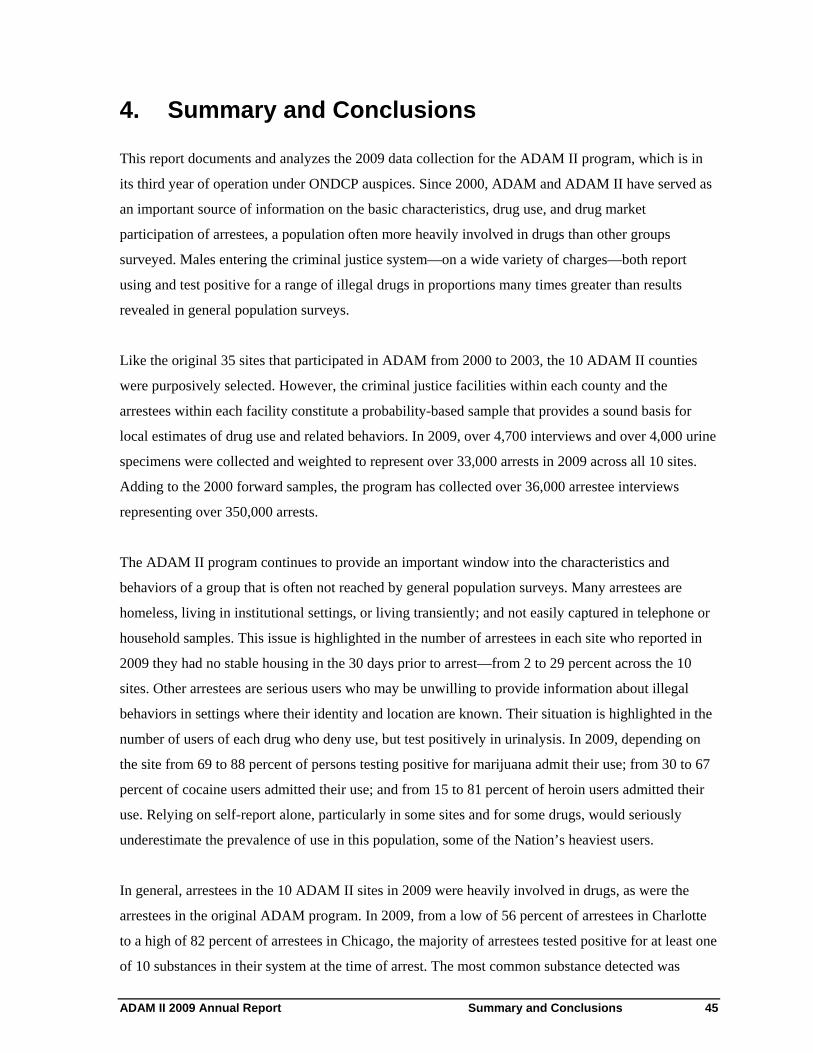
4. Summary and Conclusions
This report documents and analyzes the 2009 data collection for the ADAM II program, which is in
its third year of operation under ONDCP auspices. Since 2000, ADAM and ADAM II have served as
an important source of information on the basic characteristics, drug use, and drug market
participation of arrestees, a population often more heavily involved in drugs than other groups
surveyed. Males entering the criminal justice system—on a wide variety of charges—both report
using and test positive for a range of illegal drugs in proportions many times greater than results
revealed in general population surveys.
Like the original 35 sites that participated in ADAM from 2000 to 2003, the 10 ADAM II counties
were purposively selected. However, the criminal justice facilities within each county and the
arrestees within each facility constitute a probability-based sample that provides a sound basis for
local estimates of drug use and related behaviors. In 2009, over 4,700 interviews and over 4,000 urine
specimens were collected and weighted to represent over 33,000 arrests in 2009 across all 10 sites.
Adding to the 2000 forward samples, the program has collected over 36,000 arrestee interviews
representing over 350,000 arrests.
The ADAM II program continues to provide an important window into the characteristics and
behaviors of a group that is often not reached by general population surveys. Many arrestees are
homeless, living in institutional settings, or living transiently; and not easily captured in telephone or
household samples. This issue is highlighted in the number of arrestees in each site who reported in
2009 they had no stable housing in the 30 days prior to arrest—from 2 to 29 percent across the 10
sites. Other arrestees are serious users who may be unwilling to provide information about illegal
behaviors in settings where their identity and location are known. Their situation is highlighted in the
number of users of each drug who deny use, but test positively in urinalysis. In 2009, depending on
the site from 69 to 88 percent of persons testing positive for marijuana admit their use; from 30 to 67
percent of cocaine users admitted their use; and from 15 to 81 percent of heroin users admitted their
use. Relying on self-report alone, particularly in some sites and for some drugs, would seriously
underestimate the prevalence of use in this population, some of the Nation’s heaviest users.
In general, arrestees in the 10 ADAM II sites in 2009 were heavily involved in drugs, as were the
arrestees in the original ADAM program. In 2009, from a low of 56 percent of arrestees in Charlotte
to a high of 82 percent of arrestees in Chicago, the majority of arrestees tested positive for at least one
of 10 substances in their system at the time of arrest. The most common substance detected was
ADAM II 2009 Annual Report Summary and Conclusions 45
marijuana in all sites (from 36 to 49 percent testing positive) except for Atlanta, where cocaine use is
equally prevalent.
ADAM II data also point to regional variations in drug use. Cocaine was detected in 30 percent or
more of arrestees in Atlanta, New York, and Chicago, but in 16 percent or less of arrestees in the two
Western sites, the only two sites where the percentage of methamphetamine positives was substantial:
31 percent positive in Sacramento and 13 percent positive in Portland, compared to 1 percent or less
in half of the sites.
In spite of the heavy use reflected in ADAM II 2009 data, there is encouraging news. The proportion
of arrestees testing positive for cocaine has declined significantly in all sites but Washington, DC
since earlier peak points, and continued a significant downward trend in 5 of the 10 sites. The two
sites with the historically highest proportion of arrestees testing positive for opiates (New York and
Chicago) have both experienced a 50 percent drop from 2000 to 2009. Finally, methamphetamine use
does not appear to have remained concentrated in the western part of the county. Even in Portland and
Sacramento data on methamphetamine use in 2009 is significantly lower than peaks in 2003.
As this report indicates, drug use and drug market activity can be misleading if only national
estimates are examined. Local supply and local demand can vary even within the same region of the
country, making local estimates vital for local law enforcement and treatment planning.
The program now moves into its fourth year and continues as a critical complement to other drug
surveys. All 10 ADAM II sites will again collect data in two quarters beginning in April 2010, using
the same protocols described in this report. Data for 2010 for comparison with prior years will be
available in early 2011.
ADAM II 2009 Annual Report Summary and Conclusions 46
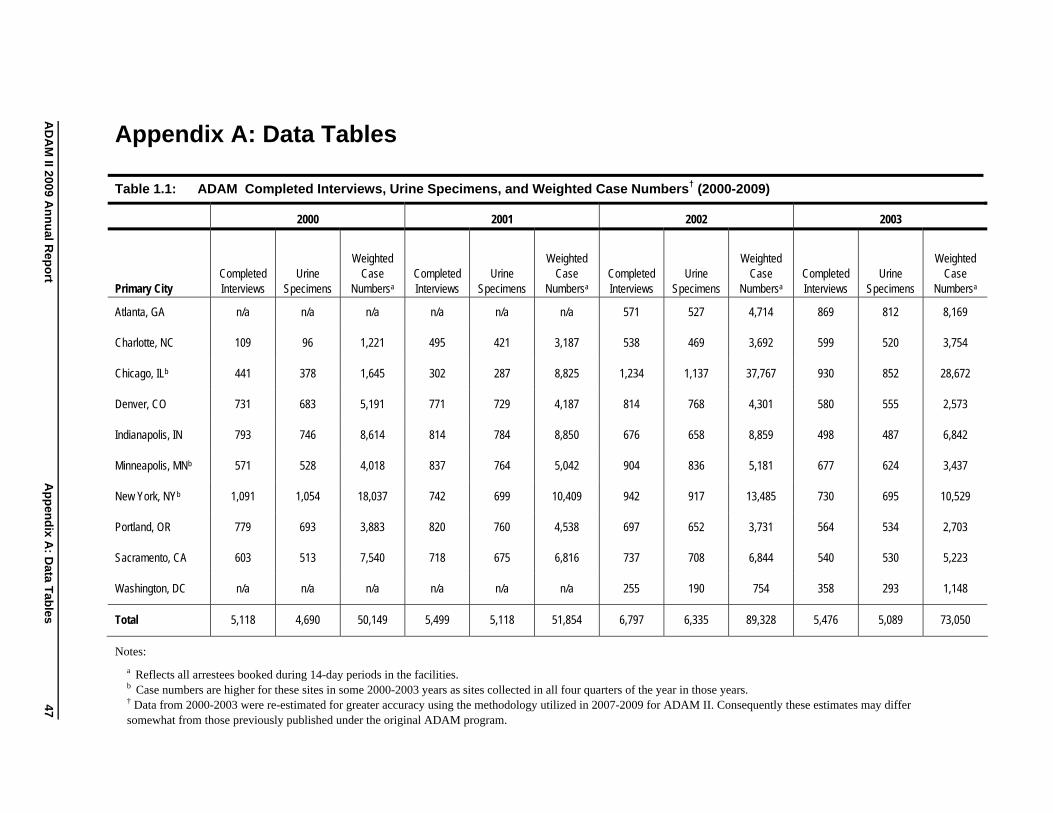
AD
AM
II 2009 An
nu
al Rep
ort
Ap
pen
dix A
: Data T
ables
Appendix A: Data Tables
Table 1.1: ADAM Completed Interviews, Urine Specimens, and Weighted Case Numbers† (2000-2009)
2000 2001 2002 2003
Weighted Weighted Weighted Weighted Completed Urine Case Completed Urine Case Completed Urine Case Completed Urine Case
Primary City Interviews Specimens Numbersa Interviews Specimens Numbersa Interviews Specimens Numbersa Interviews Specimens Numbersa
Atlanta, GA n/a n/a n/a n/a n/a n/a 571 527 4,714 869 812 8,169
Charlotte, NC 109 96 1,221 495 421 3,187 538 469 3,692 599 520 3,754
Chicago, ILb 441 378 1,645 302 287 8,825 1,234 1,137 37,767 930 852 28,672
Denver, CO 731 683 5,191 771 729 4,187 814 768 4,301 580 555 2,573
Indianapolis, IN 793 746 8,614 814 784 8,850 676 658 8,859 498 487 6,842
Minneapolis, MNb 571 528 4,018 837 764 5,042 904 836 5,181 677 624 3,437
New York, NYb 1,091 1,054 18,037 742 699 10,409 942 917 13,485 730 695 10,529
Portland, OR 779 693 3,883 820 760 4,538 697 652 3,731 564 534 2,703
Sacramento, CA 603 513 7,540 718 675 6,816 737 708 6,844 540 530 5,223
Washington, DC n/a n/a n/a n/a n/a n/a 255 190 754 358 293 1,148
Total 5,118 4,690 50,149 5,499 5,118 51,854 6,797 6,335 89,328 5,476 5,089 73,050
Notes:
a Reflects all arrestees booked during 14-day periods in the facilities.
b Case numbers are higher for these sites in some 2000-2003 years as sites collected in all four quarters of the year in those years.
† Data from 2000-2003 were re-estimated for greater accuracy using the methodology utilized in 2007-2009 for ADAM II. Consequently these estimates may differ somewhat from those previously published under the original ADAM program.
47
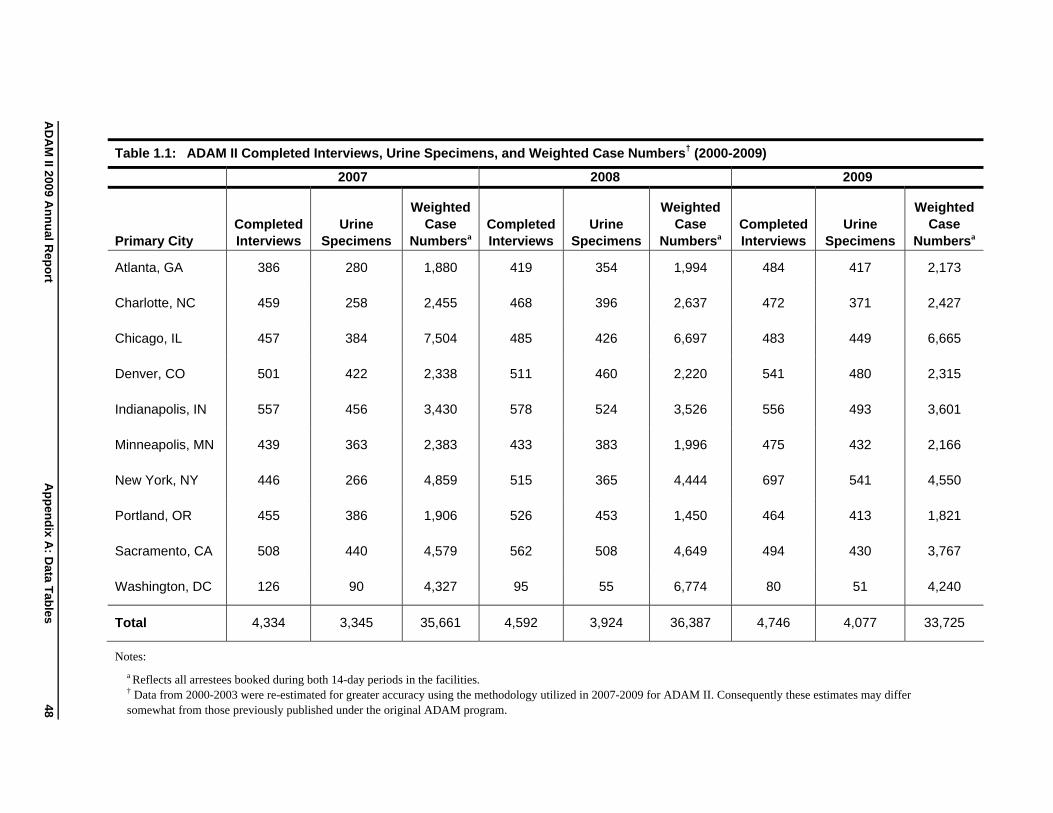
AD
AM
II 2009 An
nu
al Rep
ort
Ap
pen
dix A
: Data T
ables
Table 1.1: ADAM II Completed Interviews, Urine Specimens, and Weighted Case Numbers† (2000-2009)
2007 2008 2009
Weighted Weighted Weighted Completed Urine Case Completed Urine Case Completed Urine Case
Primary City Interviews Specimens Numbersa Interviews Specimens Numbersa Interviews Specimens Numbersa
Atlanta, GA 386 280 1,880 419 354 1,994 484 417 2,173
Charlotte, NC 459 258 2,455 468 396 2,637 472 371 2,427
Chicago, IL 457 384 7,504 485 426 6,697 483 449 6,665
Denver, CO 501 422 2,338 511 460 2,220 541 480 2,315
Indianapolis, IN 557 456 3,430 578 524 3,526 556 493 3,601
Minneapolis, MN 439 363 2,383 433 383 1,996 475 432 2,166
New York, NY 446 266 4,859 515 365 4,444 697 541 4,550
Portland, OR 455 386 1,906 526 453 1,450 464 413 1,821
Sacramento, CA 508 440 4,579 562 508 4,649 494 430 3,767
Washington, DC 126 90 4,327 95 55 6,774 80 51 4,240
Total 4,334 3,345 35,661 4,592 3,924 36,387 4,746 4,077 33,725
Notes:
a Reflects all arrestees booked during both 14-day periods in the facilities. † Data from 2000-2003 were re-estimated for greater accuracy using the methodology utilized in 2007-2009 for ADAM II. Consequently these estimates may differ somewhat from those previously published under the original ADAM program.
48
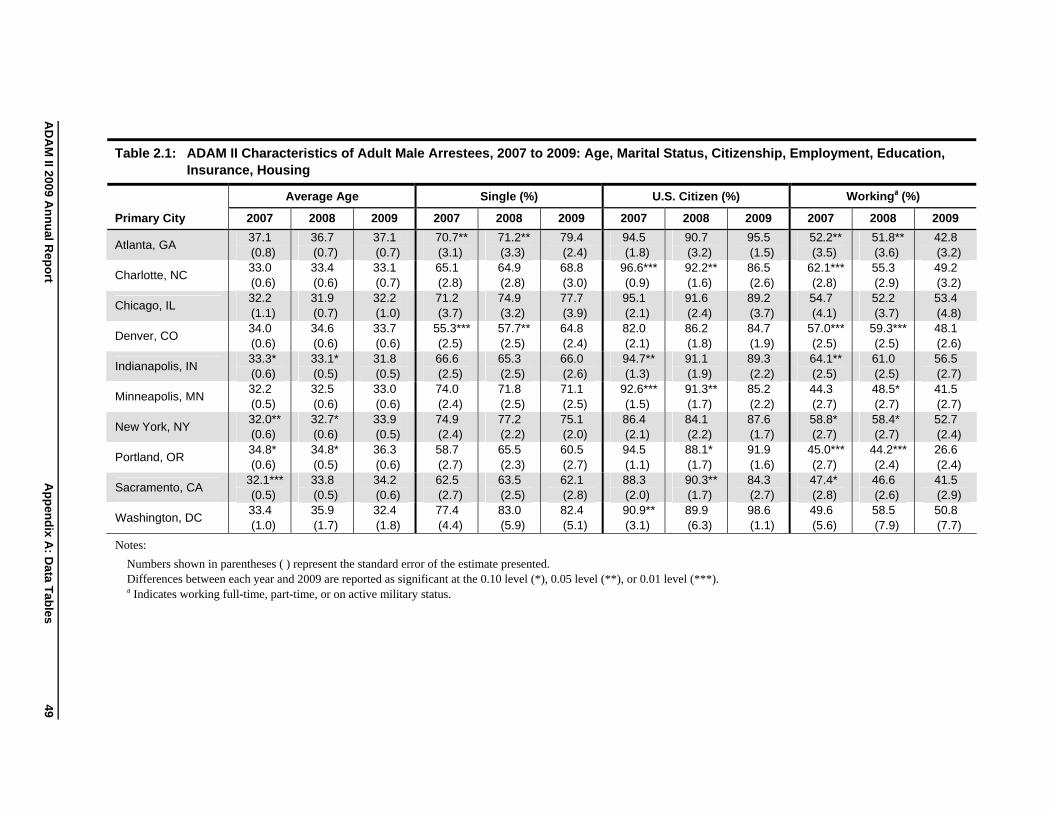
AD
AM
II 2009 An
nu
al Rep
ort
Ap
pen
dix A
: Data T
ables
Table 2.1: ADAM II Characteristics of Adult Male Arrestees, 2007 to 2009: Age, Marital Status, Citizenship, Employment, Education, Insurance, Housing
Primary City
Average Age Single (%) U.S. Citizen (%) Workinga (%)
2007 2008 2009 2007 2008 2009 2007 2008 2009 2007 2008 2009
Atlanta, GA 37.1 (0.8)
36.7 (0.7)
37.1 (0.7)
70.7** (3.1)
71.2** (3.3)
79.4 (2.4)
94.5 (1.8)
90.7 (3.2)
95.5 (1.5)
52.2** (3.5)
51.8** (3.6)
42.8 (3.2)
Charlotte, NC
Chicago, IL
33.0 (0.6) 32.2 (1.1)
33.4 (0.6) 31.9 (0.7)
33.1 (0.7) 32.2 (1.0)
65.1 (2.8) 71.2 (3.7)
64.9 (2.8) 74.9 (3.2)
68.8 (3.0) 77.7 (3.9)
96.6*** (0.9) 95.1 (2.1)
92.2** (1.6) 91.6 (2.4)
86.5 (2.6) 89.2 (3.7)
62.1*** (2.8) 54.7 (4.1)
55.3 (2.9) 52.2 (3.7)
49.2 (3.2) 53.4 (4.8)
Denver, CO 34.0 (0.6)
34.6 (0.6)
33.7 (0.6)
55.3*** (2.5)
57.7** (2.5)
64.8 (2.4)
82.0 (2.1)
86.2 (1.8)
84.7 (1.9)
57.0*** (2.5)
59.3*** (2.5)
48.1 (2.6)
Indianapolis, IN 33.3* (0.6)
33.1* (0.5)
31.8 (0.5)
66.6 (2.5)
65.3 (2.5)
66.0 (2.6)
94.7** (1.3)
91.1 (1.9)
89.3 (2.2)
64.1** (2.5)
61.0 (2.5)
56.5 (2.7)
Minneapolis, MN
New York, NY
32.2 (0.5) 32.0** (0.6)
32.5 (0.6) 32.7* (0.6)
33.0 (0.6) 33.9 (0.5)
74.0 (2.4) 74.9 (2.4)
71.8 (2.5) 77.2 (2.2)
71.1 (2.5) 75.1 (2.0)
92.6*** (1.5) 86.4 (2.1)
91.3** (1.7) 84.1 (2.2)
85.2 (2.2) 87.6 (1.7)
44.3 (2.7) 58.8* (2.7)
48.5* (2.7) 58.4* (2.7)
41.5 (2.7) 52.7 (2.4)
Portland, OR 34.8* (0.6)
34.8* (0.5)
36.3 (0.6)
58.7 (2.7)
65.5 (2.3)
60.5 (2.7)
94.5 (1.1)
88.1* (1.7)
91.9 (1.6)
45.0*** (2.7)
44.2*** (2.4)
26.6 (2.4)
Sacramento, CA 32.1*** (0.5)
33.8 (0.5)
34.2 (0.6)
62.5 (2.7)
63.5 (2.5)
62.1 (2.8)
88.3 (2.0)
90.3** (1.7)
84.3 (2.7)
47.4* (2.8)
46.6 (2.6)
41.5 (2.9)
Washington, DC 33.4 (1.0)
35.9 (1.7)
32.4 (1.8)
77.4 (4.4)
83.0 (5.9)
82.4 (5.1)
90.9** (3.1)
89.9 (6.3)
98.6 (1.1)
49.6 (5.6)
58.5 (7.9)
50.8 (7.7)
Notes:
Numbers shown in parentheses ( ) represent the standard error of the estimate presented.
Differences between each year and 2009 are reported as significant at the 0.10 level (*), 0.05 level (**), or 0.01 level (***).
a Indicates working full-time, part-time, or on active military status.
49
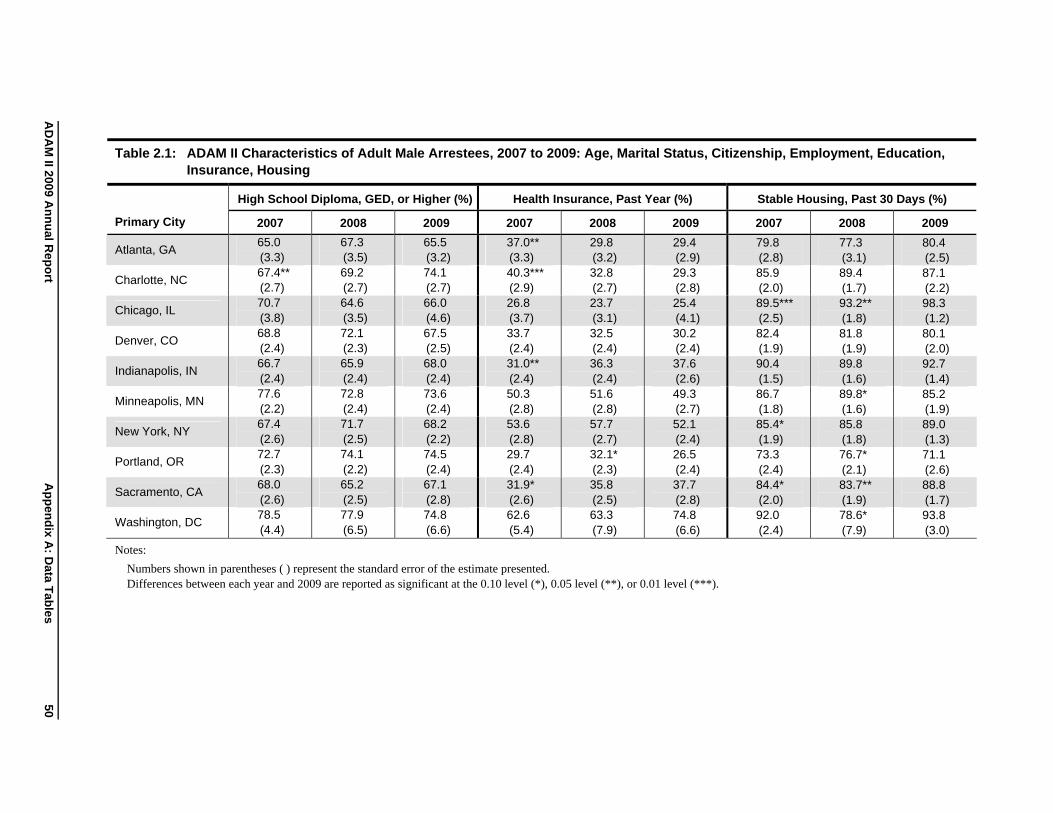
AD
AM
II 2009 An
nu
al Rep
ort
Ap
pen
dix A
: Data T
ables
Table 2.1: ADAM II Characteristics of Adult Male Arrestees, 2007 to 2009: Age, Marital Status, Citizenship, Employment, Education, Insurance, Housing
Primary City
High School Diploma, GED, or Higher (%) Health Insurance, Past Year (%) Stable Housing, Past 30 Days (%)
2007 2008 2009 2007 2008 2009 2007 2008 2009
Atlanta, GA
Charlotte, NC
Chicago, IL
Denver, CO
Indianapolis, IN
Minneapolis, MN
New York, NY
Portland, OR
Sacramento, CA
Washington, DC
65.0 (3.3) 67.4** (2.7) 70.7 (3.8) 68.8 (2.4) 66.7 (2.4) 77.6 (2.2) 67.4 (2.6) 72.7 (2.3) 68.0 (2.6) 78.5 (4.4)
67.3 (3.5) 69.2 (2.7) 64.6 (3.5) 72.1 (2.3) 65.9 (2.4) 72.8 (2.4) 71.7 (2.5) 74.1 (2.2) 65.2 (2.5) 77.9 (6.5)
65.5 (3.2) 74.1 (2.7) 66.0 (4.6) 67.5 (2.5) 68.0 (2.4) 73.6 (2.4) 68.2 (2.2) 74.5 (2.4) 67.1 (2.8) 74.8 (6.6)
37.0** (3.3) 40.3*** (2.9) 26.8 (3.7) 33.7 (2.4) 31.0** (2.4) 50.3 (2.8) 53.6 (2.8) 29.7 (2.4) 31.9* (2.6) 62.6 (5.4)
29.8 (3.2) 32.8 (2.7) 23.7 (3.1) 32.5 (2.4) 36.3 (2.4) 51.6 (2.8) 57.7 (2.7) 32.1* (2.3) 35.8 (2.5) 63.3 (7.9)
29.4 (2.9) 29.3 (2.8) 25.4 (4.1) 30.2 (2.4) 37.6 (2.6) 49.3 (2.7) 52.1 (2.4) 26.5 (2.4) 37.7 (2.8) 74.8 (6.6)
79.8 (2.8) 85.9 (2.0) 89.5*** (2.5) 82.4 (1.9) 90.4 (1.5) 86.7 (1.8) 85.4* (1.9) 73.3 (2.4) 84.4* (2.0) 92.0 (2.4)
77.3 (3.1) 89.4 (1.7) 93.2** (1.8) 81.8 (1.9) 89.8 (1.6) 89.8* (1.6) 85.8 (1.8) 76.7* (2.1) 83.7** (1.9) 78.6* (7.9)
80.4 (2.5) 87.1 (2.2) 98.3 (1.2) 80.1 (2.0) 92.7 (1.4) 85.2 (1.9) 89.0 (1.3) 71.1 (2.6) 88.8 (1.7) 93.8 (3.0)
Notes:
Numbers shown in parentheses ( ) represent the standard error of the estimate presented.
Differences between each year and 2009 are reported as significant at the 0.10 level (*), 0.05 level (**), or 0.01 level (***).
50
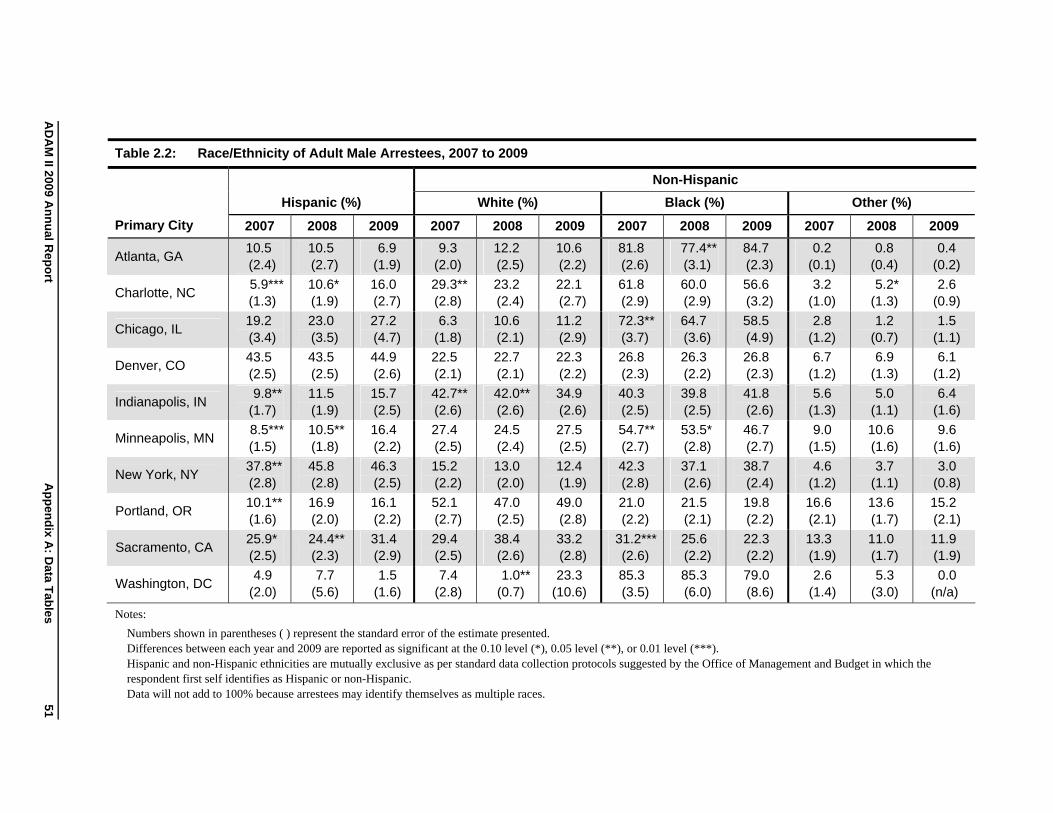
AD
AM
II 2009 An
nu
al Rep
ort
Ap
pen
dix A
: Data T
ables
Table 2.2: Race/Ethnicity of Adult Male Arrestees, 2007 to 2009
Primary City
Hispanic (%)
Non-Hispanic
White (%) Black (%) Other (%)
2007 2008 2009 2007 2008 2009 2007 2008 2009 2007 2008 2009
Atlanta, GA 10.5 (2.4)
10.5 (2.7)
6.9 (1.9)
9.3 (2.0)
12.2 (2.5)
10.6 (2.2)
81.8 (2.6)
77.4** (3.1)
84.7 (2.3)
0.2 (0.1)
0.8 (0.4)
0.4 (0.2)
Charlotte, NC
Chicago, IL
5.9*** (1.3)
19.2 (3.4)
10.6* (1.9)
23.0 (3.5)
16.0 (2.7)
27.2 (4.7)
29.3** (2.8)
6.3 (1.8)
23.2 (2.4)
10.6 (2.1)
22.1 (2.7)
11.2 (2.9)
61.8 (2.9)
72.3** (3.7)
60.0 (2.9)
64.7 (3.6)
56.6 (3.2)
58.5 (4.9)
3.2 (1.0)
2.8 (1.2)
5.2* (1.3)
1.2 (0.7)
2.6 (0.9)
1.5 (1.1)
Denver, CO
Indianapolis, IN
43.5 (2.5)
9.8** (1.7)
43.5 (2.5)
11.5 (1.9)
44.9 (2.6)
15.7 (2.5)
22.5 (2.1)
42.7** (2.6)
22.7 (2.1)
42.0** (2.6)
22.3 (2.2)
34.9 (2.6)
26.8 (2.3)
40.3 (2.5)
26.3 (2.2)
39.8 (2.5)
26.8 (2.3)
41.8 (2.6)
6.7 (1.2)
5.6 (1.3)
6.9 (1.3)
5.0 (1.1)
6.1 (1.2)
6.4 (1.6)
Minneapolis, MN
New York, NY
8.5*** (1.5)
37.8** (2.8)
10.5** (1.8)
45.8 (2.8)
16.4 (2.2)
46.3 (2.5)
27.4 (2.5)
15.2 (2.2)
24.5 (2.4)
13.0 (2.0)
27.5 (2.5)
12.4 (1.9)
54.7** (2.7)
42.3 (2.8)
53.5* (2.8)
37.1 (2.6)
46.7 (2.7)
38.7 (2.4)
9.0 (1.5)
4.6 (1.2)
10.6 (1.6)
3.7 (1.1)
9.6 (1.6)
3.0 (0.8)
Portland, OR 10.1** (1.6)
16.9 (2.0)
16.1 (2.2)
52.1 (2.7)
47.0 (2.5)
49.0 (2.8)
21.0 (2.2)
21.5 (2.1)
19.8 (2.2)
16.6 (2.1)
13.6 (1.7)
15.2 (2.1)
Sacramento, CA 25.9* (2.5)
24.4** (2.3)
31.4 (2.9)
29.4 (2.5)
38.4 (2.6)
33.2 (2.8)
31.2*** (2.6)
25.6 (2.2)
22.3 (2.2)
13.3 (1.9)
11.0 (1.7)
11.9 (1.9)
Washington, DC 4.9
(2.0) 7.7
(5.6) 1.5
(1.6) 7.4
(2.8) 1.0**
(0.7) 23.3
(10.6) 85.3 (3.5)
85.3 (6.0)
79.0 (8.6)
2.6 (1.4)
5.3 (3.0)
0.0 (n/a)
Notes:
Numbers shown in parentheses ( ) represent the standard error of the estimate presented.
Differences between each year and 2009 are reported as significant at the 0.10 level (*), 0.05 level (**), or 0.01 level (***).
Hispanic and non-Hispanic ethnicities are mutually exclusive as per standard data collection protocols suggested by the Office of Management and Budget in which the
respondent first self identifies as Hispanic or non-Hispanic.
Data will not add to 100% because arrestees may identify themselves as multiple races.
51
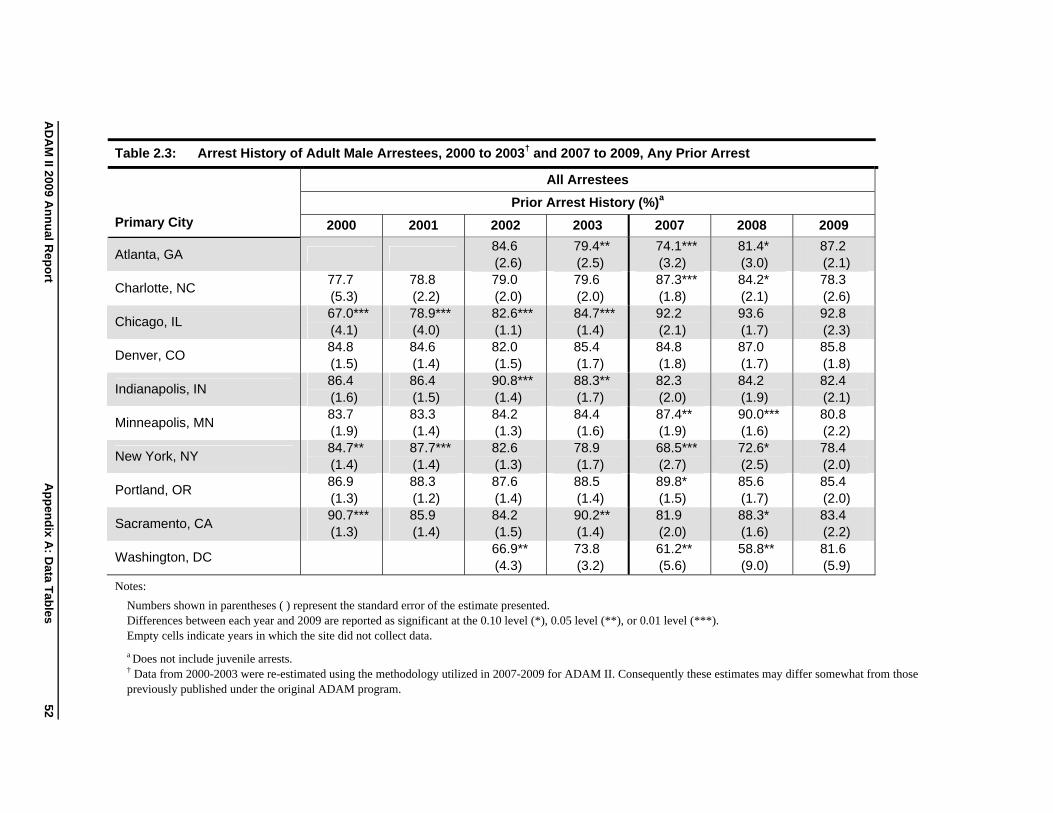
AD
AM
II 2009 An
nu
al Rep
ort
Ap
pen
dix A
: Data T
ables
Table 2.3: Arrest History of Adult Male Arrestees, 2000 to 2003† and 2007 to 2009, Any Prior Arrest
Primary City
All Arrestees
Prior Arrest History (%)a
2000 2001 2002 2003 2007 2008 2009
Atlanta, GA 84.6 (2.6)
79.4** (2.5)
74.1*** (3.2)
81.4* (3.0)
87.2 (2.1)
Charlotte, NC
Chicago, IL
Denver, CO
Indianapolis, IN
77.7 (5.3) 67.0*** (4.1) 84.8 (1.5) 86.4 (1.6)
78.8 (2.2) 78.9*** (4.0) 84.6 (1.4) 86.4 (1.5)
79.0 (2.0) 82.6*** (1.1) 82.0 (1.5) 90.8*** (1.4)
79.6 (2.0) 84.7*** (1.4) 85.4 (1.7) 88.3** (1.7)
87.3*** (1.8) 92.2 (2.1) 84.8 (1.8) 82.3 (2.0)
84.2* (2.1) 93.6 (1.7) 87.0 (1.7) 84.2 (1.9)
78.3 (2.6) 92.8 (2.3) 85.8 (1.8) 82.4 (2.1)
Minneapolis, MN
New York, NY
83.7 (1.9) 84.7** (1.4)
83.3 (1.4) 87.7*** (1.4)
84.2 (1.3) 82.6 (1.3)
84.4 (1.6) 78.9 (1.7)
87.4** (1.9) 68.5*** (2.7)
90.0*** (1.6) 72.6* (2.5)
80.8 (2.2) 78.4 (2.0)
Portland, OR
Sacramento, CA
86.9 (1.3) 90.7*** (1.3)
88.3 (1.2) 85.9 (1.4)
87.6 (1.4) 84.2 (1.5)
88.5 (1.4) 90.2** (1.4)
89.8* (1.5) 81.9 (2.0)
85.6 (1.7) 88.3* (1.6)
85.4 (2.0) 83.4 (2.2)
Washington, DC 66.9** (4.3)
73.8 (3.2)
61.2** (5.6)
58.8** (9.0)
81.6 (5.9)
Notes:
Numbers shown in parentheses ( ) represent the standard error of the estimate presented. Differences between each year and 2009 are reported as significant at the 0.10 level (*), 0.05 level (**), or 0.01 level (***). Empty cells indicate years in which the site did not collect data.
a Does not include juvenile arrests. † Data from 2000-2003 were re-estimated using the methodology utilized in 2007-2009 for ADAM II. Consequently these estimates may differ somewhat from those previously published under the original ADAM program.
52
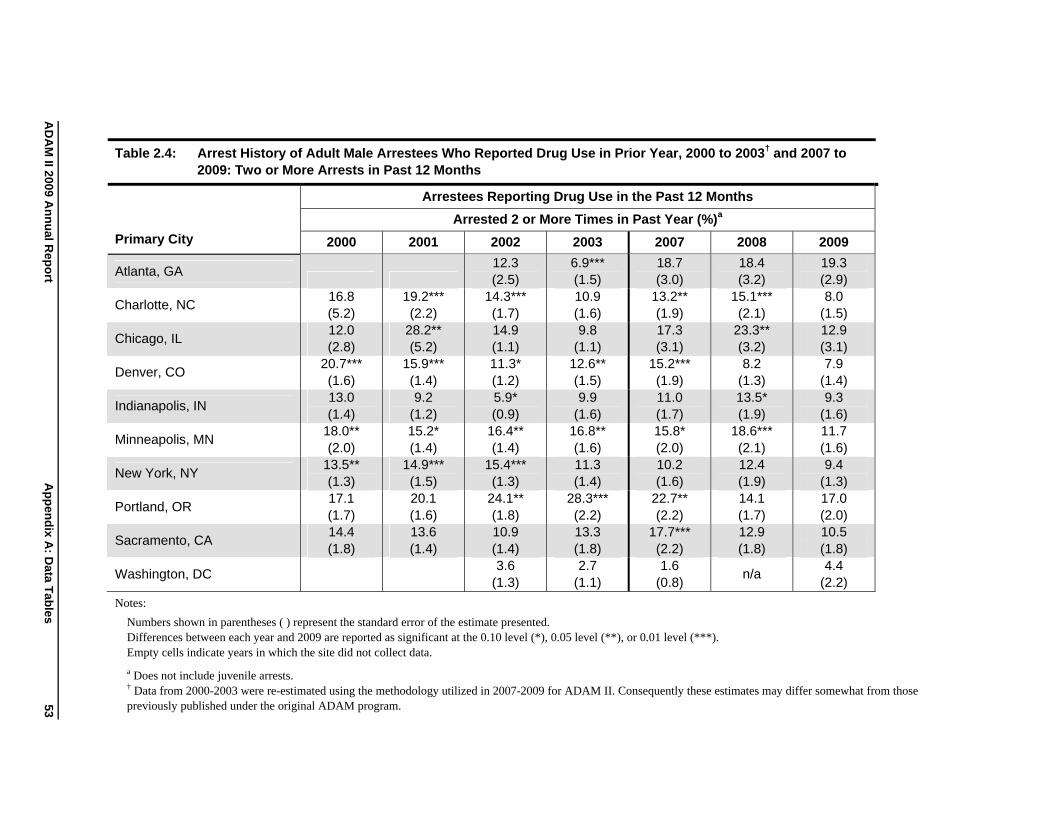
AD
AM
II 2009 An
nu
al Rep
ort
Ap
pen
dix A
: Data T
ables
Table 2.4: Arrest History of Adult Male Arrestees Who Reported Drug Use in Prior Year, 2000 to 2003† and 2007 to 2009: Two or More Arrests in Past 12 Months
Primary City
Arrestees Reporting Drug Use in the Past 12 Months
Arrested 2 or More Times in Past Year (%)a
2000 2001 2002 2003 2007 2008 2009
Atlanta, GA
Charlotte, NC
Chicago, IL
Denver, CO
Indianapolis, IN
Minneapolis, MN
New York, NY
Portland, OR
Sacramento, CA
Washington, DC
16.8 (5.2) 12.0 (2.8)
20.7*** (1.6) 13.0 (1.4)
18.0** (2.0)
13.5** (1.3) 17.1 (1.7) 14.4 (1.8)
19.2*** (2.2)
28.2** (5.2)
15.9*** (1.4) 9.2
(1.2) 15.2* (1.4)
14.9*** (1.5) 20.1 (1.6) 13.6 (1.4)
12.3 (2.5)
14.3*** (1.7) 14.9 (1.1) 11.3* (1.2) 5.9* (0.9)
16.4** (1.4)
15.4*** (1.3)
24.1** (1.8) 10.9 (1.4) 3.6
(1.3)
6.9*** (1.5) 10.9 (1.6) 9.8
(1.1) 12.6** (1.5) 9.9
(1.6) 16.8** (1.6) 11.3 (1.4)
28.3*** (2.2) 13.3 (1.8) 2.7
(1.1)
18.7 (3.0)
13.2** (1.9) 17.3 (3.1)
15.2*** (1.9) 11.0 (1.7) 15.8* (2.0) 10.2 (1.6)
22.7** (2.2)
17.7*** (2.2) 1.6
(0.8)
18.4 (3.2)
15.1*** (2.1)
23.3** (3.2) 8.2
(1.3) 13.5* (1.9)
18.6*** (2.1) 12.4 (1.9) 14.1 (1.7) 12.9 (1.8)
n/a
19.3 (2.9) 8.0
(1.5) 12.9 (3.1) 7.9
(1.4) 9.3
(1.6) 11.7 (1.6) 9.4
(1.3) 17.0 (2.0) 10.5 (1.8) 4.4
(2.2)
Notes:
Numbers shown in parentheses ( ) represent the standard error of the estimate presented. Differences between each year and 2009 are reported as significant at the 0.10 level (*), 0.05 level (**), or 0.01 level (***). Empty cells indicate years in which the site did not collect data.
a Does not include juvenile arrests. † Data from 2000-2003 were re-estimated using the methodology utilized in 2007-2009 for ADAM II. Consequently these estimates may differ somewhat from those previously published under the original ADAM program. 53
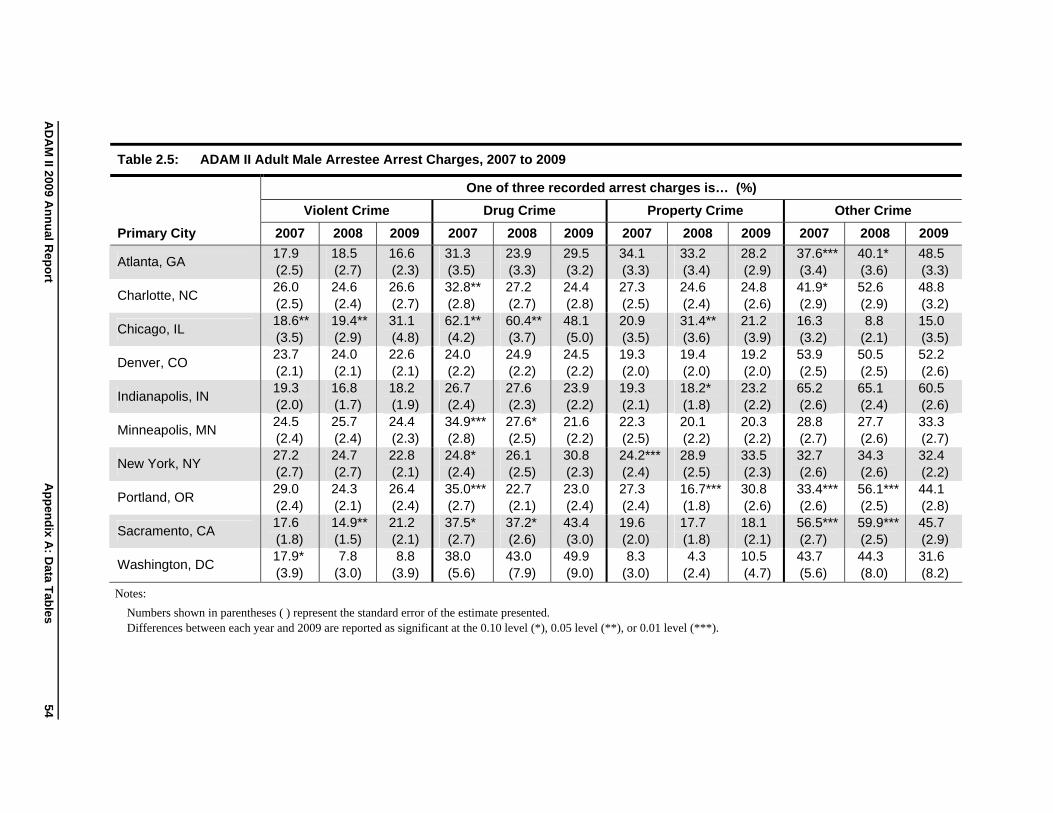
AD
AM
II 2009 An
nu
al Rep
ort
Ap
pen
dix A
: Data T
ables
Table 2.5: ADAM II Adult Male Arrestee Arrest Charges, 2007 to 2009
Primary City
One of three recorded arrest charges is… (%)
Violent Crime Drug Crime Property Crime Other Crime
2007 2008 2009 2007 2008 2009 2007 2008 2009 2007 2008 2009
Atlanta, GA
Charlotte, NC
Chicago, IL
Denver, CO
Indianapolis, IN
Minneapolis, MN
New York, NY
Portland, OR
Sacramento, CA
Washington, DC
17.9 (2.5) 26.0 (2.5) 18.6** (3.5) 23.7 (2.1) 19.3 (2.0) 24.5 (2.4) 27.2 (2.7) 29.0 (2.4) 17.6 (1.8) 17.9* (3.9)
18.5 (2.7) 24.6 (2.4) 19.4** (2.9) 24.0 (2.1) 16.8 (1.7) 25.7 (2.4) 24.7 (2.7) 24.3 (2.1) 14.9** (1.5) 7.8
(3.0)
16.6 (2.3) 26.6 (2.7) 31.1 (4.8) 22.6 (2.1) 18.2 (1.9) 24.4 (2.3) 22.8 (2.1) 26.4 (2.4) 21.2 (2.1) 8.8
(3.9)
31.3 (3.5) 32.8** (2.8) 62.1** (4.2) 24.0 (2.2) 26.7 (2.4) 34.9*** (2.8) 24.8* (2.4) 35.0*** (2.7) 37.5* (2.7) 38.0 (5.6)
23.9 (3.3) 27.2 (2.7) 60.4** (3.7) 24.9 (2.2) 27.6 (2.3) 27.6* (2.5) 26.1 (2.5) 22.7 (2.1) 37.2* (2.6) 43.0 (7.9)
29.5 (3.2) 24.4 (2.8) 48.1 (5.0) 24.5 (2.2) 23.9 (2.2) 21.6 (2.2) 30.8 (2.3) 23.0 (2.4) 43.4 (3.0) 49.9 (9.0)
34.1 (3.3) 27.3 (2.5) 20.9 (3.5) 19.3 (2.0) 19.3 (2.1) 22.3 (2.5) 24.2*** (2.4) 27.3 (2.4) 19.6 (2.0) 8.3
(3.0)
33.2 (3.4) 24.6 (2.4) 31.4** (3.6) 19.4 (2.0) 18.2* (1.8) 20.1 (2.2) 28.9 (2.5) 16.7*** (1.8) 17.7 (1.8) 4.3
(2.4)
28.2 (2.9) 24.8 (2.6) 21.2 (3.9) 19.2 (2.0) 23.2 (2.2) 20.3 (2.2) 33.5 (2.3) 30.8 (2.6) 18.1 (2.1) 10.5 (4.7)
37.6*** (3.4) 41.9* (2.9) 16.3 (3.2) 53.9 (2.5) 65.2 (2.6) 28.8 (2.7) 32.7 (2.6) 33.4*** (2.6) 56.5*** (2.7) 43.7 (5.6)
40.1* (3.6) 52.6 (2.9) 8.8
(2.1) 50.5 (2.5) 65.1 (2.4) 27.7 (2.6) 34.3 (2.6) 56.1*** (2.5) 59.9*** (2.5) 44.3 (8.0)
48.5 (3.3) 48.8 (3.2) 15.0 (3.5) 52.2 (2.6) 60.5 (2.6) 33.3 (2.7) 32.4 (2.2) 44.1 (2.8) 45.7 (2.9) 31.6 (8.2)
Notes:
Numbers shown in parentheses ( ) represent the standard error of the estimate presented.
Differences between each year and 2009 are reported as significant at the 0.10 level (*), 0.05 level (**), or 0.01 level (***).
54
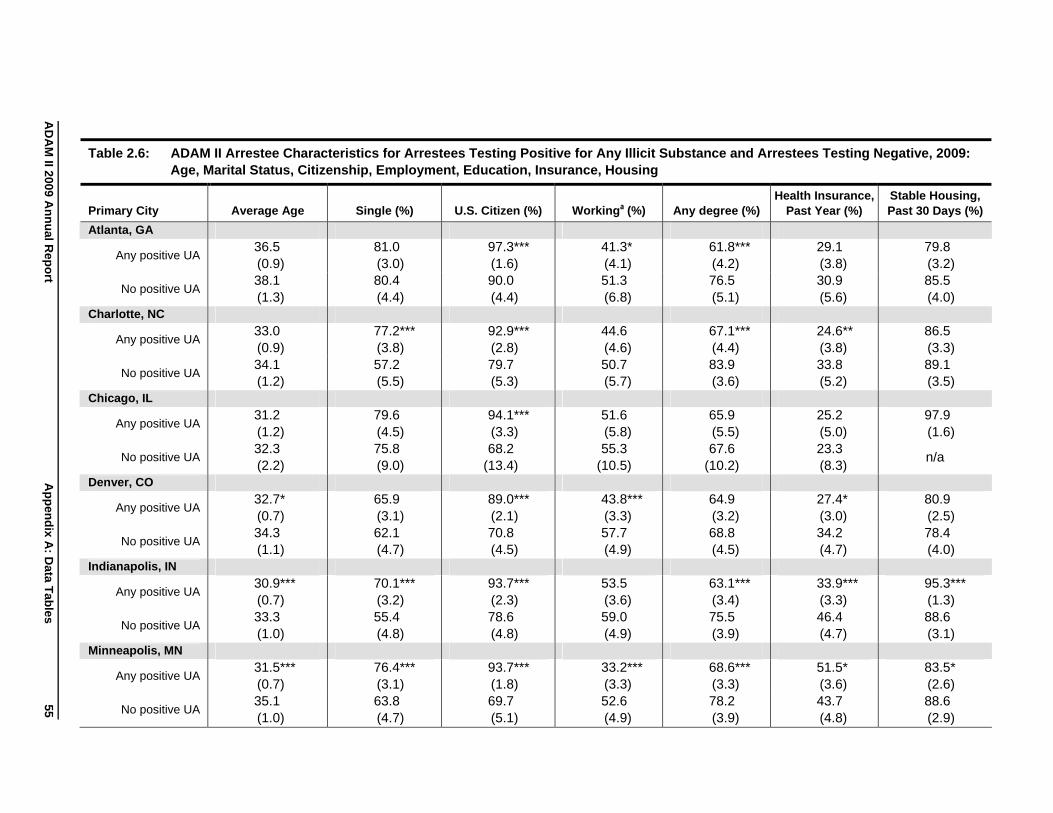
AD
AM
II 2009 An
nu
al Rep
ort
Ap
pen
dix A
: Data T
ables
Table 2.6: ADAM II Arrestee Characteristics for Arrestees Testing Positive for Any Illicit Substance and Arrestees Testing Negative, 2009: Age, Marital Status, Citizenship, Employment, Education, Insurance, Housing
Primary City Average Age Single (%) U.S. Citizen (%) Workinga (%) Any degree (%) Health Insurance,
Past Year (%) Stable Housing, Past 30 Days (%)
Atlanta, GA
Any positive UA 36.5 (0.9)
81.0 (3.0)
97.3*** (1.6)
41.3* (4.1)
61.8*** (4.2)
29.1 (3.8)
79.8 (3.2)
No positive UA 38.1 (1.3)
80.4 (4.4)
90.0 (4.4)
51.3 (6.8)
76.5 (5.1)
30.9 (5.6)
85.5 (4.0)
Charlotte, NC
Any positive UA 33.0 (0.9)
77.2*** (3.8)
92.9*** (2.8)
44.6 (4.6)
67.1*** (4.4)
24.6** (3.8)
86.5 (3.3)
No positive UA 34.1 (1.2)
57.2 (5.5)
79.7 (5.3)
50.7 (5.7)
83.9 (3.6)
33.8 (5.2)
89.1 (3.5)
Chicago, IL
Any positive UA 31.2 (1.2)
79.6 (4.5)
94.1*** (3.3)
51.6 (5.8)
65.9 (5.5)
25.2 (5.0)
97.9 (1.6)
No positive UA 32.3 (2.2)
75.8 (9.0)
68.2 (13.4)
55.3 (10.5)
67.6 (10.2)
23.3 (8.3)
n/a
Denver, CO
Any positive UA 32.7* (0.7)
65.9 (3.1)
89.0*** (2.1)
43.8*** (3.3)
64.9 (3.2)
27.4* (3.0)
80.9 (2.5)
No positive UA 34.3 (1.1)
62.1 (4.7)
70.8 (4.5)
57.7 (4.9)
68.8 (4.5)
34.2 (4.7)
78.4 (4.0)
Indianapolis, IN
Any positive UA 30.9*** (0.7)
70.1*** (3.2)
93.7*** (2.3)
53.5 (3.6)
63.1*** (3.4)
33.9*** (3.3)
95.3*** (1.3)
No positive UA 33.3 (1.0)
55.4 (4.8)
78.6 (4.8)
59.0 (4.9)
75.5 (3.9)
46.4 (4.7)
88.6 (3.1)
Minneapolis, MN
Any positive UA 31.5*** (0.7)
76.4*** (3.1)
93.7*** (1.8)
33.2*** (3.3)
68.6*** (3.3)
51.5* (3.6)
83.5* (2.6)
No positive UA 35.1 (1.0)
63.8 (4.7)
69.7 (5.1)
52.6 (4.9)
78.2 (3.9)
43.7 (4.8)
88.6 (2.9)
55
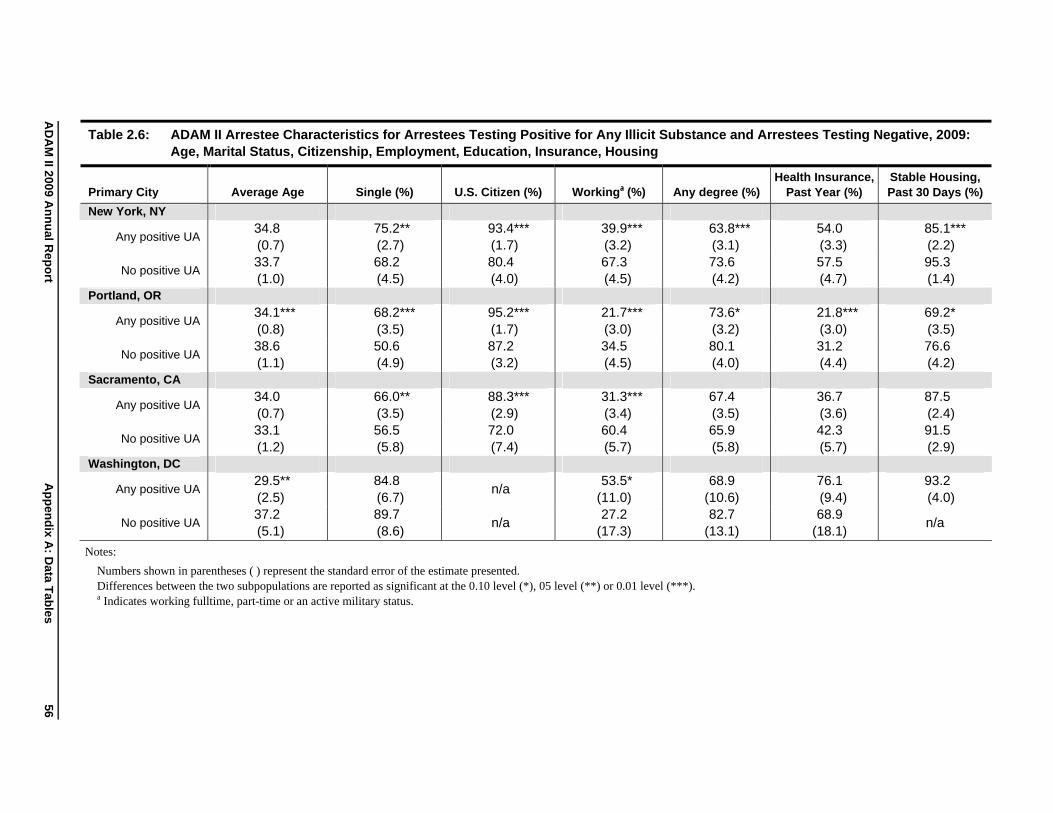
AD
AM
II 2009 An
nu
al Rep
ort
Ap
pen
dix A
: Data T
ables
Table 2.6: ADAM II Arrestee Characteristics for Arrestees Testing Positive for Any Illicit Substance and Arrestees Testing Negative, 2009: Age, Marital Status, Citizenship, Employment, Education, Insurance, Housing
Primary City Average Age Single (%) U.S. Citizen (%) Workinga (%) Any degree (%) Health Insurance,
Past Year (%) Stable Housing, Past 30 Days (%)
New York, NY
Any positive UA 34.8 (0.7)
75.2** (2.7)
93.4*** (1.7)
39.9*** (3.2)
63.8*** (3.1)
54.0 (3.3)
85.1*** (2.2)
No positive UA 33.7 (1.0)
68.2 (4.5)
80.4 (4.0)
67.3 (4.5)
73.6 (4.2)
57.5 (4.7)
95.3 (1.4)
Portland, OR
Any positive UA 34.1*** (0.8)
68.2*** (3.5)
95.2*** (1.7)
21.7*** (3.0)
73.6* (3.2)
21.8*** (3.0)
69.2* (3.5)
No positive UA 38.6 (1.1)
50.6 (4.9)
87.2 (3.2)
34.5 (4.5)
80.1 (4.0)
31.2 (4.4)
76.6 (4.2)
Sacramento, CA
Any positive UA 34.0 (0.7)
66.0** (3.5)
88.3*** (2.9)
31.3*** (3.4)
67.4 (3.5)
36.7 (3.6)
87.5 (2.4)
No positive UA 33.1 (1.2)
56.5 (5.8)
72.0 (7.4)
60.4 (5.7)
65.9 (5.8)
42.3 (5.7)
91.5 (2.9)
Washington, DC
Any positive UA 29.5** (2.5)
84.8 (6.7)
n/a 53.5*
(11.0) 68.9
(10.6) 76.1 (9.4)
93.2 (4.0)
No positive UA 37.2 (5.1)
89.7 (8.6)
n/a 27.2
(17.3) 82.7
(13.1) 68.9
(18.1) n/a
Notes:
Numbers shown in parentheses ( ) represent the standard error of the estimate presented.
Differences between the two subpopulations are reported as significant at the 0.10 level (*), 05 level (**) or 0.01 level (***).
a Indicates working fulltime, part-time or an active military status.
56
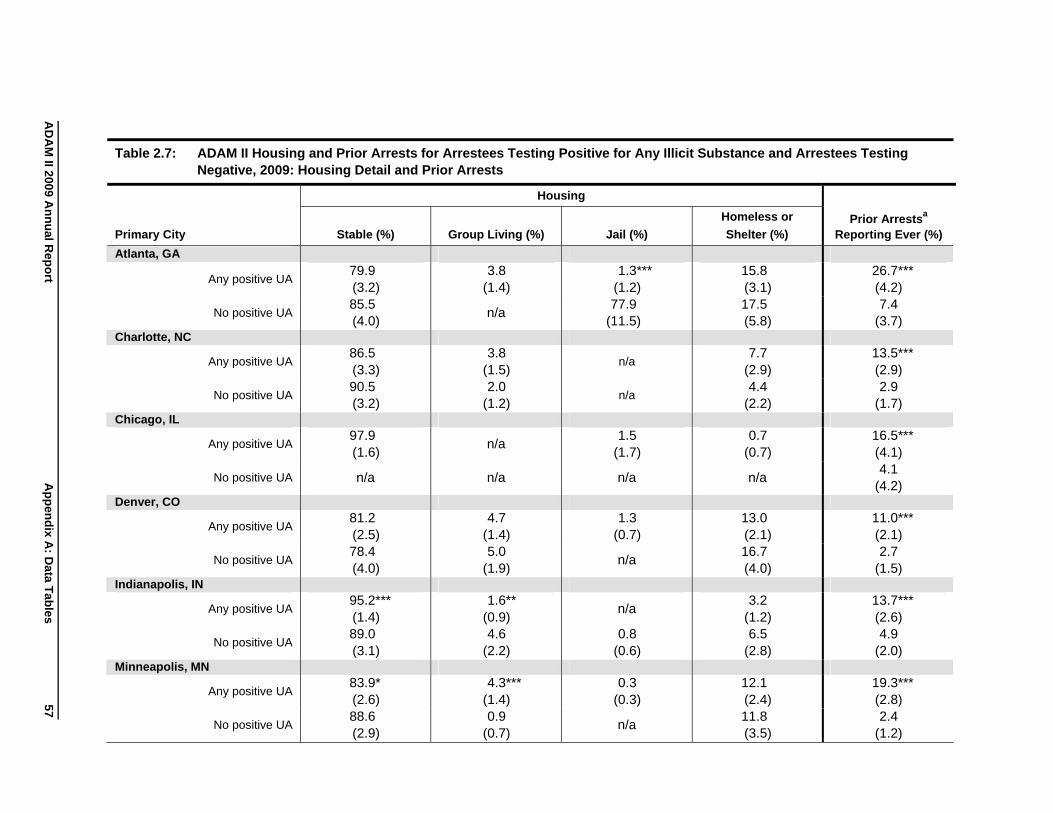
AD
AM
II 2009 An
nu
al Rep
ort
Ap
pen
dix A
: Data T
ables
Table 2.7: ADAM II Housing and Prior Arrests for Arrestees Testing Positive for Any Illicit Substance and Arrestees Testing Negative, 2009: Housing Detail and Prior Arrests
Primary City
Housing
Prior Arrestsa
Reporting Ever (%) Stable (%) Group Living (%) Jail (%)
Homeless or
Shelter (%)
Atlanta, GA
Any positive UA 79.9 (3.2)
3.8 (1.4)
1.3*** (1.2)
15.8 (3.1)
26.7*** (4.2)
No positive UA 85.5 (4.0)
n/a 77.9
(11.5) 17.5 (5.8)
7.4 (3.7)
Charlotte, NC
Any positive UA 86.5 (3.3)
3.8 (1.5)
n/a 7.7
(2.9) 13.5*** (2.9)
No positive UA 90.5 (3.2)
2.0 (1.2)
n/a 4.4
(2.2) 2.9
(1.7) Chicago, IL
Any positive UA 97.9 (1.6)
n/a 1.5
(1.7) 0.7
(0.7) 16.5*** (4.1)
No positive UA n/a n/a n/a n/a 4.1
(4.2) Denver, CO
Any positive UA 81.2 (2.5)
4.7 (1.4)
1.3 (0.7)
13.0 (2.1)
11.0*** (2.1)
No positive UA 78.4 (4.0)
5.0 (1.9)
n/a 16.7 (4.0)
2.7 (1.5)
Indianapolis, IN
Any positive UA 95.2*** (1.4)
1.6** (0.9)
n/a 3.2
(1.2) 13.7*** (2.6)
No positive UA 89.0 (3.1)
4.6 (2.2)
0.8 (0.6)
6.5 (2.8)
4.9 (2.0)
Minneapolis, MN
Any positive UA 83.9* (2.6)
4.3*** (1.4)
0.3 (0.3)
12.1 (2.4)
19.3*** (2.8)
No positive UA 88.6 (2.9)
0.9 (0.7)
n/a 11.8 (3.5)
2.4 (1.2)
57
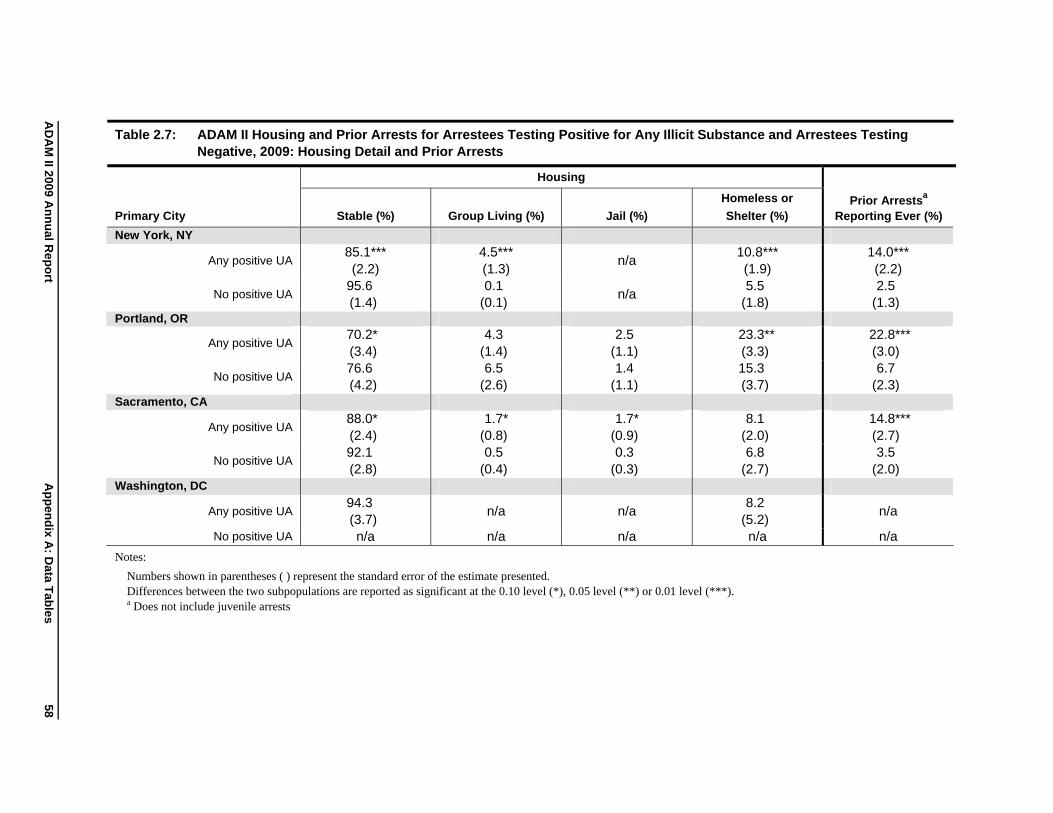
AD
AM
II 2009 An
nu
al Rep
ort
Ap
pen
dix A
: Data T
ables
Table 2.7: ADAM II Housing and Prior Arrests for Arrestees Testing Positive for Any Illicit Substance and Arrestees Testing Negative, 2009: Housing Detail and Prior Arrests
Primary City
Housing
Prior Arrestsa
Reporting Ever (%) Stable (%) Group Living (%) Jail (%)
Homeless or
Shelter (%)
New York, NY
Any positive UA 85.1*** (2.2)
4.5*** (1.3)
n/a 10.8*** (1.9)
14.0*** (2.2)
No positive UA 95.6 (1.4)
0.1 (0.1)
n/a 5.5
(1.8) 2.5
(1.3) Portland, OR
Any positive UA 70.2* (3.4)
4.3 (1.4)
2.5 (1.1)
23.3** (3.3)
22.8*** (3.0)
No positive UA 76.6 (4.2)
6.5 (2.6)
1.4 (1.1)
15.3 (3.7)
6.7 (2.3)
Sacramento, CA
Any positive UA 88.0* (2.4)
1.7* (0.8)
1.7* (0.9)
8.1 (2.0)
14.8*** (2.7)
No positive UA 92.1 (2.8)
0.5 (0.4)
0.3 (0.3)
6.8 (2.7)
3.5 (2.0)
Washington, DC
Any positive UA 94.3 (3.7)
n/a n/a 8.2
(5.2) n/a
No positive UA n/a n/a n/a n/a n/a
Notes:
Numbers shown in parentheses ( ) represent the standard error of the estimate presented.
Differences between the two subpopulations are reported as significant at the 0.10 level (*), 0.05 level (**) or 0.01 level (***).
a Does not include juvenile arrests
58
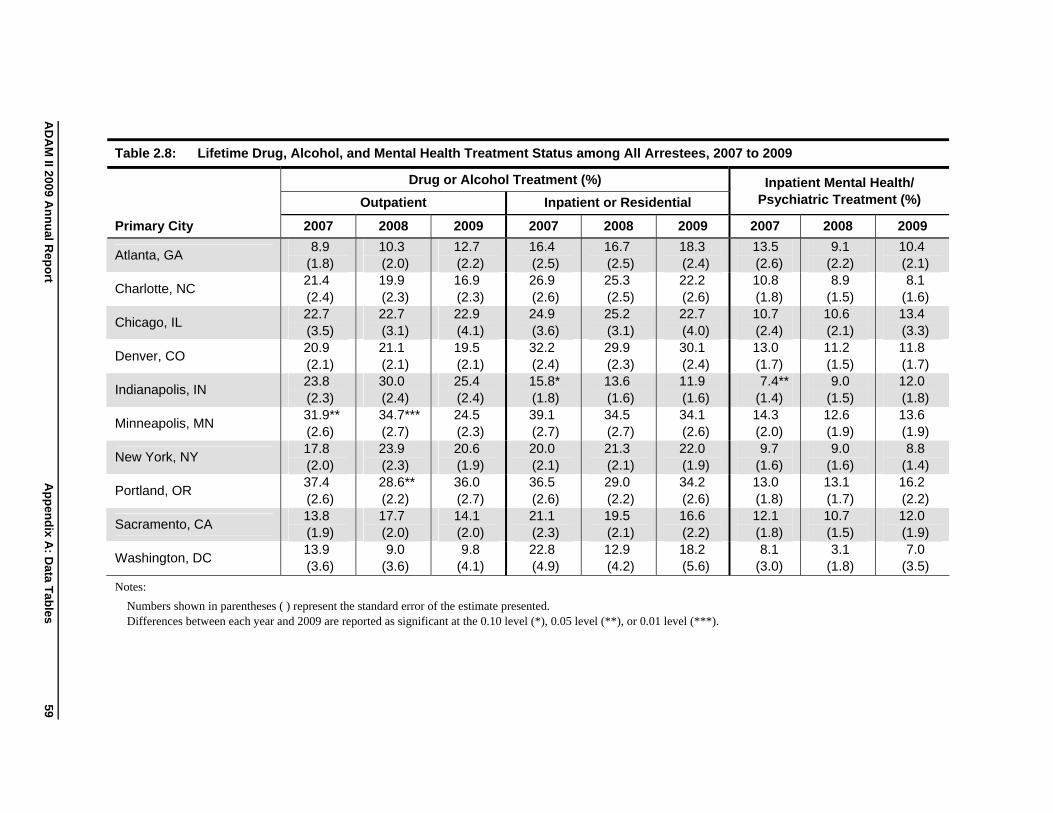
AD
AM
II 2009 An
nu
al Rep
ort
Ap
pen
dix A
: Data T
ables
Table 2.8: Lifetime Drug, Alcohol, and Mental Health Treatment Status among All Arrestees, 2007 to 2009
Primary City
Drug or Alcohol Treatment (%) Inpatient Mental Health/ Psychiatric Treatment (%) Outpatient Inpatient or Residential
2007 2008 2009 2007 2008 2009 2007 2008 2009
Atlanta, GA
Charlotte, NC
Chicago, IL
Denver, CO
Indianapolis, IN
Minneapolis, MN
New York, NY
Portland, OR
Sacramento, CA
Washington, DC
8.9 (1.8) 21.4 (2.4) 22.7 (3.5) 20.9 (2.1) 23.8 (2.3) 31.9** (2.6) 17.8 (2.0) 37.4 (2.6) 13.8 (1.9) 13.9 (3.6)
10.3 (2.0) 19.9 (2.3) 22.7 (3.1) 21.1 (2.1) 30.0 (2.4) 34.7*** (2.7) 23.9 (2.3) 28.6** (2.2) 17.7 (2.0) 9.0
(3.6)
12.7 (2.2) 16.9 (2.3) 22.9 (4.1) 19.5 (2.1) 25.4 (2.4) 24.5 (2.3) 20.6 (1.9) 36.0 (2.7) 14.1 (2.0) 9.8
(4.1)
16.4 (2.5) 26.9 (2.6) 24.9 (3.6) 32.2 (2.4) 15.8* (1.8) 39.1 (2.7) 20.0 (2.1) 36.5 (2.6) 21.1 (2.3) 22.8 (4.9)
16.7 (2.5) 25.3 (2.5) 25.2 (3.1) 29.9 (2.3) 13.6 (1.6) 34.5 (2.7) 21.3 (2.1) 29.0 (2.2) 19.5 (2.1) 12.9 (4.2)
18.3 (2.4) 22.2 (2.6) 22.7 (4.0) 30.1 (2.4) 11.9 (1.6) 34.1 (2.6) 22.0 (1.9) 34.2 (2.6) 16.6 (2.2) 18.2 (5.6)
13.5 (2.6) 10.8 (1.8) 10.7 (2.4) 13.0 (1.7) 7.4**
(1.4) 14.3 (2.0) 9.7
(1.6) 13.0 (1.8) 12.1 (1.8) 8.1
(3.0)
9.1 (2.2) 8.9
(1.5) 10.6 (2.1) 11.2 (1.5) 9.0
(1.5) 12.6 (1.9) 9.0
(1.6) 13.1 (1.7) 10.7 (1.5) 3.1
(1.8)
10.4 (2.1) 8.1
(1.6) 13.4 (3.3) 11.8 (1.7) 12.0 (1.8) 13.6 (1.9) 8.8
(1.4) 16.2 (2.2) 12.0 (1.9) 7.0
(3.5)
Notes:
Numbers shown in parentheses ( ) represent the standard error of the estimate presented.
Differences between each year and 2009 are reported as significant at the 0.10 level (*), 0.05 level (**), or 0.01 level (***).
59
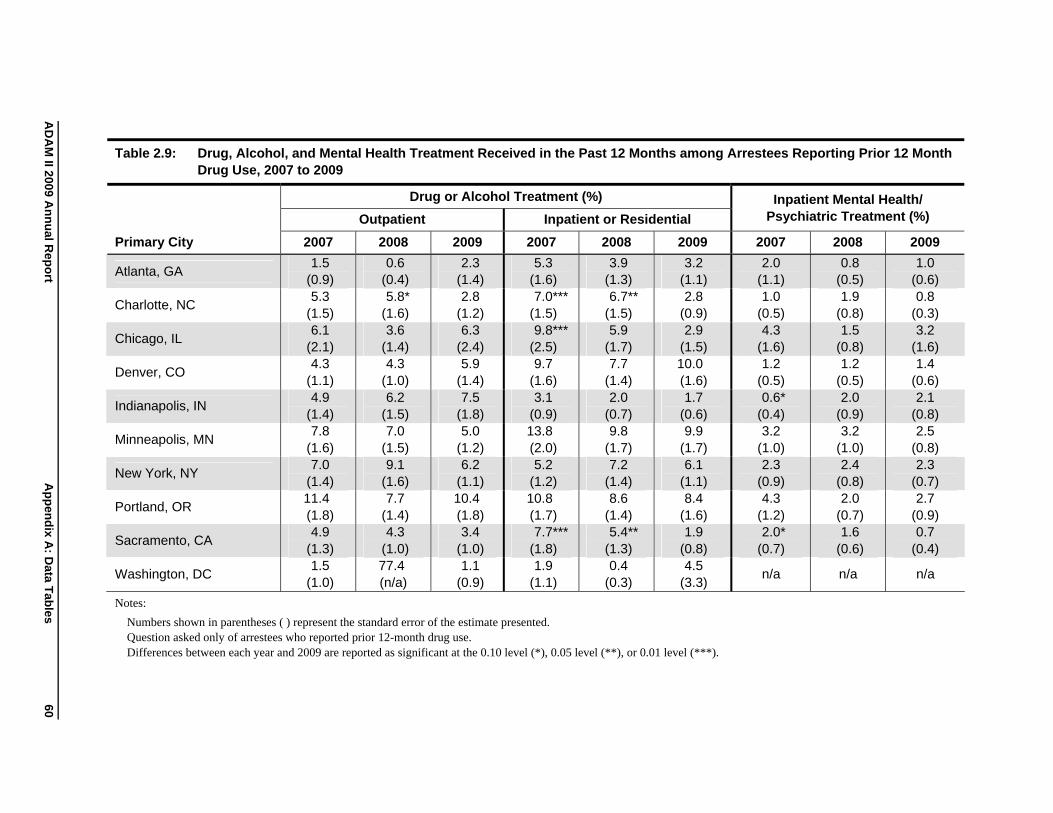
AD
AM
II 2009 An
nu
al Rep
ort
Ap
pen
dix A
: Data T
ables
Table 2.9: Drug, Alcohol, and Mental Health Treatment Received in the Past 12 Months among Arrestees Reporting Prior 12 Month Drug Use, 2007 to 2009
Primary City
Drug or Alcohol Treatment (%) Inpatient Mental Health/ Psychiatric Treatment (%) Outpatient Inpatient or Residential
2007 2008 2009 2007 2008 2009 2007 2008 2009
Atlanta, GA
Charlotte, NC
Chicago, IL
Denver, CO
Indianapolis, IN
Minneapolis, MN
New York, NY
Portland, OR
Sacramento, CA
Washington, DC
1.5 (0.9) 5.3
(1.5) 6.1
(2.1) 4.3
(1.1) 4.9
(1.4) 7.8
(1.6) 7.0
(1.4) 11.4 (1.8) 4.9
(1.3) 1.5
(1.0)
0.6 (0.4) 5.8*
(1.6) 3.6
(1.4) 4.3
(1.0) 6.2
(1.5) 7.0
(1.5) 9.1
(1.6) 7.7
(1.4) 4.3
(1.0) 77.4 (n/a)
2.3 (1.4) 2.8
(1.2) 6.3
(2.4) 5.9
(1.4) 7.5
(1.8) 5.0
(1.2) 6.2
(1.1) 10.4 (1.8) 3.4
(1.0) 1.1
(0.9)
5.3 (1.6) 7.0***
(1.5) 9.8***
(2.5) 9.7
(1.6) 3.1
(0.9) 13.8 (2.0) 5.2
(1.2) 10.8 (1.7) 7.7***
(1.8) 1.9
(1.1)
3.9 (1.3) 6.7**
(1.5) 5.9
(1.7) 7.7
(1.4) 2.0
(0.7) 9.8
(1.7) 7.2
(1.4) 8.6
(1.4) 5.4**
(1.3) 0.4
(0.3)
3.2 (1.1) 2.8
(0.9) 2.9
(1.5) 10.0 (1.6) 1.7
(0.6) 9.9
(1.7) 6.1
(1.1) 8.4
(1.6) 1.9
(0.8) 4.5
(3.3)
2.0 (1.1) 1.0
(0.5) 4.3
(1.6) 1.2
(0.5) 0.6*
(0.4) 3.2
(1.0) 2.3
(0.9) 4.3
(1.2) 2.0*
(0.7)
n/a
0.8 (0.5) 1.9
(0.8) 1.5
(0.8) 1.2
(0.5) 2.0
(0.9) 3.2
(1.0) 2.4
(0.8) 2.0
(0.7) 1.6
(0.6)
n/a
1.0 (0.6) 0.8
(0.3) 3.2
(1.6) 1.4
(0.6) 2.1
(0.8) 2.5
(0.8) 2.3
(0.7) 2.7
(0.9) 0.7
(0.4)
n/a
Notes:
Numbers shown in parentheses ( ) represent the standard error of the estimate presented.
Question asked only of arrestees who reported prior 12-month drug use.
Differences between each year and 2009 are reported as significant at the 0.10 level (*), 0.05 level (**), or 0.01 level (***).
60
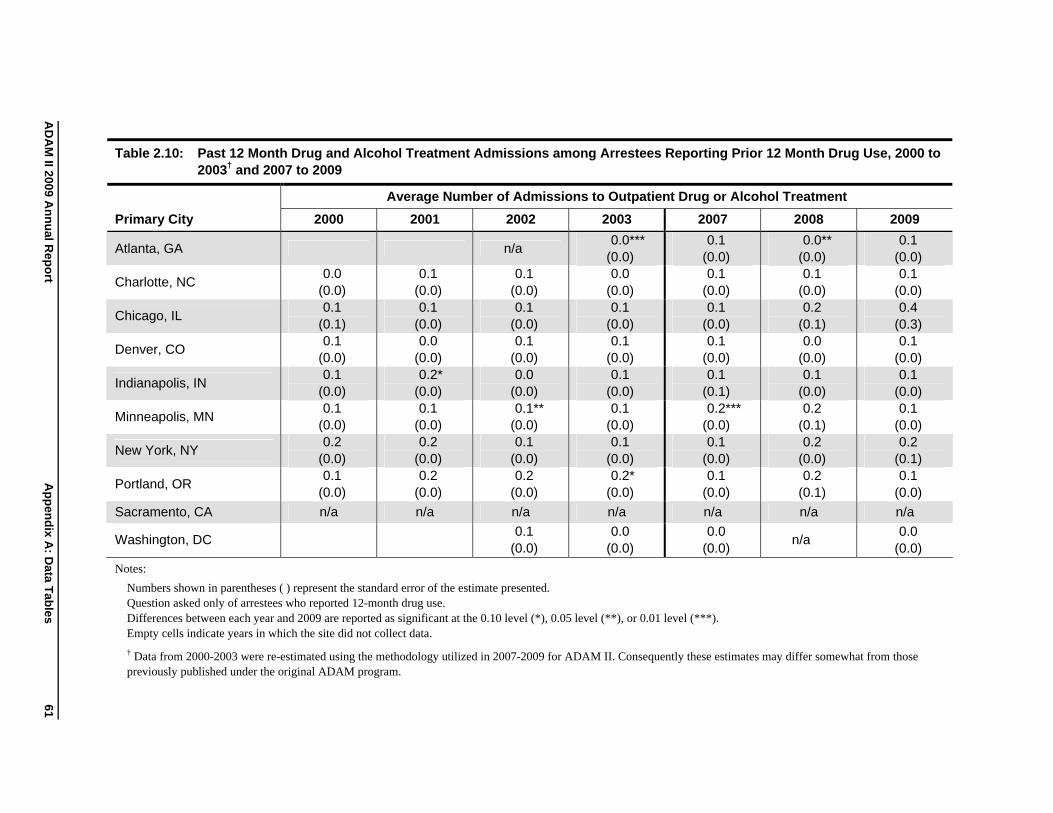
AD
AM
II 2009 An
nu
al Rep
ort
Ap
pen
dix A
: Data T
ables
Table 2.10: Past 12 Month Drug and Alcohol Treatment Admissions among Arrestees Reporting Prior 12 Month Drug Use, 2000 to 2003† and 2007 to 2009
Primary City
Average Number of Admissions to Outpatient Drug or Alcohol Treatment
2000 2001 2002 2003 2007 2008 2009
Atlanta, GA
Charlotte, NC
Chicago, IL
Denver, CO
Indianapolis, IN
Minneapolis, MN
New York, NY
Portland, OR
Sacramento, CA
Washington, DC
0.0 (0.0) 0.1
(0.1) 0.1
(0.0) 0.1
(0.0) 0.1
(0.0) 0.2
(0.0) 0.1
(0.0)
n/a
0.1 (0.0) 0.1
(0.0) 0.0
(0.0) 0.2*
(0.0) 0.1
(0.0) 0.2
(0.0) 0.2
(0.0)
n/a
n/a
0.1 (0.0) 0.1
(0.0) 0.1
(0.0) 0.0
(0.0) 0.1**
(0.0) 0.1
(0.0) 0.2
(0.0)
n/a
0.1 (0.0)
0.0*** (0.0) 0.0
(0.0) 0.1
(0.0) 0.1
(0.0) 0.1
(0.0) 0.1
(0.0) 0.1
(0.0) 0.2*
(0.0)
n/a
0.0 (0.0)
0.1 (0.0) 0.1
(0.0) 0.1
(0.0) 0.1
(0.0) 0.1
(0.1) 0.2***
(0.0) 0.1
(0.0) 0.1
(0.0)
n/a
0.0 (0.0)
0.0** (0.0) 0.1
(0.0) 0.2
(0.1) 0.0
(0.0) 0.1
(0.0) 0.2
(0.1) 0.2
(0.0) 0.2
(0.1)
n/a
n/a
0.1 (0.0) 0.1
(0.0) 0.4
(0.3) 0.1
(0.0) 0.1
(0.0) 0.1
(0.0) 0.2
(0.1) 0.1
(0.0)
n/a
0.0 (0.0)
Notes:
Numbers shown in parentheses ( ) represent the standard error of the estimate presented. Question asked only of arrestees who reported 12-month drug use. Differences between each year and 2009 are reported as significant at the 0.10 level (*), 0.05 level (**), or 0.01 level (***). Empty cells indicate years in which the site did not collect data.
† Data from 2000-2003 were re-estimated using the methodology utilized in 2007-2009 for ADAM II. Consequently these estimates may differ somewhat from those previously published under the original ADAM program.
61
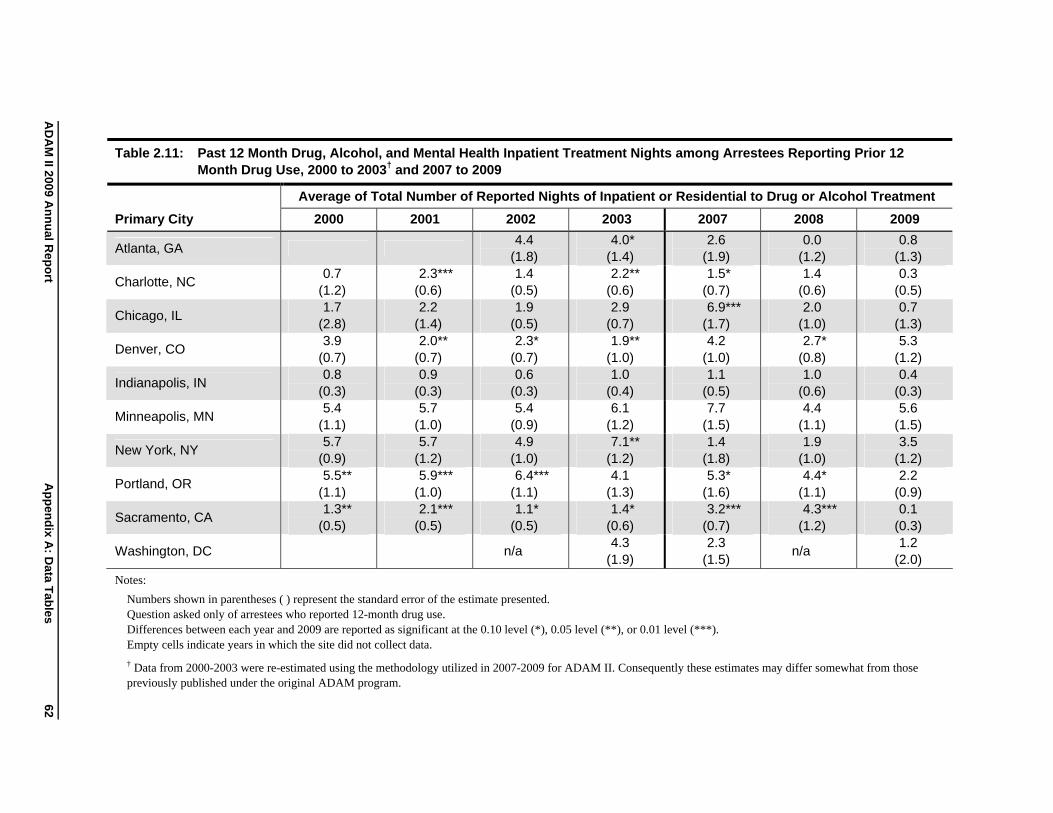
AD
AM
II 2009 An
nu
al Rep
ort
Ap
pen
dix A
: Data T
ables
Table 2.11: Past 12 Month Drug, Alcohol, and Mental Health Inpatient Treatment Nights among Arrestees Reporting Prior 12 Month Drug Use, 2000 to 2003† and 2007 to 2009
Primary City
Average of Total Number of Reported Nights of Inpatient or Residential to Drug or Alcohol Treatment
2000 2001 2002 2003 2007 2008 2009
Atlanta, GA
Charlotte, NC
Chicago, IL
Denver, CO
Indianapolis, IN
Minneapolis, MN
New York, NY
Portland, OR
Sacramento, CA
Washington, DC
0.7 (1.2) 1.7
(2.8) 3.9
(0.7) 0.8
(0.3) 5.4
(1.1) 5.7
(0.9) 5.5**
(1.1) 1.3**
(0.5)
2.3*** (0.6) 2.2
(1.4) 2.0**
(0.7) 0.9
(0.3) 5.7
(1.0) 5.7
(1.2) 5.9***
(1.0) 2.1***
(0.5)
4.4 (1.8) 1.4
(0.5) 1.9
(0.5) 2.3*
(0.7) 0.6
(0.3) 5.4
(0.9) 4.9
(1.0) 6.4***
(1.1) 1.1*
(0.5)
n/a
4.0* (1.4) 2.2**
(0.6) 2.9
(0.7) 1.9**
(1.0) 1.0
(0.4) 6.1
(1.2) 7.1**
(1.2) 4.1
(1.3) 1.4*
(0.6) 4.3
(1.9)
2.6 (1.9) 1.5*
(0.7) 6.9***
(1.7) 4.2
(1.0) 1.1
(0.5) 7.7
(1.5) 1.4
(1.8) 5.3*
(1.6) 3.2***
(0.7) 2.3
(1.5)
0.0 (1.2) 1.4
(0.6) 2.0
(1.0) 2.7*
(0.8) 1.0
(0.6) 4.4
(1.1) 1.9
(1.0) 4.4*
(1.1) 4.3***
(1.2)
n/a
0.8 (1.3) 0.3
(0.5) 0.7
(1.3) 5.3
(1.2) 0.4
(0.3) 5.6
(1.5) 3.5
(1.2) 2.2
(0.9) 0.1
(0.3) 1.2
(2.0)
Notes:
Numbers shown in parentheses ( ) represent the standard error of the estimate presented. Question asked only of arrestees who reported 12-month drug use. Differences between each year and 2009 are reported as significant at the 0.10 level (*), 0.05 level (**), or 0.01 level (***). Empty cells indicate years in which the site did not collect data.
† Data from 2000-2003 were re-estimated using the methodology utilized in 2007-2009 for ADAM II. Consequently these estimates may differ somewhat from those previously published under the original ADAM program.
62

AD
AM
II 2009 An
nu
al Rep
ort
Ap
pen
dix A
: Data T
ables
Table 2.12: Past 12 Month Mental Health Inpatient Treatment Nights among Arrestees Reporting Prior 12 Month Drug Use, 2000 to 2003† and 2007 to 2009
Primary City
Average of Total Number of Nights of Inpatient Mental Health/ Psychiatric Treatment
2000 2001 2002 2003 2007 2008 2009
Atlanta, GA
Charlotte, NC
Chicago, IL
Denver, CO
Indianapolis, IN
Minneapolis, MN
New York, NY
Portland, OR
Sacramento, CA
Washington, DC
0.1 (0.5) 0.2
(1.5) 0.3
(0.2) 0.2
(0.1) 0.3
(0.3) 1.1
(0.3) 0.8
(0.3) 0.2
(0.1)
0.6** (0.3) 0.7
(0.7) 0.6
(0.2) 0.1
(0.1) 0.7*
(0.2) 0.7
(0.4) 0.6
(0.2) 0.2
(0.1)
0.8 (0.5) 0.2
(0.2) 0.8**
(0.3) 0.4
(0.2) 0.0
(0.1) 0.1
(0.2) 0.6
(0.3) 0.5
(0.3) 0.1
(0.1)
n/a
0.6 (0.4) 0.4
(0.3) 0.2
(0.4) 0.2
(0.3) 0.2
(0.1) 0.4
(0.3) 0.3
(0.4) 0.3
(0.3) 0.3
(0.1)
n/a
0.6 (0.6)
n/a
0.7 (0.9) 0.5
(0.4) 0.1
(0.2) 1.6***
(0.3) 0.6
(0.5) 0.7
(0.4) 0.1
(0.1)
n/a
0.4 (0.3)
n/a
n/a
0.5 (0.3) 0.4
(0.2) 0.4
(0.2) 1.5
(0.7) 0.9
(0.5) 0.2
(0.1)
n/a
1.2 (0.5)
n/a
n/a
1.0 (0.8) 0.1
(0.1) 0.3
(0.2) 0.7
(0.3) 0.3
(0.2) 0.5
(0.6)
n/a
Notes:
Numbers shown in parentheses ( ) represent the standard error of the estimate presented. Question asked only of arrestees who reported 12-month drug use. Differences between each year and 2009 are reported as significant at the 0.10 level (*), 0.05 level (**), or 0.01 level (***). Empty cells indicate years in which the site did not collect data.
† Data from 2000-2003 were re-estimated using the methodology utilized in 2007-2009 for ADAM II. Consequently these estimates may differ somewhat from those previously published under the original ADAM program.
63
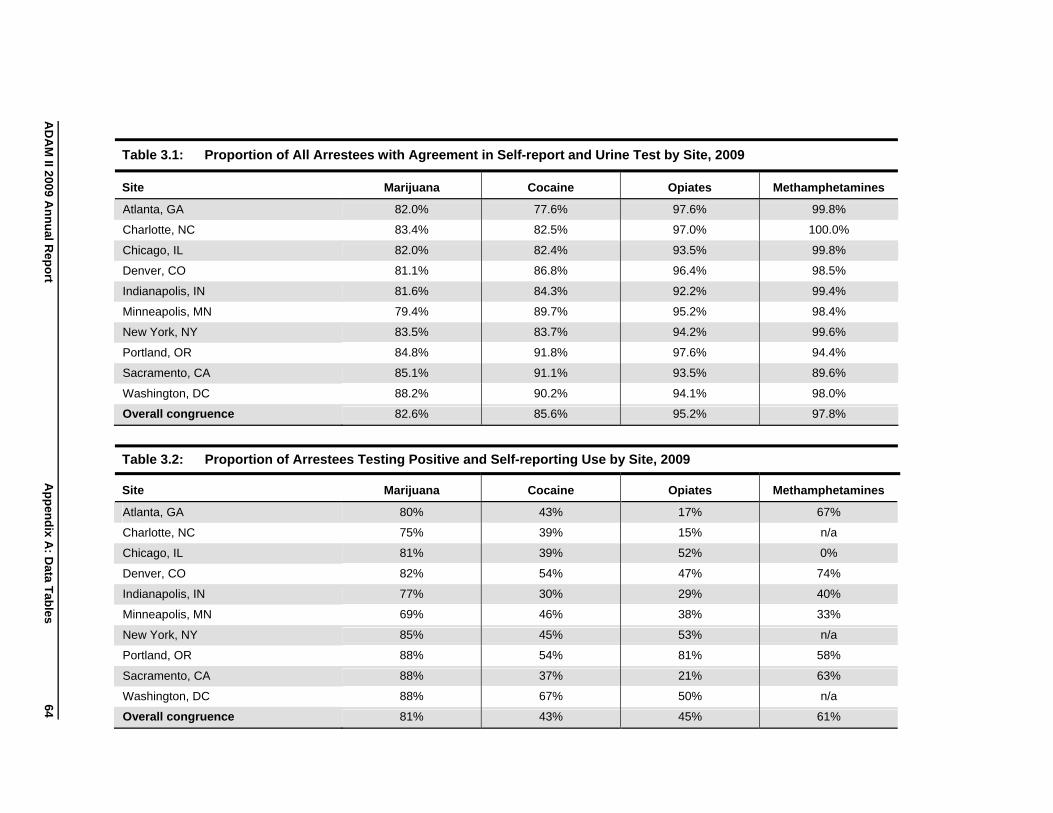
AD
AM
II 2009 An
nu
al Rep
ort
Ap
pen
dix A
: Data T
ables
Table 3.1: Proportion of All Arrestees with Agreement in Self-report and Urine Test by Site, 2009
Site Marijuana Cocaine Opiates Methamphetamines
Atlanta, GA 82.0% 77.6% 97.6% 99.8%
Charlotte, NC 83.4% 82.5% 97.0% 100.0%
Chicago, IL 82.0% 82.4% 93.5% 99.8%
Denver, CO 81.1% 86.8% 96.4% 98.5%
Indianapolis, IN 81.6% 84.3% 92.2% 99.4%
Minneapolis, MN 79.4% 89.7% 95.2% 98.4%
New York, NY 83.5% 83.7% 94.2% 99.6%
Portland, OR 84.8% 91.8% 97.6% 94.4%
Sacramento, CA 85.1% 91.1% 93.5% 89.6%
Washington, DC 88.2% 90.2% 94.1% 98.0%
Overall congruence 82.6% 85.6% 95.2% 97.8%
Table 3.2: Proportion of Arrestees Testing Positive and Self-reporting Use by Site, 2009
Site Marijuana Cocaine Opiates Methamphetamines
Atlanta, GA 80% 43% 17% 67%
Charlotte, NC 75% 39% 15% n/a
Chicago, IL 81% 39% 52% 0%
Denver, CO 82% 54% 47% 74%
Indianapolis, IN 77% 30% 29% 40%
Minneapolis, MN 69% 46% 38% 33%
New York, NY 85% 45% 53% n/a
Portland, OR 88% 54% 81% 58%
Sacramento, CA 88% 37% 21% 63%
Washington, DC 88% 67% 50% n/a
Overall congruence 81% 43% 45% 61%
64
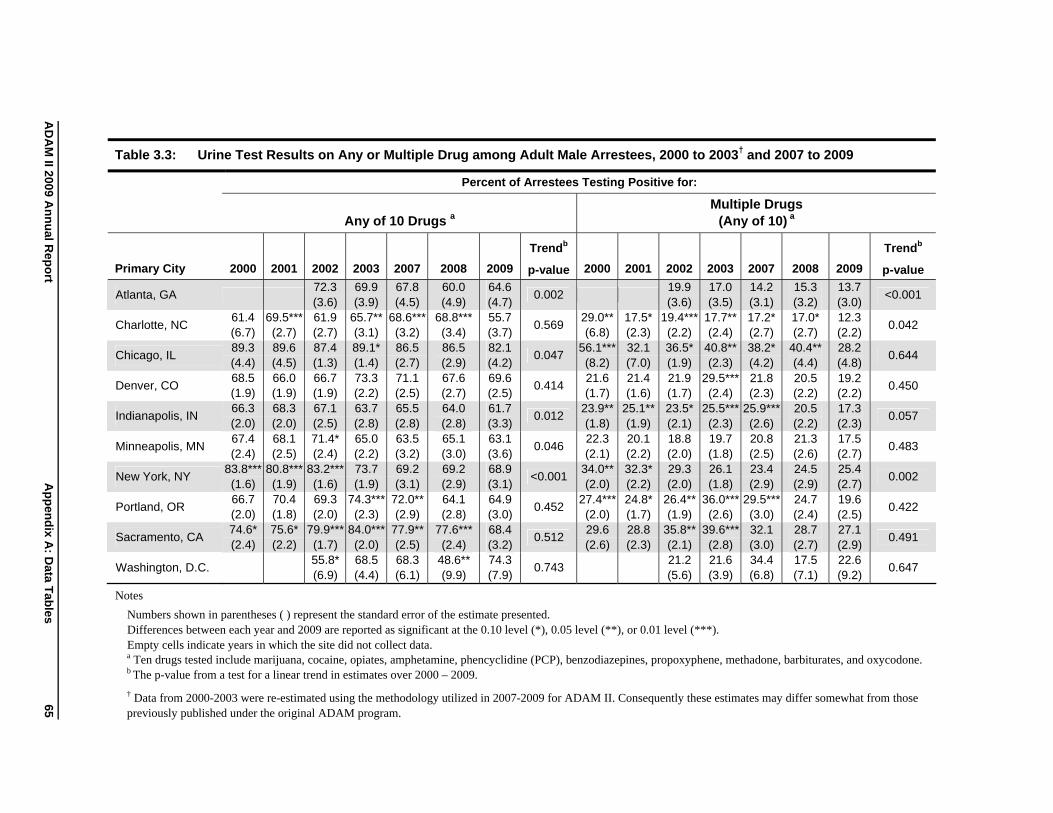
AD
AM
II 2009 An
nu
al Rep
ort
Ap
pen
dix A
: Data T
ables
Table 3.3: Urine Test Results on Any or Multiple Drug among Adult Male Arrestees, 2000 to 2003† and 2007 to 2009
Percent of Arrestees Testing Positive for:
Multiple Drugs Any of 10 Drugs a (Any of 10) a
Primary City 2000 2001 2002 2003 2007 2008 2009
Trendb
p-value 2000 2001 2002 2003 2007 2008 2009
Trendb
p-value
Atlanta, GA 72.3 (3.6)
69.9 (3.9)
67.8 (4.5)
60.0 (4.9)
64.6 (4.7)
0.002 19.9 (3.6)
17.0 (3.5)
14.2 (3.1)
15.3 (3.2)
13.7 (3.0)
<0.001
Charlotte, NC 61.4 (6.7)
69.5*** (2.7)
61.9 (2.7)
65.7** (3.1)
68.6*** (3.2)
68.8*** (3.4)
55.7 (3.7)
0.569 29.0** (6.8)
17.5* (2.3)
19.4*** (2.2)
17.7** (2.4)
17.2* (2.7)
17.0* (2.7)
12.3 (2.2)
0.042
Chicago, IL 89.3 (4.4)
89.6 (4.5)
87.4 (1.3)
89.1* (1.4)
86.5 (2.7)
86.5 (2.9)
82.1 (4.2)
0.047 56.1*** (8.2)
32.1 (7.0)
36.5* (1.9)
40.8** (2.3)
38.2* (4.2)
40.4** (4.4)
28.2 (4.8)
0.644
Denver, CO
Indianapolis, IN
68.5 (1.9) 66.3 (2.0)
66.0 (1.9) 68.3 (2.0)
66.7 (1.9) 67.1 (2.5)
73.3 (2.2) 63.7 (2.8)
71.1 (2.5) 65.5 (2.8)
67.6 (2.7) 64.0 (2.8)
69.6 (2.5) 61.7 (3.3)
0.414
0.012
21.6 (1.7)
23.9** (1.8)
21.4 (1.6)
25.1** (1.9)
21.9 (1.7) 23.5* (2.1)
29.5*** (2.4)
25.5*** (2.3)
21.8 (2.3)
25.9*** (2.6)
20.5 (2.2) 20.5 (2.2)
19.2 (2.2) 17.3 (2.3)
0.450
0.057
Minneapolis, MN 67.4 (2.4)
68.1 (2.5)
71.4* (2.4)
65.0 (2.2)
63.5 (3.2)
65.1 (3.0)
63.1 (3.6)
0.046 22.3 (2.1)
20.1 (2.2)
18.8 (2.0)
19.7 (1.8)
20.8 (2.5)
21.3 (2.6)
17.5 (2.7)
0.483
New York, NY 83.8*** (1.6)
80.8*** (1.9)
83.2*** (1.6)
73.7 (1.9)
69.2 (3.1)
69.2 (2.9)
68.9 (3.1)
<0.001 34.0** (2.0)
32.3* (2.2)
29.3 (2.0)
26.1 (1.8)
23.4 (2.9)
24.5 (2.9)
25.4 (2.7)
0.002
Portland, OR
Sacramento, CA
66.7 (2.0) 74.6* (2.4)
70.4 (1.8) 75.6* (2.2)
69.3 (2.0)
79.9*** (1.7)
74.3*** (2.3)
84.0*** (2.0)
72.0** (2.9)
77.9** (2.5)
64.1 (2.8)
77.6*** (2.4)
64.9 (3.0) 68.4 (3.2)
0.452
0.512
27.4*** (2.0) 29.6 (2.6)
24.8* (1.7) 28.8 (2.3)
26.4** (1.9)
35.8** (2.1)
36.0*** (2.6)
39.6*** (2.8)
29.5*** (3.0) 32.1 (3.0)
24.7 (2.4) 28.7 (2.7)
19.6 (2.5) 27.1 (2.9)
0.422
0.491
Washington, D.C. 55.8* (6.9)
68.5 (4.4)
68.3 (6.1)
48.6** (9.9)
74.3 (7.9)
0.743 21.2 (5.6)
21.6 (3.9)
34.4 (6.8)
17.5 (7.1)
22.6 (9.2)
0.647
Notes
Numbers shown in parentheses ( ) represent the standard error of the estimate presented. Differences between each year and 2009 are reported as significant at the 0.10 level (*), 0.05 level (**), or 0.01 level (***). Empty cells indicate years in which the site did not collect data. a Ten drugs tested include marijuana, cocaine, opiates, amphetamine, phencyclidine (PCP), benzodiazepines, propoxyphene, methadone, barbiturates, and oxycodone. b The p-value from a test for a linear trend in estimates over 2000 – 2009.
† Data from 2000-2003 were re-estimated using the methodology utilized in 2007-2009 for ADAM II. Consequently these estimates may differ somewhat from those previously published under the original ADAM program.
65
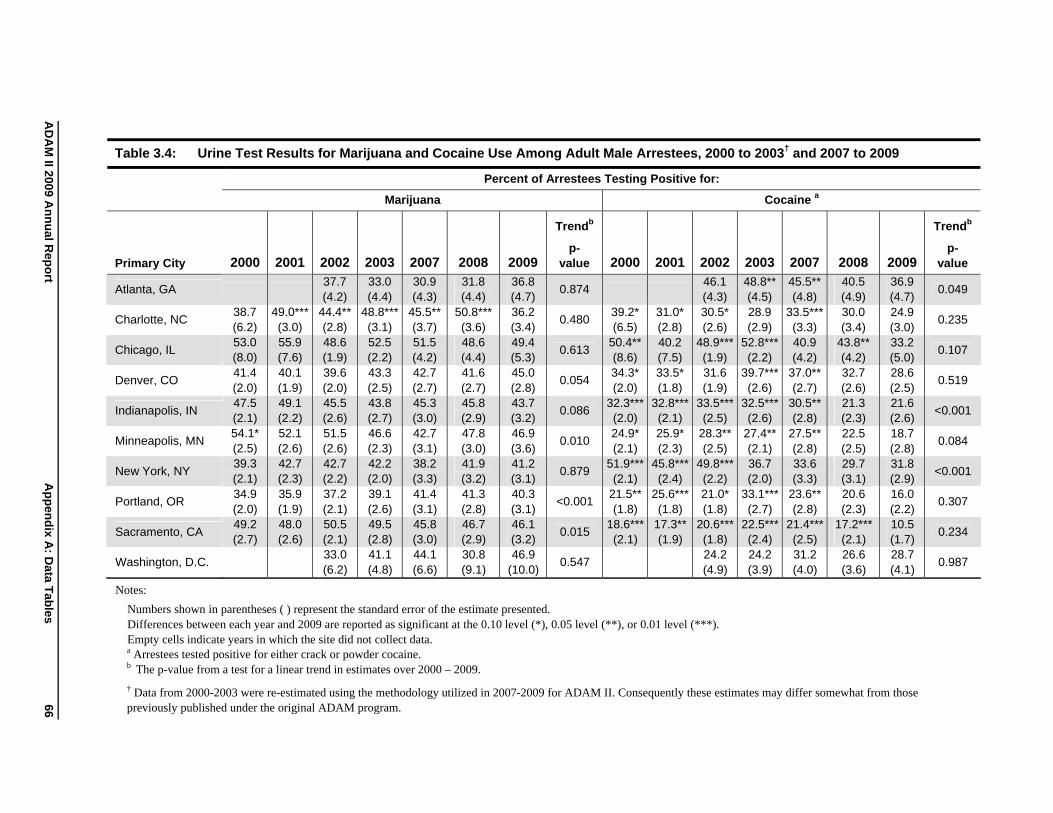
AD
AM
II 2009 An
nu
al Rep
ort
Ap
pen
dix A
: Data T
ables
Table 3.4: Urine Test Results for Marijuana and Cocaine Use Among Adult Male Arrestees, 2000 to 2003† and 2007 to 2009
Percent of Arrestees Testing Positive for:
Marijuana Cocaine a
Trendb Trendb
p- p-Primary City 2000 2001 2002 2003 2007 2008 2009 value 2000 2001 2002 2003 2007 2008 2009 value
Atlanta, GA 37.7 (4.2)
33.0 (4.4)
30.9 (4.3)
31.8 (4.4)
36.8 (4.7)
0.874 46.1 (4.3)
48.8** (4.5)
45.5** (4.8)
40.5 (4.9)
36.9 (4.7)
0.049
Charlotte, NC
Chicago, IL
38.7 (6.2) 53.0 (8.0)
49.0*** (3.0) 55.9 (7.6)
44.4** (2.8) 48.6 (1.9)
48.8*** (3.1) 52.5 (2.2)
45.5** (3.7) 51.5 (4.2)
50.8*** (3.6) 48.6 (4.4)
36.2 (3.4) 49.4 (5.3)
0.480
0.613
39.2* (6.5)
50.4** (8.6)
31.0* (2.8) 40.2 (7.5)
30.5* (2.6)
48.9*** (1.9)
28.9 (2.9)
52.8*** (2.2)
33.5*** (3.3) 40.9 (4.2)
30.0 (3.4)
43.8** (4.2)
24.9 (3.0) 33.2 (5.0)
0.235
0.107
Denver, CO 41.4 (2.0)
40.1 (1.9)
39.6 (2.0)
43.3 (2.5)
42.7 (2.7)
41.6 (2.7)
45.0 (2.8)
0.054 34.3* (2.0)
33.5* (1.8)
31.6 (1.9)
39.7*** (2.6)
37.0** (2.7)
32.7 (2.6)
28.6 (2.5)
0.519
Indianapolis, IN 47.5 (2.1)
49.1 (2.2)
45.5 (2.6)
43.8 (2.7)
45.3 (3.0)
45.8 (2.9)
43.7 (3.2)
0.086 32.3*** (2.0)
32.8*** (2.1)
33.5*** (2.5)
32.5*** (2.6)
30.5** (2.8)
21.3 (2.3)
21.6 (2.6)
<0.001
Minneapolis, MN
New York, NY
54.1* (2.5) 39.3 (2.1)
52.1 (2.6) 42.7 (2.3)
51.5 (2.6) 42.7 (2.2)
46.6 (2.3) 42.2 (2.0)
42.7 (3.1) 38.2 (3.3)
47.8 (3.0) 41.9 (3.2)
46.9 (3.6) 41.2 (3.1)
0.010
0.879
24.9* (2.1)
51.9*** (2.1)
25.9* (2.3)
45.8*** (2.4)
28.3** (2.5)
49.8*** (2.2)
27.4** (2.1) 36.7 (2.0)
27.5** (2.8) 33.6 (3.3)
22.5 (2.5) 29.7 (3.1)
18.7 (2.8) 31.8 (2.9)
0.084
<0.001
Portland, OR 34.9 (2.0)
35.9 (1.9)
37.2 (2.1)
39.1 (2.6)
41.4 (3.1)
41.3 (2.8)
40.3 (3.1)
<0.001 21.5** (1.8)
25.6*** (1.8)
21.0* (1.8)
33.1*** (2.7)
23.6** (2.8)
20.6 (2.3)
16.0 (2.2)
0.307
Sacramento, CA 49.2 (2.7)
48.0 (2.6)
50.5 (2.1)
49.5 (2.8)
45.8 (3.0)
46.7 (2.9)
46.1 (3.2)
0.015 18.6*** (2.1)
17.3** (1.9)
20.6*** (1.8)
22.5*** (2.4)
21.4*** (2.5)
17.2*** (2.1)
10.5 (1.7)
0.234
Washington, D.C. 33.0 (6.2)
41.1 (4.8)
44.1 (6.6)
30.8 (9.1)
46.9 (10.0)
0.547 24.2 (4.9)
24.2 (3.9)
31.2 (4.0)
26.6 (3.6)
28.7 (4.1)
0.987
Notes:
Numbers shown in parentheses ( ) represent the standard error of the estimate presented. Differences between each year and 2009 are reported as significant at the 0.10 level (*), 0.05 level (**), or 0.01 level (***). Empty cells indicate years in which the site did not collect data. a Arrestees tested positive for either crack or powder cocaine. b The p-value from a test for a linear trend in estimates over 2000 – 2009.
† Data from 2000-2003 were re-estimated using the methodology utilized in 2007-2009 for ADAM II. Consequently these estimates may differ somewhat from those previously published under the original ADAM program.
66
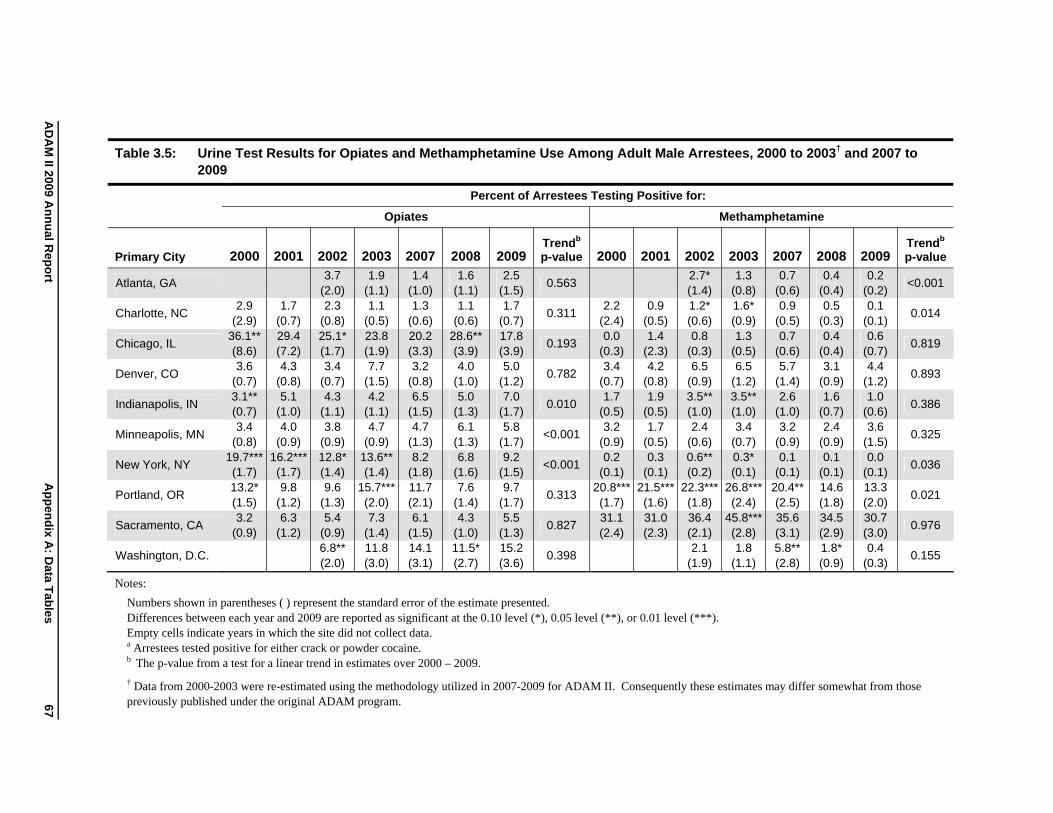
AD
AM
II 2009 An
nu
al Rep
ort
Ap
pen
dix A
: Data T
ables
67
Table 3.5: Urine Test Results for Opiates and Methamphetamine Use Among Adult Male Arrestees, 2000 to 2003† and 2007 to 2009
Percent of Arrestees Testing Positive for:
Opiates Methamphetamine
Primary City 2000 2001 2002 2003 2007 2008 2009Trendb p-value 2000 2001 2002 2003 2007 2008 2009
Trendb p-value
Atlanta, GA 3.7
(2.0) 1.9
(1.1) 1.4
(1.0) 1.6
(1.1) 2.5
(1.5) 0.563
2.7*(1.4)
1.3 (0.8)
0.7 (0.6)
0.4 (0.4)
0.2 (0.2)
<0.001
Charlotte, NC 2.9
(2.9) 1.7
(0.7) 2.3
(0.8) 1.1
(0.5) 1.3
(0.6) 1.1
(0.6) 1.7
(0.7) 0.311
2.2 (2.4)
0.9 (0.5)
1.2*(0.6)
1.6*(0.9)
0.9 (0.5)
0.5 (0.3)
0.1 (0.1)
0.014
Chicago, IL 36.1** (8.6)
29.4 (7.2)
25.1*(1.7)
23.8(1.9)
20.2(3.3)
28.6**(3.9)
17.8(3.9)
0.193 0.0
(0.3) 1.4
(2.3) 0.8
(0.3) 1.3
(0.5) 0.7
(0.6) 0.4
(0.4) 0.6
(0.7) 0.819
Denver, CO 3.6
(0.7) 4.3
(0.8) 3.4
(0.7) 7.7
(1.5) 3.2
(0.8) 4.0
(1.0) 5.0
(1.2) 0.782
3.4 (0.7)
4.2 (0.8)
6.5 (0.9)
6.5 (1.2)
5.7 (1.4)
3.1 (0.9)
4.4 (1.2)
0.893
Indianapolis, IN 3.1** (0.7)
5.1 (1.0)
4.3 (1.1)
4.2 (1.1)
6.5 (1.5)
5.0 (1.3)
7.0 (1.7)
0.010 1.7
(0.5) 1.9
(0.5) 3.5**(1.0)
3.5**(1.0)
2.6 (1.0)
1.6 (0.7)
1.0 (0.6)
0.386
Minneapolis, MN 3.4
(0.8) 4.0
(0.9) 3.8
(0.9) 4.7
(0.9) 4.7
(1.3) 6.1
(1.3) 5.8
(1.7) <0.001
3.2 (0.9)
1.7 (0.5)
2.4 (0.6)
3.4 (0.7)
3.2 (0.9)
2.4 (0.9)
3.6 (1.5)
0.325
New York, NY 19.7*** (1.7)
16.2*** (1.7)
12.8*(1.4)
13.6**(1.4)
8.2 (1.8)
6.8 (1.6)
9.2 (1.5)
<0.001 0.2
(0.1) 0.3
(0.1) 0.6**(0.2)
0.3*(0.1)
0.1 (0.1)
0.1 (0.1)
0.0 (0.1)
0.036
Portland, OR 13.2* (1.5)
9.8 (1.2)
9.6 (1.3)
15.7***(2.0)
11.7(2.1)
7.6 (1.4)
9.7 (1.7)
0.313 20.8*** (1.7)
21.5***(1.6)
22.3***(1.8)
26.8***(2.4)
20.4**(2.5)
14.6(1.8)
13.3(2.0)
0.021
Sacramento, CA 3.2
(0.9) 6.3
(1.2) 5.4
(0.9) 7.3
(1.4) 6.1
(1.5) 4.3
(1.0) 5.5
(1.3) 0.827
31.1 (2.4)
31.0(2.3)
36.4(2.1)
45.8***(2.8)
35.6(3.1)
34.5(2.9)
30.7(3.0)
0.976
Washington, D.C. 6.8**(2.0)
11.8(3.0)
14.1(3.1)
11.5*(2.7)
15.2(3.6)
0.398 2.1
(1.9) 1.8
(1.1) 5.8**(2.8)
1.8*(0.9)
0.4 (0.3)
0.155
Notes:
Numbers shown in parentheses ( ) represent the standard error of the estimate presented. Differences between each year and 2009 are reported as significant at the 0.10 level (*), 0.05 level (**), or 0.01 level (***). Empty cells indicate years in which the site did not collect data. a Arrestees tested positive for either crack or powder cocaine. b The p-value from a test for a linear trend in estimates over 2000 – 2009.
† Data from 2000-2003 were re-estimated using the methodology utilized in 2007-2009 for ADAM II. Consequently these estimates may differ somewhat from those previously published under the original ADAM program.
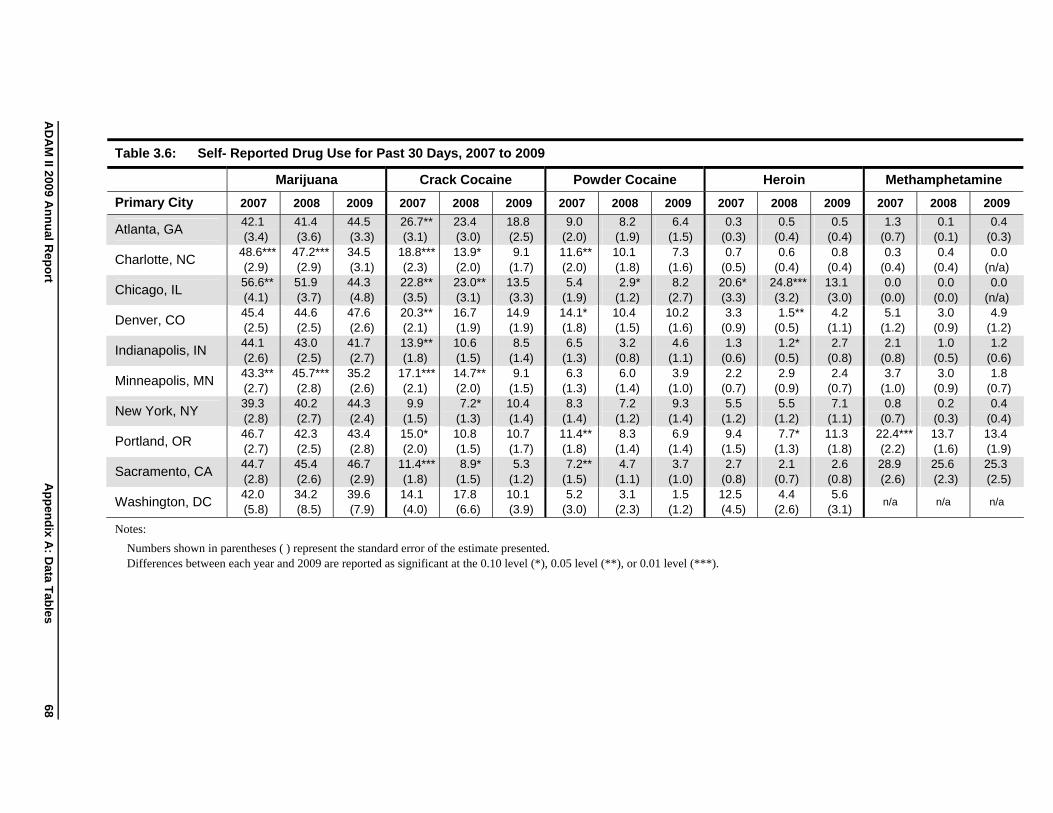
AD
AM
II 2009 An
nu
al Rep
ort
Ap
pen
dix A
: Data T
ables
Table 3.6: Self- Reported Drug Use for Past 30 Days, 2007 to 2009
Marijuana Crack Cocaine Powder Cocaine Heroin Methamphetamine
Primary City 2007 2008 2009 2007 2008 2009 2007 2008 2009 2007 2008 2009 2007 2008 2009
Atlanta, GA 42.1 (3.4)
41.4 (3.6)
44.5 (3.3)
26.7** (3.1)
23.4 (3.0)
18.8 (2.5)
9.0 (2.0)
8.2 (1.9)
6.4 (1.5)
0.3 (0.3)
0.5 (0.4)
0.5 (0.4)
1.3 (0.7)
0.1 (0.1)
0.4 (0.3)
Charlotte, NC
Chicago, IL
48.6*** (2.9) 56.6** (4.1)
47.2*** (2.9) 51.9 (3.7)
34.5 (3.1) 44.3 (4.8)
18.8*** (2.3) 22.8** (3.5)
13.9* (2.0) 23.0** (3.1)
9.1 (1.7) 13.5 (3.3)
11.6** (2.0) 5.4
(1.9)
10.1 (1.8) 2.9*
(1.2)
7.3 (1.6) 8.2
(2.7)
0.7 (0.5) 20.6* (3.3)
0.6 (0.4)
24.8*** (3.2)
0.8 (0.4) 13.1 (3.0)
0.3 (0.4) 0.0
(0.0)
0.4 (0.4) 0.0
(0.0)
0.0 (n/a) 0.0
(n/a)
Denver, CO 45.4 (2.5)
44.6 (2.5)
47.6 (2.6)
20.3** (2.1)
16.7 (1.9)
14.9 (1.9)
14.1* (1.8)
10.4 (1.5)
10.2 (1.6)
3.3 (0.9)
1.5** (0.5)
4.2 (1.1)
5.1 (1.2)
3.0 (0.9)
4.9 (1.2)
Indianapolis, IN 44.1 (2.6)
43.0 (2.5)
41.7 (2.7)
13.9** (1.8)
10.6 (1.5)
8.5 (1.4)
6.5 (1.3)
3.2 (0.8)
4.6 (1.1)
1.3 (0.6)
1.2* (0.5)
2.7 (0.8)
2.1 (0.8)
1.0 (0.5)
1.2 (0.6)
Minneapolis, MN 43.3** (2.7)
45.7*** (2.8)
35.2 (2.6)
17.1*** (2.1)
14.7** (2.0)
9.1 (1.5)
6.3 (1.3)
6.0 (1.4)
3.9 (1.0)
2.2 (0.7)
2.9 (0.9)
2.4 (0.7)
3.7 (1.0)
3.0 (0.9)
1.8 (0.7)
New York, NY 39.3 (2.8)
40.2 (2.7)
44.3 (2.4)
9.9 (1.5)
7.2* (1.3)
10.4 (1.4)
8.3 (1.4)
7.2 (1.2)
9.3 (1.4)
5.5 (1.2)
5.5 (1.2)
7.1 (1.1)
0.8 (0.7)
0.2 (0.3)
0.4 (0.4)
Portland, OR 46.7 (2.7)
42.3 (2.5)
43.4 (2.8)
15.0* (2.0)
10.8 (1.5)
10.7 (1.7)
11.4** (1.8)
8.3 (1.4)
6.9 (1.4)
9.4 (1.5)
7.7* (1.3)
11.3 (1.8)
22.4*** (2.2)
13.7 (1.6)
13.4 (1.9)
Sacramento, CA 44.7 (2.8)
45.4 (2.6)
46.7 (2.9)
11.4*** (1.8)
8.9* (1.5)
5.3 (1.2)
7.2** (1.5)
4.7 (1.1)
3.7 (1.0)
2.7 (0.8)
2.1 (0.7)
2.6 (0.8)
28.9 (2.6)
25.6 (2.3)
25.3 (2.5)
Washington, DC 42.0 (5.8)
34.2 (8.5)
39.6 (7.9)
14.1 (4.0)
17.8 (6.6)
10.1 (3.9)
5.2 (3.0)
3.1 (2.3)
1.5 (1.2)
12.5 (4.5)
4.4 (2.6)
5.6 (3.1)
n/a n/a n/a
Notes:
Numbers shown in parentheses ( ) represent the standard error of the estimate presented.
Differences between each year and 2009 are reported as significant at the 0.10 level (*), 0.05 level (**), or 0.01 level (***).
68
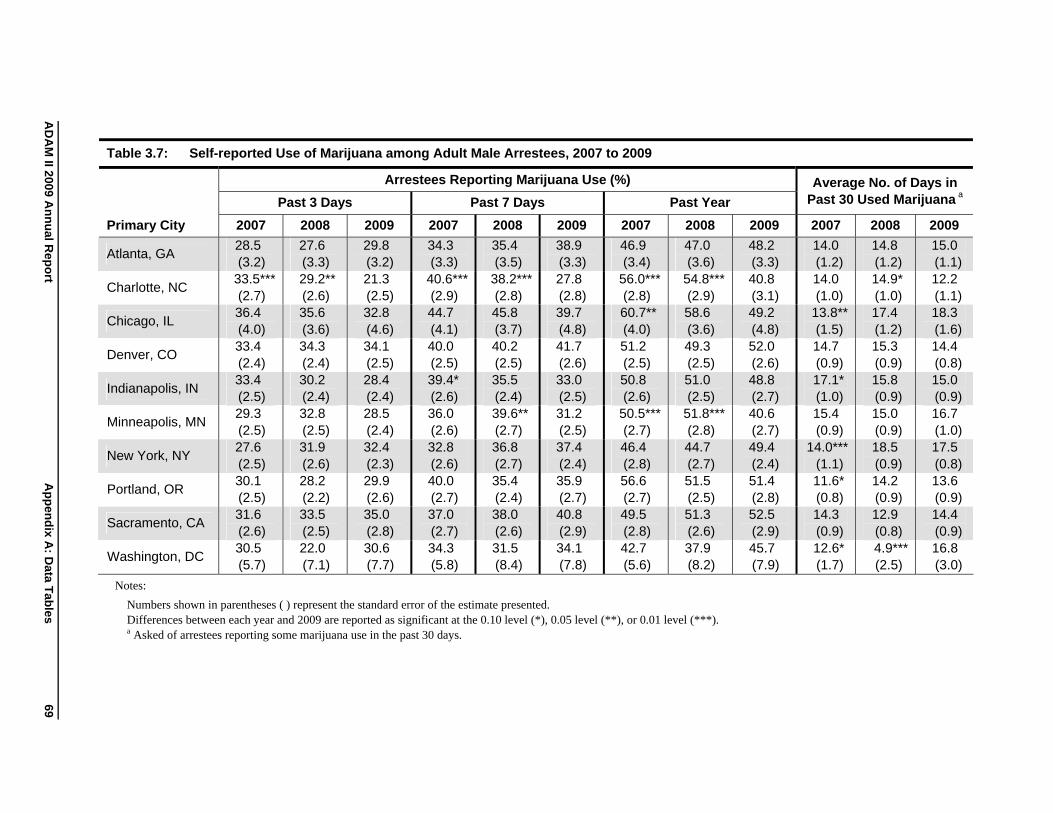
AD
AM
II 2009 An
nu
al Rep
ort
Ap
pen
dix A
: Data T
ables
Table 3.7: Self-reported Use of Marijuana among Adult Male Arrestees, 2007 to 2009
Primary City
Arrestees Reporting Marijuana Use (%) Average No. of Days in Past 30 Used Marijuana a
Past 3 Days Past 7 Days Past Year
2007 2008 2009 2007 2008 2009 2007 2008 2009 2007 2008 2009
Atlanta, GA 28.5 (3.2)
27.6 (3.3)
29.8 (3.2)
34.3 (3.3)
35.4 (3.5)
38.9 (3.3)
46.9 (3.4)
47.0 (3.6)
48.2 (3.3)
14.0 (1.2)
14.8 (1.2)
15.0 (1.1)
Charlotte, NC
Chicago, IL
33.5*** (2.7) 36.4 (4.0)
29.2** (2.6) 35.6 (3.6)
21.3 (2.5) 32.8 (4.6)
40.6*** (2.9) 44.7 (4.1)
38.2*** (2.8) 45.8 (3.7)
27.8 (2.8) 39.7 (4.8)
56.0*** (2.8) 60.7** (4.0)
54.8*** (2.9) 58.6 (3.6)
40.8 (3.1) 49.2 (4.8)
14.0 (1.0)
13.8** (1.5)
14.9* (1.0) 17.4 (1.2)
12.2 (1.1) 18.3 (1.6)
Denver, CO
Indianapolis, IN
33.4 (2.4) 33.4 (2.5)
34.3 (2.4) 30.2 (2.4)
34.1 (2.5) 28.4 (2.4)
40.0 (2.5) 39.4* (2.6)
40.2 (2.5) 35.5 (2.4)
41.7 (2.6) 33.0 (2.5)
51.2 (2.5) 50.8 (2.6)
49.3 (2.5) 51.0 (2.5)
52.0 (2.6) 48.8 (2.7)
14.7 (0.9) 17.1* (1.0)
15.3 (0.9) 15.8 (0.9)
14.4 (0.8) 15.0 (0.9)
Minneapolis, MN
New York, NY
29.3 (2.5) 27.6 (2.5)
32.8 (2.5) 31.9 (2.6)
28.5 (2.4) 32.4 (2.3)
36.0 (2.6) 32.8 (2.6)
39.6** (2.7) 36.8 (2.7)
31.2 (2.5) 37.4 (2.4)
50.5*** (2.7) 46.4 (2.8)
51.8*** (2.8) 44.7 (2.7)
40.6 (2.7) 49.4 (2.4)
15.4 (0.9)
14.0*** (1.1)
15.0 (0.9) 18.5 (0.9)
16.7 (1.0) 17.5 (0.8)
Portland, OR
Sacramento, CA
30.1 (2.5) 31.6 (2.6)
28.2 (2.2) 33.5 (2.5)
29.9 (2.6) 35.0 (2.8)
40.0 (2.7) 37.0 (2.7)
35.4 (2.4) 38.0 (2.6)
35.9 (2.7) 40.8 (2.9)
56.6 (2.7) 49.5 (2.8)
51.5 (2.5) 51.3 (2.6)
51.4 (2.8) 52.5 (2.9)
11.6* (0.8) 14.3 (0.9)
14.2 (0.9) 12.9 (0.8)
13.6 (0.9) 14.4 (0.9)
Washington, DC 30.5 (5.7)
22.0 (7.1)
30.6 (7.7)
34.3 (5.8)
31.5 (8.4)
34.1 (7.8)
42.7 (5.6)
37.9 (8.2)
45.7 (7.9)
12.6* (1.7)
4.9*** (2.5)
16.8 (3.0)
Notes:
Numbers shown in parentheses ( ) represent the standard error of the estimate presented.
Differences between each year and 2009 are reported as significant at the 0.10 level (*), 0.05 level (**), or 0.01 level (***).
a Asked of arrestees reporting some marijuana use in the past 30 days.
69
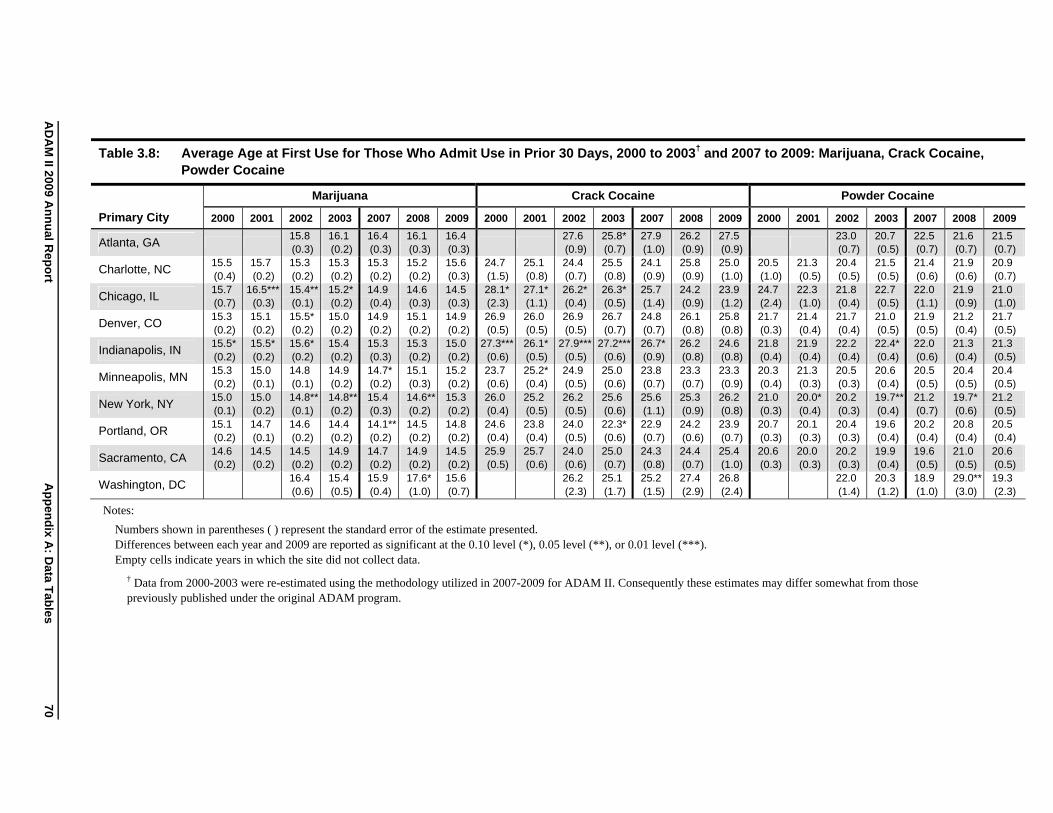
AD
AM
II 2009 An
nu
al Rep
ort
Ap
pen
dix A
: Data T
ables
Table 3.8: Average Age at First Use for Those Who Admit Use in Prior 30 Days, 2000 to 2003† and 2007 to 2009: Marijuana, Crack Cocaine, Powder Cocaine
Marijuana Crack Cocaine Powder Cocaine
Primary City 2000 2001 2002 2003 2007 2008 2009 2000 2001 2002 2003 2007 2008 2009 2000 2001 2002 2003 2007 2008 2009
Atlanta, GA 15.8 (0.3)
16.1 (0.2)
16.4 (0.3)
16.1 (0.3)
16.4 (0.3)
27.6 (0.9)
25.8* (0.7)
27.9 (1.0)
26.2 (0.9)
27.5 (0.9)
23.0 (0.7)
20.7 (0.5)
22.5 (0.7)
21.6 (0.7)
21.5 (0.7)
Charlotte, NC 15.5 (0.4)
15.7 (0.2)
15.3 (0.2)
15.3 (0.2)
15.3 (0.2)
15.2 (0.2)
15.6 (0.3)
24.7 (1.5)
25.1 (0.8)
24.4 (0.7)
25.5 (0.8)
24.1 (0.9)
25.8 (0.9)
25.0 (1.0)
20.5 (1.0)
21.3 (0.5)
20.4 (0.5)
21.5 (0.5)
21.4 (0.6)
21.9 (0.6)
20.9 (0.7)
Chicago, IL 15.7 (0.7)
16.5*** (0.3)
15.4** (0.1)
15.2* (0.2)
14.9 (0.4)
14.6 (0.3)
14.5 (0.3)
28.1* (2.3)
27.1* (1.1)
26.2* (0.4)
26.3* (0.5)
25.7 (1.4)
24.2 (0.9)
23.9 (1.2)
24.7 (2.4)
22.3 (1.0)
21.8 (0.4)
22.7 (0.5)
22.0 (1.1)
21.9 (0.9)
21.0 (1.0)
Denver, CO 15.3 (0.2)
15.1 (0.2)
15.5* (0.2)
15.0 (0.2)
14.9 (0.2)
15.1 (0.2)
14.9 (0.2)
26.9 (0.5)
26.0 (0.5)
26.9 (0.5)
26.7 (0.7)
24.8 (0.7)
26.1 (0.8)
25.8 (0.8)
21.7 (0.3)
21.4 (0.4)
21.7 (0.4)
21.0 (0.5)
21.9 (0.5)
21.2 (0.4)
21.7 (0.5)
Indianapolis, IN 15.5* (0.2)
15.5* (0.2)
15.6* (0.2)
15.4 (0.2)
15.3 (0.3)
15.3 (0.2)
15.0 (0.2)
27.3*** (0.6)
26.1* (0.5)
27.9*** (0.5)
27.2*** (0.6)
26.7* (0.9)
26.2 (0.8)
24.6 (0.8)
21.8 (0.4)
21.9 (0.4)
22.2 (0.4)
22.4* (0.4)
22.0 (0.6)
21.3 (0.4)
21.3 (0.5)
Minneapolis, MN 15.3 (0.2)
15.0 (0.1)
14.8 (0.1)
14.9 (0.2)
14.7* (0.2)
15.1 (0.3)
15.2 (0.2)
23.7 (0.6)
25.2* (0.4)
24.9 (0.5)
25.0 (0.6)
23.8 (0.7)
23.3 (0.7)
23.3 (0.9)
20.3 (0.4)
21.3 (0.3)
20.5 (0.3)
20.6 (0.4)
20.5 (0.5)
20.4 (0.5)
20.4 (0.5)
New York, NY 15.0 (0.1)
15.0 (0.2)
14.8** (0.1)
14.8** (0.2)
15.4 (0.3)
14.6** (0.2)
15.3 (0.2)
26.0 (0.4)
25.2 (0.5)
26.2 (0.5)
25.6 (0.6)
25.6 (1.1)
25.3 (0.9)
26.2 (0.8)
21.0 (0.3)
20.0* (0.4)
20.2 (0.3)
19.7** (0.4)
21.2 (0.7)
19.7* (0.6)
21.2 (0.5)
Portland, OR 15.1 (0.2)
14.7 (0.1)
14.6 (0.2)
14.4 (0.2)
14.1** (0.2)
14.5 (0.2)
14.8 (0.2)
24.6 (0.4)
23.8 (0.4)
24.0 (0.5)
22.3* (0.6)
22.9 (0.7)
24.2 (0.6)
23.9 (0.7)
20.7 (0.3)
20.1 (0.3)
20.4 (0.3)
19.6 (0.4)
20.2 (0.4)
20.8 (0.4)
20.5 (0.4)
Sacramento, CA 14.6 (0.2)
14.5 (0.2)
14.5 (0.2)
14.9 (0.2)
14.7 (0.2)
14.9 (0.2)
14.5 (0.2)
25.9 (0.5)
25.7 (0.6)
24.0 (0.6)
25.0 (0.7)
24.3 (0.8)
24.4 (0.7)
25.4 (1.0)
20.6 (0.3)
20.0 (0.3)
20.2 (0.3)
19.9 (0.4)
19.6 (0.5)
21.0 (0.5)
20.6 (0.5)
Washington, DC 16.4 (0.6)
15.4 (0.5)
15.9 (0.4)
17.6* (1.0)
15.6 (0.7)
26.2 (2.3)
25.1 (1.7)
25.2 (1.5)
27.4 (2.9)
26.8 (2.4)
22.0 (1.4)
20.3 (1.2)
18.9 (1.0)
29.0** (3.0)
19.3 (2.3)
Notes:
Numbers shown in parentheses ( ) represent the standard error of the estimate presented. Differences between each year and 2009 are reported as significant at the 0.10 level (*), 0.05 level (**), or 0.01 level (***). Empty cells indicate years in which the site did not collect data.
† Data from 2000-2003 were re-estimated using the methodology utilized in 2007-2009 for ADAM II. Consequently these estimates may differ somewhat from those previously published under the original ADAM program.
70
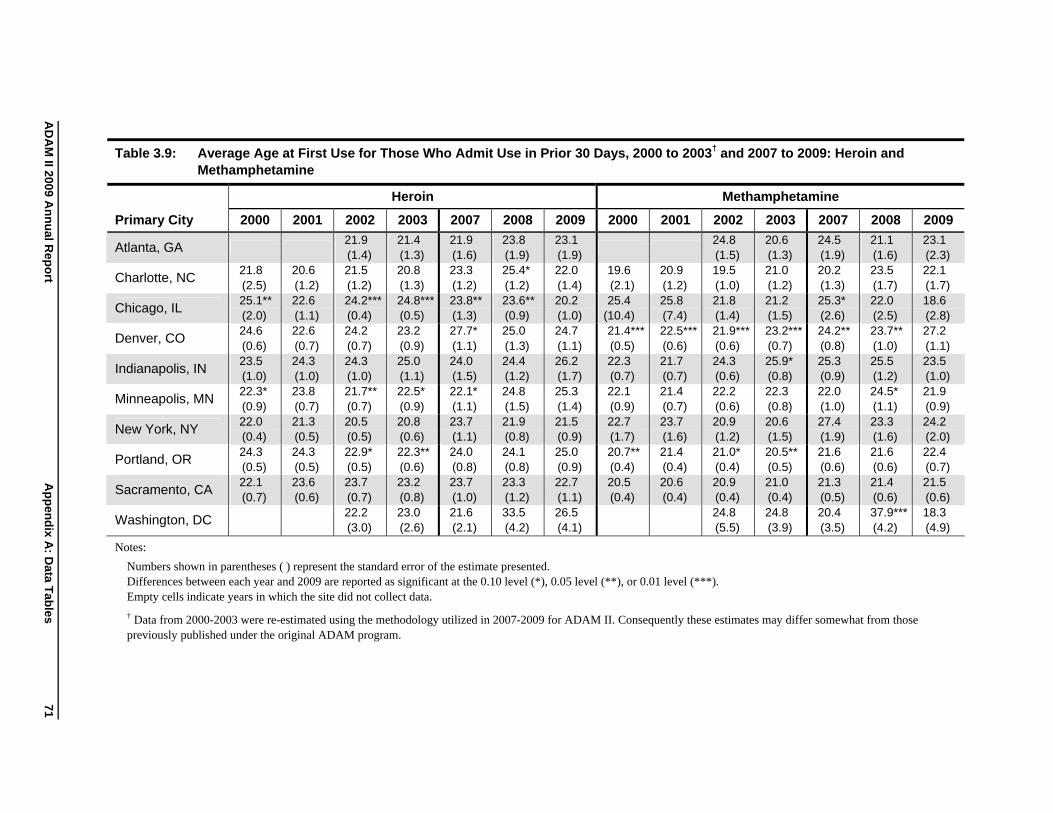
AD
AM
II 2009 An
nu
al Rep
ort
Ap
pen
dix A
: Data T
ables
71
Table 3.9: Average Age at First Use for Those Who Admit Use in Prior 30 Days, 2000 to 2003† and 2007 to 2009: Heroin and Methamphetamine
Heroin Methamphetamine
Primary City 2000 2001 2002 2003 2007 2008 2009 2000 2001 2002 2003 2007 2008 2009
Atlanta, GA 21.9 (1.4)
21.4 (1.3)
21.9 (1.6)
23.8 (1.9)
23.1 (1.9)
24.8 (1.5)
20.6 (1.3)
24.5 (1.9)
21.1 (1.6)
23.1 (2.3)
Charlotte, NC 21.8 (2.5)
20.6 (1.2)
21.5 (1.2)
20.8 (1.3)
23.3 (1.2)
25.4* (1.2)
22.0 (1.4)
19.6 (2.1)
20.9 (1.2)
19.5 (1.0)
21.0 (1.2)
20.2 (1.3)
23.5 (1.7)
22.1 (1.7)
Chicago, IL 25.1** (2.0)
22.6 (1.1)
24.2***(0.4)
24.8***(0.5)
23.8**(1.3)
23.6**(0.9)
20.2 (1.0)
25.4 (10.4)
25.8 (7.4)
21.8 (1.4)
21.2 (1.5)
25.3* (2.6)
22.0 (2.5)
18.6 (2.8)
Denver, CO 24.6 (0.6)
22.6 (0.7)
24.2 (0.7)
23.2 (0.9)
27.7* (1.1)
25.0 (1.3)
24.7 (1.1)
21.4*** (0.5)
22.5***(0.6)
21.9***(0.6)
23.2***(0.7)
24.2**(0.8)
23.7**(1.0)
27.2 (1.1)
Indianapolis, IN 23.5 (1.0)
24.3 (1.0)
24.3 (1.0)
25.0 (1.1)
24.0 (1.5)
24.4 (1.2)
26.2 (1.7)
22.3 (0.7)
21.7 (0.7)
24.3 (0.6)
25.9* (0.8)
25.3 (0.9)
25.5 (1.2)
23.5 (1.0)
Minneapolis, MN 22.3* (0.9)
23.8 (0.7)
21.7**(0.7)
22.5* (0.9)
22.1* (1.1)
24.8 (1.5)
25.3 (1.4)
22.1 (0.9)
21.4 (0.7)
22.2 (0.6)
22.3 (0.8)
22.0 (1.0)
24.5* (1.1)
21.9 (0.9)
New York, NY 22.0 (0.4)
21.3 (0.5)
20.5 (0.5)
20.8 (0.6)
23.7 (1.1)
21.9 (0.8)
21.5 (0.9)
22.7 (1.7)
23.7 (1.6)
20.9 (1.2)
20.6 (1.5)
27.4 (1.9)
23.3 (1.6)
24.2 (2.0)
Portland, OR 24.3 (0.5)
24.3 (0.5)
22.9* (0.5)
22.3**(0.6)
24.0 (0.8)
24.1 (0.8)
25.0 (0.9)
20.7** (0.4)
21.4 (0.4)
21.0* (0.4)
20.5**(0.5)
21.6 (0.6)
21.6 (0.6)
22.4 (0.7)
Sacramento, CA 22.1 (0.7)
23.6 (0.6)
23.7 (0.7)
23.2 (0.8)
23.7 (1.0)
23.3 (1.2)
22.7 (1.1)
20.5 (0.4)
20.6 (0.4)
20.9 (0.4)
21.0 (0.4)
21.3 (0.5)
21.4 (0.6)
21.5 (0.6)
Washington, DC 22.2 (3.0)
23.0 (2.6)
21.6 (2.1)
33.5 (4.2)
26.5 (4.1)
24.8 (5.5)
24.8 (3.9)
20.4 (3.5)
37.9***(4.2)
18.3 (4.9)
Notes:
Numbers shown in parentheses ( ) represent the standard error of the estimate presented. Differences between each year and 2009 are reported as significant at the 0.10 level (*), 0.05 level (**), or 0.01 level (***). Empty cells indicate years in which the site did not collect data.
† Data from 2000-2003 were re-estimated using the methodology utilized in 2007-2009 for ADAM II. Consequently these estimates may differ somewhat from those previously published under the original ADAM program.
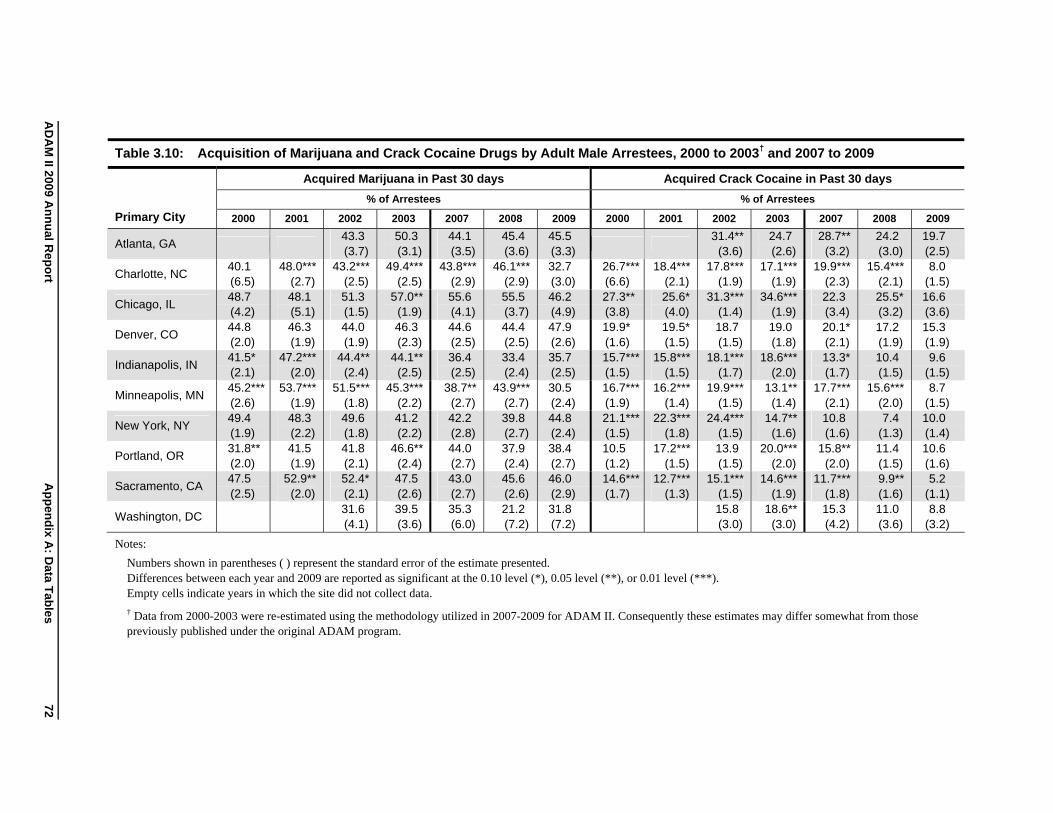
AD
AM
II 2009 An
nu
al Rep
ort
Ap
pen
dix A
: Data T
ables
Table 3.10: Acquisition of Marijuana and Crack Cocaine Drugs by Adult Male Arrestees, 2000 to 2003† and 2007 to 2009
Primary City
Acquired Marijuana in Past 30 days Acquired Crack Cocaine in Past 30 days
% of Arrestees % of Arrestees
2000 2001 2002 2003 2007 2008 2009 2000 2001 2002 2003 2007 2008 2009
Atlanta, GA 43.3 (3.7)
50.3 (3.1)
44.1 (3.5)
45.4 (3.6)
45.5 (3.3)
31.4** (3.6)
24.7 (2.6)
28.7** (3.2)
24.2 (3.0)
19.7 (2.5)
Charlotte, NC 40.1 (6.5)
48.0*** (2.7)
43.2*** (2.5)
49.4*** (2.5)
43.8*** (2.9)
46.1*** (2.9)
32.7 (3.0)
26.7*** (6.6)
18.4*** (2.1)
17.8*** (1.9)
17.1*** (1.9)
19.9*** (2.3)
15.4*** (2.1)
8.0 (1.5)
Chicago, IL 48.7 (4.2)
48.1 (5.1)
51.3 (1.5)
57.0** (1.9)
55.6 (4.1)
55.5 (3.7)
46.2 (4.9)
27.3** (3.8)
25.6* (4.0)
31.3*** (1.4)
34.6*** (1.9)
22.3 (3.4)
25.5* (3.2)
16.6 (3.6)
Denver, CO
Indianapolis, IN
44.8 (2.0) 41.5* (2.1)
46.3 (1.9)
47.2*** (2.0)
44.0 (1.9)
44.4** (2.4)
46.3 (2.3)
44.1** (2.5)
44.6 (2.5) 36.4 (2.5)
44.4 (2.5) 33.4 (2.4)
47.9 (2.6) 35.7 (2.5)
19.9* (1.6) 15.7*** (1.5)
19.5* (1.5)
15.8*** (1.5)
18.7 (1.5)
18.1*** (1.7)
19.0 (1.8)
18.6*** (2.0)
20.1* (2.1) 13.3* (1.7)
17.2 (1.9) 10.4 (1.5)
15.3 (1.9) 9.6
(1.5)
Minneapolis, MN 45.2*** (2.6)
53.7*** (1.9)
51.5*** (1.8)
45.3*** (2.2)
38.7** (2.7)
43.9*** (2.7)
30.5 (2.4)
16.7*** (1.9)
16.2*** (1.4)
19.9*** (1.5)
13.1** (1.4)
17.7*** (2.1)
15.6*** (2.0)
8.7 (1.5)
New York, NY 49.4 (1.9)
48.3 (2.2)
49.6 (1.8)
41.2 (2.2)
42.2 (2.8)
39.8 (2.7)
44.8 (2.4)
21.1*** (1.5)
22.3*** (1.8)
24.4*** (1.5)
14.7** (1.6)
10.8 (1.6)
7.4 (1.3)
10.0 (1.4)
Portland, OR
Sacramento, CA
31.8** (2.0) 47.5 (2.5)
41.5 (1.9)
52.9** (2.0)
41.8 (2.1) 52.4* (2.1)
46.6** (2.4) 47.5 (2.6)
44.0 (2.7) 43.0 (2.7)
37.9 (2.4) 45.6 (2.6)
38.4 (2.7) 46.0 (2.9)
10.5 (1.2) 14.6*** (1.7)
17.2*** (1.5)
12.7*** (1.3)
13.9 (1.5)
15.1*** (1.5)
20.0*** (2.0)
14.6*** (1.9)
15.8** (2.0)
11.7*** (1.8)
11.4 (1.5) 9.9** (1.6)
10.6 (1.6) 5.2
(1.1)
Washington, DC 31.6 (4.1)
39.5 (3.6)
35.3 (6.0)
21.2 (7.2)
31.8 (7.2)
15.8 (3.0)
18.6** (3.0)
15.3 (4.2)
11.0 (3.6)
8.8 (3.2)
Notes:
Numbers shown in parentheses ( ) represent the standard error of the estimate presented. Differences between each year and 2009 are reported as significant at the 0.10 level (*), 0.05 level (**), or 0.01 level (***). Empty cells indicate years in which the site did not collect data.
† Data from 2000-2003 were re-estimated using the methodology utilized in 2007-2009 for ADAM II. Consequently these estimates may differ somewhat from those previously published under the original ADAM program.
72
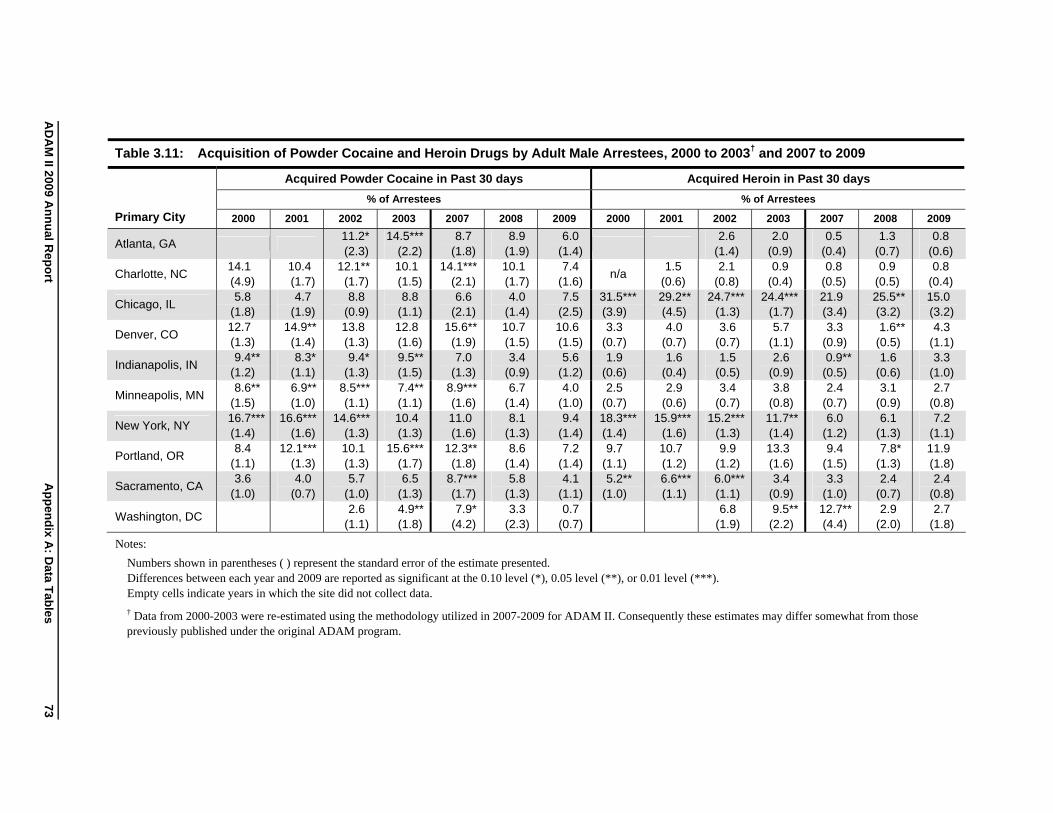
AD
AM
II 2009 An
nu
al Rep
ort
Ap
pen
dix A
: Data T
ables
Table 3.11: Acquisition of Powder Cocaine and Heroin Drugs by Adult Male Arrestees, 2000 to 2003† and 2007 to 2009
Primary City
Acquired Powder Cocaine in Past 30 days Acquired Heroin in Past 30 days
% of Arrestees % of Arrestees
2000 2001 2002 2003 2007 2008 2009 2000 2001 2002 2003 2007 2008 2009
Atlanta, GA 11.2* (2.3)
14.5*** (2.2)
8.7 (1.8)
8.9 (1.9)
6.0 (1.4)
2.6 (1.4)
2.0 (0.9)
0.5 (0.4)
1.3 (0.7)
0.8 (0.6)
Charlotte, NC 14.1 (4.9)
10.4 (1.7)
12.1** (1.7)
10.1 (1.5)
14.1*** (2.1)
10.1 (1.7)
7.4 (1.6)
n/a 1.5
(0.6) 2.1
(0.8) 0.9
(0.4) 0.8
(0.5) 0.9
(0.5) 0.8
(0.4)
Chicago, IL 5.8
(1.8) 4.7
(1.9) 8.8
(0.9) 8.8
(1.1) 6.6
(2.1) 4.0
(1.4) 7.5
(2.5) 31.5*** (3.9)
29.2** (4.5)
24.7*** (1.3)
24.4*** (1.7)
21.9 (3.4)
25.5** (3.2)
15.0 (3.2)
Denver, CO
Indianapolis, IN
12.7 (1.3) 9.4**
(1.2)
14.9** (1.4) 8.3*
(1.1)
13.8 (1.3) 9.4*
(1.3)
12.8 (1.6) 9.5** (1.5)
15.6** (1.9) 7.0
(1.3)
10.7 (1.5) 3.4
(0.9)
10.6 (1.5) 5.6
(1.2)
3.3 (0.7) 1.9
(0.6)
4.0 (0.7) 1.6
(0.4)
3.6 (0.7) 1.5
(0.5)
5.7 (1.1) 2.6
(0.9)
3.3 (0.9) 0.9**
(0.5)
1.6** (0.5) 1.6
(0.6)
4.3 (1.1) 3.3
(1.0)
Minneapolis, MN 8.6**
(1.5) 6.9** (1.0)
8.5*** (1.1)
7.4** (1.1)
8.9*** (1.6)
6.7 (1.4)
4.0 (1.0)
2.5 (0.7)
2.9 (0.6)
3.4 (0.7)
3.8 (0.8)
2.4 (0.7)
3.1 (0.9)
2.7 (0.8)
New York, NY 16.7*** (1.4)
16.6*** (1.6)
14.6*** (1.3)
10.4 (1.3)
11.0 (1.6)
8.1 (1.3)
9.4 (1.4)
18.3*** (1.4)
15.9*** (1.6)
15.2*** (1.3)
11.7** (1.4)
6.0 (1.2)
6.1 (1.3)
7.2 (1.1)
Portland, OR
Sacramento, CA
8.4 (1.1) 3.6
(1.0)
12.1*** (1.3) 4.0
(0.7)
10.1 (1.3) 5.7
(1.0)
15.6*** (1.7) 6.5
(1.3)
12.3** (1.8)
8.7*** (1.7)
8.6 (1.4) 5.8
(1.3)
7.2 (1.4) 4.1
(1.1)
9.7 (1.1) 5.2**
(1.0)
10.7 (1.2) 6.6*** (1.1)
9.9 (1.2) 6.0*** (1.1)
13.3 (1.6) 3.4
(0.9)
9.4 (1.5) 3.3
(1.0)
7.8* (1.3) 2.4
(0.7)
11.9 (1.8) 2.4
(0.8)
Washington, DC 2.6
(1.1) 4.9** (1.8)
7.9* (4.2)
3.3 (2.3)
0.7 (0.7)
6.8 (1.9)
9.5** (2.2)
12.7** (4.4)
2.9 (2.0)
2.7 (1.8)
Notes:
Numbers shown in parentheses ( ) represent the standard error of the estimate presented. Differences between each year and 2009 are reported as significant at the 0.10 level (*), 0.05 level (**), or 0.01 level (***). Empty cells indicate years in which the site did not collect data.
† Data from 2000-2003 were re-estimated using the methodology utilized in 2007-2009 for ADAM II. Consequently these estimates may differ somewhat from those previously published under the original ADAM program.
73
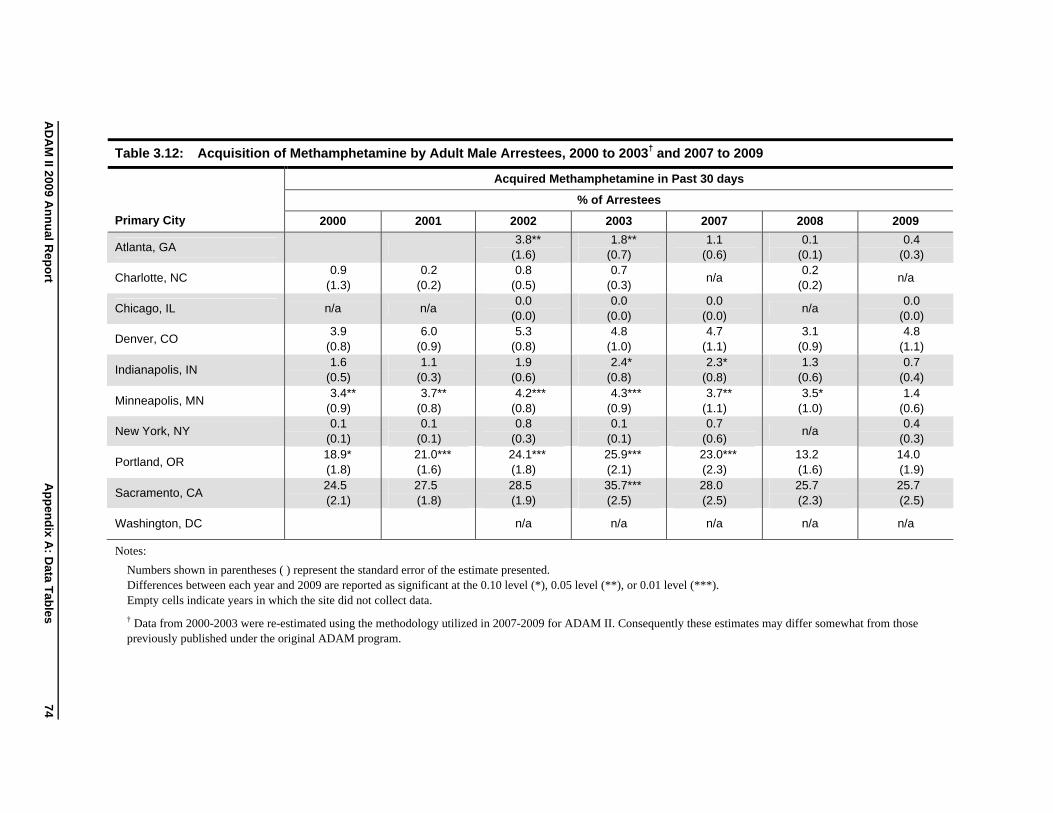
AD
AM
II 2009 An
nu
al Rep
ort
Ap
pen
dix A
: Data T
ables
Table 3.12: Acquisition of Methamphetamine by Adult Male Arrestees, 2000 to 2003† and 2007 to 2009
Primary City
Acquired Methamphetamine in Past 30 days
% of Arrestees
2000 2001 2002 2003 2007 2008 2009
Atlanta, GA
Charlotte, NC
Chicago, IL
Denver, CO
Indianapolis, IN
0.9 (1.3)
n/a
3.9 (0.8) 1.6
(0.5)
0.2 (0.2)
n/a
6.0 (0.9) 1.1
(0.3)
3.8** (1.6) 0.8
(0.5) 0.0
(0.0) 5.3
(0.8) 1.9
(0.6)
1.8** (0.7) 0.7
(0.3) 0.0
(0.0) 4.8
(1.0) 2.4*
(0.8)
1.1 (0.6)
n/a
0.0 (0.0) 4.7
(1.1) 2.3*
(0.8)
0.1 (0.1) 0.2
(0.2)
n/a
3.1 (0.9) 1.3
(0.6)
0.4 (0.3)
n/a
0.0 (0.0) 4.8
(1.1) 0.7
(0.4)
Minneapolis, MN
New York, NY
3.4** (0.9) 0.1
(0.1)
3.7** (0.8) 0.1
(0.1)
4.2*** (0.8) 0.8
(0.3)
4.3*** (0.9) 0.1
(0.1)
3.7** (1.1) 0.7
(0.6)
3.5* (1.0)
n/a
1.4 (0.6) 0.4
(0.3)
Portland, OR
Sacramento, CA
18.9* (1.8) 24.5 (2.1)
21.0*** (1.6) 27.5 (1.8)
24.1*** (1.8) 28.5 (1.9)
25.9*** (2.1) 35.7*** (2.5)
23.0*** (2.3) 28.0 (2.5)
13.2 (1.6) 25.7 (2.3)
14.0 (1.9) 25.7 (2.5)
Washington, DC n/a n/a n/a n/a n/a
Notes:
Numbers shown in parentheses ( ) represent the standard error of the estimate presented. Differences between each year and 2009 are reported as significant at the 0.10 level (*), 0.05 level (**), or 0.01 level (***). Empty cells indicate years in which the site did not collect data.
† Data from 2000-2003 were re-estimated using the methodology utilized in 2007-2009 for ADAM II. Consequently these estimates may differ somewhat from those previously published under the original ADAM program.
74
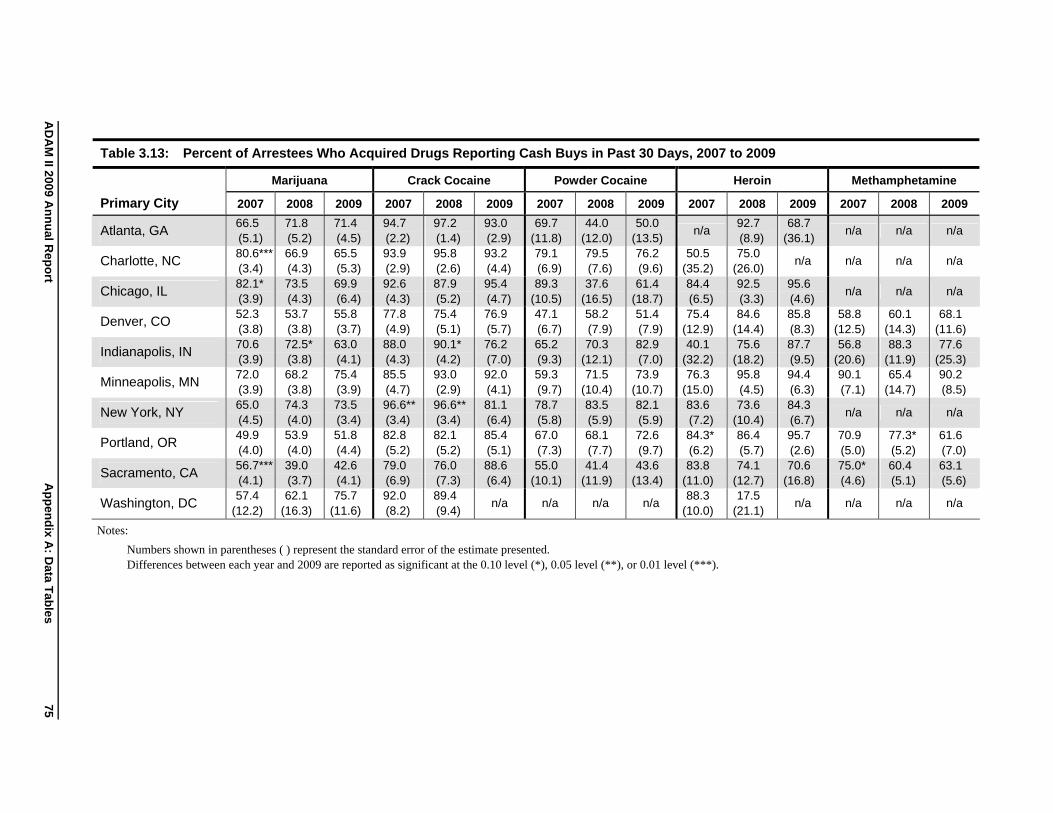
AD
AM
II 2009 An
nu
al Rep
ort
Ap
pen
dix A
: Data T
ables
Table 3.13: Percent of Arrestees Who Acquired Drugs Reporting Cash Buys in Past 30 Days, 2007 to 2009
Primary City
Marijuana Crack Cocaine Powder Cocaine Heroin Methamphetamine
2007 2008 2009 2007 2008 2009 2007 2008 2009 2007 2008 2009 2007 2008 2009
Atlanta, GA 66.5 (5.1)
71.8 (5.2)
71.4 (4.5)
94.7 (2.2)
97.2 (1.4)
93.0 (2.9)
69.7 (11.8)
44.0 (12.0)
50.0 (13.5)
n/a 92.7 (8.9)
68.7 (36.1)
n/a n/a n/a
Charlotte, NC 80.6*** (3.4)
66.9 (4.3)
65.5 (5.3)
93.9 (2.9)
95.8 (2.6)
93.2 (4.4)
79.1 (6.9)
79.5 (7.6)
76.2 (9.6)
50.5 (35.2)
75.0 (26.0)
n/a n/a n/a n/a
Chicago, IL
Denver, CO
Indianapolis, IN
82.1* (3.9) 52.3 (3.8) 70.6 (3.9)
73.5 (4.3) 53.7 (3.8) 72.5* (3.8)
69.9 (6.4) 55.8 (3.7) 63.0 (4.1)
92.6 (4.3) 77.8 (4.9) 88.0 (4.3)
87.9 (5.2) 75.4 (5.1) 90.1* (4.2)
95.4 (4.7) 76.9 (5.7) 76.2 (7.0)
89.3 (10.5) 47.1 (6.7) 65.2 (9.3)
37.6 (16.5) 58.2 (7.9) 70.3
(12.1)
61.4 (18.7) 51.4 (7.9) 82.9 (7.0)
84.4 (6.5) 75.4
(12.9) 40.1
(32.2)
92.5 (3.3) 84.6
(14.4) 75.6
(18.2)
95.6 (4.6) 85.8 (8.3) 87.7 (9.5)
n/a
58.8 (12.5) 56.8
(20.6)
n/a
60.1 (14.3) 88.3
(11.9)
n/a
68.1 (11.6) 77.6
(25.3)
Minneapolis, MN 72.0 (3.9)
68.2 (3.8)
75.4 (3.9)
85.5 (4.7)
93.0 (2.9)
92.0 (4.1)
59.3 (9.7)
71.5 (10.4)
73.9 (10.7)
76.3 (15.0)
95.8 (4.5)
94.4 (6.3)
90.1 (7.1)
65.4 (14.7)
90.2 (8.5)
New York, NY
Portland, OR
Sacramento, CA
65.0 (4.5) 49.9 (4.0) 56.7*** (4.1)
74.3 (4.0) 53.9 (4.0) 39.0 (3.7)
73.5 (3.4) 51.8 (4.4) 42.6 (4.1)
96.6** (3.4) 82.8 (5.2) 79.0 (6.9)
96.6** (3.4) 82.1 (5.2) 76.0 (7.3)
81.1 (6.4) 85.4 (5.1) 88.6 (6.4)
78.7 (5.8) 67.0 (7.3) 55.0
(10.1)
83.5 (5.9) 68.1 (7.7) 41.4
(11.9)
82.1 (5.9) 72.6 (9.7) 43.6
(13.4)
83.6 (7.2) 84.3* (6.2) 83.8
(11.0)
73.6 (10.4) 86.4 (5.7) 74.1
(12.7)
84.3 (6.7) 95.7 (2.6) 70.6
(16.8)
n/a
70.9 (5.0) 75.0* (4.6)
n/a
77.3* (5.2) 60.4 (5.1)
n/a
61.6 (7.0) 63.1 (5.6)
Washington, DC 57.4
(12.2) 62.1
(16.3) 75.7
(11.6) 92.0 (8.2)
89.4 (9.4)
n/a n/a n/a n/a 88.3
(10.0) 17.5
(21.1) n/a n/a n/a n/a
Notes:
Numbers shown in parentheses ( ) represent the standard error of the estimate presented.
Differences between each year and 2009 are reported as significant at the 0.10 level (*), 0.05 level (**), or 0.01 level (***).
75
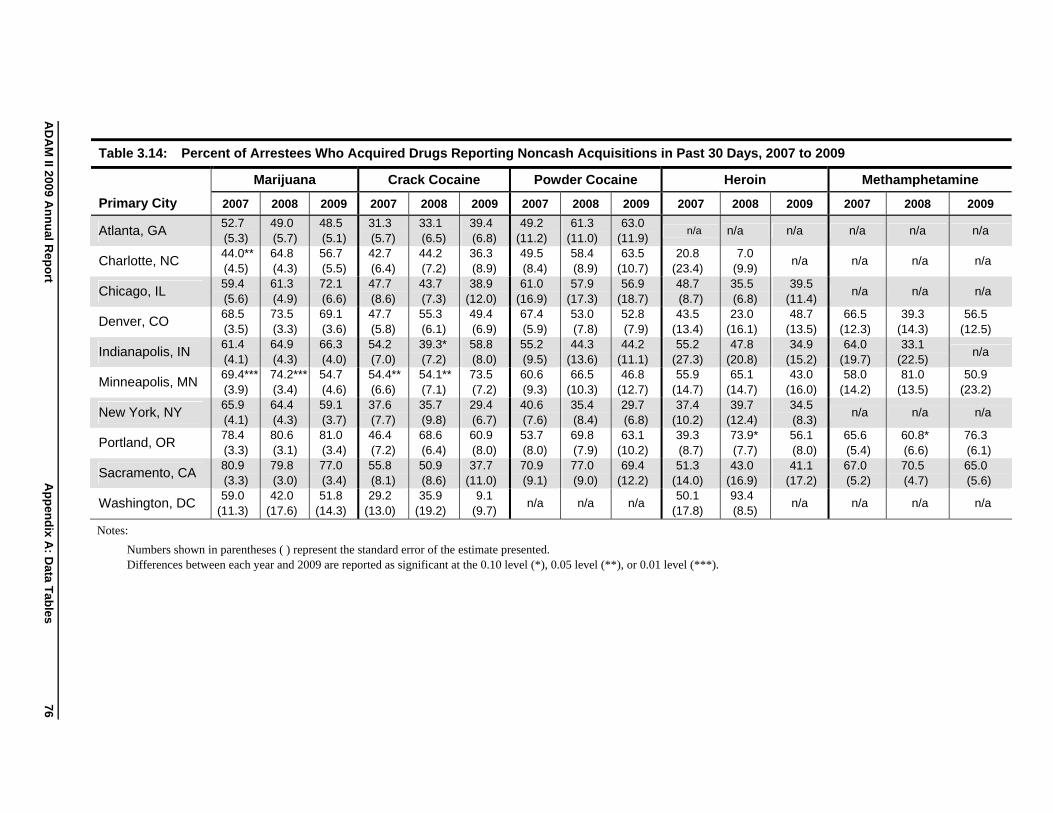
AD
AM
II 2009 An
nu
al Rep
ort
Ap
pen
dix A
: Data T
ables
Table 3.14: Percent of Arrestees Who Acquired Drugs Reporting Noncash Acquisitions in Past 30 Days, 2007 to 2009
Primary City
Marijuana Crack Cocaine Powder Cocaine Heroin Methamphetamine
2007 2008 2009 2007 2008 2009 2007 2008 2009 2007 2008 2009 2007 2008 2009
Atlanta, GA 52.7 (5.3)
49.0 (5.7)
48.5 (5.1)
31.3 (5.7)
33.1 (6.5)
39.4 (6.8)
49.2 (11.2)
61.3 (11.0)
63.0 (11.9)
n/a n/a n/a n/a n/a n/a
Charlotte, NC 44.0** (4.5)
64.8 (4.3)
56.7 (5.5)
42.7 (6.4)
44.2 (7.2)
36.3 (8.9)
49.5 (8.4)
58.4 (8.9)
63.5 (10.7)
20.8 (23.4)
7.0 (9.9)
n/a n/a n/a n/a
Chicago, IL
Denver, CO
Indianapolis, IN
59.4 (5.6) 68.5 (3.5) 61.4 (4.1)
61.3 (4.9) 73.5 (3.3) 64.9 (4.3)
72.1 (6.6) 69.1 (3.6) 66.3 (4.0)
47.7 (8.6) 47.7 (5.8) 54.2 (7.0)
43.7 (7.3) 55.3 (6.1) 39.3* (7.2)
38.9 (12.0) 49.4 (6.9) 58.8 (8.0)
61.0 (16.9) 67.4 (5.9) 55.2 (9.5)
57.9 (17.3) 53.0 (7.8) 44.3
(13.6)
56.9 (18.7) 52.8 (7.9) 44.2
(11.1)
48.7 (8.7) 43.5
(13.4) 55.2
(27.3)
35.5 (6.8) 23.0
(16.1) 47.8
(20.8)
39.5 (11.4) 48.7
(13.5) 34.9
(15.2)
n/a
66.5 (12.3) 64.0
(19.7)
n/a
39.3 (14.3) 33.1
(22.5)
n/a
56.5 (12.5)
n/a
Minneapolis, MN 69.4*** (3.9)
74.2*** (3.4)
54.7 (4.6)
54.4** (6.6)
54.1** (7.1)
73.5 (7.2)
60.6 (9.3)
66.5 (10.3)
46.8 (12.7)
55.9 (14.7)
65.1 (14.7)
43.0 (16.0)
58.0 (14.2)
81.0 (13.5)
50.9 (23.2)
New York, NY
Portland, OR
Sacramento, CA
65.9 (4.1) 78.4 (3.3) 80.9 (3.3)
64.4 (4.3) 80.6 (3.1) 79.8 (3.0)
59.1 (3.7) 81.0 (3.4) 77.0 (3.4)
37.6 (7.7) 46.4 (7.2) 55.8 (8.1)
35.7 (9.8) 68.6 (6.4) 50.9 (8.6)
29.4 (6.7) 60.9 (8.0) 37.7
(11.0)
40.6 (7.6) 53.7 (8.0) 70.9 (9.1)
35.4 (8.4) 69.8 (7.9) 77.0 (9.0)
29.7 (6.8) 63.1
(10.2) 69.4
(12.2)
37.4 (10.2) 39.3 (8.7) 51.3
(14.0)
39.7 (12.4) 73.9* (7.7) 43.0
(16.9)
34.5 (8.3) 56.1 (8.0) 41.1
(17.2)
n/a
65.6 (5.4) 67.0 (5.2)
n/a
60.8* (6.6) 70.5 (4.7)
n/a
76.3 (6.1) 65.0 (5.6)
Washington, DC 59.0
(11.3) 42.0
(17.6) 51.8
(14.3) 29.2
(13.0) 35.9
(19.2) 9.1
(9.7) n/a n/a n/a
50.1 (17.8)
93.4 (8.5)
n/a n/a n/a n/a
Notes:
Numbers shown in parentheses ( ) represent the standard error of the estimate presented.
Differences between each year and 2009 are reported as significant at the 0.10 level (*), 0.05 level (**), or 0.01 level (***).
76
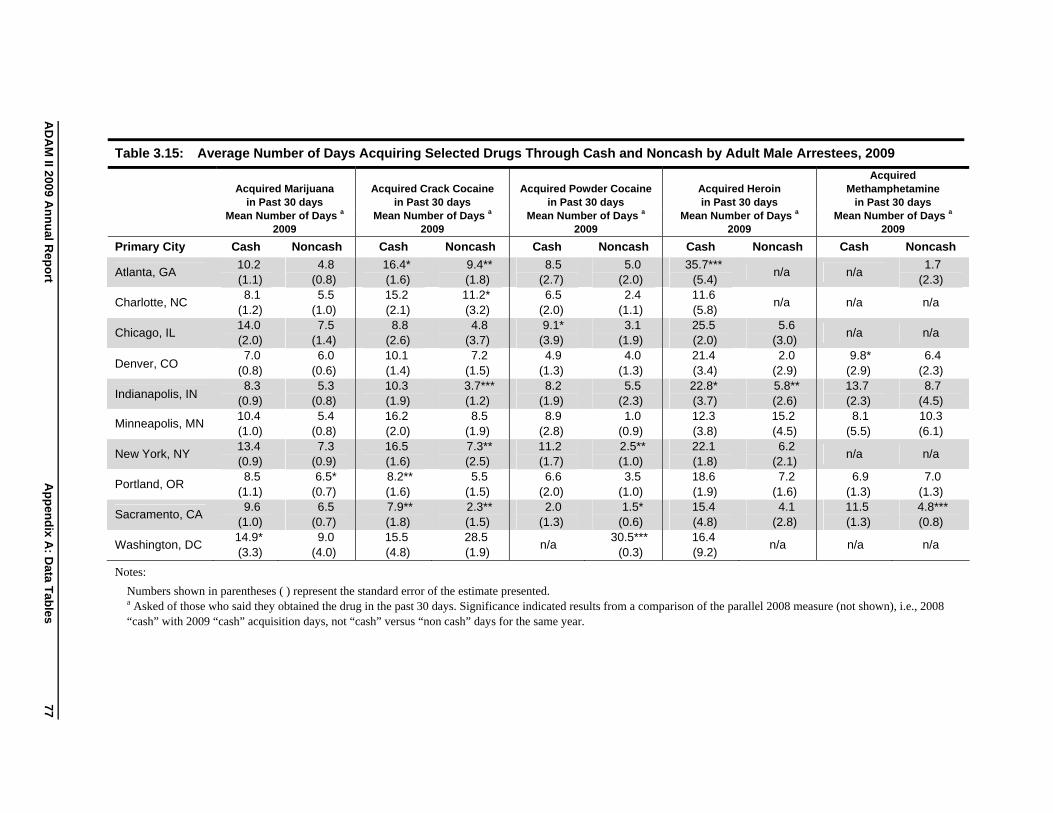
AD
AM
II 2009 An
nu
al Rep
ort
Ap
pen
dix A
: Data T
ables
Table 3.15: Average Number of Days Acquiring Selected Drugs Through Cash and Noncash by Adult Male Arrestees, 2009
Acquired Marijuana in Past 30 days
Mean Number of Days a
2009
Acquired Crack Cocaine in Past 30 days
Mean Number of Days a
2009
Acquired Powder Cocaine in Past 30 days
Mean Number of Days a
2009
Acquired Heroin in Past 30 days
Mean Number of Days a
2009
Acquired Methamphetamine
in Past 30 days Mean Number of Days a
2009
Primary City Cash Noncash Cash Noncash Cash Noncash Cash Noncash Cash Noncash
Atlanta, GA 10.2 (1.1)
4.8 (0.8)
16.4* (1.6)
9.4** (1.8)
8.5 (2.7)
5.0 (2.0)
35.7*** (5.4)
n/a n/a 1.7
(2.3)
Charlotte, NC 8.1
(1.2) 5.5
(1.0) 15.2 (2.1)
11.2* (3.2)
6.5 (2.0)
2.4 (1.1)
11.6 (5.8)
n/a n/a n/a
Chicago, IL 14.0 (2.0)
7.5 (1.4)
8.8 (2.6)
4.8 (3.7)
9.1* (3.9)
3.1 (1.9)
25.5 (2.0)
5.6 (3.0)
n/a n/a
Denver, CO 7.0
(0.8) 6.0
(0.6) 10.1 (1.4)
7.2 (1.5)
4.9 (1.3)
4.0 (1.3)
21.4 (3.4)
2.0 (2.9)
9.8* (2.9)
6.4 (2.3)
Indianapolis, IN 8.3
(0.9) 5.3
(0.8) 10.3 (1.9)
3.7*** (1.2)
8.2 (1.9)
5.5 (2.3)
22.8* (3.7)
5.8** (2.6)
13.7 (2.3)
8.7 (4.5)
Minneapolis, MN 10.4 (1.0)
5.4 (0.8)
16.2 (2.0)
8.5 (1.9)
8.9 (2.8)
1.0 (0.9)
12.3 (3.8)
15.2 (4.5)
8.1 (5.5)
10.3 (6.1)
New York, NY 13.4 (0.9)
7.3 (0.9)
16.5 (1.6)
7.3** (2.5)
11.2 (1.7)
2.5** (1.0)
22.1 (1.8)
6.2 (2.1)
n/a n/a
Portland, OR 8.5
(1.1) 6.5*
(0.7) 8.2** (1.6)
5.5 (1.5)
6.6 (2.0)
3.5 (1.0)
18.6 (1.9)
7.2 (1.6)
6.9 (1.3)
7.0 (1.3)
Sacramento, CA 9.6
(1.0) 6.5
(0.7) 7.9** (1.8)
2.3** (1.5)
2.0 (1.3)
1.5* (0.6)
15.4 (4.8)
4.1 (2.8)
11.5 (1.3)
4.8*** (0.8)
Washington, DC 14.9* (3.3)
9.0 (4.0)
15.5 (4.8)
28.5 (1.9)
n/a 30.5***
(0.3) 16.4 (9.2)
n/a n/a n/a
Notes:
Numbers shown in parentheses ( ) represent the standard error of the estimate presented.
a Asked of those who said they obtained the drug in the past 30 days. Significance indicated results from a comparison of the parallel 2008 measure (not shown), i.e., 2008
“cash” with 2009 “cash” acquisition days, not “cash” versus “non cash” days for the same year.
77
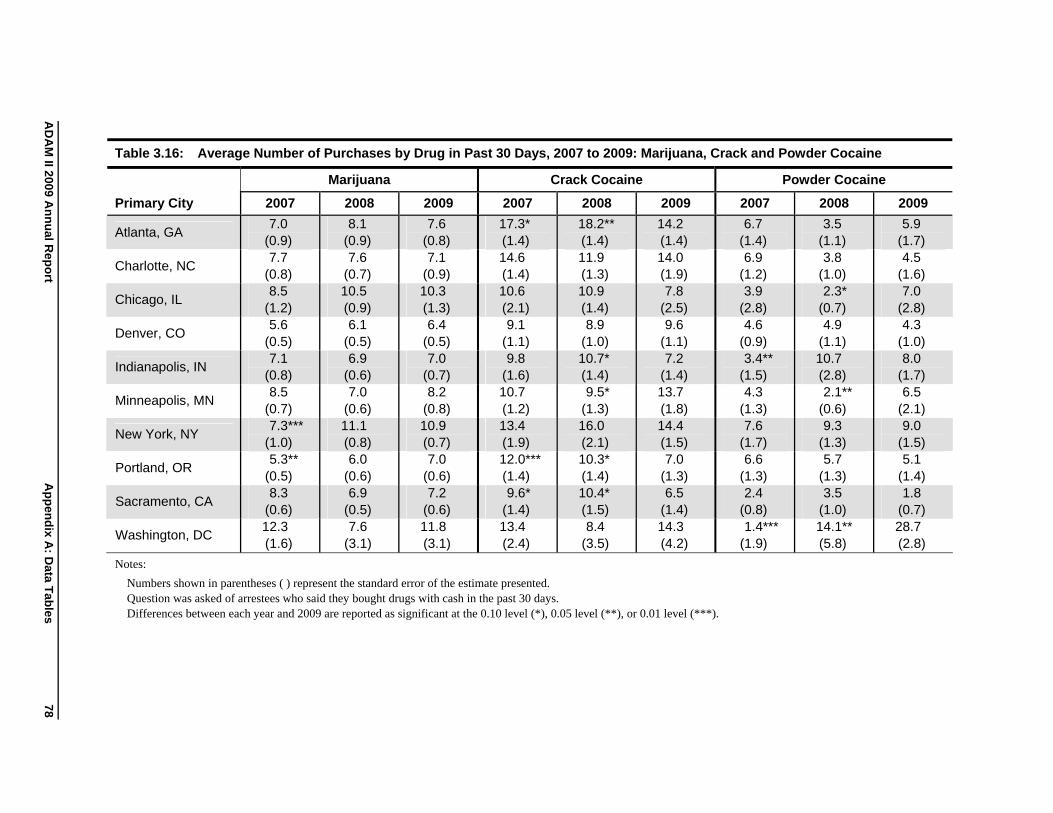
AD
AM
II 2009 An
nu
al Rep
ort
Ap
pen
dix A
: Data T
ables
Table 3.16: Average Number of Purchases by Drug in Past 30 Days, 2007 to 2009: Marijuana, Crack and Powder Cocaine
Primary City
Marijuana Crack Cocaine Powder Cocaine
2007 2008 2009 2007 2008 2009 2007 2008 2009
Atlanta, GA 7.0
(0.9) 8.1
(0.9) 7.6
(0.8) 17.3* (1.4)
18.2** (1.4)
14.2 (1.4)
6.7 (1.4)
3.5 (1.1)
5.9 (1.7)
Charlotte, NC
Chicago, IL
7.7 (0.8) 8.5
(1.2)
7.6 (0.7) 10.5 (0.9)
7.1 (0.9) 10.3 (1.3)
14.6 (1.4) 10.6 (2.1)
11.9 (1.3) 10.9 (1.4)
14.0 (1.9) 7.8
(2.5)
6.9 (1.2) 3.9
(2.8)
3.8 (1.0) 2.3*
(0.7)
4.5 (1.6) 7.0
(2.8)
Denver, CO
Indianapolis, IN
5.6 (0.5) 7.1
(0.8)
6.1 (0.5) 6.9
(0.6)
6.4 (0.5) 7.0
(0.7)
9.1 (1.1) 9.8
(1.6)
8.9 (1.0) 10.7* (1.4)
9.6 (1.1) 7.2
(1.4)
4.6 (0.9) 3.4**
(1.5)
4.9 (1.1) 10.7 (2.8)
4.3 (1.0) 8.0
(1.7)
Minneapolis, MN
New York, NY
8.5 (0.7) 7.3***
(1.0)
7.0 (0.6) 11.1 (0.8)
8.2 (0.8) 10.9 (0.7)
10.7 (1.2) 13.4 (1.9)
9.5* (1.3) 16.0 (2.1)
13.7 (1.8) 14.4 (1.5)
4.3 (1.3) 7.6
(1.7)
2.1** (0.6) 9.3
(1.3)
6.5 (2.1) 9.0
(1.5)
Portland, OR
Sacramento, CA
5.3** (0.5) 8.3
(0.6)
6.0 (0.6) 6.9
(0.5)
7.0 (0.6) 7.2
(0.6)
12.0*** (1.4) 9.6*
(1.4)
10.3* (1.4) 10.4* (1.5)
7.0 (1.3) 6.5
(1.4)
6.6 (1.3) 2.4
(0.8)
5.7 (1.3) 3.5
(1.0)
5.1 (1.4) 1.8
(0.7)
Washington, DC 12.3 (1.6)
7.6 (3.1)
11.8 (3.1)
13.4 (2.4)
8.4 (3.5)
14.3 (4.2)
1.4*** (1.9)
14.1** (5.8)
28.7 (2.8)
Notes:
Numbers shown in parentheses ( ) represent the standard error of the estimate presented.
Question was asked of arrestees who said they bought drugs with cash in the past 30 days.
Differences between each year and 2009 are reported as significant at the 0.10 level (*), 0.05 level (**), or 0.01 level (***).
78
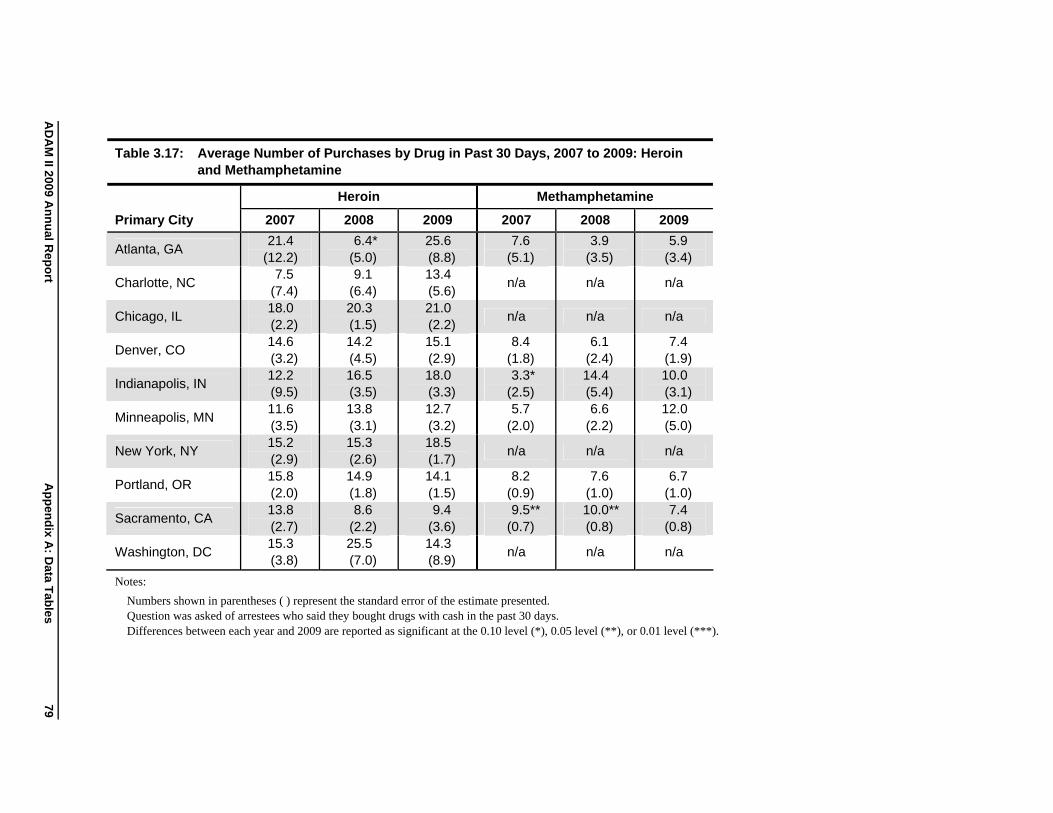
AD
AM
II 2009 An
nu
al Rep
ort
Ap
pen
dix A
: Data T
ables
79
Table 3.17: Average Number of Purchases by Drug in Past 30 Days, 2007 to 2009: Heroin and Methamphetamine
Heroin Methamphetamine
Primary City 2007 2008 2009 2007 2008 2009
Atlanta, GA 21.4
(12.2) 6.4*
(5.0) 25.6 (8.8)
7.6 (5.1)
3.9 (3.5)
5.9 (3.4)
Charlotte, NC 7.5
(7.4) 9.1
(6.4) 13.4 (5.6)
n/a n/a n/a
Chicago, IL 18.0 (2.2)
20.3 (1.5)
21.0 (2.2)
n/a n/a n/a
Denver, CO 14.6 (3.2)
14.2 (4.5)
15.1 (2.9)
8.4 (1.8)
6.1 (2.4)
7.4 (1.9)
Indianapolis, IN 12.2 (9.5)
16.5 (3.5)
18.0 (3.3)
3.3* (2.5)
14.4 (5.4)
10.0 (3.1)
Minneapolis, MN 11.6 (3.5)
13.8 (3.1)
12.7 (3.2)
5.7 (2.0)
6.6 (2.2)
12.0 (5.0)
New York, NY 15.2 (2.9)
15.3 (2.6)
18.5 (1.7)
n/a n/a n/a
Portland, OR 15.8 (2.0)
14.9 (1.8)
14.1 (1.5)
8.2 (0.9)
7.6 (1.0)
6.7 (1.0)
Sacramento, CA 13.8 (2.7)
8.6 (2.2)
9.4 (3.6)
9.5** (0.7)
10.0** (0.8)
7.4 (0.8)
Washington, DC 15.3 (3.8)
25.5 (7.0)
14.3 (8.9)
n/a n/a n/a
Notes:
Numbers shown in parentheses ( ) represent the standard error of the estimate presented. Question was asked of arrestees who said they bought drugs with cash in the past 30 days. Differences between each year and 2009 are reported as significant at the 0.10 level (*), 0.05 level (**), or 0.01 level (***).
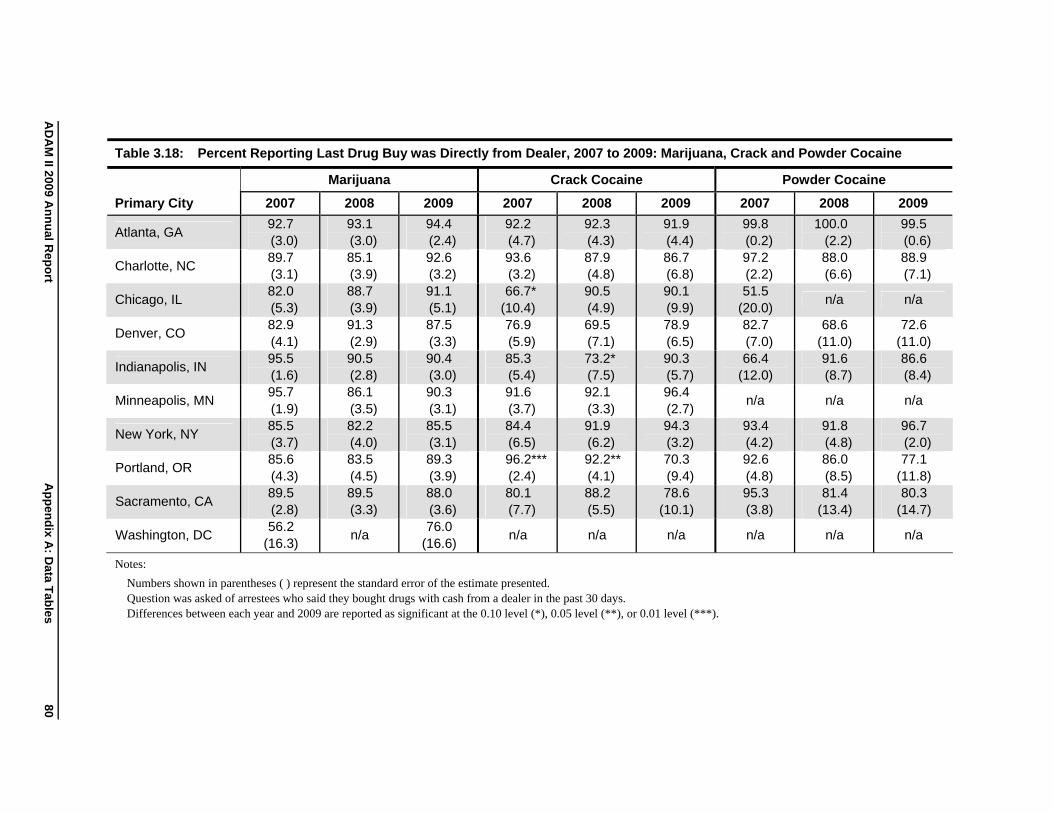
AD
AM
II 2009 An
nu
al Rep
ort
Ap
pen
dix A
: Data T
ables
Table 3.18: Percent Reporting Last Drug Buy was Directly from Dealer, 2007 to 2009: Marijuana, Crack and Powder Cocaine
Primary City
Marijuana Crack Cocaine Powder Cocaine
2007 2008 2009 2007 2008 2009 2007 2008 2009
Atlanta, GA 92.7 (3.0)
93.1 (3.0)
94.4 (2.4)
92.2 (4.7)
92.3 (4.3)
91.9 (4.4)
99.8 (0.2)
100.0 (2.2)
99.5 (0.6)
Charlotte, NC
Chicago, IL
89.7 (3.1) 82.0 (5.3)
85.1 (3.9) 88.7 (3.9)
92.6 (3.2) 91.1 (5.1)
93.6 (3.2) 66.7*
(10.4)
87.9 (4.8) 90.5 (4.9)
86.7 (6.8) 90.1 (9.9)
97.2 (2.2) 51.5
(20.0)
88.0 (6.6)
n/a
88.9 (7.1)
n/a
Denver, CO
Indianapolis, IN
82.9 (4.1) 95.5 (1.6)
91.3 (2.9) 90.5 (2.8)
87.5 (3.3) 90.4 (3.0)
76.9 (5.9) 85.3 (5.4)
69.5 (7.1) 73.2* (7.5)
78.9 (6.5) 90.3 (5.7)
82.7 (7.0) 66.4
(12.0)
68.6 (11.0) 91.6 (8.7)
72.6 (11.0) 86.6 (8.4)
Minneapolis, MN
New York, NY
95.7 (1.9) 85.5 (3.7)
86.1 (3.5) 82.2 (4.0)
90.3 (3.1) 85.5 (3.1)
91.6 (3.7) 84.4 (6.5)
92.1 (3.3) 91.9 (6.2)
96.4 (2.7) 94.3 (3.2)
n/a
93.4 (4.2)
n/a
91.8 (4.8)
n/a
96.7 (2.0)
Portland, OR
Sacramento, CA
85.6 (4.3) 89.5 (2.8)
83.5 (4.5) 89.5 (3.3)
89.3 (3.9) 88.0 (3.6)
96.2*** (2.4) 80.1 (7.7)
92.2** (4.1) 88.2 (5.5)
70.3 (9.4) 78.6
(10.1)
92.6 (4.8) 95.3 (3.8)
86.0 (8.5) 81.4
(13.4)
77.1 (11.8) 80.3
(14.7)
Washington, DC 56.2
(16.3) n/a
76.0 (16.6)
n/a n/a n/a n/a n/a n/a
Notes:
Numbers shown in parentheses ( ) represent the standard error of the estimate presented.
Question was asked of arrestees who said they bought drugs with cash from a dealer in the past 30 days.
Differences between each year and 2009 are reported as significant at the 0.10 level (*), 0.05 level (**), or 0.01 level (***).
80
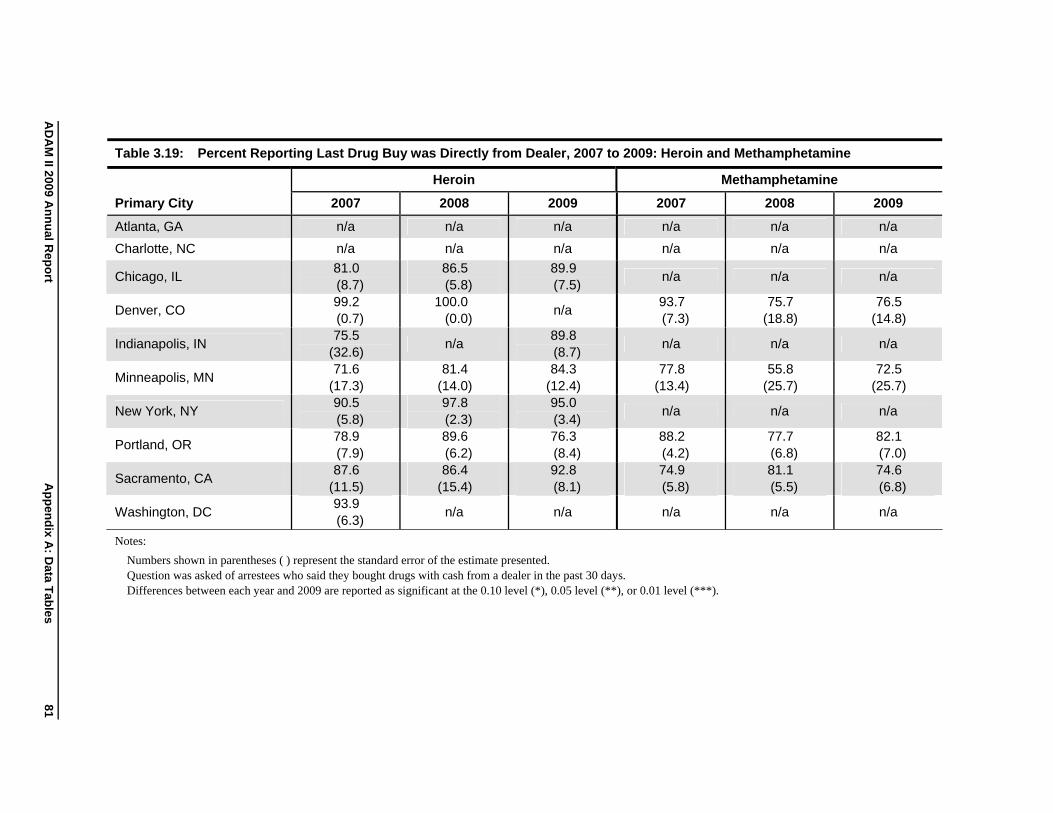
AD
AM
II 2009 An
nu
al Rep
ort
Ap
pen
dix A
: Data T
ables
81
Table 3.19: Percent Reporting Last Drug Buy was Directly from Dealer, 2007 to 2009: Heroin and Methamphetamine
Heroin Methamphetamine
Primary City 2007 2008 2009 2007 2008 2009
Atlanta, GA n/a n/a n/a n/a n/a n/a
Charlotte, NC n/a n/a n/a n/a n/a n/a
Chicago, IL 81.0 (8.7)
86.5 (5.8)
89.9 (7.5)
n/a n/a n/a
Denver, CO 99.2 (0.7)
100.0 (0.0)
n/a 93.7 (7.3)
75.7 (18.8)
76.5 (14.8)
Indianapolis, IN 75.5
(32.6) n/a
89.8 (8.7)
n/a n/a n/a
Minneapolis, MN 71.6
(17.3) 81.4
(14.0) 84.3
(12.4) 77.8
(13.4) 55.8
(25.7) 72.5
(25.7)
New York, NY 90.5 (5.8)
97.8 (2.3)
95.0 (3.4)
n/a n/a n/a
Portland, OR 78.9 (7.9)
89.6 (6.2)
76.3 (8.4)
88.2 (4.2)
77.7 (6.8)
82.1 (7.0)
Sacramento, CA 87.6
(11.5) 86.4
(15.4) 92.8 (8.1)
74.9 (5.8)
81.1 (5.5)
74.6 (6.8)
Washington, DC 93.9 (6.3)
n/a n/a n/a n/a n/a
Notes:
Numbers shown in parentheses ( ) represent the standard error of the estimate presented. Question was asked of arrestees who said they bought drugs with cash from a dealer in the past 30 days. Differences between each year and 2009 are reported as significant at the 0.10 level (*), 0.05 level (**), or 0.01 level (***).
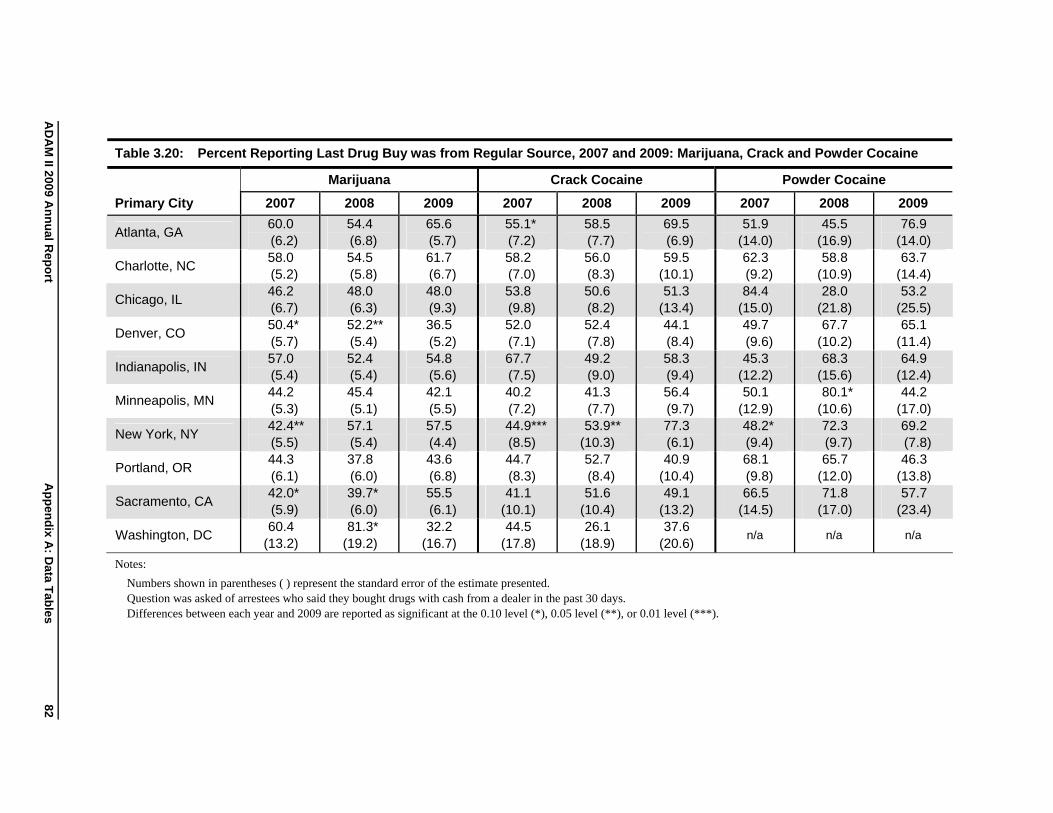
AD
AM
II 2009 An
nu
al Rep
ort
Ap
pen
dix A
: Data T
ables
Table 3.20: Percent Reporting Last Drug Buy was from Regular Source, 2007 and 2009: Marijuana, Crack and Powder Cocaine
Primary City
Marijuana Crack Cocaine Powder Cocaine
2007 2008 2009 2007 2008 2009 2007 2008 2009
Atlanta, GA 60.0 (6.2)
54.4 (6.8)
65.6 (5.7)
55.1* (7.2)
58.5 (7.7)
69.5 (6.9)
51.9 (14.0)
45.5 (16.9)
76.9 (14.0)
Charlotte, NC
Chicago, IL
58.0 (5.2) 46.2 (6.7)
54.5 (5.8) 48.0 (6.3)
61.7 (6.7) 48.0 (9.3)
58.2 (7.0) 53.8 (9.8)
56.0 (8.3) 50.6 (8.2)
59.5 (10.1) 51.3
(13.4)
62.3 (9.2) 84.4
(15.0)
58.8 (10.9) 28.0
(21.8)
63.7 (14.4) 53.2
(25.5)
Denver, CO
Indianapolis, IN
50.4* (5.7) 57.0 (5.4)
52.2** (5.4) 52.4 (5.4)
36.5 (5.2) 54.8 (5.6)
52.0 (7.1) 67.7 (7.5)
52.4 (7.8) 49.2 (9.0)
44.1 (8.4) 58.3 (9.4)
49.7 (9.6) 45.3
(12.2)
67.7 (10.2) 68.3
(15.6)
65.1 (11.4) 64.9
(12.4)
Minneapolis, MN
New York, NY
44.2 (5.3) 42.4** (5.5)
45.4 (5.1) 57.1 (5.4)
42.1 (5.5) 57.5 (4.4)
40.2 (7.2) 44.9*** (8.5)
41.3 (7.7) 53.9**
(10.3)
56.4 (9.7) 77.3 (6.1)
50.1 (12.9) 48.2* (9.4)
80.1* (10.6) 72.3 (9.7)
44.2 (17.0) 69.2 (7.8)
Portland, OR
Sacramento, CA
44.3 (6.1) 42.0* (5.9)
37.8 (6.0) 39.7* (6.0)
43.6 (6.8) 55.5 (6.1)
44.7 (8.3) 41.1
(10.1)
52.7 (8.4) 51.6
(10.4)
40.9 (10.4) 49.1
(13.2)
68.1 (9.8) 66.5
(14.5)
65.7 (12.0) 71.8
(17.0)
46.3 (13.8) 57.7
(23.4)
Washington, DC 60.4
(13.2) 81.3*
(19.2) 32.2
(16.7) 44.5
(17.8) 26.1
(18.9) 37.6
(20.6) n/a n/a n/a
Notes:
Numbers shown in parentheses ( ) represent the standard error of the estimate presented.
Question was asked of arrestees who said they bought drugs with cash from a dealer in the past 30 days.
Differences between each year and 2009 are reported as significant at the 0.10 level (*), 0.05 level (**), or 0.01 level (***).
82
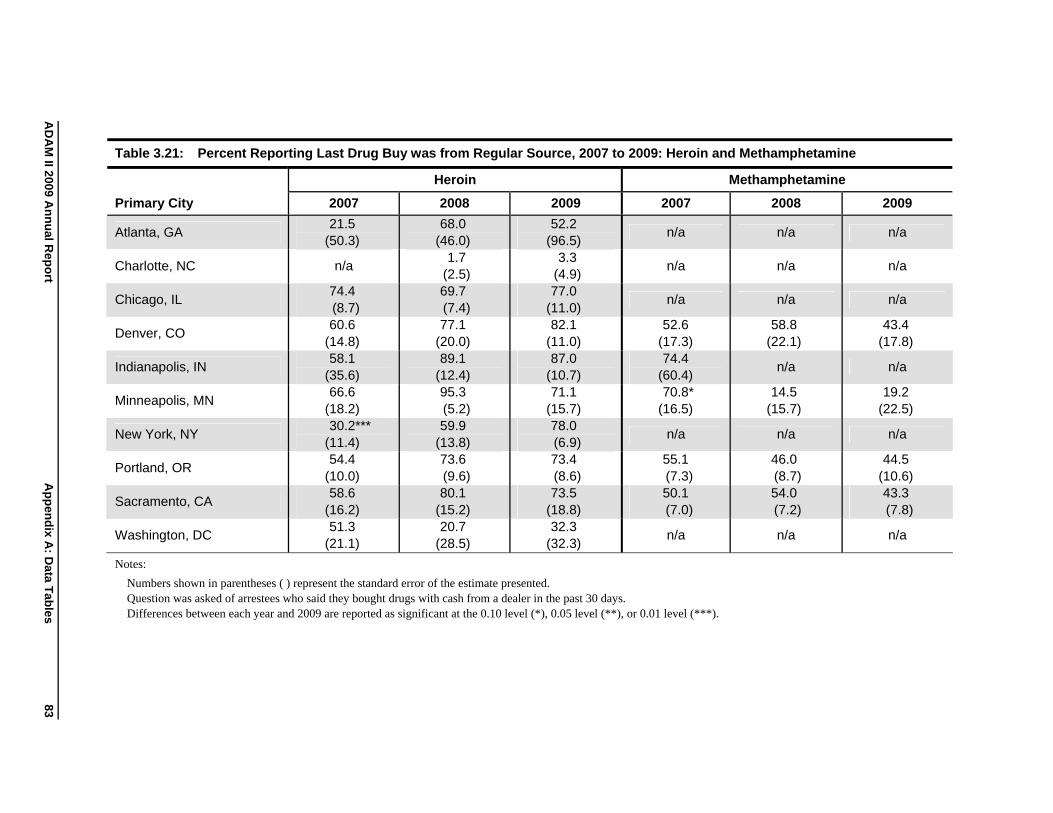
AD
AM
II 2009 An
nu
al Rep
ort
Ap
pen
dix A
: Data T
ables
83
Table 3.21: Percent Reporting Last Drug Buy was from Regular Source, 2007 to 2009: Heroin and Methamphetamine
Heroin Methamphetamine
Primary City 2007 2008 2009 2007 2008 2009
Atlanta, GA 21.5
(50.3) 68.0
(46.0) 52.2
(96.5) n/a n/a n/a
Charlotte, NC n/a 1.7
(2.5) 3.3
(4.9) n/a n/a n/a
Chicago, IL 74.4 (8.7)
69.7 (7.4)
77.0 (11.0)
n/a n/a n/a
Denver, CO 60.6
(14.8) 77.1
(20.0) 82.1
(11.0) 52.6
(17.3) 58.8
(22.1) 43.4
(17.8)
Indianapolis, IN 58.1
(35.6) 89.1
(12.4) 87.0
(10.7) 74.4
(60.4) n/a n/a
Minneapolis, MN 66.6
(18.2) 95.3 (5.2)
71.1 (15.7)
70.8* (16.5)
14.5 (15.7)
19.2 (22.5)
New York, NY 30.2***
(11.4) 59.9
(13.8) 78.0 (6.9)
n/a n/a n/a
Portland, OR 54.4
(10.0) 73.6 (9.6)
73.4 (8.6)
55.1 (7.3)
46.0 (8.7)
44.5 (10.6)
Sacramento, CA 58.6
(16.2) 80.1
(15.2) 73.5
(18.8) 50.1 (7.0)
54.0 (7.2)
43.3 (7.8)
Washington, DC 51.3
(21.1) 20.7
(28.5) 32.3
(32.3) n/a n/a n/a
Notes:
Numbers shown in parentheses ( ) represent the standard error of the estimate presented. Question was asked of arrestees who said they bought drugs with cash from a dealer in the past 30 days. Differences between each year and 2009 are reported as significant at the 0.10 level (*), 0.05 level (**), or 0.01 level (***).
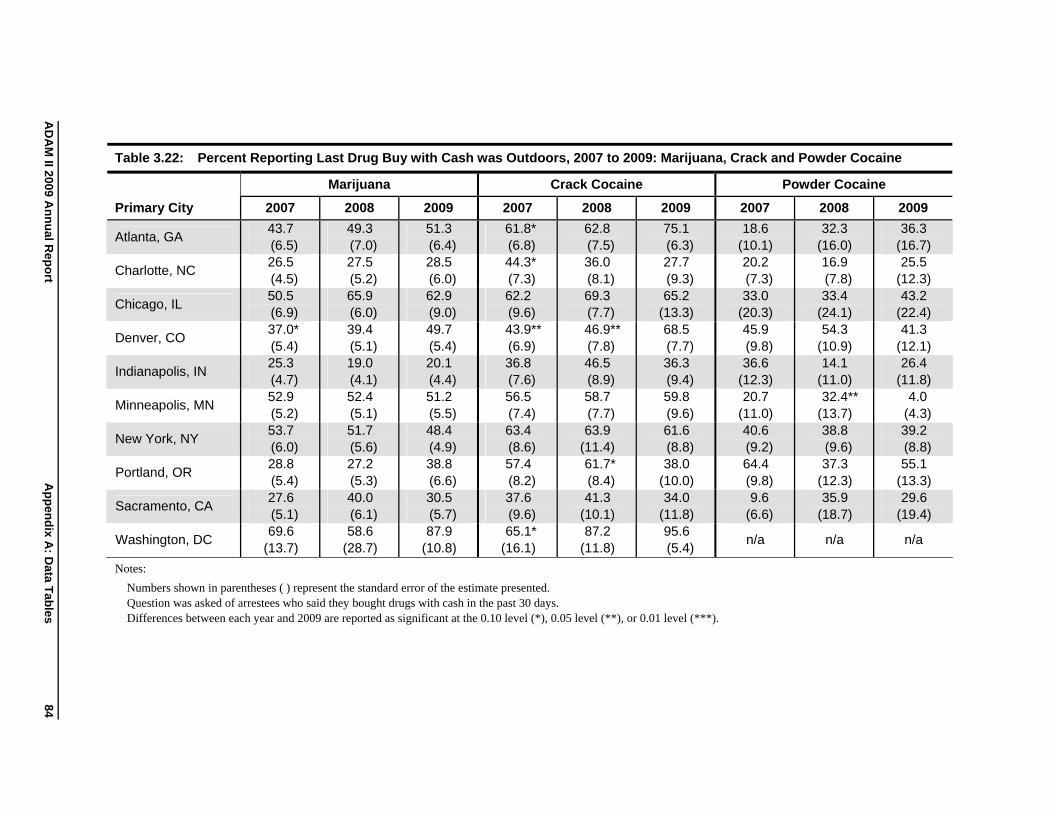
AD
AM
II 2009 An
nu
al Rep
ort
Ap
pen
dix A
: Data T
ables
Table 3.22: Percent Reporting Last Drug Buy with Cash was Outdoors, 2007 to 2009: Marijuana, Crack and Powder Cocaine
Primary City
Marijuana Crack Cocaine Powder Cocaine
2007 2008 2009 2007 2008 2009 2007 2008 2009
Atlanta, GA 43.7 (6.5)
49.3 (7.0)
51.3 (6.4)
61.8* (6.8)
62.8 (7.5)
75.1 (6.3)
18.6 (10.1)
32.3 (16.0)
36.3 (16.7)
Charlotte, NC
Chicago, IL
26.5 (4.5) 50.5 (6.9)
27.5 (5.2) 65.9 (6.0)
28.5 (6.0) 62.9 (9.0)
44.3* (7.3) 62.2 (9.6)
36.0 (8.1) 69.3 (7.7)
27.7 (9.3) 65.2
(13.3)
20.2 (7.3) 33.0
(20.3)
16.9 (7.8) 33.4
(24.1)
25.5 (12.3) 43.2
(22.4)
Denver, CO
Indianapolis, IN
37.0* (5.4) 25.3 (4.7)
39.4 (5.1) 19.0 (4.1)
49.7 (5.4) 20.1 (4.4)
43.9** (6.9) 36.8 (7.6)
46.9** (7.8) 46.5 (8.9)
68.5 (7.7) 36.3 (9.4)
45.9 (9.8) 36.6
(12.3)
54.3 (10.9) 14.1
(11.0)
41.3 (12.1) 26.4
(11.8)
Minneapolis, MN
New York, NY
52.9 (5.2) 53.7 (6.0)
52.4 (5.1) 51.7 (5.6)
51.2 (5.5) 48.4 (4.9)
56.5 (7.4) 63.4 (8.6)
58.7 (7.7) 63.9
(11.4)
59.8 (9.6) 61.6 (8.8)
20.7 (11.0) 40.6 (9.2)
32.4** (13.7) 38.8 (9.6)
4.0 (4.3) 39.2 (8.8)
Portland, OR
Sacramento, CA
28.8 (5.4) 27.6 (5.1)
27.2 (5.3) 40.0 (6.1)
38.8 (6.6) 30.5 (5.7)
57.4 (8.2) 37.6 (9.6)
61.7* (8.4) 41.3
(10.1)
38.0 (10.0) 34.0
(11.8)
64.4 (9.8) 9.6
(6.6)
37.3 (12.3) 35.9
(18.7)
55.1 (13.3) 29.6
(19.4)
Washington, DC 69.6
(13.7) 58.6
(28.7) 87.9
(10.8) 65.1*
(16.1) 87.2
(11.8) 95.6 (5.4)
n/a n/a n/a
Notes:
Numbers shown in parentheses ( ) represent the standard error of the estimate presented.
Question was asked of arrestees who said they bought drugs with cash in the past 30 days.
Differences between each year and 2009 are reported as significant at the 0.10 level (*), 0.05 level (**), or 0.01 level (***).
84
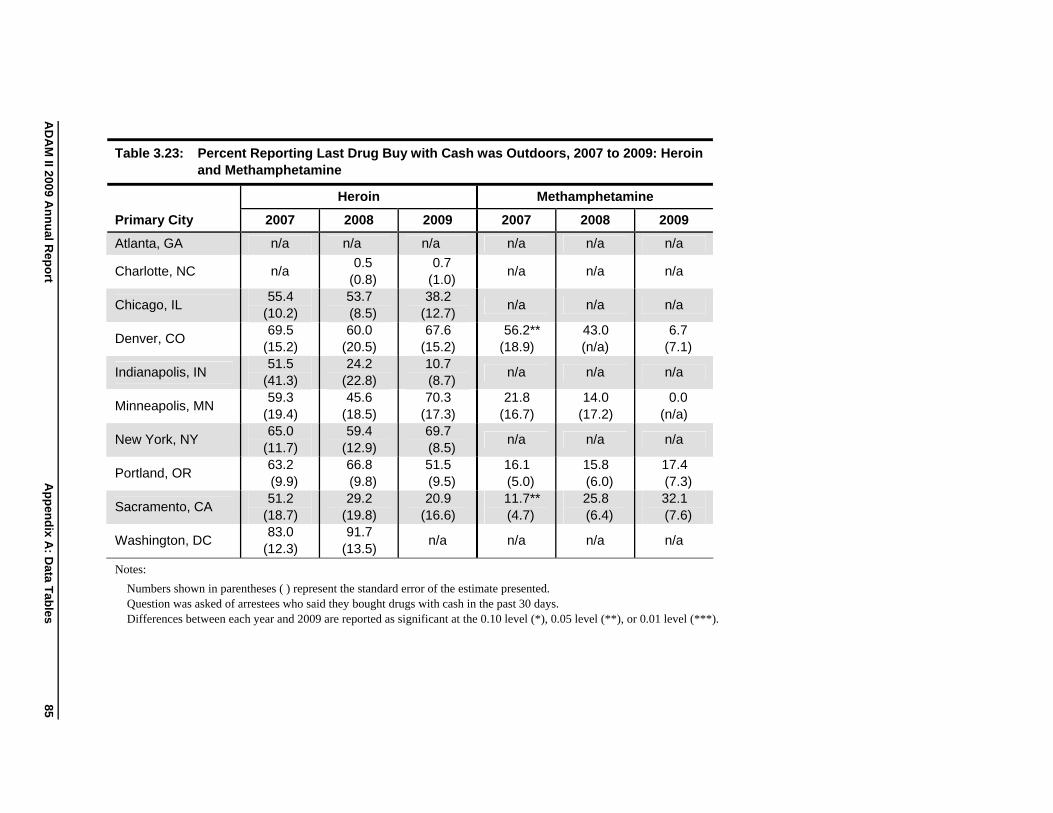
AD
AM
II 2009 An
nu
al Rep
ort
Ap
pen
dix A
: Data T
ables
85
Table 3.23: Percent Reporting Last Drug Buy with Cash was Outdoors, 2007 to 2009: Heroin and Methamphetamine
Heroin Methamphetamine
Primary City 2007 2008 2009 2007 2008 2009
Atlanta, GA n/a n/a n/a n/a n/a n/a
Charlotte, NC n/a 0.5
(0.8) 0.7
(1.0) n/a n/a n/a
Chicago, IL 55.4
(10.2) 53.7 (8.5)
38.2 (12.7)
n/a n/a n/a
Denver, CO 69.5
(15.2) 60.0
(20.5) 67.6
(15.2) 56.2**
(18.9) 43.0 (n/a)
6.7 (7.1)
Indianapolis, IN 51.5
(41.3) 24.2
(22.8) 10.7 (8.7)
n/a n/a n/a
Minneapolis, MN 59.3
(19.4) 45.6
(18.5) 70.3
(17.3) 21.8
(16.7) 14.0
(17.2) 0.0
(n/a)
New York, NY 65.0
(11.7) 59.4
(12.9) 69.7 (8.5)
n/a n/a n/a
Portland, OR 63.2 (9.9)
66.8 (9.8)
51.5 (9.5)
16.1 (5.0)
15.8 (6.0)
17.4 (7.3)
Sacramento, CA 51.2
(18.7) 29.2
(19.8) 20.9
(16.6) 11.7** (4.7)
25.8 (6.4)
32.1 (7.6)
Washington, DC 83.0
(12.3) 91.7
(13.5) n/a n/a n/a n/a
Notes:
Numbers shown in parentheses ( ) represent the standard error of the estimate presented. Question was asked of arrestees who said they bought drugs with cash in the past 30 days. Differences between each year and 2009 are reported as significant at the 0.10 level (*), 0.05 level (**), or 0.01 level (***).
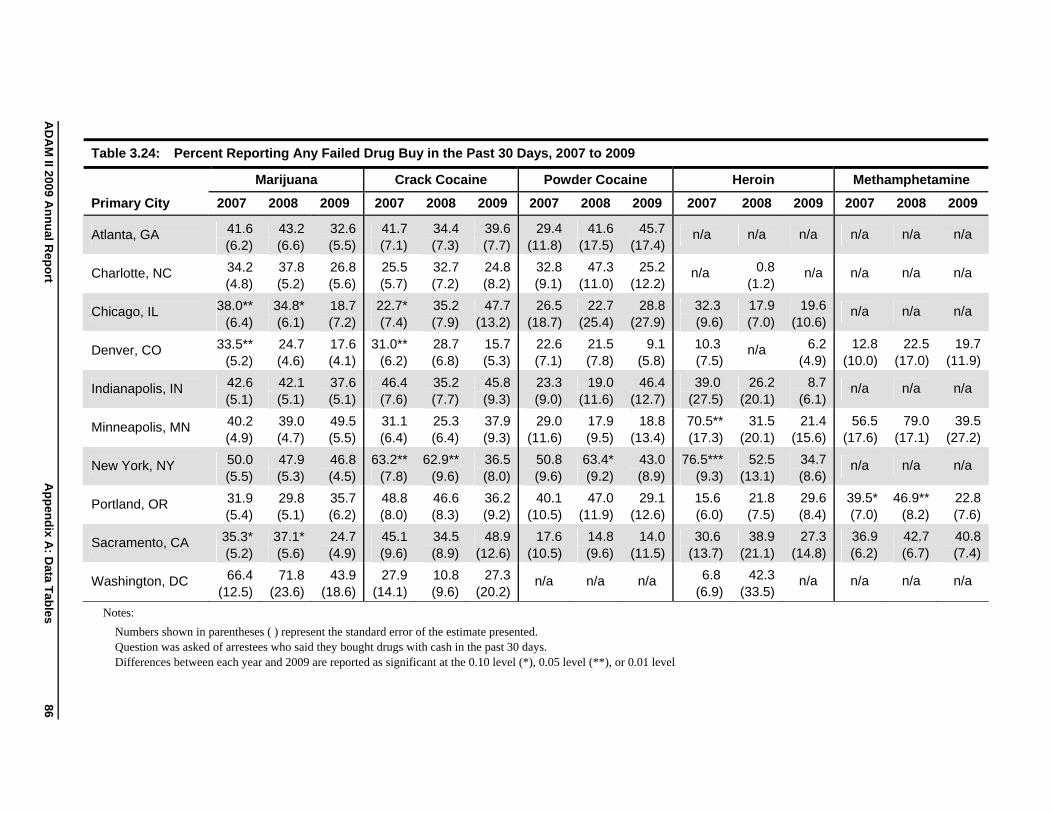
Primary City
Marijuana Crack Cocaine Powder Cocaine Heroin Methamphetamine
2007 2008 2009 2007 2008 2009 2007 2008 2009 2007 2008 2009 2007 2008 2009
Atlanta, GA
Charlotte, NC
Chicago, IL
Denver, CO
Indianapolis, IN
Minneapolis, MN
New York, NY
Portland, OR
Sacramento, CA
Washington, DC
41.6 (6.2)
34.2 (4.8)
38.0** (6.4)
33.5** (5.2)
42.6 (5.1)
40.2 (4.9)
50.0 (5.5)
31.9 (5.4)
35.3* (5.2)
66.4 (12.5)
43.2 (6.6)
37.8 (5.2)
34.8* (6.1)
24.7 (4.6)
42.1 (5.1)
39.0 (4.7)
47.9 (5.3)
29.8 (5.1)
37.1* (5.6)
71.8 (23.6)
32.6 (5.5)
26.8 (5.6)
18.7 (7.2)
17.6 (4.1)
37.6 (5.1)
49.5 (5.5)
46.8 (4.5)
35.7 (6.2)
24.7 (4.9)
43.9 (18.6)
41.7 (7.1)
25.5 (5.7)
22.7* (7.4)
31.0** (6.2)
46.4 (7.6)
31.1 (6.4)
63.2** (7.8)
48.8 (8.0)
45.1 (9.6)
27.9 (14.1)
34.4 (7.3)
32.7 (7.2)
35.2 (7.9)
28.7 (6.8)
35.2 (7.7)
25.3 (6.4)
62.9** (9.6)
46.6 (8.3)
34.5 (8.9)
10.8 (9.6)
39.6 (7.7)
24.8 (8.2)
47.7 (13.2)
15.7 (5.3)
45.8 (9.3)
37.9 (9.3)
36.5 (8.0)
36.2 (9.2)
48.9 (12.6)
27.3 (20.2)
29.4 (11.8)
32.8 (9.1)
26.5 (18.7)
22.6 (7.1)
23.3 (9.0)
29.0 (11.6)
50.8 (9.6)
40.1 (10.5)
17.6 (10.5)
n/a
41.6 (17.5)
47.3 (11.0)
22.7 (25.4)
21.5 (7.8)
19.0 (11.6)
17.9 (9.5)
63.4* (9.2)
47.0 (11.9)
14.8 (9.6)
n/a
45.7 (17.4)
25.2 (12.2)
28.8 (27.9)
9.1 (5.8)
46.4 (12.7)
18.8 (13.4)
43.0 (8.9)
29.1 (12.6)
14.0 (11.5)
n/a
n/a
n/a
32.3 (9.6)
10.3 (7.5)
39.0 (27.5)
70.5** (17.3)
76.5*** (9.3)
15.6 (6.0)
30.6 (13.7)
6.8 (6.9)
n/a
0.8 (1.2)
17.9 (7.0)
n/a
26.2 (20.1)
31.5 (20.1)
52.5 (13.1)
21.8 (7.5)
38.9 (21.1)
42.3 (33.5)
n/a
n/a
19.6 (10.6)
6.2 (4.9)
8.7 (6.1)
21.4 (15.6)
34.7 (8.6)
29.6 (8.4)
27.3 (14.8)
n/a
n/a
n/a
n/a
12.8 (10.0)
n/a
56.5 (17.6)
n/a
39.5* (7.0)
36.9 (6.2)
n/a
n/a
n/a
n/a
22.5 (17.0)
n/a
79.0 (17.1)
n/a
46.9** (8.2)
42.7 (6.7)
n/a
n/a
n/a
n/a
19.7 (11.9)
n/a
39.5 (27.2)
n/a
22.8 (7.6)
40.8 (7.4)
n/a
Table 3.24: Percent Reporting Any Failed Drug Buy in the Past 30 Days, 2007 to 2009
AD
AM
II 2009 An
nu
al Rep
ort
Ap
pen
dix A
: Data T
ables
86
Notes:
Numbers shown in parentheses ( ) represent the standard error of the estimate presented. Question was asked of arrestees who said they bought drugs with cash in the past 30 days. Differences between each year and 2009 are reported as significant at the 0.10 level (*), 0.05 level (**), or 0.01 level
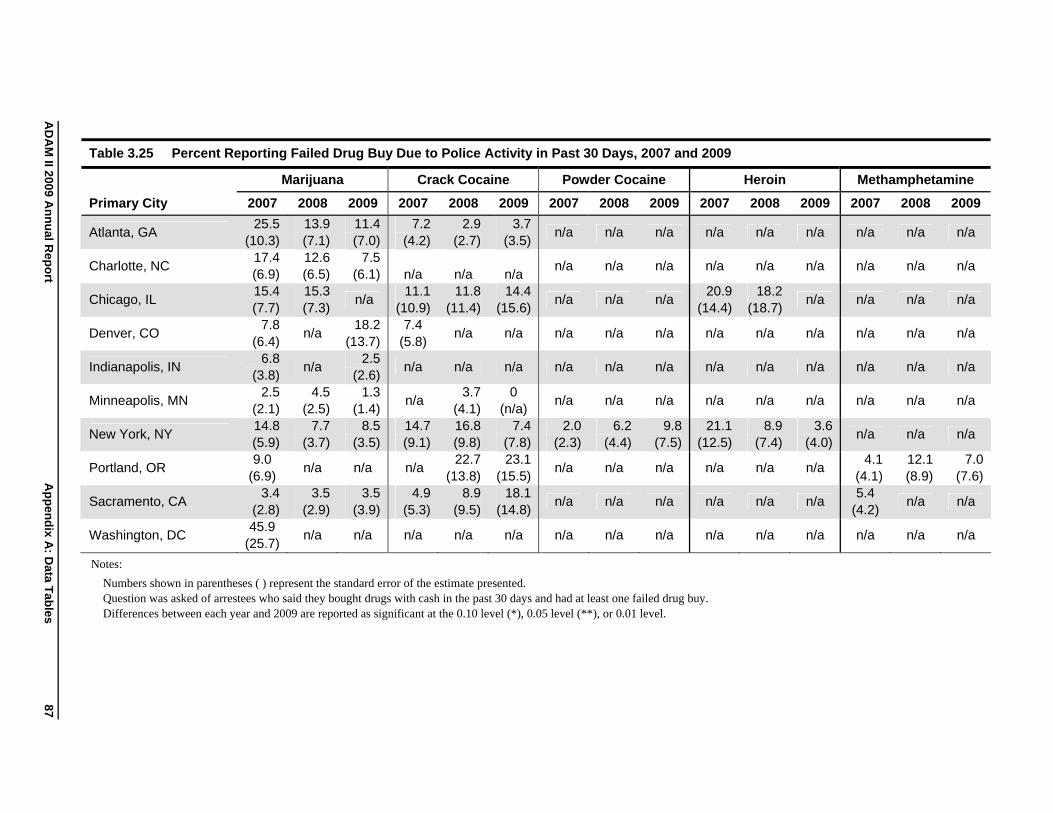
Table 3.25 Percent Reporting Failed Drug Buy Due to Police Activity in Past 30 Days, 2007 and 2009
AD
AM
II 2009 An
nu
al Rep
ort
Ap
pen
dix A
: Data T
ables
87
Marijuana Crack Cocaine Powder Cocaine Heroin Methamphetamine
Primary City 2007 2008 2009 2007 2008 2009 2007 2008 2009 2007 2008 2009 2007 2008 2009
Atlanta, GA 25.5
(10.3) 13.9 (7.1)
11.4 (7.0)
7.2 (4.2)
2.9 (2.7)
3.7 (3.5)
n/a n/a n/a n/a n/a n/a n/a n/a n/a
Charlotte, NC 17.4 (6.9)
12.6 (6.5)
7.5 (6.1) n/a n/a n/a
n/a n/a n/a n/a n/a n/a n/a n/a n/a
Chicago, IL 15.4 (7.7)
15.3 (7.3)
n/a 11.1
(10.9) 11.8
(11.4) 14.4
(15.6) n/a n/a n/a
20.9 (14.4)
18.2 (18.7)
n/a n/a n/a n/a
Denver, CO 7.8
(6.4) n/a
18.2 (13.7)
7.4 (5.8)
n/a n/a n/a n/a n/a n/a n/a n/a n/a n/a n/a
Indianapolis, IN 6.8
(3.8) n/a
2.5 (2.6)
n/a n/a n/a n/a n/a n/a n/a n/a n/a n/a n/a n/a
Minneapolis, MN 2.5
(2.1) 4.5
(2.5) 1.3
(1.4) n/a
3.7 (4.1)
0 (n/a)
n/a n/a n/a n/a n/a n/a n/a n/a n/a
New York, NY 14.8 (5.9)
7.7 (3.7)
8.5 (3.5)
14.7 (9.1)
16.8 (9.8)
7.4 (7.8)
2.0 (2.3)
6.2 (4.4)
9.8 (7.5)
21.1 (12.5)
8.9 (7.4)
3.6 (4.0)
n/a n/a n/a
Portland, OR 9.0
(6.9) n/a n/a n/a
22.7 (13.8)
23.1 (15.5)
n/a n/a n/a n/a n/a n/a 4.1
(4.1) 12.1 (8.9)
7.0 (7.6)
Sacramento, CA 3.4
(2.8) 3.5
(2.9) 3.5
(3.9) 4.9
(5.3) 8.9
(9.5) 18.1
(14.8) n/a n/a n/a n/a n/a n/a
5.4 (4.2)
n/a n/a
Washington, DC 45.9
(25.7) n/a n/a n/a n/a n/a n/a n/a n/a n/a n/a n/a n/a n/a n/a
Notes:
Numbers shown in parentheses ( ) represent the standard error of the estimate presented. Question was asked of arrestees who said they bought drugs with cash in the past 30 days and had at least one failed drug buy. Differences between each year and 2009 are reported as significant at the 0.10 level (*), 0.05 level (**), or 0.01 level.
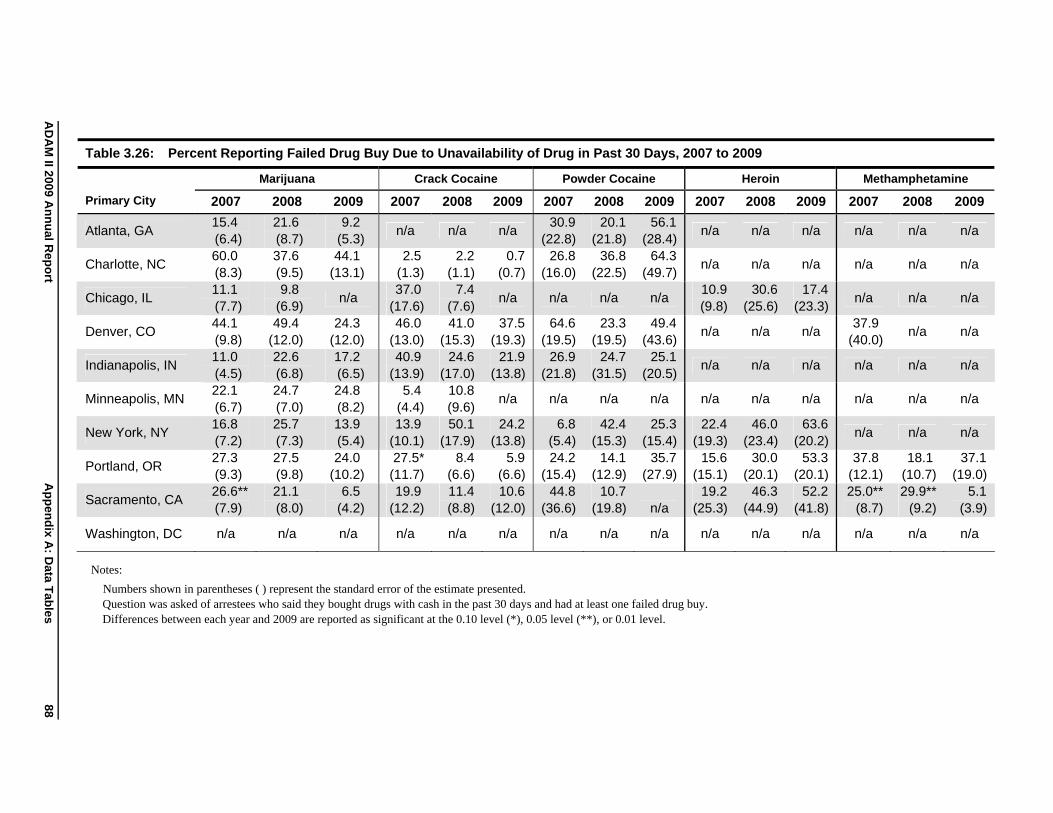
Table 3.26: Percent Reporting Failed Drug Buy Due to Unavailability of Drug in Past 30 Days, 2007 to 2009
AD
AM
II 2009 An
nu
al Rep
ort
Ap
pen
dix A
: Data T
ables
88
Marijuana Crack Cocaine Powder Cocaine Heroin Methamphetamine
Primary City 2007 2008 2009 2007 2008 2009 2007 2008 2009 2007 2008 2009 2007 2008 2009
Atlanta, GA 15.4 (6.4)
21.6 (8.7)
9.2 (5.3)
n/a n/a n/a 30.9
(22.8) 20.1
(21.8) 56.1
(28.4) n/a n/a n/a n/a n/a n/a
Charlotte, NC 60.0 (8.3)
37.6 (9.5)
44.1 (13.1)
2.5 (1.3)
2.2 (1.1)
0.7 (0.7)
26.8 (16.0)
36.8 (22.5)
64.3 (49.7)
n/a n/a n/a n/a n/a n/a
Chicago, IL 11.1 (7.7)
9.8 (6.9)
n/a 37.0
(17.6) 7.4
(7.6) n/a n/a n/a n/a
10.9 (9.8)
30.6 (25.6)
17.4 (23.3)
n/a n/a n/a
Denver, CO 44.1 (9.8)
49.4 (12.0)
24.3 (12.0)
46.0 (13.0)
41.0 (15.3)
37.5 (19.3)
64.6 (19.5)
23.3 (19.5)
49.4 (43.6)
n/a n/a n/a 37.9
(40.0) n/a n/a
Indianapolis, IN 11.0 (4.5)
22.6 (6.8)
17.2 (6.5)
40.9 (13.9)
24.6 (17.0)
21.9 (13.8)
26.9 (21.8)
24.7 (31.5)
25.1 (20.5)
n/a n/a n/a n/a n/a n/a
Minneapolis, MN 22.1 (6.7)
24.7 (7.0)
24.8 (8.2)
5.4 (4.4)
10.8 (9.6)
n/a n/a n/a n/a n/a n/a n/a n/a n/a n/a
New York, NY 16.8 (7.2)
25.7 (7.3)
13.9 (5.4)
13.9 (10.1)
50.1 (17.9)
24.2 (13.8)
6.8 (5.4)
42.4 (15.3)
25.3 (15.4)
22.4 (19.3)
46.0 (23.4)
63.6 (20.2)
n/a n/a n/a
Portland, OR 27.3 (9.3)
27.5 (9.8)
24.0 (10.2)
27.5* (11.7)
8.4 (6.6)
5.9 (6.6)
24.2 (15.4)
14.1 (12.9)
35.7 (27.9)
15.6 (15.1)
30.0 (20.1)
53.3 (20.1)
37.8 (12.1)
18.1 (10.7)
37.1 (19.0)
Sacramento, CA 26.6** (7.9)
21.1 (8.0)
6.5 (4.2)
19.9 (12.2)
11.4 (8.8)
10.6 (12.0)
44.8 (36.6)
10.7 (19.8) n/a
19.2 (25.3)
46.3 (44.9)
52.2 (41.8)
25.0** (8.7)
29.9** (9.2)
5.1 (3.9)
Washington, DC n/a n/a n/a n/a n/a n/a n/a n/a n/a n/a n/a n/a n/a n/a n/a
Notes:
Numbers shown in parentheses ( ) represent the standard error of the estimate presented. Question was asked of arrestees who said they bought drugs with cash in the past 30 days and had at least one failed drug buy. Differences between each year and 2009 are reported as significant at the 0.10 level (*), 0.05 level (**), or 0.01 level.
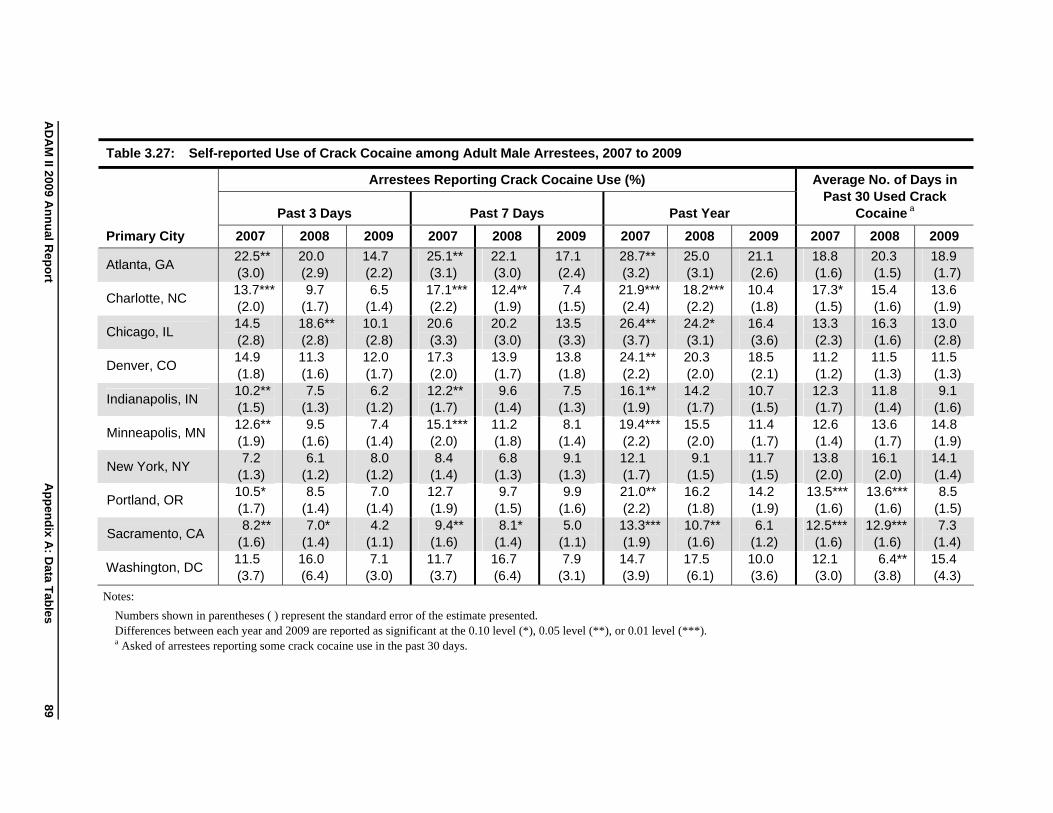
AD
AM
II 2009 An
nu
al Rep
ort
Ap
pen
dix A
: Data T
ables
Table 3.27: Self-reported Use of Crack Cocaine among Adult Male Arrestees, 2007 to 2009
Arrestees Reporting Crack Cocaine Use (%) Average No. of Days in
Primary City
Past 30 Used Crack Cocaine aPast 3 Days Past 7 Days Past Year
2007 2008 2009 2007 2008 2009 2007 2008 2009 2007 2008 2009
Atlanta, GA 22.5** (3.0)
20.0 (2.9)
14.7 (2.2)
25.1** (3.1)
22.1 (3.0)
17.1 (2.4)
28.7** (3.2)
25.0 (3.1)
21.1 (2.6)
18.8 (1.6)
20.3 (1.5)
18.9 (1.7)
Charlotte, NC 13.7*** (2.0)
9.7 (1.7)
6.5 (1.4)
17.1*** (2.2)
12.4** (1.9)
7.4 (1.5)
21.9*** (2.4)
18.2*** (2.2)
10.4 (1.8)
17.3* (1.5)
15.4 (1.6)
13.6 (1.9)
Chicago, IL 14.5 (2.8)
18.6** (2.8)
10.1 (2.8)
20.6 (3.3)
20.2 (3.0)
13.5 (3.3)
26.4** (3.7)
24.2* (3.1)
16.4 (3.6)
13.3 (2.3)
16.3 (1.6)
13.0 (2.8)
Denver, CO 14.9 (1.8)
11.3 (1.6)
12.0 (1.7)
17.3 (2.0)
13.9 (1.7)
13.8 (1.8)
24.1** (2.2)
20.3 (2.0)
18.5 (2.1)
11.2 (1.2)
11.5 (1.3)
11.5 (1.3)
Indianapolis, IN 10.2** (1.5)
7.5 (1.3)
6.2 (1.2)
12.2** (1.7)
9.6 (1.4)
7.5 (1.3)
16.1** (1.9)
14.2 (1.7)
10.7 (1.5)
12.3 (1.7)
11.8 (1.4)
9.1 (1.6)
Minneapolis, MN 12.6** (1.9)
9.5 (1.6)
7.4 (1.4)
15.1*** (2.0)
11.2 (1.8)
8.1 (1.4)
19.4*** (2.2)
15.5 (2.0)
11.4 (1.7)
12.6 (1.4)
13.6 (1.7)
14.8 (1.9)
New York, NY 7.2
(1.3) 6.1
(1.2) 8.0
(1.2) 8.4
(1.4) 6.8
(1.3) 9.1
(1.3) 12.1 (1.7)
9.1 (1.5)
11.7 (1.5)
13.8 (2.0)
16.1 (2.0)
14.1 (1.4)
Portland, OR 10.5* (1.7)
8.5 (1.4)
7.0 (1.4)
12.7 (1.9)
9.7 (1.5)
9.9 (1.6)
21.0** (2.2)
16.2 (1.8)
14.2 (1.9)
13.5*** (1.6)
13.6*** (1.6)
8.5 (1.5)
Sacramento, CA 8.2**
(1.6) 7.0*
(1.4) 4.2
(1.1) 9.4**
(1.6) 8.1*
(1.4) 5.0
(1.1) 13.3*** (1.9)
10.7** (1.6)
6.1 (1.2)
12.5*** (1.6)
12.9*** (1.6)
7.3 (1.4)
Washington, DC 11.5 (3.7)
16.0 (6.4)
7.1 (3.0)
11.7 (3.7)
16.7 (6.4)
7.9 (3.1)
14.7 (3.9)
17.5 (6.1)
10.0 (3.6)
12.1 (3.0)
6.4** (3.8)
15.4 (4.3)
Notes:
Numbers shown in parentheses ( ) represent the standard error of the estimate presented.
Differences between each year and 2009 are reported as significant at the 0.10 level (*), 0.05 level (**), or 0.01 level (***).
a Asked of arrestees reporting some crack cocaine use in the past 30 days.
89
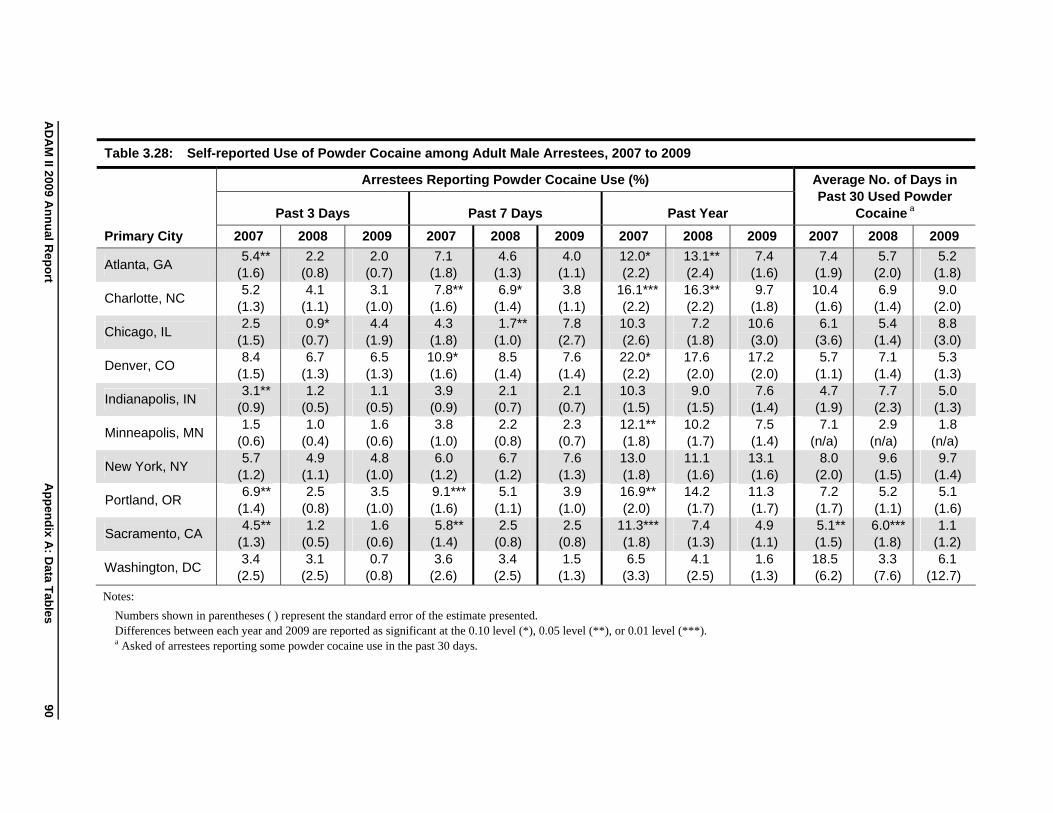
AD
AM
II 2009 An
nu
al Rep
ort
Ap
pen
dix A
: Data T
ables
Table 3.28: Self-reported Use of Powder Cocaine among Adult Male Arrestees, 2007 to 2009
Arrestees Reporting Powder Cocaine Use (%) Average No. of Days in
Primary City
Past 30 Used Powder Cocaine aPast 3 Days Past 7 Days Past Year
2007 2008 2009 2007 2008 2009 2007 2008 2009 2007 2008 2009
Atlanta, GA 5.4**
(1.6) 2.2
(0.8) 2.0
(0.7) 7.1
(1.8) 4.6
(1.3) 4.0
(1.1) 12.0* (2.2)
13.1** (2.4)
7.4 (1.6)
7.4 (1.9)
5.7 (2.0)
5.2 (1.8)
Charlotte, NC 5.2
(1.3) 4.1
(1.1) 3.1
(1.0) 7.8**
(1.6) 6.9*
(1.4) 3.8
(1.1) 16.1*** (2.2)
16.3** (2.2)
9.7 (1.8)
10.4 (1.6)
6.9 (1.4)
9.0 (2.0)
Chicago, IL 2.5
(1.5) 0.9*
(0.7) 4.4
(1.9) 4.3
(1.8) 1.7**
(1.0) 7.8
(2.7) 10.3 (2.6)
7.2 (1.8)
10.6 (3.0)
6.1 (3.6)
5.4 (1.4)
8.8 (3.0)
Denver, CO 8.4
(1.5) 6.7
(1.3) 6.5
(1.3) 10.9* (1.6)
8.5 (1.4)
7.6 (1.4)
22.0* (2.2)
17.6 (2.0)
17.2 (2.0)
5.7 (1.1)
7.1 (1.4)
5.3 (1.3)
Indianapolis, IN 3.1**
(0.9) 1.2
(0.5) 1.1
(0.5) 3.9
(0.9) 2.1
(0.7) 2.1
(0.7) 10.3 (1.5)
9.0 (1.5)
7.6 (1.4)
4.7 (1.9)
7.7 (2.3)
5.0 (1.3)
Minneapolis, MN 1.5
(0.6) 1.0
(0.4) 1.6
(0.6) 3.8
(1.0) 2.2
(0.8) 2.3
(0.7) 12.1** (1.8)
10.2 (1.7)
7.5 (1.4)
7.1 (n/a)
2.9 (n/a)
1.8 (n/a)
New York, NY 5.7
(1.2) 4.9
(1.1) 4.8
(1.0) 6.0
(1.2) 6.7
(1.2) 7.6
(1.3) 13.0 (1.8)
11.1 (1.6)
13.1 (1.6)
8.0 (2.0)
9.6 (1.5)
9.7 (1.4)
Portland, OR 6.9**
(1.4) 2.5
(0.8) 3.5
(1.0) 9.1*** (1.6)
5.1 (1.1)
3.9 (1.0)
16.9** (2.0)
14.2 (1.7)
11.3 (1.7)
7.2 (1.7)
5.2 (1.1)
5.1 (1.6)
Sacramento, CA 4.5**
(1.3) 1.2
(0.5) 1.6
(0.6) 5.8**
(1.4) 2.5
(0.8) 2.5
(0.8) 11.3*** (1.8)
7.4 (1.3)
4.9 (1.1)
5.1** (1.5)
6.0*** (1.8)
1.1 (1.2)
Washington, DC 3.4
(2.5) 3.1
(2.5) 0.7
(0.8) 3.6
(2.6) 3.4
(2.5) 1.5
(1.3) 6.5
(3.3) 4.1
(2.5) 1.6
(1.3) 18.5 (6.2)
3.3 (7.6)
6.1 (12.7)
Notes:
Numbers shown in parentheses ( ) represent the standard error of the estimate presented.
Differences between each year and 2009 are reported as significant at the 0.10 level (*), 0.05 level (**), or 0.01 level (***).
a Asked of arrestees reporting some powder cocaine use in the past 30 days.
90
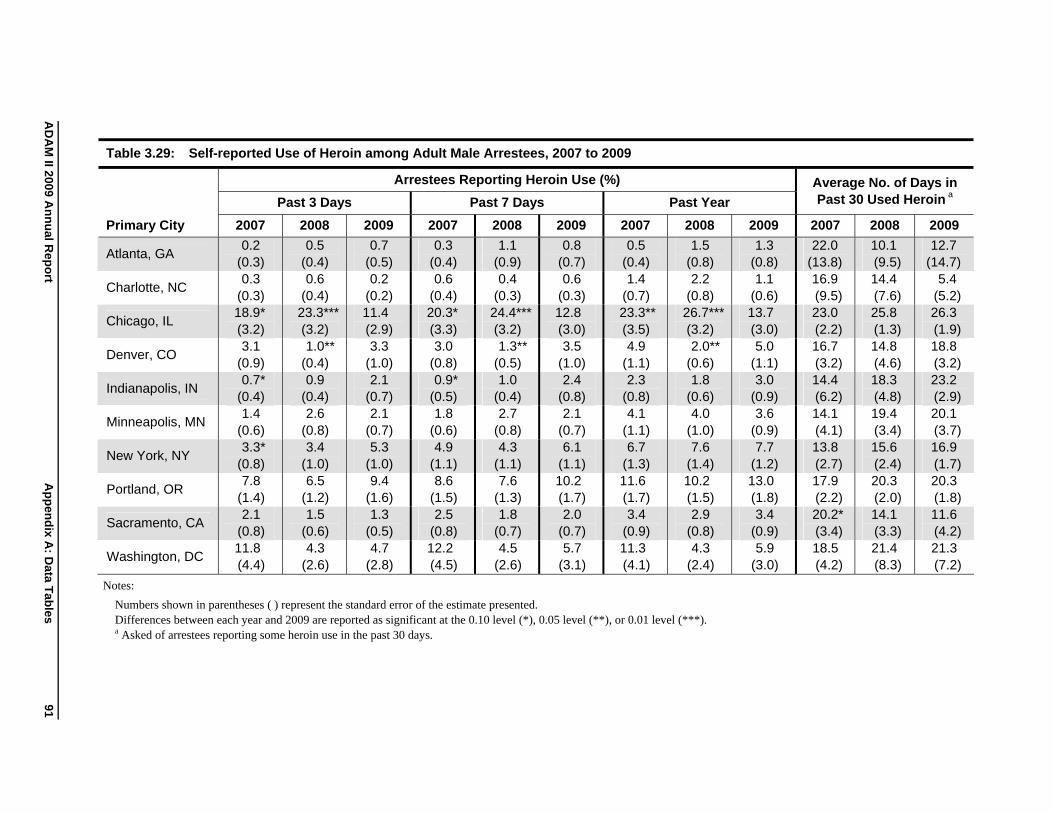
AD
AM
II 2009 An
nu
al Rep
ort
Ap
pen
dix A
: Data T
ables
Table 3.29: Self-reported Use of Heroin among Adult Male Arrestees, 2007 to 2009
Primary City
Arrestees Reporting Heroin Use (%) Average No. of Days in Past 30 Used Heroin a
Past 3 Days Past 7 Days Past Year
2007 2008 2009 2007 2008 2009 2007 2008 2009 2007 2008 2009
Atlanta, GA 0.2
(0.3) 0.5
(0.4) 0.7
(0.5) 0.3
(0.4) 1.1
(0.9) 0.8
(0.7) 0.5
(0.4) 1.5
(0.8) 1.3
(0.8) 22.0
(13.8) 10.1 (9.5)
12.7 (14.7)
Charlotte, NC
Chicago, IL
0.3 (0.3) 18.9* (3.2)
0.6 (0.4)
23.3*** (3.2)
0.2 (0.2) 11.4 (2.9)
0.6 (0.4) 20.3* (3.3)
0.4 (0.3)
24.4*** (3.2)
0.6 (0.3) 12.8 (3.0)
1.4 (0.7) 23.3** (3.5)
2.2 (0.8)
26.7*** (3.2)
1.1 (0.6) 13.7 (3.0)
16.9 (9.5) 23.0 (2.2)
14.4 (7.6) 25.8 (1.3)
5.4 (5.2) 26.3 (1.9)
Denver, CO
Indianapolis, IN
3.1 (0.9) 0.7*
(0.4)
1.0** (0.4) 0.9
(0.4)
3.3 (1.0) 2.1
(0.7)
3.0 (0.8) 0.9*
(0.5)
1.3** (0.5) 1.0
(0.4)
3.5 (1.0) 2.4
(0.8)
4.9 (1.1) 2.3
(0.8)
2.0** (0.6) 1.8
(0.6)
5.0 (1.1) 3.0
(0.9)
16.7 (3.2) 14.4 (6.2)
14.8 (4.6) 18.3 (4.8)
18.8 (3.2) 23.2 (2.9)
Minneapolis, MN
New York, NY
1.4 (0.6) 3.3*
(0.8)
2.6 (0.8) 3.4
(1.0)
2.1 (0.7) 5.3
(1.0)
1.8 (0.6) 4.9
(1.1)
2.7 (0.8) 4.3
(1.1)
2.1 (0.7) 6.1
(1.1)
4.1 (1.1) 6.7
(1.3)
4.0 (1.0) 7.6
(1.4)
3.6 (0.9) 7.7
(1.2)
14.1 (4.1) 13.8 (2.7)
19.4 (3.4) 15.6 (2.4)
20.1 (3.7) 16.9 (1.7)
Portland, OR
Sacramento, CA
7.8 (1.4) 2.1
(0.8)
6.5 (1.2) 1.5
(0.6)
9.4 (1.6) 1.3
(0.5)
8.6 (1.5) 2.5
(0.8)
7.6 (1.3) 1.8
(0.7)
10.2 (1.7) 2.0
(0.7)
11.6 (1.7) 3.4
(0.9)
10.2 (1.5) 2.9
(0.8)
13.0 (1.8) 3.4
(0.9)
17.9 (2.2) 20.2* (3.4)
20.3 (2.0) 14.1 (3.3)
20.3 (1.8) 11.6 (4.2)
Washington, DC 11.8 (4.4)
4.3 (2.6)
4.7 (2.8)
12.2 (4.5)
4.5 (2.6)
5.7 (3.1)
11.3 (4.1)
4.3 (2.4)
5.9 (3.0)
18.5 (4.2)
21.4 (8.3)
21.3 (7.2)
Notes:
Numbers shown in parentheses ( ) represent the standard error of the estimate presented.
Differences between each year and 2009 are reported as significant at the 0.10 level (*), 0.05 level (**), or 0.01 level (***).
a Asked of arrestees reporting some heroin use in the past 30 days.
91
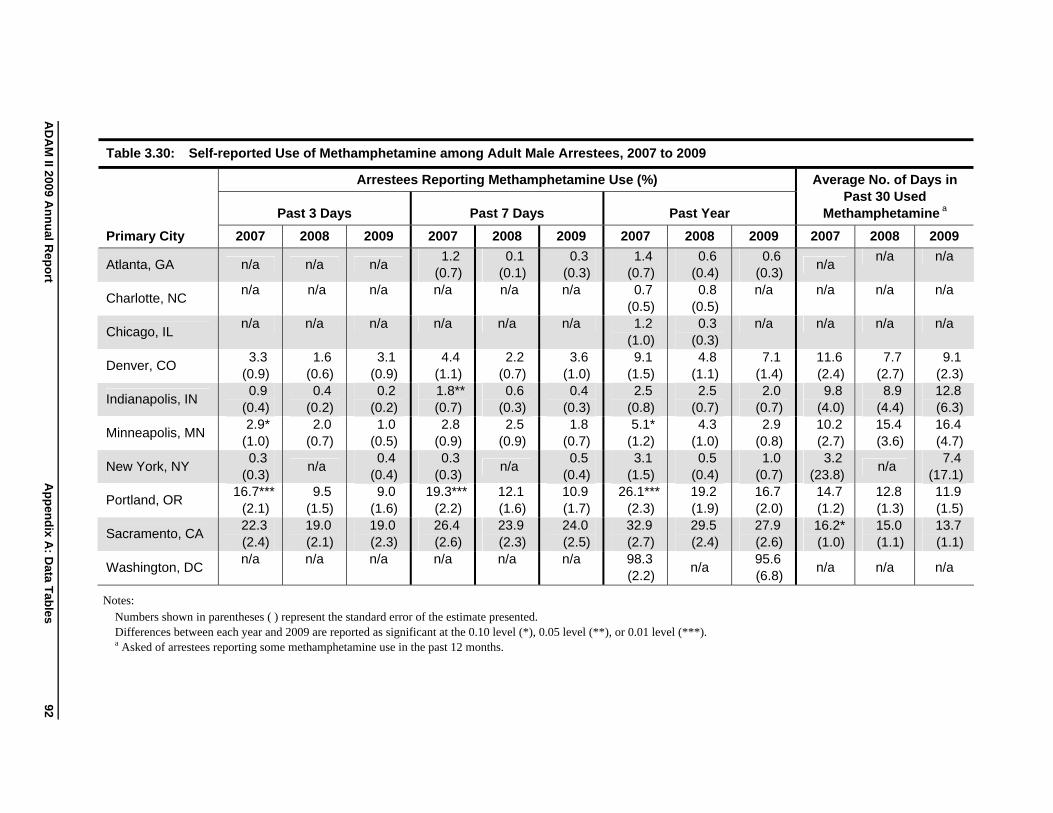
AD
AM
II 2009 An
nu
al Rep
ort
Ap
pen
dix A
: Data T
ables
Table 3.30: Self-reported Use of Methamphetamine among Adult Male Arrestees, 2007 to 2009
Primary City
Arrestees Reporting Methamphetamine Use (%) Average No. of Days in Past 30 Used
Methamphetamine aPast 3 Days Past 7 Days Past Year
2007 2008 2009 2007 2008 2009 2007 2008 2009 2007 2008 2009
Atlanta, GA n/a n/a n/a 1.2
(0.7) 0.1
(0.1) 0.3
(0.3) 1.4
(0.7) 0.6
(0.4) 0.6
(0.3) n/a
n/a n/a
Charlotte, NC n/a n/a n/a n/a n/a n/a 0.7
(0.5) 0.8
(0.5) n/a n/a n/a n/a
Chicago, IL n/a n/a n/a n/a n/a n/a 1.2
(1.0) 0.3
(0.3) n/a n/a n/a n/a
Denver, CO 3.3
(0.9) 1.6
(0.6) 3.1
(0.9) 4.4
(1.1) 2.2
(0.7) 3.6
(1.0) 9.1
(1.5) 4.8
(1.1) 7.1
(1.4) 11.6 (2.4)
7.7 (2.7)
9.1 (2.3)
Indianapolis, IN 0.9
(0.4) 0.4
(0.2) 0.2
(0.2) 1.8** (0.7)
0.6 (0.3)
0.4 (0.3)
2.5 (0.8)
2.5 (0.7)
2.0 (0.7)
9.8 (4.0)
8.9 (4.4)
12.8 (6.3)
Minneapolis, MN 2.9*
(1.0) 2.0
(0.7) 1.0
(0.5) 2.8
(0.9) 2.5
(0.9) 1.8
(0.7) 5.1*
(1.2) 4.3
(1.0) 2.9
(0.8) 10.2 (2.7)
15.4 (3.6)
16.4 (4.7)
New York, NY 0.3
(0.3) n/a
0.4 (0.4)
0.3 (0.3)
n/a 0.5
(0.4) 3.1
(1.5) 0.5
(0.4) 1.0
(0.7) 3.2
(23.8) n/a
7.4 (17.1)
Portland, OR 16.7***
(2.1) 9.5
(1.5) 9.0
(1.6) 19.3***
(2.2) 12.1 (1.6)
10.9 (1.7)
26.1*** (2.3)
19.2 (1.9)
16.7 (2.0)
14.7 (1.2)
12.8 (1.3)
11.9 (1.5)
Sacramento, CA 22.3 (2.4)
19.0 (2.1)
19.0 (2.3)
26.4 (2.6)
23.9 (2.3)
24.0 (2.5)
32.9 (2.7)
29.5 (2.4)
27.9 (2.6)
16.2* (1.0)
15.0 (1.1)
13.7 (1.1)
Washington, DC n/a n/a n/a n/a n/a n/a 98.3
(2.2) n/a
95.6 (6.8)
n/a n/a n/a
Notes: Numbers shown in parentheses ( ) represent the standard error of the estimate presented. Differences between each year and 2009 are reported as significant at the 0.10 level (*), 0.05 level (**), or 0.01 level (***). a Asked of arrestees reporting some methamphetamine use in the past 12 months.
92
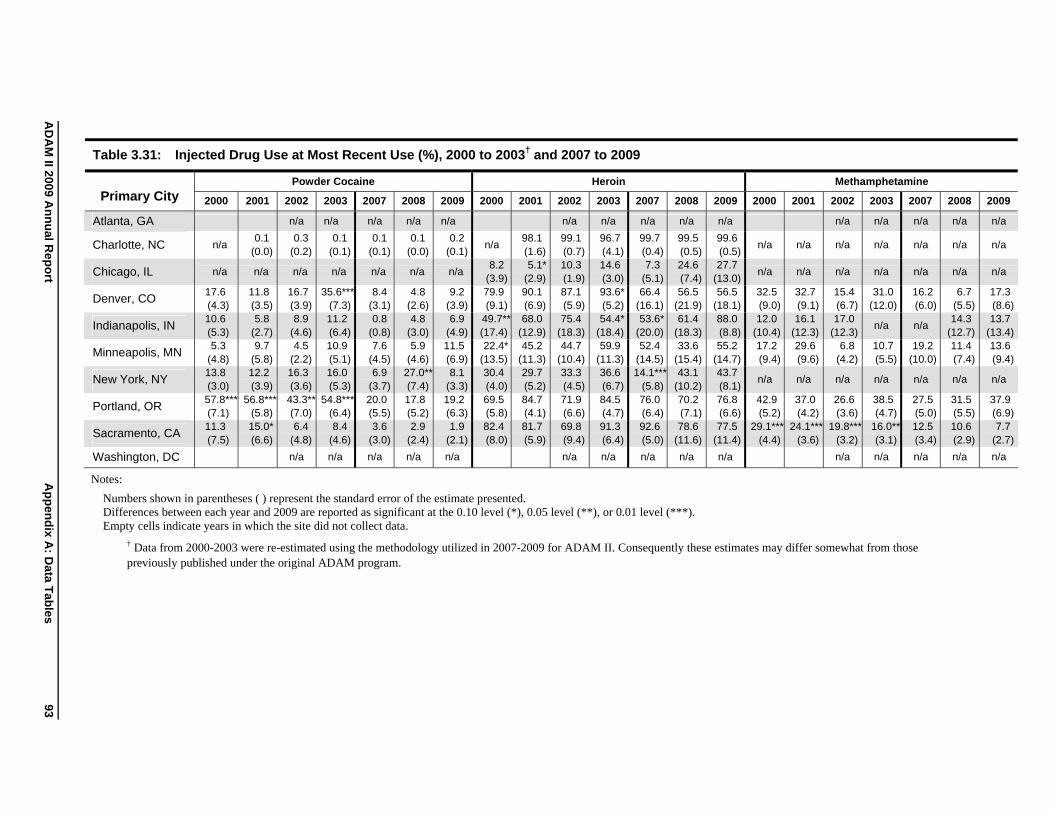
Table 3.31: Injected Drug Use at Most Recent Use (%), 2000 to 2003† and 2007 to 2009
AD
AM
II 2009 An
nu
al Rep
ort
Ap
pen
dix A
: Data T
ables
93
Powder Cocaine Heroin Methamphetamine
Primary City 2000 2001 2002 2003 2007 2008 2009 2000 2001 2002 2003 2007 2008 2009 2000 2001 2002 2003 2007 2008 2009
Atlanta, GA n/a n/a n/a n/a n/a n/a n/a n/a n/a n/a n/a n/a n/a n/a n/a
Charlotte, NC n/a 0.1
(0.0) 0.3
(0.2) 0.1
(0.1) 0.1
(0.1) 0.1
(0.0) 0.2
(0.1) n/a
98.1 (1.6)
99.1 (0.7)
96.7 (4.1)
99.7 (0.4)
99.5 (0.5)
99.6 (0.5)
n/a n/a n/a n/a n/a n/a n/a
Chicago, IL n/a n/a n/a n/a n/a n/a n/a 8.2
(3.9) 5.1*
(2.9) 10.3 (1.9)
14.6 (3.0)
7.3 (5.1)
24.6 (7.4)
27.7 (13.0)
n/a n/a n/a n/a n/a n/a n/a
Denver, CO 17.6 (4.3)
11.8 (3.5)
16.7 (3.9)
35.6*** (7.3)
8.4 (3.1)
4.8 (2.6)
9.2 (3.9)
79.9 (9.1)
90.1 (6.9)
87.1 (5.9)
93.6* (5.2)
66.4 (16.1)
56.5 (21.9)
56.5 (18.1)
32.5 (9.0)
32.7 (9.1)
15.4 (6.7)
31.0 (12.0)
16.2 (6.0)
6.7 (5.5)
17.3 (8.6)
Indianapolis, IN 10.6 (5.3)
5.8 (2.7)
8.9 (4.6)
11.2 (6.4)
0.8 (0.8)
4.8 (3.0)
6.9 (4.9)
49.7** (17.4)
68.0 (12.9)
75.4 (18.3)
54.4* (18.4)
53.6* (20.0)
61.4 (18.3)
88.0 (8.8)
12.0 (10.4)
16.1 (12.3)
17.0 (12.3)
n/a n/a 14.3
(12.7) 13.7
(13.4)
Minneapolis, MN 5.3
(4.8) 9.7
(5.8) 4.5
(2.2) 10.9 (5.1)
7.6 (4.5)
5.9 (4.6)
11.5 (6.9)
22.4* (13.5)
45.2 (11.3)
44.7 (10.4)
59.9 (11.3)
52.4 (14.5)
33.6 (15.4)
55.2 (14.7)
17.2 (9.4)
29.6 (9.6)
6.8 (4.2)
10.7 (5.5)
19.2 (10.0)
11.4 (7.4)
13.6 (9.4)
New York, NY 13.8 (3.0)
12.2 (3.9)
16.3 (3.6)
16.0 (5.3)
6.9 (3.7)
27.0** (7.4)
8.1 (3.3)
30.4 (4.0)
29.7 (5.2)
33.3 (4.5)
36.6 (6.7)
14.1*** (5.8)
43.1 (10.2)
43.7 (8.1)
n/a n/a n/a n/a n/a n/a n/a
Portland, OR 57.8*** (7.1)
56.8*** (5.8)
43.3** (7.0)
54.8*** (6.4)
20.0 (5.5)
17.8 (5.2)
19.2 (6.3)
69.5 (5.8)
84.7 (4.1)
71.9 (6.6)
84.5 (4.7)
76.0 (6.4)
70.2 (7.1)
76.8 (6.6)
42.9 (5.2)
37.0 (4.2)
26.6 (3.6)
38.5 (4.7)
27.5 (5.0)
31.5 (5.5)
37.9 (6.9)
Sacramento, CA 11.3 (7.5)
15.0* (6.6)
6.4 (4.8)
8.4 (4.6)
3.6 (3.0)
2.9 (2.4)
1.9 (2.1)
82.4 (8.0)
81.7 (5.9)
69.8 (9.4)
91.3 (6.4)
92.6 (5.0)
78.6 (11.6)
77.5 (11.4)
29.1*** (4.4)
24.1*** (3.6)
19.8*** (3.2)
16.0** (3.1)
12.5 (3.4)
10.6 (2.9)
7.7 (2.7)
Washington, DC n/a n/a n/a n/a n/a n/a n/a n/a n/a n/a n/a n/a n/a n/a n/a
Notes:
Numbers shown in parentheses ( ) represent the standard error of the estimate presented. Differences between each year and 2009 are reported as significant at the 0.10 level (*), 0.05 level (**), or 0.01 level (***). Empty cells indicate years in which the site did not collect data.
† Data from 2000-2003 were re-estimated using the methodology utilized in 2007-2009 for ADAM II. Consequently these estimates may differ somewhat from those previously published under the original ADAM program.
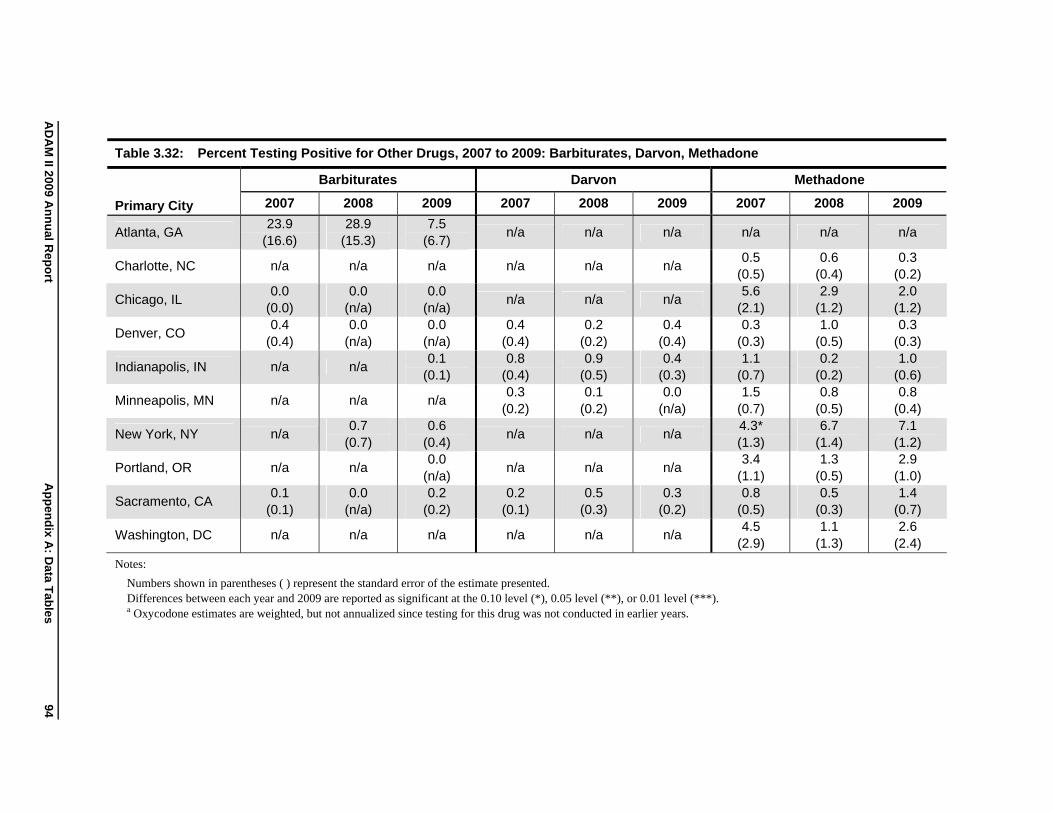
AD
AM
II 2009 An
nu
al Rep
ort
Ap
pen
dix A
: Data T
ables
Table 3.32: Percent Testing Positive for Other Drugs, 2007 to 2009: Barbiturates, Darvon, Methadone
Primary City
Barbiturates Darvon Methadone
2007 2008 2009 2007 2008 2009 2007 2008 2009
Atlanta, GA 23.9
(16.6) 28.9
(15.3) 7.5
(6.7) n/a n/a n/a n/a n/a n/a
Charlotte, NC
Chicago, IL
n/a
0.0 (0.0)
n/a
0.0 (n/a)
n/a
0.0 (n/a)
n/a
n/a
n/a
n/a
n/a
n/a
0.5 (0.5) 5.6
(2.1)
0.6 (0.4) 2.9
(1.2)
0.3 (0.2) 2.0
(1.2)
Denver, CO
Indianapolis, IN
0.4 (0.4)
n/a
0.0 (n/a)
n/a
0.0 (n/a) 0.1
(0.1)
0.4 (0.4) 0.8
(0.4)
0.2 (0.2) 0.9
(0.5)
0.4 (0.4) 0.4
(0.3)
0.3 (0.3) 1.1
(0.7)
1.0 (0.5) 0.2
(0.2)
0.3 (0.3) 1.0
(0.6)
Minneapolis, MN
New York, NY
n/a
n/a
n/a
0.7 (0.7)
n/a
0.6 (0.4)
0.3 (0.2)
n/a
0.1 (0.2)
n/a
0.0 (n/a)
n/a
1.5 (0.7) 4.3* (1.3)
0.8 (0.5) 6.7
(1.4)
0.8 (0.4) 7.1
(1.2)
Portland, OR
Sacramento, CA
n/a
0.1 (0.1)
n/a
0.0 (n/a)
0.0 (n/a) 0.2
(0.2)
n/a
0.2 (0.1)
n/a
0.5 (0.3)
n/a
0.3 (0.2)
3.4 (1.1) 0.8
(0.5)
1.3 (0.5) 0.5
(0.3)
2.9 (1.0) 1.4
(0.7)
Washington, DC n/a n/a n/a n/a n/a n/a 4.5
(2.9) 1.1
(1.3) 2.6
(2.4)
Notes:
Numbers shown in parentheses ( ) represent the standard error of the estimate presented.
Differences between each year and 2009 are reported as significant at the 0.10 level (*), 0.05 level (**), or 0.01 level (***).
a Oxycodone estimates are weighted, but not annualized since testing for this drug was not conducted in earlier years.
94
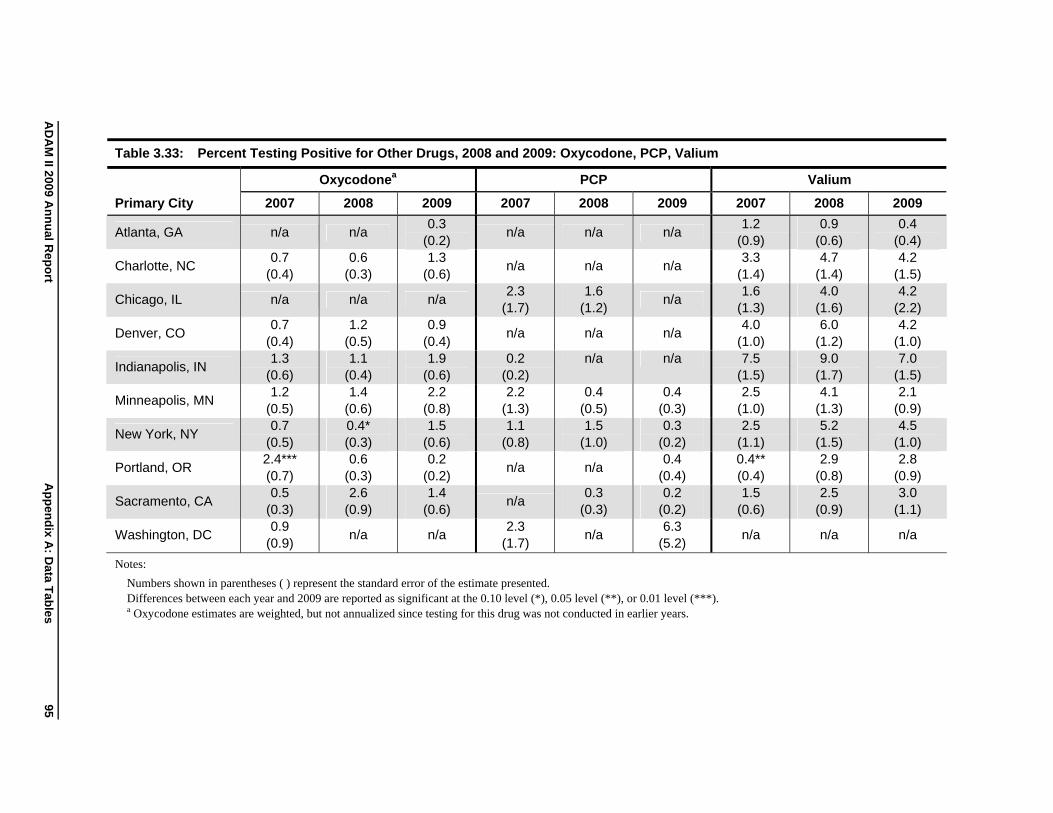
AD
AM
II 2009 An
nu
al Rep
ort
Ap
pen
dix A
: Data T
ables
Table 3.33: Percent Testing Positive for Other Drugs, 2008 and 2009: Oxycodone, PCP, Valium
Primary City
Oxycodonea PCP Valium
2007 2008 2009 2007 2008 2009 2007 2008 2009
Atlanta, GA n/a n/a 0.3
(0.2) n/a n/a n/a
1.2 (0.9)
0.9 (0.6)
0.4 (0.4)
Charlotte, NC
Chicago, IL
0.7 (0.4)
n/a
0.6 (0.3)
n/a
1.3 (0.6)
n/a
n/a
2.3 (1.7)
n/a
1.6 (1.2)
n/a
n/a
3.3 (1.4) 1.6
(1.3)
4.7 (1.4) 4.0
(1.6)
4.2 (1.5) 4.2
(2.2)
Denver, CO
Indianapolis, IN
0.7 (0.4) 1.3
(0.6)
1.2 (0.5) 1.1
(0.4)
0.9 (0.4) 1.9
(0.6)
n/a
0.2 (0.2)
n/a
n/a
n/a
n/a
4.0 (1.0) 7.5
(1.5)
6.0 (1.2) 9.0
(1.7)
4.2 (1.0) 7.0
(1.5)
Minneapolis, MN
New York, NY
1.2 (0.5) 0.7
(0.5)
1.4 (0.6) 0.4* (0.3)
2.2 (0.8) 1.5
(0.6)
2.2 (1.3) 1.1
(0.8)
0.4 (0.5) 1.5
(1.0)
0.4 (0.3) 0.3
(0.2)
2.5 (1.0) 2.5
(1.1)
4.1 (1.3) 5.2
(1.5)
2.1 (0.9) 4.5
(1.0)
Portland, OR
Sacramento, CA
2.4*** (0.7) 0.5
(0.3)
0.6 (0.3) 2.6
(0.9)
0.2 (0.2) 1.4
(0.6)
n/a
n/a
n/a
0.3 (0.3)
0.4 (0.4) 0.2
(0.2)
0.4** (0.4) 1.5
(0.6)
2.9 (0.8) 2.5
(0.9)
2.8 (0.9) 3.0
(1.1)
Washington, DC 0.9
(0.9) n/a n/a
2.3 (1.7)
n/a 6.3
(5.2) n/a n/a n/a
Notes:
Numbers shown in parentheses ( ) represent the standard error of the estimate presented.
Differences between each year and 2009 are reported as significant at the 0.10 level (*), 0.05 level (**), or 0.01 level (***).
a Oxycodone estimates are weighted, but not annualized since testing for this drug was not conducted in earlier years.
95
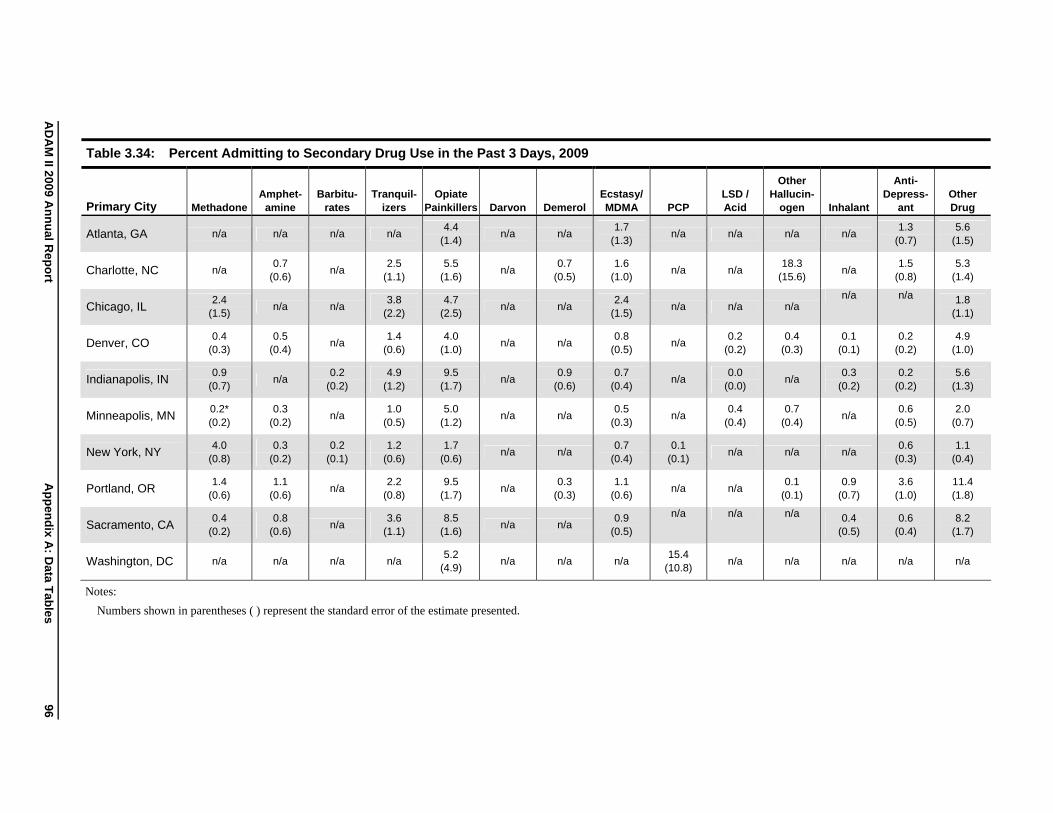
Table 3.34: Percent Admitting to Secondary Drug Use in the Past 3 Days, 2009
AD
AM
II 2009 An
nu
al Rep
ort
Ap
pen
dix A
: Data T
ables
96
Primary City Methadone Amphet-
amine Barbitu-
rates Tranquil-
izers Opiate
Painkillers Darvon Demerol Ecstasy/ MDMA PCP
LSD / Acid
Other Hallucin-
ogen Inhalant
Anti-Depress-
ant Other Drug
Atlanta, GA n/a n/a n/a n/a 4.4
(1.4) n/a n/a
1.7 (1.3)
n/a n/a n/a n/a 1.3
(0.7) 5.6
(1.5)
Charlotte, NC n/a 0.7
(0.6) n/a
2.5 (1.1)
5.5 (1.6)
n/a 0.7
(0.5) 1.6
(1.0) n/a n/a
18.3 (15.6)
n/a 1.5
(0.8) 5.3
(1.4)
Chicago, IL 2.4
(1.5) n/a n/a
3.8 (2.2)
4.7 (2.5)
n/a n/a 2.4
(1.5) n/a n/a n/a
n/a n/a 1.8 (1.1)
Denver, CO 0.4
(0.3) 0.5
(0.4) n/a
1.4 (0.6)
4.0 (1.0)
n/a n/a 0.8
(0.5) n/a
0.2 (0.2)
0.4 (0.3)
0.1 (0.1)
0.2 (0.2)
4.9 (1.0)
Indianapolis, IN 0.9
(0.7) n/a
0.2 (0.2)
4.9 (1.2)
9.5 (1.7)
n/a 0.9
(0.6) 0.7
(0.4) n/a
0.0 (0.0)
n/a 0.3
(0.2) 0.2
(0.2) 5.6
(1.3)
Minneapolis, MN 0.2* (0.2)
0.3 (0.2)
n/a 1.0
(0.5) 5.0
(1.2) n/a n/a
0.5 (0.3)
n/a 0.4
(0.4) 0.7
(0.4) n/a
0.6 (0.5)
2.0 (0.7)
New York, NY 4.0
(0.8) 0.3
(0.2) 0.2
(0.1) 1.2
(0.6) 1.7
(0.6) n/a n/a
0.7 (0.4)
0.1 (0.1)
n/a n/a n/a 0.6
(0.3) 1.1
(0.4)
Portland, OR 1.4
(0.6) 1.1
(0.6) n/a
2.2 (0.8)
9.5 (1.7)
n/a 0.3
(0.3) 1.1
(0.6) n/a n/a
0.1 (0.1)
0.9 (0.7)
3.6 (1.0)
11.4 (1.8)
Sacramento, CA 0.4
(0.2) 0.8
(0.6) n/a
3.6 (1.1)
8.5 (1.6)
n/a n/a 0.9
(0.5)
n/a n/a n/a 0.4 (0.5)
0.6 (0.4)
8.2 (1.7)
Washington, DC n/a n/a n/a n/a 5.2
(4.9) n/a n/a n/a
15.4 (10.8)
n/a n/a n/a n/a n/a
Notes:
Numbers shown in parentheses ( ) represent the standard error of the estimate presented.
Appendix B: ADAM II Program Methodology
In fall 2006, 10 sites were selected to participate in the ADAM II program. They were chosen to provide the following:
National geographic spread, as trends in drug use tend to be regional; A focus on counties east of the Mississippi River, in order to monitor the emergence of
methamphetamine use in this part of the country; and Consistent, biannual data collection points, to support statistical trend analysis.
All of the former 35 ADAM sites were considered for participation, with a focus on those that were more likely to meet the goals of the ADAM II program. Factors that were considered when making this determination included the complexity of the site’s sampling plan (with a preference for single-facility sampling designs) and past performance participating in the ADAM program (e.g., consistent, high-quality data collection over an adequate period of time for trend development and quality of the census data provided for weighting). The selection process was also driven by ONDCP’s interest in monitoring the emergence of methamphetamine use and was, therefore, biased toward counties east of the Mississippi.
Table B.1 provides information on selection criteria for each of the 10 selected sites. Each site collected data for 2007, 2008, and 2009 and will participate again in 2010.
Site Sampling
ADAM II comprises a non-probability sample of 10 counties and a probability sample of arrestees booked into jails within those counties. Consequently, program data are not generalizable to the nation as a whole or to any specific region in which the sites exist. However, the study is designed so that each county’s data is representative of all adult male arrestees booked in that county during the data collection period.
Sampling within a County
The standard catchment area for each site is the county, although the sites are referred to by the name of the largest city in the county’s geographic region. The number of booking facilities and the manner in which arrestees are moved from arrest to arraignment to holding varies within each site.
ADAM II 2009 Annual Report Appendix B: ADAM II Program Methodology 97
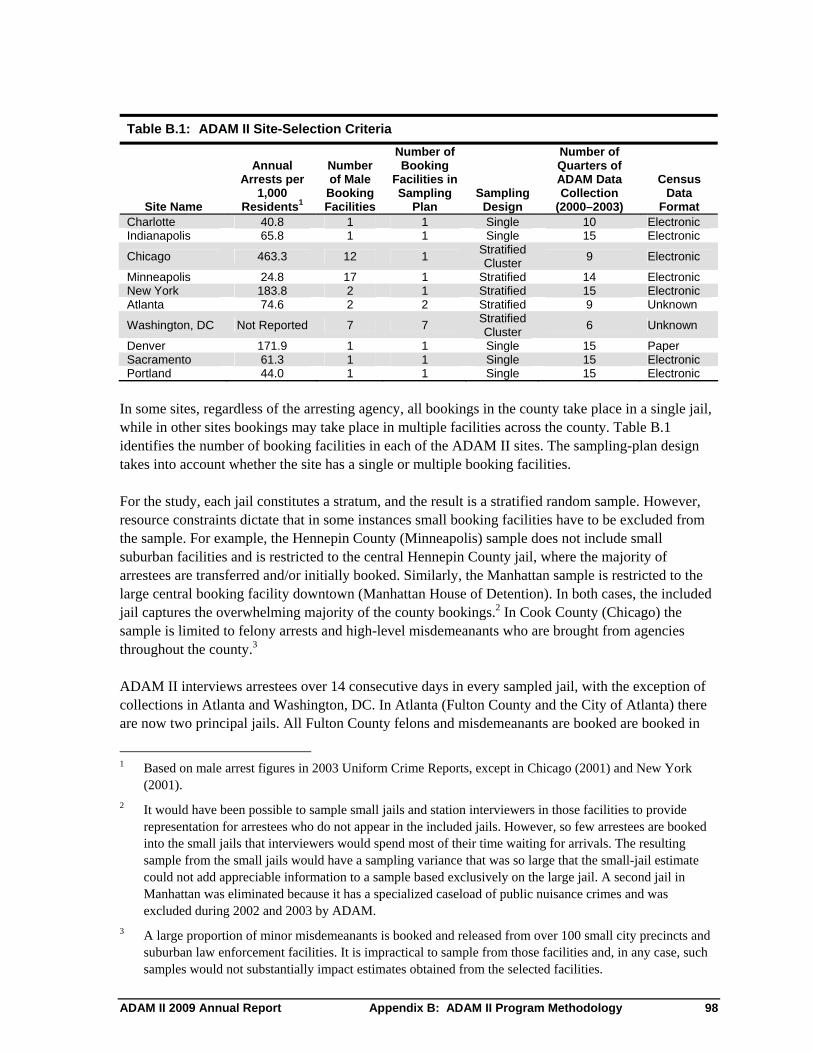
Table B.1: ADAM II Site-Selection Criteria
Number of Number of
Site Name
Annual Arrests per
1,000 Residents1
Number of Male
Booking Facilities
Booking Facilities in Sampling
Plan Sampling
Design
Quarters of ADAM Data Collection
(2000–2003)
Census Data
Format
Indianapolis 65.8 1 1 Single 15 Electronic Charlotte 40.8 1 1 Single 10 Electronic
Chicago 463.3 12 1 Stratified Cluster
9 Electronic
Minneapolis 24.8 17 1 Stratified 14 Electronic New York 183.8 2 1 Stratified 15 Electronic Atlanta 74.6 2 2 Stratified 9 Unknown
Washington, DC Not Reported 7 7 Stratified Cluster
6 Unknown
Denver 171.9 1 1 Single 15 Paper Sacramento 61.3 1 1 Single 15 Electronic Portland 44.0 1 1 Single 15 Electronic
In some sites, regardless of the arresting agency, all bookings in the county take place in a single jail, while in other sites bookings may take place in multiple facilities across the county. Table B.1 identifies the number of booking facilities in each of the ADAM II sites. The sampling-plan design takes into account whether the site has a single or multiple booking facilities.
For the study, each jail constitutes a stratum, and the result is a stratified random sample. However, resource constraints dictate that in some instances small booking facilities have to be excluded from the sample. For example, the Hennepin County (Minneapolis) sample does not include small suburban facilities and is restricted to the central Hennepin County jail, where the majority of arrestees are transferred and/or initially booked. Similarly, the Manhattan sample is restricted to the large central booking facility downtown (Manhattan House of Detention). In both cases, the included jail captures the overwhelming majority of the county bookings.2 In Cook County (Chicago) the sample is limited to felony arrests and high-level misdemeanants who are brought from agencies throughout the county.3
ADAM II interviews arrestees over 14 consecutive days in every sampled jail, with the exception of collections in Atlanta and Washington, DC. In Atlanta (Fulton County and the City of Atlanta) there are now two principal jails. All Fulton County felons and misdemeanants are booked are booked in
1 Based on male arrest figures in 2003 Uniform Crime Reports, except in Chicago (2001) and New York (2001).
2 It would have been possible to sample small jails and station interviewers in those facilities to provide representation for arrestees who do not appear in the included jails. However, so few arrestees are booked into the small jails that interviewers would spend most of their time waiting for arrivals. The resulting sample from the small jails would have a sampling variance that was so large that the small-jail estimate could not add appreciable information to a sample based exclusively on the large jail. A second jail in Manhattan was eliminated because it has a specialized caseload of public nuisance crimes and was excluded during 2002 and 2003 by ADAM.
3 A large proportion of minor misdemeanants is booked and released from over 100 small city precincts and suburban law enforcement facilities. It is impractical to sample from those facilities and, in any case, such samples would not substantially impact estimates obtained from the selected facilities.
ADAM II 2009 Annual Report Appendix B: ADAM II Program Methodology 98
Fulton County Jail. The second facility, the Atlanta Detention Center, books all misdemeanants arrested in the city proper by the Atlanta Police Department; all city felony arrests are taken to the Fulton County Jail. ADAM II samples from one facility in the first week and the second in the second week. There are seven booking facilities (districts) in Washington, DC. Since 2007 the Washington, DC sampling protocol randomly selects days for sampling at each of the facilities.
Sampling within a Facility
The ADAM II sampling procedure is the same within every jail across all sites. Both the original ADAM and ADAM II lack sufficient resources to station interviewers in booking facilities 24 hours per day for a two week period. Recognizing this constraint, the original ADAM sampling team considered a plan to randomly sample periods during a 24-hour day and station interviewers in the jails during those sampled periods. Eventually the team found this impractical for three reasons. First, jail personnel typically prohibit access to inmates during certain periods, as it is disruptive to jail operations. Second, sampling periods of relative quiescence force interviewers to be idle for at least some parts of their work shifts. Third, random sampling of interview periods requires interviewers to work unreasonable duty shifts.
Seeking a more practical sampling procedure, the sampling design is based on dividing data-collection days into periods of stock and flow. Interviewers arrive at the jail at a fixed time during the day—call this H. They work a shift of length S. The stock comprises all arrestees who booked between H-24+S and H. The flow comprises all arrestees who are booked between H and H+S. For example, if interviewers start working at 4 PM and worked for eight hours, then the stock period runs from 12am to 4PM, and the flow period runs from 4PM to 12am. Sampling is done from the stock and flow strata.
In the stock period, sampling is done from arrestees who were arrested between H-24+S and H. This sampling is done at time H, so interviewers can interview only those arrestees who are in jail as of time H—hence the name stock. With respect to the flow period, sampling is done continuously for arrestees as they are booked between H and H+S—hence the name flow.
To determine sampling rate, supervisors estimate the number of bookings that occur during the stock and flow periods. If the daily total is N, the number booked during the stock period NS, the number booked during the flow period NF, then N = NS + NF. Supervisors set quotas from the stock and flow equal to nS and nF, respectively, such that:
nS NS Equation B.1 nF N F
The actual sample size (n = nS + nF) depends on the number of interviewers and sometimes (for smaller jails) the number of bookings; N = NS + NF since n cannot exceed N.
The supervisor sorts arrestees who are booked into the jail during the stock period and forms ns of equal sized strata based on that ordering. Sampling is systematic within each stratum: nS+1, nS+2, etc. If the sampled arrestee is unavailable or unwilling to participate, the supervisor selects the nearest neighbor—meaning the arrestees whose booking time occurs immediately after the arrestee who was unavailable or had declined to be interviewed. This replacement continues until the quota is filled.
ADAM II 2009 Annual Report Appendix B: ADAM II Program Methodology 99
During the flow period, the supervisor selects the arrestee who was booked most recently and assigns an interviewer. If the arrestee is unavailable or unwilling to participate, the supervisor selects the next most recently booked arrestee as a substitute. This process continues until the work shift ends.
This procedure produces a sample that is reasonably well balanced, meaning that arrestees tend to have about the same probability of being included in the sample. If the sample were perfectly balanced, weighting would be unnecessary to achieve unbiased estimates; and in fact, estimates based on weighted and unweighted ADAM data are similar. The sample is not perfectly balanced, however, for several reasons.
First, while supervisors attempt to sample proportional to size during the stock and flow periods, achieving this proportionality requires two pieces of information that are unavailable at the time that supervisors set quotas. A supervisor can only estimate NS and NF based on historical experience. Furthermore, the supervisor cannot know the length of time required to complete interviews because the length of the ADAM instrument depends on the extent of the arrestee’s reported drug use, so the achieved value of nF is variable.
Second, the number of bookings varies from day-to-day, but the number of interviewers is constant. Days with a high number of bookings result in lower sampling probabilities than days with a low number of bookings. Furthermore, the number of bookings varies over the flow period, so that arrestees who are booked during periods with the most intensive booking activity have lower sampling rates than arrestees who are booked during periods with the least intensive booking activity. Sampling rates do not vary as much across the stock period because of the way that the period is partitioned.
Third, arrestees can exit the jail during the stock period. The probability that an arrestee will have been released prior to being approached by an interviewer depends on both the time during the stock period when he was booked and the charge. The earlier that booking occurred during the stock period, the greater the opportunity to have been released. The more serious the charge, the lower the probability of being released, because serious offenders are more likely to be detained for some time pending trial, bail, legal representation, or other activity relevant to release. Neither factor plays an important role during the flow period because of the way that the sample is selected during the flow period.
ADAM II preserves the sampling procedures used by the original ADAM, with the exception of sampling in Washington, DC. Due to insufficient resources to station an interviewer in each jail for every day, a random sample of days was taken so that each of the seven district jails has two or three interviewing days depending on its size. When ADAM II interviewers conduct interviews in each jail, the interviewers follow the sampling procedures described above.
Cook County (Chicago) presents another unique problem, because ADAM II staff can interview only during narrowly specified hours, precluding the use of an eight-hour flow period. Otherwise, the sampling procedure in Cook County is the same as elsewhere.
ADAM II 2009 Annual Report Appendix B: ADAM II Program Methodology 100
Weighting the ADAM II Data
As discussed above, sampling procedures remain the same from ADAM to ADAM II. These procedures are designed so that every arrestee has about the same probability of being sampled. That goal is never achieved in reality, and, in fact, the sampling rate varies appreciably across the population. Weighting the ADAM II data compensates for the sampling-rate variance that occurs during data collection. Originally, ADAM assigned weights by assigning all arrestees to strata based on offenses and the time they were booked. This approach was not altogether satisfactory, because samples were often small or even missing within a stratum, so that strata had to be merged. Merging required considerable manual manipulation of the data, and too frequently disparate strata were merged.
Instead, since 2007 ADAM II has developed propensity scores to weight the data. A propensity score is the estimated probability that a member of the population of arrestees is included in the sample. The estimated propensity score comes from a logistic regression in which the explanatory variables are the offense, details about when the interview was done (day, time of day), and other available information, such as age, that may affect the probability of selection. The inverse of the propensity score is the ADAM II case weight.
Propensity score weights improve the old ADAM poststratification weights. Weights are more homogenous (that is, there are fewer very large weights) and the resulting sampling variances are reduced. Propensity scores were applied to reweight the 2000 and 2001 data, when those data are available, to improve trend estimates.4 Because the contractor from 2002–2003 (NORC) was unable to provide the 2002 and 2003 census data (that is, the booking records for the times when interviewers were in the jails), it has not been possible to reweight the 2002 and 2003 ADAM data.
Imputation of Missing Test Sample Data
In the past, researchers who weighted ADAM data assumed that urine tests were missing at random. The solution, then, was to develop a second set of weights that applied just to the urine test results. There are two potential disadvantages to this approach. The first is that if the results were not missing at random, the resulting weights would produce a biased estimate of the probability of testing positive for a specified drug. The second is that discarding cases as missing necessarily inflates sampling variances. Neither disadvantage was material so long as most arrestees provided urine samples.
Unfortunately, in some ADAM II sites, a higher than expected percentage of arrestees failed to provide urine specimens. While it’s a matter of course to investigate the reason for this higher than expected level of missing data and seek to improve response rates, one must recognize that what was a minor problem when the missing data rate was small becomes a potentially serious problem when the missing data rate is large.
The approach to mitigate the problem is to use existing information to impute missing values. When both self-report of drug use and the urine test results are known, a regression is estimated, where the urine test result is the dependent variable and the self-report is the explanatory variable. The results
Abt Associates developed the poststratification weighting system and used site census data (data on all arrests in the interview period in the county) from 2000 to 2001 to weight the data.
ADAM II 2009 Annual Report Appendix B: ADAM II Program Methodology 101
4
from this regression are then used to impute a value when the self-report is known but there is no urine test result. Although conceptually simple, the practice of performing data imputations is complicated, and is detailed in ADAM II Technical Documentation Report.
Given the desire to improve all estimates, data imputation procedures are now used to improve estimates of the probability that offenders test positive for specified drugs in all sites.
Each site raises unique problems. For example, the sample size is unexpectedly small in Washington, DC because arrestees accumulate across seven distinct jails, so each jail has a fairly small flow of offenders. An eventual solution may be to expand the number of interview days, but in the meantime, other means were used to improve the estimates. Washington, DC presents a unique opportunity to improve estimates because Pretrial Services obtains a urine sample from everyone who is arraigned— typically only offenders with serious charges. Thus, the ADAM II sample is partitioned into two groups: those with a high probability of having a Pretrial Services urine test and those with a low probability of having a Pretrial Services urine test. For the former, the results from the Pretrial Services urine test are used as the estimate; for the latter, the weighted ADAM II data are used.
Estimating Trends
One of the primary goals of reestablishing the ADAM II program was to generate trends that bridge the ADAM programs and assess the significance of changes. While one could produce trend estimates by placing ADAM II estimates onto a graph with previous ADAM estimates, this trend would not be accurate. Two important considerations are taken into account in producing trend estimates: (1) Police practices change and thus affect who is arrested over time—any simple comparison could not distinguish between the probability that an offender would use drugs and the probability that an offender would appear in a jail-based sample—and (2) ADAM and ADAM II samples were collected at different times of year, which may affect trends based on cyclical patterns of drug use.
Model-based predictions that control for the offender mix are developed to account for these considerations. This is analogous to case-mix adjustments often required in health services research. Specifically, weighted regressions are estimated where the result of a urine test is the left-hand-side variable and the right-hand-side variables include the year, the offense, variables controlling for seasonality, and some additional factors that vary from place-to-place. The trends are then based on regression-based predictions that control for the offense and for seasonality.
Confidence intervals around each estimate to determine the significance of year-to-year change are also developed using regression models. This is a necessary step because the annualized estimates are not independent of each other.
ADAM II 2009 Annual Report Appendix B: ADAM II Program Methodology 102
2009 Data Collection
Sample Sizes
Nearly 7,800 adult male arrestees were sampled across all sites, an average of 850 cases sampled per site.5 The number of sampled cases does not represent the number of sampled cases that are available to be interviewed, a number contingent on whether the arrestee is physically available or has been transferred to another facility, is ill and in the medical unit, or isolated due to violent behavior (see below for complete explanation of inclusion criteria). There were 5,540 sampled and available adult male arrestees across all sites, with an average of 600 per site6 in the two data collection quarters of 2009.
Interview Completion Goals
The interview completion goals for each of the 10 ADAM II sites are 250 completes per quarter for two quarters for a total of 5,000 completes across all sites. In the two quarters of the 2009 collection, 4,746 interviews were completed across all sites, with an average of 518 completes per site.7 Three sites (Denver, Indianapolis, and New York) exceeded the goal of 500 completed interviews. Other sites ranged from 483 completes in Chicago to 494 in Sacramento.
To understand the ADAM II sample of arrestees and how it translates into an estimate for all booked arrestees, it is important to take into account the unique ADAM II sampling approach as well as the environment in which the sampling plan is executed. ADAM II sampling plans are designed to systematically sample from a population that may or may not be eligible or available to participate in the study, both of which may not be determined until the arrestee is sampled and approached for participation.
Disposition of Sampled Arrestees
Facesheets completed in ADAM II serve two purposes. The first is to generate data to assess whether the interviewers are following the sampling plan. The second is to generate a potential sample of arrestees eligible to be interviewed. This potential sample includes arrestees who may be eligible, but they may also have been released back into the community, transferred to another facility, taken to court, or are otherwise unavailable to the interviewer.
In creating the sampling frame, data collectors remove from the list those arrestees who were booked into the facility more than 48 hours prior to data collection, if those data are available to them at the facility. This list becomes the sampling frame to which data collectors apply the protocols for stock and flow selections described earlier. However, accurate data on time-since-arrest is not always available and consequently an arrestee’s true eligibility may not be known until the interviewer finds
5 Washington, DC is excluded from calculation of this average. That sample size totaled 143 across both quarters (17 percent of the average).
6 Washington, DC is excluded from this average. The available cases totaled 139 across both quarters (23 percent of the average).
7 Washington, DC is excluded from this average. The number of completed interviews totaled 80 across both quarters (15 percent of the average).
ADAM II 2009 Annual Report Appendix B: ADAM II Program Methodology 103
the sampled arrestee and asks when he was arrested. Of that pool of eligible arrestees, some may also not be available for a number of reasons, such as being taken to court, released, or removed from the booking area for violent behavior, or illness. The remaining arrestees are eligible and available. A sampled, available case may choose not to be interviewed: language barrier, does not want to, etc. Those who are successfully interviewed are complete cases. If an eligible and available arrestee completes an interview, he has the option of providing a urine sample. He may also refuse to supply the specimen for a number of reasons.
The following definitions summarize these conditions:
Eligible cases: All male arrestees who have been arrested within the prior 48-hour period and are not immigration or federal holds.
Sampled cases: Eligible male arrestees booked into the facility within the 24-hour period of data collection, selected by interval from the stock period and by temporal ordering from the flow period.
Available cases: Sampled cases that are (1) physically in the facility and (2) have not been removed from the booking area due to illness or violent behavior.
In addition, those arrestees not contacted before the end of the interview shift are eligible but unavailable for the interview.8 The remaining arrestees are eligible and available. If an eligible and available arrestee completes an interview, he has the option of providing a urine sample. Using the above eligibility rules, disposition codes are created for each facesheet. Table B.2 reports the numbers of completed facesheets with each final disposition (i.e., ineligible, eligible and unavailable, eligible and available, and completes) by ADAM II site and overall. The number of arrestees eligible and available for the interview is found in the final six rows.
Interview Response Rates
Similar to examining sample sizes, there are two interview response rates: one that reflects the total sampled arrestees (the overall response rate), and one that reflects the sampled, available arrestees (the conditional response rate.)9 Given the ADAM II sampling plans, in particular the stock sampling approach, everyone who is sampled is not available to be approached for the interview. A conditional response rate calculation based upon the number of arrestees who are physically available for interviewing is instructive as a reflection of the percentage of eligible and available respondents completing the survey. The conditional response rate is more for assessing how well the interviewer performs.
8 We recognize that there may be some unavailable arrestees that would be ineligible since they were booked more than 48 hours prior to being contacted. However, as reported in Table B.2, there are very few ineligible arrestees. To simplify the response rates, we assume all arrestees that were unavailable to be eligible for the interview.
9 The overall response rate is analogous to RR1 and the conditional response rate is analogous to the contact rate CON1 found in the Standard Definitions from the American Association of Public Opinion Research (AAPOR 2006, pp. 32–36).
ADAM II 2009 Annual Report Appendix B: ADAM II Program Methodology 104
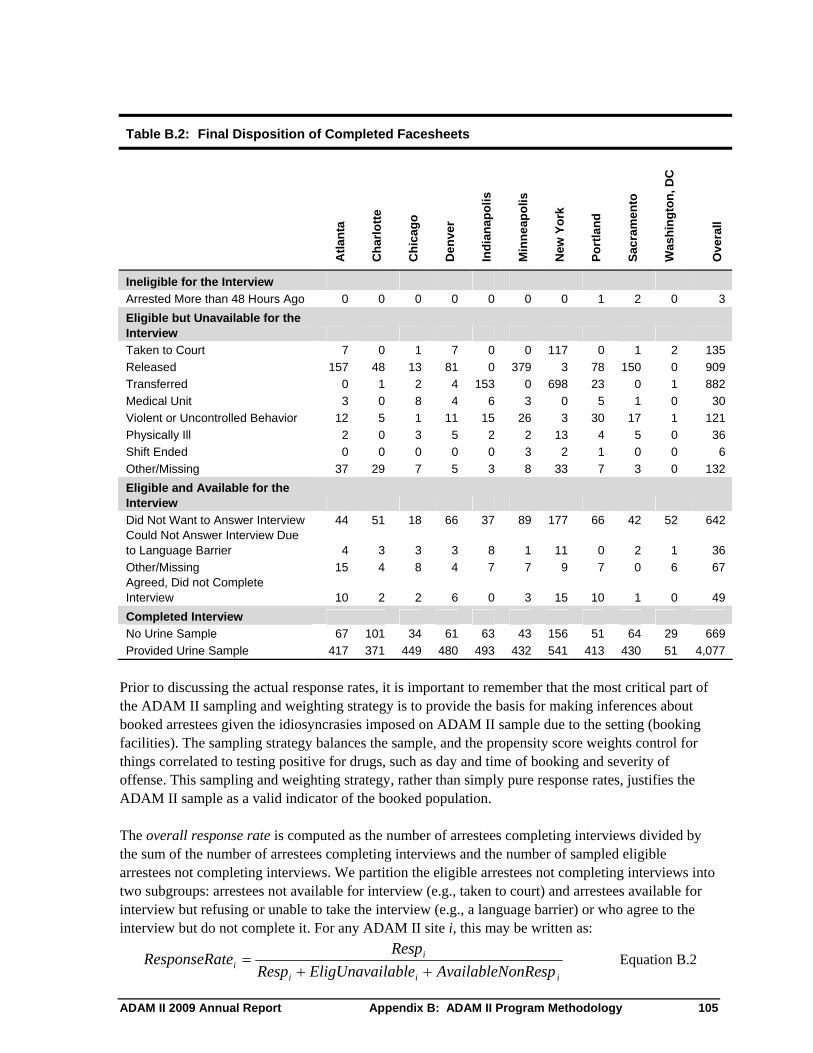
Table B.2: Final Disposition of Completed Facesheets
Atl
anta
Ch
arlo
tte
Ch
icag
o
Den
ver
Ind
ian
apo
lis
Min
nea
po
lis
New
Yo
rk
Po
rtla
nd
Sac
ram
ento
Was
hin
gto
n, D
C
Ove
rall
Ineligible for the Interview
Arrested More than 48 Hours Ago 0 0 0 0 0 0 0 1 2 0 3
Eligible but Unavailable for the Interview
Taken to Court 7 0 1 7 0 0 117 0 1 2 135
Released 157 48 13 81 0 379 3 78 150 0 909
Transferred 0 1 2 4 153 0 698 23 0 1 882
Medical Unit 3 0 8 4 6 3 0 5 1 0 30
Violent or Uncontrolled Behavior 12 5 1 11 15 26 3 30 17 1 121
Physically Ill 2 0 3 5 2 2 13 4 5 0 36
Shift Ended 0 0 0 0 0 3 2 1 0 0 6
Other/Missing 37 29 7 5 3 8 33 7 3 0 132
Eligible and Available for the Interview
Did Not Want to Answer Interview 44 51 18 66 37 89 177 66 42 52 642 Could Not Answer Interview Due to Language Barrier 4 3 3 3 8 1 11 0 2 1 36
Other/Missing 15 4 8 4 7 7 9 7 0 6 67 Agreed, Did not Complete Interview 10 2 2 6 0 3 15 10 1 0 49
Completed Interview
No Urine Sample 67 101 34 61 63 43 156 51 64 29 669
Provided Urine Sample 417 371 449 480 493 432 541 413 430 51 4,077
Prior to discussing the actual response rates, it is important to remember that the most critical part of the ADAM II sampling and weighting strategy is to provide the basis for making inferences about booked arrestees given the idiosyncrasies imposed on ADAM II sample due to the setting (booking facilities). The sampling strategy balances the sample, and the propensity score weights control for things correlated to testing positive for drugs, such as day and time of booking and severity of offense. This sampling and weighting strategy, rather than simply pure response rates, justifies the ADAM II sample as a valid indicator of the booked population.
The overall response rate is computed as the number of arrestees completing interviews divided by the sum of the number of arrestees completing interviews and the number of sampled eligible arrestees not completing interviews. We partition the eligible arrestees not completing interviews into two subgroups: arrestees not available for interview (e.g., taken to court) and arrestees available for interview but refusing or unable to take the interview (e.g., a language barrier) or who agree to the interview but do not complete it. For any ADAM II site i, this may be written as:
RespiResponseRatei Equation B.2 Resp EligUnavailable AvailableNonRespi i i
ADAM II 2009 Annual Report Appendix B: ADAM II Program Methodology 105
Where:
ResponseRate The response rate to the interview Resp The number of eligible and available arrestees responding to the interview EligUnavailable The number of eligible but unavailable arrestees AvailableNonResp The number of eligible and available arrestees not completing an interview
The conditional response rate is nested within the overall response rate, and is written as the number of arrestees completing interviews divided by the sum of the number of arrestees completing interviews and the number of sampled eligible and available arrestees not completing interviews. For any ADAM II site i, this may be written as:
RespCondResponseRatei
i Equation B.3 Respi AvailableNonRespi
Overall response rates for the interview may be computed according to Equation B.2, and conditional response rates may be computed according to Equation B.3. For each ADAM II site, Table B.3 reports the number of arrestees eligible to be interviewed, eligible and available for the interview, completing the interview, and providing a urine specimen. Table B.3 then reports both the conditional and overall response rates for completing an interview.
Urine Response Rates
There are three different response rates for providing a urine specimen. The first is the urine agreement rate, an important indicator of the reliability of self-reported drug abuse. For any ADAM II site i, it is computed by:
ProvideUrineiUrineAgreementRatei Equation B.4 Respi
ProvideUrine is the number of arrestees providing a urine sample. Seven of the 10 ADAM II sites achieved a urine sample agreement rate in excess of 80 percent Table B.3. A high average urine agreement rate of 86 percent was achieved across all sites for the first and second quarters in 2008, with a range from 64 percent in Washington, DC to 93 percent in Chicago.
For completeness, in Table B.3 we report two other response rates: the urine conditional response rate and the urine overall response rate. The urine conditional response rate is computed by:
UrineCondResponseRate CondResponseRate UrineAgreementRate Equation B.5 i i i
The urine overall response rate is computed by:
UrineResponseRatei ResponseRatei UrineAgreementRatei Equation B.6
ADAM II 2009 Annual Report Appendix B: ADAM II Program Methodology 106
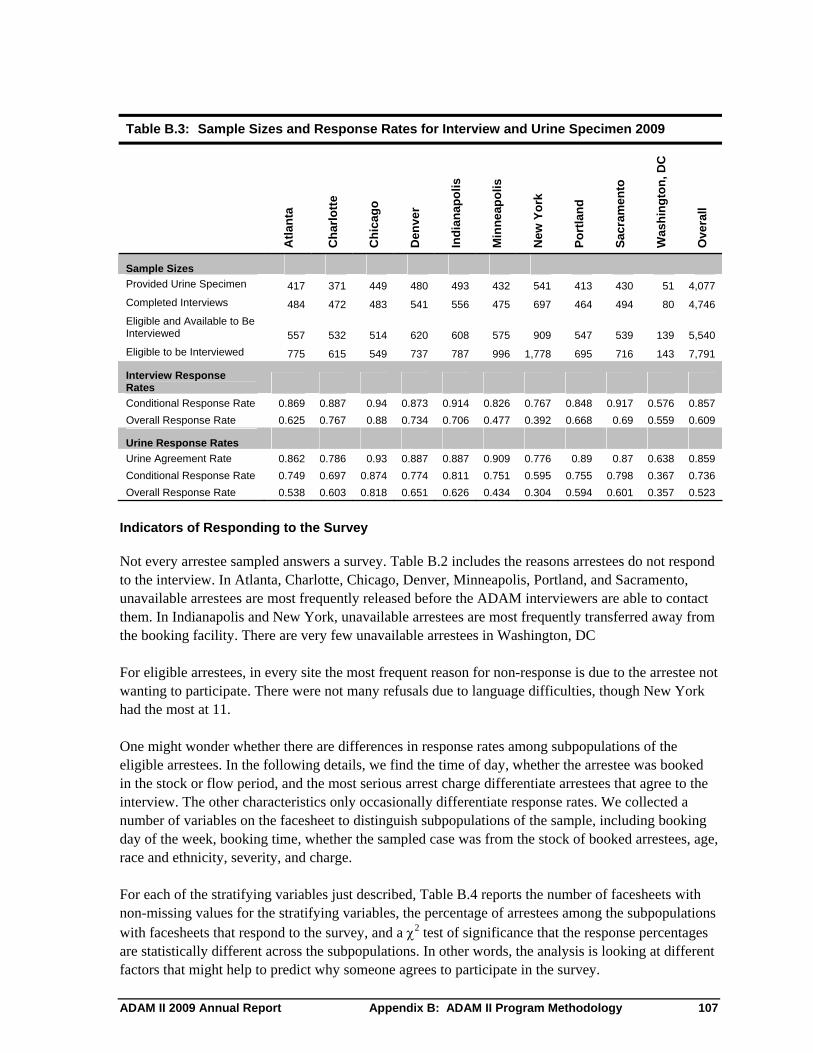
Table B.3: Sample Sizes and Response Rates for Interview and Urine Specimen 2009
Atl
anta
Ch
arlo
tte
Ch
icag
o
Den
ver
Ind
ian
apo
lis
Min
nea
po
lis
New
Yo
rk
Po
rtla
nd
Sac
ram
ento
Was
hin
gto
n, D
C
Ove
rall
Sample Sizes
Provided Urine Specimen 417 371 449 480 493 432 541 413 430 51 4,077
Completed Interviews 484 472 483 541 556 475 697 464 494 80 4,746
Eligible and Available to Be Interviewed 557 532 514 620 608 575 909 547 539 139 5,540
Eligible to be Interviewed 775 615 549 737 787 996 1,778 695 716 143 7,791
Interview Response Rates
Conditional Response Rate 0.869 0.887 0.94 0.873 0.914 0.826 0.767 0.848 0.917 0.576 0.857
Overall Response Rate 0.625 0.767 0.88 0.734 0.706 0.477 0.392 0.668 0.69 0.559 0.609
Urine Agreement Rate 0.862 0.786 0.93 0.887 0.887 0.909 0.776 0.89 0.87 0.638 0.859
Conditional Response Rate 0.749 0.697 0.874 0.774 0.811 0.751 0.595 0.755 0.798 0.367 0.736
Overall Response Rate 0.538 0.603 0.818 0.651 0.626 0.434 0.304 0.594 0.601 0.357 0.523
Urine Response Rates
Indicators of Responding to the Survey
Not every arrestee sampled answers a survey. Table B.2 includes the reasons arrestees do not respond to the interview. In Atlanta, Charlotte, Chicago, Denver, Minneapolis, Portland, and Sacramento, unavailable arrestees are most frequently released before the ADAM interviewers are able to contact them. In Indianapolis and New York, unavailable arrestees are most frequently transferred away from the booking facility. There are very few unavailable arrestees in Washington, DC
For eligible arrestees, in every site the most frequent reason for non-response is due to the arrestee not wanting to participate. There were not many refusals due to language difficulties, though New York had the most at 11.
One might wonder whether there are differences in response rates among subpopulations of the eligible arrestees. In the following details, we find the time of day, whether the arrestee was booked in the stock or flow period, and the most serious arrest charge differentiate arrestees that agree to the interview. The other characteristics only occasionally differentiate response rates. We collected a number of variables on the facesheet to distinguish subpopulations of the sample, including booking day of the week, booking time, whether the sampled case was from the stock of booked arrestees, age, race and ethnicity, severity, and charge.
For each of the stratifying variables just described, Table B.4 reports the number of facesheets with non-missing values for the stratifying variables, the percentage of arrestees among the subpopulations with facesheets that respond to the survey, and a 2 test of significance that the response percentages are statistically different across the subpopulations. In other words, the analysis is looking at different factors that might help to predict why someone agrees to participate in the survey.
ADAM II 2009 Annual Report Appendix B: ADAM II Program Methodology 107

A few notes are necessary to discuss the 2 tests of significance. First, in this section we consider a difference statistically significant if its p-value is less than or equal to 0.05. Second, in the case of Washington, DC, we control for the facility in which the sample was drawn in addition to the stratifying variable.10
For eligible arrestees in all sites but Chicago and Washington, DC, the time at which an arrestee is booked appears to differentiate agreement percentages. In all sites, arrestees booked earlier in the day agree to the interview at a lower rate. Usually the lowest rate is from 12:00 AM to 8:59 PM, with the exceptions of Charlotte and Portland, where the agreement percentages are roughly equal in early and midday (9:00 AM – 3:59 PM). The highest agreement percentages are late in the day (4:00 PM – 11:59 PM), except in Denver, Indianapolis and Minneapolis, where they are lower but roughly equal early or midday. Agreement percentages are always higher in the flow time period rather than the stock time period.
The most serious charge type is a statistically significant predictor of agreement percentages in six sites, although it is idiosyncratic. In Charlotte, those with a property charges are least likely to agree to the interview. In Indianapolis, those with “other” charges are least likely to agree to the interview. In New York, those with violent or drug charges as their most severe offense at arrest are least likely to agree to answer the interview. In Minneapolis, those with drug or “other” charges are least likely to agree to the interview. Finally, in Portland and Sacramento, those with drug charges as their most severe offense at arrest are least likely to agree to answer the interview.
The day of the week an arrestee was booked differentiated agreement percentages in three sites. In Charlotte, the agreement percentage was low on Tuesday and high on Thursday and Friday. In Indianapolis, the agreement percentage was low on Monday, Tuesday, and Saturday. In New York, the agreement percentage was low on Monday and high on Saturday.
The race and ethnicity of the arrestee differentiated agreement percentages in four sites, but no general pattern arose. In Atlanta, the lowest agreement percentage was for “other” races, while the highest was for blacks. In Denver, the lowest agreement percentage was for “other” races, while the highest was for Hispanics. In Portland, the lowest agreement percentage was for blacks and whites, while the highest was for Hispanics. Finally, in Sacramento, the lower agreement percentages were for whites and “other” races, while the higher ones were for blacks and Hispanics.
The severity of the most serious charge at the time of arrest differentiated the agreement percentages in four sites. In Atlanta and Sacramento, those with lower severity of arrest charges were less likely to agree to the interview. In Indianapolis and Minneapolis, those with misdemeanors were less likely to agree to an interview.
10 This would enable us to discern differences that could not be explained simply by differences in the facility from which the sample was drawn.
ADAM II 2009 Annual Report Appendix B: ADAM II Program Methodology 108
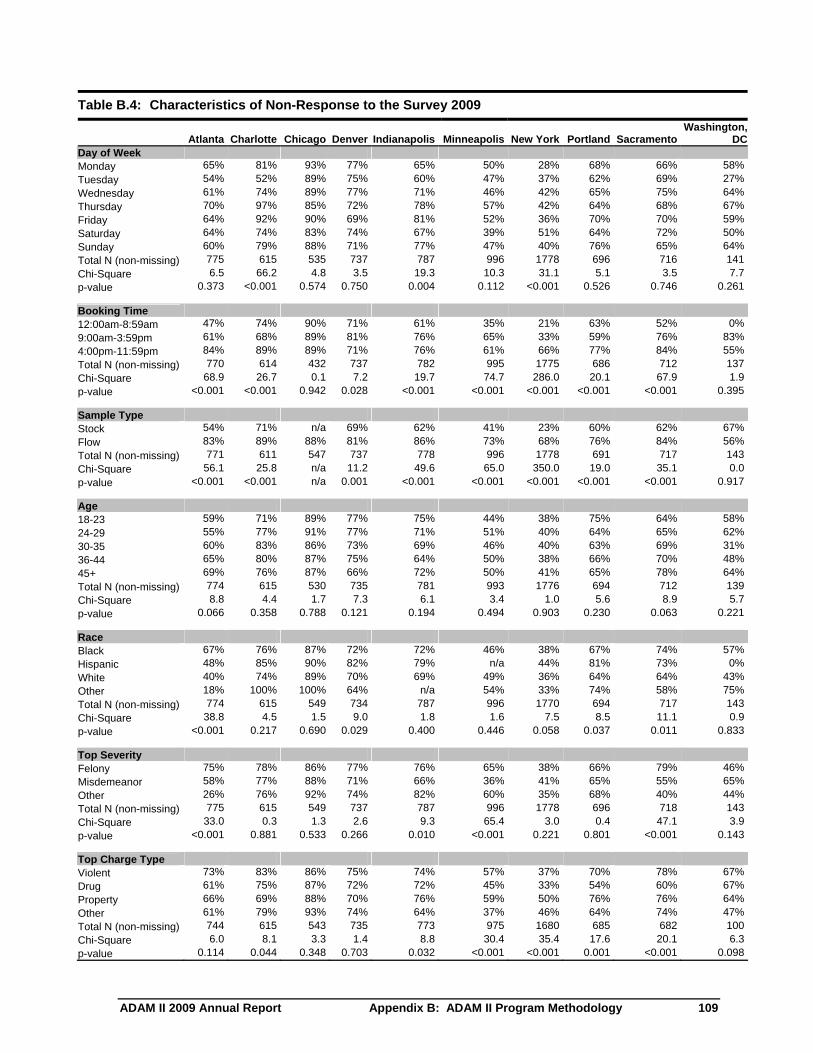
Table B.4: Characteristics of Non-Response to the Survey 2009
Washington, Atlanta Charlotte Chicago Denver Indianapolis Minneapolis New York Portland Sacramento DC
Day of Week Monday 65% 81% 93% 77% 65% 50% 28% 68% 66% 58% Tuesday 54% 52% 89% 75% 60% 47% 37% 62% 69% 27% Wednesday 61% 74% 89% 77% 71% 46% 42% 65% 75% 64% Thursday 70% 97% 85% 72% 78% 57% 42% 64% 68% 67% Friday 64% 92% 90% 69% 81% 52% 36% 70% 70% 59% Saturday 64% 74% 83% 74% 67% 39% 51% 64% 72% 50% Sunday 60% 79% 88% 71% 77% 47% 40% 76% 65% 64% Total N (non-missing) 775 615 535 737 787 996 1778 696 716 141 Chi-Square 6.5 66.2 4.8 3.5 19.3 10.3 31.1 5.1 3.5 7.7 p-value 0.373 <0.001 0.574 0.750 0.004 0.112 <0.001 0.526 0.746 0.261
Booking Time 12:00am-8:59am 47% 74% 90% 71% 61% 35% 21% 63% 52% 0% 9:00am-3:59pm 4:00pm-11:59pm
61% 84%
68% 89%
89% 89%
81% 71%
76% 76%
65% 61%
33% 66%
59% 77%
76% 84%
83% 55%
Total N (non-missing) 770 614 432 737 782 995 1775 686 712 137 Chi-Square p-value
68.9 <0.001
26.7 <0.001
0.1 0.942
7.2 0.028
19.7 <0.001
74.7 <0.001
286.0 <0.001
20.1 <0.001
67.9 <0.001
1.9 0.395
Sample Type Stock 54% 71% n/a 69% 62% 41% 23% 60% 62% 67% Flow 83% 89% 88% 81% 86% 73% 68% 76% 84% 56% Total N (non-missing) 771 611 547 737 778 996 1778 691 717 143 Chi-Square 56.1 25.8 n/a 11.2 49.6 65.0 350.0 19.0 35.1 0.0 p-value <0.001 <0.001 n/a 0.001 <0.001 <0.001 <0.001 <0.001 <0.001 0.917
Age 18-23 59% 71% 89% 77% 75% 44% 38% 75% 64% 58% 24-29 55% 77% 91% 77% 71% 51% 40% 64% 65% 62% 30-35 60% 83% 86% 73% 69% 46% 40% 63% 69% 31% 36-44 65% 80% 87% 75% 64% 50% 38% 66% 70% 48% 45+ 69% 76% 87% 66% 72% 50% 41% 65% 78% 64% Total N (non-missing) 774 615 530 735 781 993 1776 694 712 139 Chi-Square 8.8 4.4 1.7 7.3 6.1 3.4 1.0 5.6 8.9 5.7 p-value 0.066 0.358 0.788 0.121 0.194 0.494 0.903 0.230 0.063 0.221
Race Black 67% 76% 87% 72% 72% 46% 38% 67% 74% 57% Hispanic 48% 85% 90% 82% 79% n/a 44% 81% 73% 0% White 40% 74% 89% 70% 69% 49% 36% 64% 64% 43% Other 18% 100% 100% 64% n/a 54% 33% 74% 58% 75% Total N (non-missing) 774 615 549 734 787 996 1770 694 717 143 Chi-Square 38.8 4.5 1.5 9.0 1.8 1.6 7.5 8.5 11.1 0.9 p-value <0.001 0.217 0.690 0.029 0.400 0.446 0.058 0.037 0.011 0.833
Felony Misdemeanor
75% 58%
78% 77%
86% 88%
77% 71%
76% 66%
65% 36%
38% 41%
66% 65%
79% 55%
46% 65%
Other 26% 76% 92% 74% 82% 60% 35% 68% 40% 44% Total N (non-missing) 775 615 549 737 787 996 1778 696 718 143 Chi-Square 33.0 0.3 1.3 2.6 9.3 65.4 3.0 0.4 47.1 3.9 p-value <0.001 0.881 0.533 0.266 0.010 <0.001 0.221 0.801 <0.001 0.143
Top Severity
Top Charge Type Violent 73% 83% 86% 75% 74% 57% 37% 70% 78% 67% Drug 61% 75% 87% 72% 72% 45% 33% 54% 60% 67% Property 66% 69% 88% 70% 76% 59% 50% 76% 76% 64% Other 61% 79% 93% 74% 64% 37% 46% 64% 74% 47% Total N (non-missing) 744 615 543 735 773 975 1680 685 682 100 Chi-Square 6.0 8.1 3.3 1.4 8.8 30.4 35.4 17.6 20.1 6.3 p-value 0.114 0.044 0.348 0.703 0.032 <0.001 <0.001 0.001 <0.001 0.098
ADAM II 2009 Annual Report Appendix B: ADAM II Program Methodology 109
Once an arrestee agrees to answer a survey, his characteristics as measured on the facesheet do little to differentiate whether he will provide a urine test. Table B.5 is structured similarly to Table B.4, though for survey respondents. It reports the number of survey respondents with non-missing values for the stratifying variables, the percentage of surveyed arrestees among the subpopulations with facesheets that provide a urine sample, and a 2 test of significance that the response percentages are statistically different across the subpopulations.
The facesheet variables distinguish the percentages of arrestees agreeing to provide a urine sample across the different subpopulations. In New York, people arrested later in the week and those older than the youngest category provided urine tests at a higher rate. In Charlotte, those arrested early in the day and those arrested during the stock time provided urine tests at a higher rate. Finally, in Sacramento, those arrested during the stock time provided urine tests at a higher rate.
ADAM II 2009 Annual Report Appendix B: ADAM II Program Methodology 110
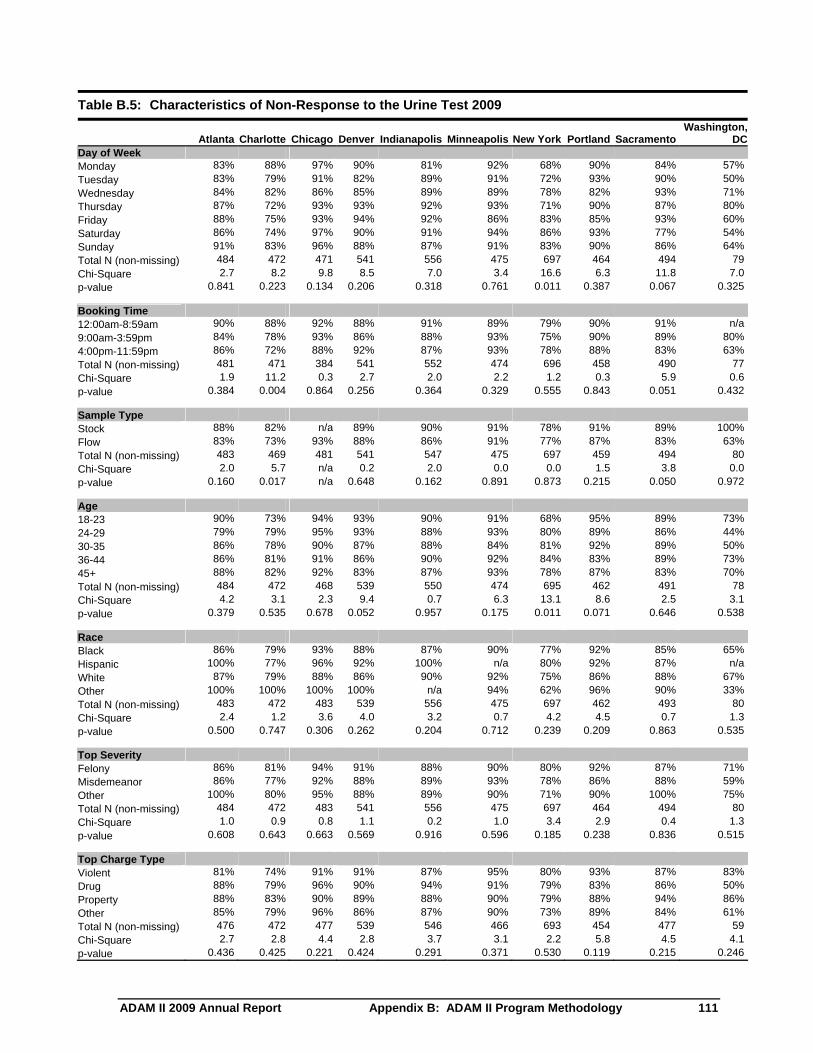
Table B.5: Characteristics of Non-Response to the Urine Test 2009
Washington, Atlanta Charlotte Chicago Denver Indianapolis Minneapolis New York Portland Sacramento DC
Monday 83% 88% 97% 90% 81% 92% 68% 90% 84% 57% Tuesday 83% 79% 91% 82% 89% 91% 72% 93% 90% 50% Wednesday 84% 82% 86% 85% 89% 89% 78% 82% 93% 71% Thursday 87% 72% 93% 93% 92% 93% 71% 90% 87% 80% Friday 88% 75% 93% 94% 92% 86% 83% 85% 93% 60% Saturday 86% 74% 97% 90% 91% 94% 86% 93% 77% 54% Sunday 91% 83% 96% 88% 87% 91% 83% 90% 86% 64% Total N (non-missing) 484 472 471 541 556 475 697 464 494 79 Chi-Square 2.7 8.2 9.8 8.5 7.0 3.4 16.6 6.3 11.8 7.0 p-value 0.841 0.223 0.134 0.206 0.318 0.761 0.011 0.387 0.067 0.325
Booking Time 12:00am-8:59am 90% 88% 92% 88% 91% 89% 79% 90% 91% n/a 9:00am-3:59pm 84% 78% 93% 86% 88% 93% 75% 90% 89% 80% 4:00pm-11:59pm 86% 72% 88% 92% 87% 93% 78% 88% 83% 63% Total N (non-missing) 481 471 384 541 552 474 696 458 490 77 Chi-Square 1.9 11.2 0.3 2.7 2.0 2.2 1.2 0.3 5.9 0.6 p-value 0.384 0.004 0.864 0.256 0.364 0.329 0.555 0.843 0.051 0.432
Day of Week
Sample Type Stock 88% 82% n/a 89% 90% 91% 78% 91% 89% 100% Flow 83% 73% 93% 88% 86% 91% 77% 87% 83% 63% Total N (non-missing) 483 469 481 541 547 475 697 459 494 80 Chi-Square 2.0 5.7 n/a 0.2 2.0 0.0 0.0 1.5 3.8 0.0 p-value 0.160 0.017 n/a 0.648 0.162 0.891 0.873 0.215 0.050 0.972
Age 18-23 90% 73% 94% 93% 90% 91% 68% 95% 89% 73% 24-29 79% 79% 95% 93% 88% 93% 80% 89% 86% 44% 30-35 86% 78% 90% 87% 88% 84% 81% 92% 89% 50% 36-44 86% 81% 91% 86% 90% 92% 84% 83% 89% 73% 45+ 88% 82% 92% 83% 87% 93% 78% 87% 83% 70% Total N (non-missing) 484 472 468 539 550 474 695 462 491 78 Chi-Square 4.2 3.1 2.3 9.4 0.7 6.3 13.1 8.6 2.5 3.1 p-value 0.379 0.535 0.678 0.052 0.957 0.175 0.011 0.071 0.646 0.538
Race Black 86% 79% 93% 88% 87% 90% 77% 92% 85% 65% Hispanic 100% 77% 96% 92% 100% n/a 80% 92% 87% n/a White 87% 79% 88% 86% 90% 92% 75% 86% 88% 67% Other 100% 100% 100% 100% n/a 94% 62% 96% 90% 33% Total N (non-missing) 483 472 483 539 556 475 697 462 493 80 Chi-Square 2.4 1.2 3.6 4.0 3.2 0.7 4.2 4.5 0.7 1.3 p-value 0.500 0.747 0.306 0.262 0.204 0.712 0.239 0.209 0.863 0.535
Felony Misdemeanor
86% 86%
81% 77%
94% 92%
91% 88%
88% 89%
90% 93%
80% 78%
92% 86%
87% 88%
71% 59%
Other 100% 80% 95% 88% 89% 90% 71% 90% 100% 75% Total N (non-missing) 484 472 483 541 556 475 697 464 494 80 Chi-Square 1.0 0.9 0.8 1.1 0.2 1.0 3.4 2.9 0.4 1.3 p-value 0.608 0.643 0.663 0.569 0.916 0.596 0.185 0.238 0.836 0.515
Top Severity
Top Charge Type Violent 81% 74% 91% 91% 87% 95% 80% 93% 87% 83% Drug 88% 79% 96% 90% 94% 91% 79% 83% 86% 50% Property 88% 83% 90% 89% 88% 90% 79% 88% 94% 86% Other 85% 79% 96% 86% 87% 90% 73% 89% 84% 61% Total N (non-missing) 476 472 477 539 546 466 693 454 477 59 Chi-Square 2.7 2.8 4.4 2.8 3.7 3.1 2.2 5.8 4.5 4.1 p-value 0.436 0.425 0.221 0.424 0.291 0.371 0.530 0.119 0.215 0.246
ADAM II 2009 Annual Report Appendix B: ADAM II Program Methodology 111
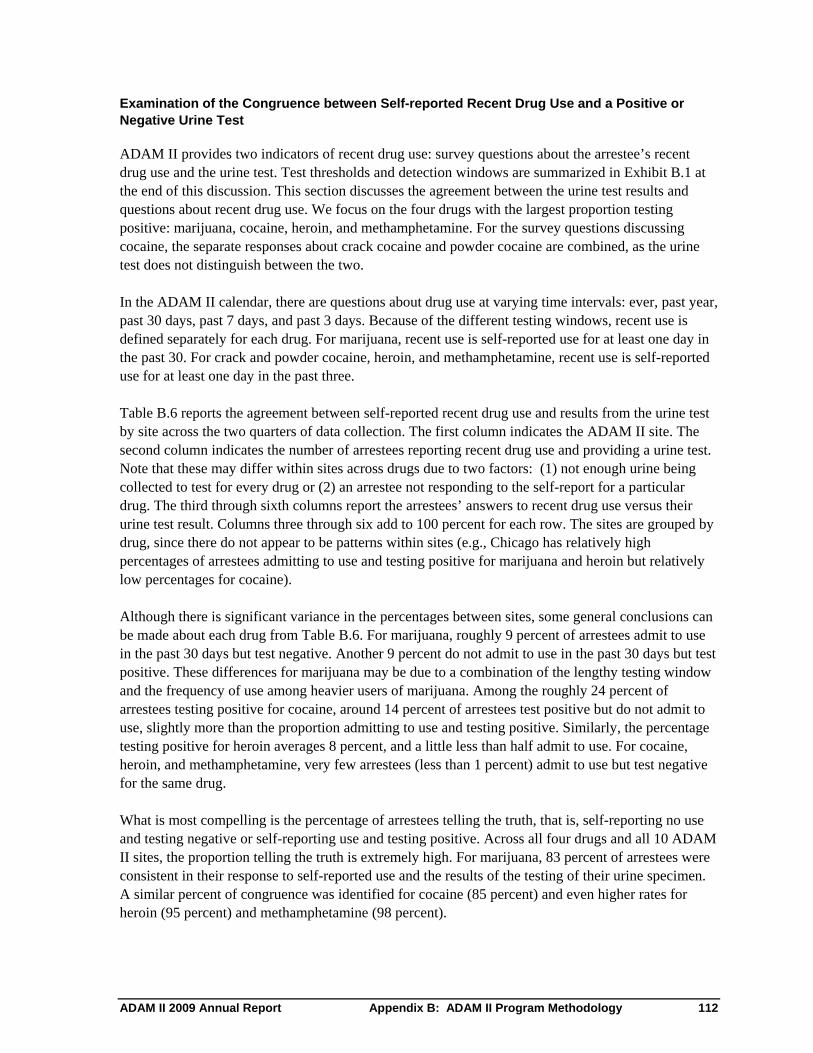
Examination of the Congruence between Self-reported Recent Drug Use and a Positive or Negative Urine Test
ADAM II provides two indicators of recent drug use: survey questions about the arrestee’s recent drug use and the urine test. Test thresholds and detection windows are summarized in Exhibit B.1 at the end of this discussion. This section discusses the agreement between the urine test results and questions about recent drug use. We focus on the four drugs with the largest proportion testing positive: marijuana, cocaine, heroin, and methamphetamine. For the survey questions discussing cocaine, the separate responses about crack cocaine and powder cocaine are combined, as the urine test does not distinguish between the two.
In the ADAM II calendar, there are questions about drug use at varying time intervals: ever, past year, past 30 days, past 7 days, and past 3 days. Because of the different testing windows, recent use is defined separately for each drug. For marijuana, recent use is self-reported use for at least one day in the past 30. For crack and powder cocaine, heroin, and methamphetamine, recent use is self-reported use for at least one day in the past three.
Table B.6 reports the agreement between self-reported recent drug use and results from the urine test by site across the two quarters of data collection. The first column indicates the ADAM II site. The second column indicates the number of arrestees reporting recent drug use and providing a urine test. Note that these may differ within sites across drugs due to two factors: (1) not enough urine being collected to test for every drug or (2) an arrestee not responding to the self-report for a particular drug. The third through sixth columns report the arrestees’ answers to recent drug use versus their urine test result. Columns three through six add to 100 percent for each row. The sites are grouped by drug, since there do not appear to be patterns within sites (e.g., Chicago has relatively high percentages of arrestees admitting to use and testing positive for marijuana and heroin but relatively low percentages for cocaine).
Although there is significant variance in the percentages between sites, some general conclusions can be made about each drug from Table B.6. For marijuana, roughly 9 percent of arrestees admit to use in the past 30 days but test negative. Another 9 percent do not admit to use in the past 30 days but test positive. These differences for marijuana may be due to a combination of the lengthy testing window and the frequency of use among heavier users of marijuana. Among the roughly 24 percent of arrestees testing positive for cocaine, around 14 percent of arrestees test positive but do not admit to use, slightly more than the proportion admitting to use and testing positive. Similarly, the percentage testing positive for heroin averages 8 percent, and a little less than half admit to use. For cocaine, heroin, and methamphetamine, very few arrestees (less than 1 percent) admit to use but test negative for the same drug.
What is most compelling is the percentage of arrestees telling the truth, that is, self-reporting no use and testing negative or self-reporting use and testing positive. Across all four drugs and all 10 ADAM II sites, the proportion telling the truth is extremely high. For marijuana, 83 percent of arrestees were consistent in their response to self-reported use and the results of the testing of their urine specimen. A similar percent of congruence was identified for cocaine (85 percent) and even higher rates for heroin (95 percent) and methamphetamine (98 percent).
ADAM II 2009 Annual Report Appendix B: ADAM II Program Methodology 112
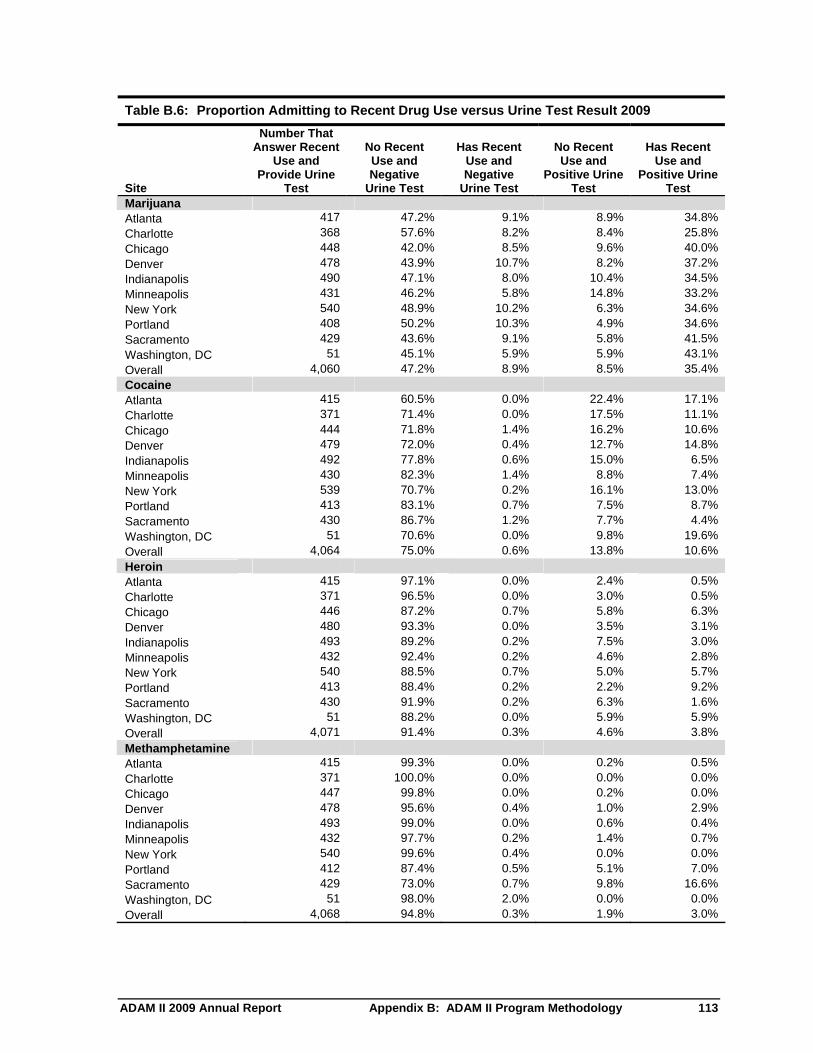
Table B.6: Proportion Admitting to Recent Drug Use versus Urine Test Result 2009
Number That Answer Recent No Recent Has Recent No Recent Has Recent
Use and Use and Use and Use and Use and Provide Urine Negative Negative Positive Urine Positive Urine
Site Test Urine Test Urine Test Test Test Marijuana Atlanta 417 47.2% 9.1% 8.9% 34.8% Charlotte 368 57.6% 8.2% 8.4% 25.8% Chicago 448 42.0% 8.5% 9.6% 40.0% Denver 478 43.9% 10.7% 8.2% 37.2% Indianapolis 490 47.1% 8.0% 10.4% 34.5% Minneapolis 431 46.2% 5.8% 14.8% 33.2% New York 540 48.9% 10.2% 6.3% 34.6% Portland 408 50.2% 10.3% 4.9% 34.6% Sacramento 429 43.6% 9.1% 5.8% 41.5% Washington, DC 51 45.1% 5.9% 5.9% 43.1% Overall 4,060 47.2% 8.9% 8.5% 35.4% Cocaine Atlanta 415 60.5% 0.0% 22.4% 17.1% Charlotte 371 71.4% 0.0% 17.5% 11.1% Chicago 444 71.8% 1.4% 16.2% 10.6% Denver 479 72.0% 0.4% 12.7% 14.8% Indianapolis 492 77.8% 0.6% 15.0% 6.5% Minneapolis 430 82.3% 1.4% 8.8% 7.4% New York 539 70.7% 0.2% 16.1% 13.0% Portland 413 83.1% 0.7% 7.5% 8.7% Sacramento 430 86.7% 1.2% 7.7% 4.4% Washington, DC 51 70.6% 0.0% 9.8% 19.6% Overall 4,064 75.0% 0.6% 13.8% 10.6% Heroin Atlanta 415 97.1% 0.0% 2.4% 0.5% Charlotte 371 96.5% 0.0% 3.0% 0.5% Chicago 446 87.2% 0.7% 5.8% 6.3% Denver 480 93.3% 0.0% 3.5% 3.1% Indianapolis 493 89.2% 0.2% 7.5% 3.0% Minneapolis 432 92.4% 0.2% 4.6% 2.8% New York 540 88.5% 0.7% 5.0% 5.7% Portland 413 88.4% 0.2% 2.2% 9.2% Sacramento 430 91.9% 0.2% 6.3% 1.6% Washington, DC 51 88.2% 0.0% 5.9% 5.9% Overall 4,071 91.4% 0.3% 4.6% 3.8% Methamphetamine Atlanta 415 99.3% 0.0% 0.2% 0.5% Charlotte 371 100.0% 0.0% 0.0% 0.0% Chicago 447 99.8% 0.0% 0.2% 0.0% Denver 478 95.6% 0.4% 1.0% 2.9% Indianapolis 493 99.0% 0.0% 0.6% 0.4% Minneapolis 432 97.7% 0.2% 1.4% 0.7% New York 540 99.6% 0.4% 0.0% 0.0% Portland 412 87.4% 0.5% 5.1% 7.0% Sacramento 429 73.0% 0.7% 9.8% 16.6% Washington, DC 51 98.0% 2.0% 0.0% 0.0% Overall 4,068 94.8% 0.3% 1.9% 3.0%
ADAM II 2009 Annual Report Appendix B: ADAM II Program Methodology 113
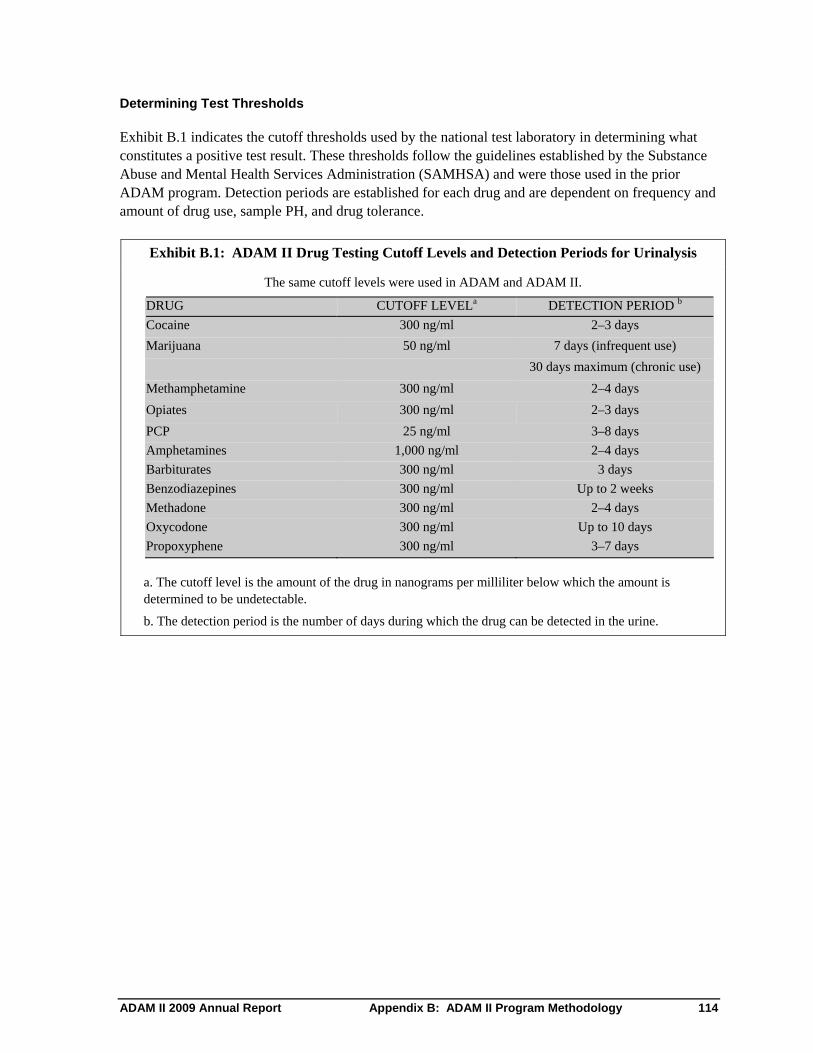
Determining Test Thresholds
Exhibit B.1 indicates the cutoff thresholds used by the national test laboratory in determining what constitutes a positive test result. These thresholds follow the guidelines established by the Substance Abuse and Mental Health Services Administration (SAMHSA) and were those used in the prior ADAM program. Detection periods are established for each drug and are dependent on frequency and amount of drug use, sample PH, and drug tolerance.
Exhibit B.1: ADAM II Drug Testing Cutoff Levels and Detection Periods for Urinalysis
The same cutoff levels were used in ADAM and ADAM II.
DRUG CUTOFF LEVELa DETECTION PERIOD b
Cocaine 300 ng/ml 2–3 days
Marijuana 50 ng/ml 7 days (infrequent use)
30 days maximum (chronic use)
Methamphetamine 300 ng/ml 2–4 days
Opiates 300 ng/ml 2–3 days
PCP 25 ng/ml 3–8 days
Amphetamines 1,000 ng/ml 2–4 days
Barbiturates 300 ng/ml 3 days
Benzodiazepines 300 ng/ml Up to 2 weeks
Methadone 300 ng/ml 2–4 days
Oxycodone 300 ng/ml Up to 10 days
Propoxyphene 300 ng/ml 3–7 days
a. The cutoff level is the amount of the drug in nanograms per milliliter below which the amount is determined to be undetectable.
b. The detection period is the number of days during which the drug can be detected in the urine.
ADAM II 2009 Annual Report Appendix B: ADAM II Program Methodology 114
Appendix C: Site Fact Sheets
Numbers for each site reflected on their Fact Sheets may not correspond exactly to those in the cross-site comparisons in the body of this report and Appendix A.
Although we annualized estimates for fact sheets in 2007 and 2008, we elected to not annualize the estimates for 2009 in the fact sheets alone. Instead, the fact sheets report estimates that are weighted by the ADAM II propensity score weights. We did this for two reasons. One, we are concerned about the reliability of annualizing estimates that either have a very small number underlying of observations, or estimates of binary variables that are very rare or very frequent. There are a number of instances in subcategories where the number of observations underlying the estimates becomes very small—much smaller than those considered reliable by other large surveys such as the NSDUH. Two, computing estimates based upon only the propensity score weights allows outside researchers to more easily replicate our estimates, as the annualization process is highly technical and difficult to replicate. As a check of the decision to not annualize the fact sheets, we compared annualized and non-annualized estimates and found that the annualization factors do not greatly change the estimates. We would be pleased to provide the annualized and non-annualized fact sheets for comparison.
ADAM II 2009 Annual Report Appendix C: Site Fact Sheets 115

ADAM II 2009 Annual Report Site Fact Sheets
ADAM II 2009 Report City of Atlanta/Fulton County, GA
Primary City: Atlanta
Male Arrestees All Statistics Weighted
Facilities in Sample: 2 Sampled Eligible Arrestees: 775 Conditional Interview Response Rate¹: 87% (n = 484) Arrestees Booked in Data Collection Period: 2173 Urine Response Rate to Interviews: 86% (n = 417)
Age of Booked Arrestees (%)
Mean Age <21 21-25 26-30 31-35 36+ Unknown
35.9 7.5 17.3 14.5 10.6 50.1 0.0
Race of Booked Arrestees (%)
American Native Black or Indian/ Hawaiian/
White2 African
American Hispanic/
Latino Alaska Native
Pacific Islander Asian
13.8 84.7 5.3 0.7 0.0 0.1
Percent Positive for Drugs
Testing Positive by Drug and Age (%) Testing Positive by Drugs and Race (%) Total Testing Positive (%)
Std Error <21 21-25 26-30 31-35 36+ Unknown White Black Hispanic Other Unknown
Any Drug3,4 68.1 2.3 67.3 74.8 64.8 63.8 67.5 60.8 69.1 31.1 72.8 54.8 Cocaine 36.3 2.4 3.4 18.2 17.8 42.9 52.1 36.5 37.0 13.5 27.7 0.0 Marijuana 44.9 2.4 67.3 73.4 60.7 45.2 29.1 36.9 47.1 16.1 72.8 54.8 Opiates 2.4 6.6 0.0 0.0 0.9 4.3 10.1 1.6 1.5 0.0 0.0 Oxycodone 0.3 0.0 0.0 0.0 0.9 0.4 0.7 0.2 0.0 0.0 0.0 Meth 0.6 0.0 0.0 0.0 3.2 0.8 3.7 0.3 0.0 0.0 0.0
Multiple Drug3,4 19.0 1.9 10.0 20.9 13.8 28.4 20.4 30.7 18.0 0.0 27.7 0.0
Percent Positive for Drugs by Offense Category
Violent (%) Property (%) Drug Possession
(%) Drug Distribution
(%) Other (%) Unknown (%) (n = 69) (n = 122) (n = 65) (n = 2) (n = 219) (n = 8)
Any Drug3,4 66.0 66.4 85.3 48.1 65.2 100.0 Cocaine 24.5 40.6 44.4 48.1 36.4 53.5 Marijuana 53.8 35.8 72.8 0.0 43.4 100.0 Opiates 1.3 1.3 4.6 0.0 1.9 22.5 Oxycodone 0.0 0.0 1.3 0.0 0.2 0.0 Meth 0.0 0.0 1.2 0.0 1.0 0.0
Multiple Drug3,4 15.0 12.9 36.2 0.0 19.9 64.0
Self-Reported Drug Use in the Past Year and Experience with Drug and Mental Health Treatment
Treatment Time by Type of Treatment (%)
Any Treatment Inpatient Outpatient Mental Health TreatmentEver (%)
Ever % Last Avg Nights Ever % Last Avg Adm Ever % Last Avg Nights
Crack Cocaine 59.6 50.0 Powder Cocaine 43.2 31.5 Marijuana 27.1 19.9 Heroin 84.8 62.5 Meth 39.2 39.2
Year5 Last Year
10.6 4.9 23.0 0.0 0.0 25.5 5.3 0.3 13.6
25.6 0.5 48.0 0.0 0.0 0.0
Year5
3.2 0.0 2.7
48.0 0.0
Last Year 0.3 20.4 0.2 21.7 0.1 10.9 0.3 25.6 0.0 22.0
Year5
6.1 0.0 2.4 0.0 0.0
Last Year 3.4 0.0 1.3 0.0 0.0
1 - Conditional interview response rate is the number of completed interviews divided by the number of sampled arrestees available to be interviewed
2- Categories are not mutually exclusive; arrestees may report multiple race categories.
3 - Drug panel includes marijuana, cocaine, opiates, amphetamine EMIT test, PCP, valium, darvon, methadone, barbiturates, and oxycodone
4 - Denominator includes anyone that provided a large enough urine sample to test for all of the drug panel
5 - Percentage of arrestees responding to the calendar section of the ADAM survey
City of Atlanta/Fulton County, GA, 2009 Page 1
116
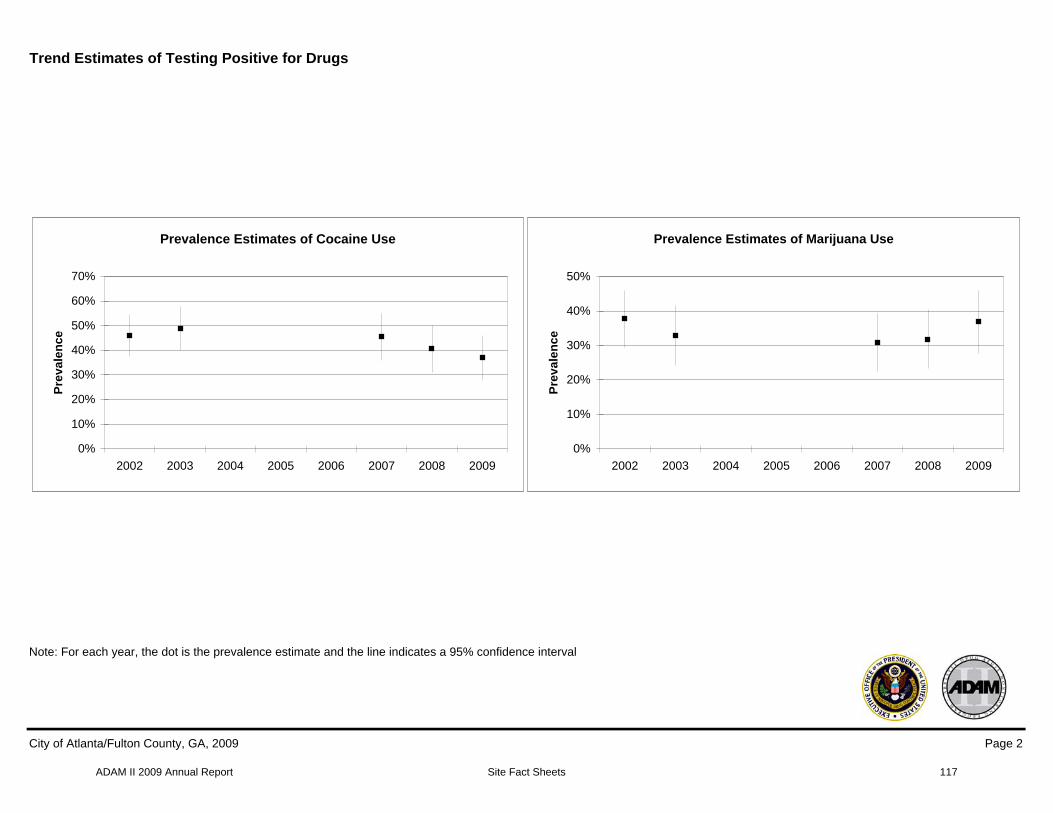
ADAM II 2009 Annual Report Site Fact Sheets
Trend Estimates of Testing Positive for Drugs
Prevalence Estimates of Cocaine Use
0%
10%
20%
30%
40%
50%
60%
70%
2002 2003 2004 2005 2006 2007 2008 2009
Pre
va
len
ce
Prevalence Estimates of Marijuana Use
0%
10%
20%
30%
40%
50%
2002 2003 2004 2005 2006 2007 2008 2009
Pre
va
len
ce
Note: For each year, the dot is the prevalence estimate and the line indicates a 95% confidence interval
City of Atlanta/Fulton County, GA, 2009 Page 2
117
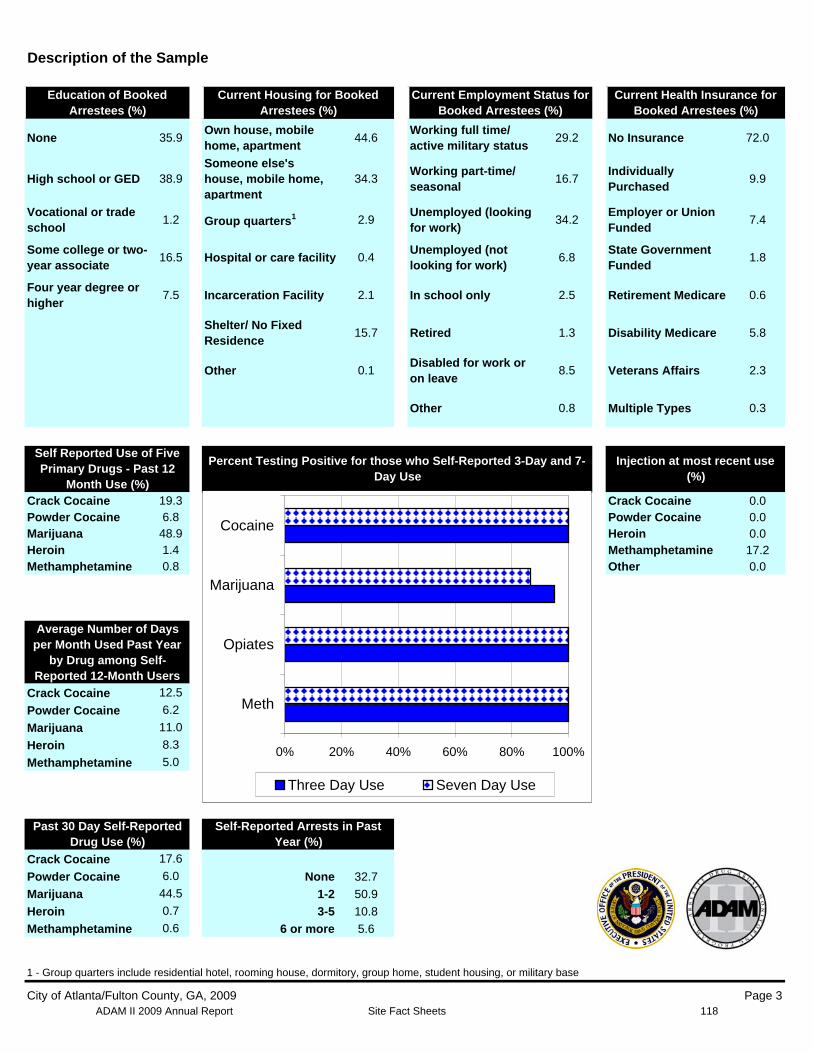
ADAM II 2009 Annual Report Site Fact Sheets
Description of the Sample
Arrestees (%)
None 35.9
High school or GED 38.9
Vocational or trade school
Some college or two-year associate
Four year degree or higher
1.2
16.5
7.5
Self Reported Use of Five Primary Drugs - Past 12
Month Use (%) Crack Cocaine 19.3 Powder Cocaine 6.8 Marijuana 48.9 Heroin 1.4 Methamphetamine 0.8
Education of Booked
Average Number of Days per Month Used Past Year
by Drug among Self-Reported 12-Month Users
Crack Cocaine 12.5
Powder Cocaine 6.2
Marijuana 11.0
Heroin 8.3
Methamphetamine 5.0
Current Housing for Booked Arrestees (%)
Own house, mobile home, apartment
44.6
Someone else's house, mobile home, 34.3 apartment
Group quarters1 2.9
Hospital or care facility 0.4
Incarceration Facility 2.1
Shelter/ No Fixed Residence
15.7
Other 0.1
Current Employment Status forBooked Arrestees (%)
Working full time/ active military status
29.2
Working part-time/ seasonal
16.7
Unemployed (looking for work)
34.2
Unemployed (not looking for work)
6.8
In school only 2.5
Retired 1.3
Disabled for work or on leave
8.5
Other 0.8
Percent Testing Positive for those who Self-Reported 3-Day and 7-Day Use
0% 20% 40% 60% 80% 100%
Meth
Opiates
Marijuana
Cocaine
Three Day Use Seven Day Use
Current Health Insurance forBooked Arrestees (%)
No Insurance 72.0
Individually Purchased
9.9
Employer or Union Funded
7.4
State Government Funded
1.8
Retirement Medicare 0.6
Disability Medicare 5.8
Veterans Affairs 2.3
Multiple Types 0.3
Injection at most recent use (%)
Crack Cocaine 0.0 Powder Cocaine 0.0 Heroin 0.0 Methamphetamine 17.2 Other 0.0
Past 30 Day Self-Reported Drug Use (%)
Crack Cocaine 17.6
Powder Cocaine 6.0
Marijuana 44.5
Heroin 0.7
Methamphetamine 0.6
Self-Reported Arrests in Past Year (%)
None 32.7
1-2 50.9
3-5 10.8
6 or more 5.6
1 - Group quarters include residential hotel, rooming house, dormitory, group home, student housing, or military base
City of Atlanta/Fulton County, GA, 2009 Page 3 118
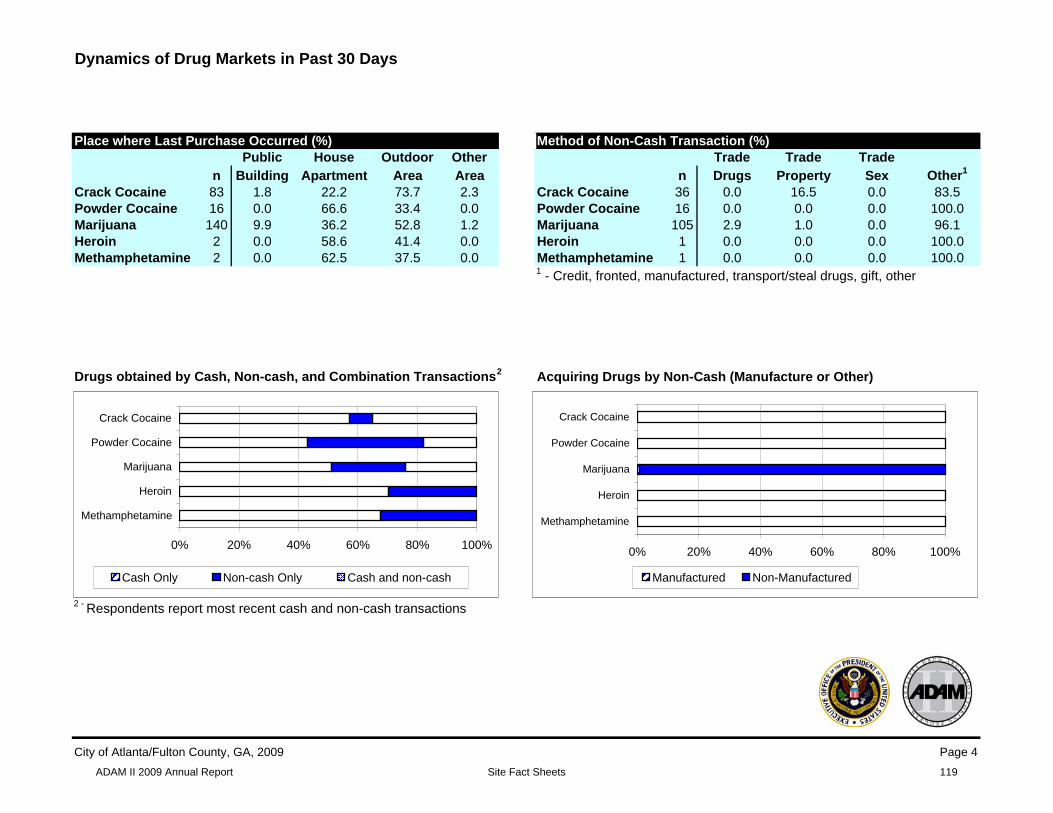
ADAM II 2009 Annual Report Site Fact Sheets
Dynamics of Drug Markets in Past 30 Days
Place where Last Purchase Occurred (%) Public House Outdoor Other
n Building Apartment Area Area Crack Cocaine 83 1.8 22.2 73.7 2.3 Powder Cocaine 16 0.0 66.6 33.4 0.0 Marijuana 140 9.9 36.2 52.8 1.2 Heroin 2 0.0 58.6 41.4 0.0 Methamphetamine 2 0.0 62.5 37.5 0.0
Method of Non-Cash Transaction (%) Trade Trade Trade
n Drugs Property Sex Other1
Crack Cocaine 36 0.0 16.5 0.0 83.5 Powder Cocaine 16 0.0 0.0 0.0 100.0 Marijuana 105 2.9 1.0 0.0 96.1 Heroin 1 0.0 0.0 0.0 100.0 Methamphetamine 1 0.0 0.0 0.0 100.0 1 - Credit, fronted, manufactured, transport/steal drugs, gift, other
Drugs obtained by Cash, Non-cash, and Combination Transactions2 Acquiring Drugs by Non-Cash (Manufacture or Other)
2 - Respondents report most recent cash and non-cash transactions
0% 20% 40% 60% 80% 100%
Methamphetamine
Heroin
Marijuana
Powder Cocaine
Crack Cocaine
Cash Only Non-cash Only Cash and non-cash
0% 20% 40% 60% 80% 100%
Methamphetamine
Heroin
Marijuana
Powder Cocaine
Crack Cocaine
Manufactured Non-Manufactured
City of Atlanta/Fulton County, GA, 2009 Page 4
119
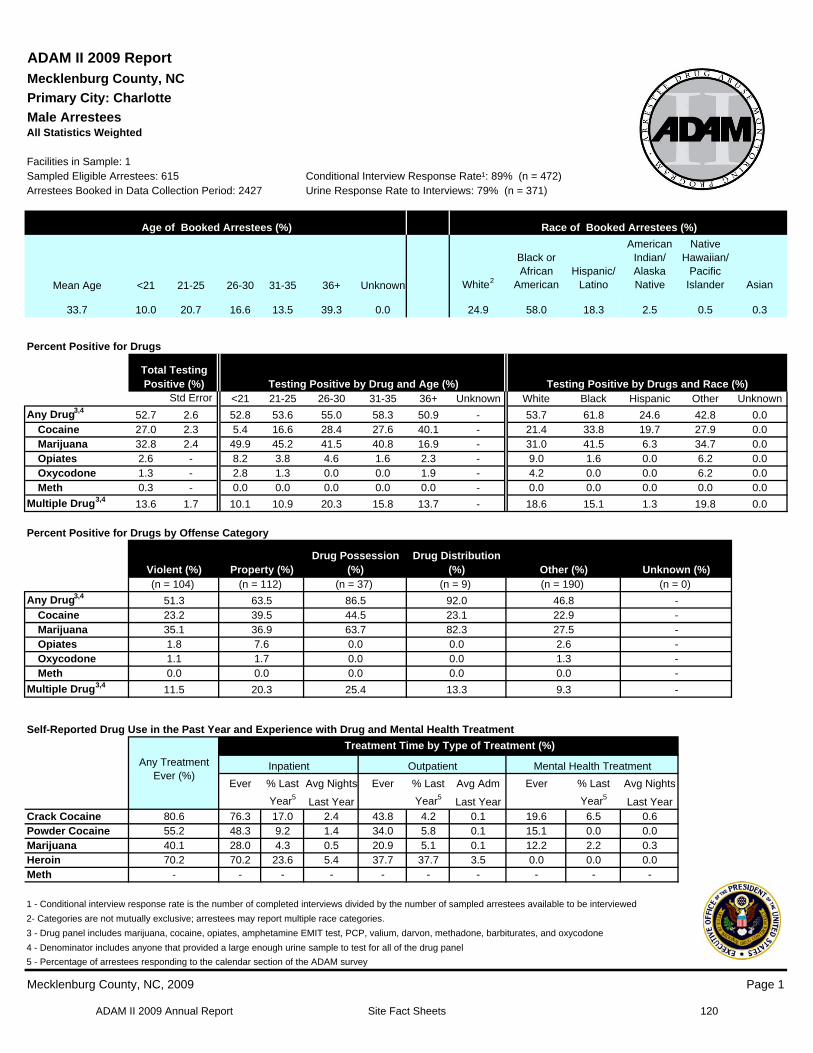
ADAM II 2009 Annual Report Site Fact Sheets
ADAM II 2009 Report Mecklenburg County, NC
Primary City: Charlotte
Male Arrestees All Statistics Weighted
Facilities in Sample: 1 Sampled Eligible Arrestees: 615 Conditional Interview Response Rate¹: 89% (n = 472) Arrestees Booked in Data Collection Period: 2427 Urine Response Rate to Interviews: 79% (n = 371)
Age of Booked Arrestees (%)
Mean Age <21 21-25 26-30 31-35 36+ Unknown
33.7 10.0 20.7 16.6 13.5 39.3 0.0
Race of Booked Arrestees (%)
American Native Black or Indian/ Hawaiian/
White2 African
American Hispanic/
Latino Alaska Native
Pacific Islander Asian
24.9 58.0 18.3 2.5 0.5 0.3
Percent Positive for Drugs
Total Testing Positive (%) Testing Positive by Drug and Age (%) Testing Positive by Drugs and Race (%)
Std Error <21 21-25 26-30 31-35 36+ Unknown White Black Hispanic Other Unknown
Any Drug3,4 52.7 2.6 52.8 53.6 55.0 58.3 50.9 53.7 61.8 24.6 42.8 0.0 Cocaine 27.0 2.3 5.4 16.6 28.4 27.6 40.1 21.4 33.8 19.7 27.9 0.0 Marijuana 32.8 2.4 49.9 45.2 41.5 40.8 16.9 31.0 41.5 6.3 34.7 0.0 Opiates 2.6 8.2 3.8 4.6 1.6 2.3 9.0 1.6 0.0 6.2 0.0 Oxycodone 1.3 2.8 1.3 0.0 0.0 1.9 4.2 0.0 0.0 6.2 0.0 Meth 0.3 0.0 0.0 0.0 0.0 0.0 0.0 0.0 0.0 0.0 0.0
Multiple Drug3,4 13.6 1.7 10.1 10.9 20.3 15.8 13.7 18.6 15.1 1.3 19.8 0.0
Percent Positive for Drugs by Offense Category
Violent (%) Property (%) Drug Possession
(%) Drug Distribution
(%) Other (%) Unknown (%) (n = 104) (n = 112) (n = 37) (n = 9) (n = 190) (n = 0)
Any Drug3,4 51.3 63.5 86.5 92.0 46.8 -Cocaine 23.2 39.5 44.5 23.1 22.9 -Marijuana 35.1 36.9 63.7 82.3 27.5 -Opiates 1.8 7.6 0.0 0.0 2.6 -Oxycodone 1.1 1.7 0.0 0.0 1.3 -Meth 0.0 0.0 0.0 0.0 0.0 -
Multiple Drug3,4 11.5 20.3 25.4 13.3 9.3 -
Self-Reported Drug Use in the Past Year and Experience with Drug and Mental Health Treatment
Treatment Time by Type of Treatment (%)
Any Treatment Inpatient Outpatient Mental Health TreatmentEver (%)
Ever % Last Avg Nights Ever % Last Avg Adm Ever % Last Avg Nights
Crack Cocaine 80.6 76.3 Powder Cocaine 55.2 48.3 Marijuana 40.1 28.0 Heroin 70.2 70.2 Meth - -
Year5 Last Year
17.0 2.4 43.8 9.2 1.4 34.0 4.3 0.5 20.9
23.6 5.4 37.7 - - -
Year5
4.2 5.8 5.1
37.7 -
Last Year 0.1 19.6 0.1 15.1 0.1 12.2 3.5 0.0 - -
Year5
6.5 0.0 2.2 0.0 -
Last Year 0.6 0.0 0.3 0.0 -
1 - Conditional interview response rate is the number of completed interviews divided by the number of sampled arrestees available to be interviewed
2- Categories are not mutually exclusive; arrestees may report multiple race categories.
3 - Drug panel includes marijuana, cocaine, opiates, amphetamine EMIT test, PCP, valium, darvon, methadone, barbiturates, and oxycodone
4 - Denominator includes anyone that provided a large enough urine sample to test for all of the drug panel
5 - Percentage of arrestees responding to the calendar section of the ADAM survey
Mecklenburg County, NC, 2009 Page 1
120
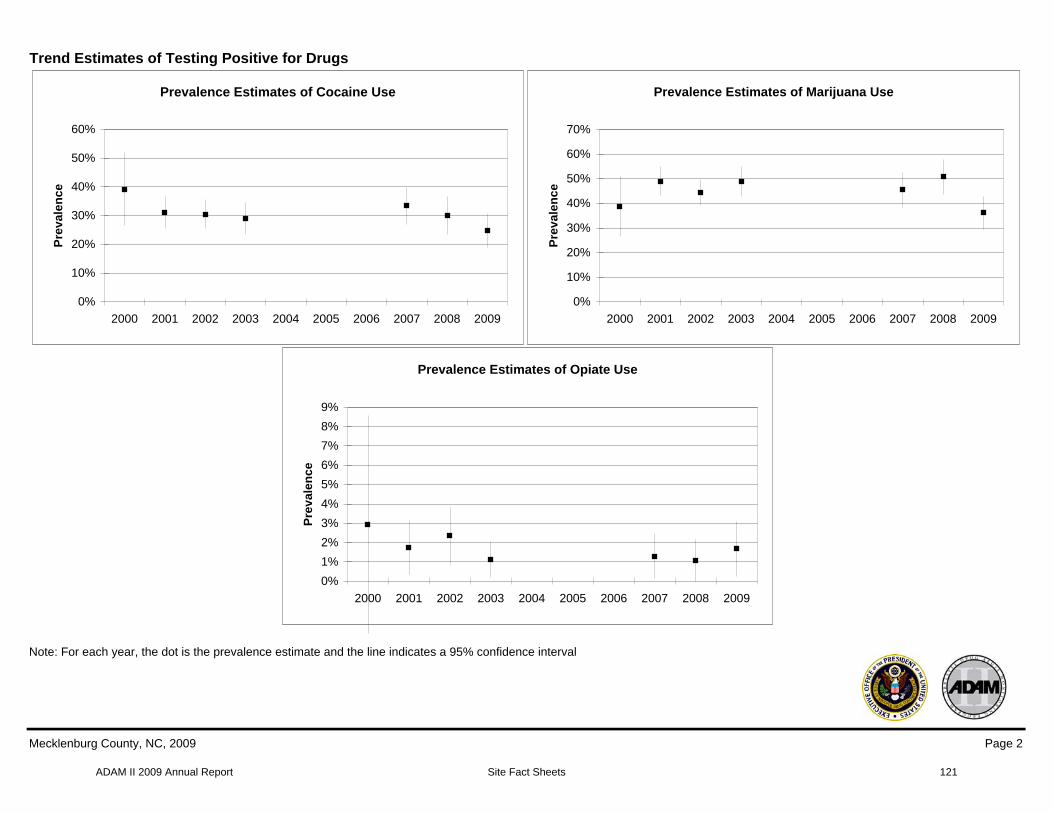
ADAM II 2009 Annual Report Site Fact Sheets
Trend Estimates of Testing Positive for Drugs
Prevalence Estimates of Cocaine Use
0%
10%
20%
30%
40%
50%
60%
2000 2001 2002 2003 2004 2005 2006 2007 2008 2009
Pre
va
len
ce
Prevalence Estimates of Opiate Use
0%
1%
2%
3%
4%
5%
6%
7%
8%
9%
2000 2001 2002 2003 2004 2005 2006 2007 2008 2009
Pre
va
len
ce
Prevalence Estimates of Marijuana Use
0%
10%
20%
30%
40%
50%
60%
70%
2000 2001 2002 2003 2004 2005 2006 2007 2008 2009
Pre
va
len
ce
Note: For each year, the dot is the prevalence estimate and the line indicates a 95% confidence interval
Mecklenburg County, NC, 2009 Page 2
121
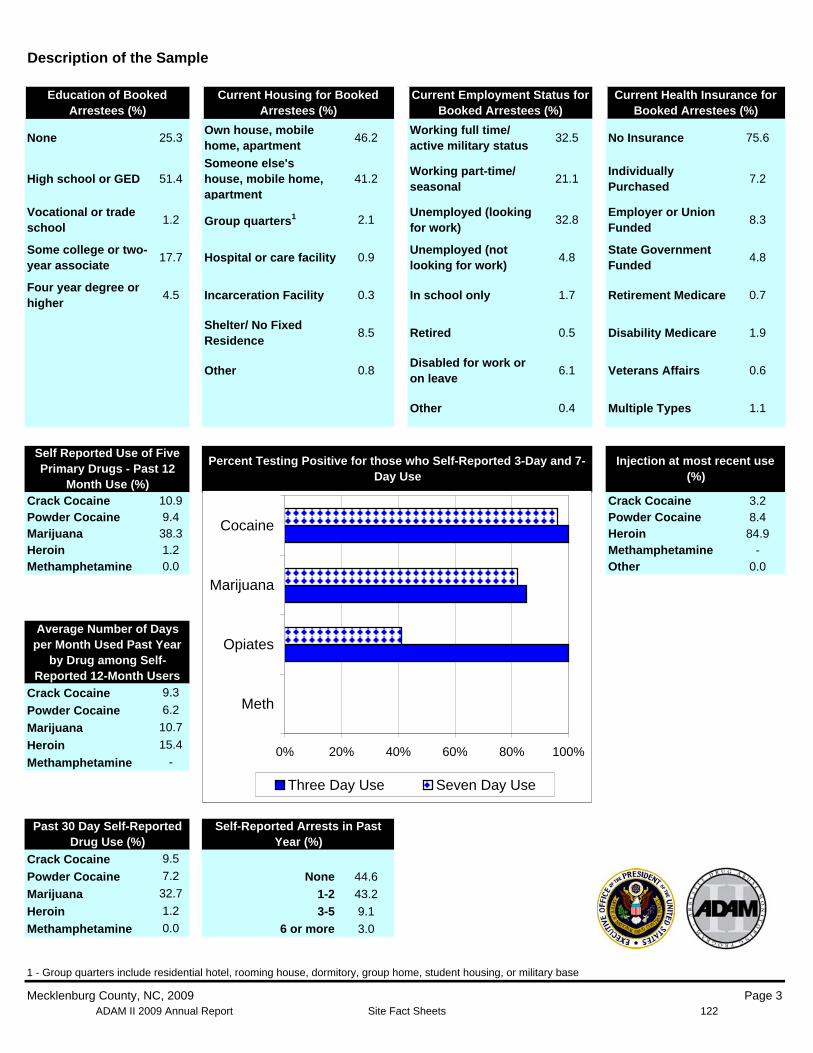
ADAM II 2009 Annual Report Site Fact Sheets
Description of the Sample
Education of Booked Arrestees (%)
None 25.3
High school or GED 51.4
Vocational or trade school
1.2
Some college or two-year associate
17.7
Four year degree or higher
4.5
Current Housing for Booked Arrestees (%)
Own house, mobile home, apartment
46.2
Someone else's house, mobile home, 41.2 apartment
Group quarters1 2.1
Hospital or care facility 0.9
Incarceration Facility 0.3
Shelter/ No Fixed Residence
8.5
Other 0.8
Current Employment Status for Booked Arrestees (%)
Working full time/ active military status
32.5
Working part-time/ seasonal
21.1
Unemployed (looking for work)
32.8
Unemployed (not looking for work)
4.8
In school only 1.7
Retired 0.5
Disabled for work or on leave
6.1
Other 0.4
Current Health Insurance for Booked Arrestees (%)
No Insurance 75.6
Individually Purchased
7.2
Employer or Union Funded
8.3
State Government Funded
4.8
Retirement Medicare 0.7
Disability Medicare 1.9
Veterans Affairs 0.6
Multiple Types 1.1
Self Reported Use of Five Primary Drugs - Past 12
Month Use (%) Crack Cocaine 10.9 Powder Cocaine 9.4 Marijuana 38.3 Heroin 1.2 Methamphetamine 0.0
Injection at most recent use (%)
Crack Cocaine 3.2 Powder Cocaine 8.4 Heroin 84.9 Methamphetamine -Other 0.0
Average Number of Days per Month Used Past Year
by Drug among Self-Reported 12-Month Users
Crack Cocaine 9.3
Powder Cocaine 6.2
Marijuana 10.7
Heroin 15.4
Methamphetamine -
Past 30 Day Self-Reported Drug Use (%)
Crack Cocaine 9.5
Powder Cocaine 7.2
Marijuana 32.7
Heroin 1.2
Methamphetamine 0.0
Self-Reported Arrests in Past Year (%)
None 44.6
1-2 43.2
3-5 9.1
6 or more 3.0
Percent Testing Positive for those who Self-Reported 3-Day and 7-Day Use
0% 20% 40% 60% 80% 100%
Meth
Opiates
Marijuana
Cocaine
Three Day Use Seven Day Use
1 - Group quarters include residential hotel, rooming house, dormitory, group home, student housing, or military base
Mecklenburg County, NC, 2009 Page 3 122
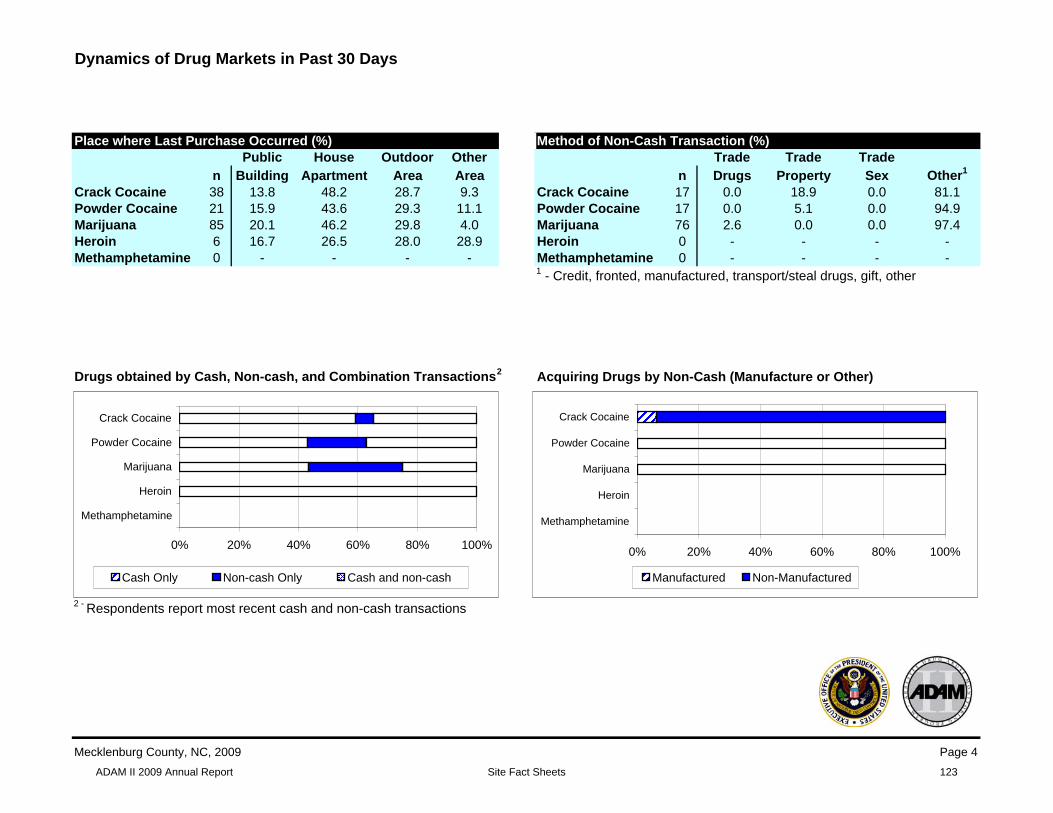
ADAM II 2009 Annual Report Site Fact Sheets
Dynamics of Drug Markets in Past 30 Days
Place where Last Purchase Occurred (%) Public House Outdoor Other
n Building Apartment Area Area Crack Cocaine 38 13.8 48.2 28.7 9.3 Powder Cocaine 21 15.9 43.6 29.3 11.1 Marijuana 85 20.1 46.2 29.8 4.0 Heroin 6 16.7 26.5 28.0 28.9 Methamphetamine 0 - - - -
Method of Non-Cash Transaction (%) Trade Trade Trade
n Drugs Property Sex Other1
Crack Cocaine 17 0.0 18.9 0.0 81.1 Powder Cocaine 17 0.0 5.1 0.0 94.9 Marijuana 76 2.6 0.0 0.0 97.4 Heroin 0 - - - -Methamphetamine 0 - - -1 - Credit, fronted, manufactured, transport/steal drugs, gift, other
-
Drugs obtained by Cash, Non-cash, and Combination Transactions2 Acquiring Drugs by Non-Cash (Manufacture or Other)
2 - Respondents report most recent cash and non-cash transactions
0% 20% 40% 60% 80% 100%
Methamphetamine
Heroin
Marijuana
Powder Cocaine
Crack Cocaine
Cash Only Non-cash Only Cash and non-cash
0% 20% 40% 60% 80% 100%
Methamphetamine
Heroin
Marijuana
Powder Cocaine
Crack Cocaine
Manufactured Non-Manufactured
Mecklenburg County, NC, 2009 Page 4
123

ADAM II 2009 Annual Report Site Fact Sheets
ADAM II 2009 Report
Cook County, IL
Primary City: Chicago
Male Arrestees All Statistics Weighted
Facilities in Sample: 1 Sampled Eligible Arrestees: 549 Conditional Interview Response Rate¹: 94% (n = 483) Arrestees Booked in Data Collection Period: 6665 Urine Response Rate to Interviews: 93% (n = 449)
Age of Booked Arrestees (%)
Mean Age <21 21-25 26-30 31-35 36+ Unknown
32.0 15.0 21.0 18.4 11.7 33.9 0.0
Race of Booked Arrestees (%)
American Native Black or Indian/ Hawaiian/
White2 African
American Hispanic/
Latino Alaska Native
Pacific Islander Asian
26.0 66.7 20.8 1.1 3.0 0.3
Percent Positive for Drugs
Total Testing Positive (%) Testing Positive by Drug and Age (%) Testing Positive by Drugs and Race (%)
Std Error <21 21-25 26-30 31-35 36+ Unknown White Black Hispanic Other Unknown
Any Drug3,4 71.6 2.6 72.3 75.4 72.4 66.2 72.0 66.9 73.2 67.9 79.0 76.2 Cocaine 26.4 2.4 3.1 14.1 26.9 27.2 46.5 28.4 24.9 28.9 34.8 0.0 Marijuana 47.4 2.8 68.6 66.3 53.2 49.0 25.4 45.5 50.7 45.8 46.0 42.6 Opiates 12.3 1.7 2.5 4.4 10.7 16.0 22.4 14.9 12.6 2.0 0.0 33.6 Oxycodone 0.0 0.0 0.0 0.0 0.0 0.0 0.0 0.0 0.0 0.0 0.0 Meth 0.2 0.0 0.0 1.8 0.0 0.0 1.3 0.0 1.6 0.0 0.0
Multiple Drug3,4 19.6 2.1 8.3 12.8 22.1 19.9 29.1 25.1 18.8 16.0 18.1 33.6
Percent Positive for Drugs by Offense Category
Drug Possession Drug Distribution Violent (%) Property (%) (%) (%) Other (%) Unknown (%) (n = 175) (n = 93) (n = 62) (n = 15) (n = 137) (n = 6)
Any Drug3,4 68.7 80.3 88.0 83.7 61.9 61.5 Cocaine 19.7 40.7 39.5 40.0 21.2 33.4 Marijuana 52.6 42.2 56.0 42.2 42.6 45.7 Opiates 4.5 22.6 27.6 17.3 10.4 0.0 Oxycodone 0.0 0.0 0.0 0.0 0.0 0.0 Meth 0.0 0.0 2.3 0.0 0.0 0.0
Multiple Drug3,4 12.4 29.8 33.7 25.0 16.9 35.2
Self-Reported Drug Use in the Past Year and Experience with Drug and Mental Health Treatment
Any Treatment Ever (%)
Treatment Time by Type of Treatment (%)
Inpatient Outpatient Mental Health Treatment
Ever % Last Avg Nights Ever % Last Avg Adm Ever % Last Avg Nights
Year5 Last Year Year5
Last Year Year5 Last Year
Crack Cocaine 75.4 54.4 8.1 2.7 48.6 15.8 2.5 36.7 9.1 0.3 Powder Cocaine 56.7 41.5 7.2 0.2 35.3 8.4 0.1 27.0 8.9 0.3 Marijuana 35.2 17.1 2.7 0.6 19.7 2.5 0.9 15.5 5.2 0.5 Heroin 71.5 54.7 5.9 0.8 46.7 13.9 3.1 29.4 4.7 0.3 Meth 0.0 0.0 0.0 0.0 0.0 0.0 0.0 0.0 0.0 0.0
1 - Conditional interview response rate is the number of completed interviews divided by the number of sampled arrestees available to be interviewed
2- Categories are not mutually exclusive; arrestees may report multiple race categories.
3 - Drug panel includes marijuana, cocaine, opiates, amphetamine EMIT test, PCP, valium, darvon, methadone, barbiturates, and oxycodone
4 - Denominator includes anyone that provided a large enough urine sample to test for all of the drug panel
5 - Percentage of arrestees responding to the calendar section of the ADAM survey
Cook County, IL, 2009 Page 1
124
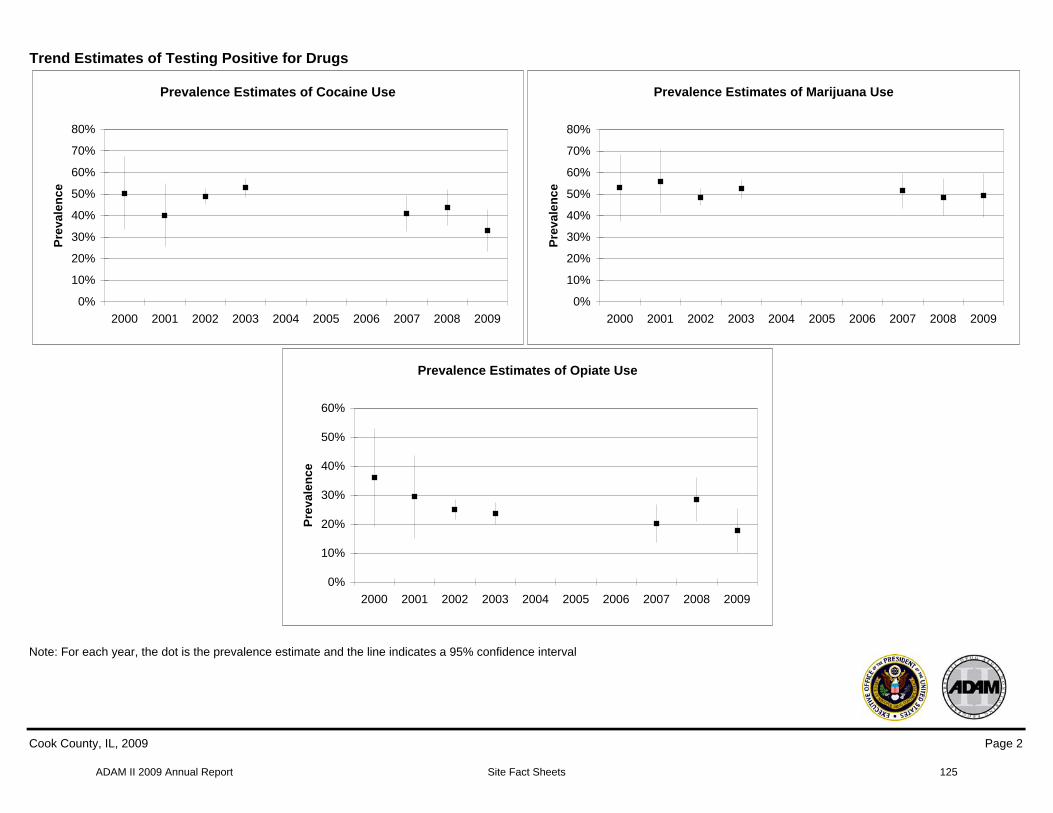
ADAM II 2009 Annual Report Site Fact Sheets
Trend Estimates of Testing Positive for Drugs
Prevalence Estimates of Cocaine Use
0%
10%
20%
30%
40%
50%
60%
70%
80%
2000 2001 2002 2003 2004 2005 2006 2007 2008 2009
Pre
va
len
ce
Prevalence Estimates of Opiate Use
0%
10%
20%
30%
40%
50%
60%
2000 2001 2002 2003 2004 2005 2006 2007 2008 2009
Pre
va
len
ce
Prevalence Estimates of Marijuana Use
0%
10%
20%
30%
40%
50%
60%
70%
80%
2000 2001 2002 2003 2004 2005 2006 2007 2008 2009
Pre
va
len
ce
Note: For each year, the dot is the prevalence estimate and the line indicates a 95% confidence interval
Cook County, IL, 2009 Page 2
125
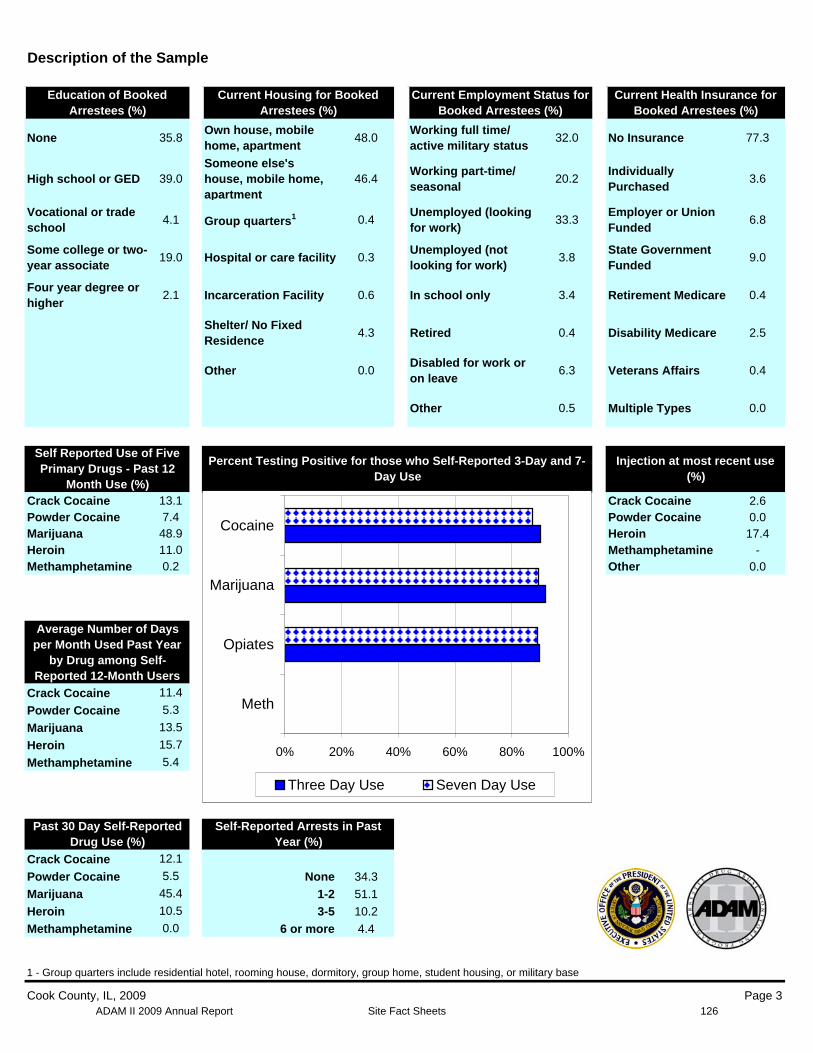
ADAM II 2009 Annual Report Site Fact Sheets
Description of the Sample
Education of Booked Arrestees (%)
None 35.8
High school or GED 39.0
Vocational or trade school
4.1
Some college or two-year associate
19.0
Four year degree or higher
2.1
Current Housing for Booked Arrestees (%)
Own house, mobile home, apartment
48.0
Someone else's house, mobile home, 46.4 apartment
Group quarters1 0.4
Hospital or care facility 0.3
Incarceration Facility 0.6
Shelter/ No Fixed Residence
4.3
Other 0.0
Current Employment Status forBooked Arrestees (%)
Working full time/ active military status
32.0
Working part-time/ seasonal
20.2
Unemployed (looking for work)
33.3
Unemployed (not looking for work)
3.8
In school only 3.4
Retired 0.4
Disabled for work or on leave
6.3
Other 0.5
Current Health Insurance for Booked Arrestees (%)
No Insurance 77.3
Individually Purchased
3.6
Employer or Union Funded
6.8
State Government Funded
9.0
Retirement Medicare 0.4
Disability Medicare 2.5
Veterans Affairs 0.4
Multiple Types 0.0
Self Reported Use of Five Primary Drugs - Past 12
Month Use (%) Crack Cocaine 13.1 Powder Cocaine 7.4 Marijuana 48.9 Heroin 11.0 Methamphetamine 0.2
Injection at most recent use (%)
Crack Cocaine 2.6 Powder Cocaine 0.0 Heroin 17.4 Methamphetamine -Other 0.0
Average Number of Days per Month Used Past Year
by Drug among Self-Reported 12-Month Users
Crack Cocaine 11.4
Powder Cocaine 5.3
Marijuana 13.5
Heroin 15.7
Methamphetamine 5.4
Past 30 Day Self-Reported Drug Use (%)
Crack Cocaine 12.1
Powder Cocaine 5.5
Marijuana 45.4
Heroin 10.5
Methamphetamine 0.0
Self-Reported Arrests in Past Year (%)
None 34.3
1-2 51.1
3-5 10.2
6 or more 4.4
Percent Testing Positive for those who Self-Reported 3-Day and 7-Day Use
0% 20% 40% 60% 80% 100%
Meth
Opiates
Marijuana
Cocaine
Three Day Use Seven Day Use
1 - Group quarters include residential hotel, rooming house, dormitory, group home, student housing, or military base
Cook County, IL, 2009 Page 3 126
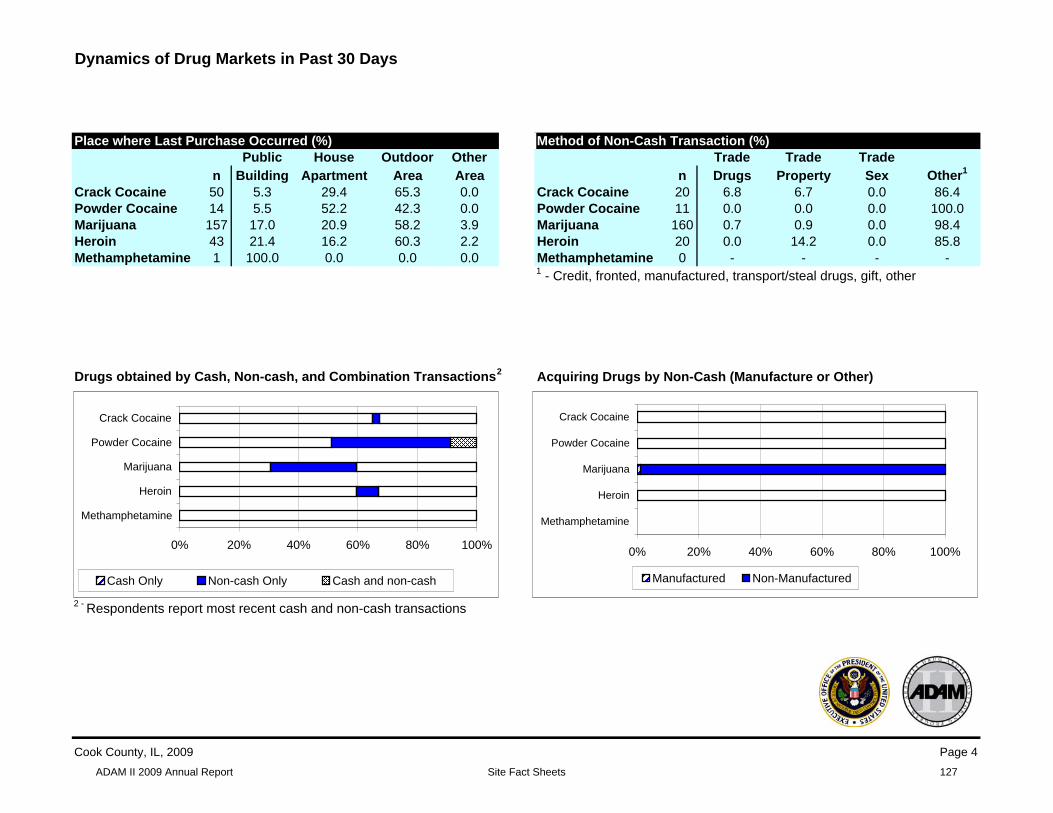
ADAM II 2009 Annual Report Site Fact Sheets
Dynamics of Drug Markets in Past 30 Days
Place where Last Purchase Occurred (%) Public House Outdoor Other
n Building Apartment Area Area Crack Cocaine 50 5.3 29.4 65.3 0.0 Powder Cocaine 14 5.5 52.2 42.3 0.0 Marijuana 157 17.0 20.9 58.2 3.9 Heroin 43 21.4 16.2 60.3 2.2 Methamphetamine 1 100.0 0.0 0.0 0.0
Method of Non-Cash Transaction (%) Trade Trade Trade
n Drugs Property Sex Other1
Crack Cocaine 20 6.8 6.7 0.0 86.4 Powder Cocaine 11 0.0 0.0 0.0 100.0 Marijuana 160 0.7 0.9 0.0 98.4 Heroin 20 0.0 14.2 0.0 85.8 Methamphetamine 0 - - -1 - Credit, fronted, manufactured, transport/steal drugs, gift, other
-
Drugs obtained by Cash, Non-cash, and Combination Transactions2 Acquiring Drugs by Non-Cash (Manufacture or Other)
2 - Respondents report most recent cash and non-cash transactions
0% 20% 40% 60% 80% 100%
Methamphetamine
Heroin
Marijuana
Powder Cocaine
Crack Cocaine
Cash Only Non-cash Only Cash and non-cash
0% 20% 40% 60% 80% 100%
Methamphetamine
Heroin
Marijuana
Powder Cocaine
Crack Cocaine
Manufactured Non-Manufactured
Cook County, IL, 2009 Page 4
127

ADAM II 2009 Annual Report Site Fact Sheets
ADAM II 2009 Report
Denver County, CO
Primary City: Denver
Male Arrestees All Statistics Weighted
Facilities in Sample: 1 Sampled Eligible Arrestees: 737 Conditional Interview Response Rate¹: 87% (n = 541) Arrestees Booked in Data Collection Period: 2315 Urine Response Rate to Interviews: 89% (n = 480)
Age of Booked Arrestees (%)
Mean Age <21 21-25 26-30 31-35 36+ Unknown
34.1 11.6 20.4 14.9 10.2 42.9 0.0
Race of Booked Arrestees (%)
American Native Black or Indian/ Hawaiian/
White2 African
American Hispanic/
Latino Alaska Native
Pacific Islander Asian
50.1 30.8 44.3 10.5 1.6 1.1
Percent Positive for Drugs
Testing Positive by Drug and Age (%) Testing Positive by Drugs and Race (%) Total Testing Positive (%)
Std Error <21 21-25 26-30 31-35 36+ Unknown White Black Hispanic Other Unknown
Any Drug3,4 68.8 2.3 81.8 69.9 62.2 68.5 67.1 63.5 78.0 60.9 66.7 100.0 Cocaine 28.2 2.3 6.6 17.9 29.6 28.4 37.6 22.6 33.5 28.6 30.3 0.0 Marijuana 45.2 2.5 81.8 55.8 44.3 44.9 29.9 39.4 52.9 39.3 43.6 100.0 Opiates 6.1 1.1 3.9 5.0 7.4 6.9 7.5 9.5 5.0 4.7 1.0 0.0 Oxycodone 0.9 2.1 0.0 1.1 0.0 1.2 1.0 0.9 1.0 0.0 0.0 Meth 4.3 1.1 0.0 5.3 10.5 3.6 3.7 7.5 0.9 4.4 2.6 0.0
Multiple Drug3,4 19.7 2.0 10.8 18.8 24.5 17.2 20.4 19.3 17.9 18.5 18.2 0.0
Percent Positive for Drugs by Offense Category
Violent (%) Property (%) Drug Possession
(%) Drug Distribution
(%) Other (%) Unknown (%) (n = 118) (n = 91) (n = 80) (n = 0) (n = 268) (n = 2)
Any Drug3,4 69.7 69.2 84.0 - 63.9 100.0 Cocaine 21.7 25.6 46.5 - 24.1 0.0 Marijuana 48.0 43.4 49.7 - 41.9 100.0 Opiates 4.9 8.0 13.2 - 4.7 0.0 Oxycodone 0.0 1.1 3.4 - 0.4 0.0 Meth 1.4 5.6 7.8 - 4.1 0.0
Multiple Drug3,4 11.6 21.6 34.8 - 16.7 0.0
Self-Reported Drug Use in the Past Year and Experience with Drug and Mental Health Treatment
Any Treatment Ever (%)
Treatment Time by Type of Treatment (%)
Inpatient Outpatient Mental Health Treatment
Ever % Last Avg Nights Ever % Last Avg Adm Ever % Last Avg Nights
Year5 Last Year Year5
Last Year Year5 Last Year
Crack Cocaine 74.7 60.8 27.6 18.1 32.0 15.0 0.3 25.1 6.1 0.2 Powder Cocaine 47.3 38.7 11.7 3.9 22.3 10.6 0.2 12.7 3.2 0.1 Marijuana 46.1 34.4 13.2 5.3 21.8 6.6 0.1 11.6 2.6 1.6 Heroin 67.9 59.9 27.6 9.8 27.0 16.7 0.4 36.8 11.5 0.4 Meth 56.1 25.9 6.7 2.0 36.6 15.6 0.3 26.2 11.7 0.3
1 - Conditional interview response rate is the number of completed interviews divided by the number of sampled arrestees available to be interviewed
2- Categories are not mutually exclusive; arrestees may report multiple race categories.
3 - Drug panel includes marijuana, cocaine, opiates, amphetamine EMIT test, PCP, valium, darvon, methadone, barbiturates, and oxycodone
4 - Denominator includes anyone that provided a large enough urine sample to test for all of the drug panel
5 - Percentage of arrestees responding to the calendar section of the ADAM survey
Denver County, CO, 2009 Page 1
128
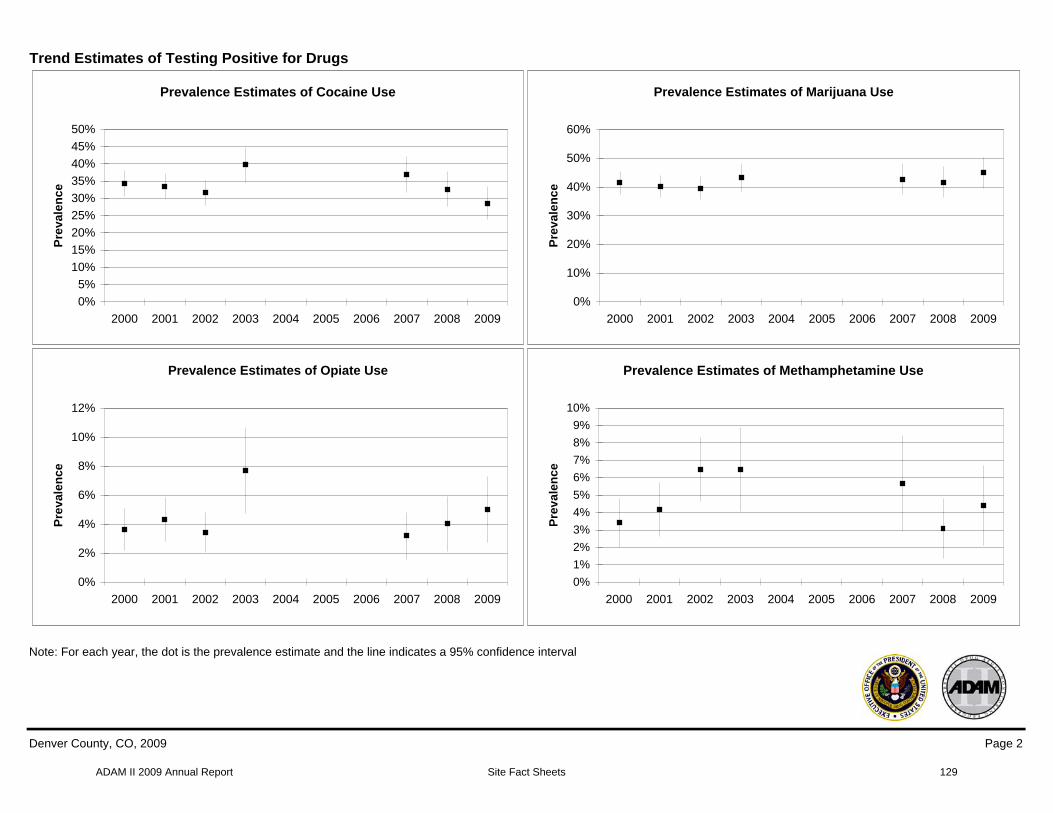
ADAM II 2009 Annual Report Site Fact Sheets
Trend Estimates of Testing Positive for Drugs
Prevalence Estimates of Cocaine Use
0%
5%
10%
15%
20%
25%
30%
35%
40%
45%
50%
2000 2001 2002 2003 2004 2005 2006 2007 2008 2009
Pre
va
len
ce
Prevalence Estimates of Marijuana Use
0%
10%
20%
30%
40%
50%
60%
2000 2001 2002 2003 2004 2005 2006 2007 2008 2009
Pre
va
len
ce
Note: For each year, the dot is the prevalence estimate and the line indicates a 95% confidence interval
Prevalence Estimates of Opiate Use
0%
2%
4%
6%
8%
10%
12%
2000 2001 2002 2003 2004 2005 2006 2007 2008 2009
Pre
va
len
ce
Prevalence Estimates of Methamphetamine Use
0%
1%
2%
3%
4%
5%
6%
7%
8%
9%
10%
2000 2001 2002 2003 2004 2005 2006 2007 2008 2009
Pre
va
len
ce
Denver County, CO, 2009 Page 2
129

ADAM II 2009 Annual Report Site Fact Sheets
Description of the Sample
Education of Booked Arrestees (%)
None 30.3
High school or GED 40.1
Vocational or trade school
3.6
Some college or two-year associate
20.8
Four year degree or higher
5.1
Self Reported Use of Five Primary Drugs - Past 12
Month Use (%) Crack Cocaine 17.1 Powder Cocaine 15.8 Marijuana 51.4 Heroin 4.6 Methamphetamine 6.4
Average Number of Days per Month Used Past Year
by Drug among Self-Reported 12-Month Users
Crack Cocaine 5.8
Powder Cocaine 2.7
Marijuana 10.0
Heroin 12.4
Methamphetamine 4.3
Current Housing for Booked Arrestees (%)
Own house, mobile home, apartment
45.6
Someone else's house, mobile home, 33.4 apartment
Group quarters1 3.9
Hospital or care facility 1.0
Incarceration Facility 1.3
Shelter/ No Fixed Residence
14.6
Other 0.2
Current Employment Status for Booked Arrestees (%)
Working full time/ active military status
32.2
Working part-time/ seasonal
16.6
Unemployed (looking for work)
32.8
Unemployed (not looking for work)
5.3
In school only 3.7
Retired 1.1
Disabled for work or on leave
7.6
Other 0.7
Percent Testing Positive for those who Self-Reported 3-Day and 7-Day Use
0% 20% 40% 60% 80% 100%
Meth
Opiates
Marijuana
Cocaine
Three Day Use Seven Day Use
N
Current Health Insurance for Booked Arrestees (%)
o Insurance 71.0
ndividually urchased
4.6
mployer or Union unded
tate Government unded
10.1
9.1
etirement Medicare 0.5
isability Medicare 3.1
eterans Affairs 1.7
ultiple Types 0.0
IP
EF
SF
R
D
V
M
Injection at most recent use (%)
Crack Cocaine 0.0 Powder Cocaine 9.9 Heroin 66.8 Methamphetamine 22.1 Other 0.0
Past 30 Day Self-Reported Drug Use (%)
Crack Cocaine 14.3
Powder Cocaine 9.4
Marijuana 47.1
Heroin 4.0
Methamphetamine 4.3
Self-Reported Arrests in Past Year (%)
None 55.2
1-2 40.6
3-5 4.2
6 or more 0.0
1 - Group quarters include residential hotel, rooming house, dormitory, group home, student housing, or military base
Denver County, CO, 2009 Page 3 130
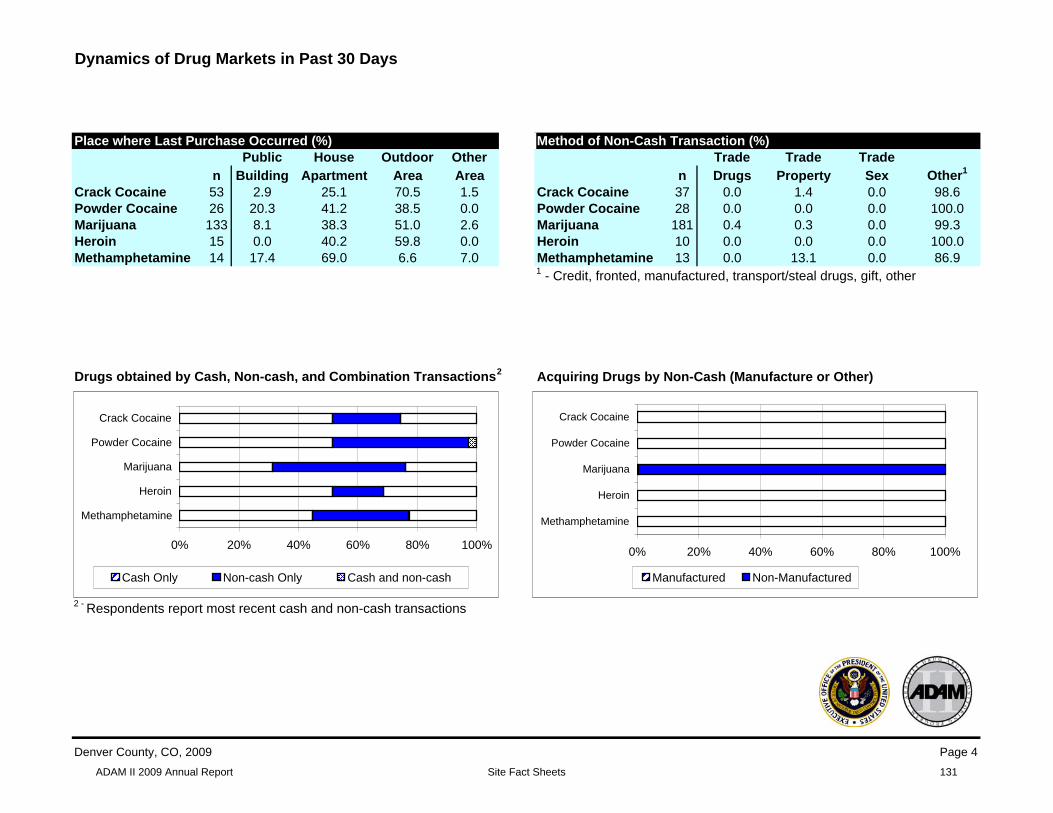
ADAM II 2009 Annual Report Site Fact Sheets
Dynamics of Drug Markets in Past 30 Days
Place where Last Purchase Occurred (%) Public House Outdoor Other
n Building Apartment Area Area Crack Cocaine 53 2.9 25.1 70.5 1.5 Powder Cocaine 26 20.3 41.2 38.5 0.0 Marijuana 133 8.1 38.3 51.0 2.6 Heroin 15 0.0 40.2 59.8 0.0 Methamphetamine 14 17.4 69.0 6.6 7.0
Method of Non-Cash Transaction (%) Trade Trade Trade
n Drugs Property Sex Other1
Crack Cocaine 37 0.0 1.4 0.0 98.6 Powder Cocaine 28 0.0 0.0 0.0 100.0 Marijuana 181 0.4 0.3 0.0 99.3 Heroin 10 0.0 0.0 0.0 100.0 Methamphetamine 13 0.0 13.1 0.0 1 - Credit, fronted, manufactured, transport/steal drugs, gift, other
86.9
Drugs obtained by Cash, Non-cash, and Combination Transactions2 Acquiring Drugs by Non-Cash (Manufacture or Other)
2 - Respondents report most recent cash and non-cash transactions
0% 20% 40% 60% 80% 100%
Methamphetamine
Heroin
Marijuana
Powder Cocaine
Crack Cocaine
Cash Only Non-cash Only Cash and non-cash
0% 20% 40% 60% 80% 100%
Methamphetamine
Heroin
Marijuana
Powder Cocaine
Crack Cocaine
Manufactured Non-Manufactured
Denver County, CO, 2009 Page 4
131

ADAM II 2009 Annual Report Site Fact Sheets
ADAM II 2009 Report
Marion County, IN
Primary City: Indianapolis
Male Arrestees All Statistics Weighted
Facilities in Sample: 1 Sampled Eligible Arrestees: 787 Conditional Interview Response Rate¹: 91% (n = 556) Arrestees Booked in Data Collection Period: 3601 Urine Response Rate to Interviews: 89% (n = 493)
Age of Booked Arrestees (%)
Mean Age <21 21-25 26-30 31-35 36+ Unknown
31.9 14.0 22.0 18.9 11.8 33.3 0.0
Race of Booked Arrestees (%)
American Native Black or Indian/ Hawaiian/
White2 African
American Hispanic/
Latino Alaska Native
Pacific Islander Asian
48.8 48.7 14.6 7.0 1.2 0.7
Percent Positive for Drugs
Testing Positive by Drug and Age (%) Testing Positive by Drugs and Race (%) Total Testing Positive (%)
Std Error <21 21-25 26-30 31-35 36+ Unknown White Black Hispanic Other Unknown
Any Drug3,4 60.0 2.8 66.5 62.5 60.0 60.8 58.1 58.7 66.0 34.2 55.1 0.0 Cocaine 21.2 2.3 6.8 14.5 16.3 21.7 34.5 16.8 26.4 16.6 18.1 0.0 Marijuana 42.7 2.8 62.9 52.3 52.8 39.6 27.2 37.9 54.2 19.1 40.5 0.0 Opiates 8.9 1.6 3.5 12.2 9.3 9.7 10.3 15.3 3.8 2.1 11.2 0.0 Oxycodone 1.9 2.1 0.8 2.1 2.2 2.3 3.1 0.3 0.0 4.5 0.0 Meth 1.1 0.0 1.5 0.0 1.6 1.5 2.0 0.0 0.0 0.0 0.0
Multiple Drug3,4 17.3 2.1 7.8 20.7 19.2 18.6 18.7 17.2 19.6 3.5 16.1 0.0
Percent Positive for Drugs by Offense Category
Violent (%) Property (%) Drug Possession
(%) Drug Distribution
(%) Other (%) Unknown (%) (n = 111) (n = 126) (n = 68) (n = 20) (n = 268) (n = 8)
Any Drug3,4 53.1 63.6 84.6 69.1 59.3 65.8 Cocaine 11.7 23.9 24.7 30.4 21.3 22.8 Marijuana 40.4 41.8 70.1 61.5 43.0 39.7 Opiates 8.4 15.9 10.6 4.6 7.5 15.7 Oxycodone 2.1 2.6 1.5 4.6 1.8 0.0 Meth 0.0 0.8 3.1 0.0 1.0 0.0
Multiple Drug3,4 9.5 21.5 26.9 27.3 16.5 12.5
Self-Reported Drug Use in the Past Year and Experience with Drug and Mental Health Treatment
Any Treatment Ever (%)
Treatment Time by Type of Treatment (%)
Inpatient Outpatient Mental Health Treatment
Ever % Last Avg Nights Ever % Last Avg Adm Ever % Last Avg Nights
Year5 Last Year Year5
Last Year Year5 Last Year
Crack Cocaine 62.0 30.8 7.1 0.7 50.5 19.9 0.2 14.7 4.9 0.2 Powder Cocaine 62.8 21.5 10.6 0.9 43.1 5.6 0.2 28.6 6.7 1.7 Marijuana 40.5 13.5 2.5 0.7 28.3 9.0 0.1 12.6 3.8 0.4 Heroin 66.9 42.7 23.2 10.6 37.3 7.5 0.1 17.1 4.5 0.0 Meth 81.0 81.0 8.9 0.4 59.9 18.4 0.2 35.1 9.2 0.1
1 - Conditional interview response rate is the number of completed interviews divided by the number of sampled arrestees available to be interviewed
2- Categories are not mutually exclusive; arrestees may report multiple race categories.
3 - Drug panel includes marijuana, cocaine, opiates, amphetamine EMIT test, PCP, valium, darvon, methadone, barbiturates, and oxycodone
4 - Denominator includes anyone that provided a large enough urine sample to test for all of the drug panel
5 - Percentage of arrestees responding to the calendar section of the ADAM survey
Marion County, IN, 2009 Page 1
132
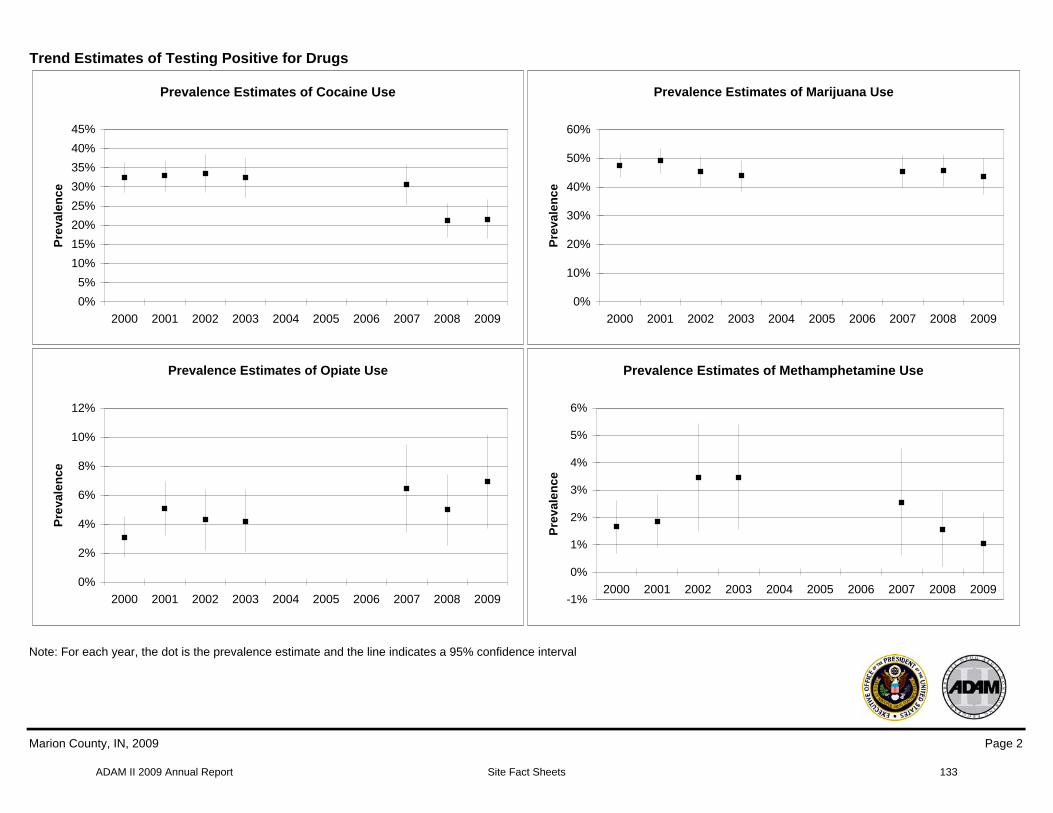
ADAM II 2009 Annual Report Site Fact Sheets
Trend Estimates of Testing Positive for Drugs
Prevalence Estimates of Cocaine Use
0%
5%
10%
15%
20%
25%
30%
35%
40%
45%
2000 2001 2002 2003 2004 2005 2006 2007 2008 2009
Pre
va
len
ce
Prevalence Estimates of Marijuana Use
0%
10%
20%
30%
40%
50%
60%
2000 2001 2002 2003 2004 2005 2006 2007 2008 2009
Pre
va
len
ce
Note: For each year, the dot is the prevalence estimate and the line indicates a 95% confidence interval
Prevalence Estimates of Opiate Use
0%
2%
4%
6%
8%
10%
12%
2000 2001 2002 2003 2004 2005 2006 2007 2008 2009
Pre
va
len
ce
Prevalence Estimates of Methamphetamine Use
-1%
0%
1%
2%
3%
4%
5%
6%
2000 2001 2002 2003 2004 2005 2006 2007 2008 2009
Pre
va
len
ce
Marion County, IN, 2009 Page 2
133
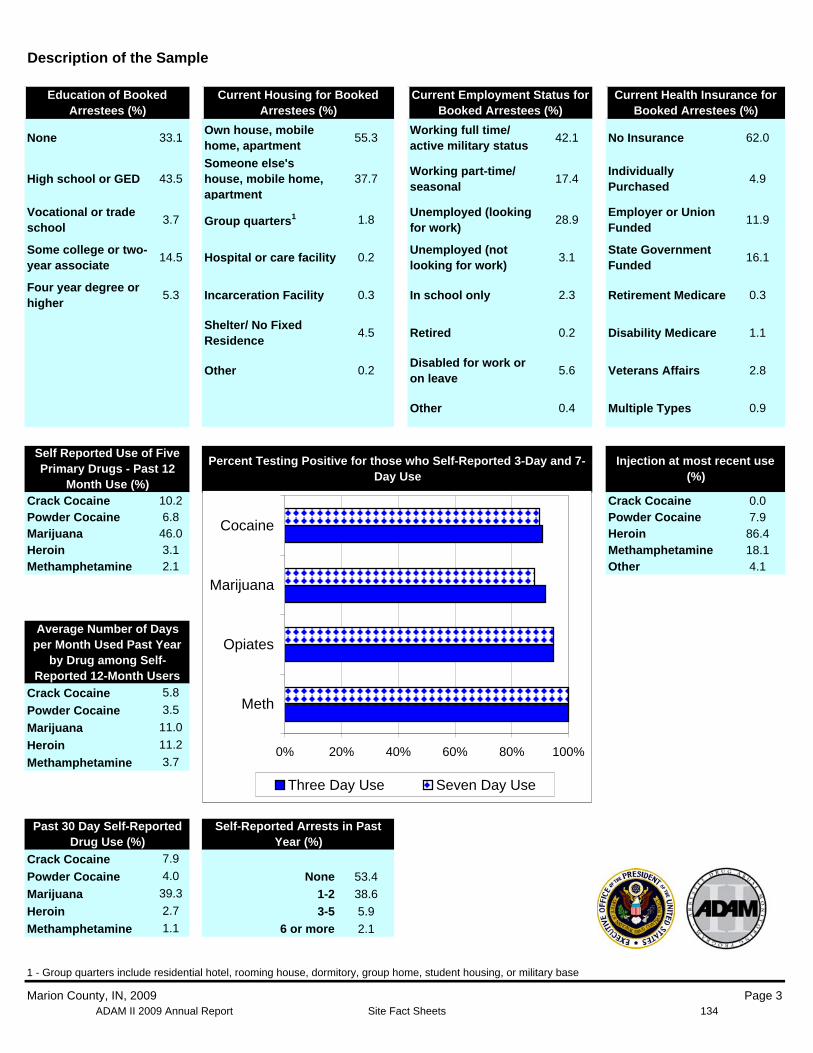
ADAM II 2009 Annual Report Site Fact Sheets
Description of the Sample
Education of Booked Arrestees (%)
None 33.1
High school or GED 43.5
Vocational or trade school
3.7
Some college or two-year associate
14.5
Four year degree or higher
5.3
Self Reported Use of Five Primary Drugs - Past 12
Month Use (%) Crack Cocaine 10.2 Powder Cocaine 6.8 Marijuana 46.0 Heroin 3.1 Methamphetamine 2.1
Average Number of Days per Month Used Past Year
by Drug among Self-Reported 12-Month Users
Crack Cocaine 5.8
Powder Cocaine 3.5
Marijuana 11.0
Heroin 11.2
Methamphetamine 3.7
Current Housing for Booked Arrestees (%)
Own house, mobile home, apartment
55.3
Someone else's house, mobile home, 37.7 apartment
Group quarters1 1.8
Hospital or care facility 0.2
Incarceration Facility 0.3
Shelter/ No Fixed Residence
4.5
Other 0.2
Current Employment Status for Booked Arrestees (%)
Working full time/ active military status
42.1
Working part-time/ seasonal
17.4
Unemployed (looking for work)
28.9
Unemployed (not looking for work)
3.1
In school only 2.3
Retired 0.2
Disabled for work or on leave
5.6
Other 0.4
Percent Testing Positive for those who Self-Reported 3-Day and 7-Day Use
0% 20% 40% 60% 80% 100%
Meth
Opiates
Marijuana
Cocaine
Three Day Use Seven Day Use
Current Health Insurance for Booked Arrestees (%)
No Insurance 62.0
Individually Purchased
4.9
Employer or Union Funded
11.9
State Government Funded
16.1
Retirement Medicare 0.3
Disability Medicare 1.1
Veterans Affairs 2.8
Multiple Types 0.9
Injection at most recent use (%)
Crack Cocaine 0.0 Powder Cocaine 7.9 Heroin 86.4 Methamphetamine 18.1 Other 4.1
Past 30 Day Self-Reported Drug Use (%)
Crack Cocaine 7.9
Powder Cocaine 4.0
Marijuana 39.3
Heroin 2.7
Methamphetamine 1.1
Self-Reported Arrests in Past Year (%)
None 53.4
1-2 38.6
3-5 5.9
6 or more 2.1
1 - Group quarters include residential hotel, rooming house, dormitory, group home, student housing, or military base
Marion County, IN, 2009 Page 3 134
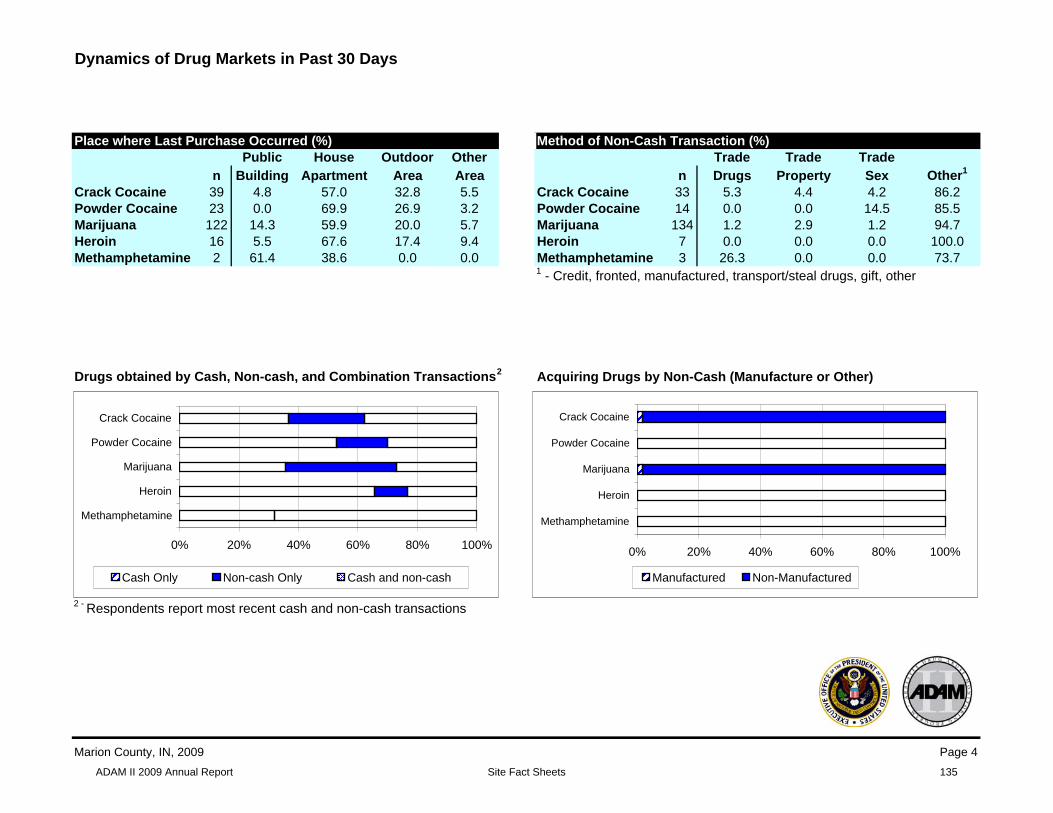
ADAM II 2009 Annual Report Site Fact Sheets
Dynamics of Drug Markets in Past 30 Days
Place where Last Purchase Occurred (%) Public House Outdoor Other
n Building Apartment Area Area Crack Cocaine 39 4.8 57.0 32.8 5.5 Powder Cocaine 23 0.0 69.9 26.9 3.2 Marijuana 122 14.3 59.9 20.0 5.7 Heroin 16 5.5 67.6 17.4 9.4 Methamphetamine 2 61.4 38.6 0.0 0.0
Method of Non-Cash Transaction (%) Trade Trade Trade
n Drugs Property Sex Other1
Crack Cocaine 33 5.3 4.4 4.2 86.2 Powder Cocaine 14 0.0 0.0 14.5 85.5 Marijuana 134 1.2 2.9 1.2 94.7 Heroin 7 0.0 0.0 0.0 100.0 Methamphetamine 3 26.3 0.0 0.0 1 - Credit, fronted, manufactured, transport/steal drugs, gift, other
73.7
Drugs obtained by Cash, Non-cash, and Combination Transactions2 Acquiring Drugs by Non-Cash (Manufacture or Other)
2 - Respondents report most recent cash and non-cash transactions
0% 20% 40% 60% 80% 100%
Methamphetamine
Heroin
Marijuana
Powder Cocaine
Crack Cocaine
Cash Only Non-cash Only Cash and non-cash
0% 20% 40% 60% 80% 100%
Methamphetamine
Heroin
Marijuana
Powder Cocaine
Crack Cocaine
Manufactured Non-Manufactured
Marion County, IN, 2009 Page 4
135
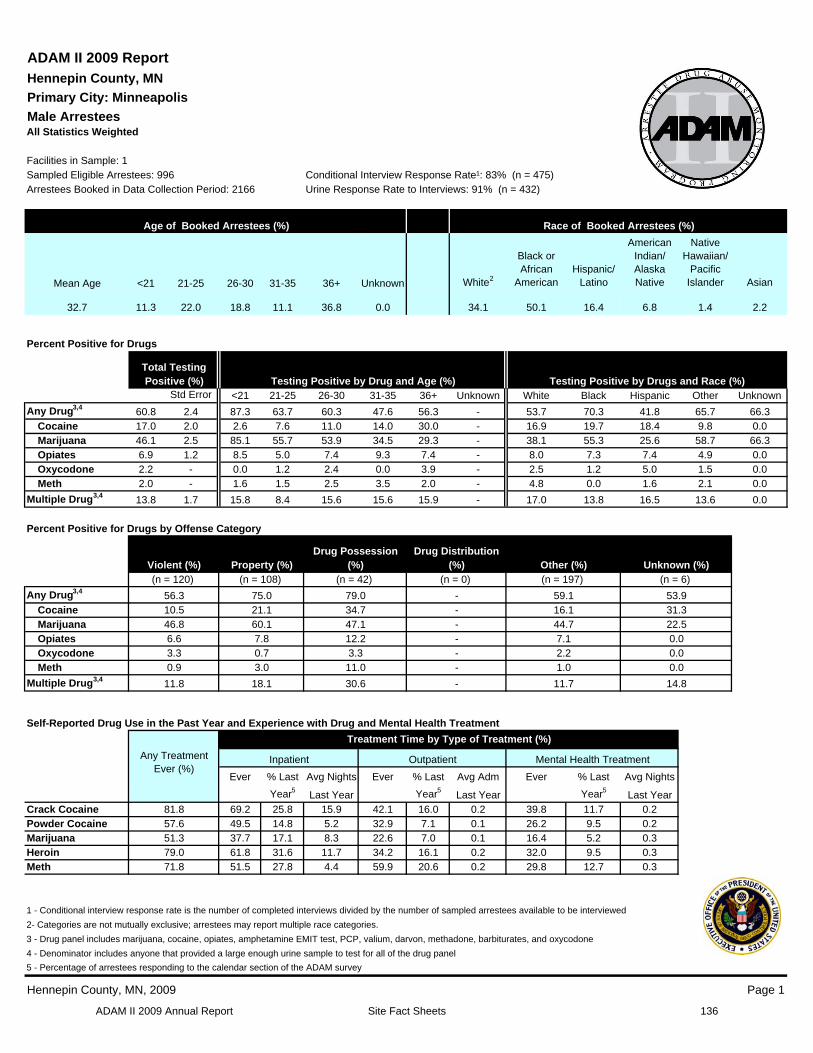
ADAM II 2009 Annual Report Site Fact Sheets
ADAM II 2009 Report
Hennepin County, MN
Primary City: Minneapolis
Male Arrestees All Statistics Weighted
Facilities in Sample: 1 Sampled Eligible Arrestees: 996 Conditional Interview Response Rate¹: 83% (n = 475) Arrestees Booked in Data Collection Period: 2166 Urine Response Rate to Interviews: 91% (n = 432)
Age of Booked Arrestees (%)
Mean Age <21 21-25 26-30 31-35 36+ Unknown
32.7 11.3 22.0 18.8 11.1 36.8 0.0
Race of Booked Arrestees (%)
American Native Black or Indian/ Hawaiian/
White2 African
American Hispanic/
Latino Alaska Native
Pacific Islander Asian
34.1 50.1 16.4 6.8 1.4 2.2
Percent Positive for Drugs
Total Testing Positive (%) Testing Positive by Drug and Age (%) Testing Positive by Drugs and Race (%)
Std Error <21 21-25 26-30 31-35 36+ Unknown White Black Hispanic Other Unknown
Any Drug3,4 60.8 2.4 87.3 63.7 60.3 47.6 56.3 53.7 70.3 41.8 65.7 66.3 Cocaine 17.0 2.0 2.6 7.6 11.0 14.0 30.0 16.9 19.7 18.4 9.8 0.0 Marijuana 46.1 2.5 85.1 55.7 53.9 34.5 29.3 38.1 55.3 25.6 58.7 66.3 Opiates 6.9 1.2 8.5 5.0 7.4 9.3 7.4 8.0 7.3 7.4 4.9 0.0 Oxycodone 2.2 0.0 1.2 2.4 0.0 3.9 2.5 1.2 5.0 1.5 0.0 Meth 2.0 1.6 1.5 2.5 3.5 2.0 4.8 0.0 1.6 2.1 0.0
Multiple Drug3,4 13.8 1.7 15.8 8.4 15.6 15.6 15.9 17.0 13.8 16.5 13.6 0.0
Percent Positive for Drugs by Offense Category
Violent (%) Property (%) Drug Possession
(%) Drug Distribution
(%) Other (%) Unknown (%) (n = 120) (n = 108) (n = 42) (n = 0) (n = 197) (n = 6)
Any Drug3,4 56.3 75.0 79.0 - 59.1 53.9 Cocaine 10.5 21.1 34.7 - 16.1 31.3 Marijuana 46.8 60.1 47.1 - 44.7 22.5 Opiates 6.6 7.8 12.2 - 7.1 0.0 Oxycodone 3.3 0.7 3.3 - 2.2 0.0 Meth 0.9 3.0 11.0 - 1.0 0.0
Multiple Drug3,4 11.8 18.1 30.6 - 11.7 14.8
Self-Reported Drug Use in the Past Year and Experience with Drug and Mental Health Treatment
Any Treatment Ever (%)
Treatment Time by Type of Treatment (%)
Inpatient Outpatient Mental Health Treatment
Ever % Last Avg Nights Ever % Last Avg Adm Ever % Last Avg Nights
Year5 Last Year Year5
Last Year Year5 Last Year
Crack Cocaine 81.8 69.2 25.8 15.9 42.1 16.0 0.2 39.8 11.7 0.2 Powder Cocaine 57.6 49.5 14.8 5.2 32.9 7.1 0.1 26.2 9.5 0.2 Marijuana 51.3 37.7 17.1 8.3 22.6 7.0 0.1 16.4 5.2 0.3 Heroin 79.0 61.8 31.6 11.7 34.2 16.1 0.2 32.0 9.5 0.3 Meth 71.8 51.5 27.8 4.4 59.9 20.6 0.2 29.8 12.7 0.3
1 - Conditional interview response rate is the number of completed interviews divided by the number of sampled arrestees available to be interviewed
2- Categories are not mutually exclusive; arrestees may report multiple race categories.
3 - Drug panel includes marijuana, cocaine, opiates, amphetamine EMIT test, PCP, valium, darvon, methadone, barbiturates, and oxycodone
4 - Denominator includes anyone that provided a large enough urine sample to test for all of the drug panel
5 - Percentage of arrestees responding to the calendar section of the ADAM survey
Hennepin County, MN, 2009 Page 1
136
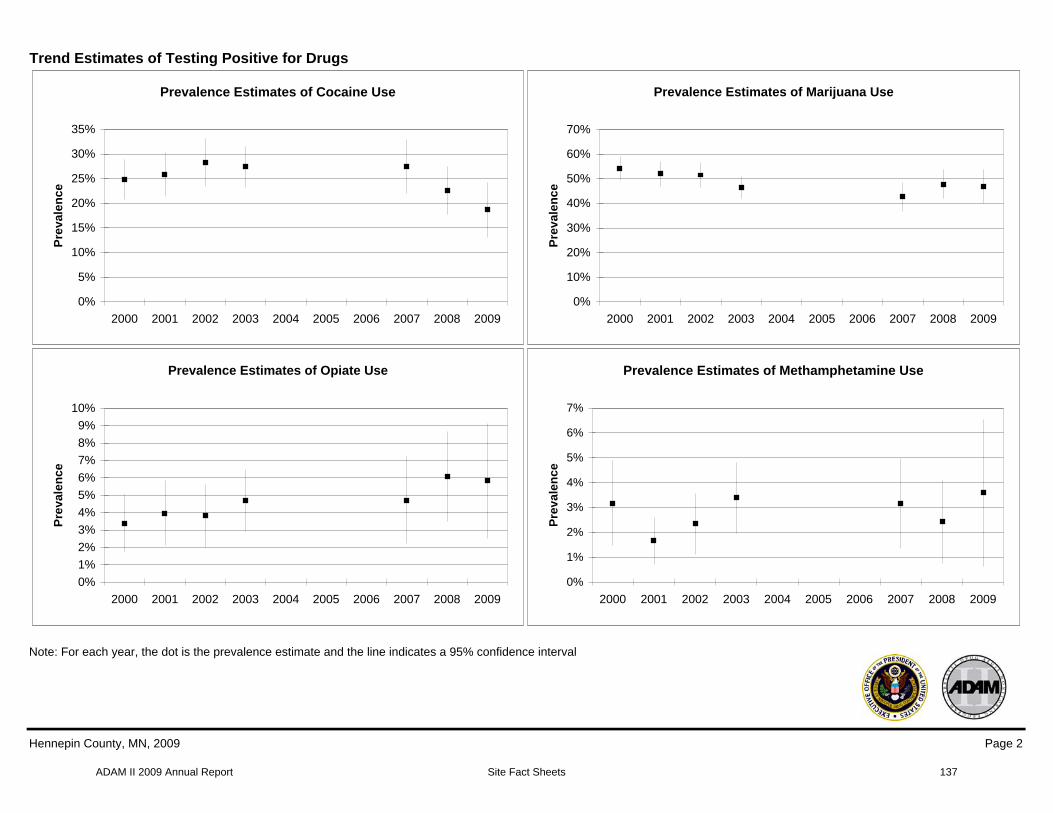
ADAM II 2009 Annual Report Site Fact Sheets
Trend Estimates of Testing Positive for Drugs
Prevalence Estimates of Cocaine Use
0%
5%
10%
15%
20%
25%
30%
35%
2000 2001 2002 2003 2004 2005 2006 2007 2008 2009
Pre
va
len
ce
Prevalence Estimates of Marijuana Use
0%
10%
20%
30%
40%
50%
60%
70%
2000 2001 2002 2003 2004 2005 2006 2007 2008 2009
Pre
va
len
ce
Note: For each year, the dot is the prevalence estimate and the line indicates a 95% confidence interval
Prevalence Estimates of Opiate Use
0%
1%
2%
3%
4%
5%
6%
7%
8%
9%
10%
2000 2001 2002 2003 2004 2005 2006 2007 2008 2009
Pre
va
len
ce
Prevalence Estimates of Methamphetamine Use
0%
1%
2%
3%
4%
5%
6%
7%
2000 2001 2002 2003 2004 2005 2006 2007 2008 2009
Pre
va
len
ce
Hennepin County, MN, 2009 Page 2
137
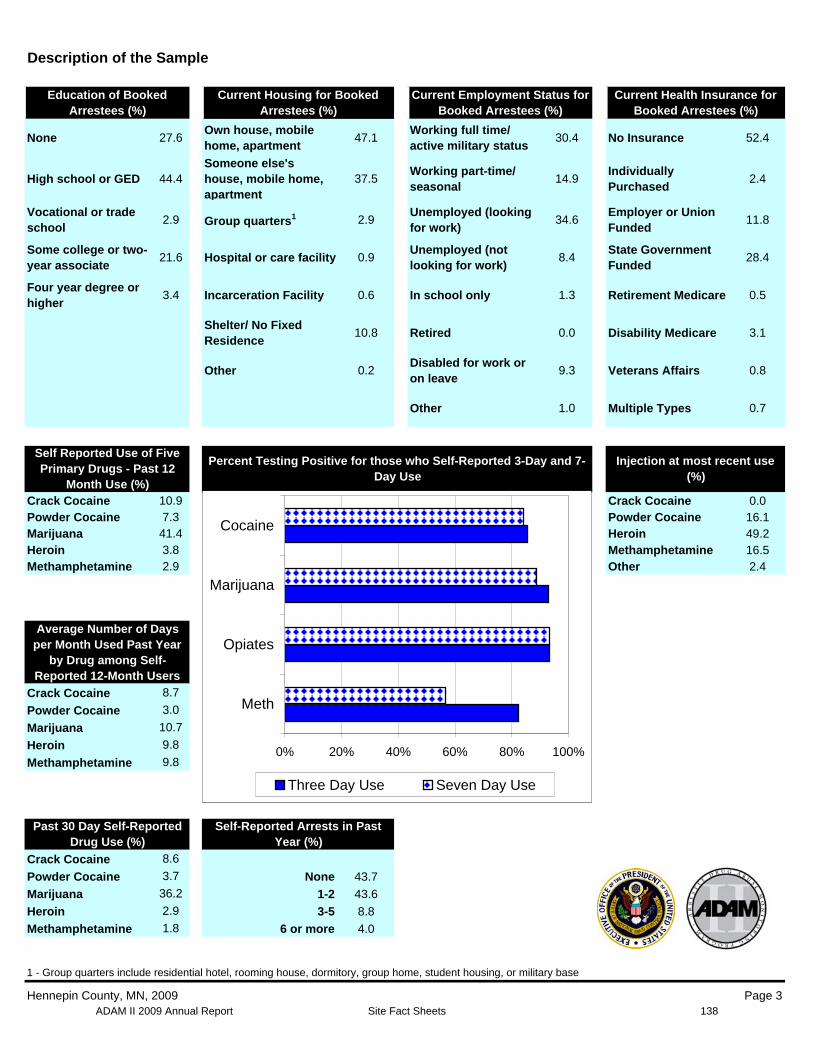
ADAM II 2009 Annual Report Site Fact Sheets
Description of the Sample
Education of Booked Arrestees (%)
None 27.6
High school or GED 44.4
Vocational or trade school
2.9
Some college or two-year associate
21.6
Four year degree or higher
3.4
Self Reported Use of Five Primary Drugs - Past 12
Month Use (%) Crack Cocaine 10.9 Powder Cocaine 7.3 Marijuana 41.4 Heroin 3.8 Methamphetamine 2.9
Average Number of Days per Month Used Past Year
by Drug among Self-Reported 12-Month Users
Crack Cocaine 8.7
Powder Cocaine 3.0
Marijuana 10.7
Heroin 9.8
Methamphetamine 9.8
Current Housing for Booked Arrestees (%)
Own house, mobile home, apartment
47.1
Someone else's house, mobile home, 37.5 apartment
Group quarters1 2.9
Hospital or care facility 0.9
Incarceration Facility 0.6
Shelter/ No Fixed Residence
10.8
Other 0.2
Current Employment Status forBooked Arrestees (%)
Working full time/ active military status
30.4
Working part-time/ seasonal
14.9
Unemployed (looking for work)
34.6
Unemployed (not looking for work)
8.4
In school only 1.3
Retired 0.0
Disabled for work or on leave
9.3
Other 1.0
Percent Testing Positive for those who Self-Reported 3-Day and 7-Day Use
0% 20% 40% 60% 80% 100%
Meth
Opiates
Marijuana
Cocaine
Three Day Use Seven Day Use
Current Health Insurance for Booked Arrestees (%)
No Insurance 52.4
Individually Purchased
2.4
Employer or Union Funded
11.8
State Government Funded
28.4
Retirement Medicare 0.5
Disability Medicare 3.1
Veterans Affairs 0.8
Multiple Types 0.7
Injection at most recent use (%)
Crack Cocaine 0.0 Powder Cocaine 16.1 Heroin 49.2 Methamphetamine 16.5 Other 2.4
Past 30 Day Self-Reported Drug Use (%)
Crack Cocaine 8.6
Powder Cocaine 3.7
Marijuana 36.2
Heroin 2.9
Methamphetamine 1.8
Self-Reported Arrests in Past Year (%)
None 43.7
1-2 43.6
3-5 8.8
6 or more 4.0
1 - Group quarters include residential hotel, rooming house, dormitory, group home, student housing, or military base
Hennepin County, MN, 2009 Page 3 138
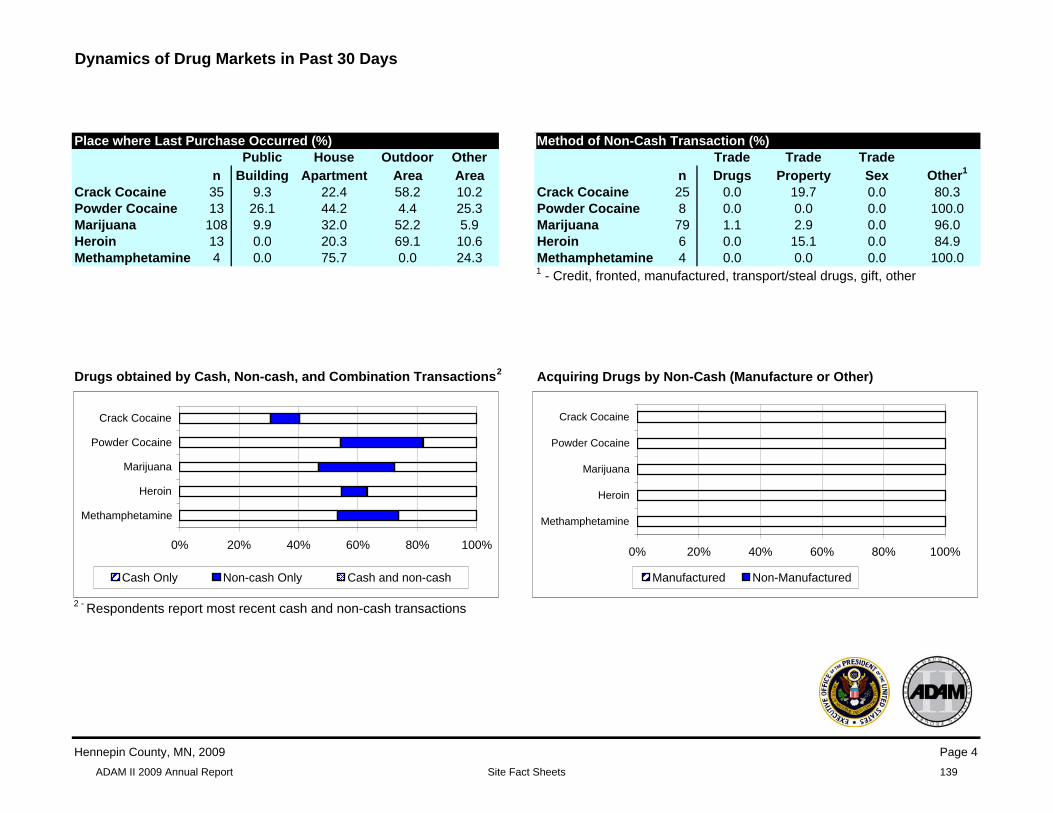
ADAM II 2009 Annual Report Site Fact Sheets
Dynamics of Drug Markets in Past 30 Days
Place where Last Purchase Occurred (%) Public House Outdoor Other
n Building Apartment Area Area Crack Cocaine 35 9.3 22.4 58.2 10.2 Powder Cocaine 13 26.1 44.2 4.4 25.3 Marijuana 108 9.9 32.0 52.2 5.9 Heroin 13 0.0 20.3 69.1 10.6 Methamphetamine 4 0.0 75.7 0.0 24.3
Method of Non-Cash Transaction (%) Trade Trade Trade
n Drugs Property Sex Other1
Crack Cocaine 25 0.0 19.7 0.0 80.3 Powder Cocaine 8 0.0 0.0 0.0 100.0 Marijuana 79 1.1 2.9 0.0 96.0 Heroin 6 0.0 15.1 0.0 84.9 Methamphetamine 4 0.0 0.0 0.0 1 - Credit, fronted, manufactured, transport/steal drugs, gift, other
100.0
Drugs obtained by Cash, Non-cash, and Combination Transactions2 Acquiring Drugs by Non-Cash (Manufacture or Other)
2 - Respondents report most recent cash and non-cash transactions
0% 20% 40% 60% 80% 100%
Methamphetamine
Heroin
Marijuana
Powder Cocaine
Crack Cocaine
Cash Only Non-cash Only Cash and non-cash
0% 20% 40% 60% 80% 100%
Methamphetamine
Heroin
Marijuana
Powder Cocaine
Crack Cocaine
Manufactured Non-Manufactured
Hennepin County, MN, 2009 Page 4
139
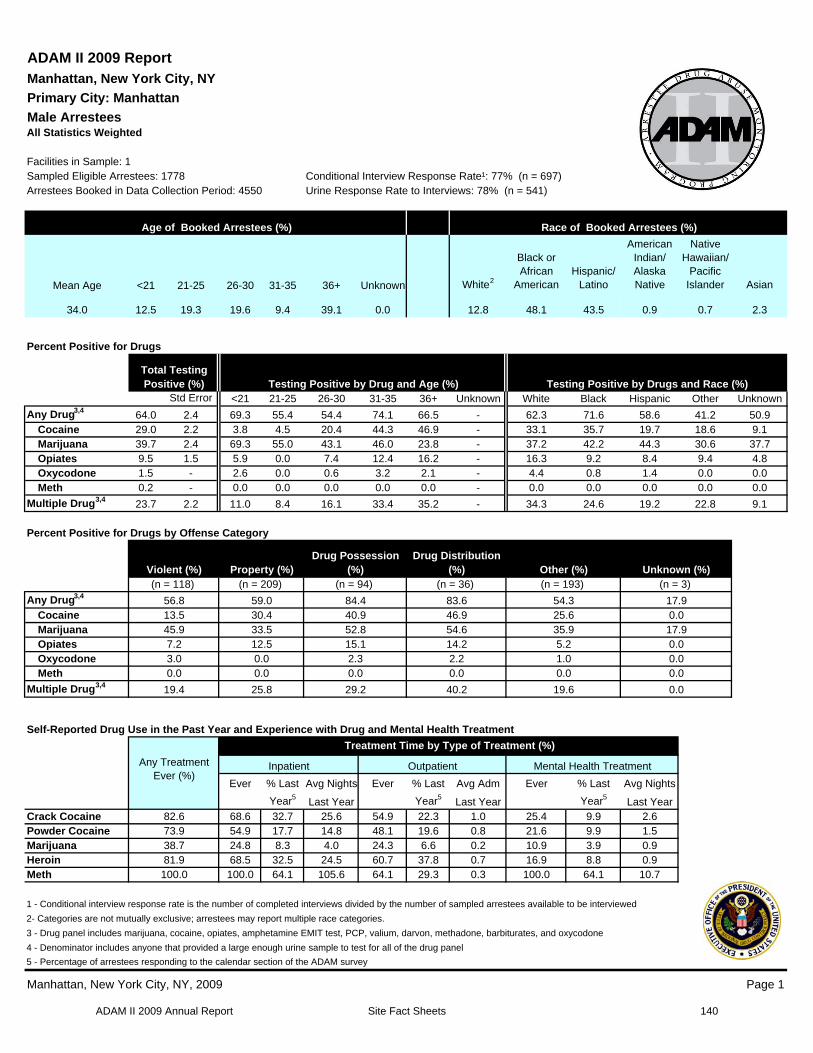
ADAM II 2009 Annual Report Site Fact Sheets
ADAM II 2009 Report Manhattan, New York City, NY
Primary City: Manhattan
Male Arrestees All Statistics Weighted
Facilities in Sample: 1 Sampled Eligible Arrestees: 1778 Conditional Interview Response Rate¹: 77% (n = 697) Arrestees Booked in Data Collection Period: 4550 Urine Response Rate to Interviews: 78% (n = 541)
Age of Booked Arrestees (%)
Mean Age <21 21-25 26-30 31-35 36+ Unknown
34.0 12.5 19.3 19.6 9.4 39.1 0.0
Race of Booked Arrestees (%)
American Native Black or Indian/ Hawaiian/
White2 African
American Hispanic/
Latino Alaska Native
Pacific Islander Asian
12.8 48.1 43.5 0.9 0.7 2.3
Percent Positive for Drugs
Total Testing Positive (%) Testing Positive by Drug and Age (%) Testing Positive by Drugs and Race (%)
Std Error <21 21-25 26-30 31-35 36+ Unknown White Black Hispanic Other Unknown
Any Drug3,4 64.0 2.4 69.3 55.4 54.4 74.1 66.5 62.3 71.6 58.6 41.2 50.9 Cocaine 29.0 2.2 3.8 4.5 20.4 44.3 46.9 33.1 35.7 19.7 18.6 9.1 Marijuana 39.7 2.4 69.3 55.0 43.1 46.0 23.8 37.2 42.2 44.3 30.6 37.7 Opiates 9.5 1.5 5.9 0.0 7.4 12.4 16.2 16.3 9.2 8.4 9.4 4.8 Oxycodone 1.5 2.6 0.0 0.6 3.2 2.1 4.4 0.8 1.4 0.0 0.0 Meth 0.2 0.0 0.0 0.0 0.0 0.0 0.0 0.0 0.0 0.0 0.0
Multiple Drug3,4 23.7 2.2 11.0 8.4 16.1 33.4 35.2 34.3 24.6 19.2 22.8 9.1
Percent Positive for Drugs by Offense Category
Violent (%) Property (%) Drug Possession
(%) Drug Distribution
(%) Other (%) Unknown (%) (n = 118) (n = 209) (n = 94) (n = 36) (n = 193) (n = 3)
Any Drug3,4 56.8 59.0 84.4 83.6 54.3 17.9 Cocaine 13.5 30.4 40.9 46.9 25.6 0.0 Marijuana 45.9 33.5 52.8 54.6 35.9 17.9 Opiates 7.2 12.5 15.1 14.2 5.2 0.0 Oxycodone 3.0 0.0 2.3 2.2 1.0 0.0 Meth 0.0 0.0 0.0 0.0 0.0 0.0
Multiple Drug3,4 19.4 25.8 29.2 40.2 19.6 0.0
Self-Reported Drug Use in the Past Year and Experience with Drug and Mental Health Treatment
Any Treatment Ever (%)
Treatment Time by Type of Treatment (%)
Inpatient Outpatient Mental Health Treatment
Ever % Last Avg Nights
Year5 Last Year
Ever % Last
Year5
Avg Adm
Last Year
Ever % Last
Year5
Avg Nights
Last Year Crack Cocaine 82.6 68.6 32.7 25.6 54.9 22.3 1.0 25.4 9.9 2.6 Powder Cocaine 73.9 54.9 17.7 14.8 48.1 19.6 0.8 21.6 9.9 1.5 Marijuana 38.7 24.8 8.3 4.0 24.3 6.6 0.2 10.9 3.9 0.9 Heroin 81.9 68.5 32.5 24.5 60.7 37.8 0.7 16.9 8.8 0.9 Meth 100.0 100.0 64.1 105.6 64.1 29.3 0.3 100.0 64.1 10.7
1 - Conditional interview response rate is the number of completed interviews divided by the number of sampled arrestees available to be interviewed
2- Categories are not mutually exclusive; arrestees may report multiple race categories.
3 - Drug panel includes marijuana, cocaine, opiates, amphetamine EMIT test, PCP, valium, darvon, methadone, barbiturates, and oxycodone
4 - Denominator includes anyone that provided a large enough urine sample to test for all of the drug panel
5 - Percentage of arrestees responding to the calendar section of the ADAM survey
Manhattan, New York City, NY, 2009 Page 1
140
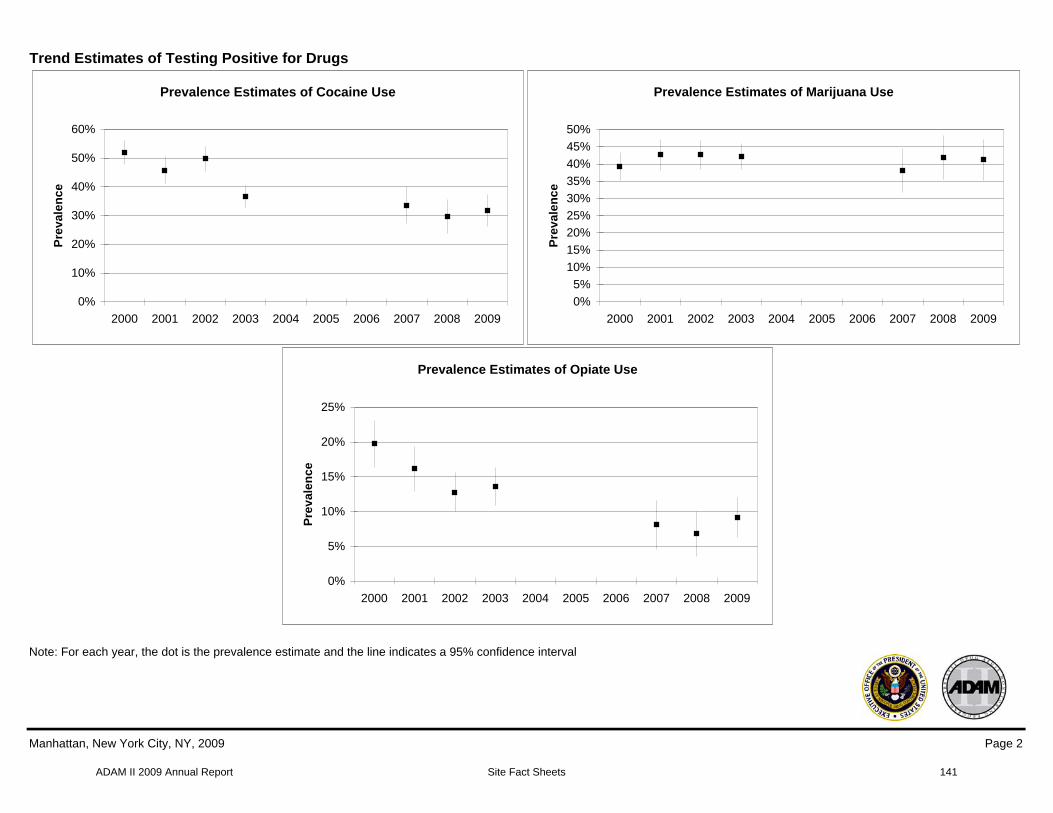
ADAM II 2009 Annual Report Site Fact Sheets
Trend Estimates of Testing Positive for Drugs
Prevalence Estimates of Cocaine Use
0%
10%
20%
30%
40%
50%
60%
2000 2001 2002 2003 2004 2005 2006 2007 2008 2009
Pre
va
len
ce
Prevalence Estimates of Opiate Use
0%
5%
10%
15%
20%
25%
2000 2001 2002 2003 2004 2005 2006 2007 2008 2009
Pre
va
len
ce
Prevalence Estimates of Marijuana Use
0%
5%
10%
15%
20%
25%
30%
35%
40%
45%
50%
2000 2001 2002 2003 2004 2005 2006 2007 2008 2009
Pre
va
len
ce
Note: For each year, the dot is the prevalence estimate and the line indicates a 95% confidence interval
Manhattan, New York City, NY, 2009 Page 2
141
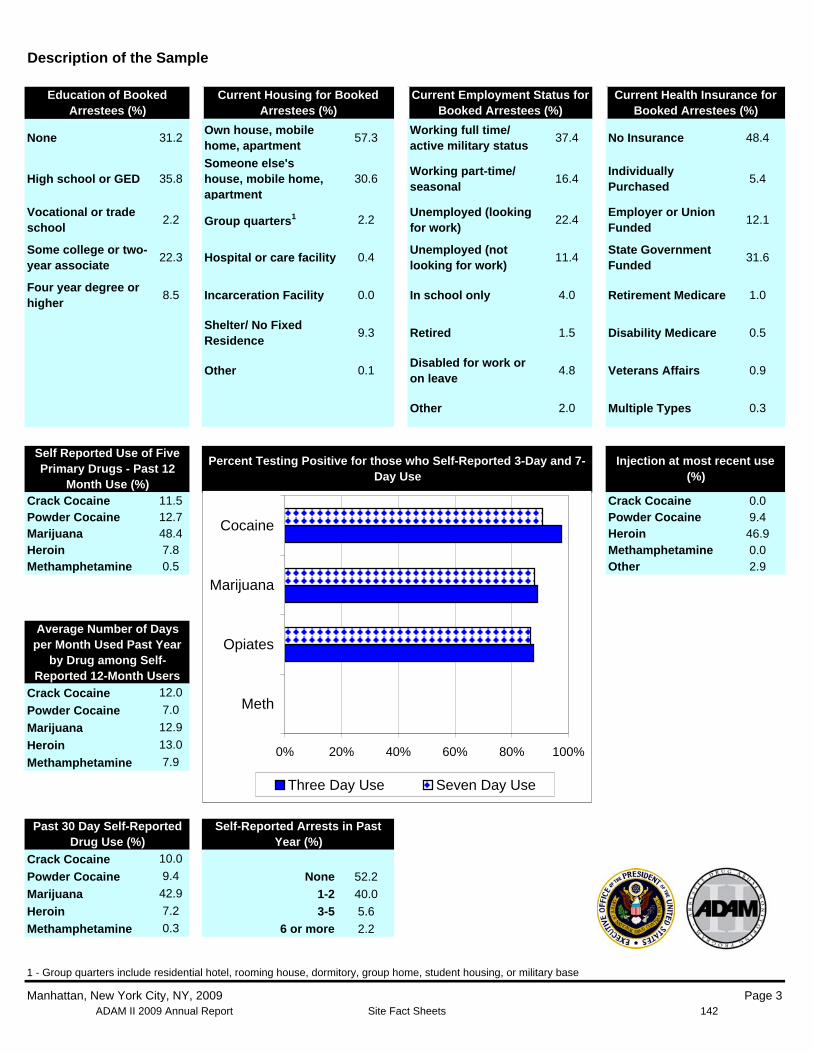
ADAM II 2009 Annual Report Site Fact Sheets
Description of the Sample
Education of Booked Arrestees (%)
None 31.2
High school or GED 35.8
Vocational or trade school
2.2
Some college or two-year associate
22.3
Four year degree or higher
8.5
Self Reported Use of Five Primary Drugs - Past 12
Month Use (%) Crack Cocaine 11.5 Powder Cocaine 12.7 Marijuana 48.4 Heroin 7.8 Methamphetamine 0.5
Average Number of Days per Month Used Past Year
by Drug among Self-Reported 12-Month Users
Crack Cocaine 12.0
Powder Cocaine 7.0
Marijuana 12.9
Heroin 13.0
Methamphetamine 7.9
Current Housing for Booked Arrestees (%)
Own house, mobile home, apartment
57.3
Someone else's house, mobile home, 30.6 apartment
Group quarters1 2.2
Hospital or care facility 0.4
Incarceration Facility 0.0
Shelter/ No Fixed Residence
9.3
Other 0.1
Current Employment Status for Booked Arrestees (%)
Working full time/ active military status
37.4
Working part-time/ seasonal
16.4
Unemployed (looking for work)
22.4
Unemployed (not looking for work)
11.4
In school only 4.0
Retired 1.5
Disabled for work or on leave
4.8
Other 2.0
Percent Testing Positive for those who Self-Reported 3-Day and 7-Day Use
0% 20% 40% 60% 80% 100%
Meth
Opiates
Marijuana
Cocaine
Three Day Use Seven Day Use
Current Health Insurance for Booked Arrestees (%)
No Insurance 48.4
Individually Purchased
5.4
Employer or Union Funded
12.1
State Government Funded
31.6
Retirement Medicare 1.0
Disability Medicare 0.5
Veterans Affairs 0.9
Multiple Types 0.3
Injection at most recent use (%)
Crack Cocaine 0.0 Powder Cocaine 9.4 Heroin 46.9 Methamphetamine 0.0 Other 2.9
Past 30 Day Self-Reported Drug Use (%)
Crack Cocaine 10.0
Powder Cocaine 9.4
Marijuana 42.9
Heroin 7.2
Methamphetamine 0.3
Self-Reported Arrests in Past Year (%)
None 52.2
1-2 40.0
3-5 5.6
6 or more 2.2
1 - Group quarters include residential hotel, rooming house, dormitory, group home, student housing, or military base
Manhattan, New York City, NY, 2009 Page 3 142
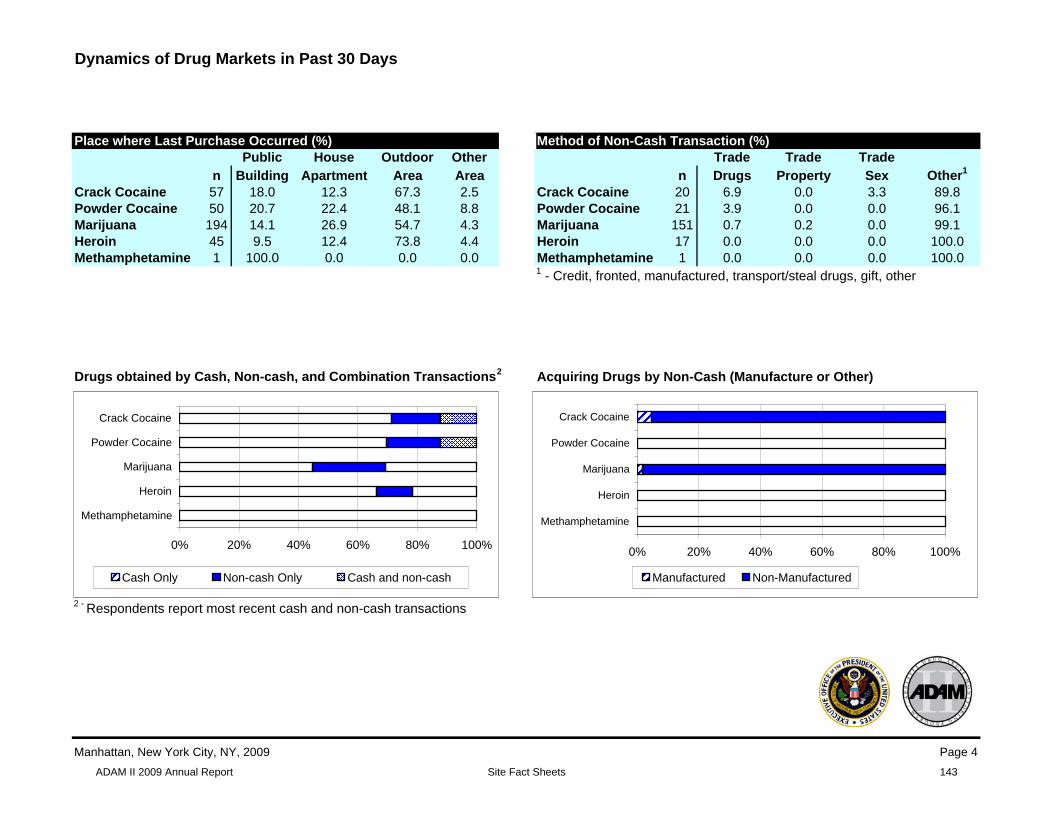
ADAM II 2009 Annual Report Site Fact Sheets
Dynamics of Drug Markets in Past 30 Days
Place where Last Purchase Occurred (%) Public House Outdoor Other
n Building Apartment Area Area Crack Cocaine 57 18.0 12.3 67.3 2.5 Powder Cocaine 50 20.7 22.4 48.1 8.8 Marijuana 194 14.1 26.9 54.7 4.3 Heroin 45 9.5 12.4 73.8 4.4 Methamphetamine 1 100.0 0.0 0.0 0.0
Method of Non-Cash Transaction (%) Trade Trade Trade
n Drugs Property Sex Other1
Crack Cocaine 20 6.9 0.0 3.3 89.8 Powder Cocaine 21 3.9 0.0 0.0 96.1 Marijuana 151 0.7 0.2 0.0 99.1 Heroin 17 0.0 0.0 0.0 100.0 Methamphetamine 1 0.0 0.0 0.0 1 - Credit, fronted, manufactured, transport/steal drugs, gift, other
100.0
Drugs obtained by Cash, Non-cash, and Combination Transactions2 Acquiring Drugs by Non-Cash (Manufacture or Other)
2 - Respondents report most recent cash and non-cash transactions
0% 20% 40% 60% 80% 100%
Methamphetamine
Heroin
Marijuana
Powder Cocaine
Crack Cocaine
Cash Only Non-cash Only Cash and non-cash
0% 20% 40% 60% 80% 100%
Methamphetamine
Heroin
Marijuana
Powder Cocaine
Crack Cocaine
Manufactured Non-Manufactured
Manhattan, New York City, NY, 2009 Page 4
143

ADAM II 2009 Annual Report Site Fact Sheets
ADAM II 2009 Report
Multnomah County, OR
Primary City: Portland
Male Arrestees All Statistics Weighted
Facilities in Sample: 1 Sampled Eligible Arrestees: 696 Conditional Interview Response Rate¹: 85% (n = 464) Arrestees Booked in Data Collection Period: 1821 Urine Response Rate to Interviews: 89% (n = 413)
Age of Booked Arrestees (%)
Mean Age <21 21-25 26-30 31-35 36+ Unknown
36.3 9.4 15.4 12.8 12.1 50.3 0.0
Race of Booked Arrestees (%)
American Native Black or Indian/ Hawaiian/
White2 African
American Hispanic/
Latino Alaska Native
Pacific Islander Asian
64.6 23.4 16.8 14.5 2.1 1.7
Percent Positive for Drugs
Total Testing Positive (%) Testing Positive by Drug and Age (%) Testing Positive by Drugs and Race (%)
Std Error <21 21-25 26-30 31-35 36+ Unknown White Black Hispanic Other Unknown
Any Drug3,4 62.5 2.7 71.3 73.2 60.5 67.0 55.8 59.5 75.7 47.4 54.6 79.5 Cocaine 16.2 1.9 9.7 7.9 13.6 15.9 20.8 9.8 32.5 18.8 13.9 0.0 Marijuana 38.1 2.8 63.7 59.2 44.8 39.9 23.7 34.0 53.7 30.9 33.1 79.5 Opiates 11.4 1.7 5.7 10.9 12.1 16.1 9.5 11.9 5.4 7.0 8.7 0.0 Oxycodone 0.2 0.0 0.0 0.0 0.0 0.4 0.0 0.7 0.0 0.0 0.0 Meth 13.3 1.8 6.7 15.9 5.6 17.4 13.5 16.9 5.3 6.5 11.1 0.0
Multiple Drug3,4 18.6 2.1 9.7 23.9 14.4 18.4 17.4 15.9 24.5 11.2 13.2 0.0
Percent Positive for Drugs by Offense Category
Drug Possession Drug Distribution Violent (%) Property (%) (%) (%) Other (%) Unknown (%) (n = 128) (n = 125) (n = 43) (n = 15) (n = 193) (n = 9)
Any Drug3,4 50.2 72.5 90.9 86.4 56.7 53.2 Cocaine 10.3 20.4 39.5 29.5 11.2 13.2 Marijuana 39.5 36.1 41.6 46.8 37.4 53.2 Opiates 4.0 17.1 12.5 19.8 9.1 0.0 Oxycodone 0.6 0.0 0.0 0.0 0.4 0.0 Meth 6.4 19.1 30.0 15.5 11.4 0.0
Multiple Drug3,4 11.0 23.3 32.4 17.2 15.0 13.2
Self-Reported Drug Use in the Past Year and Experience with Drug and Mental Health Treatment
Any Treatment Ever (%)
Treatment Time by Type of Treatment (%)
Inpatient Outpatient Mental Health Treatment
Ever % Last
Year5
Avg Nights
Last Year
Ever % Last
Year5
Avg Adm
Last Year
Ever % Last
Year5
Avg Nights
Last Year Crack Cocaine 78.9 62.7 24.8 2.3 56.9 18.1 0.2 18.9 8.2 0.6 Powder Cocaine 60.0 47.3 22.9 1.8 43.6 11.9 0.1 17.7 2.5 0.0 Marijuana 56.7 38.7 10.9 2.4 40.5 15.1 0.2 16.8 3.8 0.6 Heroin 71.0 60.6 25.6 3.3 52.7 12.5 0.1 14.9 2.7 0.0 Meth 72.1 50.9 13.1 1.9 62.4 29.8 0.3 19.7 3.1 0.9
1 - Conditional interview response rate is the number of completed interviews divided by the number of sampled arrestees available to be interviewed
2- Categories are not mutually exclusive; arrestees may report multiple race categories.
3 - Drug panel includes marijuana, cocaine, opiates, amphetamine EMIT test, PCP, valium, darvon, methadone, barbiturates, and oxycodone
4 - Denominator includes anyone that provided a large enough urine sample to test for all of the drug panel
5 - Percentage of arrestees responding to the calendar section of the ADAM survey
Multnomah County, OR, 2009 Page 1
144
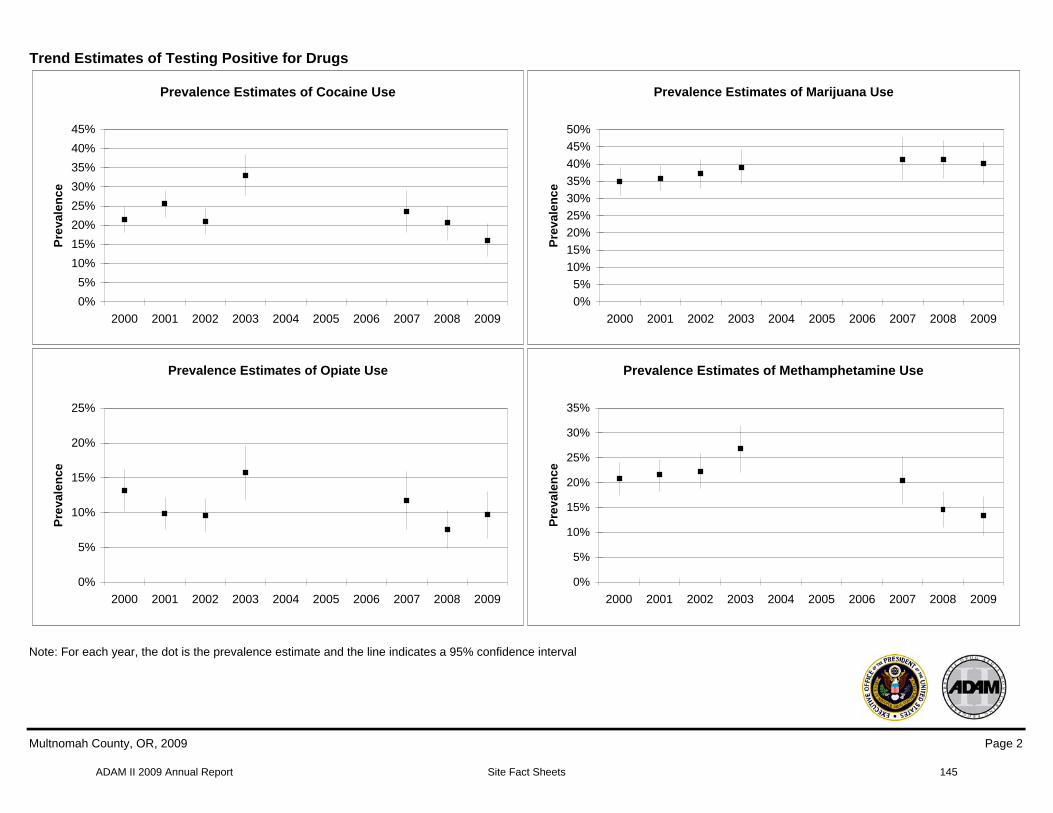
ADAM II 2009 Annual Report Site Fact Sheets
Trend Estimates of Testing Positive for Drugs
Prevalence Estimates of Cocaine Use
0%
5%
10%
15%
20%
25%
30%
35%
40%
45%
2000 2001 2002 2003 2004 2005 2006 2007 2008 2009
Pre
va
len
ce
Prevalence Estimates of Marijuana Use
0%
5%
10%
15%
20%
25%
30%
35%
40%
45%
50%
2000 2001 2002 2003 2004 2005 2006 2007 2008 2009
Pre
va
len
ce
Prevalence Estimates of Opiate Use
0%
5%
10%
15%
20%
25%
2000 2001 2002 2003 2004 2005 2006 2007 2008 2009
Pre
va
len
ce
Prevalence Estimates of Methamphetamine Use
0%
5%
10%
15%
20%
25%
30%
35%
2000 2001 2002 2003 2004 2005 2006 2007 2008 2009
Pre
va
len
ce
Note: For each year, the dot is the prevalence estimate and the line indicates a 95% confidence interval
Multnomah County, OR, 2009 Page 2
145

ADAM II 2009 Annual Report Site Fact Sheets
Description of the Sample
Education of Booked Arrestees (%)
None 26.9
High school or GED 42.3
Vocational or trade school
3.9
Some college or two-year associate
21.0
Four year degree or higher
5.9
Self Reported Use of Five Primary Drugs - Past 12
Month Use (%) Crack Cocaine 14.1 Powder Cocaine 11.8 Marijuana 50.9 Heroin 13.2 Methamphetamine 16.8
Average Number of Days per Month Used Past Year
by Drug among Self-Reported 12-Month Users
Crack Cocaine 6.2
Powder Cocaine 3.5
Marijuana 9.6
Heroin 12.8
Methamphetamine 7.1
Current Housing for Booked Arrestees (%)
Own house, mobile home, apartment
36.5
Someone else's house, mobile home, 34.5 apartment
Group quarters1 3.6
Hospital or care facility 1.6
Incarceration Facility 2.2
Shelter/ No Fixed Residence
20.6
Other 1.0
Current Employment Status for Booked Arrestees (%)
Working full time/ active military status
21.1
Working part-time/ seasonal
9.6
Unemployed (looking for work)
42.2
Unemployed (not looking for work)
12.1
In school only 2.1
Retired 1.4
Disabled for work or on leave
9.4
Other 2.1
Percent Testing Positive for those who Self-Reported 3-Day and 7-Day Use
0% 20% 40% 60% 80% 100%
Meth
Opiates
Marijuana
Cocaine
Three Day Use Seven Day Use
Current Health Insurance for Booked Arrestees (%)
No Insurance 75.4
Individually Purchased
1.9
Employer or Union Funded
7.5
State Government Funded
8.5
Retirement Medicare 0.2
Disability Medicare 3.1
Veterans Affairs 2.1
Multiple Types 1.3
Injection at most recent use (%)
Crack Cocaine 3.5 Powder Cocaine 17.1 Heroin 75.3 Methamphetamine 33.4 Other 2.5
Past 30 Day Self-Reported Drug Use (%)
Crack Cocaine 10.8
Powder Cocaine 6.6
Marijuana 43.5
Heroin 11.5
Methamphetamine 13.6
Self-Reported Arrests in Past Year (%)
None 42.0
1-2 43.7
3-5 10.1
6 or more 4.2
1 - Group quarters include residential hotel, rooming house, dormitory, group home, student housing, or military base
Multnomah County, OR, 2009 Page 3 146
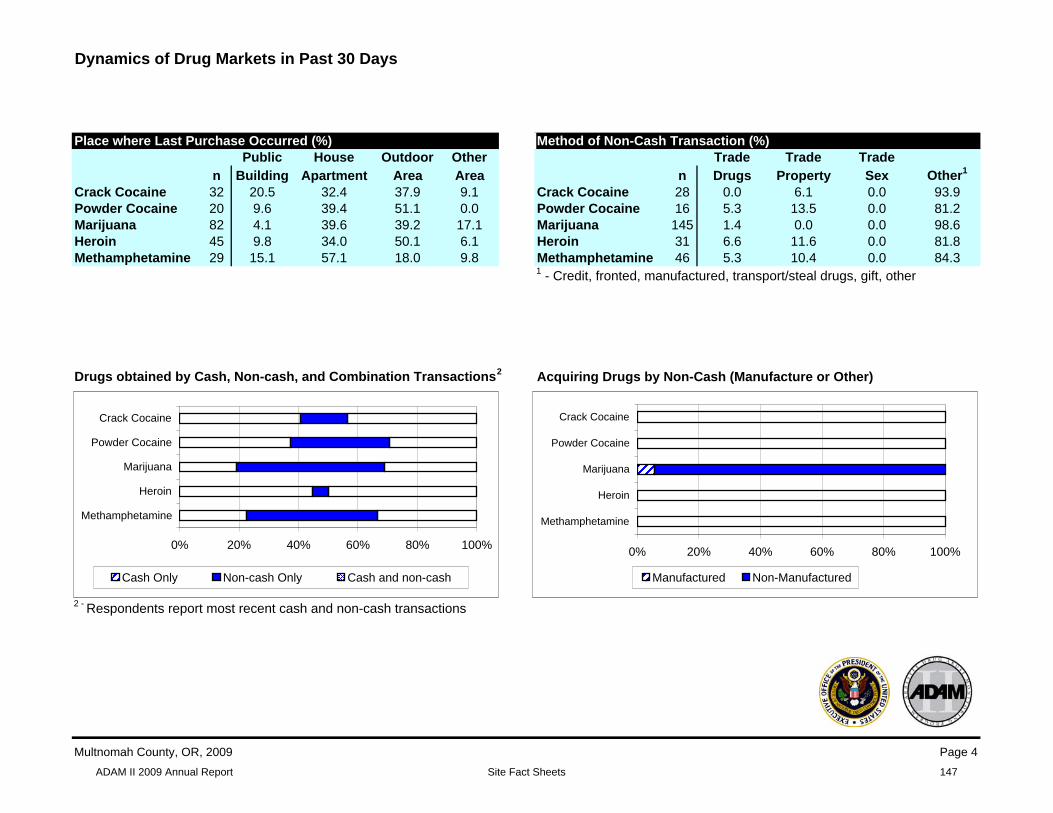
ADAM II 2009 Annual Report Site Fact Sheets
Dynamics of Drug Markets in Past 30 Days
Place where Last Purchase Occurred (%) Public House Outdoor Other
n Building Apartment Area Area Crack Cocaine 32 20.5 32.4 37.9 9.1 Powder Cocaine 20 9.6 39.4 51.1 0.0 Marijuana 82 4.1 39.6 39.2 17.1 Heroin 45 9.8 34.0 50.1 6.1 Methamphetamine 29 15.1 57.1 18.0 9.8
Method of Non-Cash Transaction (%) Trade Trade Trade
n Drugs Property Sex Other1
Crack Cocaine 28 0.0 6.1 0.0 93.9 Powder Cocaine 16 5.3 13.5 0.0 81.2 Marijuana 145 1.4 0.0 0.0 98.6 Heroin 31 6.6 11.6 0.0 81.8 Methamphetamine 46 5.3 10.4 0.0 1 - Credit, fronted, manufactured, transport/steal drugs, gift, other
84.3
Drugs obtained by Cash, Non-cash, and Combination Transactions2 Acquiring Drugs by Non-Cash (Manufacture or Other)
2 - Respondents report most recent cash and non-cash transactions
0% 20% 40% 60% 80% 100%
Methamphetamine
Heroin
Marijuana
Powder Cocaine
Crack Cocaine
Cash Only Non-cash Only Cash and non-cash
0% 20% 40% 60% 80% 100%
Methamphetamine
Heroin
Marijuana
Powder Cocaine
Crack Cocaine
Manufactured Non-Manufactured
Multnomah County, OR, 2009 Page 4
147
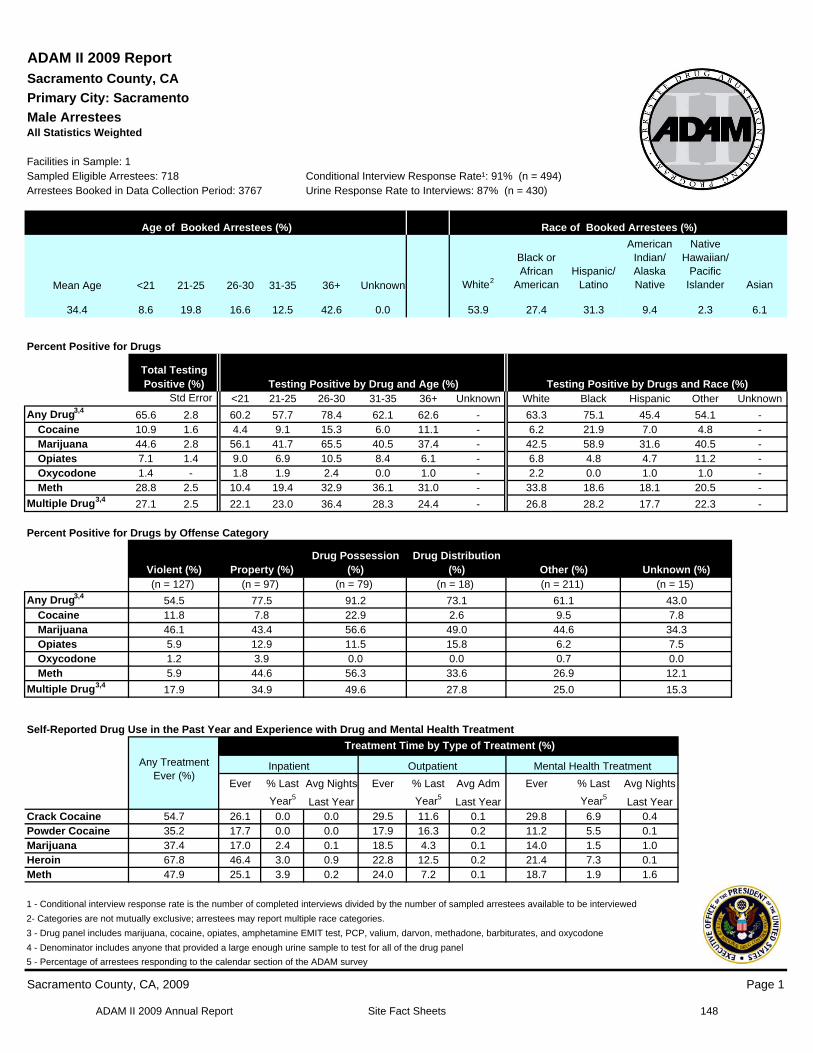
ADAM II 2009 Annual Report Site Fact Sheets
ADAM II 2009 Report Sacramento County, CA
Primary City: Sacramento
Male Arrestees All Statistics Weighted
Facilities in Sample: 1 Sampled Eligible Arrestees: 718 Arrestees Booked in Data Collection Period: 3767
Conditional Interview Response Rate¹: 91% (n = 494) Urine Response Rate to Interviews: 87% (n = 430)
Age of Booked Arrestees (%)
Mean Age <21 21-25 26-30 31-35 36+ Unknown
34.4 8.6 19.8 16.6 12.5 42.6 0.0
Race of Booked Arrestees (%)
American Native Black or Indian/ Hawaiian/
White2 African
American Hispanic/
Latino Alaska Native
Pacific Islander Asian
53.9 27.4 31.3 9.4 2.3 6.1
Percent Positive for Drugs
Total Testing Positive (%) Testing Positive by Drug and Age (%) Testing Positive by Drugs and Race (%)
Std Error <21 21-25 26-30 31-35 36+ Unknown White Black Hispanic Other Unknown
Any Drug3,4 65.6 2.8 60.2 57.7 78.4 62.1 62.6 63.3 75.1 45.4 54.1 Cocaine 10.9 1.6 4.4 9.1 15.3 6.0 11.1 6.2 21.9 7.0 4.8 Marijuana 44.6 2.8 56.1 41.7 65.5 40.5 37.4 42.5 58.9 31.6 40.5 Opiates 7.1 1.4 9.0 6.9 10.5 8.4 6.1 6.8 4.8 4.7 11.2 -Oxycodone 1.4 1.8 1.9 2.4 0.0 1.0 2.2 0.0 1.0 1.0 -Meth 28.8 2.5 10.4 19.4 32.9 36.1 31.0 33.8 18.6 18.1 20.5
Multiple Drug3,4 27.1 2.5 22.1 23.0 36.4 28.3 24.4 26.8 28.2 17.7 22.3
Percent Positive for Drugs by Offense Category
Drug Possession Drug Distribution Violent (%) Property (%) (%) (%) Other (%) Unknown (%) (n = 127) (n = 97) (n = 79) (n = 18) (n = 211) (n = 15)
Any Drug3,4 54.5 77.5 91.2 73.1 61.1 43.0 Cocaine 11.8 7.8 22.9 2.6 9.5 7.8 Marijuana 46.1 43.4 56.6 49.0 44.6 34.3 Opiates 5.9 12.9 11.5 15.8 6.2 7.5 Oxycodone 1.2 3.9 0.0 0.0 0.7 0.0 Meth 5.9 44.6 56.3 33.6 26.9 12.1
Multiple Drug3,4 17.9 34.9 49.6 27.8 25.0 15.3
Self-Reported Drug Use in the Past Year and Experience with Drug and Mental Health Treatment
Any Treatment Ever (%)
Treatment Time by Type of Treatment (%)
Inpatient Outpatient Mental Health Treatment
Ever % Last Avg Nights
Year5 Last Year
Ever % Last
Year5
Avg Adm
Last Year
Ever % Last
Year5
Avg Nights
Last Year Crack Cocaine 54.7 26.1 0.0 0.0 29.5 11.6 0.1 29.8 6.9 0.4 Powder Cocaine 35.2 17.7 0.0 0.0 17.9 16.3 0.2 11.2 5.5 0.1 Marijuana 37.4 17.0 2.4 0.1 18.5 4.3 0.1 14.0 1.5 1.0 Heroin 67.8 46.4 3.0 0.9 22.8 12.5 0.2 21.4 7.3 0.1 Meth 47.9 25.1 3.9 0.2 24.0 7.2 0.1 18.7 1.9 1.6
1 - Conditional interview response rate is the number of completed interviews divided by the number of sampled arrestees available to be interviewed
2- Categories are not mutually exclusive; arrestees may report multiple race categories.
3 - Drug panel includes marijuana, cocaine, opiates, amphetamine EMIT test, PCP, valium, darvon, methadone, barbiturates, and oxycodone
4 - Denominator includes anyone that provided a large enough urine sample to test for all of the drug panel
5 - Percentage of arrestees responding to the calendar section of the ADAM survey
Sacramento County, CA, 2009 Page 1
148
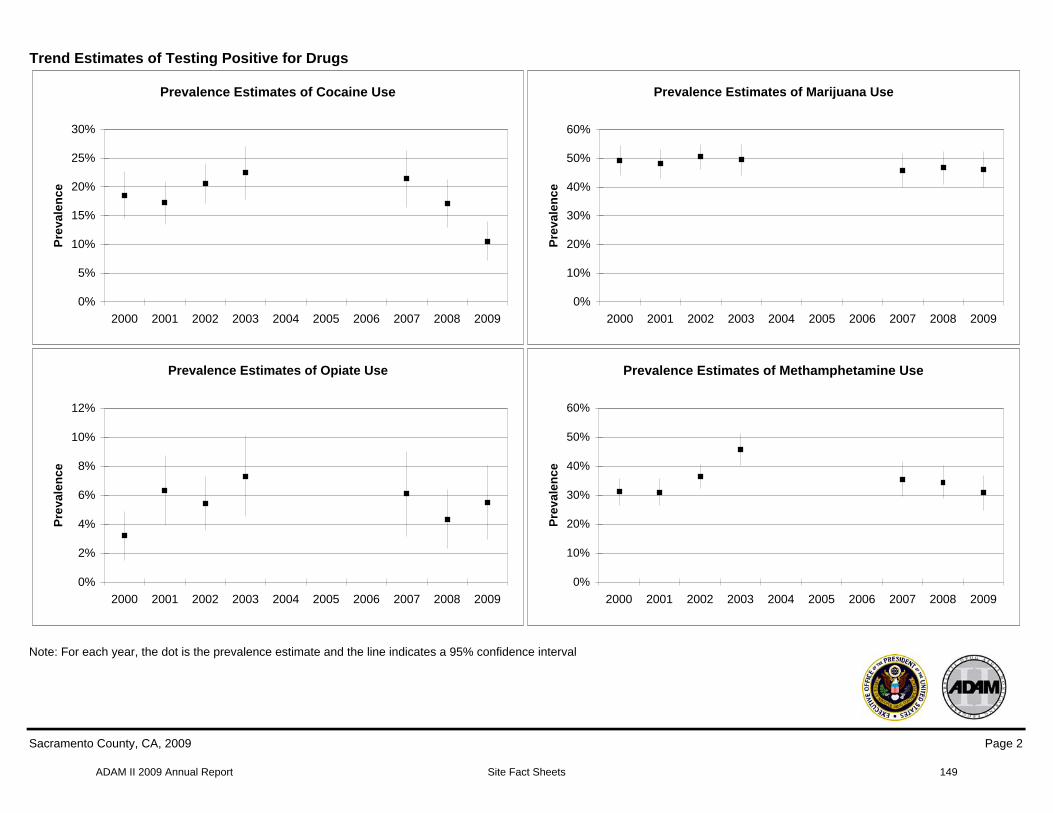
ADAM II 2009 Annual Report Site Fact Sheets
Trend Estimates of Testing Positive for Drugs
Prevalence Estimates of Cocaine Use
0%
5%
10%
15%
20%
25%
30%
2000 2001 2002 2003 2004 2005 2006 2007 2008 2009
Pre
va
len
ce
Prevalence Estimates of Marijuana Use
0%
10%
20%
30%
40%
50%
60%
2000 2001 2002 2003 2004 2005 2006 2007 2008 2009
Pre
va
len
ce
Note: For each year, the dot is the prevalence estimate and the line indicates a 95% confidence interval
Prevalence Estimates of Opiate Use
0%
2%
4%
6%
8%
10%
12%
2000 2001 2002 2003 2004 2005 2006 2007 2008 2009
Pre
va
len
ce
Prevalence Estimates of Methamphetamine Use
0%
10%
20%
30%
40%
50%
60%
2000 2001 2002 2003 2004 2005 2006 2007 2008 2009
Pre
va
len
ce
Sacramento County, CA, 2009 Page 2
149
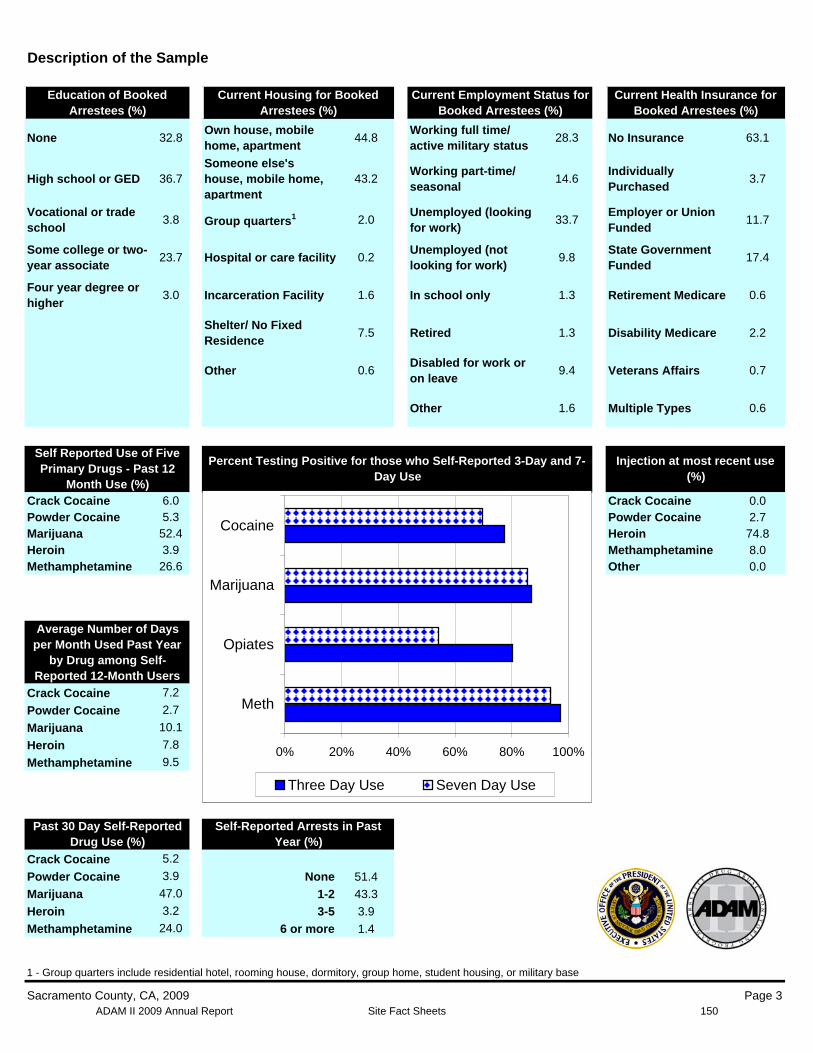
ADAM II 2009 Annual Report Site Fact Sheets
Description of the Sample
Education of Booked Arrestees (%)
None 32.8
High school or GED 36.7
Vocational or trade school
3.8
Some college or two-year associate
23.7
Four year degree or higher
3.0
Self Reported Use of Five Primary Drugs - Past 12
Month Use (%) Crack Cocaine 6.0 Powder Cocaine 5.3 Marijuana 52.4 Heroin 3.9 Methamphetamine 26.6
Average Number of Days per Month Used Past Year
by Drug among Self-Reported 12-Month Users
Crack Cocaine 7.2
Powder Cocaine 2.7
Marijuana 10.1
Heroin 7.8
Methamphetamine 9.5
Current Housing for Booked Arrestees (%)
Own house, mobile home, apartment
44.8
Someone else's house, mobile home, 43.2 apartment
Group quarters1 2.0
Hospital or care facility 0.2
Incarceration Facility 1.6
Shelter/ No Fixed Residence
7.5
Other 0.6
Current Employment Status for Booked Arrestees (%)
Working full time/ active military status
28.3
Working part-time/ seasonal
14.6
Unemployed (looking for work)
33.7
Unemployed (not looking for work)
9.8
In school only 1.3
Retired 1.3
Disabled for work or on leave
9.4
Other 1.6
Percent Testing Positive for those who Self-Reported 3-Day and 7-Day Use
0% 20% 40% 60% 80% 100%
Meth
Opiates
Marijuana
Cocaine
Three Day Use Seven Day Use
Current Health Insurance for Booked Arrestees (%)
No Insurance 63.1
Individually Purchased
3.7
Employer or Union Funded
11.7
State Government Funded
17.4
Retirement Medicare 0.6
Disability Medicare 2.2
Veterans Affairs 0.7
Multiple Types 0.6
Injection at most recent use (%)
Crack Cocaine 0.0 Powder Cocaine 2.7 Heroin 74.8 Methamphetamine 8.0 Other 0.0
Past 30 Day Self-Reported Drug Use (%)
Crack Cocaine 5.2
Powder Cocaine 3.9
Marijuana 47.0
Heroin 3.2
Methamphetamine 24.0
Self-Reported Arrests in Past Year (%)
None 51.4
1-2 43.3
3-5 3.9
6 or more 1.4
1 - Group quarters include residential hotel, rooming house, dormitory, group home, student housing, or military base
Sacramento County, CA, 2009 Page 3 150
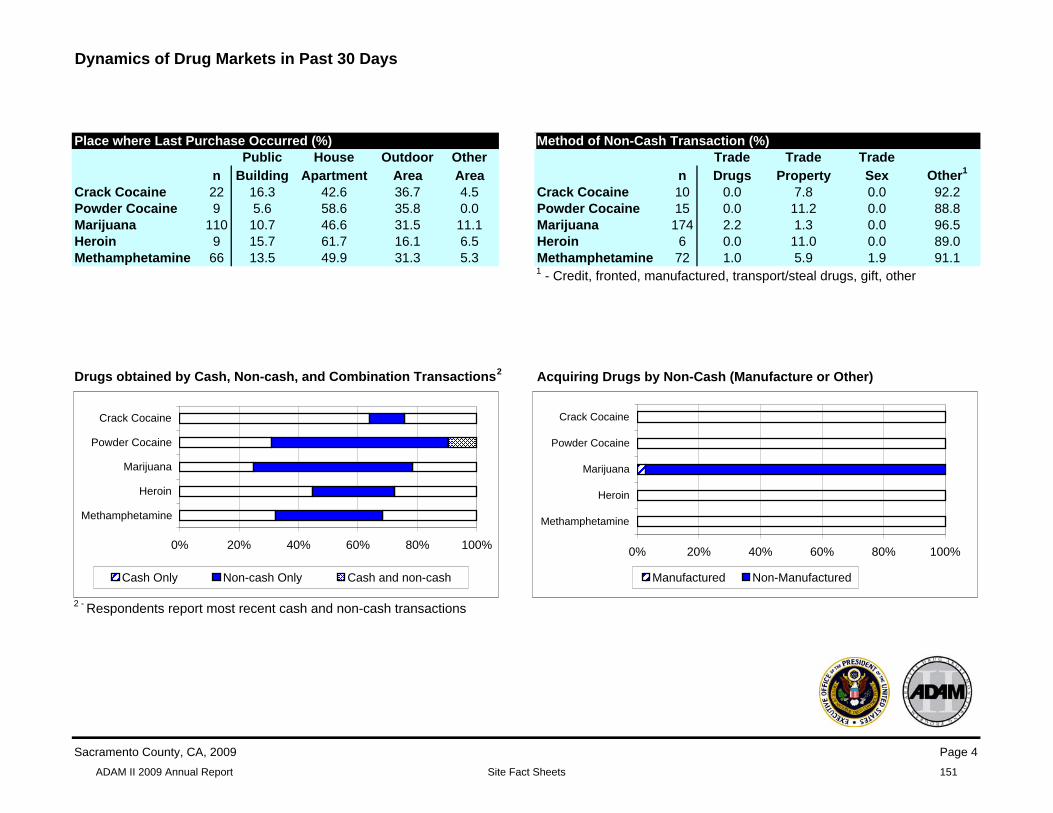
ADAM II 2009 Annual Report Site Fact Sheets
Dynamics of Drug Markets in Past 30 Days
Place where Last Purchase Occurred (%) Public House Outdoor Other
n Building Apartment Area Area Crack Cocaine 22 16.3 42.6 36.7 4.5 Powder Cocaine 9 5.6 58.6 35.8 0.0 Marijuana 110 10.7 46.6 31.5 11.1 Heroin 9 15.7 61.7 16.1 6.5 Methamphetamine 66 13.5 49.9 31.3 5.3
Method of Non-Cash Transaction (%) Trade Trade Trade
n Drugs Property Sex Other1
Crack Cocaine 10 0.0 7.8 0.0 92.2 Powder Cocaine 15 0.0 11.2 0.0 88.8 Marijuana 174 2.2 1.3 0.0 96.5 Heroin 6 0.0 11.0 0.0 89.0 Methamphetamine 72 1.0 5.9 1.9 1 - Credit, fronted, manufactured, transport/steal drugs, gift, other
91.1
Drugs obtained by Cash, Non-cash, and Combination Transactions2 Acquiring Drugs by Non-Cash (Manufacture or Other)
2 - Respondents report most recent cash and non-cash transactions
0% 20% 40% 60% 80% 100%
Methamphetamine
Heroin
Marijuana
Powder Cocaine
Crack Cocaine
Cash Only Non-cash Only Cash and non-cash
0% 20% 40% 60% 80% 100%
Methamphetamine
Heroin
Marijuana
Powder Cocaine
Crack Cocaine
Manufactured Non-Manufactured
Sacramento County, CA, 2009 Page 4
151
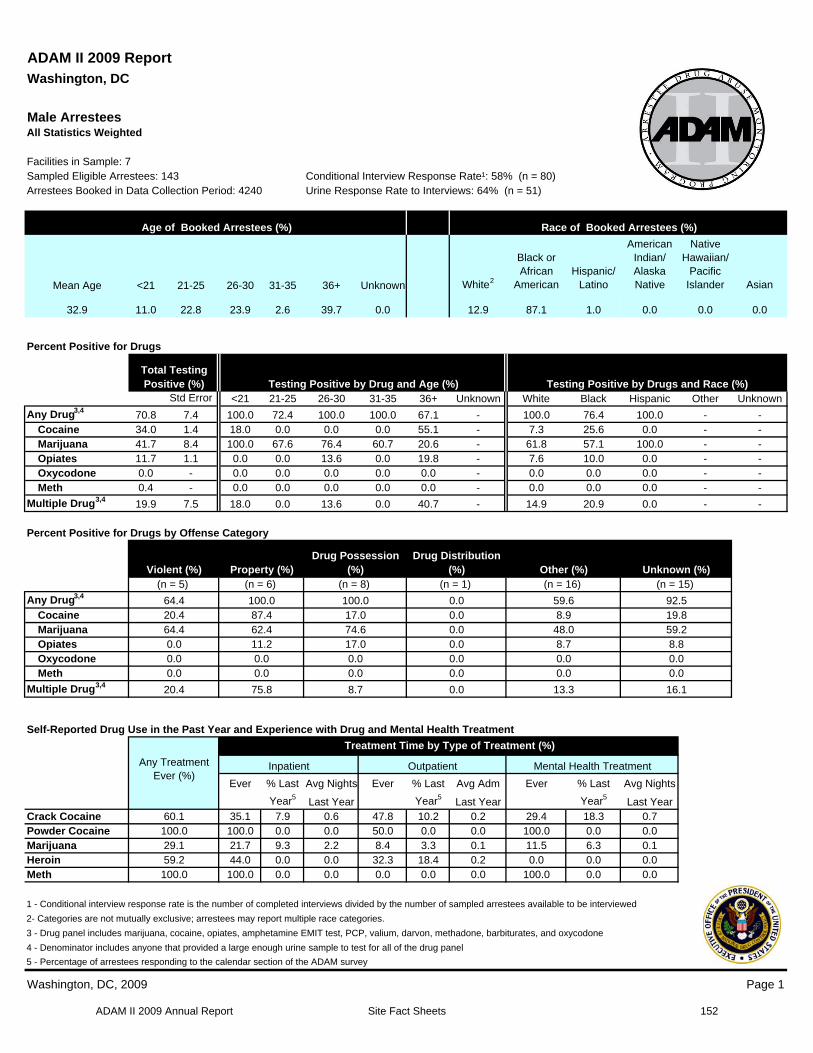
ADAM II 2009 Annual Report Site Fact Sheets
ADAM II 2009 Report Washington, DC
Male Arrestees All Statistics Weighted
Facilities in Sample: 7 Sampled Eligible Arrestees: 143 Arrestees Booked in Data Collection Period: 4240
Conditional Interview Response Rate¹: 58% (n = 80) Urine Response Rate to Interviews: 64% (n = 51)
Age of Booked Arrestees (%)
Mean Age <21 21-25 26-30 31-35 36+ Unknown
32.9 11.0 22.8 23.9 2.6 39.7 0.0
Race of Booked Arrestees (%)
American Native Black or Indian/ Hawaiian/
White2 African
American Hispanic/
Latino Alaska Native
Pacific Islander Asian
12.9 87.1 1.0 0.0 0.0 0.0
Percent Positive for Drugs
Total Testing Positive (%) Testing Positive by Drug and Age (%) Testing Positive by Drugs and Race (%)
Std Error <21 21-25 26-30 31-35 36+ Unknown White Black Hispanic Other Unknown
Any Drug3,4 70.8 7.4 100.0 72.4 100.0 100.0 67.1 100.0 76.4 100.0 -Cocaine 34.0 1.4 18.0 0.0 0.0 0.0 55.1 7.3 25.6 0.0 -Marijuana 41.7 8.4 100.0 67.6 76.4 60.7 20.6 61.8 57.1 100.0 -Opiates 11.7 1.1 0.0 0.0 13.6 0.0 19.8 7.6 10.0 0.0 - -Oxycodone 0.0 0.0 0.0 0.0 0.0 0.0 0.0 0.0 0.0 - -Meth 0.4 0.0 0.0 0.0 0.0 0.0 0.0 0.0 0.0 -
Multiple Drug3,4 19.9 7.5 18.0 0.0 13.6 0.0 40.7 14.9 20.9 0.0 -
Percent Positive for Drugs by Offense Category
Drug Possession Drug Distribution Violent (%) Property (%) (%) (%) Other (%) Unknown (%)
(n = 5) (n = 6) (n = 8) (n = 1) (n = 16) (n = 15)
Any Drug3,4 64.4 100.0 100.0 0.0 59.6 92.5 Cocaine 20.4 87.4 17.0 0.0 8.9 19.8 Marijuana 64.4 62.4 74.6 0.0 48.0 59.2 Opiates 0.0 11.2 17.0 0.0 8.7 8.8 Oxycodone 0.0 0.0 0.0 0.0 0.0 0.0 Meth 0.0 0.0 0.0 0.0 0.0 0.0
Multiple Drug3,4 20.4 75.8 8.7 0.0 13.3 16.1
Self-Reported Drug Use in the Past Year and Experience with Drug and Mental Health Treatment
Treatment Time by Type of Treatment (%)
Any Treatment Inpatient Outpatient Mental Health TreatmentEver (%)
Ever % Last Avg Nights Ever % Last Avg Adm Ever % Last Avg Nights
Year5 Last Year Year5
Last Year Year5 Last Year
Crack Cocaine 60.1 35.1 7.9 0.6 47.8 10.2 0.2 29.4 18.3 0.7 Powder Cocaine 100.0 100.0 0.0 0.0 50.0 0.0 0.0 100.0 0.0 0.0 Marijuana 29.1 21.7 9.3 2.2 8.4 3.3 0.1 11.5 6.3 0.1 Heroin 59.2 44.0 0.0 0.0 32.3 18.4 0.2 0.0 0.0 0.0 Meth 100.0 100.0 0.0 0.0 0.0 0.0 0.0 100.0 0.0 0.0
1 - Conditional interview response rate is the number of completed interviews divided by the number of sampled arrestees available to be interviewed
2- Categories are not mutually exclusive; arrestees may report multiple race categories.
3 - Drug panel includes marijuana, cocaine, opiates, amphetamine EMIT test, PCP, valium, darvon, methadone, barbiturates, and oxycodone
4 - Denominator includes anyone that provided a large enough urine sample to test for all of the drug panel
5 - Percentage of arrestees responding to the calendar section of the ADAM survey
Washington, DC, 2009 Page 1
152
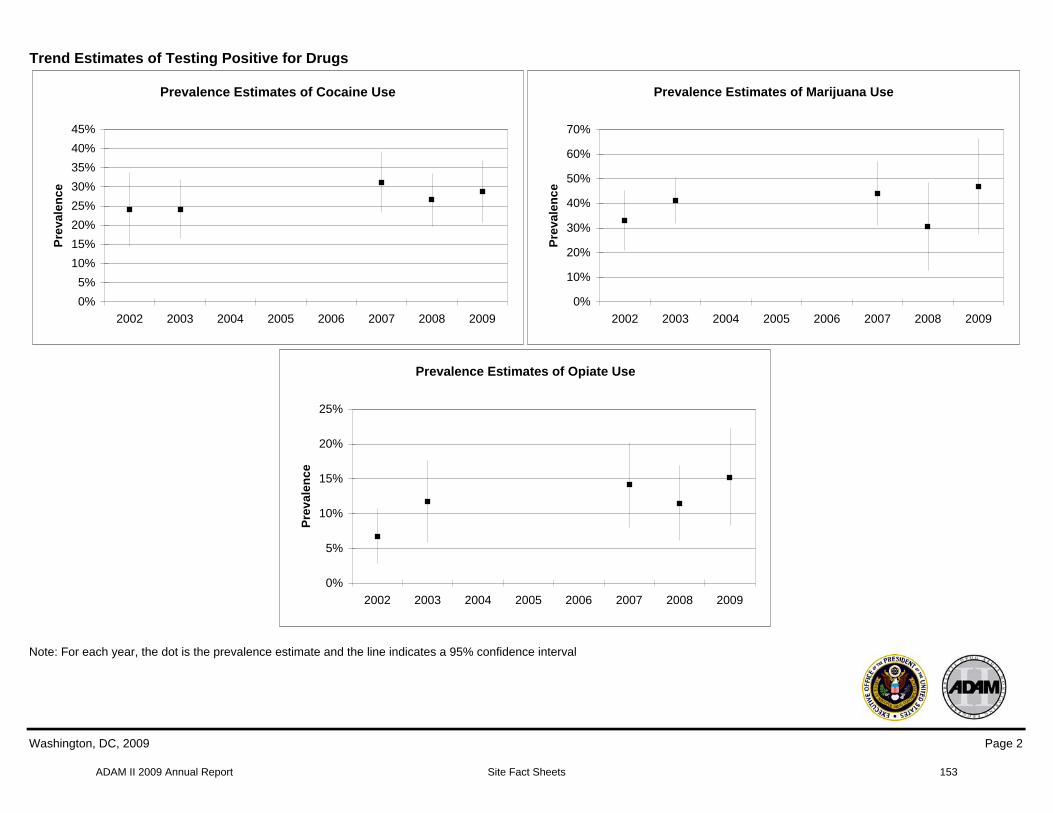
ADAM II 2009 Annual Report Site Fact Sheets
Trend Estimates of Testing Positive for Drugs
Prevalence Estimates of Cocaine Use
0%
5%
10%
15%
20%
25%
30%
35%
40%
45%
2002 2003 2004 2005 2006 2007 2008 2009
Pre
va
len
ce
Prevalence Estimates of Opiate Use
0%
5%
10%
15%
20%
25%
2002 2003 2004 2005 2006 2007 2008 2009
Pre
va
len
ce
Prevalence Estimates of Marijuana Use
0%
10%
20%
30%
40%
50%
60%
70%
2002 2003 2004 2005 2006 2007 2008 2009
Pre
va
len
ce
Note: For each year, the dot is the prevalence estimate and the line indicates a 95% confidence interval
Washington, DC, 2009 Page 2
153
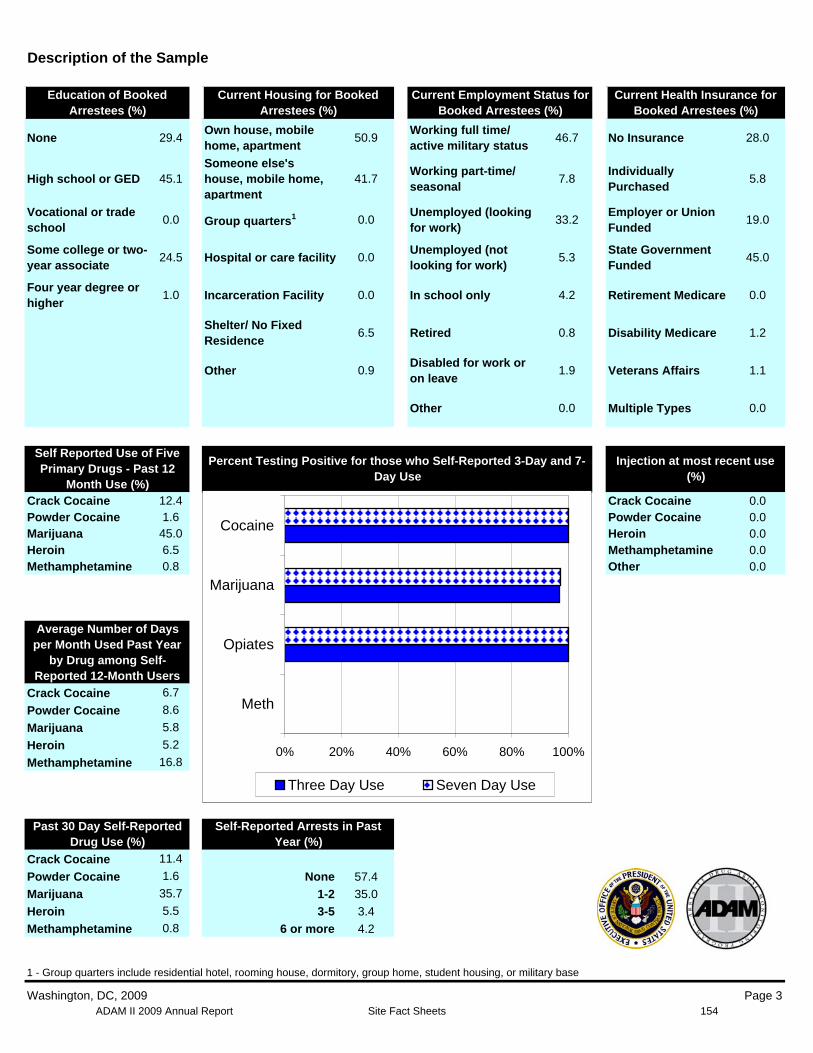
ADAM II 2009 Annual Report Site Fact Sheets
Description of the Sample
Education of Booked Arrestees (%)
None 29.4
High school or GED 45.1
Vocational or trade school
0.0
Some college or two-year associate
24.5
Four year degree or higher
1.0
Self Reported Use of Five Primary Drugs - Past 12
Month Use (%) Crack Cocaine 12.4 Powder Cocaine 1.6 Marijuana 45.0 Heroin 6.5 Methamphetamine 0.8
Average Number of Days per Month Used Past Year
by Drug among Self-Reported 12-Month Users
Crack Cocaine 6.7
Powder Cocaine 8.6
Marijuana 5.8
Heroin 5.2
Methamphetamine 16.8
Current Housing for Booked Arrestees (%)
Own house, mobile home, apartment
50.9
Someone else's house, mobile home, 41.7 apartment
Group quarters1 0.0
Hospital or care facility 0.0
Incarceration Facility 0.0
Shelter/ No Fixed Residence
6.5
Other 0.9
Current Employment Status for Booked Arrestees (%)
Working full time/ active military status
46.7
Working part-time/ seasonal
7.8
Unemployed (looking for work)
33.2
Unemployed (not looking for work)
5.3
In school only 4.2
Retired 0.8
Disabled for work or on leave
1.9
Other 0.0
Percent Testing Positive for those who Self-Reported 3-Day and 7-Day Use
0% 20% 40% 60% 80% 100%
Meth
Opiates
Marijuana
Cocaine
Three Day Use Seven Day Use
Current Health Insurance for Booked Arrestees (%)
No Insurance 28.0
Individually Purchased
5.8
Employer or Union Funded
19.0
State Government Funded
45.0
Retirement Medicare 0.0
Disability Medicare 1.2
Veterans Affairs 1.1
Multiple Types 0.0
Injection at most recent use (%)
Crack Cocaine 0.0 Powder Cocaine 0.0 Heroin 0.0 Methamphetamine 0.0 Other 0.0
Past 30 Day Self-Reported Drug Use (%)
Crack Cocaine 11.4
Powder Cocaine 1.6
Marijuana 35.7
Heroin 5.5
Methamphetamine 0.8
Self-Reported Arrests in Past Year (%)
None 57.4
1-2 35.0
3-5 3.4
6 or more 4.2
1 - Group quarters include residential hotel, rooming house, dormitory, group home, student housing, or military base
Washington, DC, 2009 Page 3 154
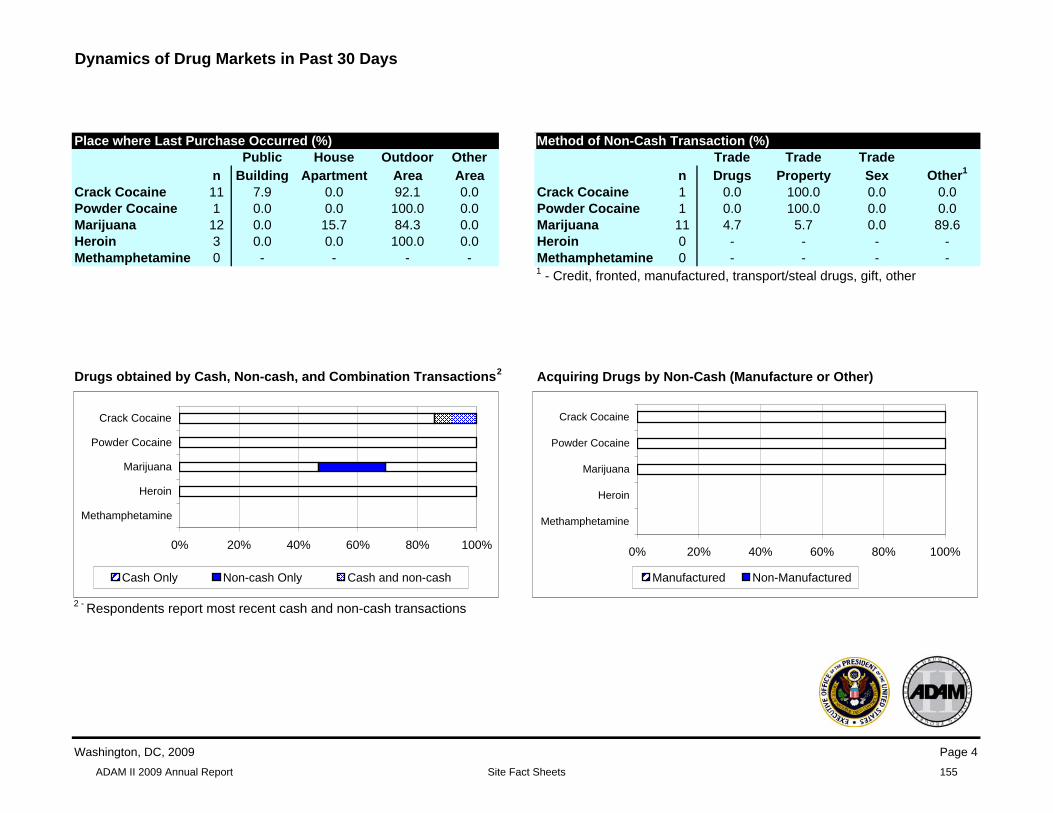
ADAM II 2009 Annual Report Site Fact Sheets
Dynamics of Drug Markets in Past 30 Days
Place where Last Purchase Occurred (%) Public House Outdoor Other
n Building Apartment Area Area Crack Cocaine 11 7.9 0.0 92.1 0.0 Powder Cocaine 1 0.0 0.0 100.0 0.0 Marijuana 12 0.0 15.7 84.3 0.0 Heroin 3 0.0 0.0 100.0 0.0 Methamphetamine 0 - - - -
Method of Non-Cash Transaction (%) Trade Trade Trade
n Drugs Property Sex Other1
Crack Cocaine 1 0.0 100.0 0.0 0.0 Powder Cocaine 1 0.0 100.0 0.0 0.0 Marijuana 11 4.7 5.7 0.0 89.6 Heroin 0 - - - -Methamphetamine 0 - - -1 - Credit, fronted, manufactured, transport/steal drugs, gift, other
-
Drugs obtained by Cash, Non-cash, and Combination Transactions2 Acquiring Drugs by Non-Cash (Manufacture or Other)
2 - Respondents report most recent cash and non-cash transactions
0% 20% 40% 60% 80% 100%
Methamphetamine
Heroin
Marijuana
Powder Cocaine
Crack Cocaine
Cash Only Non-cash Only Cash and non-cash
0% 20% 40% 60% 80% 100%
Methamphetamine
Heroin
Marijuana
Powder Cocaine
Crack Cocaine
Manufactured Non-Manufactured
Washington, DC, 2009 Page 4
155