Embed Size (px)
Citation preview

AD-AO84 122 PITISSIDI4 1*41W PA 1*4W ID ENERFO SOCIAL AND IU-tTC P/S 19/3PRESIDEN4TIALLY DIRECTED RELOCATIONI COMLIANCE ATTITUOLES. WI1NAY SO 0 0 ROS DCPA1-77-C-NIA
UNCLASSIFIED UCSM-80-CDI II.
1 221 U
1 NI
LEkVELFINAL REPORT
PRESIDENTIALLY DIRECTED RELOCATION:COMPLIANCE ATTITUDES
GEORGE 0. ROGERS SE ECTEf
CONTRACT: DCPAO 1 -77-C-02 18WORK UNIT: 4815B
FOR
FEDERAL EMERGENCY MANAGEMENT AGENCYWASHINGTON D.C. 20472
TH418 REPORT HAS SEEN REVIE[WED IN THE FEDERAL EameGECYMANAGEMENT AGENCY AND APPROVED FOR PUBLICATION. APPROVALR DOES NoT SIGNIFY THAT THE CONTENTSo NECESSARILY REFLECT THEVIEWS AND POLICIES Oor THE FEDERAL EMERGENCY MANAGEMENTAGENCY.
UNIVERSITY OF PITTSBURGHUNIVERSITY CENWR POO SOCIAL AND URBAN RESEARCH
MAY. 1960
*P~tb~a3 005~m~ ~ td~

FINAL REPORT if
PRESIDENTIALLY DIRECTED RELOCATION:
Compliance Attitudes
George 0. Rogers
CONTRACT: DCPAOI-77-C-0218WORK UNIT: 4815B
for
Federal Emergency Management AgencyWashington, D.C. 20472
This report has been reviewed in the Federal EmergencyManagement Agency and approved for publication. Approvaldoes not signify that the contents necessarily reflectthe views and policies of the Federal Emergency Manage-ment Agency.
University of Pittsburgh
University Center for Social and Urban Research
May, 1980
APPROVED FOR PUBLIC RELEASE: DISTRIBUTION UNLIMITED
A - I. ,:

UnclassifiedSECURITY CLASSIFICATION OF THIS PAGE 197.o Dw. (..I
REPOR DOCUENTATON PAE hlAD lINSTRUCTIONSREPOT DCUMNTATON AGEBEF~ORE CO.%fPLFTING FORMI
I. REPORT NUMBER 3.GOVT ACCESSION NO. 3. RCCIPIETHYS CATALOG NUMBER
4. TiTLng .. 'I)S TVPe or RLPoRT.a PERIOD COVEREO
if Presidentially Directed Relocatiop"I FinalRepmt o,Compliance Attitudes,#0" " T 8
7. AU THOR(s) . CONTRACT OR GRANT NUM9614(s)
George 0. /Rogers DCPAOl-77-C-02l8
A. PERFRMN ORGANIZATION NAME AND ADDRESS to, PROGA ELEMENT. PRIJECT. TASX
University of Pittsburgh, University A 4a""UI UBR
Center for Social and Urban Research - 4815B
It. CONTROILLAG OFFICE NAME AND ADDRESS IF. RtEPOr DATE
Fedeal ~ Mangemet AcMay, 1980FdrlEergency MngmtAgency 13. JUMOIER OF PAGES
Washington, D.C. 2047T2 *_________I___MA MONITORING AGEENCY NAME G AODRESS(If dawIP, 1,0.. CWI,.Ili.* Off-,) IS. SECURITY CLASS. fteIhi-.. pfl)
- Unclassified
I.ECLASSIFICATION!' DOWN GRADINGaSCHEDLE'
IS. DISTRIBUTION STATEMENT (.1 hs.. R9.-0)
Approved for Public Release; Distribution Unlimited
It. KEY WOnDs (C.I1~w~ -0 SlC06 l....v 1 a.,.Uy esbl..h -- ~b.,)
20. Aosr;ACTr rc.w,l..'.R ,... . /Is -g.c.v d id..b .,, bf-k.AUWIA'
In this report the results of the 1978 national survey are cast interms of presidential relocation compliance attitudes and their bearingon crisis relocation planning. In this national probability sample,1620 Americans, 18 years of age and older, vere interviewed in the con-tiguous United States. The responsibility for the fieldwork-rests withMarketing Information Service of Atlanta, Georgia.
DO 1473 EDITON OFr I NOV its is OSOLETE Unclassified ______
SECURITY CLASSIFICATION OF THIS PAGE IRA.. 11&-b E101-0..
Unclassifiedr., FC, &S$IFICATION OF TUIb PAQR(h. Dad& Zna.ed)
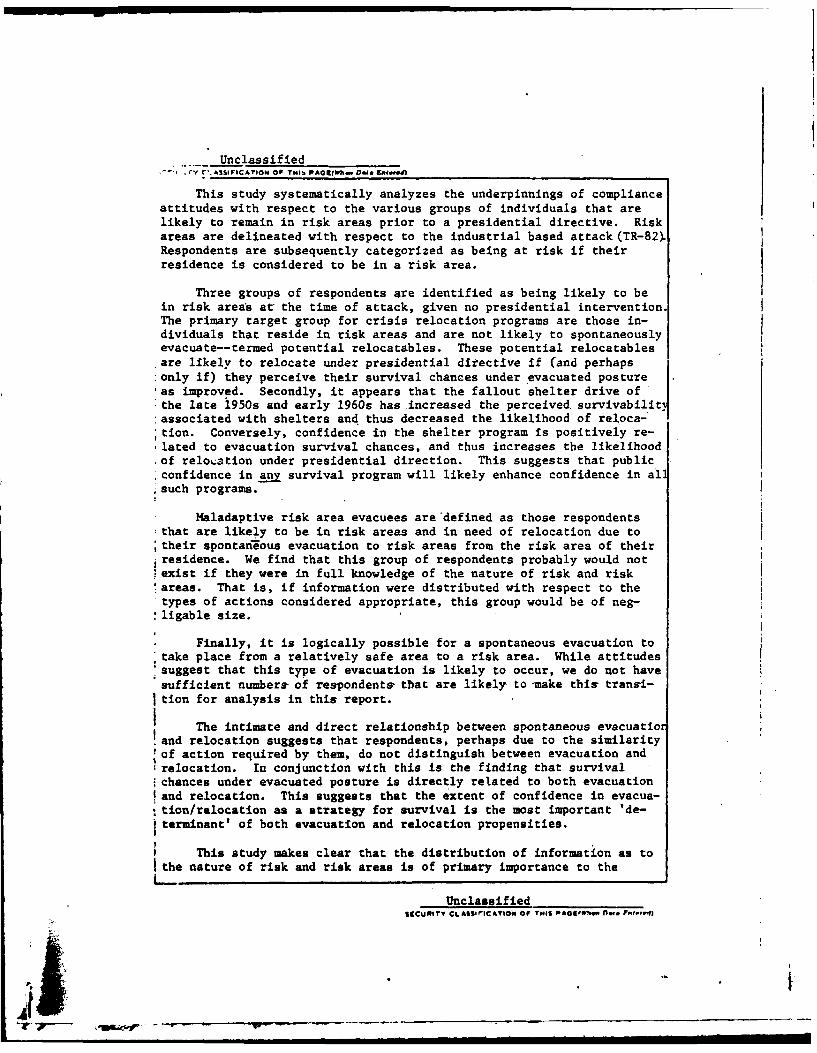
This study systematically analyzes the underpinnings of complianceattitudes with respect to the various groups of individuals that arelikely to remain in risk areas prior to a presidential directive. Riskareas are delineated with respect to the industrial based attack (TR-82Respondents are subsequently categorized as being at risk if theirresidence is considered to be in a risk area.
Three groups of respondents are identified as being likely to bein risk areas at the time of attack, given no presidential intervention.
The primary target group for crisis relocation programs are those in-dividuals that reside in risk areas and are not likely to spontaneouslyevacuate--termed potential relocatables. These potential relocatables
are likely to relocate under presidential directive if (and perhapsonly if) they perceive their survival chances under *evacuated posture [
'as improved. Secondly, it appears that the fallout shelter drive of tthe late 1950s and early 1960s has increased the perceived survivabilitj:associated with shelters and thus decreased the likelihood of reloca-,tion. Conversely, confidence in the shelter program is positively re-,lated to evacuation survival chances, and thus increases the likelihoodof relocation under presidential direction. This suggests that publicconfidence in any survival program will likely enhance confidence in al3.such programs.
Maladaptive risk area evacuees are defined as those respondents:that are likely to be in risk areas and in need of relocation due to,their spontan-eous evacuation to risk areas from the risk area of theiriresidence. We find that this group of respondents probably would not.exist if they were in full knowledge of the nature of risk and risk'areas. That is, if information were distributed with respect to thetypes of actions considered appropriate, this group would be of neg-ligable size.
Finally, it is logically possible for a spontaneous evacuation totake place from a relatively safe area to a risk area. While attitudessuggest that this type of evacuation is likely to occur, we do not havesufficient number& of respondents, that are likely to -make thi transi-tion for analysis in this report.
The intimate and direct relationship between spontaneous evacuatior
land relocation suggests that respondents, perhaps due to the similarity'of action required by them, do not distinguish between evacuation and;relocation. In conjunction with this is the finding that survivalichances under evacuated posture is directly related to both evacuationland relocation. This suggests that the extent of confidence in evacua-Stion/relocation as a strategy for survival is the most important 'de-iterminant' of both evacuation and relocation propensities.
This study makes clear that the distribution of information as toI the nature of risk and risk areas is of primary importance to the
UnclassifiedSeCUNItY CLASSIICATIO Or THIS PAGvw.N. 0M. F.".)
A _ _ _ _ _ __ _ _ _ _

Unclassified-. 7 F C.. AS.4bCeAOw o0 Tw'. PAGCE(w* DuO g."e..
effectiveness of crisis relocation. This conclusion clearly underlinesthe importance of educational programs with respect to crisis reloca-tion in either a period of increased tension, or a more general pro-gram. We argue that the very effectiveness of crisis relocation as amethod of dealing with nuclear disaster depends on this distributionof information.
,cCSion For
I -
* ""
i
I S
I
Utranclassie*_
DIs
UnlssfeSeUHP :&S-'CTO rto
! ,F

PREFACE
This paper represents a reformulation of the results of the
1978 national survey. Some specific issues related to crisis re-
location planning are addressed: compliance attitudes with respect
to a presidentially directed relocation.
While the primary responsibility rests with the author, this
research would not have taken place without the continued support
of Dr. Jiri Nehnevajsa. Not only was the data made available through
his efforts, but his constant and copious criticism, advice and
guidance were of tremendous value to the author and this report.
In addition, the author is in considerable debt to the
University Center for Social and Urban Research for the constant
and unending support. The expression of gratitude is hardly enough.
George 0. Rogers
March 26, 1980
v

TABLE OF CONTENTS
Page
PREFACE ............. ........................... v
1. INTRODUCTION ........... ....................... 1
2. SOME RELEVANT RELOCATION GROUPS ...... ............. 4
3. POTENTIAL RELOCATABLES ......... .................. 9
3.1 Some Selected Characteristics of PotentialRelocatables .......... .................... 9
3.2 Some Impacts on the Likelihood of DirectedEvaluation .......... ..................... 10
3.2.1 Geographic Location .... ............. ... 10
3.2.2 Respondent's Age .... ............... ... 11
3.2.3 Sex of Respondent ..... .............. ... 12
3.2.4 Employment Status ..... .............. ... 12
3.2.5 Number of Older Household Members ... ...... 12
3.2.6 Disaster Experience .... ............. ... 13
3.2.7 Life Stage ...... .................. ... 13
3.3 Some Characteristics of Directed Evacuation for'Potential Relocatables' .............. ....... 15
3.4 A Preliminary Model of Directed Evacuation for'Potential Relocatables' .............. ....... 17
3.5 Conclusions for Potential Relocatables ......... ... 17
4. MALADAPTIVE RISK AREA EVACUEES .... .............. ... 30
4.1 Some Characteristics of Maladaptive RiskArea Evacuees .............. ........... .. 31
4.2 Relocation Propensities for Maladaptive RiskArea Evacuees. ...... ..................... 31
4.2.1 Service in the Armed Forces ........... ... 32
4.3 Some Background Characteristics and RelocationPropensities for Maladaptive Risk Area Evacuees. . 32
4.4 A Preliminary Model of Relocation Propensitiesfor Maladaptive Risk Area Evacuees ........... ... 33
4.5 Conclusions for Maladaptive Risk Area Evacuees . . 35
5. CONCLUSION ......... ........................ ... 42

TABLE OF CONTENTS (continued)
List of Tables
Table 1.1: Pattern of Desirability Among AlternativesWhere '+' Denotes Positive Desirability and'-' Denotes Neutral or Negative Desirability . . . . 3
Table 2.1: Relative Distribution Among SpontaneousEvacuation Response Sets in Light of aPeriod of Increased World Tensions. .. ......... 8
Table 3.1: Directed Evacuation Likelihood and CommnunityEstimates Under Presidential Direction byResidential Area .. .. ............. .. 19
Table 3.2: Directed Evacuation Likelihood and CommunityEstimate Under Presidential Direction byAge of Respondent, for Those RespondentsLikely to Stay in Risk Areas in the Pre-Direction Period .. .. ............. .. 20
Table 3.3: Directed Evacuation Likelihood and CommunityEstimate Under Presidential Directive bySex of Respondent, for Those RespondentsLikely to Stay in Risk Areas in Pre-DirectionPeriod .. .. ............. ........ 21
Table 3.4: Directed Evacuation Likelihood and CommnunityEstimate Under Presidential Direction byEmployment Status, for Those RespondentsLikely to Stay in Risk Areas in the Pre-Direction Period .. .. ............. .. 22
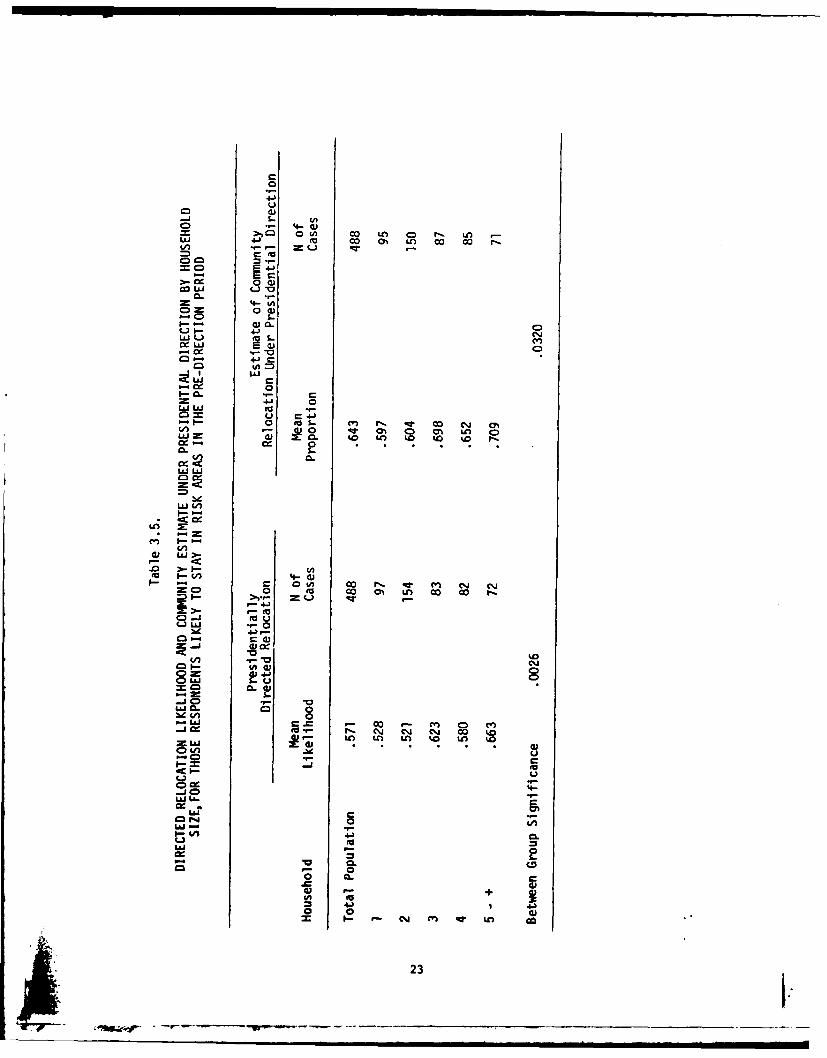
Table 3.5: Directed Evacuation Likelihood and CommunityEstimate Under Presidential Direction byHousehold Size, for those Respondents Likelyto Stay in Risk Areas in the Pre-DirectionPeriod .. .. ............ ......... 23
Table 3.6: Directed Evacuation Likelihood and CommunityEstimate Under Presidential Direction byNumber of Household Members 65 Years of Ageor More, for Respondents Likely to Stay inRisk Areas in the Pre-Direction Period .. .. .... 24
Table 3.7: Directed Evacuation Likelihood and CommunityEstimates Under Presidential Direction byDisaster Experience. .. ...............25
Table 3.8: Directed Evacuation Likelihood and Community.Estimates Under Presidential Direction byLife Stage, for Respondents Likely to Stayin Risk Areas in the Pre-Direction Period. .. ... 26

TABLE OF CONTENTS (continued)
Table 3.9: Unstandardized Regression Coefficients forSignificant Factors in Directed EvacuationPropensities, for Individuals Likely to Stayin Risk Areas in Pre-Directive Period .......... ... 27
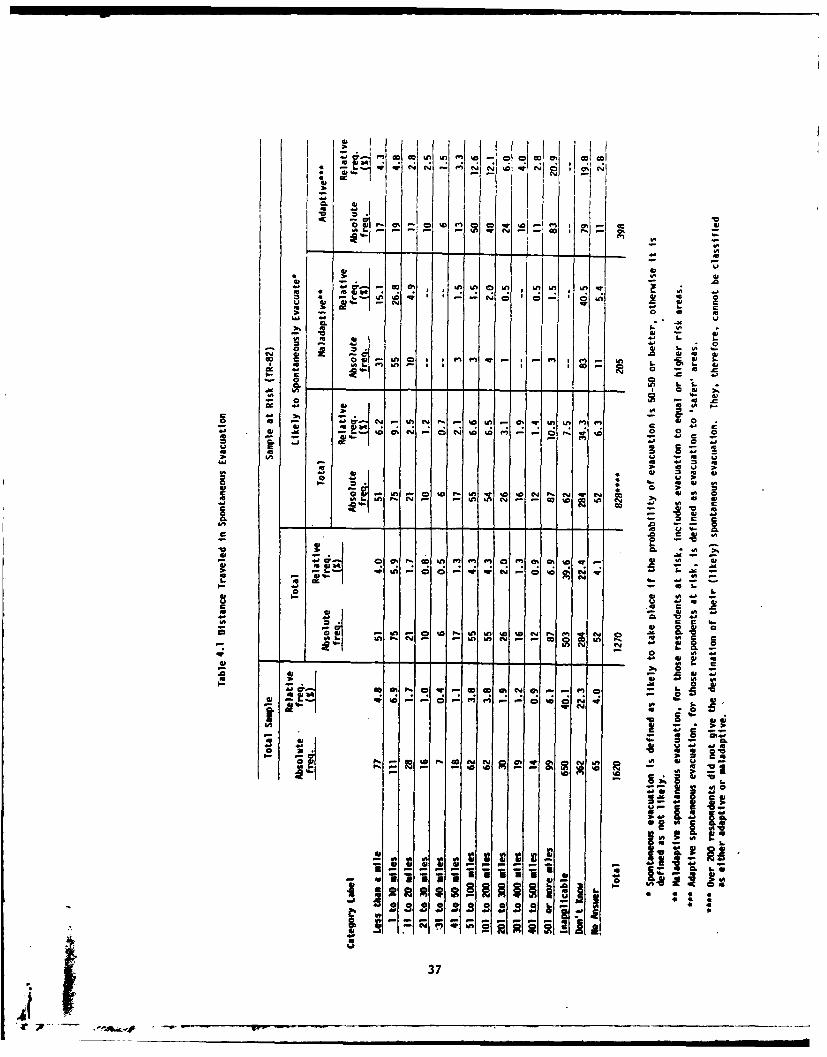
Table 4.1: Distance Traveled in Spontaneous Evacuation .. ..... 37
Table 4.2: Reason for Choosing Destination inSpontaneous Evacuation ..... ................ ... 38
Table 4.3: Relocation Propensity by Service inArmed Forces ......... ..................... 39
Table 4.4: Unstandardized Regression Coefficients forSignificant Factors in Directed EvacuationPropensities, for Maladaptive Risk AreaEvacuees ....... ....................... .... 40
AV

TABLE OF CONTENTS (continued)
List of Figures
Figure 2.1: Groups of Aff ce Individuls forPresidentially Directed Evacuation .... ........ 7
Figure 3.1: A Preliminary Model of Directed EvacuationAttitudes for Those Individuals Likely toRemain in Risk Areas in the Pre-DirectivePeriod ........ ...................... ... 28
Figure 3.2: A Preliminary Model of the RelationshipBetween Survivability and Directed EvacuationPropensity for Individuals not Likely toSpontaneously Evacuate TR-82 Risk Areas ......... 29
Figure 4.1: A Preliminary Substantive Model ofRelocation Propensity for MaladaptiveRisk Area Evacuees ........ ................ 41
"f i. .
1. INTRODUCTION
A presidentially directed evacuation is one important option
for dealing with an acute threat of nuclear war. Before making a
complete investigation into attitudes indicative of potential
public compliance, let us examine the relationship between this and
other alternatives for the mitigation of nuclear disaster affects.
Specifically, let us examine the relationships among the following
alternative methods:
1. Blast shelters
2. Public fallout shelters
3. Home basement sharing
4. Crisis relocation
The data to be reported here and all subsequent data in this
report are derived from the 1978 national survey. This survey was
carried out between mid-Septemrber and mid-December of 1978. The
sample of adult residents Cage 18 years or older) of the contiguous
48 states, includes 1,620 Americans. The average interview, as
carried out by Marketing Information Service of Atlanta, Georgia,
was 71 minutes in length. In another report, Issues of Civil
Defense: Vintage 1978, Jiri Nehnevajsa has presented the major
findings of the 1978 survey.
We ask each respondent to rate the desirability of these
alternatives, from highly desirable (+3) to highly undesirable (-3),
with zero (0) representing a neutral response. We find that while
the overwhelming majority (77.2%) find at least two of these alterna-
tives desirable (including only positive responses), 88 respondents
or 5.4 percent find no alternatives desirable, and 138 respondents
(8.4 percent view these alternatives as true alternatives, i.e.,
mutually exclusive alternatives).
We also find, however, that of those that found no alterna-
tive desirable, 36.9 percent said they definitely or probably would
evacuate under presidential direction. For those that view these
alternatives as mutually exclusive, 52.3 percent responded they
definitely or probably would evacuate under presidential direction.
This points the way to examination of the patterns of desirability
among the alternatives.

Table 1.1 shows that 41.4 percent of our respondents find all
four alternatives not only acceptable but desirable.
" Further, if we look at those (138 respondents) that
treated these alternatives as mutually exclusive, we
find that these alternatives are ranked as follows:
Home basements are least desirable, with blast shelters
and evacuation being more desirable, and public fallout
shelters being most desirable.
" However, if we then examine the responses of those that
selected three (3) of the alternatives, we find that the
ranking changes slightly to reverse the order of blast
shelters and evacuation so that the order becomes: Public
fallout as the most acceptable, blast shelters the next
most desirable, with evacuation and home basements being
the next least and least desirable alternatives respec-
tively.
Since 2.1 percent view evacuation as the alternative, and
62.9 percent find that evacuation is at least an alternative, evacua-
tion groups, which are defined with respect to the response patterns
to item on directed and spontaneous evacuation, become the focus of
this report. The remaining chapters of this report are organized
around response patterns to items on directed and spontaneous evacua-
tion and the extent of actual risk (TR-82) for the area of residence.
2
4r X___

Table 1. 1.
Pattern of Desirability among Alternatives
Where '+' Denotes Positive Desirabilityand '-' Denotes Neutral or Negative Desirability
Public Home RelativeFallout Basement Blast FrequencyShelters Sharing EvacuatioT Shelters (%)
+ + + + 41.4
+ - + + 8.8
+ + - + 7.6
.... 5.4
+ - - - 4.6
+ - - + 4.4
+ + + - 4.1
+ + - - 3.7
+ - + - 3.5
- - + - 2.1
- + + + 1.7
- - - + 1.1
- - + + .8
+ - - .7
- + - + .6
+ + - .5
TOTAL VALID CASES* 1475
*The remaining cases did not respond to at least one question
with respect to desirability.
3t
-.2-- --- -____________ ________-

2. SOME RELEVANT RELOCATION GROUPS
Distinct from the issues of feasibility, cost effectiveness,
credibility and acceptance, the issues related to spontaneous and
directed evacuation are of primary importance to crisis relocation
planning (CRP). Of particular importance are the attitudes of the
populace toward an evacuation directed by the president or some other
figure of authority, which may also be referred to as relocation.
However, these attitudes are only relevant when placed in the context
of risk and spontaneous evacuation attitudes. The risk areas result-
ing from industrial based targeting (TR-82) are used as the basis of
risk in this report. A respondent is considered at risk if that in-
dividual's residence is in an area that is at least partially exposed
to risk according to TR-82; otherwise she/he is considered not at risk.
The relocation response must then be considered in light of
the respondent's relative location with respect to three considerations:
1. Is the respondent's place of residence located in a
risk area?
2. How likely is the respondent to spontaneously evacuate?
Or put another way, is the respondent likely to be in or
near that residence at the time of impact (t 0) in the
absence of presidential action calling for relocation?
3. If the respondent is likely to spontaneously evacuate,
what is the nature of that evacuation; is it adaptive
or maladaptive?
It is clear that these considerations are ordered ones. That
is, spontaneous evacuation is dependent on the risk consideration,
and adaptiveness is dependent on both the risk and the spontaneous
evacuation considerations. This yields the partitioning presented
in Figure 2.1.
It is clear from Figure 2.1 that 45.6 percent of the respondents
at risk said they would probably or definitely not evacuate spontaneously.
This group of respondents represent 35.3 percent of the entire sample.
This group which we shall term 'potential relocatables,' will be the
focus of chapter 3. This group of individuals are the primary bene-
factors of presidentially directed relocation in the event of a nuclear
attack.
4

Spontaneous evacuation, among those at risk comprises 42.6
percent of the sample. Of those respondents at risk 35.9 percent
said they would evacuate to a location deemed 'safer', while 18.5
percent responded in a manner suggesting maladaptive spontaneous
evacuation. Adaptive spontaneous evacuation for those respondents
at risk includes responses such as 'foreign country', ' cottage or
summer home', 'campgrounds or countryside', and due to the assumed
stress reduction effect, 'relatives or friend's homes', or 'hometown'.
Maladaptive responses include spontaneous evacuation to other cities
at risk, military bases, and shelter. Those respondents that re-
sponded 'don't know where to go' or 'refused to answer', were not
classified as either adaptive or maladaptive. Adaptive and maladap-
tive spontaneous evacuation among those risk comprise 28.1 and 14.5
percent of the sample respectively.
Respondents that are likely to spontaneously evacuate risk
(TR-82) areas (regardless of the adaptiveness) must be examined in
light of distance traveled in this evacuation and the reasons for
choosing this destination. For those respondents at risk and likely
to spontaneously evacuate in a maladaptive way, the response to presi-
dentially directed evacuation becomes important since these respondents
will be asked to reevaluate their location at a time just before the attack
(t0). Even though 14.5 percent of the sample fit into this category,
we expect large portions of this category (perhaps as large as 80
percent, since 79.5 percent said they would follow instructions as
to where to go in the event of a directed evacuation) to readjust
their destinations to adaptive evacuation postures. This suggests
that the primary reason for this group's apparent size is misin-
formation;* which relevant information about the evacuation in the
event of a nuclear attack would alleviate.
Since 32.3 percent of the entire sample are likely to take
adaptive action in the event of a period of increased tension, and
only 22.7 percent are expected to take maladaptive action under the
same circumstances, we conclude that action is more likely to result
in adaptive behavior than maladaptive behavior. However, since 44.4
*It seems undeniably clear that public information about re-
location planning itself would drastically reduce the number of mala-
daptive responses, probably to a negligable level.5
- - m
percent of our sample are not likely to take any action spontaneously,
insights as to the adaptiveness of that inaction can only be examined
in the liget of responses to directed evacuation. Table 2.1 presents
the relative distribution among response sets to an increased period
of world tension.
Thus there are three groups of people that are likely to be in
risk areas at t 0* First, the residents of those risk areas that are
not likely to evacuate (cf. Chapter 3). Second, residents of risk
areas that evacuate maladaptively (cf. Chapter 4). And third, resi-
dents of non-risk areas that are likely to evacuate to risk areas
in the pre-directive period. The last group of individuals cannot
be larger than approximately 22 persons in all, and we can only
positively identify 5 cases that fit into this category. Thus we
shall ignore this group of individuals for the purposes of this
report.
6

Figure 2.1 Groups of Affected Individuals for PresidentiallyDirected Evacuation.
No Spontaneous
Evacuation*
(45.6%)
TR-82 Risk Maladaptive**
(78.4%) < " (18.5%)
~SpontaneousEvacuation*
(54.4%Z) \ Adaptive**
(35.9%)
No Spontaneous
Evacuation*
(42.0%)
No TR-82 Risk Maladaptive***
(21.6%) (38.0%)
< Spontaneous
Evacuation*
<Adaptive***
(20.0%)
Spontaneous evacuation is defined as likely to take place if theprobability of evacuation is 50-50 or better; otherwise it isdefined as not likely.
** Adaptive spontaneous evacuation, for those respondents at risk,is defined as evacuation to 'safer' areas; maladaptive responseincludes evacuation to equal or higher risk areas.
*** Adaptive spontaneous evacuation, for those respondents not atrisk, is defined as 'evacuation to a shelter;' all other responsesare considered maladaptive.
7A~

Table 2.1. Relative Distribution Among Spontaneous EvacuationResponse Sets in Light of a Period of Increased World Tensions.
Relative FrequencyCategory (%)
Adaptive Responses:
Spontaneously evacuate 'risk' areasin favor of 'low' risk areas 28.1
Spontaneously 'evacuate' relatively'low risk areas in favor of shelter 4.2
Total Adaptive Responses 32.3
Maladaptive Responses:
Spontaneously evacuate ' risk' areasin favor of other risk areas 14.5
Spontaneously evacuate relatively 'low'risk areas in favor of other 'low'riskareas or 'high'risk areas 8.2
Total Maladaptive Responses 22.7
Inactive Responses:
At risk 35.3
Not at risk 9.1
Total Inactive Responses 44.4
Other active responses (NEC) * .6 .6
Total 100.0 100.0
*A small proportion of cases are not clearly identifiable into ':he above
groups due to missing data. We are able to identify them insofar as
their likelihood of activity, but no further. Thus we refer to them
as Not Elsewhere Classified.
8
qw.A

3. POTENTIAL RELOCATABLES
The largest group of individuals (35.3%), and the principal
target group for directed relocation are those people that are likely
to 'stay' in risk areas (TR-82) in the pre-direction period. They
are the principal target group in essentially three ways:
1. They are the largest single group of people to be
affected.
2. They are likely to remain in risk areas, and thus need
further direction or information.
3. They will probably choose an inactive alternative,
which implies that they must be persuaded to an
active alternative in order to adaptively evacuate.
Who are these people? How likely are they to relocate under
presidential direction? And how do they differ from their neighbors?
3.1 Some Selected Characteristics of Potential Relocatables
In response to the first question, let us elaborate some of
the principal characteristics:* While 15.9 percent of the whole sample reside in large
northeastern cities of the United States, 23.2 percent
of the potential relocatables reside in northeastern
cities of 100,000 persons and over. On the other hand,
10.7 percent of the entire sample have residences in
large western metropolitan areas, while 15.0 percent
of those likely to stay in risk areas in the pre-
directive period reside in these cities.
* Among the potential relocatables the older married
group, which includes those respondents that are 45
to 64 years of age, married and have no children present
in the household, consists of 15.2 percent of the group,
while it the complete sample only 11.9 percent are in
this category.* Like the overall sample the majority of potential re-
locatables are fully employed (68.7 percent among potential
relocatables and 69.6 percent of the entire sample).
9

* Potential relocatables are more frequently females than
they are males (59.6 percent), although this is also true
of all respondents in the entire sample (i.e., 55.8 per-
cent of the sample are female).
* Like the overall sample we expect about 60 percent of
the potential relocatables to follow instructions as to
where to go.
* While the age distributions are very similar (both among
the potential relocatables and the entire sample), the
distribution is somewhat skewed toward the older cate-
gories among the potential relocatables.
Total PotentialCategory Sample Relocatables
18 to 29 years of age 30.6% 24.8%
30 to 44 years of age 28.9% 28.5%
45 to 64 years of age 26.1% 29.7%
65 years of age or over 13.4% 15.6%
Refused to answer 1.0% 1.4%
For those at risk that are likely to stay in the pre-
direction period (termed potential relocatables), 40.0
percent of those that responded suggested ideological
reasons for non-compliance with a directed evacuation.
Only 36.3 percent of the entire sample suggested such
reasons.
3.2 Some Impacts on the Likelihood of Directed Evacuation
As opposed to the entire sample, which has a likelihood
index of .717 for directed evacuation, this group of potential
relocatables in the pre-direction period have a much lower likeli-
hood index (.570). This makes it evident that it is precisely those
individuals that are most in need of relocation that are the least
likely to relocate under presidential direction.
3.2.1 Geographic Location
With respect to geographic location, three categories of
respondents are substantially below average with respect to directed
-evacuation likelihood (cf. Table 3.1 for complete breakdown). Those
included are:
10
L~ j lO
1. The respondents residing in the large (one million
and over) metropolitan areas of the north central
region of the United States which have a likelihood
of .456.
2. Rural, but none-the-less risk areas, of the north
central region have a directed evacuation likelihood
of .446.
3. Rural, areas of the western region are the least
likely to evacuate under presidential direction with
an index score of .417.
Several categories are substantially above the average with
respect to directed evacuation likelihood index. They include:
1. Large metropolitan areas of the northeastern United
States with an index of .644.
2. Rural areas of the northeastern region (.750) and
the southern region of the United States (.636).
With two expections, the respondents' estimate of the com-
munity response under the presidential evacuation situation is uni-
versally higher than the likelihood index of their own relocation.
These exceptions both occur with respect to the categories that are
above average with respect to likelihood of directed evacuation.
Furthermore, both occur with respect to the northeastern and southern
rural areas. Thus for the most part we find that regardless of the
respondent's own likelib'-od of evacuation under the presidential
directive conditions, the respondent sees himself or herself less
likely to evacuate than his or her neighbors.
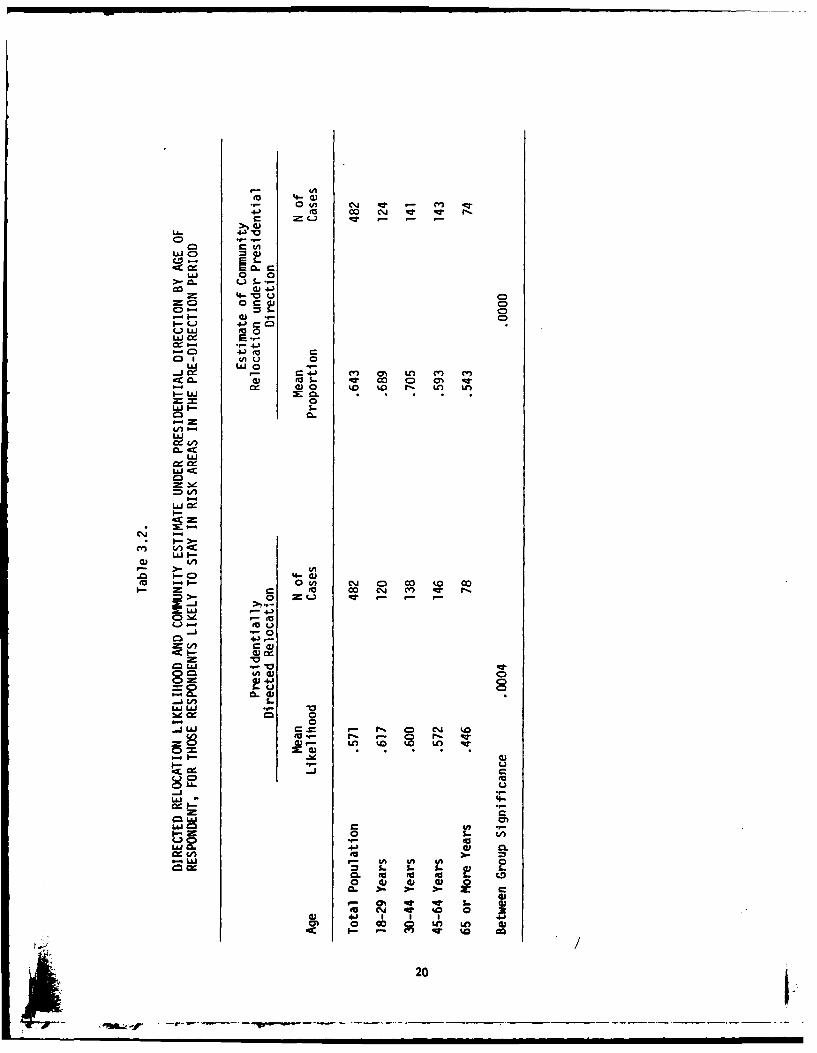
3.2.2 Respondent's Age
The likelihood of evacuation under the directed conditions
varies inversely with the respondent's age. For those over 64 years
of age the evacuation likelihood index is at a minimum of .446, while
the maximum occurs with respect to the respondents aged 18 to 29 years
(cf. the complete breakdown by age is presented in Table 3.2).
The community estimate for all age categories is up an average
of .071 points. Thus it is clear that as the propensity of evacuation
varies with respect to age the respondent expects his or her neighbors
to be more prone to evacuate than themselves.

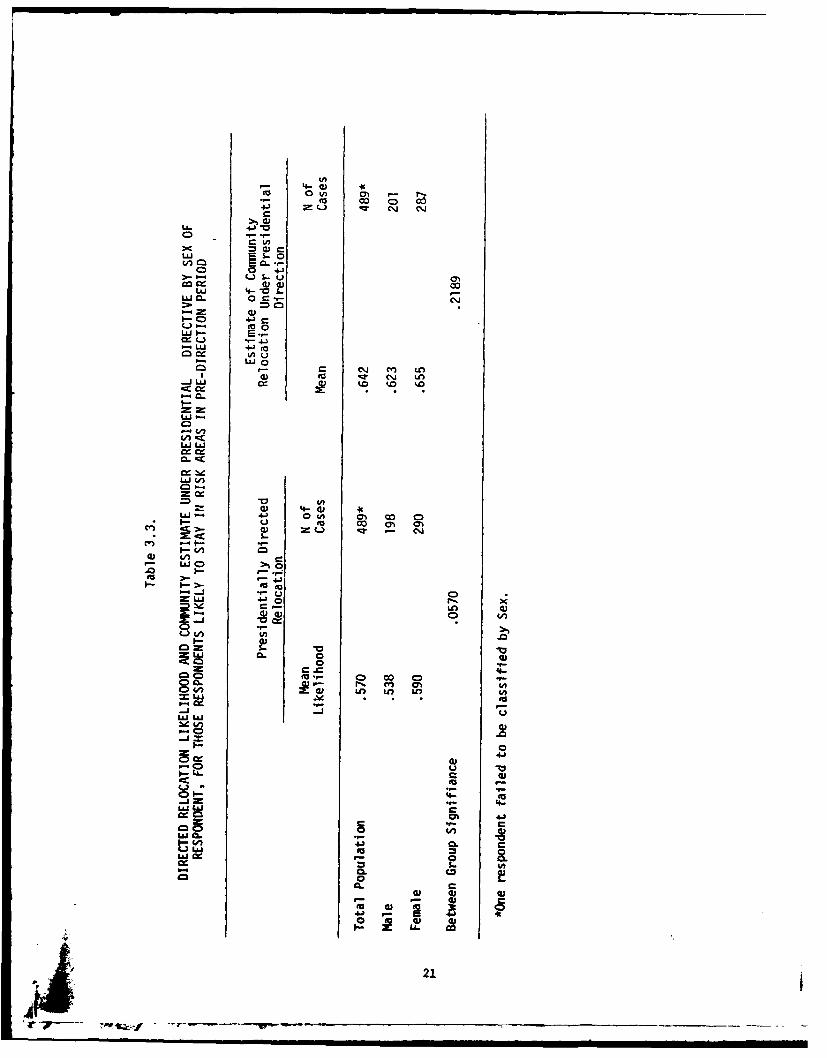
3.2.3 Sex of Respondent
Potential relocatables are characterized by females that are
more likely to evacuate given a presidential directive (.590) , while
the males are more apt to remain inactive with an evacuation likeli-
hood of .538. The estimates of the community evacuation proportion
are again indicative of an increased probability for other community
members from the respondent's perspective. Table 3.3 presents this
distribution.
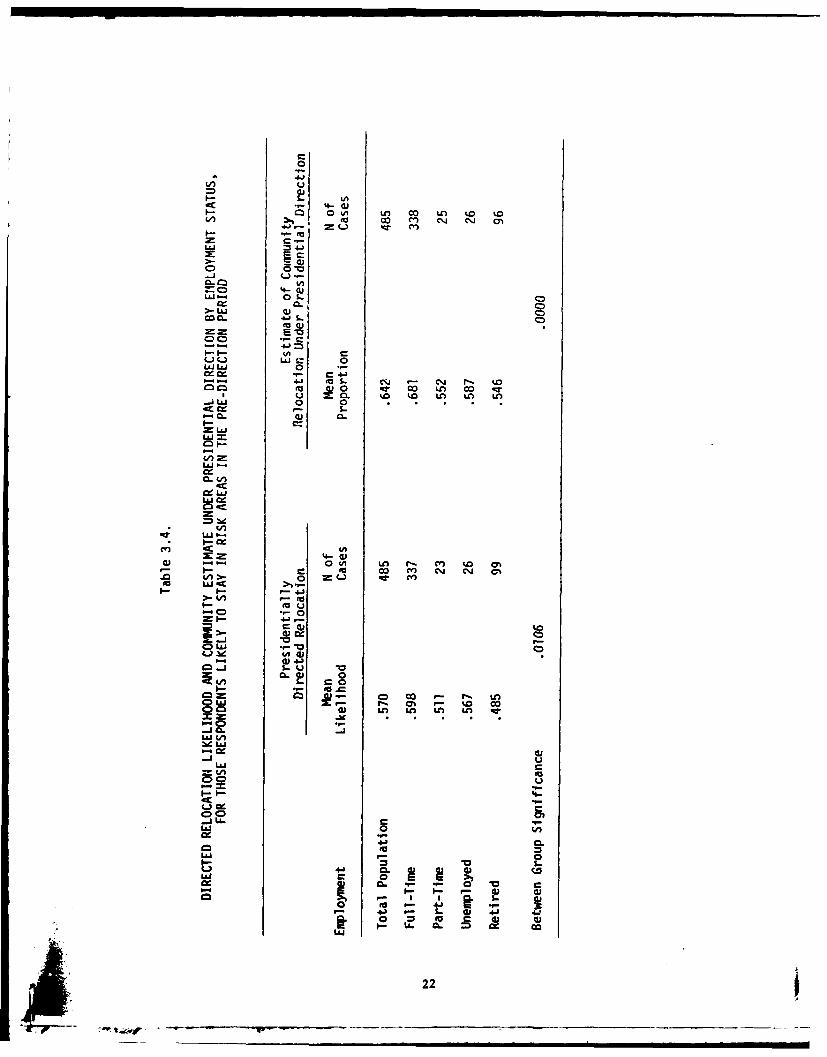
3.2.4 Employment Status
Two categories of people with respect to employment status are
of particular interest. First it is most apparent from Table 3.4
that respondents employed full time are the most likely to evacuate
under the circumstances of presidential direction. While this group
makes up 69.5% of the respondents in the risk areas that are not
likely to evacuate spontaneously, it also represents a large propor-
tion of the labor force.
Retired individuals on the other hand are among the least
likely to evacuate under these conditions (.485). This we suspect
may be related to the perceived value these people place on their
own life. In other words, this may be related to their perception
of their societal worth. Retired people may well be those individuals
who perceive their contribution to society as limited, while those
that are fully employed find their contribution to society more
valuable. This is a somewhat altruistic viewpoint that is eminently
related to the protestant work ethic.
Furthermore, all groups of respondents with respect to
employment status estimate their neighbor's evacuation index at
higher rates than themselves. The community estimate is, on the
average, .072 points higher than the likelihood index for the
respondents.
3.2.5 Number of Older Household Members
It is very clear that the more household members that are
65 years of age or more, the less probable the respondent is to
evacuate under presidential direction. Respondents residing in
12

households with no persons 65 years of age or more are above average
with respect to evacuation likelihood (.606), while those with two
members of the household aged 65 or more are considerably less likely
to evacuate (.410).
This trend is not only apparent for the estimates of the
community likelihood, but are universally higher than the individual
estimates.
3.2.6 Disaster Expirience
Relocation likelihood for potential relocatables is decreased
among those respondents that have had at least one experience with
a disaster. Respondents that have never been exposed to a disaster
are more likely to evacuate under presidential direction (.598),
than disaster exposed individuals (.545). Disaster exposure signifi-
cantly alters an individual's attitudes toward the need for evacuation.
This 'hardening' comes about due to either the fatalistic nature of
disasters (i.e., not being able to modify the outcome of a disaster),
or a realization that no method of dealing with disaster is a panacea,
or a combination of the two. While the community estimates are not
empirically different for those exposed to disaster, the pattern is
the same as the pattern of relocation propensity. Table 3.7 presents
presidentially directed relocation propensities and community estimates
by disaster experience.
3.2.7 Life Stage
Life stage deals with the progression of an individual
through various phases of life. It is not meant to imply that all
individuals progress through all life stages, but rather a classifi-
cation of individuals with respect to several dimensions simultaneously.
This classification should result in sets of more or less homogeneous
groups of people with respect to their progression through life. In
many cases individuals in life stage categories will share many common
values and beliefs. It is for this latter reason that life stage is
used in the discussion of relocation propensities.
The most important aspect of life stage is the age component.
It is this component that determines the basic 'cohort' of the individual.
Secondly, the individual's marital status is of importance since marriage
13
and the disolution of a marriage are primary 'life events' that
usually change an individual's outlook on life in general. Third,
it is important to consider the component of being a parent, since
the additional 'responsibility' that being a parent-involves alters,
in a basic way, the approach to one's life. Finally, tht- relation-
ship of an individual to be in the labor force primarily alters
one's 'function' and thus is of primary concern to life stage.
Given these aspects of life stage we have constructed an
indicator of life stage from the available indicators of age,
marital status, parental status, and employment status. Two cate-
gories of individuals were allowed to 'override' other distinctions.
First, retired individuals have altered their way of life over those
not retired. Thus, if an individual is classified as retired, he
or she is in the stage of life characterized as retirement. This is
not to argue that retired persons cannot have children or be married,
or for that matter be of a relatively young age; it is only to say
that retired people have the common relation to the means of produc-
tion (i.e., none). Secondly, widowed persons share the life event
of losing a spouse (without replacement). This being a very disturb-
ing life event, warrants a life stage all of its own.
The remaining groups of life stage are mutually exclusive
and exhaustive. They were designed in such a way as to encompass the
entire range of possibilities. However, several of these categories
(due to their size) were grouped together to create an 'other' cate-
gory. Thus, we are left with the categories presented in Table 3.8.
Life stage is related to likelihood of evacuation under the
presidential directive situation in several ways. It appears that
the higher one's self-esteem the more apt they are to evacuate under
these conditions. Married parents are more prone to evacuate than
non-married parents. Young single adults (.677) are the most likely
to evacuate, while retired individuals are least likely to evacuate
under the conditions of a presidentially directed evacuation. Among
those least likely to evacuate under these conditions are widowed
individuals (.479), middle aged single adults (.475), and retired
persons (.463). Table 3.8 presents the entire breakdown.
h 14PIP-_

Once again we find that the community estimate is universally
higher than the individual likelihood of relocation. Thus it is clear
that the use of the individual propensity is a conservative estimate
of the magnitude of the actVal relocation probability for the entire
populace.
3.3 Some Characteristics of Directed Relocation for 'Potential Re-locatables'
Given that there are a variety of individual factors that
play a role in the likelihood of relocation given the president would
urge an evacuation, it is interesting to explore the nature of the
multivariate response patterns. When only background characteristics
are considered, two variables effect the individual's propensity to
relocate given a presidential directive. The most important back-
giound factor is the number of household members 65 years of age or
more. The individual's propensity to relocate under these conditions
decreases 9.3 percent for each additional senior resident in the
household.
The other significant impact on directed relocation likeli-
hood is a binary variable representing the north central region of
the United States.* Potential relocatables residing in the north
central region are 7.7 percent less likely to relocate than those
people residing in the northeastern region of the United States.
This may well reflect the 'over-identification' of targets in the
northeast by the media and subsequently in the minds of the populous.
Jointly these background characteristics account for only 5.3 per-
cent of the variance, which indicates that demographically the
attitudes toward directed relocation are relatively homogeneous
(cf. Table 3.9, column 1 for details).
Regardless of demographic background we find it important
to consider the effect of warning, survivability, and threat, not
only international ambience, but perception of area risk as well.
When all these substantive areas are taken into consideration, only
survivability estimates have a significant impact on directed reloca-
tion likelihoods. Specifically, the chance of survival if the area
*Regions of the United States are referred to as they are
defined by the Bureau of the Census.
15

is evacuated (from the respondent's perspective) is directly related
to the respondent's propensity toward directed relocation. As the
survival chances range from zero to one, and the directed relocation
likelihood has the same range, an individual that estimates surviva-
bility under evacuation conditions as .8 is 4.6 percent more likely
to relocate than an individual that perceives the survivability under
evacuated circumstances as .7 when area survival chances in general
are taken into account.
On the other hand the perception of the area Qhances of survival
in general tend to decrease the propensity toward directed relocation.
Under these same conditions an individual with the perception that
area survivability is very good is 12.1 percent less likely to re-
locate under presidential direction than an individual that believes
the area survival chances are very bad, when survivability for evacuated
conditions is taken into account. Jointly these two variables account
for 14.2 percent of the variance in the propensity to relocate under
presidential directive (cf. Table 3.9, column 2 for further details).
For this particular sub-population of 'potential relocatables'
general survivability is directly associated with survival expectation
if in fallout shelters. Specifically, an individual that finds sur-
vival chances. 'very good' in fallout shelters is 46.2 percent more
confident of survival in general than the individual that perceives
survival in fallout shelters as 'very bad'. Survivability in fallout
shelters 'explains' just over 20 percent of the variance in general
survival chances. Essentially this means that to the extent that the
populace has confidence in fallout shelters they are less likely to
evacuate even under presidential direction (cf. Table 3.9, column 4
for details).
The best predictors of relocation propensities, when all
variables, social demographic and substantive are considered, are
evacuation survival chances, number of household members 65 years of
age or older, and size of household, in that order. Again evacuation
survival has a strong direct effect (.435), while the number of house-
hold members maintains a weaker yet significant indirect effect (-.603).
Household size is directly related to the likelihood of relocation
under a presidential directive. For each additional household member
16
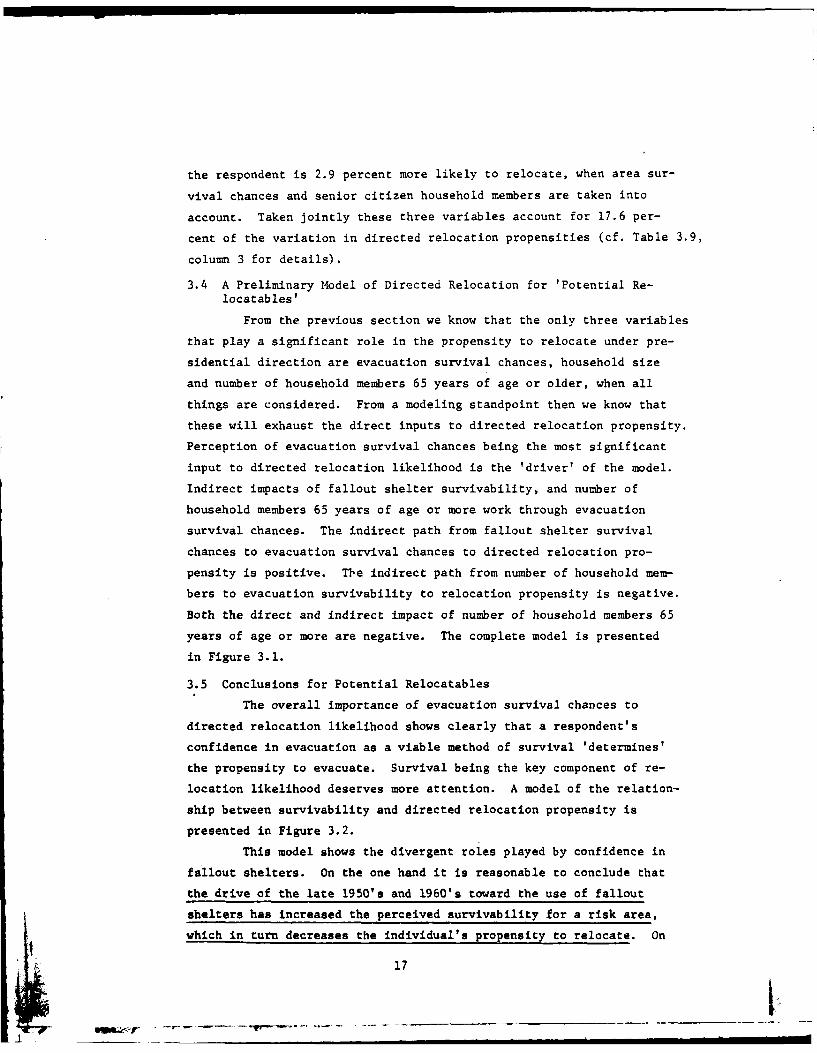
the respondent is 2.9 percent more likely to relocate, when area sur-
vival chances and senior citizen household members are taken into
account. Taken jointly these three variables account for 17.6 per-
cent of the variation in directed relocation propensities (cf. Table 3.9,
column 3 for details).
3.4 A Preliminary Model of Directed Relocation for 'Potential Re-locatables'
From the previous section we know that the only three variables
that play a significant role in the propensity to relocate under pre-
sidential direction are evacuation survival chances, household size
and number of household members 65 years of age or older, when all
things are considered. From a modeling standpoint then we know that
these will exhaust the direct inputs to directed relocation propensity.
Perception of evacuation survival chances being the most significant
input to directed relocation likelihood is the 'driver' of the model.
Indirect impacts of fallout shelter survivability, and number of
household members 65 years of age or more work through evacuation
survival chances. The indirect path from fallout shelter survival
chances to evacuation survival chances to directed relocation pro-
pensity is positive. The indirect path from number of household mem-
bers to evacuation survivability to relocation propensity is negative.
Both the direct and indirect impact of number of household members 65
years of age or more are negative. The complete model is presented
in Figure 3.1.
3.5 Conclusions for Potential Relocatables
The overall importance of evacuation survival chances to
directed relocation likelihood shows clearly that a respondent's
confidence in evacuation as a viable method of survival 'determines'
the propensity to evacuate. Survival being the key component of re-
location likelihood deserves more attention. A model of the relation-
ship between survivability and directed relocation propensity is
presented in Figure 3.2.
This model shows the divergent roles played by confidence in
fallout shelters. On the one hand it is reasonable to conclude that
the drive of the late 1950's and 1960's toward the use of fallout
shelters has increased the perceived survivability for a risk area,
which in turn decreases the individual's propensity to relocate. On
e. 17

the other hand the use of fallout shelters will, even given a success-
ful evacuation, play a role in the protection of an individual in the
post attack period. Whether or not this is realized by the respondent
is of little consequence, but the positive indirect path from fallout
shelter survival chances to relocation propensity, indicated the com-
patibility of these programs. Finally, it should be noted that the
indirect impact through evacuation survivability is nearly three
times the magnitude of the negative impact through general survival
chances.

cc. 01J CJ In en In -T 6n CO V I
Go
'It!
a:
aen31,
0.l
AA o
r-a 41 a-0 0' Z 'a
B 0
0we 01 1164
* --4.
'419
U - EIV
*.- Cu eJ
4- '0 U
0 C
(U 0 0
0 4-in 4-0
ZO 0LL 0
4) o 0D t L f
CLLJ EU0
LJ
LUJ
IUL CC~0
00
too
00
4c 1-0
.0 10 Q -0)
0) LU -4 .
0m
_j J C)-l %
u 0T
0 $-
UEU
0 20
' 4-W 0
CDC
LJ
Q S-u(
W cLLJO a.* 0 .-
-m 0J
LLJ +JEa U
JoI a ~ m em LOl
LLJ.cm-EV7
LL&J V
LU. 4.) wu ON. co 0C4 u to 0 0'. 0'.
a) m) - C-4
.0 1-
LL -J 0
4-
Cr- a
0
80~4 cUu
4E Xvci
U.) L21
4- a)I- (A Oi Ln co in %D .0
Ln to 00 en C14 C. ON
Lli
CLL SI
4J.- go S. Q " 4
CLC
- L.
I
0I-
Lnn
4- aJG, ~ V) in r-. m %D 0I
Mu LLI<941
tnj
s- WCR-Eu.
0zJ (A ~ 9-
a,
-U, Eu
LLI V)
419
U. 4..0
Ih1 a) 41i ~ a
22
CDC
00 LU
oa-.
Wi u j Uv- Z )
000
ccI- %. n N -' 0
a-
0UcrILj
0= U 4-
LJJ w 0 co r 0n
LU
I-
IA (
mu-o
- C=UJ CD m 0=' *,- N N N cm W
01a -Wi naj q L9 '
- )Jd
*cm
0go
E~ 0 tor- N N NC
zu~a +4.) 1 4
(D"r Ln
LSJIJ23

(A~ cli f ) C
n m P C C%Ji
L6
0 (0
LUj
I-, (UC)
S. CDvCDa. *1
4)
flZLLI
4n-u 0"1
LU = .
'U S I- x CL
LU
LUJ
V)L 43p.4
C.D M
0 LL- e. 4-
u CDwcacm wl 0
'UU-J to
LAJ4..
o 4
24 L

LU 0
cr- 4- 4
LUJ L.- 0 0% m' .4.L to (.o CV)
LiU
i
ca 41
LUJ
1- - 41 cJ LO 0D041 to S. * Ln m)
iv ao 0 o %0 o %0cc 0
LU
LUJc-9%L
a, (A- ) %V-
LUJ (A m) .. %
(n u
LALA4-
- Vn
.,a 00D c Ln
-LJ
Lai-J 4
41A
9- V; w I
1 41
ga UaV
L25

6.1
a m C0
w~
~~CIA
0 - 41 N C~~ '~o mC ~ Il ~ U
U~ CUAn 0
09 110
~ -26

Table 3.9.
Unstandardized Regression Coefficients for SignificantFactors in Directed Relocation Propensities, for Individuals
Likely to Stay in Risk Areas in Pre-directive Period
Directed RelocationLikelihood
BothDemographic Substantive Demographic and General
Independent Variables Variables Substantive Vari- SurvivalVariables ONLY* ONLY** ables Considered Chances
Residence inNorth CentralRegion *** - .077 NC NS NC
Number ofHousehold Mem-bers 65 yearsof Age or More - .093 NC - .060 NC
Household Size NS NC .029 NC
Survival Chances:Evacuation NC .458 .435 NS
General NC -.121 NS NC
With FalloutShelters NC NS NS .462
Constant .604 .369 .282 .059
R squared .053 .142 .176 .227
*Demographic variables considered include: Age, Age, offered temporary housingto others, sex, employment status, size of household, number of senior citizensin household, marital status, size of city, and region of residence.
*Substantive variables considered include: Survivability under conditions ofevacuation and fallout shelters and general survivability of area, internationalambient threat, area risk, and warning.
**Northeast region taken as base category.
NS - Not Significant
NC - Not Considered
A 27

Relocation" .907 ,
Propensity y, (
.435 .029
- 060Evacuation Householdsurvival sizechances \.ier
945 -. 031/ .923
* -. 792
survival Number of householdchances members 65 years
of age or more
.605
* Exogenous Input
Figure 3.1 A Preliminary Model of Directed Relocation Attitudes forthose Individuals Likely to Remain in Risk Areas in thePre-directive Period.
28
r _ _ _ _ _ __ _ -

TV5
Relocation .926Propensity
.458 -. 121
Evacuation GeneralSurvival SurvivalChances -4 Chances
.94 .462
\.28387
Fallout ShelterSurvivalChances
Figure 3.2 A Preliminary Model of the Relationship betweenSurvivability and Directed Relocation Propensityfor Individuals not likely to Spontaneously EvacuateTR-82 Risk Areas.
29

4. MALAflAPTIVE RISK AREA EVACUEES
Nearly 60 percent of the entire sample suggested that they
are likely to evacuate their residence in a period of increased world
tension (i.e., 59.9 percent of the respondents assigned a likelihood
of 50-50 or better to evacuation in this period). However, this in-
cludes those respondents that reside in non-risk areas, and those
that responded that they would "evacuate to shelter."
Since relatively few respondents are positively identifiable
as evacuating relatively safe areas for TR-82 risk areas, we are
primarily concerned with examining those individuals that reside
in areas with relatively high risk, that are likely to evacuate
but evacuate in a maladaptive way (i.e., evacuate to an equal or
highier risk area). Of the 1270 respondents that reside in risk
areas, 65.2 percent are prone to spontaneously evacuate.
over 200 of these respondents that are likely to evacuate
risk areas in a period of increased world tension, did not indicate
what their destination might be. However, among those that did in-
dicate the nature of their destination (603 respondents) approximately
two out of every three suggest (at least in one sense) adaptive destina-
tions. Approximately 19 percent of these adaptive responses indicate
that they will travel 50 miles or less in this spontaneous evacuation
(cf. Table 4.1).
It seems reasonable that, given prevailing winds and other
conditions on which the TR-82 risk area delineations are based, a
certain minimum distance traveled in any evacuation would have to be
upheld in order for that evacuation to be considered truly adaptive.
We have, rather arbitrarily, set this minimum at 50 miles. Thus we
find that 45.4 percent of those that are classifiable are likely to
evacuate risk areas in a truly naladaptive way.
Maladaptive spontaneous evacuation from risk areas is then
redefined to include individuals that are at risk and likely to evacuate
spontaneously and either evacuate to, a location with an equal or higher
(TR-82) risk, or travel less t~han 50 miles in this evacuation. We shall
refer to this group as simply maL~daptive risk area evacuees. Table 4.2
presents the respondent's reason for choosing the destination of the
spontaneous evacuation, in comparison with other relevant groups.
30

4.1 Some Characteristics of Maladaptive Risk Area Evacuees
Examination of this group of respondents makes it clear that
the emphasis on public fallout shelters of recent decades has pos-
sibly led to a conceptual confusion between "evacuation" and "going
to shelter." While 32.9 percent of those respondents that are likely
to spontaneously evacuate suggest an 'evacuate to shelter' response
pattern, among the maladaptive risk area evacuees this trend is
accentuated (i.e., 64.1 percent make the 'evacuate to shelter' response
pattern). We suspect that this marked increase is the affect of a
recognition of the relative 'risk' of remaining in a comparatively
'unsafe' area. However, when this recognition is coupled with a
'need' to 'take some action' and the emphasis on shelters as the
method of dealing with nuclear attack results in an increased response
pattern of the 'evacuate to shelter' type.
Like the entire sample, over 60 percent of the maladaptive
risk area evacuees believe the named destination to be 'safer'. This
makes reasonably clear that lack of information is the primary reason
that these individuals are likely to evacuate maladaptively. Further-
more, if during periods of increased world tensions information is made
avaiable to the populace as to the nature of risk and risk areas, the
extent of maladaptive spontaneous evacuation from risk areas would be
reduced substantially.
Maladaptive risk area evacuees are in a variety of ways very
similar to the respondents of the entire sample. The distribution
of individuals among the categories of background characteristics are
not significantly different among those respondents classified as
maladaptive risk area evacuees, when compared to the overall sample.
Demographic variables examined include: occupation of main wage
earner, self-assessed social class, respondent's education, family
income, number of household members 65 years of age or older, respon-
dent's ae, employment status of main wage earner, respondent's marital
status, sex, and race.
4.2 Relocation Propensities for Maladaptive Risk Area Evacuees
The seemingly isomorphic relationship between the sample as
a whole and the maladaptive risk area evacuees along demographic and
31

background characteristics, seems to suggest that relocation pro-
pensities for the entire sample will be 'mirrored' by the maladaptive
risk area evacuees. However, this is not the case as the overall
relocation propensity for maladaptive risk area evacuees is signi-
ficantly higher (.818) than the relocation likelihood for the com-
plete sample (.717). This apparent shift is primarily a function
of the definition of a maladaptive risk area evacuee, rather than
a substantively interesting trend.
We assume that if the respondent finds value in the idea of
evacuation (in terms of survivability), that this attitude will have
a positive impact on both spontaneous evacuation and presidentially
directed relocation. Thus by selecting respondents that are likely
to spontaneously evacuate, we 'automatically' increase the relocation
propensity.
4.2.1 Service in the Armed Forces
The data indicate that if the respondent or the respondent's
spouse has served in the armed forces, they are less likely to re-
locate than those with no such experience. Table 4.3 presents the
relocation propensity and the estimate of community evacuation in
the presidentially directed situation by armed forces experience.
Armed forces experience seems to 'harden' an individual toward non-
compliance. We suspect that having experienced the armed forces,
individuals are either prone toward the belief that nuclear war
cannot happen, or that the destruction of such a war would be so
complete as to make surviving either impossible or undesirable.
4.3 Some Background Characteristics and Relocation Propensities for
!4aladaptive Risk Area Evacuees
Respondents that are residing in large north central cities
of the United States are less likely to evacuate under directed cir-
cumstances than large city dwellers in the northeastern region, when
background characteristics are taken into consideration. Having
served in the armed forces is also related to relocation propensities
in a negative manner. While residing in large north central cities
decreases the likelihood of evacuation under direction from the
president by 10.6 percent, having served in the armed services de-
creases the likelihood of compliance by 55.2 percent, when both are
considered siultaneously (cf. Table 4.4, column 1).
32

4.4 A Preliminary Model of Relocation Propensities for M!aladaptiveRisk Area Evacuees
On the other hand when only substantive inputs are considered
(i.e., ignoring differences of background), relocation is directly
dependent (in a positive way) on spontaneous evacuation likelihoods
and survival chances (as estimated by the respondent) under evacuated
conditions, but simultaneously negatively related to a response of
'nowhere to go' to the question of why some people would not evacuate
under any circumstances. While being prone to evacuate spontaneously
increases the compliance rate by 22 percent, and directed relocation
likelihoods are 16.2 percent more likely for those that view survival
chances as ' very good' than those that responded that the survival
chances are 'very bad' if evacuated, those respondents that suggested
'no place to go' as a reason for noncompliance are 12.7 percent less
likely to evacuate under presidential directive (cf. Table 4.4, column 2).
When both demographic and substantive variables are taken into
consideration, we find that the best three predictors of relocation
propensities for maladaptive risk evacuees are: the respondent's
spontaneous evacuation likelihood, evacuation survival chances and
residence in the north central region of the country and in large
metropolitan areas. Empirically we find that an increase of 10 per-
cent in spontaneous evacuation likelihood increases the likelihood
of relocation under presidential directive by 2.3 percent. In a
similar sense the chances of survival assigned to evacuation by the
respondent is positively related to relocation propensity. Specifically
a respondent that believes his/her chances of survival are 'very bad'
if the area is evacuated is 17.8 percent less likely to relocate under
presidential direction than the individual that responds that his/her
survival chances are 'very good.' Finally respondents residing in
large metropolitan areas in the north central region are 10.6 percent
less likely to relocate than individuals residing in large northeastern
cities (cf. Table 4.4, column 3).
Since only service in the armed forces and residing in large
cities in the north central region of the United States are important
factors in the likelihood of relocation under presidential direction,
it seems reasonable to ignore such inputs to relocation propensity.
33

In other words, given only these two empirical inputs with respect
to demographic variables, examination of a model of relocation pro-
pensity regardless of background is reasonable. Such background
characteristics would be exogenous to any substantive inputs in any
event.
While the direct impacts on relocation propensity are pre-
cisely as reported in Table 4.4 (column 2), only the indirect effect
need be further examined (cf. Figure 4.1). Since survival chances
maintain positive impacts on both spontaneous evacuation and reloca-
tion likelihoods and the relationship between spontaneous and directed
evacuation is a positive one, it is clear that those individuals that
'believe' in evacuation as an appropriate way of mitigating the effect
of nuclear attacks, are more likely to evacuate both on their own and
in response to a presidential directive.
On the other hand, those respondents that suggest that some
people may not evacuate under any circumstances since they have 'no-
where to go', affects both spontaneous and directed evacuation in a
negative way. Thus once again due to the positive relationship be-
tween spontaneous and directed evacuation, suggesting 'nowhere to go'
as a reason f or not evacuating affects relocation propensities in a
negative manner both directly and indirectly.
Survival chances under evacuated conditions are directly
affected by sur-vival chances for both fallout and blast shelters.
Specifically, if survival chances are seen as 'very good' given the
use of fallout shelters, the respondent is 25.1 percent more con-
fident in terms of evacuation survival chances than if the chances
of survival in fallout shelters is considered 'very bad'. Survival
chances in blast shelters is viewed in a similar way, with evacuation
survivability being increased 18.7 percent for individuals that con-
sider blast shelter survivability as 'very good' when compared to
blast shelter survivability as 'very bad'. This indicates that in-
creasing public confidence in either public fallout shelters or blast
shelters, or more directly evacuation programs themselves will work
to increase the likelihood of evacuation in general (i.e., either
spontaneous or directed). This may be interpreted as a public
34
-_____________ -------------- ____
confidence in civil defense concepts of the past yielding an increased
confidence in current programs which in turn yields a higher reloca-
tion propensity.
Suggesting that some people have 'nowhere to go' as a source
of noncompliance with a directed relocation is directly affected by
the likelihood of the respondent's residential area being in danger
or a target area. If the respondent views the area of his/her residence
as being in 'certain danger'. He/she is 23.4 percent more likely to
suggest the lack of a place to go as a reason for not evacuating, than
the respondent that responds that they are in 'no dangers. On the
other hand, the more extreme the respondent feels the current world
tensions are the less likely they are to suggest the lack of a place
to go as a reason for not evacuating. Thus in periods of increased
world tension maladaptive risk area evacuees are less likely to sug-
gest that some people have 'nowhere to go' as a reason for not evacuat-
ing, and are thus more likely to either spontaneously evacuate or re-
locate. Once again pointing to the need for a program to inform the
populace as to appropriate action in periods of increased world
tensions.
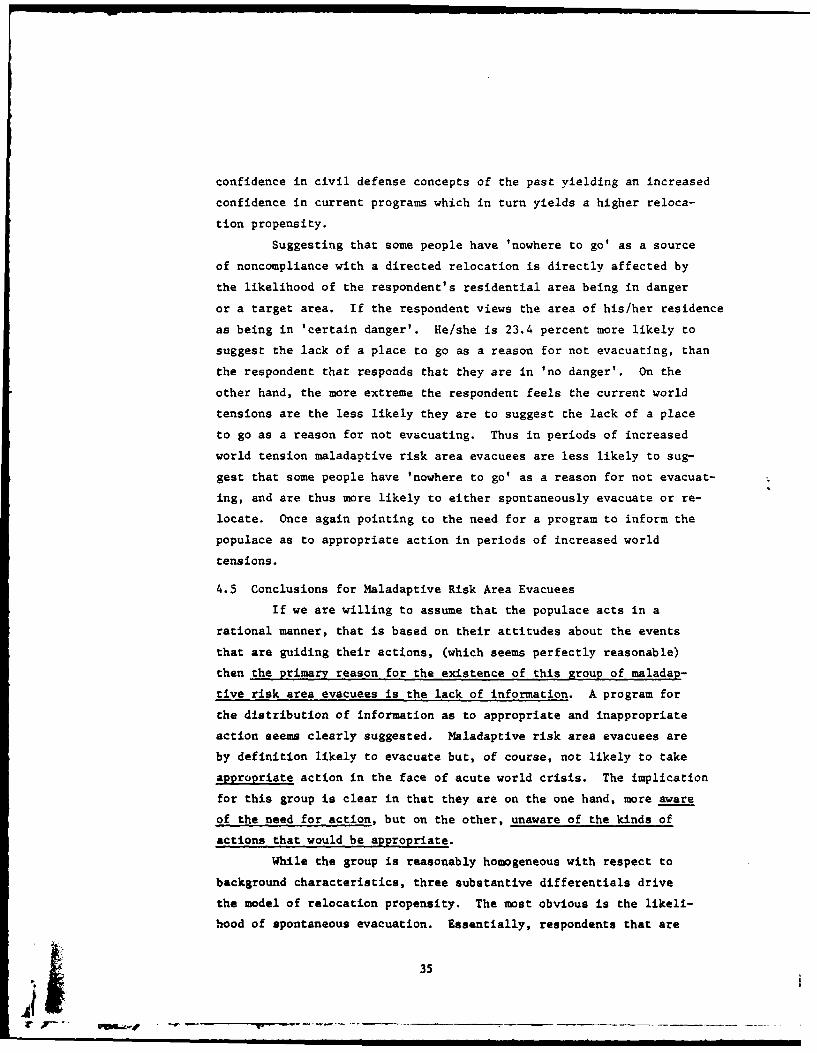
4.5 Conclusions for Maladaptive Risk Area Evacuees
If we are willing to assume that the populace acts in a
rational manner, that is based on their attitudes about the events
that are guiiding their actions, (which seems perfectly reasonable)
then the primary reason for the excistence of this group of maladap-
tive risk area evacuees is the lack of information. A program for
the distribution of information as to appropriate and inappropriate
action seems clearly suggested. Maladaptive risk area evacuees are
by definition likely to evacuate but, of course, not likely to take
appropriate action in the face of acute world crisis. The implication
for this group is clear in that they are on the one hand, more aware
of the need for action, but on the other, unaware of the kinds of
actions that would be appropriate.
While the group is reasonably homogeneous with respect to
background characteristics, three substantive differentials drive
the model of relocation propensity. The most obvious is the likeli-
hood of spontaneous evacuation. Essentially, respondents that are
~35

likely to evacuate spontaneously are also inclined to relocate under
presential directive. Empirically respondents do not differentiate
between evacuation on the one hand and relocation on the other. The
more exogenous inputs into the model have similar effects on both
spontaneous evacuation and presidentially directed relocation. This
is probably due to the similarity of action that each would require
of the respondent.
The rationality behind the finding that an individual is
more likely to evacuate if (and perhaps only if) he/she views evacua-
tion as increasing his/her survivability is flawless. However, in
terms of survivability, alternate methods of mitigating the effect
of nuclear war are not viewed as mutually exclusive. Thus it seems
as if the respondents are likely to be more confident in any parti-
cular alternative if they are also confident in all the alternatives.
While threat does not deem to affect relocation propensity
directly, which is couterintuitive, it does affect the relocation
propensities in an indirect manner. Threat does work indirectly
through the suggestion that some people have 'nowhere to go,' as
a reason for not evacuating under any circumstances. It is not
unmistakenly clear that increased threat yields decreased likeli-
hood of suggesting that some people have 'nowhere to go', which in
turn increases the likelihood of both evacuation and relocation.
What is clear is that threat, with respect to increased world ten-
sions, plays this role, while threat with respect to likelihood of
residential area being a target has the opposite effect. This is
perhaps due to the realization that target areas exist but that the
likelihood of them being used is negligible. Thus as world tensions
increase the populace is apt to find a place to go, while realizing
that they reside in a risk area.
36
VOWS,_ _ _ _ _ _ _ _ __ _ _ _ _ _ _
430
cr 11! 61 4! 1 4
C4 .4
41 0 .
06
~. 432 4 c41 - 4
-6 130 -, . 0
*1 IV In - I110 30
43i .Wc-n Lm C~ w e% 0a0.o
4. 41 Z3~
.4 c
C~a 4.- - 0
IA 4
43 43
37~

co v
- 0
04 U9 c 4 4)c o
%CC Cm cmk
CC
- 41
0..
4w
Cc - C
_ ~00
.4 .
.4 38

O0u 0 w-4 %
t.J a'i .
4n1
LC.,
4-'a,1 CED C)r- P
S- un.. CC
r, U)*1~ , C, 0 0 0r
to'. t
* 1. O - ~ CJ - .
= 0 c
4a Oi- IA :
C c c LW ca
0.t tn0n0
go '.
393
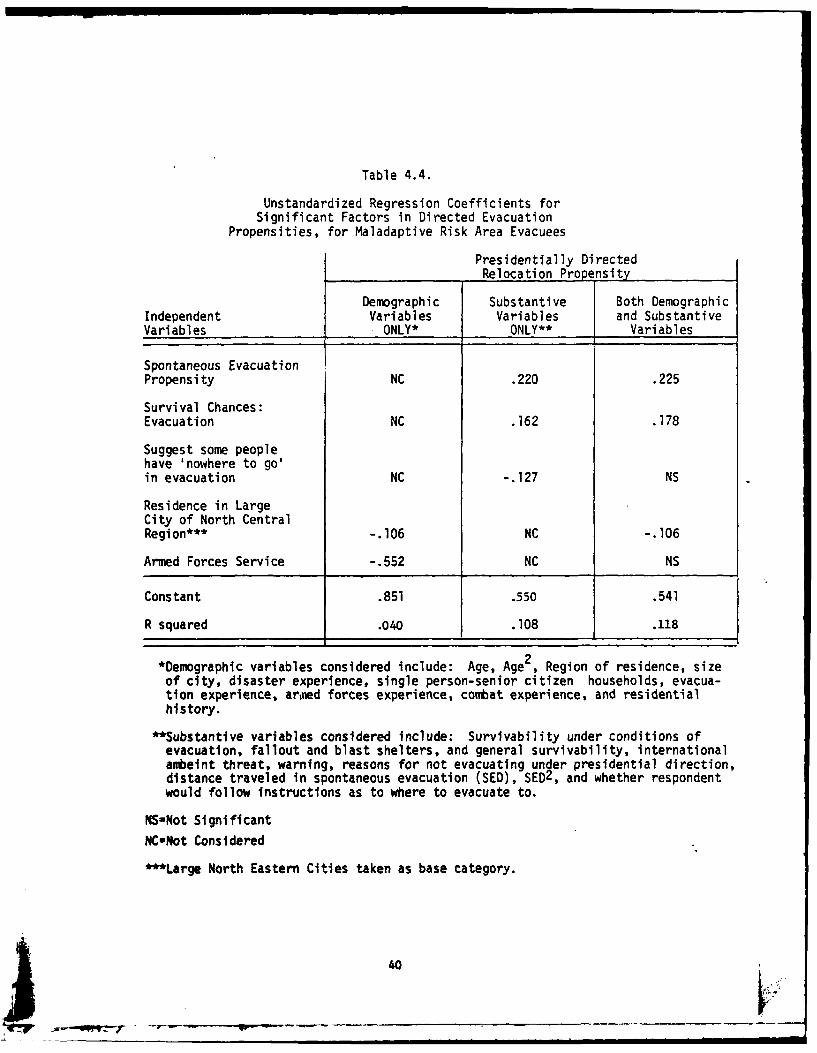
Table 4.4.
Unstandardized Regression Coefficients forSignificant Factors in Directed Evacuation
Propensities, for Maladaptive Risk Area Evacuees
Presidentially DirectedRelocation Propensity
Demographic Substantive Both DemographicIndependent Variables Variables and SubstantiveVariables ONLY* ONLY** Variables
Spontaneous EvacuationPropensity NC .220 .225
Survival Chances:Evacuation NC .162 .178
Suggest some peoplehave 'nowhere to go'in evacuation NC -.127 NS
Residence in LargeCity of North CentralRegion*** -.106 NC -.106
Armed Forces Service -.552 NC NS
Constant .851 .550 .541
R squared .040 .108 .118
*Demographic variables considered include: Age, Age 2, Region of residence, size
of city, disaster experience, single person-senior citizen households, evacua-tion experience, arned forces experience, combat experience, and residentialhistory.
**Substantive variables considered include: Survivability under conditions of
evacuation, fallout and blast shelters, and general survivability, internationalambeint threat, warning, reasons for not evacuating under presidential direction,distance traveled in spontaneous evacuation (SED), SED2 , and whether respondentwould follow instructions as to where to evacuate to.
NS-Not Significant
NC-Not Considered
***Large North Eastern Cities taken as base category.
40• _V

SpontaneousEvacuation .220 RelocationPropensity ' Propensity
.982 .944
-.055 .162
*
EvacuationSome PeopleL'Survivalhave 'no- Chances 916where to go'
.98
-040.234 /251 \ 7
World Area Survival SurvivalTensions Target Chances ChancesAbout Now Likelihood in Fallout in Blast
Shelters Shelters.040
.424
Figure 4.1. A Preliminary Substantive Model of Relocation Propensityfor Maladaptive Risk Area Evacuees.
41
II
. ....... n___ __ __ __ __ ____n_ _in__ ___ __ __I___I_ _-_ _I __ II I__ __I__ _I_ _I

5. CONCLUSION
While we recognize that crisis relocation is only one of
several methods available for the mitigation of the effects of
nuclear disaster, we find that among our sample the vast majority
view the alternatives as complimentary (i.e., in terms of their
desirability). A large portion of the sample find crisis reloca-
tion a desirable means of dealing with the effect of nuclear
disasters.
Within the context of this "overall favorableness" toward
crisis relocation, the purpose of this report has been to explore
the nature of compliance with a presidentially directed evacuation,
termed relocation, to avoid confusion between directed and spon-
taneous evacuation. We have argued that consideration of three
groups of individuals is important for the examination of compliance
attitudes for those people likely to be in risk areas at the time of
attack (t0) should there be no presidential action to direct reloca-
tion.
1. Individuals that reside in risk areas and are not
likely to spontaneously evacuate, termed potential
relocatables.
2. Risk area residents that are likely to evacuate
their residences maladaptively, termed maladaptive
risk area evacuees.
3. Residents of relatively safe areas that are likely
to spontaneously evacuate to risk areas in the
pre-directive period.
This latter group was found to be of insufficient size to in-
clude in this report. We recognize that these groups are based on
attitudes rather than behavior. We have focused our attention on
attitudes toward compliance with a presidentially directed relocation,
rather than behavior in an actual relocation situation.
The most obvious finding is that attitudes toward spontaneous
evacuation and directed relocation are related directly (i.e., the
more likely an individual is to evacuate spontaneously, the more
likely he/she is to relocate under the conditions of a presidential
42
- wt: T -' -- -__1

directive). This is probably due to the similarity of the actions
required (by the respondent) to either evacuate or relocate. This
involves not only the attitudes of the respondent but the resources
available to the respondent as well. It does not indicate that a
respondent is likely to both evacuate and relocate if the evacuation
is adaptive, or that the evacuation precludes relocation if the
evacuation is maladaptive.
Perhaps the most important finding is that among those in-
dividuals likely to be in risk areas at to, evacuation survival
chances are positively related to both spontaneous and directed
evacuation attitudes. If an individual believes that his/her
survivability is enhanced by evacuation, he/she will be more likely
to evacuate in either a spontaneous manner or in response to a
presidential directive. Thus we conclude that the extent of con-
fidence in evacuation as a method of mitigating the effect of
nuclear disaster, is directly related to both evacuation and re-
location propensities. This conclusion is so eminently reasonable
and rational, that it precludes further discussion.
The distribution of information as to the natrure of risk and
risk areas is of primary importance in a period of increased world
tensions if crisis relocation is to be an effective method of miti-
gating the effects of nuclear war. Among maladaptive risk area
evacuees misinformation is the principle reason for the group's
existence, while about 60 percent of the potential relocatables
said they would 'follow instructions' as to the destination of
presidentially directed relocation. We argue that the effectiveness
of crisis relocation as an alternative method of dealing with nuclear
disaster depends on the distribution of information as to the ap-
propriateness of various behavior patterns. This we find to be true
not only of spontaneous evacuation but of relocation as well.
While we expected the perception of threat to play a major
role in the model of relocation propensity, we found that threat has
no direct impact on either spontaneous evacuation or relocation.
However, it does have the indirect effect of decreasing the likeli-
hood of responding that some people have 'nowhere to go' and that is
43

why they will not evacuate under any circumstances, when we consider
the effect of world tensions, for maladaptive risk area evacuees.
This yields an overall positive affect on relocation propensities.
On the other hand, perception of area target likelihood hag the
opposite effect on suggesting that some people have 'nowhere to go'
in the event of evacuation, which yields an overall negative affect
on relocation propensities. Threat not only does not have the mag-
nitude of affect we expected, but is not clearly interpretable with
respect to the relationship between threat in general and the likeli-
hood of relocation. Furthermore, threat does not play any empirically
significant role for potential relocatables.
Finally we would like to point out that those individuals that
reside in risk areas that are not *likely to spontaneously evacuate
are the principal 'target group' for presidentially directed reloca-
tion efforts.
1. They are of primary importance since they are the
largest single group of individuals.
2. Potential relocatables are the most likely group
of individuals to be in risk areas at t 0 since they
are less likely to relocate than maladaptive risk
area evacuees.
3. They are also more likely to be 'risk area stayers'
since they are likely to be in their own homes at t 0'
This last point is arrived at since this makes them
more prone toward feeling 'safe' in familiar surround-
ings, and due to the 'protection of their territory',
than those individuals that are not likely to be in
or around their homes.
44

April 1980
REVISED MANDATORY STANDARD DISTRIBUTION LIST FOR RESEARCH REPORTS(ALL PROJECTS)
(Number of Copies - One unless otherwise indicated)
Federal Emergency Management AgencyMitigation and ResearchATTN: Administrative OfficerWashington, D.C. 20472 (60)
Defense Technical Information CenterCameron StationAlexandria, VA 22314 (12)
Civil Defense Research ProjectOak Ridge National LaboratoryATTN: LibrarianP.O. Box XOak Ridge, TN 37830
Dr. William W. ChenaultHuman Sciences Research, Inc.Westgate Research Park7710 Old Springhouse RoadMcLean, VA 22101
Dr. John W. BillheimerSYSTAN, Inc.P.O. Box ULos Altos, CA 94022
The Council of State GovernmentsATTN: Mr. Hubert A. GallagherDisaster Assistance Project1225 Connecticut Avenue N.W., #300Washington, D.C. 20036
Woodward-Clyde ConsultantsATTN: Edward A. SchuertProject ManagerThree Embarcadero CenterSuite 700San Francisco, CA 94111
- -r'i:4 "2 " -"-

DISTRIBUrION LIST (continued)Page Two
Scientific Services, Inc.517 East Bayshore AvenueRedwood, CA 94067
Ellory BlockScience Applications, Inc.2109 West Clinton AvenueHuntsville, Alabama 35805
The Dikewood CorporationUniversity Research Park1009 Bradbury Drive, S.E.Albuquerque, NM 87106
Ohio State UniversityDisaster Research Center127-129 West 10th AvenueColumbus, OH 43201
URS Research Company155 Bovet RoadSan Mateo, CA 94402
Dr. Gerald KlonglanDept. of Sociology & AnthropologyIowa State UniversityAmes, IA 50010
General Leslie BrayThe Analytic Sciences Corp.1117 North 19th StreetRosslyn, VA 22209
Mr. Walmer E. FtropeCenter for Planning and Research5600 Columbia PikeBailey Cross Roads, VA 22041
Mr. Don JohnstonResearch Triangle InstituteP.O. Box 12194Research Triangle Park, NC 27709
-- .' i -ii a I i
DISTRIBUTION LIST (continued)Page Three
William ChipmanFederal Emergency Management AgencyPlans and PreparednessGSA Building, Room 422718th and E Street, N.W.Washington, D.C. 20472 (4)
Michael KaltmanU.S. Nuclear Regulatory ComissionP 302Washington, D.C. 20555 (4)
National Bureau of StandardsDisaster Research CoordinatorATT~N: Mr. C. G. CulverOffice of Federal Building TechnologyCenter for Building TechnologyWashington, D.C. 20234
Command and Control Technical CenterThe Pentagon - BE 685Washington, D.C. 20301
Mr. Louis V. SpencerRadiation Theory SectionNational Bureau of StandardsBuilding 245, Room C-313Washington, D. C. 20418
Dr. John ChristensonDept. of SociologyBrigham Young UniversityProvo, UT 84601 (2)
Dr. Charles FritzNational Academy of SciencesRoom JR 7322101 Constitution Avenue, N.W.Washington, D.C. 20418 (4)
Robert PatersonFEMA Staff CollegeFederal CenterBattle Creek, MI 49106 (4)
A.-

DISTRIBUTION LIST (continued)Page Four
Ron PerryBattelle InstituteHuman Affairs Research Center4000 N.E. 41st StreetSeattle, WA 98105
Mr. Robert HarkerSYSTAN, Inc.P.O. Box ULos Altos, CA 94022
Ms. Marie HaymanInternational City Management Assn.1140 Connecticut Avenue, N.W.Washington, D.C. 20036
Ms. Clara RubinAcademy of Contemporary Problems1501 Neil AvenueColumbus, Ohio 43201
Division of Emergency ManagementDept. of Crime Control andPublic Safety
116 West Jones StreetRaleigh,~ NC 27611 (4)
Division of Policy Researchand Analysis
National Science Foundation1800 G StreetWashington, D.C. 20550 (2)
Dr. Baia BanathyFar West Laboratories for
Education and Research Development1855 Falsome StreetSan Francisco, CA 94103 (4)
Mr. John MillerOrganization 23509Boeing Aerospace CompanyP.O. Box 3994Seattle, WA 93124

EmE
t~ 9
.2'~ 2A
00
a, =
- ~ ~~~ .0 U, ~ Eu..
-~-78 .-. &7~
To -G 'o 60~0
46 m r q7 . r -6 m" -v Z 720
b.. 'E. - .0 V v : 0. - -
U a ~ i .0
0c - - - ---'-0, -a
:a z
- m 4 u
EE~~~~~~~ oMC0 0 ~0 ~ .E 0 .oU
.0 E.&
s r- 0.1. 00
.5 VO r
-0 02- E ~ 1 E9 E r. E. S0 Z0
8 u f4'~ 'Ul u
£l t . 50 0 . 0 72 C
0 0~ 2~o u oV.E
ili U u, u0
- Ua.';:, .2
Or *0 0 to -' U
~~~~ U- 000 2 ,0& cc t . 0~0
x. f- A- r 'I On
-a I I 0q U- 1 11 a A -- _I , IL E
71 -Z t 1 9 _1t
*11 Mc~
~ 4 0
3 W V m
a :r
Cc l u A , ' <* ~ ~
00 = -r-nrm
a~ n -,
< n
C6 w t 0 1- ~W, QQ
0 ;-r
a,- S 2 5; IF n
IFw~ n
0, q
7 . 2 . n Mn E. cco ) W. onr aO P nn.q.
-,0 M .0 1 cc CL 0
CL o...n wn .
r'C~ n~ a
R r n 0 .r I- 7
n CLn m 1, -0 C6 -
0- n. o ir 0 C-
CL no~ 0 0 00 n.CC CLE;0 ~-;gooL Z. CL -0-*'~~
nw tR 1= n- w I
Q0 . A 91 n
--- n
13 Z30 -- 0 n0
r r. % , -,3 a ~n
3~~~~q n 0 ! -n-M
aq S 09 . -
G o .
r a "

FILIM
TI