Embed Size (px)
Citation preview

AD-A134 317
UNCLASSIFIED
MECHANICAL PROPERTIES OF LONGLEAF PINE TREATED WITH WATERBORNE SALT PRESERVATIVES(U) FOREST PRODUCTS LAB MADISON WI B A BENDTSEN ET AL. AUG 83 FPL-434
F/G 11/12
1/1

1.0 ü,M = ia IM
l.l L. |£0
11.25 «II 1.4
m [2.2
2.0
=
.6
MICROCOPY RESOLUTION TEST CHART
N*T.ON*L »U"C 4u Of ST*WO*»OS - -»«3 - A
.
—

United State; Department < Agriculture
Forest Servi'
Forest Products Laboratory
Research Paper FPL 434
I
'S
Mechanical Properties of Longleaf Pine Treated with Waterborne Salt Preservatives B. A. Bendtsen L. R. Gjovik and S. P. Verrill
unt m£ ^ DISTRIBUTION STATEMENT A Approved fox public release)
Distribution Unlimited

=3=
Abstract
' Mechanical properties were measured on small clear bending specimens of longleaf pine sapwood treated with three wateroorne salt preservative systems. Preservative retentions ranged from 0.25 to 2 5 pounds per cubic foot (*/ff), and specimens wan either air dried or kiln dried at 140*F. Modulus of elasticity of specimens dried at this schedule was not affected by preservative salt retentions of up to 2.5 lb/ft3.
Modulus of rupture was not affected by ACA treatments regardless of type of drying; was reduced by CCA-II at 2.5 lb/ft' when kiln dried; and was reduced by CCA-I at retentions above 0.25, especially when kiln dried.
Work to maximum load was adversely affected by CCA-I and CCA-II at nearly all retentions when air dried or kiln dried and by ACA at retentions of 1.0 and 2.5 lb/ft3. ^r~"
Accpr,nton For
NTis -:-•••,< I DTIC I ' Una [ ] Ju . f cation
Tf-
Bv Distril • ' in/
Availability : • • •:;
:Av ! ", '/or Diat tial
•_.

United States Department of Agriculture
Forest Service
Forest Products Laboratory'
Research Paper FPL 434
August 1983
Mechanical Properties of Longleaf Pine Treated with Waterborne Salt Preservatives B. A. Bendtsen, Supervisory Research Forest Products Technologist L. R. Gjovik, Research Forest Products Technologist and S. P. Verrill,2 Mathematical Statistician
Introduction Methods
Waterborne inorganic salt preservatives, primarily chromated copper arsenate (CCA) and ammoniacal copper arsenate (ACA). are commonly used to protect wood in environments that promote decay. There is concern that these treatments may reduce the mechanical properties of wood, but the results of past research in this area (appendix I: Literature) are inconsistent and inconclusive, particularly at high loadings of salt. Better information is needed on the effects of these treatments so that compensation can be made in structural design using treated materials.
Small clear bending specimens of longleaf pine are used here to evaluate strength in response to treatment with ACA and CCA types I and II. A range of preservative retentions were tested from 0.25 to 2.5 pounds per cubic foot (lb/ft3). These retentions cover all normal use applications from above ground (0.25 lb/ft3) to marine environments (2.5 lb/ft3). Specimens were loaded very rapidly to simulate the load conditions of treated fender piles that failed during handling (11)?
CCA Types I and II were selected for evaluation because they have substantially different proportions of chromium; ACA has no chromium. We believe that this heavy metal is capable of degrading wood properties.
' The Forest Products Laboratory is maintained at Madison. Wis in cooperation with the University of Wisconsin.
1 Verrill is a Mathematical Statistician, lormerly ot FPL. now at the Lawrence Livermore National Lab . Livermore, Calif We acknowledge the computer assistar.^e rendered by Eric Elvira of the Lawrence Livermore National Lab
The experiment was a three-way factorial design: • Preservative systems—three levels. ACA, CCA type I, and CCA type II. • Salt loading—four levels. 0.25. 0.6. 1.0, and 2.5 lb/ft*. • Drying—two levels: kiln and air drying.
There were also three "control groups: water treated and kiln dried; water treated and air dried; and no treatment with air drying from the original green condition. A sample size of 25 specimens was provided for each preservative- retention-drying combination and the water-treated control groups. Thirty specimens were provided for the untreated control group.
• Specimens 1- by 1-inch-square and 16 inches long were p-.eoared from longleaf pine logs and treated to target retentions by conventional practice Air-dry specimens were dried under controlled conditions (initially 80°F and 90 pet relative humidity (RH) and finally 74°F and 65 pet RH).
Kiln-dry specimens were dried for 10 drys at 140°F, a condition intended to simulate drying ot full-size piles. All specimens were allowed to come to equilibrium in an environment controlled at 74°F and 65 percent RH in preparation for test.
Specimens were tested in rapid bending by applying a concentrated load at the center of a 14-inch span. The duration of the test was about one-fiftieth of a second, and simultaneous measurements of load and deflection were recorded in a digital oscilloscope
Appendix II contains experimental detail.
' Italicized numbers in parentheses refer to literature cited at end of report
--

Results
_
Cell means, standard deviations, and numbers of specimens tested for modulus of rupture (MOR), modulus of elasticity (MOE), work to maximum load (WML), moisture content (MC), and specific gravity (SG) are given in tables 1-5.
Comparisons Between Preservative Systems, Retention Levels, and Type of Drying A three-way analysis of variance (ANOVA) was performed to determine the significance of main and interaction effects of preservative systems, retention levels, and type of drying upon the three mechanical properties measured and upon MC. Data for the water-treated and the untreated control specimens were not included in this analysis.
At the 5 percent confidence level, the main effects of preservative systems, retention level, and type of drying were each significant on MOR, WML, and MC (table 6 and figs. 1 -3). Figures 1 through 3 were constructed by combining the air-dried and kiln-dried results to best illustrate retention level and preservative system main
effects. The effect of drying type was relatively minor except in the CCA-II case (fig. 4). There were no significant main effects on MOE.
There were no significant interactions of main effects on MOR. However, the preservative system-retention level interaction was significant on WML From figure 2 it is apparent that the negative effect on WML of an increase in retention level is greatest in the CCA-I case, followed by the CCA-II case, and then the ACA case. This accounts for the interaction.
All interactions were significant on moisture content In particular the increase of MC with an increase in retention level is more pronounced in the CCA-I case than in the CCA-II case (than in the ACA case) (fig. 3). This accounts for the preservative system-retention level interaction in the MC response.
Table 1.—Modulus of rupture (lb in.1)'
Type drying
Air dry
Kiln dry
Air dry
Kiln dry
Air dry
Kiln dry
Untreated Water- treated controls
Modulus of rupture of specimens treated at these retention levels (lb 'ft')'
controls 0.25 0.6 1.0 2.5
ACA
29 22,501
2.870(12.8)
25 22,164
2,657(12.0)
23 22,627
3,084(13.6)
25 21.716
3.311(15.2)
25 22.436
2,710(121)
25 20.716
2.591(125)
25 21,135
3.748(17.7)
25 21.325
2.360(11.1)
24 21.952
2.910(13.3)
CCA-I
25 21.907
2.846(130)
24 20 854
3.346(160)
24 21,332
2.676(12.5)
25 21.659
3.272(15 1)
24 20.492
3.081(160)
23 18.293
3.150(172)
23 22,098
2,029(9.2)
25 20.219
3.301(163)
CCA-II
23 19.821
2.810(142)
24 18.944
3.445(182)
25 22,515
3,079(13.7)
25 21.332
3.155(148)
23 22.255
2.740(123)
24 20.983
3.040(145)
25 21,525
2.325(10.8)
22 20.435
2.291(11 2)
24 21.019
2.988(142)
24 20,011
3.271(163)
data, the first line is the number of spe cimens; the second the average modulus of ru pture. the third, the stanjard deviation (coefficients of variation in parentheses)
' Nominal retention levels, actual retention levels are given in Table At in the Appendices

Table 2.—Modulus of elasticity (IP lb/in.')1
Air dry 29 3.306
0.551(16.7)
Kiln dry
Air dry
Kiln dry
Air dry
Kiln dry
Water« treated
Modulus ot elasticity of specimens treated at these retention levels (ib/ff)1
controls 0.25 0.6 1.0 2.S
ACA
25 3.356
0.484(14.4)
23 3.375
0490(145)
25 3.241
0.572(17.7)
25 3.359
0.424(12.6)
25 3.152
0.456(14.5)
25 3 126
0.659(21 1)
25 3 217
0 387(12.0)
24 3.344
0.518(15.5)
CCA-I
25 3.377
0.546(16.2)
24 3238
0.501(15.5)
24 3.179
0498(15.7)
25 3.292
0.535(16.2)
24 3183
0537(16.9)
23 3.352
0.429(12 8)
23 3326
0.322(9 69)
25 3.224
0.458(14.2)
CCA-II
23 3.131
0.476(15.2)
24 3.544
0.359(10.1)
25 3.301
0.531(16.1)
25 3.238
0.483(149)
23 3.367
0.463(137)
25 3200
0.519(16.2)
25 3.133
0.486(15.5)
22 3212
0.437(13.6)
24 3.252
0.482(14.8)
24 3.402
0.398(11.7)
he number of spe omens; the second the average modulus of el; isticity. the third, the standard deviation (coefficients of variation in parentheses)
1 Nominal retention levels, actual retention levels are given in Table A1 of the Appendices.
A Duncan s multiple range test (15) was conducted to identify the source of significance in main effects. The results for comparisons among preservative systems are shown below
(The symbols • and > indicate that a treatment leads to a strength property that is significantly less than or greater than another at the 5 pet confidence level; an equal sign indicates no significance at that confidence level.) MOR: CCA-I - CCA-II - ACA MOE. CCA-I - CCA-II - ACA WML: CCA-I - CCA-II < ACA MC: CCA-I - CCA-II - ACA
Similarly the results for level of salt retention are MOR: 2.5 « 1.0 06 MOE 2 5 -1.0- 0 6 WML: 2.5 - 1.0 - 0.6 MC: 2.5 * 1.0 > 0.6
and for type of drying MOR: KD . AD MOE: KD AD WML; KD • AD MC: KD - AD
- 0.25 - 0.25 • 0.25 0.25
Because significance of interactions did not reflect degree of effect, we qualify these results. In particular, the nature of the significant preservative-retention level interaction in the WML case (fig. 2) suggests that the CCA-I < CCA-II < ACA ordering is much stronger at high retention levels than at low retention levels. In this same WML case the 2.5 < 1.0 = 0.6 < 0.25 ordering is more definite tor the CCA-I preservative than for the ACA preservative. Also in both the WML and MOR cases the KD < AD result may be important only for the CCA-II preservative.
Figures I through 3 indicate that increases in MC generally parallel decreases in strength—i.e., for both MC and mechanical properties, ACA shows the least response to treatment, CCA-I the most, and these effects increase with increasing retention levels. To determine whether the lower mechanical properties were due to chemical degradation or to higher moisture contents, a second ANOVA was conducted on the MOR and WML data after adjusting individual observations to 12 percent MC (20). Contrasting
the results of this analysis (table 7) to those in the unadjusted case (table 6), we see that the significant main effects of preservative system and retention level on MOR are apparently due to differences in MC. When the MOR data are adjusted to 12 percent MC. only the main effect of drying type is significant.
For WML. there is essentially no change in the levels of significance for all main and interaction effects when the data are adjusted to 12 percent MC. This analysis suggests that the salt treatments cause a degradation of the wood that affects WML but not MOR. Alternatively, it suggests that the standard WML moisture content adjustment is not satisfactory
Regression Although linear and nonlinear curves may be fit to the MOR or WML versus retention level data, the experiment was not specifically designed to provide optimal estimates of such curves. Thus we made no extensive curve-fitting efforts. We did. however, perform multiple regressions of MOR and WML on retention level and SG for the ACA-air dry. ACA- kiln dry, CCA-I. CCA-ll-air dry. and CCA-ll-kiln dry cases
(data not adjusted for MC). No statistically significant lack of fit was detected. The resultant regression equations together with the corresponding confidence surface equations are given in table 8
Properties of Treated Material Compared to Those of Untreated Controls To determine the magnitude of treatment effects, the ratios of the average mechanical properties for each treatment group to those of the untreated control group were calculated (table 9). Also Duncan's multiple range test (DMRT) was used to test for significant differences (at the 5 pet level) between the averages of the treatment cells and the average of the untreated control group. This test was performed on both the unadjusted data and the data adjusted to 12 percent MC. The results of these analyses are included in table 9.
Table 3.—Work to maximum load (inch-pounds per specimen)'
Type drying
Air dry
Kiln dry
Air dry
Kiln dry
Air dry
Kiln dry
Untreated controls
29 2509
493(197)
Water- treated
Work to maximur at these re
controls 0.25 0.6
25 233.6
47.3(20.3)
23 233.7
52.7(22.5)
25 227 1
56.7(25.0)
25 2239
57 7(25.8)
25 221.9
48 3(21.8)
24 2264
51 1(22.6)
24 2179
43.5(200)
25 209.0
50.2(240)
23 226.6
40 4(178)
25 1865
54 0(290)
25 2466
49.1(19.9)
25 212.5
54.4(256)
25 2469
41.9(17 0)
22 190.7
48.1(25.2)
1.0
ACA
CCA-I
CCA-II
25 232.8
45.0(193)
25 211.9
39.6(18.7)
24 177.5
43.5(24.5)
23 168 7
35 8(21.2)
23 217.6
43.3(19.9}
24 191.1
47.8(25.0)
2.5
25 204 3
48 5(23.7)
24 197.8
53.3(27.0)
23 118.9
42.4(35 7)
24 1183
421(35.6)
25 1868
43.5(23.3)
24 153.5
48 9(31 8)
' In each set of data, the first line is the number of specimens; the second, the average energy absorbed to maximum load; the third, the standard deviation (coefficients of variation in parentheses)
' Nominal retention levels, actual retention levels are given in Table A1 of the Appendices.
__^
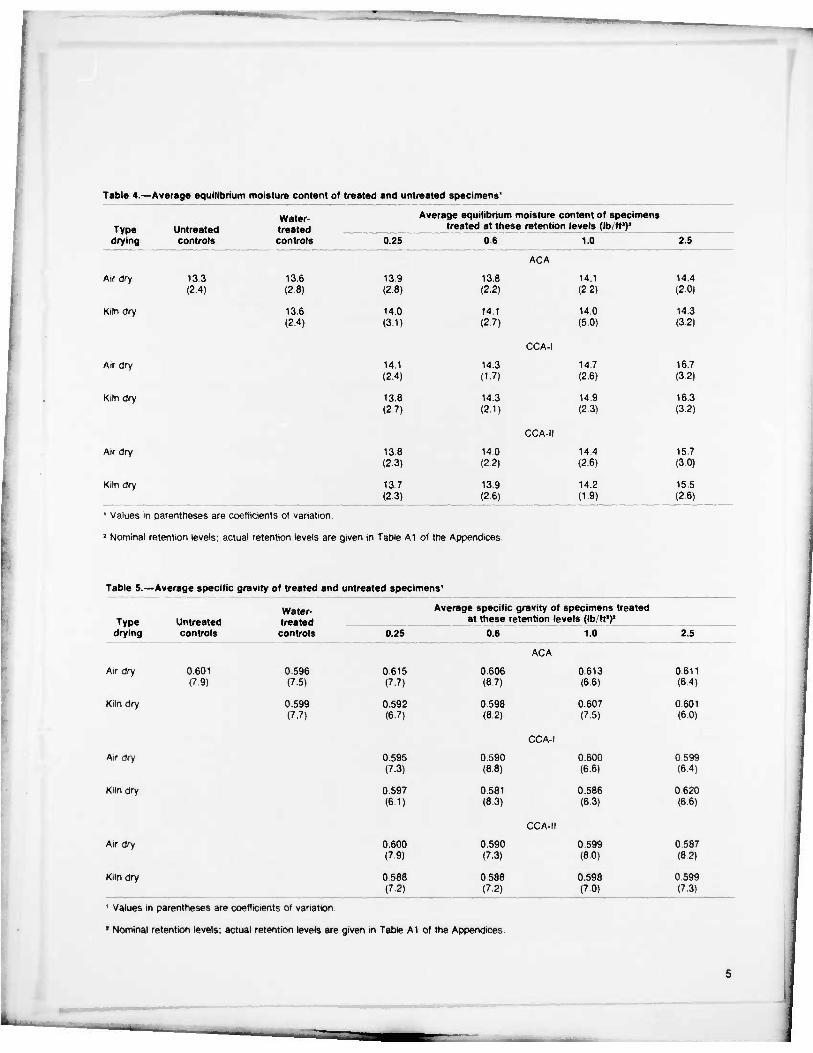
Table 4.—Average equilibrium moisture content of treated and untreated specimen»1
Type Untreated controls
Water- treated controls
Average equilibrium moisture content of specimens treated at these retention levels (lb/ft*)'
drying 0.25 0.6 1.0 2.5
ACA
Air dry 13.3 (2.4)
13.6 (28)
13.9 (2.8)
13.8 (2.2)
14 1 (22)
14.4 (20)
Kiln dry 13.6 (2.4)
14.0 (3.1)
M.I (2.7)
CCA-I
14.0 (5.0)
14.3 (3.2)
Air dry 14.1 (2.4)
14.3 (1.7)
14.7 (2.6)
16.7 (32)
Kiln dry 13.8 (2.7)
14.3 (2.1)
CCA-M
14.9 (23)
16.3 (3.2)
Air dry 13.8 (2.3)
14.0 (2.2)
14.4 (26)
15.7 (30)
Kiln dry 13.7 (2.3)
13.9 (26)
142 (19)
15.5 (26)
' Values in parentheses are coefficients of variation.
2 Nominal retention levels; actual retention levels are given in Table A1 of the Appendices
Table 5.—Average specific gravity of treated and untreated specimens'
Type Untreated controls
Water- treated controls
Average specific gravity of specimens treated at these retention levels (lb/ft')'
drying 0.25 0.6 1.0 2.5
ACA
Air dry 0601 (7.9)
0 596 (75)
0.615 (7.7)
0.606 (87)
0613 (6.6)
0.611 (64)
Kiln dry 0 599 (7 7)
0592 (6.7)
0.598 (8.2)
CCA-I
0607 (75)
0.601 (6.0)
Air dry 0.595 (7.3)
0590 (8.8)
0600 (6.6)
0 599 (6.4)
Kiln dry 0.597 (61)
0.581 (8.3)
CCA-II
0 586 (63)
0.620 (66)
Air dry 0.600 (7.9)
0590 (73)
0599 (80)
0587 (82)
Kiln dry 0.588 (72)
0588 (72)
0.598 (70)
0 599 (73)
' Values in parentheses are coefficients of variation
2 Nominal retention levels, actual retention levels are given in Table A1 of the Appendices

Average losses for unadjusted MOR values range from none for the airdried 0.25 lb/ft3 treatments with ACA and CCA-II to nearly 20 percent for the air-dried 2.5 lb/ft3
treatment with CCA-I. At the intermediate levels of treatment (0.6 and 1.0 lb/ft3) the loss exceeded 10 percent for kiln-dried CCA-I treatments and was slightly less for CCA-II. Although nearly all treatment cells, including those treated with water only, show some reduction, the DMRT does not indicate significance at the 5 percent level for reductions less than about 10 percent. Five of the 24 treatments caused a statistically significant reduction in MOR. After adjustment for moisture content, none of these five treatments were significant.
Table 6.—Levels c' significance for main and interaction effects'
Modulus Modulus of of rupture elasticity
Work to Mois- maximum ture
load content
Mam effects Preservative
systems Retention levels Type drying
Interactions Pres x ret Pres X drying Ret X drying Pres x ret x drying
0.0001 0.8739 0.0001 0 0001 .0001 .7055 .0001 0001 .0339 .7290 .0023 0169
1164 .0493 0001 0001 3325 .7023 .3014 .0103 7165 1750 .4098 0012 4701 .6136 .5921 0446
' Numbers less than 0.05 indicate significance at the 5 percent confidence level
For WML, the minimum loss was about 2 percent due to the 0.25 lb/ft3 treatment with CCA-II and ranged to 53 percent for the 2.5 lb/ft3 treatment with CCA-I. The DMRT showed that treatments with both CCA-I and CCA-II caused statistically significant reductions at retention levels of 0.6 lb/ft3 and higher. The air-dry 0.25 lb/ft3 level of treatment with CCA-I also caused a significant reduction For ACA the 2.5 lb/ft3 level was significant as was the kiln-dry 1.0 lb/ft3
treatment. After adjusting the data to 12 percent MC, a significant reduction was still evident in 14 of 16 cells that initially showed significance.
Table 7.—Levels of significance for main and interaction effects after adjusting modulus of rupture and work to maximum load data to 12 percent moisture content'
Modulus Work to of rupture maximum load
Mam effects Preservative systems 03954 00001 Retention levels 4313 .0001 Type drying .0100 0014
Interactions Pres x ret .1525 .0001 Pres x drying 1767 2497 Ret X drying 8987 4074 Pres x ret x drying 4962 .5501
' Numbers less than 0 05 indicate significance at the 5 percent confidence level
Table 8.—Regression equations and 95 percent confidence limits for a new observation at RETL • Z„ SG • Z,
The gener al form of the equation:'
roperty • .», + ä,Z, + ä,Z, tK\
Strength p / * + I + (S„(Z, - X,y - 2S„(Z, X.HZ , - 5c.) S„(Z, X,)')
/ n(S„SM SV)
Preserv- ative Drying
system condition <*t «» äs K n X, x, s„ s„ s„ WORK TO MAXIMUM LOAD (inch pounds per specimen)
ACA Combined -71 12 500 89 246 0 888 0 604 0841 0 0009 0 0019 CCA-I Combined 85 47 530 79 241 868 596 807 0034 0019 CCA-II Kiln 9 32 370 96 120 873 595 832 0006 0018 CCA-II Air 52 18 480 85 123
MODULUS OF RUPTURE (lb/in.J)
885 594 857 0050 0021 I
ACA Kiln 11.000 280 54,000 3,950 123 .877 600 831 0006 0019 ACA Air 7.700 760 50,000 3.550 123 899 608 858 0012 0020 CCA-I Combined -9.300 1.550 53,000 4,050 241 .868 596 807 0034 0019 CCA-II Kiln 6.500 600 47.000 4.350 120 873 595 832 0006 0018 CCA-II Air 8.400 260 51.000 3,500 123 885 594 857 0050 0021
For our purposes the "iquation strength property *- «, + n,Z, + <"»,A, t 1.05 K is a fairly satisfactory simplification

1.0 2.0 SALT RETENTION IPCF1
% IT r~
16
EQUILIBRIUM l5
MOISTURE CONTENT
14 -
13 -
1
CCA I
-WATER-TREATED CONTROL
10 20 SALT RETENTION (PCFl
Figure 1.—Effect of salt retention on modulus of rupture for three preservative systems expressed as a percentage of untreated controls (air- and kiln-dried specimens combined and not adjusted for moisture content). (M 151 582)
WORK T0 TO MAXIMUM 'u
LOAD
'0 20 SALT RET£NrlON IPCF)
Figure 2 —Effect of salt retention on work to maximum load tor three preservative systems expressed as a percentage of untreated controls (air- and kiln-dried specimens combined and not adjusted for moisture content) (to 151 590)
Figure 3—Effect of preservative systems and retention level on equilibrium moisture content (air-dried and kiln-dried specimens combined). (M 151 583)
100
STRENGTH PROPERTY
10 20 SALT RETENTION (PCFl
Figure 4.—Effects of air drying versus kiln drying for CCA-II treatments expressed as a percentage of untreated controls (not adjusted for moisture content). WML • work to maximum load (M 151 585)

Table 9.—Average mechanical properties of treated specimens as a percentage of untreated controls (all percentages are calculated from strength values at test moisture content)'
Mechanical properties of specimens Preaerv- Water- treated at these retention levels
ative Drying treated <lb/ft')J
system method controls 0.25 0.6 1.0 2.5
MODULUS OF RUPTURE
ACA Air Kiln
100.6 94.8
965 976
99.7 97.4
92.1 92.7
CCA-I Air Kiln
98.5 93.9
94.8 98.2
96.3 899-
91.1 88.1'
81.3- 84 2"
CCA-II Air Kiln
100.1 957
948 908
98.9 93.4
93.3 889"
MODULUS OF ELASTICITY
ACA Air Kiln
102 1 973
980 101.1
101.6 102.1
95.3 97.9
CCA-I Air Kiln
101 5 94.6
962 100.6
99.6 97.5
96.3 94.7
101.4 107.2
CCA-II Air Kiln
99.8 94.8
97.9 97.2
101.8 98.4
96 8 102.0
WORK TO MAXIMUM LOAD
ACA Air Kiln
93 1 88.4
90.5 90.2
92.8 84.5-t
81.4*t 78.8't
CCA-I Air Kiln
93.1 89.2
86.8* 90.3
83.3't 74.3't
70.7*t 67.2't
47.4*t 47.2't
CCA-II Air Kiln
983 98.4
84.7't 76.0-f
86.7-t 76.2-f
74.4't 61.2-t
1 * indicates a significant difference from the untreated controls before adjusting for moisture content; t indicates significant difference after adjusting to 12 percent moisture content
* Nominal retention levels; actual retentions are given in Table A1 of the Appendices.
Kiln drying caused an additional 5 percent reduction m MOR beyond that caused by air drying for all levels of treatment with CCA-II. For WML, kiln drying specimens treated with CCA-II caused additional reductions of about 9 to 13 percent at retentions of 0.6 lb/ft5 and higher. The effects of kiln versus air drying for treatments with ACA and CCA-I were inconsistent across retention levels for all three mechanical properties.
Failure Characteristics Examination of specimens after testing revealed interesting patterns of failure characteristics among preservative systems, retention levels, and failure types. Normally, brash or brittle failures are associated with wood of low strength, particularly in energy absorption properties. Brashness is common in wood of low density or wood that has been exposed to any agency of deterioration such as decay, heat, or reactant chemicals. Thus it was anticipated that kiln-dried specimens would be more brash than air dried, that high retention specimens would be more brash than low retention; and that specimens treated with preservative systems causing the greatest strength reductions would be most brash. Using complete separation of the specimen at time of failure as our criterion for brashness, we see that the specimens do not adhere to these anticipated patterns (table 10).
For example, in the 2.5 lb/ft3 treatment with ACA. 15 air- dned specimens failed with complete separation while only 8 kiln-dried specimens did. In 7 of 13 cases, the number of air-dried specimens with brash failures exceeded the number of kiln-dried specimens with brash failure (table 10).
In the air-dried CCA-I treatment, 11 specimens treated to 0.25 lb/ft3 failed completely compared to only 1 of those treated to 2.5 lb/ft3. In no case did the numbers of specimens showing brashness increase consistently with increasing retention level
Based upon strength response, treatment with CCA-I at the 2.5 lb/ft3 level should have caused the most brashy failures. Yet, only one specimen in each of the air-dry and kiln-dry groups with this treatment failed completely.
Table 10.—Numbers of brashy specimens in each treatment cell
Preservative system
Nominal retention
Air dried
Kiln dried
Ib'ft'
ACA 0 25 6
10 25
6 10 10 15
13 12 6 8
CCA-I 25 6
10 25
11 7 8 1
5 6 7 1
CCA-II 25 6
10 25
7 5 8
15
10 7
11 10 ¥
Water 0 9 6 I

Discussion
1
The Duncan s multiple range test (DMRT) analysis showed that some treatments caused a statistically significant strength response while others did not. The DMRT has shown that the only treatments to cause a statistically significant reduction (5 pet confidence level) are CCA-I at retention levels 0.6 lb/ft3 and higher and CCA-II at 2.5 lb/ft' when kiln dried. For WML. significant reductions were observed in response to all three preservative systems. The retention level at which significance was observed varied among preservative systems and with type of drying. However, from the general trends evident in table 9 and figure 2, it would seem that all three preservative systems caused reductions in WML at all levels of retentions Because of high variability the experiment was too insensitive to detect the treatment effects at lower response levels. The same reasoning applies to MOR (fig. 1). Because MOR responded less to treatment than WML. large- sample sizes would be required to show significant treatment effects at the low retention levels for MOR
Similarly, the DMRT only detected statistically significant kiln-drying effects for the CCA-II treatment. Yet, 11 of 16 experimental cells pertaining to MOR and WML for the other 2 preservative systems showed lower results for kiln- dried specimens. Thus experiments with larger sample sizes may also detect significance in the type of drying for the ACA and CCA-I treatments. Furthermore, kiln temperatures were limited to 140°F in this experiment. Higher temperatures would presumably produce more pronounced effects
We observed that when MOR values are adjusted to 12 percent MC. only the drying condition main effect remains statistically significant Thus the observed decrease in unadjusted MOR as retention level increases is apparently associated with the higher moisture contents in the treated material On the other hand, correcting work values for MC did not account for the observed reductions in this property Regardless, moisture adjustments may only be of academic interest. In practice, if treatment causes an increase in the MC of the wood and an associated loss in strength, this must be considered a part of the treatment effect. Effectively, a loss in strength due to increased MC is no different from that due to a chemical degradation of the wood ''self.
We noted earlier that we believed that the heavy metal chromium is capable of degrading wood properties. The alignment of the three preservative systems evaluated in terms of the strength reductions observed—CCA-I • CCA- II • ACA—is consistent with this hypothesis CCA-I has 61 percent chromium (Cr03). CCA-II has 35 3 percent, and ACA has none.
From table 8. estimates can be made of the strength reductions due to treatment that can be expected in material treated to conventional salt retention levels.' At the 0.25 lb ft3 treatment level, the reductions in MOR would range from 2 to 5 percent (all calculations assume an SG of 0 6. the average value observed in the experiment; percent reductions will be greater for smaller SG s. less for larger SG s) At the 0.6 and 1.0 lb ft3 treatment levels, there would be a 2 to 3 percent MOR reduction in the air-dried CCA-II case, a 3 to 4 percent reduction in the air-dried ACA case, and 5 to 7 percent reductions in the other cases At the 2.5 lb/ft3 level, the MOR reductions would be approximately 4 percent in the air-dried CCA-II case 17 percent in the CCA-I case, and 8 to 10 percent in the remaining cases
Reductions in WML at a treatment level of 0 25 lb ft3 range from 8 to 12 percent At the 0 6 and 1.0 lb ft3 levels. WML reductions range from 10 to 14 percent m the ACA and air- dried CCA-II cases, from 16 to 21 percent in the kiln-dried CCA-II case, and from 18 to 26 percent in the CCA-I case. At the 2.5 lb/ft3 level these reductions are approximately 22. 40. and 54 percent
' For example, the control MOR was 22.501 From table 8 we see that in the kiln-dried CCA-II case the expected MOR value tor a retention level equal to 0 25 and a specific gravity equal to 0 6 is 6.500 600(0 251 • 47,000(0 61 - 21.250 Thus the percent reduction would be (22.501 21.550)100'22.501 4 2
I
J

Conclusions Recommendations
In small clear specimens, neither ACA- nor CCA-type preservatives adversely affect the MOE of southern pine sapwood either air or kiln dried after treatment to retentions from 0.25 to 2.5 lb/ft3.
ACA has no effect on MOR. but CCA-type preservatives vary in their adverse effects, which may be aggravated by kiln drying.
Work to maximum load is adversely affected by all three preservatives but least by ACA
Kiln drying at 140°F can adversely affect the mechanical properties of wood treated with certain waterbome preservatives.
Finally, our work clearly indicates that certain preservative systems induce reductions in MOR and WML that far exceed the reductions due solely to processing
Because of considerable industrial interest in high temperature kiln drying of wood after treatment with these preservatives, additional research is needed to evaluate the effects of the high temperature drying process on treated materials.
Future research should consider species other than southern pine, perhaps Douglas-fir and species in the Hem- Fir group.
Because grade and size factors may interact with treatment effects and because of difficulties with simulating processing effects, the effects of treatments on small clear specimens may not be applicable to full-size structural materials. To adequately account for treatment effects in engineering design, future research must include tests of full-size materials
Chemical bulking should also be evaluated in full-size material In bending members, any increase in section modulus due to bulking at least partially offsets reductions in material properties associated with treatments.
The strength reductions caused by the waterborne preservatives evaluated appear to be associated with the amount of chromium in the formulations. The mechanism by which chromium effects wood properties should be studied as a basis for developing alternative formulations.
10
„ -

Literature Cited
1. Alexander, J. B. Wood piles—specifications and mechanics. J. Forest Prod. Res. Soc. 3(2):62-64, 1953.
2. American Society for Testing and Materials. Standard definition of terms relating to methods of mechanical testing. ASTM Standard E 6-76. Part 10. Philadelphia, PA; 1979.
3. American Society for Testing and Materials. Standard method for establishing design stresses for round timber piles. ASTM Standard D 2899-74. Philadelphia, PA; 1979.
4. American Society for Testing and Materials. Standard methods for establishing clear wood strength values. ASTM Standard D 2555-78. Part 22. Philadelphia, PA; 1979.
5. American Society for Testing and Materials. Standard methods of testing small clear specimens of timber. ASTM Standard D 143-52. Part 22. Philadelphia, PA; 1979.
6. American Wood-Preservers' Association. Book of standards. Standard C 2-77. Bethesda, MD; AWPA; 1978.
7. Bolza, E.; Kloot, N. H. The mechanical properties of 174 Australian timbers. Technological Paper No. 25. Highett, Victoria. Australia: Division of Forest Products, Commonwealth Scientific Industrial Research Organization; 1963.
8. Burmester, Arno. Long term effects of wood preservatives on physical and mechanical properties of wood. Holz als Roh-und Werkstoff 28(12):478-485; 1970.
9. Burmester, Arno; Becker, Günther. Investigations on the influence of wood preservatives on the strength of wood. Holz als Roh-und Werkstoff 21(10);393-409; 1963.
12. Eggleston, Richard C. Pole strength tests. J. Forest Prod. Res. Soc. 2(1):3-24; 1952.
13. Hesp, T., Watson, R. W. The effects of water-born preservatives applied by vacuum pressure methods on the strength properties of wood. Wood 29(6):50- 53; 1964.
14. Hunt, G. W.; Garratt, G. A. Wood preservation, second edition. New York: McGraw-Hill; 1953.
15. Miller, Rupert G., Jr. Simultaneous statistical inference. New York: McGraw-Hill; 1966.
16. National Forest Products Association. National design specification for wood construction. Washington, DC: National Forest Products Association; 1977.
17. Siemon, G. R. Bending strength of CCA-treated slash pine poles. Research Note No. 29. Queensland, Australia: Department of Forestry; 1979.
18. Terentjev, V. Effect of KM-5 preservative on the mechanical properties of wood. Derevoobrabalyvayushchaya Promphlennost' 21(8):15-16; Jan. 1972.
19. Thompson, Warren S. Effect of preservative salts on hardwood veneer. Forest Prod. J. 14(3): 124-128; 1964.
20. U.S. Forest Products Laboratory. Wood handbook. Agriculture Handbook 72. U.S. Department of Agriculture; 1955.
21. Wangaard. F. F. The mechanical properties of wood. New York: John Wiley & Sons; 1950.
10. Davis. P.; Rabinowitz, P. Numerical integration. Waltham. MA: Blaisdell Publishing; 1967.
11. Eaton, Max L.; Drelicharz, Joseph A; Roe, Thorndyke, Jr. The mechanical properties of preservative treated marine piles—results of limited full scale testing. Civil Engineering Laboratory TN No. N-1535, Port Hueneme. CA; Nov. 1978.
11
— J

'^•' wm
Appendix I
Literature Bending and compression parallel to grain strengths were improved by treatments with 9 kg/m3 (^0.6 lb/ft3) of chrome-fluoride salts in a study by Burmester (8). He also reported lower impact bending strength which was recoverable if the salt was extracted. Southern pine poles commercially treated with greensalt showed slight increases in bending strength (12), while little or no strength effect was observed in European redwood (Scots pine) treated with about 1 lb/ft3 of acid copper chromate (18).
The influences of 10 types of salt at retention levels ranging from 8 to 24 kg/m3 (^0.5 to 1.5 lb/ft3) on the mechanical properties of pine, spruce, and beech were investigated by Burmester and Becker (9). Effects on bending strength and on compression parallel and perpendicular to grain strengths varied from slight decreases to slight increases while impact strength decreased significantly. Thompson (19) treated rotary cut veneer of four species with Boliden salts, Celcure. Chemonite, and copper chromate. Some species-salt combinations resulted in higher toughness but the toughness of blackgum was reduced from 26 to 52 percent depending upon the chemical.
The mechanical properties of Scots pine treated with 0.25 lb/ft3 of a copper/chrome/arsenate formulation were measured by Hesp (13). The average MOR. impact bending strength, maximum crushing strength, hardness, and shear strength ol the treated material were all slightly lower than those of the untreated controls. However. Hesp stated that the means were well within the range of natural variability.
MOR was least affected and the reduction was thought to be of no concern for structural use. In compression parallel to grain and shear tests, the strength reductions in the water-treated controls were as large as those in the salt- treated specimens. Hesp concluded that the reductions observed must be due to pressure treatment with aqueous solutions rather than to any inherent chemical or physical property of the preservative salts.
This is a recurring theme in the literature. Burmester and Becker (9) also observed that strength changes are obviously not caused by chemical decomposition of the wood but apparently by the physical treating processes, and that the reductions observed in mechanical properties are of no practical importance. Alexander (1) stated, It is safe to anticipate that round timbers, whether poles or piles, pressure treated to the current specifications of the American Wood-Preservers' Association do not change significantly in bending strength by reason of the preservation treatment."
Both Wangaard (21) and Hunt and Garratt (14) observed that tests generally show that strength losses are almost entirely due to the temperatures and pressures to which the wood is subjected during the conditioning and impregnation
' Personal correspondence with Oregon Stale University, where these tests were conducted, revealed that the CCA-creosote-treated Douglas fir piles failed in shear because o) burst checKs present betöre testing However, this observation does not change the general conclusions of the paper
period rather than to a chemical degradation. They indicate that zinc chloride is virtually inactive in the 2 to 5 percent solutions used in commercial practice, although the chemical apparently makes wood somewhat more brittle under impact. However, they add that in high concentrations, particularly in high temperature environments, zinc chloride is capable of degrading wood These conclusions do not necessarily apply to waterborne salts because of differences in the treating procedures.
Damaging evidence against the waterborne salt treatments is found in the work of Eaton et al. (11). Douglas-fir and southern pine piles were treated with ACA and CCA singly and in dual treatments with creosote. Five piles were tested per treatment group. The average bending strengths of individual treatment groups ranged from about 40 to 80 percent of the untreated controls; MOE from about 55 to 90 percent; and energy required to cause failure from 35 to 65 percent. Generally, the results between species and between salts individually and in dual treatment with creosote were not substantially different. Although large treatment effects are suggested by differences in mean values, many of the differences were not statistically significant because of the small numbers of specimens and the variability in test results. The authors recommend that where mechanical loading is the principle cause of failure, only creosote-treated piles should be considered.'
The results of Siemon (17) emphasize the inconsistencies in the literature concerning the effects of salt treatments on strength and are in direct conflict with these of Eaton et al. (11). Sixty-four slash pine poles, 14 to 15 inches in diameter at breast height (outside bark), from the three major exotic plantations in southeast Queensland, Australia, were treated to 32 kg/m3 (i2 lb/ft3) at a depth of 50 mm (2.0 inches). The poles were tested in bending after reaching 30 percent MC at a depth of 50 mm. The average MOR measured was 10,190 pounds per square inch (lb/in.2); MOE was 1,738,000 lb/in.'. These values compare favorably with those for untreated small clear specimens of slash pine grown in Australia and tested at 12 percent MC; 10,900 lb/ in.» for MOR and 1,370,000 lb/in.J for MOE (7). Although no untreated controls were tested for comparison, it would appear that the reductions, if any. due to treatment with CCA were negligible.
Current engineering design practice does not appear to reflect adequately the potential degradation of mechanical properties by treatment with waterborne salt preservatives In design with dimension lumber, there is no recognition of treatment effects except in the case of the heavy salt retentions required for marine exposure (16). Even here, normal design stresses apply except that no increase is permitted for impact load duration. In round timber design a 10 percent reduction factor is applied for poles treated by the Boulton process and a 15 percent reduction factor for steam-conditioned southern pine (2). ASTM Committee D07 on wood recently concluded that the reduction for steam conditioning be increased to 25 percent This change will appear in future editions of the round timber piling standard, but the standard does not recognize the existence of any preservative effect.
12

Appendix II
Experimental Material
Test material was cut from longleaf pine (Pinus palustris) trees 12 inches or more in diameter at breast height from the Harrison Experimental Forest (De Soto National Forest) near Guifport, Mississippi. Increment cores were used to select trees with potential for providing test material with 6 to 10 rings per inch in the sapwood. Trees hdving these characteristics were sought to minimize material variability and to assure uniform preservative treatment among specimens.
The first 6-foot bolt above the stump was cut from each of 15 trees. These bolts were end-coated to retard drying and end checking and shipped via motor freight to the Forest Products Laboratory.
Specimen Preparation and Assignment
Each bolt was sawn to maximize the number of 11/4-inch- square sapwood sticks cut parallel to the bark and with the annual rings oriented parallel to one face. Heartwood material was discarded.
Table Al.—Average preservative retentions for treated specimens, ranges, and coefficients of variation (COV)
Preserv- ative type
ACA
Type drying
Average retentions of specimens treated at these target levels (lb/ft*)
0.25 0.6 1.0 2.5
Air dry: Average 0.243 0.602 1.01 259 Range 023-0.26 056-0 65 0 97-1.07 2.39-281 COV (44) (4.3) (3.7) (4.5)
Kiln dry: Average 0 250 0601 1.01 258 Range 0 23-0 27 0 54-0 64 0 93-1.10 2.41-272 COV
CCA-I (39) (44) (4.5) (3.6)
Air dry: Average 0247 0 604 1 00 2.57 Range 0 23-0 26 055-067 0 92-1.10 233-2.74 COV (3.9) (50) (40) (4.2)
Kiln dry: Average 0248 0 601 1 01 2.53 Range 0 23-0 26 0.57-065 0 95-1 09 2.35-2.78 COV
CCA-II (32) (39) (39) (43)
Air dry Average 0 247 0 605 1 00 258 Range 0 23-0 27 0 56-0 65 0.93-1.08 2.38-2 81 COV (4 7) (46) (4.2) (4.4)
Kiln dry Average 0 250 0 601 1 00 255 Range 0 23-0 27 0 550 64 0 91-1 07 2 32-2 72 COV (3 8) (3 7) (41) (46)
The sticks were kiln dried to a target MC of 14 to 16 percent using a maximum dry bulb temperature of 120°F with no wet bulb control, and then brought to equilibrium in a room controlled at 74°F and 65 percent RH (approximately 12 pet EMC).
The sticks were machined to a 1-inch square cross section, the ring orientation trued in the process, and cut into 16- inch lengths, excluding any strength-reducing growth characteristics such as knots and cross grain. From this stock of 1- X 1- X 16-inch specimens the required 680 were selected for uniformity of growth rate and percentage of latewood and for freedom from any small defects that may have been overlooked.
Fifty specimens were randomly assigned to each pair of experimental cells (air vs. kiln drying) that were to receive the same preservative system and level of salt loading (including the water-treated controls), and 30 specimens were assigned to the untreated control group After treatment, each group of 50 specimens was randomly subdivided for the two levels of drying. (Because of the batch nature of the processing, our replicates" are not true replicates. However, the carefully controlled nature of the treating and drying processes leads us to believe that between batch variation is of the same order as within batch variation. The analyses of variance support this belief (table A1).)
Treatment
The compositions of the waterborne salt preservative systems were.
• Ammoniacal copper arsenate pet Copper as CuO 49.8 Arsenic as As205 50.2 • Chromated copper arsenate. type I Chromium as Cr03 61.0 Copper as CuO 17.0 Arsenic as As205 22.0 • Chromated copper arsenate, type II Chromium as Cr03 35.3 Copper as CuO 19.6 Arsenic as As205 45.1
The recommended practice for full-cell treatment was followed (6). An initial vacuum of 27 inches was held for Vj hour, and following solution flow-in at ambient temperatures, a pressure of 150 lb/in.2 was applied for 2 hours.
Specimens were weighed and measured before treatment and weighed again after treatment. The concentration of salt solutions required to attain the target loadings was based upon the weight gam of the watertreated controls and specimen dimensions The 12 separate treatment runs required for the combinations of 3 preservative systems and 4 retention levels were conducted in random order.
13
F
Salt loadings were calculated by
R = 3.81C(WTB - WJ
IXwXd (1)
where R • salt loading (lb/ft3) WTB = weight, treated (grams) Wu = weight, untreated (grams)
C = solution concentration (weight of salt/weight water plus salt)
l,w,d = length, width, and depth of specimen (inches).
Average salt loadings attained for each experimental cell were very close to target retention levels (table A1). The greatest deviations from target loadings occurred at the 2.5 lb/ft3 treatment where average retention levels ranged from 2.53 to 2.59 lb/ft3 for the six experimental cells treated to that level. Within-cell variation in treatment was also relatively uniform as coefficients of variation were typically 3.5 to 4.5 percent (table A1).
Drying An Drying Specimens designated for air drying were stickered and initially exposed to ambient conditions controlled at 80°F and 90 percent RH for 3 weeks. These specimens were then moved to an environment controlled at 74°F and 65 percent RH and allowed to come to equilibrium.
Kiln Drying When the study began, industry representatives told us that it was common practice to limit temperatures to 140°F while kiln drying piles treated with waterborne salt preservative. The drying time for piles was said to be about 10 days. Because our specimens were so small and would dry so rapidly, a procedure was needed to retard drying to simulate industrial drying practices.
In the kiln, the specimens were stickered and then wrapped and sealed with polyethelene. The polyethelene was supported so that it did not touch any part of the specimens. Ten extra treated specimens were stickered outside of the polyethelene wrap.
The kiln was then operated continuously at 140°F for 10 days. A 5° wet-bulb depression was maintained to minimize vapor transmission through the polyethelene wrap. By closely monitoring the weights of the specimens outside the wrap, we determined that these specimens dried to about 20 percent MC in 48 hours. Thus, after 8 days the wrap was removed permitting the test specimen to dry within the desired 10-day heating period.
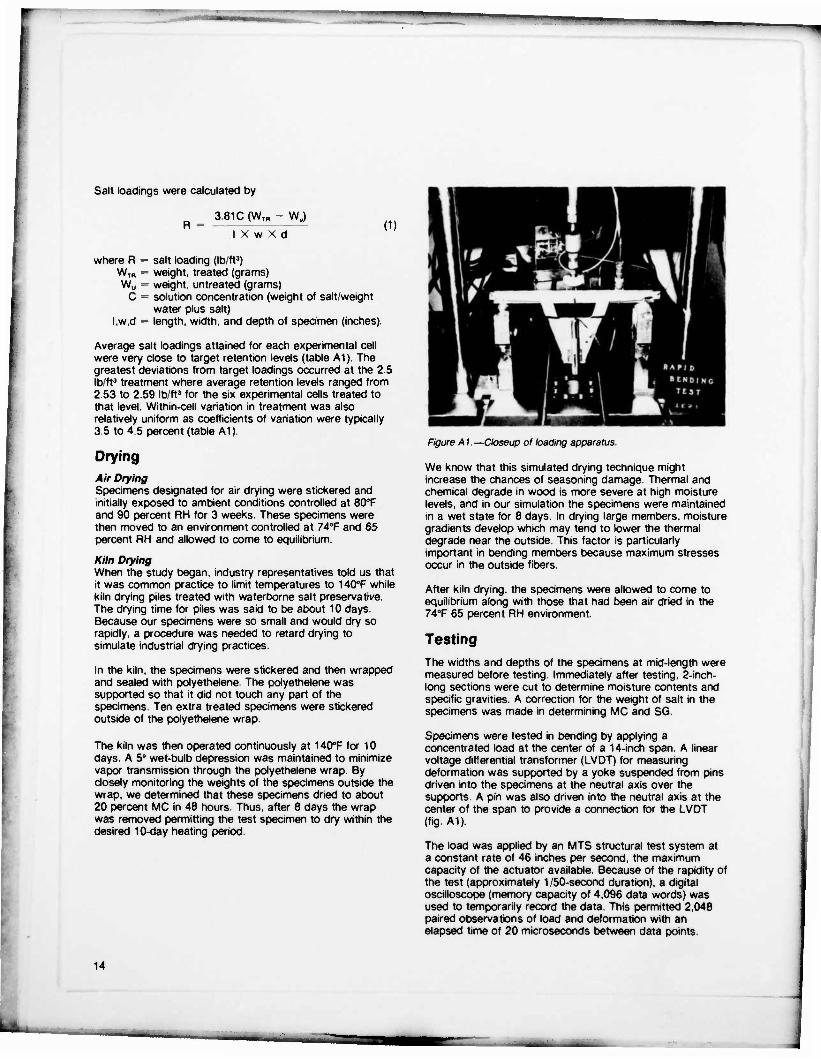
Figure A1—Closeup of loading apparatus.
We know that this simulated drying technique might increase the chances of seasoning damage. Thermal and chemical degrade in wood is more severe at high moisture levels, and in our simulation the specimens were maintained in a wet state for 8 days. In drying large members, moisture gradients develop which may tend to lower the thermal degrade near the outside. This factor is particularly important in bending members because maximum stresses occur in the outside fibers.
After kiln drying, the specimens were allowed to come to equilibrium along with those that had been air dried in the 74°F 65 percent RH environment.
Testing
The widths and depths of the specimens at mid-length were measured before testing. Immediately after testing, 2-inch- long sections were cut to determine moisture contents and specific gravities. A correction for the weight of salt in the specimens was made in determining MC and SG.
Specimens were tested in bending by applying a concentrated load at the center of a 14-inch span. A linear voltage differential transformer (LVDT) for measuring deformation was supported by a yoke suspended from pins driven into the specimens at the neutral axis over the supports. A pin was also driven into the neutral axis at the center of the span to provide a connection for the LVDT (fig. A1).
The load was applied by an MTS structural test system at a constant rate of 46 inches per second, the maximum capacity of the actuator available. Because of the rapidity of the test (approximately 1 /50-second duration), a digital oscilloscope (memory capacity of 4,096 data words) was used to temporarily record the data. This permitted 2.048 paired observations of load and deformation with an elapsed time of 20 microseconds between data points.
14
.—
High speed photography was used to study the test in progress to assure that the deformation data was accurate. We learned in trial runs that excessive noise in the load- deformation trace was caused by vibration of the pin connecting the LVDT to the specimen. Increasingly larger diameter pins were tried until no further vibration of the pin could be detected by photography. Photography also showed that minimizing the tolerance between the pin diameter and the hole diameter in the stem of the LVDT reduced the extraneous noise in the load-deformation trace. Further, a slight preload greatly reduced the shock and subsequent vibration in the specimen and equipment that was apparent when no preload was applied. A typical load- deformation data trace is shown in figure A2.
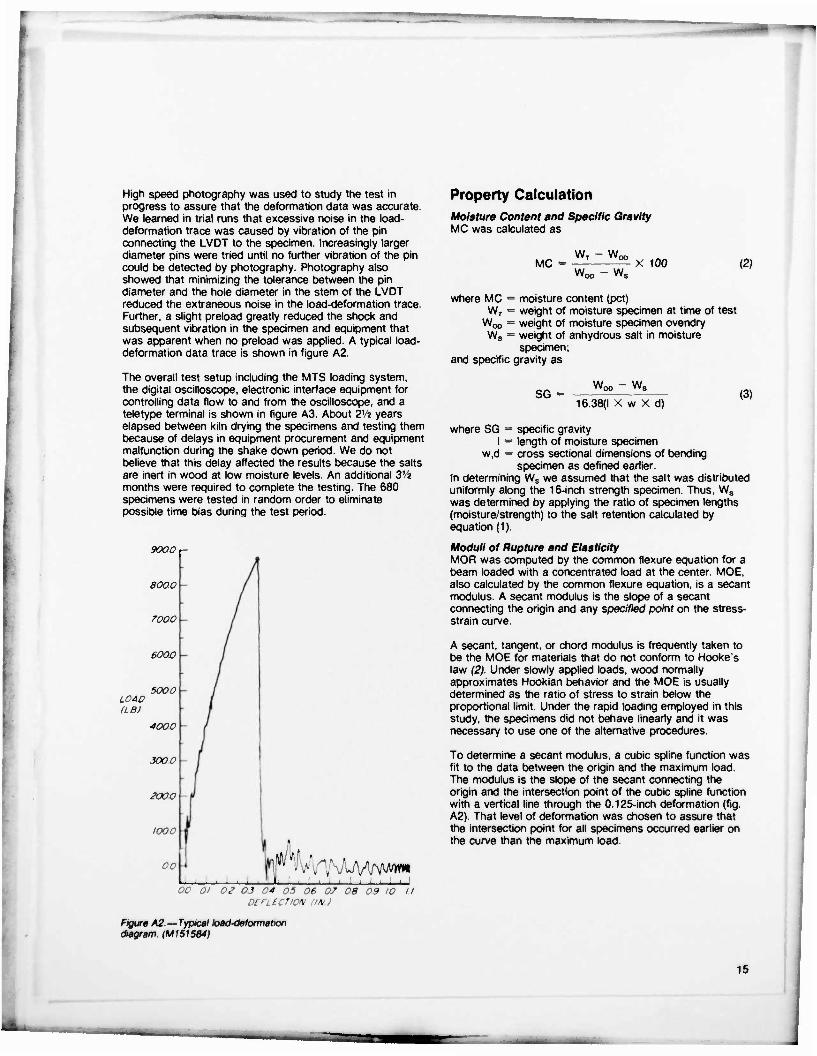
The overall test setup including the MTS loading system, the digital oscilloscope, electronic interface equipment for controlling data flow to and from the oscilloscope, and a teletype terminal is shown in figure A3. About 2V2 years elapsed between kiln drying the specimens and testing them because of delays in equipment procurement and equipment malfunction during the shake down period. We do not believe that this delay affected the results because the salts are inert in wood at low moisture levels. An additional 3'/? months were required to complete the testing. The 680 specimens were tested in random order to eliminate possible time bias during the test period.
9000<-
8000
7000
600O -
LOAD (LB)
5000 -
4000
3O00
eooo
1000
00
I. ., , ,...!, 1 j hj OO 01 0^ 03 01 05 O6 07 08 09 10 II
Deri ecTioN (m 1
Figure A2—Typical toad-deformation diagram (M1S15S4)
Property Calculation Moisture Content and Specific Gravity MC was calculated as
MC - WT - W0
W0 Ws X tOO (2)
where MC = moisture content (pet) WT = weight of moisture specimen at time of test
Woo = weight of moisture specimen ovendry Ws = weight of anhydrous salt in moisture
specimen; and specific gravity as
SG = w0 ws
16.38(1 X w X d) (3)
where SG = specific gravity I = length of moisture specimen
w,d = cross sectional dimensions of bending specimen as defined earlier.
In determining Ws we assumed that the salt was distributed uniformly along the 16-inch strength specimen. Thus, Ws was determined by applying the ratio of specimen lengths (moisture/strength) to the salt retention calculated by equation (1).
Moduli of Rupture and Elasticity MOR was computed by the common flexure equation for a beam loaded with a concentrated load at the center. MOE, also calculated by the common flexure equation, is a secant modulus. A secant modulus is the slope of a secant connecting the origin and any specified point on the stress- strain curve.
A secant, tangent, or chord modulus is frequently taken to be the MOE for materials that do not conform to Hooke's law (2). Under slowly applied loads, wood normally approximates Hookian behavior and the MOE is usually determined as the ratio of stress to strain below the proportional limit. Under the rapid loading employed in this study, the specimens did not behave linearly and it was necessary to use one of the alternative procedures.
To determine a secant modulus, a cubic spline function was fit to the data between the origin and the maximum load. The modulus is the slope of the secant connecting the origin and the intersection point of the cubic spline function with a vertical line through the 0.125-inch deformation (fig. A2). That level of deformation was chosen to assure that the intersection point for all specimens occurred earlier on the curve than the maximum load.
15
.

^
The secant modulus may not necessarily measure precisely the same material characteristic as the MOE determined by the standard test (4,5). However, the two properties probably respond similarly to treatment. Thus, the secant modulus can be used as an index of the effects that the various treatments used in this study have on the standard MOE.
Work to Maximum Load The energy absorbed by the specimen as it was loaded to failure (work to maximum load) was determined by numerical integration of the area under the stress-strain curve to maximum load (9) (fig. A2) For nine specimens, the areas were also measured with a planimeter which assure that the numerical integration could be used without introducing bias in the results
Figure A3 —Overall view of test equipment (M144969-6)
2.5-9/83
16 4H> S GOVERNMENT PRINTING OFFICE 198 3 6 5 M 025 m>m
J

U.S. Forest Products Laboratory
Mechanical Properties of longleaf pine treated with waterborne salt preservatives
16 p. (USDA For. Serv Res. Pap. FPL 434).
In small clear specimens of longleaf pine sapwood. neither ammonium chromated arsenate (ACA) nor chromated copper arsenate (CCA) preservatives adversely affect the modulus of elasticity of wood either air or kiln dried after treatment to retentions from 0.25 to 2.5 lb/ft3 ACA has no effect on MOP,, but CCA-type preservatives vary in their adverse effects which may be aggravated by kiln drying Work to maximum load is adversely affected by all preservatives tested but least by ACA. The study showed that kiln drying at 140°F can adversely affect the mechanical properties of wood treated with certain waterborne preservatives.
Keywords: Preservatives, CCA treatment, ACA treatment, southern pine, mechanical properties, strength properties
_