Embed Size (px)
Citation preview
LONGLEAF PARTNERS FUNDSSM
QUARTERLY REPORT
a t M a r c h 3 1 , 2 0 0 0
PARTNERS FUND
INTERNATIONAL FUND
REALTY FUND
SMALL-CAP FUND
MANAGED BY:SOUTHEASTERN ASSET MANAGEMENT, INC.
Memphis, TN
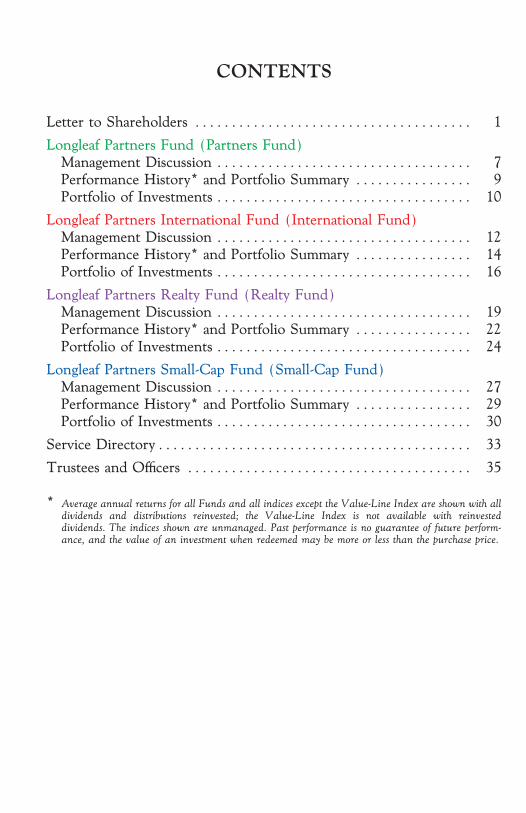
CONTENTS
Letter to Shareholders ÏÏÏÏÏÏÏÏÏÏÏÏÏÏÏÏÏÏÏÏÏÏÏÏÏÏÏÏÏÏÏÏÏÏÏÏÏÏ 1
Longleaf Partners Fund (Partners Fund)
Management Discussion ÏÏÏÏÏÏÏÏÏÏÏÏÏÏÏÏÏÏÏÏÏÏÏÏÏÏÏÏÏÏÏÏÏÏÏ 7
Performance History* and Portfolio Summary ÏÏÏÏÏÏÏÏÏÏÏÏÏÏÏÏ 9
Portfolio of Investments ÏÏÏÏÏÏÏÏÏÏÏÏÏÏÏÏÏÏÏÏÏÏÏÏÏÏÏÏÏÏÏÏÏÏÏ 10
Longleaf Partners International Fund (International Fund)
Management Discussion ÏÏÏÏÏÏÏÏÏÏÏÏÏÏÏÏÏÏÏÏÏÏÏÏÏÏÏÏÏÏÏÏÏÏÏ 12
Performance History* and Portfolio Summary ÏÏÏÏÏÏÏÏÏÏÏÏÏÏÏÏ 14
Portfolio of Investments ÏÏÏÏÏÏÏÏÏÏÏÏÏÏÏÏÏÏÏÏÏÏÏÏÏÏÏÏÏÏÏÏÏÏÏ 16
Longleaf Partners Realty Fund (Realty Fund)
Management Discussion ÏÏÏÏÏÏÏÏÏÏÏÏÏÏÏÏÏÏÏÏÏÏÏÏÏÏÏÏÏÏÏÏÏÏÏ 19
Performance History* and Portfolio Summary ÏÏÏÏÏÏÏÏÏÏÏÏÏÏÏÏ 22
Portfolio of Investments ÏÏÏÏÏÏÏÏÏÏÏÏÏÏÏÏÏÏÏÏÏÏÏÏÏÏÏÏÏÏÏÏÏÏÏ 24
Longleaf Partners Small-Cap Fund (Small-Cap Fund)
Management Discussion ÏÏÏÏÏÏÏÏÏÏÏÏÏÏÏÏÏÏÏÏÏÏÏÏÏÏÏÏÏÏÏÏÏÏÏ 27
Performance History* and Portfolio Summary ÏÏÏÏÏÏÏÏÏÏÏÏÏÏÏÏ 29
Portfolio of Investments ÏÏÏÏÏÏÏÏÏÏÏÏÏÏÏÏÏÏÏÏÏÏÏÏÏÏÏÏÏÏÏÏÏÏÏ 30
Service DirectoryÏÏÏÏÏÏÏÏÏÏÏÏÏÏÏÏÏÏÏÏÏÏÏÏÏÏÏÏÏÏÏÏÏÏÏÏÏÏÏÏÏÏÏ 33
Trustees and OÇcers ÏÏÏÏÏÏÏÏÏÏÏÏÏÏÏÏÏÏÏÏÏÏÏÏÏÏÏÏÏÏÏÏÏÏÏÏÏÏÏ 35
* Average annual returns for all Funds and all indices except the Value-Line Index are shown with alldividends and distributions reinvested; the Value-Line Index is not available with reinvesteddividends. The indices shown are unmanaged. Past performance is no guarantee of future perform-ance, and the value of an investment when redeemed may be more or less than the purchase price.
Longleaf Partners FundsLETTER TO SHAREHOLDERS
TO OUR SHAREHOLDERS:
In the twenty-Ñve year history of Southeastern Asset Management, we have
aggressively pursued additional assets from new and existing clients in the
Partners Fund universe three times Ì late 1987, 1990, and October of 1998. We
have otherwise been indiÅerent to inÖows or have closed the Fund when
qualifying investments with the required margins of safety were diÇcult to Ñnd.
In the current environment where many already discounted stocks are under
further pressure from value managers who are liquidating holdings, Longleaf sees
signiÑcant opportunity. For the fourth time in our Ñrm's history we are encourag-
ing our existing partners to add aggressively to their Longleaf investments, and we
are pursuing new shareholders as well. Many of our institutional clients have
added to their accounts with the gains they have captured from their technology
holdings. We believe that Longleaf's return opportunities are signiÑcant, and the
attendant risks are minimal. We are convinced that partners who invest today will
be as satisÑed with their long-term results as those shareholders who invested in
late 1987, the fourth quarter of 1990, and October of 1998.
The Risk
While some use volatility measures such as standard deviation to measure risk,
most thoughtful long-term investors equate risk with the probability of perma-
nently losing capital. In today's extremely bifurcated market where a handful of
excessively valued companies dominate indices, our holdings have demonstrable
intrinsic values which are materially greater than their share prices.
Much has been written about the resemblance of today's market to the early
1970's when Ñfty stocks known as the ""Nifty Fifty'' ruled that equity environ-
ment. In an article on February 24, 2000 the Wall Street Journal drew a striking
comparison. At the end of 1972 the top 20% highest priced stocks of the S&P
500 sold for a median P/E of 33.9 while the remaining 80% sold for 12.3X. The
contrast in today's market is more extreme. The top 20% of the S&P 500 sells for
over 70X earnings, and the lower 80% sells for a P/E of less than 15. Today's
""Nifty Fifty'' equivalents are Internet related and biotech businesses. In 1999 the
68 technology stocks in the S&P 500 returned 131% while the remaining 432
companies were up less than 2%. The Ñrst quarter of 2000 has been a continua-
tion of this polarity.
Historically, those who owned stocks which sold at large premiums to their
underlying business values paid dearly. Shareholders who did not cash in their
gains from the ""Nifty Fifty's'' run through 1972, or worse, speculators who
1
Longleaf Partners FundsLETTER TO SHAREHOLDERS
chased the good performance and bought those companies as they approached
their peaks, had dismal results. Within two years many of the ""Nifty Fifty''
owners had lost 50Ó80% of their capital by the time the market bottomed in late
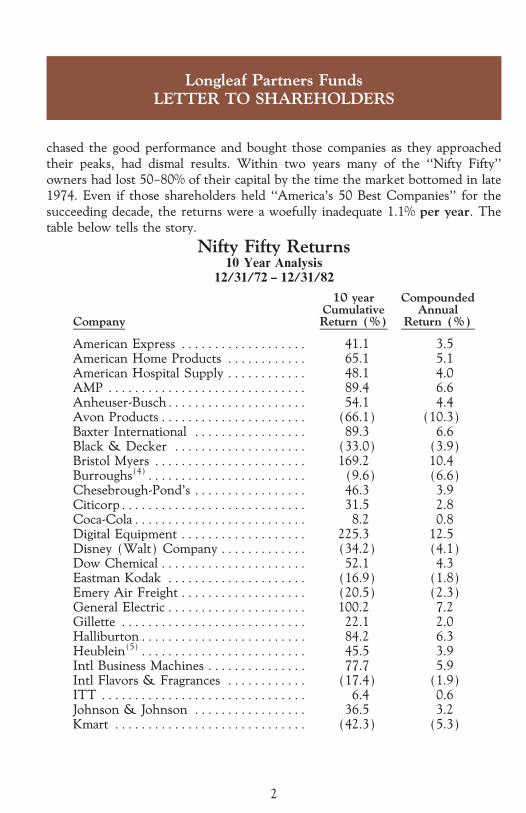
1974. Even if those shareholders held ""America's 50 Best Companies'' for the
succeeding decade, the returns were a woefully inadequate 1.1% per year. The
table below tells the story.
Nifty Fifty Returns10 Year Analysis
12/31/72 Ó 12/31/82
10 year CompoundedCumulative Annual
Company Return (%) Return (%)
American Express ÏÏÏÏÏÏÏÏÏÏÏÏÏÏÏÏÏÏÏ 41.1 3.5American Home Products ÏÏÏÏÏÏÏÏÏÏÏÏ 65.1 5.1American Hospital Supply ÏÏÏÏÏÏÏÏÏÏÏÏ 48.1 4.0AMP ÏÏÏÏÏÏÏÏÏÏÏÏÏÏÏÏÏÏÏÏÏÏÏÏÏÏÏÏÏÏ 89.4 6.6Anheuser-BuschÏÏÏÏÏÏÏÏÏÏÏÏÏÏÏÏÏÏÏÏÏ 54.1 4.4Avon ProductsÏÏÏÏÏÏÏÏÏÏÏÏÏÏÏÏÏÏÏÏÏÏ (66.1) (10.3)Baxter International ÏÏÏÏÏÏÏÏÏÏÏÏÏÏÏÏÏ 89.3 6.6Black & Decker ÏÏÏÏÏÏÏÏÏÏÏÏÏÏÏÏÏÏÏÏ (33.0) (3.9)Bristol Myers ÏÏÏÏÏÏÏÏÏÏÏÏÏÏÏÏÏÏÏÏÏÏÏ 169.2 10.4Burroughs(4)ÏÏÏÏÏÏÏÏÏÏÏÏÏÏÏÏÏÏÏÏÏÏÏÏ (9.6) (6.6)Chesebrough-Pond's ÏÏÏÏÏÏÏÏÏÏÏÏÏÏÏÏÏ 46.3 3.9CiticorpÏÏÏÏÏÏÏÏÏÏÏÏÏÏÏÏÏÏÏÏÏÏÏÏÏÏÏÏ 31.5 2.8Coca-ColaÏÏÏÏÏÏÏÏÏÏÏÏÏÏÏÏÏÏÏÏÏÏÏÏÏÏ 8.2 0.8Digital Equipment ÏÏÏÏÏÏÏÏÏÏÏÏÏÏÏÏÏÏÏ 225.3 12.5Disney (Walt) Company ÏÏÏÏÏÏÏÏÏÏÏÏÏ (34.2) (4.1)Dow Chemical ÏÏÏÏÏÏÏÏÏÏÏÏÏÏÏÏÏÏÏÏÏÏ 52.1 4.3Eastman Kodak ÏÏÏÏÏÏÏÏÏÏÏÏÏÏÏÏÏÏÏÏÏ (16.9) (1.8)Emery Air Freight ÏÏÏÏÏÏÏÏÏÏÏÏÏÏÏÏÏÏÏ (20.5) (2.3)General ElectricÏÏÏÏÏÏÏÏÏÏÏÏÏÏÏÏÏÏÏÏÏ 100.2 7.2Gillette ÏÏÏÏÏÏÏÏÏÏÏÏÏÏÏÏÏÏÏÏÏÏÏÏÏÏÏÏ 22.1 2.0HalliburtonÏÏÏÏÏÏÏÏÏÏÏÏÏÏÏÏÏÏÏÏÏÏÏÏÏ 84.2 6.3Heublein(5)ÏÏÏÏÏÏÏÏÏÏÏÏÏÏÏÏÏÏÏÏÏÏÏÏÏ 45.5 3.9Intl Business Machines ÏÏÏÏÏÏÏÏÏÏÏÏÏÏÏ 77.7 5.9Intl Flavors & Fragrances ÏÏÏÏÏÏÏÏÏÏÏÏ (17.4) (1.9)ITT ÏÏÏÏÏÏÏÏÏÏÏÏÏÏÏÏÏÏÏÏÏÏÏÏÏÏÏÏÏÏÏ 6.4 0.6Johnson & Johnson ÏÏÏÏÏÏÏÏÏÏÏÏÏÏÏÏÏ 36.5 3.2Kmart ÏÏÏÏÏÏÏÏÏÏÏÏÏÏÏÏÏÏÏÏÏÏÏÏÏÏÏÏÏ (42.3) (5.3)
2
Longleaf Partners FundsLETTER TO SHAREHOLDERS
10 year CompoundedCumulative Annual
Company Return (%) Return (%)
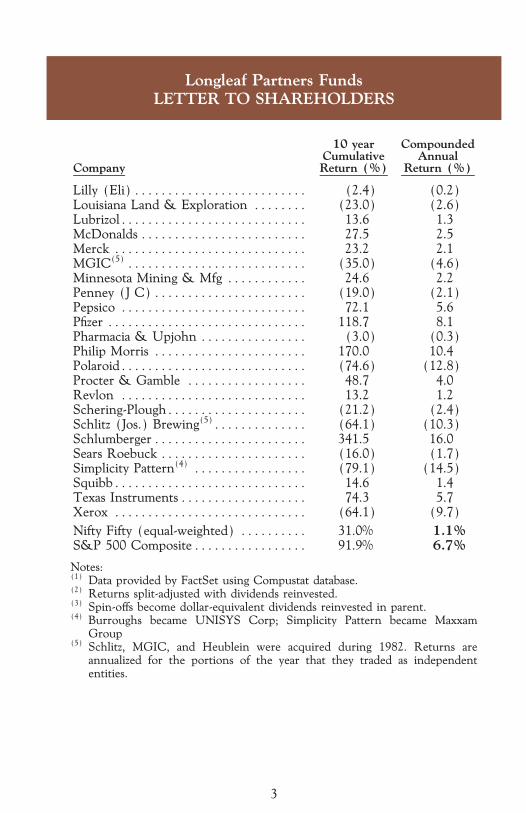
Lilly (Eli)ÏÏÏÏÏÏÏÏÏÏÏÏÏÏÏÏÏÏÏÏÏÏÏÏÏÏ (2.4) (0.2)Louisiana Land & Exploration ÏÏÏÏÏÏÏÏ (23.0) (2.6)LubrizolÏÏÏÏÏÏÏÏÏÏÏÏÏÏÏÏÏÏÏÏÏÏÏÏÏÏÏÏ 13.6 1.3McDonalds ÏÏÏÏÏÏÏÏÏÏÏÏÏÏÏÏÏÏÏÏÏÏÏÏÏ 27.5 2.5Merck ÏÏÏÏÏÏÏÏÏÏÏÏÏÏÏÏÏÏÏÏÏÏÏÏÏÏÏÏÏ 23.2 2.1MGIC(5) ÏÏÏÏÏÏÏÏÏÏÏÏÏÏÏÏÏÏÏÏÏÏÏÏÏÏÏ (35.0) (4.6)Minnesota Mining & Mfg ÏÏÏÏÏÏÏÏÏÏÏÏ 24.6 2.2Penney (J C)ÏÏÏÏÏÏÏÏÏÏÏÏÏÏÏÏÏÏÏÏÏÏÏ (19.0) (2.1)Pepsico ÏÏÏÏÏÏÏÏÏÏÏÏÏÏÏÏÏÏÏÏÏÏÏÏÏÏÏÏ 72.1 5.6PÑzer ÏÏÏÏÏÏÏÏÏÏÏÏÏÏÏÏÏÏÏÏÏÏÏÏÏÏÏÏÏÏ 118.7 8.1Pharmacia & Upjohn ÏÏÏÏÏÏÏÏÏÏÏÏÏÏÏÏ (3.0) (0.3)Philip Morris ÏÏÏÏÏÏÏÏÏÏÏÏÏÏÏÏÏÏÏÏÏÏÏ 170.0 10.4PolaroidÏÏÏÏÏÏÏÏÏÏÏÏÏÏÏÏÏÏÏÏÏÏÏÏÏÏÏÏ (74.6) (12.8)Procter & Gamble ÏÏÏÏÏÏÏÏÏÏÏÏÏÏÏÏÏÏ 48.7 4.0Revlon ÏÏÏÏÏÏÏÏÏÏÏÏÏÏÏÏÏÏÏÏÏÏÏÏÏÏÏÏ 13.2 1.2Schering-PloughÏÏÏÏÏÏÏÏÏÏÏÏÏÏÏÏÏÏÏÏÏ (21.2) (2.4)Schlitz (Jos.) Brewing(5)ÏÏÏÏÏÏÏÏÏÏÏÏÏÏ (64.1) (10.3)SchlumbergerÏÏÏÏÏÏÏÏÏÏÏÏÏÏÏÏÏÏÏÏÏÏÏ 341.5 16.0Sears Roebuck ÏÏÏÏÏÏÏÏÏÏÏÏÏÏÏÏÏÏÏÏÏÏ (16.0) (1.7)Simplicity Pattern(4) ÏÏÏÏÏÏÏÏÏÏÏÏÏÏÏÏÏ (79.1) (14.5)SquibbÏÏÏÏÏÏÏÏÏÏÏÏÏÏÏÏÏÏÏÏÏÏÏÏÏÏÏÏÏ 14.6 1.4Texas InstrumentsÏÏÏÏÏÏÏÏÏÏÏÏÏÏÏÏÏÏÏ 74.3 5.7Xerox ÏÏÏÏÏÏÏÏÏÏÏÏÏÏÏÏÏÏÏÏÏÏÏÏÏÏÏÏÏ (64.1) (9.7)
Nifty Fifty (equal-weighted) ÏÏÏÏÏÏÏÏÏÏ 31.0% 1.1%S&P 500 CompositeÏÏÏÏÏÏÏÏÏÏÏÏÏÏÏÏÏ 91.9% 6.7%
Notes:(1) Data provided by FactSet using Compustat database.(2) Returns split-adjusted with dividends reinvested.(3) Spin-oÅs become dollar-equivalent dividends reinvested in parent.(4) Burroughs became UNISYS Corp; Simplicity Pattern became Maxxam
Group(5) Schlitz, MGIC, and Heublein were acquired during 1982. Returns are
annualized for the portions of the year that they traded as independententities.
3
Longleaf Partners FundsLETTER TO SHAREHOLDERS
Following a comfortable consensus of owning everyone's favorite stocks almost
always hurts your Ñnancial health in the long run. The market over the long-term
properly prices businesses. Holding overvalued stocks exposes capital to extreme
danger.
The Return Opportunity
At the end of the Ñrst quarter, all four Longleaf portfolios are selling at
approximately half of our appraisals of their intrinsic or private market values.
These discounts imply over a 100% return should these businesses reach our
appraisals because the corporate values are building through the retention and
reinvestment of net cash earnings. Even if it takes Ñve years for the values to get
recognized, the return opportunities are substantial.
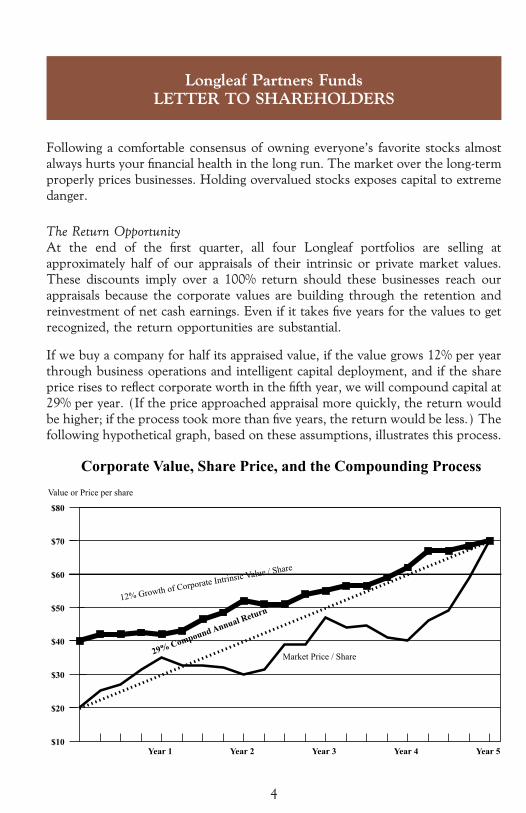
If we buy a company for half its appraised value, if the value grows 12% per year
through business operations and intelligent capital deployment, and if the share
price rises to reÖect corporate worth in the Ñfth year, we will compound capital at
29% per year. (If the price approached appraisal more quickly, the return would
be higher; if the process took more than Ñve years, the return would be less.) The
following hypothetical graph, based on these assumptions, illustrates this process.
4
Longleaf Partners FundsLETTER TO SHAREHOLDERS
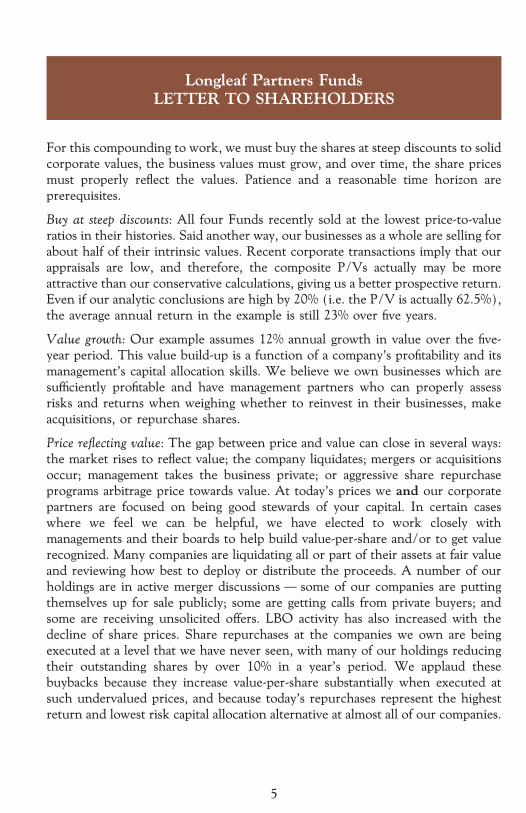
For this compounding to work, we must buy the shares at steep discounts to solid
corporate values, the business values must grow, and over time, the share prices
must properly reÖect the values. Patience and a reasonable time horizon are
prerequisites.
Buy at steep discounts: All four Funds recently sold at the lowest price-to-value
ratios in their histories. Said another way, our businesses as a whole are selling for
about half of their intrinsic values. Recent corporate transactions imply that our
appraisals are low, and therefore, the composite P/Vs actually may be more
attractive than our conservative calculations, giving us a better prospective return.
Even if our analytic conclusions are high by 20% (i.e. the P/V is actually 62.5%),
the average annual return in the example is still 23% over Ñve years.
Value growth: Our example assumes 12% annual growth in value over the Ñve-
year period. This value build-up is a function of a company's proÑtability and its
management's capital allocation skills. We believe we own businesses which are
suÇciently proÑtable and have management partners who can properly assess
risks and returns when weighing whether to reinvest in their businesses, make
acquisitions, or repurchase shares.
Price reÖecting value: The gap between price and value can close in several ways:
the market rises to reÖect value; the company liquidates; mergers or acquisitions
occur; management takes the business private; or aggressive share repurchase
programs arbitrage price towards value. At today's prices we and our corporate
partners are focused on being good stewards of your capital. In certain cases
where we feel we can be helpful, we have elected to work closely with
managements and their boards to help build value-per-share and/or to get value
recognized. Many companies are liquidating all or part of their assets at fair value
and reviewing how best to deploy or distribute the proceeds. A number of our
holdings are in active merger discussions Ì some of our companies are putting
themselves up for sale publicly; some are getting calls from private buyers; and
some are receiving unsolicited oÅers. LBO activity has also increased with the
decline of share prices. Share repurchases at the companies we own are being
executed at a level that we have never seen, with many of our holdings reducing
their outstanding shares by over 10% in a year's period. We applaud these
buybacks because they increase value-per-share substantially when executed at
such undervalued prices, and because today's repurchases represent the highest
return and lowest risk capital allocation alternative at almost all of our companies.
5
Longleaf Partners FundsLETTER TO SHAREHOLDERS
To summarize, your partners at Southeastern have aggressively invested in the
Longleaf Funds. We are convinced our returns from today's price levels will be
exceptional and the concomitant and comparative risks are negligible.
Shareholder Meeting
Our annual gathering of shareholders will be Wednesday, May 10 at 5:30 p.m. at
the Memphis Botanic Garden. We hope to see many of you there. We look
forward to reviewing the opportunities in each of the Longleaf portfolios.
www.longleafpartners.com
We have received numerous visitors at www.longleafpartners.com and appreciate
your interest. An audio replay of the shareholder meeting presentations should
be available on the Web site by the end of May for those of you unable to attend.
Sincerely,
O. Mason Hawkins, CFA G. Staley Cates, CFA
Chairman & CEO President
6
Partners Fund - MANAGEMENT DISCUSSIONby Mason Hawkins, Staley Cates, and John Buford
In a frustrating quarter Longleaf Partners Fund declined 5.4% while the S&P 500
Index rose 2.3%. Although technology stocks faltered in the Ñnal days of March,
the quarter's results reÖect the contrast between dot.com valuations (NASDAQ
up 12.4%) and mainstream businesses (Dow Jones Industrial Average Ó4.7%).
Four holdings accounted for much of the Fund's decline Ì Waste Management,
Tricon, Knight Ridder, and Hilton. We remain conÑdent in our case on Waste
Management (see the previous two quarterly reports for details). The right CEO
is in place, industry fundamentals remain strong, and operating cash Öow is on
target, even before the company's systems are Ñxed well enough to enable Maury
Myers to optimize operations. With all the bad press hovering over the stock,
however, Wall Street will require a couple of good quarters before believing.
The negative sentiment towards Waste Management is similar to that surround-
ing Seagram when we bought it in 1997. We paid prices in the low-to-mid $30's
for Seagram in the face of unfavorable views of management. We believed the
negative assessment to be unwarranted, just as we view the current negative
opinion of WMI's management ""credibility'' due to the prior team as overdone.
A year after that Seagram purchase, although fundamentals remained sound, the
stock traded in the mid $20's, a sizable paper loss. Less than six months later in
the spring of 1999 Seagram had appreciated to $65, almost twice our cost, and we
sold the stock at our appraisal.
This comparison is not meant to suggest that we will double our money on WMI
in only six months. It does highlight how volatile stock prices are, how quickly
sentiment can change when justiÑed by fundamentals, and how we attempt to
take advantage of irrational swings between fear and greed. While the bad press is
one theory that has kept WMI at a steeply discounted price, negative PR is not
reason enough for us to walk away from attractive business characteristics and
signiÑcant undervaluation.
The Seagram experience also illustrates that big returns do not happen in a
straight line. If returns could be timed or if stocks rose in even increments, we
could wait for favorable price momentum and then jump in. Because the markets
do not accommodate this kind of wishful thinking, we must be early and patient.
Two of the other three ""laggards'' in the Ñrst quarter are operating exceptionally
well. Tricon's stock is weak because of horrible same-store comparisons that the
company will report for the Ñrst few months of this year. However, even with
those comps Tricon will report earnings and free cash Öow up over 20% in 2000,
after last year's 43% gain in EPS and 22% gain in free cash Öow. Due to this
amazing disconnect between business performance of their KFC, Pizza Hut, and
7
Partners Fund - MANAGEMENT DISCUSSIONby Mason Hawkins, Staley Cates, and John Buford
Taco Bell brands, and the stock price, management bought in a whopping 3
million shares in January alone.
Knight Ridder reported EPS up 20% in 1999 and will post a double digit gain
again this year, and was rewarded with a stock price drop. Like Tricon, KRI is
taking advantage of this drop by buying in substantial shares and thereby adding
even more to existing intrinsic value per share. KRI sells substantially below our
appraisal of around 9X EBITDA. Our conÑdence in that appraisal was boosted by
Tribune's agreement to pay 11X EBITDA for Times Mirror, which we believe
has lower growth characteristics and a weaker Web presence than Knight Ridder.
Hilton's stock has been weak due to poor performance at its Doubletree segment
and disappointing margins in 1999. The core properties and fee businesses,
however, are doing very well. The trophy hotels such as the Waldorf Astoria and
the Hawaiian Village are insulated from the industry's new supply threats, and
new hotel capacity is a positive rather than a negative for the fee businesses.
Management owns a substantial amount of the company, and Steve Bollenbach is
focused solely on building and recognizing value.
Our 13D Ñling on Aetna speaks for itself, and this is not the time to comment
further. In due course we will communicate the case in more detail.
While at the end of this quarter we report to you disappointing results, we also
report two things that we strongly believe will outweigh the current un-
derperformance over the long-term. First and most important, we have never
seen this kind of widespread undervaluation of Ñne businesses. Our composite
price-to-value ratio is below 50% for the Ñrst time ever, compared to a long-term
average in the high 60's. Just getting back to average would provide a return that
more than compensates for the past year, while putting us on a platform from
which we have historically generated high long-term absolute returns. Second, we
have never seen this level of company share repurchase activity. Almost every
company in the Fund is taking advantage of today's Ñre sale prices and adding
even more value to their shares by taking out sellers at prices way below fair
worth.
8
Partners Fund - PERFORMANCE HISTORYand PORTFOLIO SUMMARY
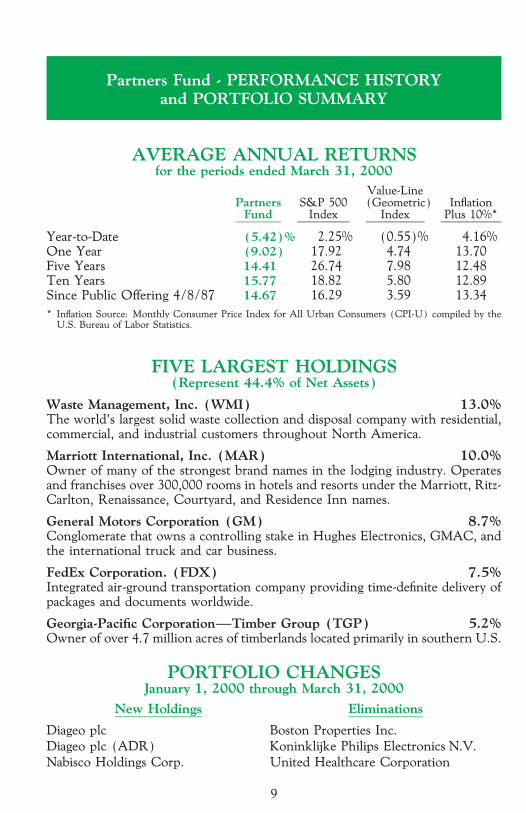
AVERAGE ANNUAL RETURNSfor the periods ended March 31, 2000
Value-LinePartners S&P 500 (Geometric) InÖation
Fund Index Index Plus 10%*
Year-to-Date (5.42)% 2.25% (0.55)% 4.16%One Year (9.02) 17.92 4.74 13.70Five Years 14.41 26.74 7.98 12.48Ten Years 15.77 18.82 5.80 12.89Since Public OÅering 4/8/87 14.67 16.29 3.59 13.34
* InÖation Source: Monthly Consumer Price Index for All Urban Consumers (CPI-U) compiled by theU.S. Bureau of Labor Statistics.
FIVE LARGEST HOLDINGS(Represent 44.4% of Net Assets)
Waste Management, Inc. (WMI) 13.0%The world's largest solid waste collection and disposal company with residential,commercial, and industrial customers throughout North America.
Marriott International, Inc. (MAR) 10.0%Owner of many of the strongest brand names in the lodging industry. Operatesand franchises over 300,000 rooms in hotels and resorts under the Marriott, Ritz-Carlton, Renaissance, Courtyard, and Residence Inn names.
General Motors Corporation (GM) 8.7%Conglomerate that owns a controlling stake in Hughes Electronics, GMAC, andthe international truck and car business.
FedEx Corporation. (FDX) 7.5%Integrated air-ground transportation company providing time-deÑnite delivery ofpackages and documents worldwide.
Georgia-PaciÑc CorporationÌTimber Group (TGP) 5.2%Owner of over 4.7 million acres of timberlands located primarily in southern U.S.
PORTFOLIO CHANGESJanuary 1, 2000 through March 31, 2000
New Holdings Eliminations
Diageo plc Boston Properties Inc.
Diageo plc (ADR) Koninklijke Philips Electronics N.V.
Nabisco Holdings Corp. United Healthcare Corporation
9
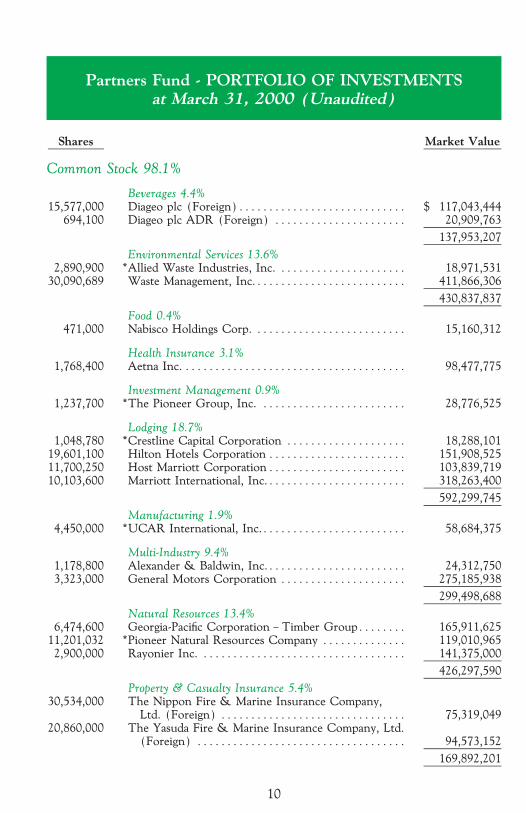
Partners Fund - PORTFOLIO OF INVESTMENTSat March 31, 2000 (Unaudited)
Shares Market Value
Common Stock 98.1%
Beverages 4.4%15,577,000 Diageo plc (Foreign)ÏÏÏÏÏÏÏÏÏÏÏÏÏÏÏÏÏÏÏÏÏÏÏÏÏÏÏÏ $ 117,043,444
694,100 Diageo plc ADR (Foreign) ÏÏÏÏÏÏÏÏÏÏÏÏÏÏÏÏÏÏÏÏÏÏ 20,909,763
137,953,207
Environmental Services 13.6%2,890,900 *Allied Waste Industries, Inc. ÏÏÏÏÏÏÏÏÏÏÏÏÏÏÏÏÏÏÏÏÏ 18,971,531
30,090,689 Waste Management, Inc.ÏÏÏÏÏÏÏÏÏÏÏÏÏÏÏÏÏÏÏÏÏÏÏÏÏ 411,866,306
430,837,837
Food 0.4%471,000 Nabisco Holdings Corp. ÏÏÏÏÏÏÏÏÏÏÏÏÏÏÏÏÏÏÏÏÏÏÏÏÏ 15,160,312
Health Insurance 3.1%1,768,400 Aetna Inc. ÏÏÏÏÏÏÏÏÏÏÏÏÏÏÏÏÏÏÏÏÏÏÏÏÏÏÏÏÏÏÏÏÏÏÏÏÏ 98,477,775
Investment Management 0.9%1,237,700 *The Pioneer Group, Inc. ÏÏÏÏÏÏÏÏÏÏÏÏÏÏÏÏÏÏÏÏÏÏÏÏ 28,776,525
Lodging 18.7%1,048,780 *Crestline Capital Corporation ÏÏÏÏÏÏÏÏÏÏÏÏÏÏÏÏÏÏÏÏ 18,288,101
19,601,100 Hilton Hotels Corporation ÏÏÏÏÏÏÏÏÏÏÏÏÏÏÏÏÏÏÏÏÏÏÏ 151,908,52511,700,250 Host Marriott CorporationÏÏÏÏÏÏÏÏÏÏÏÏÏÏÏÏÏÏÏÏÏÏÏ 103,839,71910,103,600 Marriott International, Inc.ÏÏÏÏÏÏÏÏÏÏÏÏÏÏÏÏÏÏÏÏÏÏÏ 318,263,400
592,299,745
Manufacturing 1.9%4,450,000 *UCAR International, Inc.ÏÏÏÏÏÏÏÏÏÏÏÏÏÏÏÏÏÏÏÏÏÏÏÏ 58,684,375
Multi-Industry 9.4%1,178,800 Alexander & Baldwin, Inc.ÏÏÏÏÏÏÏÏÏÏÏÏÏÏÏÏÏÏÏÏÏÏÏ 24,312,7503,323,000 General Motors Corporation ÏÏÏÏÏÏÏÏÏÏÏÏÏÏÏÏÏÏÏÏÏ 275,185,938
299,498,688
Natural Resources 13.4%6,474,600 Georgia-PaciÑc Corporation Ó Timber GroupÏÏÏÏÏÏÏÏ 165,911,625
11,201,032 *Pioneer Natural Resources Company ÏÏÏÏÏÏÏÏÏÏÏÏÏÏ 119,010,9652,900,000 Rayonier Inc. ÏÏÏÏÏÏÏÏÏÏÏÏÏÏÏÏÏÏÏÏÏÏÏÏÏÏÏÏÏÏÏÏÏÏ 141,375,000
426,297,590
Property & Casualty Insurance 5.4%30,534,000 The Nippon Fire & Marine Insurance Company,
Ltd. (Foreign) ÏÏÏÏÏÏÏÏÏÏÏÏÏÏÏÏÏÏÏÏÏÏÏÏÏÏÏÏÏÏÏ 75,319,04920,860,000 The Yasuda Fire & Marine Insurance Company, Ltd.
(Foreign) ÏÏÏÏÏÏÏÏÏÏÏÏÏÏÏÏÏÏÏÏÏÏÏÏÏÏÏÏÏÏÏÏÏÏÏ 94,573,152
169,892,201
10
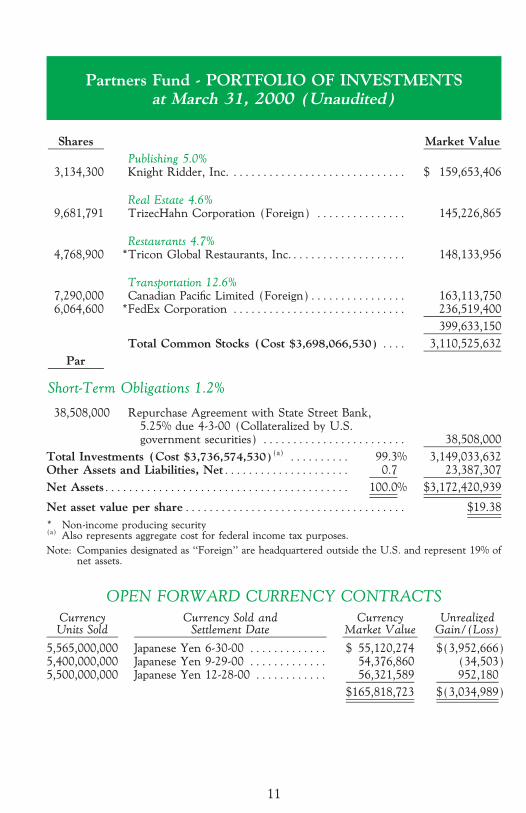
Partners Fund - PORTFOLIO OF INVESTMENTSat March 31, 2000 (Unaudited)
Shares Market Value
Publishing 5.0%3,134,300 Knight Ridder, Inc. ÏÏÏÏÏÏÏÏÏÏÏÏÏÏÏÏÏÏÏÏÏÏÏÏÏÏÏÏÏ $ 159,653,406
Real Estate 4.6%9,681,791 TrizecHahn Corporation (Foreign) ÏÏÏÏÏÏÏÏÏÏÏÏÏÏÏ 145,226,865
Restaurants 4.7%4,768,900 *Tricon Global Restaurants, Inc.ÏÏÏÏÏÏÏÏÏÏÏÏÏÏÏÏÏÏÏ 148,133,956
Transportation 12.6%7,290,000 Canadian PaciÑc Limited (Foreign)ÏÏÏÏÏÏÏÏÏÏÏÏÏÏÏÏ 163,113,7506,064,600 *FedEx Corporation ÏÏÏÏÏÏÏÏÏÏÏÏÏÏÏÏÏÏÏÏÏÏÏÏÏÏÏÏÏ 236,519,400
399,633,150
Total Common Stocks (Cost $3,698,066,530) ÏÏÏÏ 3,110,525,632
Par
Short-Term Obligations 1.2%
38,508,000 Repurchase Agreement with State Street Bank,5.25% due 4-3-00 (Collateralized by U.S.government securities) ÏÏÏÏÏÏÏÏÏÏÏÏÏÏÏÏÏÏÏÏÏÏÏÏ 38,508,000
Total Investments (Cost $3,736,574,530)(a) ÏÏÏÏÏÏÏÏÏÏ 99.3% 3,149,033,632Other Assets and Liabilities, NetÏÏÏÏÏÏÏÏÏÏÏÏÏÏÏÏÏÏÏÏÏ 0.7 23,387,307
Net AssetsÏÏÏÏÏÏÏÏÏÏÏÏÏÏÏÏÏÏÏÏÏÏÏÏÏÏÏÏÏÏÏÏÏÏÏÏÏÏÏÏÏ 100.0% $3,172,420,939
Net asset value per shareÏÏÏÏÏÏÏÏÏÏÏÏÏÏÏÏÏÏÏÏÏÏÏÏÏÏÏÏÏÏÏÏÏÏÏÏÏ $19.38
* Non-income producing security(a) Also represents aggregate cost for federal income tax purposes.
Note: Companies designated as ""Foreign'' are headquartered outside the U.S. and represent 19% ofnet assets.
OPEN FORWARD CURRENCY CONTRACTS
Currency Currency Sold and Currency UnrealizedUnits Sold Settlement Date Market Value Gain/(Loss)
5,565,000,000 Japanese Yen 6-30-00 ÏÏÏÏÏÏÏÏÏÏÏÏÏ $ 55,120,274 $(3,952,666)5,400,000,000 Japanese Yen 9-29-00 ÏÏÏÏÏÏÏÏÏÏÏÏÏ 54,376,860 (34,503)5,500,000,000 Japanese Yen 12-28-00 ÏÏÏÏÏÏÏÏÏÏÏÏ 56,321,589 952,180
$165,818,723 $(3,034,989)
11
International Fund - MANAGEMENT DISCUSSIONby Mason Hawkins, Staley Cates, and Andrew McDermott
The International Fund ended the Ñrst quarter up 2.1% versus a 0.4% decline for
the EAFE Index. International markets continue to track the U.S. market's
infatuation with technology, media, and telecommunications stocks. In the U.K.
and Japan, the focus is even more pronounced than in the U.S. This dichotomy,
which began to reverse in the last weeks of the quarter, allowed us to substantially
reshape the portfolio. We begin the second quarter with stronger brands, better
partners, and greater discounts between price and value than we ever thought
possible.
We bought Diageo, Molson, and Fairfax Holdings during the quarter. Diageo's
brands include the world's most popular collection of spirits (including Johnnie
Walker and SmirnoÅ), as well as Pillsbury, Burger King, and Guinness. Molson
has over 40% of the Canadian beer market and has been restructured by an
exceptional new management team. Fairfax Holdings' Prem Watsa has a reputa-
tion in the insurance industry matched only by Warren BuÅett. Watsa has an
outstanding long-term record as both an investor and an operator, and has
substantially all of his net worth invested in Fairfax. We purchased all three
businesses near their recent lows and at extreme discounts to intrinsic value.
We funded our purchases by selling appreciated holdings and through a process
of painful pruning. Bemrose, the Fund's fourth largest holding at year-end, nearly
tripled on the announcement of its restructuring program. We sold a portion of
our position at attractive prices. During the quarter we liquidated Wassall at our
appraisal prior to its takeover by KKR, and we sold our holding in Nippon
Broadcasting, another stock that tripled while we owned it.
In addition to realizing gains on these investments, we sold two small positions,
Banco Hipotecario and Jarvis Hotels, to concentrate in our best ideas. We
continued to emphasize those Japanese non-life investments with the best
combination of discount from appraisal and intelligent partners by selling Dai-
Tokyo and Yasuda Fire and Marine and increasing our stakes in Nippon Fire and
Nissan Fire. We also liquidated a proÑtable short position in Anglo American.
We rarely short securities in the Fund and will only do so as a hedge. We shorted
Anglo because we own De Beers whose two assets are its diamond business and a
40% stake in Anglo. The short sale allowed us to lock in a low price for De Beers'
diamond business.
The same forces that provided us opportunities to buy Diageo, Molson, and
Fairfax contributed to declines in many of the Fund's Ñnancial, transportation,
and consumer product stocks. With the exception of Sampo, our insurance
investments declined. Our three transportation related stocks, Canadian PaciÑc,
12
International Fund - MANAGEMENT DISCUSSIONby Mason Hawkins, Staley Cates, and Andrew McDermott
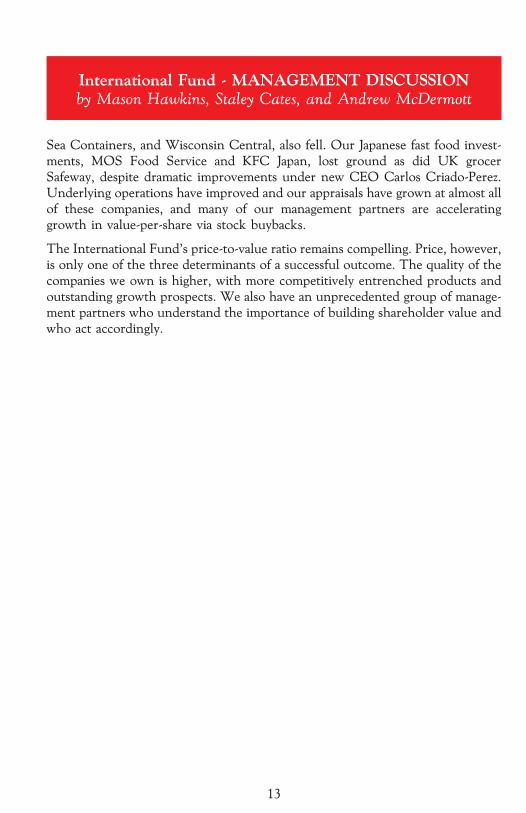
Sea Containers, and Wisconsin Central, also fell. Our Japanese fast food invest-
ments, MOS Food Service and KFC Japan, lost ground as did UK grocer
Safeway, despite dramatic improvements under new CEO Carlos Criado-Perez.
Underlying operations have improved and our appraisals have grown at almost all
of these companies, and many of our management partners are accelerating
growth in value-per-share via stock buybacks.
The International Fund's price-to-value ratio remains compelling. Price, however,
is only one of the three determinants of a successful outcome. The quality of the
companies we own is higher, with more competitively entrenched products and
outstanding growth prospects. We also have an unprecedented group of manage-
ment partners who understand the importance of building shareholder value and
who act accordingly.
13
International Fund - PERFORMANCE HISTORYand PORTFOLIO SUMMARY
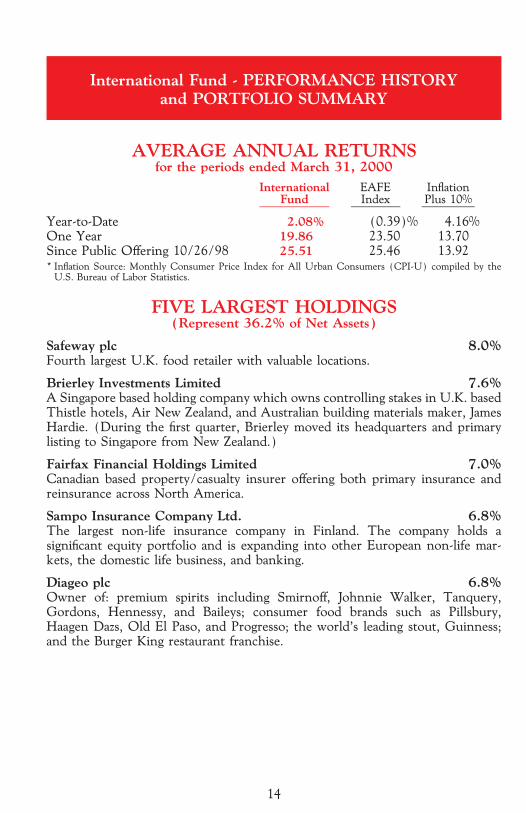
AVERAGE ANNUAL RETURNSfor the periods ended March 31, 2000
International EAFE InÖationFund Index Plus 10%
Year-to-Date 2.08% (0.39)% 4.16%One Year 19.86 23.50 13.70Since Public OÅering 10/26/98 25.51 25.46 13.92* InÖation Source: Monthly Consumer Price Index for All Urban Consumers (CPI-U) compiled by the
U.S. Bureau of Labor Statistics.
FIVE LARGEST HOLDINGS(Represent 36.2% of Net Assets)
Safeway plc 8.0%Fourth largest U.K. food retailer with valuable locations.
Brierley Investments Limited 7.6%A Singapore based holding company which owns controlling stakes in U.K. basedThistle hotels, Air New Zealand, and Australian building materials maker, JamesHardie. (During the Ñrst quarter, Brierley moved its headquarters and primarylisting to Singapore from New Zealand.)
Fairfax Financial Holdings Limited 7.0%Canadian based property/casualty insurer oÅering both primary insurance andreinsurance across North America.
Sampo Insurance Company Ltd. 6.8%The largest non-life insurance company in Finland. The company holds asigniÑcant equity portfolio and is expanding into other European non-life mar-kets, the domestic life business, and banking.
Diageo plc 6.8%Owner of: premium spirits including SmirnoÅ, Johnnie Walker, Tanquery,Gordons, Hennessy, and Baileys; consumer food brands such as Pillsbury,Haagen Dazs, Old El Paso, and Progresso; the world's leading stout, Guinness;and the Burger King restaurant franchise.
14
International Fund - PORTFOLIO SUMMARY
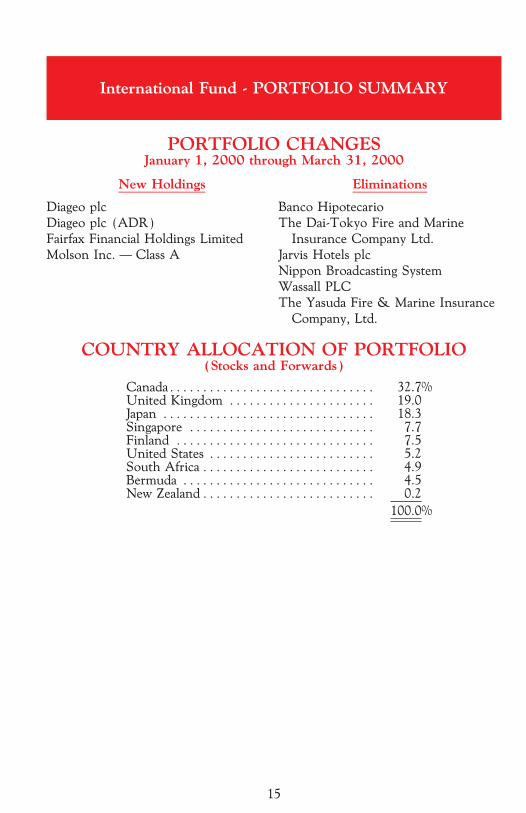
PORTFOLIO CHANGESJanuary 1, 2000 through March 31, 2000
New Holdings Eliminations
Diageo plc Banco Hipotecario
Diageo plc (ADR) The Dai-Tokyo Fire and Marine
Fairfax Financial Holdings Limited Insurance Company Ltd.
Molson Inc. Ì Class A Jarvis Hotels plc
Nippon Broadcasting System
Wassall PLC
The Yasuda Fire & Marine Insurance
Company, Ltd.
COUNTRY ALLOCATION OF PORTFOLIO(Stocks and Forwards)
CanadaÏÏÏÏÏÏÏÏÏÏÏÏÏÏÏÏÏÏÏÏÏÏÏÏÏÏÏÏÏÏÏ 32.7%United Kingdom ÏÏÏÏÏÏÏÏÏÏÏÏÏÏÏÏÏÏÏÏÏÏ 19.0Japan ÏÏÏÏÏÏÏÏÏÏÏÏÏÏÏÏÏÏÏÏÏÏÏÏÏÏÏÏÏÏÏÏ 18.3Singapore ÏÏÏÏÏÏÏÏÏÏÏÏÏÏÏÏÏÏÏÏÏÏÏÏÏÏÏÏ 7.7Finland ÏÏÏÏÏÏÏÏÏÏÏÏÏÏÏÏÏÏÏÏÏÏÏÏÏÏÏÏÏÏ 7.5United States ÏÏÏÏÏÏÏÏÏÏÏÏÏÏÏÏÏÏÏÏÏÏÏÏÏ 5.2South Africa ÏÏÏÏÏÏÏÏÏÏÏÏÏÏÏÏÏÏÏÏÏÏÏÏÏÏ 4.9Bermuda ÏÏÏÏÏÏÏÏÏÏÏÏÏÏÏÏÏÏÏÏÏÏÏÏÏÏÏÏÏ 4.5New ZealandÏÏÏÏÏÏÏÏÏÏÏÏÏÏÏÏÏÏÏÏÏÏÏÏÏÏ 0.2
100.0%
15
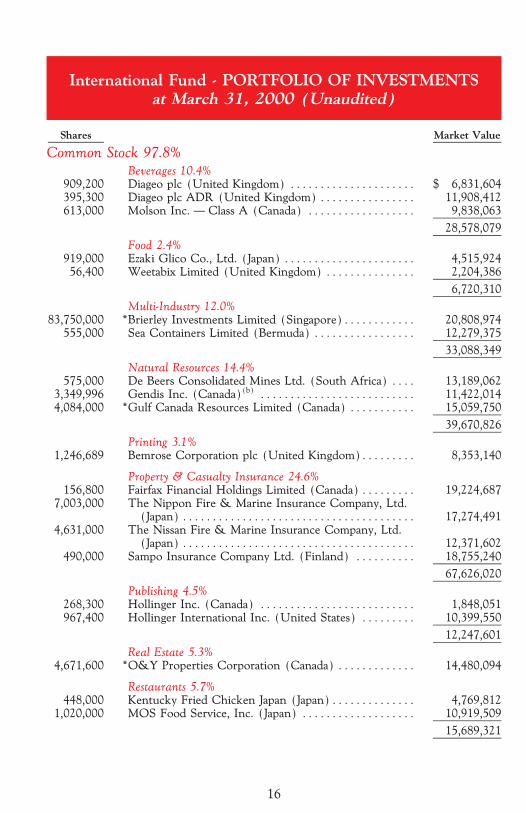
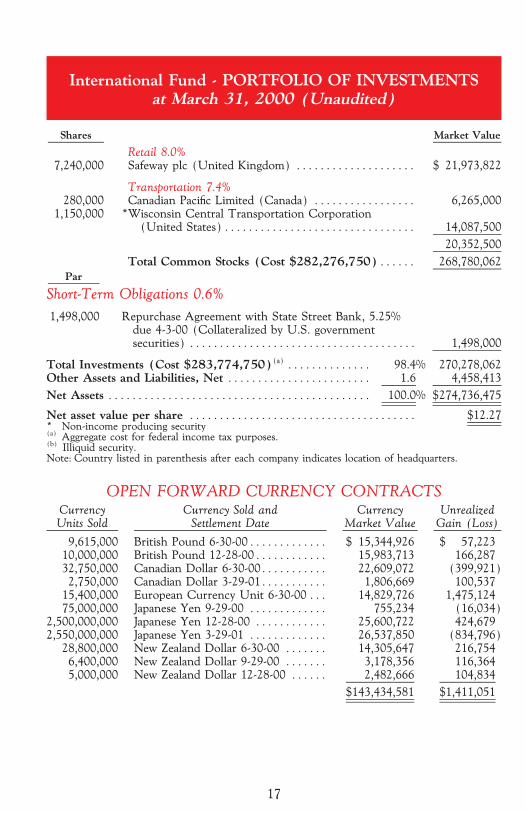
International Fund - PORTFOLIO OF INVESTMENTSat March 31, 2000 (Unaudited)
Shares Market Value
Common Stock 97.8%
Beverages 10.4%909,200 Diageo plc (United Kingdom) ÏÏÏÏÏÏÏÏÏÏÏÏÏÏÏÏÏÏÏÏÏ $ 6,831,604395,300 Diageo plc ADR (United Kingdom) ÏÏÏÏÏÏÏÏÏÏÏÏÏÏÏÏ 11,908,412613,000 Molson Inc. Ì Class A (Canada) ÏÏÏÏÏÏÏÏÏÏÏÏÏÏÏÏÏÏ 9,838,063
28,578,079
Food 2.4%919,000 Ezaki Glico Co., Ltd. (Japan) ÏÏÏÏÏÏÏÏÏÏÏÏÏÏÏÏÏÏÏÏÏÏ 4,515,92456,400 Weetabix Limited (United Kingdom) ÏÏÏÏÏÏÏÏÏÏÏÏÏÏÏ 2,204,386
6,720,310
Multi-Industry 12.0%83,750,000 *Brierley Investments Limited (Singapore)ÏÏÏÏÏÏÏÏÏÏÏÏ 20,808,974
555,000 Sea Containers Limited (Bermuda) ÏÏÏÏÏÏÏÏÏÏÏÏÏÏÏÏÏ 12,279,375
33,088,349
Natural Resources 14.4%575,000 De Beers Consolidated Mines Ltd. (South Africa) ÏÏÏÏ 13,189,062
3,349,996 Gendis Inc. (Canada)(b) ÏÏÏÏÏÏÏÏÏÏÏÏÏÏÏÏÏÏÏÏÏÏÏÏÏÏ 11,422,0144,084,000 *Gulf Canada Resources Limited (Canada) ÏÏÏÏÏÏÏÏÏÏÏ 15,059,750
39,670,826
Printing 3.1%1,246,689 Bemrose Corporation plc (United Kingdom)ÏÏÏÏÏÏÏÏÏ 8,353,140
Property & Casualty Insurance 24.6%156,800 Fairfax Financial Holdings Limited (Canada) ÏÏÏÏÏÏÏÏÏ 19,224,687
7,003,000 The Nippon Fire & Marine Insurance Company, Ltd.(Japan) ÏÏÏÏÏÏÏÏÏÏÏÏÏÏÏÏÏÏÏÏÏÏÏÏÏÏÏÏÏÏÏÏÏÏÏÏÏÏÏ 17,274,491
4,631,000 The Nissan Fire & Marine Insurance Company, Ltd.(Japan) ÏÏÏÏÏÏÏÏÏÏÏÏÏÏÏÏÏÏÏÏÏÏÏÏÏÏÏÏÏÏÏÏÏÏÏÏÏÏÏ 12,371,602
490,000 Sampo Insurance Company Ltd. (Finland) ÏÏÏÏÏÏÏÏÏÏ 18,755,240
67,626,020
Publishing 4.5%268,300 Hollinger Inc. (Canada) ÏÏÏÏÏÏÏÏÏÏÏÏÏÏÏÏÏÏÏÏÏÏÏÏÏÏ 1,848,051967,400 Hollinger International Inc. (United States) ÏÏÏÏÏÏÏÏÏ 10,399,550
12,247,601
Real Estate 5.3%4,671,600 *O&Y Properties Corporation (Canada) ÏÏÏÏÏÏÏÏÏÏÏÏÏ 14,480,094
Restaurants 5.7%448,000 Kentucky Fried Chicken Japan (Japan)ÏÏÏÏÏÏÏÏÏÏÏÏÏÏ 4,769,812
1,020,000 MOS Food Service, Inc. (Japan) ÏÏÏÏÏÏÏÏÏÏÏÏÏÏÏÏÏÏÏ 10,919,509
15,689,321
16
International Fund - PORTFOLIO OF INVESTMENTSat March 31, 2000 (Unaudited)
Shares Market Value
Retail 8.0%7,240,000 Safeway plc (United Kingdom) ÏÏÏÏÏÏÏÏÏÏÏÏÏÏÏÏÏÏÏÏ $ 21,973,822
Transportation 7.4%280,000 Canadian PaciÑc Limited (Canada) ÏÏÏÏÏÏÏÏÏÏÏÏÏÏÏÏÏ 6,265,000
1,150,000 *Wisconsin Central Transportation Corporation(United States)ÏÏÏÏÏÏÏÏÏÏÏÏÏÏÏÏÏÏÏÏÏÏÏÏÏÏÏÏÏÏÏÏ 14,087,500
20,352,500
Total Common Stocks (Cost $282,276,750)ÏÏÏÏÏÏ 268,780,062
Par
Short-Term Obligations 0.6%
1,498,000 Repurchase Agreement with State Street Bank, 5.25%due 4-3-00 (Collateralized by U.S. governmentsecurities) ÏÏÏÏÏÏÏÏÏÏÏÏÏÏÏÏÏÏÏÏÏÏÏÏÏÏÏÏÏÏÏÏÏÏÏÏÏÏ 1,498,000
Total Investments (Cost $283,774,750)(a) ÏÏÏÏÏÏÏÏÏÏÏÏÏÏ 98.4% 270,278,062Other Assets and Liabilities, Net ÏÏÏÏÏÏÏÏÏÏÏÏÏÏÏÏÏÏÏÏÏÏÏÏ 1.6 4,458,413
Net Assets ÏÏÏÏÏÏÏÏÏÏÏÏÏÏÏÏÏÏÏÏÏÏÏÏÏÏÏÏÏÏÏÏÏÏÏÏÏÏÏÏÏÏÏÏ 100.0% $274,736,475
Net asset value per share ÏÏÏÏÏÏÏÏÏÏÏÏÏÏÏÏÏÏÏÏÏÏÏÏÏÏÏÏÏÏÏÏÏÏÏÏÏÏ $12.27* Non-income producing security(a) Aggregate cost for federal income tax purposes.(b) Illiquid security.Note: Country listed in parenthesis after each company indicates location of headquarters.
OPEN FORWARD CURRENCY CONTRACTSCurrency Currency Sold and Currency UnrealizedUnits Sold Settlement Date Market Value Gain (Loss)
9,615,000 British Pound 6-30-00ÏÏÏÏÏÏÏÏÏÏÏÏÏ $ 15,344,926 $ 57,22310,000,000 British Pound 12-28-00ÏÏÏÏÏÏÏÏÏÏÏÏ 15,983,713 166,28732,750,000 Canadian Dollar 6-30-00ÏÏÏÏÏÏÏÏÏÏÏ 22,609,072 (399,921)2,750,000 Canadian Dollar 3-29-01ÏÏÏÏÏÏÏÏÏÏÏ 1,806,669 100,537
15,400,000 European Currency Unit 6-30-00 ÏÏÏ 14,829,726 1,475,12475,000,000 Japanese Yen 9-29-00 ÏÏÏÏÏÏÏÏÏÏÏÏÏ 755,234 (16,034)
2,500,000,000 Japanese Yen 12-28-00 ÏÏÏÏÏÏÏÏÏÏÏÏ 25,600,722 424,6792,550,000,000 Japanese Yen 3-29-01 ÏÏÏÏÏÏÏÏÏÏÏÏÏ 26,537,850 (834,796)
28,800,000 New Zealand Dollar 6-30-00 ÏÏÏÏÏÏÏ 14,305,647 216,7546,400,000 New Zealand Dollar 9-29-00 ÏÏÏÏÏÏÏ 3,178,356 116,3645,000,000 New Zealand Dollar 12-28-00 ÏÏÏÏÏÏ 2,482,666 104,834
$143,434,581 $1,411,051
17

(Intentionally Left Blank)
18
Realty Fund - MANAGEMENT DISCUSSIONby C.T. Fitzpatrick, Mason Hawkins, and Staley Cates
Longleaf Partners Realty Fund declined 4.4% while the Wilshire Real Estate
Securities Index was up 2.8% and the NAREIT Index posted a 2.2% return
during the Ñrst quarter of 2000. Although our disciplined value approach is not
producing satisfactory results currently, Southeastern's process has delivered
superior long-term returns. This approach is the only way we are comfortable
investing and protecting our own capital.
In the Ñrst quarter, any slight interest in real estate focused on ""blue chip'' REITs
and we underperformed. We own some of the Ñnest real estate in the world at
extremely attractive prices, and we are partners with some of the best manage-
ment talent in the industry. Our aggregate cash Öows and values are rising
steadily, yet many of our companies are selling at lower prices. Despite being
frustrated with the lack of appreciation for our core holdings, we are ecstatic at
the opportunities for rational, long-term investors. To explain our conÑdence we
highlight a few holdings, which account for almost 40% of the portfolio.
Hilton: This company was most responsible for the Realty Fund's
poor results in the Ñrst quarter. This short-term volatility does not
diminish Hilton's superior long-term compounding ability. In fact, from
this price level, the opportunity is higher. Hilton sells for less than 5X
FFO (a proxy for earnings in real estate companies). The company is
growing at a double-digit rate in a less than robust environment for
hotels. Hilton has some of the best brands in the industry and is run by
a proven, capable, shareholder-oriented management team.
Forest City: Earnings (FFO) per share were up 12.5% in 1999. 2000
looks even better Ó the company will complete the massive Times
Square re-development project and should have strong same property
cash Öow growth. Recently, Forest City was selected for one of the
premier development opportunities in the country, converting the six
square mile Denver-Stapleton Airport into a ""city within a city.'' The
company sells for 6X FFO.
Catellus: The landlords in San Francisco and Silicon Valley are major
beneÑciaries of the ""new economy''. Catellus is best positioned with its
strategic assets. 1999 earnings (their equivalent to FFO) per share grew
at 25% in 1999 and should increase at a double-digit rate again in 2000.
The company's entitled land portfolio (including 313 acres on the
waterfront in downtown San Francisco) has increased in value in this
very desirable, supply-constrained market.
19
Realty Fund - MANAGEMENT DISCUSSIONby C.T. Fitzpatrick, Mason Hawkins, and Staley Cates
Prime Group: FFO per share increased 11.5% in 1999 due to strong
same property results from Chicago oÇce assets. The company sold its
largest single asset for $300/square foot; the stock is selling for less than
$100/square foot. Prime Group has announced plans for 2000 to sell
$500 million in assets and repurchase $250 million in stock, represent-
ing approximately 60% of all the outstanding shares and units.
Two companies which total 4% of assets deserve special mention because they
materially hurt performance in the Ñrst quarter. Bay View Capital's stock has
been weak in the wake of the FMAC acquisition. Time will tell whether FMAC
will perform up to expectation or whether our value has been diluted perma-
nently. Even assuming the latter, BVC's intrinsic value is signiÑcantly higher than
the stock price. BVC sells for less than book value, which itself reÖects no credit
for the company's San Francisco deposit franchise.
Prime Retail is also extremely inexpensive. Today it sells for approximately 1X its
trailing FFO/share. The company's stock price declined because former manage-
ment failed to integrate the 1998 Horizon acquisition eÅectively. This failure
involved both operating results at the properties and Ñnancial management of the
balance sheet. The board of directors has replaced most of senior management.
We are disappointed in the company's results and in our own assessment of
management.
The Realty Fund's return also has been hurt by the market's continued
rewarding of speculative enterprises over current cash Öows and quality assets.
Consider the example this quarter at one of our core investments, Beacon Capital
Partners. The company is managed by the widely admired Alan Leventhal and
Lionel Fortin, who have created tremendous value by acquiring 20% of the oÇce
space in the supply constrained Cambridge market before rents spiked. Our
partners at Beacon invested a small amount in a real estate technology company
called Cypress Communications which they subsequently distributed to share-
holders. The stock symbol is CYCO (pronounced ""psycho''). CYCO has never
made an operating proÑt and its 1999 operating losses of $15 million were double
its revenue of $7.4 million. During the Ñrst quarter CYCO issued its Ñrst public
shares to capitalize on the market's technology mania. Subsequent to the IPO the
company had an equity market capitalization of $1.4 billion. We quickly sold our
overvalued stake in CYCO at a gain of over 350%.
The irony of this transaction is that just prior to the CYCO spin-oÅ, Beacon
traded at $12/share. The market priced CYCO at over $5/share of Beacon,
implying a value of only $7/share for Beacon's remaining proÑtable assets. The
20
Realty Fund - MANAGEMENT DISCUSSIONby C.T. Fitzpatrick, Mason Hawkins, and Staley Cates
Cambridge properties alone are worth $15/share. The further irony is that
chasing speculative investments like CYCO recently would have rewarded you
and ourselves, even though it would have meant abandoning every principle we
hold. With our own capital permanently invested we prefer to protect our assets
by owning companies with tangible values such as Beacon at greatly discounted
prices.
In the Ñrst quarter markets rewarded speculation; sound investments with low
business risk and high cash-on-cash returns were shunned. In this kind of
environment both we and the companies we own will act rationally. We will
concentrate our capital and yours in businesses where the asset and cash Öow
values are clearly deÑnable, where the stocks are available at large discounts to our
appraisals, and where we can partner with credible and capable managers. Many
of our companies are repurchasing their stock with proceeds from private market
asset sales at fair prices, thus building intrinsic values. Ultimately, these values
will translate into higher share prices. Because the gap between our appraisals and
current market quotes is unprecedented, Longleaf Partners Realty's future
returns should be signiÑcant.
21
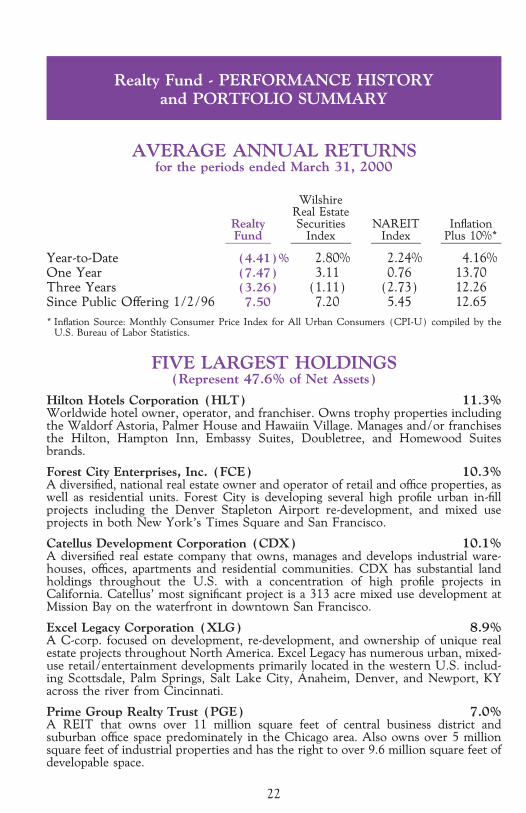
Realty Fund - PERFORMANCE HISTORYand PORTFOLIO SUMMARY
AVERAGE ANNUAL RETURNSfor the periods ended March 31, 2000
WilshireReal Estate
Realty Securities NAREIT InÖationFund Index Index Plus 10%*
Year-to-Date (4.41)% 2.80% 2.24% 4.16%One Year (7.47) 3.11 0.76 13.70Three Years (3.26) (1.11) (2.73) 12.26Since Public OÅering 1/2/96 7.50 7.20 5.45 12.65
* InÖation Source: Monthly Consumer Price Index for All Urban Consumers (CPI-U) compiled by theU.S. Bureau of Labor Statistics.
FIVE LARGEST HOLDINGS(Represent 47.6% of Net Assets)
Hilton Hotels Corporation (HLT) 11.3%Worldwide hotel owner, operator, and franchiser. Owns trophy properties includingthe Waldorf Astoria, Palmer House and Hawaiin Village. Manages and/or franchisesthe Hilton, Hampton Inn, Embassy Suites, Doubletree, and Homewood Suitesbrands.
Forest City Enterprises, Inc. (FCE) 10.3%A diversiÑed, national real estate owner and operator of retail and oÇce properties, aswell as residential units. Forest City is developing several high proÑle urban in-Ñllprojects including the Denver Stapleton Airport re-development, and mixed useprojects in both New York's Times Square and San Francisco.
Catellus Development Corporation (CDX) 10.1%A diversiÑed real estate company that owns, manages and develops industrial ware-houses, oÇces, apartments and residential communities. CDX has substantial landholdings throughout the U.S. with a concentration of high proÑle projects inCalifornia. Catellus' most signiÑcant project is a 313 acre mixed use development atMission Bay on the waterfront in downtown San Francisco.
Excel Legacy Corporation (XLG) 8.9%A C-corp. focused on development, re-development, and ownership of unique realestate projects throughout North America. Excel Legacy has numerous urban, mixed-use retail/entertainment developments primarily located in the western U.S. includ-ing Scottsdale, Palm Springs, Salt Lake City, Anaheim, Denver, and Newport, KYacross the river from Cincinnati.
Prime Group Realty Trust (PGE) 7.0%A REIT that owns over 11 million square feet of central business district andsuburban oÇce space predominately in the Chicago area. Also owns over 5 millionsquare feet of industrial properties and has the right to over 9.6 million square feet ofdevelopable space.
22
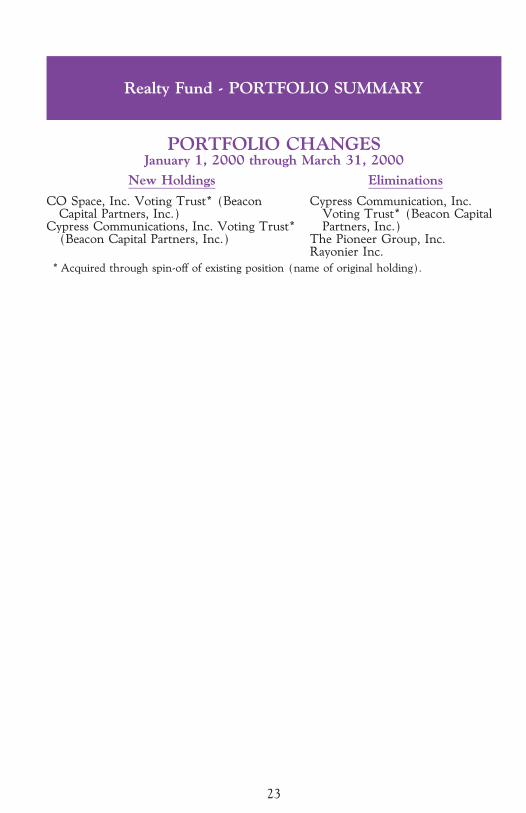
Realty Fund - PORTFOLIO SUMMARY
PORTFOLIO CHANGESJanuary 1, 2000 through March 31, 2000
New Holdings Eliminations
CO Space, Inc. Voting Trust* (Beacon Cypress Communication, Inc.Capital Partners, Inc.) Voting Trust* (Beacon Capital
Cypress Communications, Inc. Voting Trust* Partners, Inc.)(Beacon Capital Partners, Inc.) The Pioneer Group, Inc.
Rayonier Inc.
* Acquired through spin-oÅ of existing position (name of original holding).
23
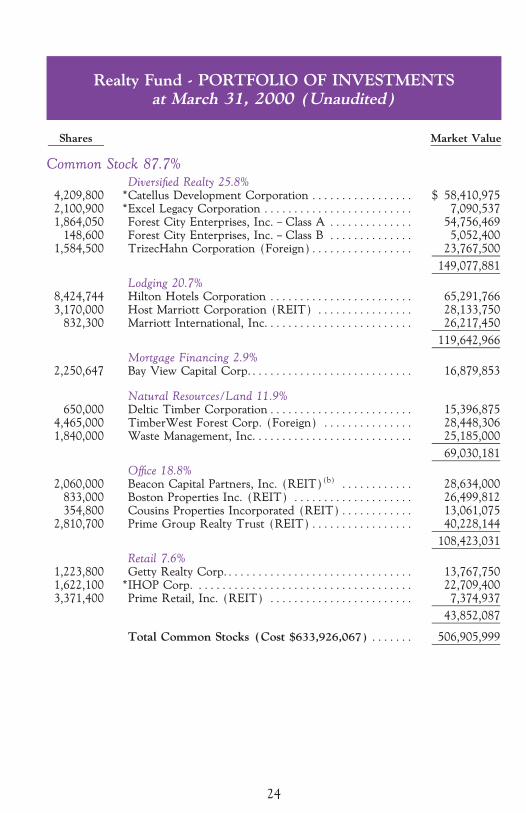
Realty Fund - PORTFOLIO OF INVESTMENTSat March 31, 2000 (Unaudited)
Shares Market Value
Common Stock 87.7%
DiversiÑed Realty 25.8%4,209,800 *Catellus Development Corporation ÏÏÏÏÏÏÏÏÏÏÏÏÏÏÏÏÏ $ 58,410,9752,100,900 *Excel Legacy Corporation ÏÏÏÏÏÏÏÏÏÏÏÏÏÏÏÏÏÏÏÏÏÏÏÏÏ 7,090,5371,864,050 Forest City Enterprises, Inc. Ó Class A ÏÏÏÏÏÏÏÏÏÏÏÏÏÏ 54,756,469
148,600 Forest City Enterprises, Inc. Ó Class B ÏÏÏÏÏÏÏÏÏÏÏÏÏÏ 5,052,4001,584,500 TrizecHahn Corporation (Foreign)ÏÏÏÏÏÏÏÏÏÏÏÏÏÏÏÏÏ 23,767,500
149,077,881
Lodging 20.7%8,424,744 Hilton Hotels Corporation ÏÏÏÏÏÏÏÏÏÏÏÏÏÏÏÏÏÏÏÏÏÏÏÏ 65,291,7663,170,000 Host Marriott Corporation (REIT) ÏÏÏÏÏÏÏÏÏÏÏÏÏÏÏÏ 28,133,750
832,300 Marriott International, Inc.ÏÏÏÏÏÏÏÏÏÏÏÏÏÏÏÏÏÏÏÏÏÏÏÏ 26,217,450
119,642,966
Mortgage Financing 2.9%2,250,647 Bay View Capital Corp.ÏÏÏÏÏÏÏÏÏÏÏÏÏÏÏÏÏÏÏÏÏÏÏÏÏÏÏ 16,879,853
Natural Resources/Land 11.9%650,000 Deltic Timber CorporationÏÏÏÏÏÏÏÏÏÏÏÏÏÏÏÏÏÏÏÏÏÏÏÏ 15,396,875
4,465,000 TimberWest Forest Corp. (Foreign) ÏÏÏÏÏÏÏÏÏÏÏÏÏÏÏ 28,448,3061,840,000 Waste Management, Inc. ÏÏÏÏÏÏÏÏÏÏÏÏÏÏÏÏÏÏÏÏÏÏÏÏÏÏ 25,185,000
69,030,181
OÇce 18.8%2,060,000 Beacon Capital Partners, Inc. (REIT)(b) ÏÏÏÏÏÏÏÏÏÏÏÏ 28,634,000
833,000 Boston Properties Inc. (REIT) ÏÏÏÏÏÏÏÏÏÏÏÏÏÏÏÏÏÏÏÏ 26,499,812354,800 Cousins Properties Incorporated (REIT)ÏÏÏÏÏÏÏÏÏÏÏÏ 13,061,075
2,810,700 Prime Group Realty Trust (REIT)ÏÏÏÏÏÏÏÏÏÏÏÏÏÏÏÏÏ 40,228,144
108,423,031
Retail 7.6%1,223,800 Getty Realty Corp.ÏÏÏÏÏÏÏÏÏÏÏÏÏÏÏÏÏÏÏÏÏÏÏÏÏÏÏÏÏÏÏ 13,767,7501,622,100 *IHOP Corp. ÏÏÏÏÏÏÏÏÏÏÏÏÏÏÏÏÏÏÏÏÏÏÏÏÏÏÏÏÏÏÏÏÏÏÏÏ 22,709,4003,371,400 Prime Retail, Inc. (REIT) ÏÏÏÏÏÏÏÏÏÏÏÏÏÏÏÏÏÏÏÏÏÏÏÏ 7,374,937
43,852,087
Total Common Stocks (Cost $633,926,067) ÏÏÏÏÏÏÏ 506,905,999
24
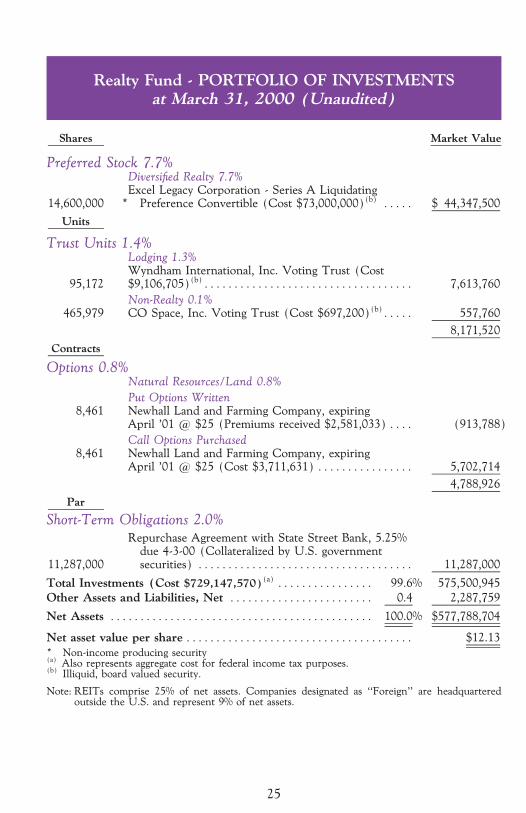
Realty Fund - PORTFOLIO OF INVESTMENTSat March 31, 2000 (Unaudited)
Shares Market Value
Preferred Stock 7.7%DiversiÑed Realty 7.7%Excel Legacy Corporation - Series A Liquidating
14,600,000 * Preference Convertible (Cost $73,000,000)(b) ÏÏÏÏÏ $ 44,347,500
Units
Trust Units 1.4%Lodging 1.3%Wyndham International, Inc. Voting Trust (Cost
95,172 $9,106,705)(b)ÏÏÏÏÏÏÏÏÏÏÏÏÏÏÏÏÏÏÏÏÏÏÏÏÏÏÏÏÏÏÏÏÏÏÏ 7,613,760
Non-Realty 0.1%465,979 CO Space, Inc. Voting Trust (Cost $697,200)(b)ÏÏÏÏÏ 557,760
8,171,520
Contracts
Options 0.8%Natural Resources/Land 0.8%
Put Options Written8,461 Newhall Land and Farming Company, expiring
April '01 @ $25 (Premiums received $2,581,033) ÏÏÏÏ (913,788)
Call Options Purchased8,461 Newhall Land and Farming Company, expiring
April '01 @ $25 (Cost $3,711,631) ÏÏÏÏÏÏÏÏÏÏÏÏÏÏÏÏ 5,702,714
4,788,926
Par
Short-Term Obligations 2.0%
Repurchase Agreement with State Street Bank, 5.25%due 4-3-00 (Collateralized by U.S. government
11,287,000 securities) ÏÏÏÏÏÏÏÏÏÏÏÏÏÏÏÏÏÏÏÏÏÏÏÏÏÏÏÏÏÏÏÏÏÏÏÏ 11,287,000
Total Investments (Cost $729,147,570)(a) ÏÏÏÏÏÏÏÏÏÏÏÏÏÏÏÏ 99.6% 575,500,945
Other Assets and Liabilities, Net ÏÏÏÏÏÏÏÏÏÏÏÏÏÏÏÏÏÏÏÏÏÏÏÏ 0.4 2,287,759
Net Assets ÏÏÏÏÏÏÏÏÏÏÏÏÏÏÏÏÏÏÏÏÏÏÏÏÏÏÏÏÏÏÏÏÏÏÏÏÏÏÏÏÏÏÏÏ 100.0% $577,788,704
Net asset value per share ÏÏÏÏÏÏÏÏÏÏÏÏÏÏÏÏÏÏÏÏÏÏÏÏÏÏÏÏÏÏÏÏÏÏÏÏÏÏ $12.13
* Non-income producing security(a) Also represents aggregate cost for federal income tax purposes.(b) Illiquid, board valued security.
Note: REITs comprise 25% of net assets. Companies designated as ""Foreign'' are headquarteredoutside the U.S. and represent 9% of net assets.
25
(Intentionally Left Blank)
26
Small-Cap Fund - MANAGEMENT DISCUSSIONby Mason Hawkins, Staley Cates, and John Buford
In the Ñrst quarter Longleaf Partners Small-Cap Fund fell 5.0% while the Russell
2000 fueled primarily by technology stocks, rose an impressive 7.1%. Most of our
decline was caused by four of our holdings.
Our biggest single issue in the quarter was Safety-Kleen. The outside directors
announced they were exploring accounting irregularities and suspended top
company oÇcers. It is a bizarre situation that seems far from being resolved.
Safety-Kleen is the combination of the old Safety-Kleen business (which we
previously owned) that distributes and collects cleaning solvents for small
industrial users, and Laidlaw Environmental which deals in hazardous substances
for large users. We literally do not know how to comment or even fully assess this
situation yet since the company has not detailed the numbers or explained the
problem nor have any of the suspended oÇcers been terminated. We continue to
monitor this closely and as soon as we have any information on which to base a
decision, we will make one.
Bay View Capital's stock has been weak in the wake of the FMAC acquisition.
Time will tell whether FMAC will perform up to expectation or whether our
value has been permanently diluted. Even assuming the latter, BVC's intrinsic
value is signiÑcantly higher than the stock price. BVC sells for less than book
value, which reÖects no credit for the company's San Francisco deposit franchise.
Wyndham's new management continues to upgrade the chain and report good
core results. The stock suÅers from the overall weakness of the lodging group.
WYN, however, is eÅectively streamlining its business and focusing on its
Wyndham properties. A new, sophisticated ownership group and board hired a
new management team with very large ownership positions, thus aligning all of
our interests. This new board and team originally sparked our interest in
Wyndham, and the stock sells far below bids oÅered for the company during the
restructuring process.
U.S. Industries declined over Wall Street's general fears about building products
investments. Our appraisal incorporates where we are in the construction cycle.
Substantial insider buying and aggressive corporate repurchases conÑrm our
assessment of the stock's extreme undervaluation.
Our long-term optimism for the Small-Cap Fund is rooted in the speciÑc building
blocks in this portfolio. Whether partnering with Mark Hansen's team, which
has already made dramatic strides at Fleming, at less than 4X EBITDA, or with
the Smiths' team at Neiman-Marcus at just over half of revenues, our opportuni-
ties are better than they have been in years. As in the Partners Fund, we have
never seen this kind of widespread undervaluation of Ñne businesses. Our
27
Small-Cap Fund - MANAGEMENT DISCUSSIONby Mason Hawkins, Staley Cates, and John Buford
composite price-to-value ratio is below 50% for the Ñrst time ever, compared to a
long-term average in the high 60's. Just getting back to average would not only
provide a return that more than compensates for the past year, but would also put
us on a platform from which we have historically generated high long-term
absolute returns.
Not surprisingly, the low prices and small capitalizations of our holdings have
begun to attract a great deal of interest both from insiders and from outsiders.
Many of our partners have taken advantage of these discounts by aggressively
repurchasing their stocks. Several managers have sold assets or are exploring full
liquidation to get shareholders paid. Merger and acquisition interest has risen.
We have been approached by third parties to discuss purchasing our stakes as
part of eÅorts to buy out several companies. To enable us to talk freely with all
interested parties, we converted our 13G Ñlings with the SEC on Catellus, Gulf
Canada, Pioneer Group, VICORP, and Wisconsin Central to 13D's. The recent
activity gives us conÑdence that values will be realized and our wait in many cases
will not be long.
Besides the enthusiasm for our current holdings, our buy list of new and future
ideas is extensive. Partners who invest additional cash will allow us to purchase
more compelling businesses and improve our future returns.
28
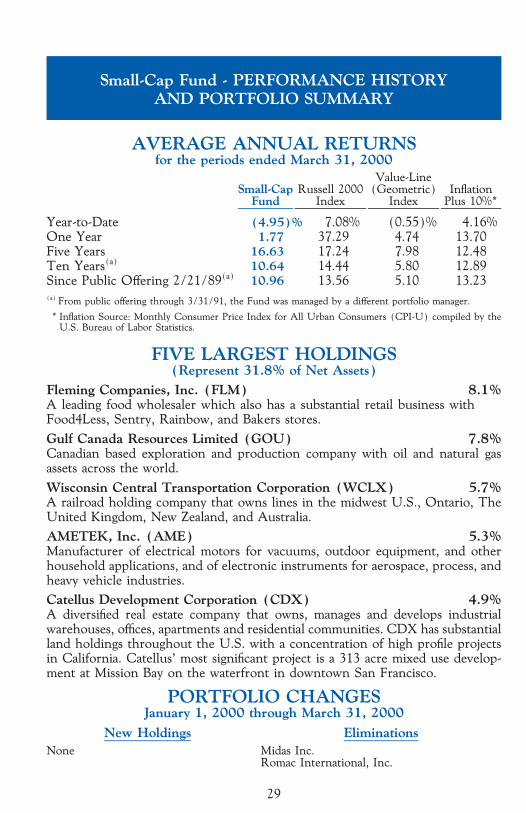
Small-Cap Fund - PERFORMANCE HISTORYAND PORTFOLIO SUMMARY
AVERAGE ANNUAL RETURNSfor the periods ended March 31, 2000
Value-LineSmall-Cap Russell 2000 (Geometric) InÖation
Fund Index Index Plus 10%*
Year-to-Date (4.95)% 7.08% (0.55)% 4.16%One Year 1.77 37.29 4.74 13.70Five Years 16.63 17.24 7.98 12.48Ten Years(a) 10.64 14.44 5.80 12.89Since Public OÅering 2/21/89(a) 10.96 13.56 5.10 13.23(a) From public oÅering through 3/31/91, the Fund was managed by a diÅerent portfolio manager.
* InÖation Source: Monthly Consumer Price Index for All Urban Consumers (CPI-U) compiled by theU.S. Bureau of Labor Statistics.
FIVE LARGEST HOLDINGS(Represent 31.8% of Net Assets)
Fleming Companies, Inc. (FLM) 8.1%A leading food wholesaler which also has a substantial retail business withFood4Less, Sentry, Rainbow, and Bakers stores.
Gulf Canada Resources Limited (GOU) 7.8%Canadian based exploration and production company with oil and natural gasassets across the world.
Wisconsin Central Transportation Corporation (WCLX) 5.7%A railroad holding company that owns lines in the midwest U.S., Ontario, TheUnited Kingdom, New Zealand, and Australia.
AMETEK, Inc. (AME) 5.3%Manufacturer of electrical motors for vacuums, outdoor equipment, and otherhousehold applications, and of electronic instruments for aerospace, process, andheavy vehicle industries.
Catellus Development Corporation (CDX) 4.9%A diversiÑed real estate company that owns, manages and develops industrialwarehouses, oÇces, apartments and residential communities. CDX has substantialland holdings throughout the U.S. with a concentration of high proÑle projectsin California. Catellus' most signiÑcant project is a 313 acre mixed use develop-ment at Mission Bay on the waterfront in downtown San Francisco.
PORTFOLIO CHANGESJanuary 1, 2000 through March 31, 2000
New Holdings EliminationsNone Midas Inc.
Romac International, Inc.
29
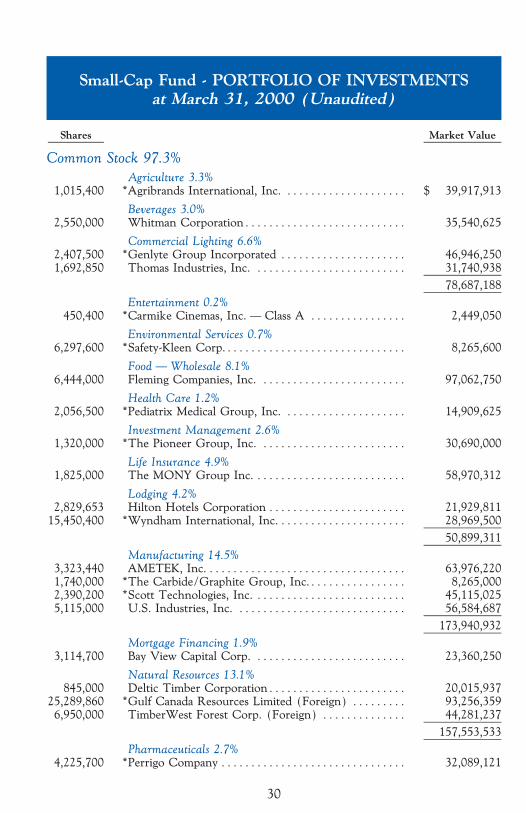
Small-Cap Fund - PORTFOLIO OF INVESTMENTSat March 31, 2000 (Unaudited)
Shares Market Value
Common Stock 97.3%
Agriculture 3.3%1,015,400 *Agribrands International, Inc. ÏÏÏÏÏÏÏÏÏÏÏÏÏÏÏÏÏÏÏÏ $ 39,917,913
Beverages 3.0%2,550,000 Whitman CorporationÏÏÏÏÏÏÏÏÏÏÏÏÏÏÏÏÏÏÏÏÏÏÏÏÏÏÏ 35,540,625
Commercial Lighting 6.6%2,407,500 *Genlyte Group Incorporated ÏÏÏÏÏÏÏÏÏÏÏÏÏÏÏÏÏÏÏÏÏ 46,946,2501,692,850 Thomas Industries, Inc. ÏÏÏÏÏÏÏÏÏÏÏÏÏÏÏÏÏÏÏÏÏÏÏÏÏ 31,740,938
78,687,188
Entertainment 0.2%450,400 *Carmike Cinemas, Inc. Ì Class A ÏÏÏÏÏÏÏÏÏÏÏÏÏÏÏÏ 2,449,050
Environmental Services 0.7%6,297,600 *Safety-Kleen Corp.ÏÏÏÏÏÏÏÏÏÏÏÏÏÏÏÏÏÏÏÏÏÏÏÏÏÏÏÏÏÏ 8,265,600
Food Ì Wholesale 8.1%6,444,000 Fleming Companies, Inc. ÏÏÏÏÏÏÏÏÏÏÏÏÏÏÏÏÏÏÏÏÏÏÏÏ 97,062,750
Health Care 1.2%2,056,500 *Pediatrix Medical Group, Inc. ÏÏÏÏÏÏÏÏÏÏÏÏÏÏÏÏÏÏÏÏ 14,909,625
Investment Management 2.6%1,320,000 *The Pioneer Group, Inc. ÏÏÏÏÏÏÏÏÏÏÏÏÏÏÏÏÏÏÏÏÏÏÏÏ 30,690,000
Life Insurance 4.9%1,825,000 The MONY Group Inc. ÏÏÏÏÏÏÏÏÏÏÏÏÏÏÏÏÏÏÏÏÏÏÏÏÏ 58,970,312
Lodging 4.2%2,829,653 Hilton Hotels Corporation ÏÏÏÏÏÏÏÏÏÏÏÏÏÏÏÏÏÏÏÏÏÏÏ 21,929,811
15,450,400 *Wyndham International, Inc. ÏÏÏÏÏÏÏÏÏÏÏÏÏÏÏÏÏÏÏÏÏ 28,969,500
50,899,311
Manufacturing 14.5%3,323,440 AMETEK, Inc. ÏÏÏÏÏÏÏÏÏÏÏÏÏÏÏÏÏÏÏÏÏÏÏÏÏÏÏÏÏÏÏÏÏ 63,976,2201,740,000 *The Carbide/Graphite Group, Inc.ÏÏÏÏÏÏÏÏÏÏÏÏÏÏÏÏ 8,265,0002,390,200 *Scott Technologies, Inc. ÏÏÏÏÏÏÏÏÏÏÏÏÏÏÏÏÏÏÏÏÏÏÏÏÏ 45,115,0255,115,000 U.S. Industries, Inc. ÏÏÏÏÏÏÏÏÏÏÏÏÏÏÏÏÏÏÏÏÏÏÏÏÏÏÏÏ 56,584,687
173,940,932
Mortgage Financing 1.9%3,114,700 Bay View Capital Corp. ÏÏÏÏÏÏÏÏÏÏÏÏÏÏÏÏÏÏÏÏÏÏÏÏÏ 23,360,250
Natural Resources 13.1%845,000 Deltic Timber CorporationÏÏÏÏÏÏÏÏÏÏÏÏÏÏÏÏÏÏÏÏÏÏÏ 20,015,937
25,289,860 *Gulf Canada Resources Limited (Foreign) ÏÏÏÏÏÏÏÏÏ 93,256,3596,950,000 TimberWest Forest Corp. (Foreign) ÏÏÏÏÏÏÏÏÏÏÏÏÏÏ 44,281,237
157,553,533
Pharmaceuticals 2.7%4,225,700 *Perrigo Company ÏÏÏÏÏÏÏÏÏÏÏÏÏÏÏÏÏÏÏÏÏÏÏÏÏÏÏÏÏÏÏ 32,089,121
30
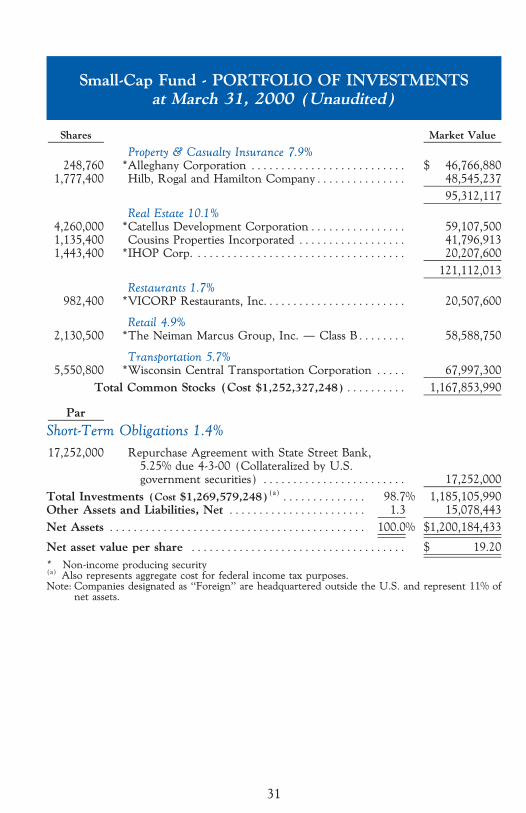
Small-Cap Fund - PORTFOLIO OF INVESTMENTSat March 31, 2000 (Unaudited)
Shares Market Value
Property & Casualty Insurance 7.9%248,760 *Alleghany Corporation ÏÏÏÏÏÏÏÏÏÏÏÏÏÏÏÏÏÏÏÏÏÏÏÏÏÏ $ 46,766,880
1,777,400 Hilb, Rogal and Hamilton CompanyÏÏÏÏÏÏÏÏÏÏÏÏÏÏÏ 48,545,237
95,312,117
Real Estate 10.1%4,260,000 *Catellus Development CorporationÏÏÏÏÏÏÏÏÏÏÏÏÏÏÏÏ 59,107,5001,135,400 Cousins Properties Incorporated ÏÏÏÏÏÏÏÏÏÏÏÏÏÏÏÏÏÏ 41,796,9131,443,400 *IHOP Corp. ÏÏÏÏÏÏÏÏÏÏÏÏÏÏÏÏÏÏÏÏÏÏÏÏÏÏÏÏÏÏÏÏÏÏÏ 20,207,600
121,112,013
Restaurants 1.7%982,400 *VICORP Restaurants, Inc.ÏÏÏÏÏÏÏÏÏÏÏÏÏÏÏÏÏÏÏÏÏÏÏ 20,507,600
Retail 4.9%2,130,500 *The Neiman Marcus Group, Inc. Ì Class BÏÏÏÏÏÏÏÏ 58,588,750
Transportation 5.7%5,550,800 *Wisconsin Central Transportation Corporation ÏÏÏÏÏ 67,997,300
Total Common Stocks (Cost $1,252,327,248)ÏÏÏÏÏÏÏÏÏÏ 1,167,853,990
Par
Short-Term Obligations 1.4%
17,252,000 Repurchase Agreement with State Street Bank,5.25% due 4-3-00 (Collateralized by U.S.government securities) ÏÏÏÏÏÏÏÏÏÏÏÏÏÏÏÏÏÏÏÏÏÏÏÏ 17,252,000
Total Investments (Cost $1,269,579,248)(a) ÏÏÏÏÏÏÏÏÏÏÏÏÏÏ 98.7% 1,185,105,990Other Assets and Liabilities, Net ÏÏÏÏÏÏÏÏÏÏÏÏÏÏÏÏÏÏÏÏÏÏÏ 1.3 15,078,443
Net Assets ÏÏÏÏÏÏÏÏÏÏÏÏÏÏÏÏÏÏÏÏÏÏÏÏÏÏÏÏÏÏÏÏÏÏÏÏÏÏÏÏÏÏÏ 100.0% $1,200,184,433
Net asset value per share ÏÏÏÏÏÏÏÏÏÏÏÏÏÏÏÏÏÏÏÏÏÏÏÏÏÏÏÏÏÏÏÏÏÏÏÏ $ 19.20
* Non-income producing security(a) Also represents aggregate cost for federal income tax purposes.Note: Companies designated as ""Foreign'' are headquartered outside the U.S. and represent 11% of
net assets.
31

(Intentionally Left Blank)
32
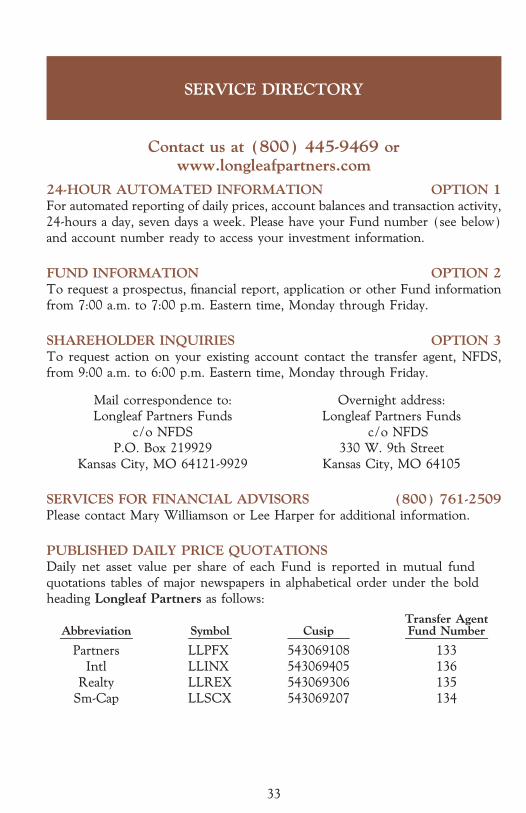
SERVICE DIRECTORY
Contact us at (800) 445-9469 orwww.longleafpartners.com
24-HOUR AUTOMATED INFORMATION OPTION 1For automated reporting of daily prices, account balances and transaction activity,
24-hours a day, seven days a week. Please have your Fund number (see below)
and account number ready to access your investment information.
FUND INFORMATION OPTION 2To request a prospectus, Ñnancial report, application or other Fund information
from 7:00 a.m. to 7:00 p.m. Eastern time, Monday through Friday.
SHAREHOLDER INQUIRIES OPTION 3To request action on your existing account contact the transfer agent, NFDS,
from 9:00 a.m. to 6:00 p.m. Eastern time, Monday through Friday.
Mail correspondence to: Overnight address:
Longleaf Partners Funds Longleaf Partners Funds
c/o NFDS c/o NFDS
P.O. Box 219929 330 W. 9th Street
Kansas City, MO 64121-9929 Kansas City, MO 64105
SERVICES FOR FINANCIAL ADVISORS (800) 761-2509Please contact Mary Williamson or Lee Harper for additional information.
PUBLISHED DAILY PRICE QUOTATIONSDaily net asset value per share of each Fund is reported in mutual fund
quotations tables of major newspapers in alphabetical order under the bold
heading Longleaf Partners as follows:
Transfer AgentAbbreviation Symbol Cusip Fund Number
Partners LLPFX 543069108 133
Intl LLINX 543069405 136
Realty LLREX 543069306 135
Sm-Cap LLSCX 543069207 134
33

(Intentionally Left Blank)
34
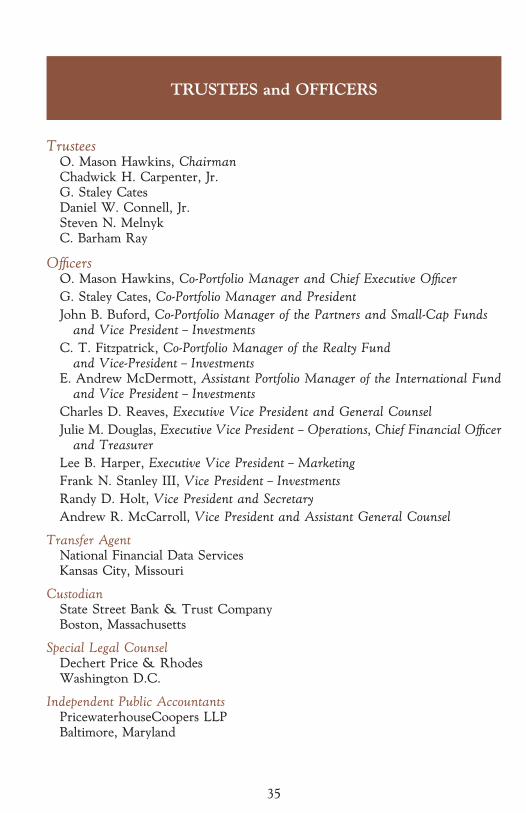
TRUSTEES and OFFICERS
TrusteesO. Mason Hawkins, ChairmanChadwick H. Carpenter, Jr.G. Staley CatesDaniel W. Connell, Jr.Steven N. MelnykC. Barham Ray
OÇcersO. Mason Hawkins, Co-Portfolio Manager and Chief Executive OÇcer
G. Staley Cates, Co-Portfolio Manager and President
John B. Buford, Co-Portfolio Manager of the Partners and Small-Cap Fundsand Vice President Ó Investments
C. T. Fitzpatrick, Co-Portfolio Manager of the Realty Fundand Vice-President Ó Investments
E. Andrew McDermott, Assistant Portfolio Manager of the International Fundand Vice President Ó Investments
Charles D. Reaves, Executive Vice President and General Counsel
Julie M. Douglas, Executive Vice President Ó Operations, Chief Financial OÇcerand Treasurer
Lee B. Harper, Executive Vice President Ó Marketing
Frank N. Stanley III, Vice President Ó Investments
Randy D. Holt, Vice President and Secretary
Andrew R. McCarroll, Vice President and Assistant General Counsel
Transfer AgentNational Financial Data ServicesKansas City, Missouri
CustodianState Street Bank & Trust CompanyBoston, Massachusetts
Special Legal CounselDechert Price & RhodesWashington D.C.
Independent Public AccountantsPricewaterhouseCoopers LLPBaltimore, Maryland
35

Longleaf Partners FundsSM
c/o NFDSP.O. Box 219929
Kansas City, MO 64121-9929(800) 445-9469
www.longleafpartners.com