Embed Size (px)
Citation preview

AD-A 197 783
'1ifI FL E UAP:
DTJC
SAUG 1o019D'H
- ,-~ -i

SECURITY CLASSIFICATION OF THIS PAGE M7 2Form Approved
REPORT DOCUMENTATION PAGE 0MB No 0704-0188__________________________________________1 Exp Date Jun 30, 7986
la. REPORT SECURITY CLASSIFICATION lb RESTRICTIVE MARKINGS
2a SECURITY CLASSIFICATION AUTHORITY 3 DISTRIBUTION /AVAILABILITY OF REPORT
2b. DECLASSIFICATION / DOWNGRADING SCHEDULE%
PERFORMING ORG IZTIO POT NUMBER(S~ 5 kah**-) MONITORING ORGANIZATION REPORT NUMBER(S)
6a. N4M O EFOR rf1NG ORGANIZATION 6b. OFFICE SYMBOL 7a. NAME OF MONITORING ORGANIZATION
(b~ -0A C-)~CIJ,1t bfPA~f'CA C) -6c. ADDRESS (City, State, and ZIP Code) 7b. ADDRESS (City State. andJtP Code)
Sa. NAME OF FUNDING/ SPONSORING 8b. OFFICE SYMBOL 9. PROCUREMENT INSTRUMENT IDENTIFICATION Nj MBERORGANIZATION (if applicable) 5 4 rAAI5, t)bh1IPC4(DAft -eeA- -r) 2c. c kj
JbAVC-()AA C Z3
8c. ADDRESS (City, State, and ZIP Code) 10. SOURCE OF FUNDING NUMBERSPROGRAM jPROJECT ITASK WORK UNITELEMENT NO. NO NO jACCESSION NO
11. TITLE (include Security Casification)-Riec(otjI acdc) - J-~ (-L- LAt~te
12. PERSONAL AUTHOR(S) . m e ? ; k L .1a
ci
13a. TYPE OF REPORT 113b. TIME COVERED I1DAEORPRT(erMotay 15. PAGE COUNT
M. ~ ~ ~ A, is ~ I FROM _TO __ _ ii~ u~Aes16. SUPPLEMEIN.ARY NOTATION - nl
Aac-w W c ri~4o- t,---
117 COSATI CODES 18. SUBJECT TERMS (Continue on reverse if necessary and identify by block number)
FIELD GROUP SUB-GROUP -R1I 4nAXr T noc 1 -?,Is ( - bewzbl -L-~LkY(Y
19. ABSTRACT (Continue on reverse if necessary and identify by block number)
1wi ia rcd 1 1vt I lei-L- ,,64"dw ) Q&(0 h~$ eA(Lt Le* Ide &jA) aA A4e4 %tAE
Lipp&*1611fi 4. #aoM.'W' Ie 45i aPa4e - P&A rmtopkiko,&sS $4a
6.fl.c%(6i .5auayatwG i&ay.+'%a Ilia C-' 8~- 0 .' . 'o4-4 -6
oeF~ ~p - A- PS&wi~ e; I.de nO Bj1 i~rwk cc"". 011 jX Ptnw 6( 11-i- tcl
*k SA'ho' +10 aa '6 C G- s k.- 4 ,i 4f,, (A. X fld 9% 6, -~A~. A ~~ea~(4 ~~flkrJ&,3CL (1m) o(f cnzsnlatSJ f'ej\ Adc W~& 4 ' X j6 .51."vas ,ja
ciak &fL ( P c4 . !5wl p1n Aiu~v gt.tir~m
Ijkt.&i PtA- me 1 Sa . (4,"j e'rc:r.Iihke Pc A - NP !C, IP -11
20 DISTRIBUTION /AVAILABILITY OF ABSTRACT 21 ABSTRACT SECURITY CLASSIFICATION
5 UNCLASSIFIED/UNLIMI TED 0 SAME AS RPT L TIC USl:RS
22a NAME OF RESPONSIBLE INDIVIDUAL 22b TELEPHONE (include Area Code) I22c OFFICE SYMBOL
DD FORM 1473, 84 MAR 83 APR edition may be used until exhausted -SECURPITY CLASSIO CATION OFTHIS_-PAGEAll other editions are obsolete

1 0
POLY(ETHYL ACRYLATE) AND POLY(--BENZYL-L-GLUTAMATE):
AN INTERPENETRATING POLYMER SYSTEM
A THESIS
SUBMITTED TO THE FACULTY OF THE GRADUATE SCHOOL
OF THE UNIVERSITY OF MINNESOTA
BY
PETER RENE GIBSON
IN PARTIAL FULFILLMENT OF THE REQUIREMENTS
FOR THE DEGREE OF
MASTER OF SCIENCE
DTICJUNE, 1988 I
~AUG 1O01988~
" ..'..
DISThTBUTION STA. T.A
Apprvfor pubic releS88Distribution Unlimited.
ABSTRACT
The rigid rod polymer poly(fibenzyl-L-glutamate) (PBLG) dissolves in ethyl
acrylate (EA) at elevated temperatures. Upon cooling to room temperature, a gelpl
is formed. Phase separaticn occurs on a submicron level. The PbLG forms a con-
tinuous submicron network. The sample is homogeneous to the eye. With the ad-
dition of an initiator to the EA, the vinyl monomer may be polymerized to form
poly(ethyl acrylate) (PEA). When the polymerization initiated by photochemical
initiator occurs from the EA-PBLG gel state, no gross change in the PBLG net-
work occurs. A polymer film of linear PEA and PBLG is formed. With the addi-
tion of an initiator and crosslinker to the EA, EA may be crosslinked upon
polymerization from the EA-PBLG gel state. An interpenetrating polymer net-
work (IPN) of crosslinked PEA and PBLG is formed. Rheologically, the storage
and loss moduli variations due to changes in frequency, strain, and PBLG con-
centration are examined for each type of sample. Additionally, the effects of
crosslinker concentration is examined for IPN's. The characteristics of the PEA
made in the laboratory are compared to commercial PEA samples by nuclear mag-
netic resonance (NMR) spectroscopy and gel permeation chromatography (GPC).
The swelling and leaching traits of the PEA-PBLG samples are investigated using
methanol. Methanol is a good solvent for PEA but a non-solvent for PBLG.. The :Z
results in all areas are related into an understanding of the structural and dynamic . /
properties of the EA-PBLG gel, linear PEA-PBLG film, and crosslinked PEA-
PBLG IPN.
-. __S
!I

ACKNOWLEDGEMENTS
S
The author would like to thank Professor Wilmer G. Miller for his continuous
support and guidance in all phases of the thesis preparation. His assistance was
very enlightening and greatly appreciated. Additionally, a heartfelt thanks to my
wife for her understanding and encouragement when things seemed least likely to
be accomplished.
*i "
S]MI,
Accession For
NTLz 9 7:iA& I 'El .C T;. 0
I '. <': .;,,' fV d ElI .. . .. .. .
Ij
&-.':' ' _ -. .'Sl

TABLE OF CONTENTSS
CHAPTER 1: BACKGROUND 1
1.1 Introduction 1
1.2 Nomenclature 2
1.3 Polymer Phase Behavior 4
1.3-1 Random Coil Polymer Phase Behavior 5
1.3-2 Rigid Rod or Stiff-chain Polymer 6Phase Behavior
1.4 Liquid Crystallinity 7
1.4-1 Formation of Liquid Crystals 7
1.4-2 A Rigid Rod Polymer in Liquid 8Crystals PBLG
1.5 Interpenetrating Polymer Networks 10
1.5-1 Early Studies on IPN's 11
1.5-2 A Random Coil Polymer in IPN's: 13PEA
1.6 A Rigid Rod Polymer in Blends and 15Copolymers: PBLG
1.7 Theoretical Development 16
1.7-1 Models of Random Coils in 17Viscous Flow
1.7-2 Models of Rigid Rod Particles in 18Viscous Flow
1.7-3 Models of Helix-Random Coil 19
Transition
1.7-4 Models for Modulus of Composites 20
1.7-5 Comparison with Experimental Data 23
1.8 The Focus of This Thesis: 24A Random Coil-Rigid Rod Polymer System
-w4w
CHAPTER 2: EXPERIMENTAL 26
2.1 Choice of the PEA-PBLG System 26
2.2 Formation of an Ethyl Acrylate- 27PBLG Gel
2.2-1 Evaporation of the Solvent 29
2.2-2 Solubility of PBLG in the Solvent 30
2.3 Solvent Polymerization in the PBLG- 31Solvent Gel
2.3-1 Thermal Versus Photochemical 34Initiation for PEA Formation
2.3-2 Reaction Time Windows 36
2.3-3 Confirmation of PEA Characteristics 37
2.4 Formation of PEA-PBLG IPN 38
2.4-1 The Crosslinking Agent: Ethylene 38Diacrylate
2.4-2 Avoiding Stress Buildup in 39Crosslinked PEA
2.4-3 Swelling and Leaching of 40Crosslinked Samples
2.5 Rheology 41 0
2.5-1 Rheological Background 42
2.5-2 Rheological Theory 43
CHAPTER 3: RESULTS AND DISCUSSION 45
3.1 Formation of PBLG-Vinyl Monomer Gels 45 .4N.
3.2 Ethyl Acrylate-PBLG Gels: Rheology 46
3.2-1 Frequency Dependence of EA-PBLG 46Gels' Dynamic Moduli X
3.2-2 Strain Dependence of EA-PBLG 46 %Gels' Dynamic Moduli -N
3.2-3 PBLG Concentration Dependence uf 47EA-PBLG Gels' Dynamic Moduli
11

3.2-4 Trends in EA-PBLG Gels' Dynamic 47Moduli 0
3.3 PEA-PBLG Films: Rheology 49
3.3-1 Frequency Dependence of PEA-PBLG 49Films' Dynamic Moduli
3.3-2 Strain Dependence of PEA-PBLG 50Films' Dynamic Moduli
3.3-3 PBLG Concentration Dependence of 51PEA-PBLG Films' Dynamic Moduli
3.3-4 Trends in PEA-PBLG Films' Dynamic 52
Moduli
3.4 PEA-PBLG Interpenetrating Polymer 53Networks: Rheology
3.4-1 Frequency Dependence of PEA-PBLG 53Interpenetrating Polymer Networks'Dynamic Moduli
3.4-2 Strain Dependence of PEA-PBLG 54 W,Interpenetrating Polymer Networks'Dynamic Moduli
3.4-3 PBLG Concentration Dependence of 55PEA-PBLG Interpenetrating PolymerNetworks' Dynamic Moduli
3.4-4 EDA Concentration Dependence of 55PEA-PBLG Interpenetrating PolymerNetworks' Dynamic Moduli
3.4-5 Trends of PEA-PBLG 56Interpenetrating Polymer Networks'Moduli
3.5 PEA Characteristics 57
3.6 Swelling and Leaching in PEA-PBLG 58 % ..-
Interpenetrating Polymer Networks
CHAPTER 4: CONCLUSIONS 92
REFERENCES 96
APPENDIX 104
N N N N N

S
CHAPTER ONE: BACKGROUND S1.1 INTRODUCTION
Since World War II, when American scientists developed styrene-butadiene
rubber (SBR) as a substitute for natural rubber, research on polymer synthesis
and properties has blossomed. As it became accepted that these macromolecules
existed, studies of their properties began and theories on the mechanisms of syn-
thesis were developed.
Today, polymers are accepted, yet still intriguing, molecules. It is hard to im-
agine our world without plastics. As a slew of polymers were studied, the concen-
sus on the structure of polymers was that of a random coil. More study lead to the
discovery of a rigid rod or stiff-chain structure. Investigations continued as the uses
of polymers increased. The versatility of polymers amazed scientists as the varying
properties of individual polymers became known.
As efforts were turned to controlling the physical properties of polymers,
various synthesis techniques were developed by altering reaction conditions. Mix- .
tures of polymers became commonplace and their interactions, mechanisms, and
physical properties were investigated. The growing interest in combining polymers
to obtain polymer blends with different properties lead to a barrage of related .,,
terms. These various terms for polymer combinations are based on the way in
which the polymers interact with themselves and each other.
N
S. 1
o .. . - € ..1
,.OU , ,, ",' t . ' ?O:."-': . .",' .- ,r-" " . . ." .- ,r .-.-.- " , . . r - - . - - - . . ., - - . . . . . ,. ..
. X : %
%%
g' •
' *" % % * %
%" ' "" " " % " % " °"N" - "'

1.2 NOMENCLATURE
A polymer blend can be considered a combination of two polymers without any
chemical bonds between them. A graft copolymer has chemical bonds between the
two homopolymers. A graft copolymer can be made when a monomer is in the in-
timate presence of a polymer and the monomer is polymerized. The actual extent,,)
of the grafting between the homopolymers of the copolymer formed may be very
small. An interpenetrating polymer network (IPN) also involves the polymeriza-
tion of a monomer in the intimate presence of a polymer: however, at least one of
the resulting polymers is crosslinked. So, IPN's may he considered a special type
of graft copolymer. 0
But, confusion still exists. The term interpenetrating polymer network was first e%
introduced in the chemical literature in 1960 by J. R. Millar [I]. Primary, secon-
dary, and tertiary networks were formed. The primary network was a conventional
crosslinked network of a solution of 50 % divinylbenzene (DVB), by weight, in
ethylstyrene and styrene. To make the secondary network, Millar swelled the
primary network with the same styrene and 50 % DVB solution, then crosslinked
and polymerized the solution. The procedure was repeated to form the tertiary
network.
From Millar's work, other scientists developed variations in sequencing of
polymerization and crosslinking, in which polymer was crosslinked, and in the
compatibility of the individual polymers. Klempner et al. [2] suggested three -,,",
methods of classifying IPN's. They used IPN as a general term to denote a
polyblend with permanent entanglements made by homocrosslinking of the two
polymers with no covalent bonds between the polymers. ",
e e'lm e

The first method, based on morphology, considers completely interpenetrating
polymer networks (CIPN) as the ideal case where no phase separation is present.
However, due to the incompatibility of most polymers, most IPN's are only par- . ,tially interpenetrating and are more appropriately called phase separated IPN's
(PSIPN). Some systems are semicompatible or partial IPN's (PIPN). The final
distinction in this classification scheme is the quasi IPN (QIPN) which shows a
single glass transition temperature, as a CIPN would, but no proof of complete
miscibilitv has been established.
The second method of Klempner et al. is predicated on the IPN synthesis tech-
nique. A latex IPN (LIPN) is made by emulsion polymerization of individual
monomers which are then combined, coagulated, fused, and crosslinked. Simul-.4..
taneous interpenetrating networks (SIN) are combined in bulk or solution. A SIN
may be made by combining two different monomers with crosslinking agent and
catalysts. The monomers must be chosen so that no coreaction occurs allowing
each monomer to be homopolymerized. A sequential IPN (SIPN) is formed by
proceeding through the synthesis steps in order. This means that one polymer is
completely polymerized and crosslinked while the other is still a monomer. The •
foamed IPN (FIPN) has cellular structure as it is blown into a foam.
The third method presented by Klempner et al. is the non-topological scheme.
It deals with interpenetrating homopolymer networks (IHPN) similar to Millar's
IPN's where the same polymer or copoiymer is swollen with its monomer. Also.
joined IPN's (JIPN) consider the situation where significant intramolecular
crosslinking exists. Finally, when two polymers form an IPN while only one is 0
crosslinked. a pseudo IPN (PDIPN) is made.
%. %14V
A. -
"%' .5
. '. , ' t . '. '.2 .. '.•, , '' .'' ','; •
.'- ', .', . '.2 , 2''.'" "': ., -o'.:-'. ,' '..'k,'.- , 5 , "'.'','k ,, ,3' ,,W, ' '.- ,'- .. Je 4:,

The PDIPN has also been referred to as a semi- IPN [3]. A semi-IPN of the *.-.
first kind (semi-1-IPN) is where the initial polymer is crosslinked. A semi-IPN of
the second kind (semi-2-IPN) is where the monomer being polvmerized to form
the IPN is crosslinked.
As Klempner et al.'s systems hint, there are thousands of different combinations
of possible synthesis steps, crosslinking performed, and actual modes of grafting.
Sperling [4] suggested a qualitative and quantitative approach to organizing pos-
sible structures. Then, Sperling and Ferguson [5] developed a system based on
group theory to describe these combinations. Since morphology of the materials F
formed, and hence physical and mechanical properties, are strongly influenced by
synthetic sequence, a way to singularly describe a particular combination is impor-
trint. However, this system has not been universally accepted. Sperling et al. [6]
offered a variation of the earlier group theory system based on mathematical
rings. This system uses two binary operations; one involves polymeric combina-
tions without bonds and the other represents combinations with bonds.
1.3 POLYMER PHASE BEHAVIOR
The phase behavior of a polymer-diluent system depends on the structure of the
polymer. A random coil polymer in solution has phase behavior that differs vastly
from the phase behavior of a rigid rod polymer in solution.
P1 --Vxe, NI-
Z-.--

)Q00j~K~x1% . ) .
%
1.3-1 RANDOM COIL POLYMER PHASE BEHAVIOR
Flory [7-111 investigated the thermodynamics and phase equilibria in various
polymer-solvent systems. Consider a standard temperature versus composition
phase diagram for a random coil polymer solution. The phase diagram (Figure
1.1) for a given molecular weight polymer has two regions. Region I is a one phase
polymer-solvent region, while region II represents a two phase polymer-solvent
region. The two phases of region II both contain polymer and solvent, however.
one phase is polymer rich while the other is polymer poor [121.
T
M IP •
VOLUME FRACTION )
Figure 1.1. Phase Diagram (Temperature vs. VolumeFraction) for a Random Coil Polymer-Diluent System.
(adapted from [7])
N - ' 1
5
4, P( %,
%%,%~:.%4.%:-4 .
I "-~ . e ,. 1 4 *.~*~~ . . 4 - 4
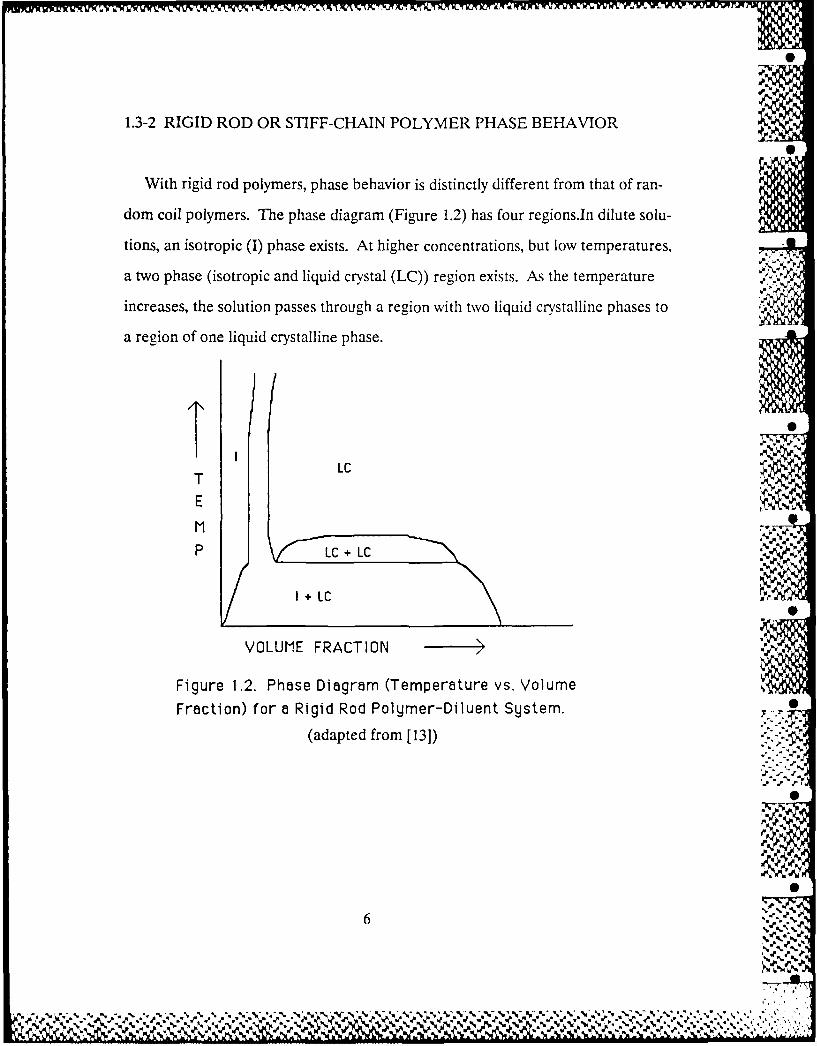
1.3-2 RIGID ROD OR STIFF-CHAIN POLYMER PHASE BEHAVIOR
With rigid rod polymers, phase behavior is distinctly different from that of ran-
dom coil polymers. The phase diagram (Figure 1.2) has four regions.In dilute solu-
tions, an isotropic (I) phase exists. At higher concentrations, but low temperatures, -_
a two phase (isotropic and liquid crystal (LC)) region exists. As the temperature
increases, the solution passes through a region with two liquid crystalline phases to
a region of one liquid crystalline phase.
LC "
T 7E
MP LC +LC
I LC
VOLUME FRACTION
Figure 1.2. Phase Diagram (Temperature vs. Volume
Fraction) for a Rigid Rod Polymer-Diluent System.
(adapted from [13])
66
'I ,
% % 1
1.4 LIQUID CRYSTALLINITY
One of the most interesting characteristics of rigid rod polymers in a diluent is
their ability to form a single liquid crystalline phase or a two phase liquid crystal-
line region depending on conditions. The liquid crystalline state is characterized
by long range as well as short range orientationally ordered molecules. The
molecules are either nematic, smectic, or cholesteric. Nematic structure allows for
translational mobility of constituent molecules, while the molecular layers of the •
smectic structure limits translational movement. If optical chirality exists, the
nematic phase has a twist and is referred to as cholesteric.
1.4-1 FORMATION OF LIQUID CRYSTALS
Liquid crystallinity, or mesomorphism, is usually induced in one of two ways.
The first method is enantiotropic or heating from a solid phase. The second
method is monotropic or supercooling of the isotropic liquid phase below the melt-
ing temperature. Enantiotropic liquid crystals are thermodynamically stable and
can be obtained on both heating and cooling cycles. Monotropic liquid crystals are
metastable with respect to the solid and are seen in the cooling regime only [14].
As with most rules in life, there are exceptions. Lyotropic polymer liquid crys-
tals spontaneously form a fluid having long-range order when in the presence of a
solvent [15]. This state results from selectively weakening specific crystalline lat-
tice sites [14].
In studying the formation of the lyotropic mesophase, viscosity dramatically in-
creases when the concentration of the rod-like solute is increased. This trend con- '-
7%
4. *A, 0, 1% % %* %

tinues until a critical concentration is reached where a sharp decrease in viscosity
accompanies the formation of the lyotropic mesophase [14]. O
1.4-2 A RIGID ROD POLYMER IN LIQUID CRYSTALS:POLY( -- BENZYL-L-GLUTAMATE) - PBLG
Poly(- -benzyl-L-glutamate) (PBLG) (see Figure 1.3) is a rigid rod polymer.
Polymerization can be achieved by solution polymerization of the monomer, the
N-carboxyanhydride of the benzyl glutamate, using base initiation. PBLG provides
an opportunity to study a material whose order is well defined in both the solid and
liquid states. The order is incumbent upon the conformational structure known as
the a-helix. This trait is not a unique structure; it may vary with changes in en- S
vironment [16]. 0
-E-- Nil - CII - -
CII1
011)
C =0
Figure 1.3. Poly( -t - benzyl-L-glutamate) (PBLG).
In the mid 1950's, Lundberg and Doty [17] studied the synthesis and structure of
PBLG in different solvents as part of a series of investigations on polypeptides.
Since then, PBLG has been studied extensively in dimethylformamide (DMF) [15,
18-27], m-cresol [15, 27-32], toluene [18, 19, 33], chloroform (CIul) [21, 34-37],
benzyl alcohol [38], and in other solvents [15, 21, 22, 37, 39-41].
8

Miller et al.[18] found that PBLG-DMF samples went from a fluid state to a gel
state upon entering the wide biphasic region by cooling. This observation suggests
a change in morphology. Rheological studies done by Miller et al. on the PBLG-
DMF system, a compatible system, and PBLG-toluene, a system where PBLG
end-to-end aggregates, give similar results. The PBLG-toluene system and a
PBLG-DMF-water system entered the wide biphasic region at room temperature
and above.
Wee and Miller [25] constructed a temperature-composition phase diagram for
the PBLG-DMF system in the temperature range of -20* to + 140" C and a com-
position range of 0 to 40 weight percent polymer. Warren et al. [27] studied the
molecular weight dependence of both the storage and loss moduli of PBLG in
DMF and m-cresol in dilute solution.
In further work by Miller [15], the molecular dispersion of fairly polar solvents
such as DMF and m-cresol show no evidence of association, while less polar sol-
vents tend to associate even at high dilution. Miller contends that while the vis-
cosity is highly concentration dependent for the isotropic phase, it drops sharply
upon crossing into the narrow biphasic region. When the narrow biphasic region is
traversed, the viscosity of the PBLG-DMF system rises again while no such effect
is seen in the PBLG-m-cresol system.
Asada et al. [28] studied the rheological properties and structures of con-
centrated (10-40 weight %) solutions of PBLG in m-cresol at various shear rates.
Similar studies have been conducted by Kiss and Porter [29] and more recently
(1986) by Moldenaers and Mewis [30].
Ookubo et al. [31] attempted to interpret the results of studies on dilute solu-
tions of PBLG in m-cresol by three mechanisms. The mechanisms are end-over-
9
ail' 41

end rotation, flexural deformation, and side-chain motion. All of the mechanisms
were successful in describing the viscoelastic relaxation of PBLG in m-cresol,
however, the dependence on the contour length varied in each mechanism.
Miller et al. have also studied the PBLG-toluene system [18,19] finding that
storage modulus is virtually independent of frequency, concentration, molecular
weight, and temperature of formation [19]. Chakrabarti and Miller [33] examined
PBLG-toluene aggregation as a function of concentration, temperature, molecular
weight, molecular weight distribution, stereochemistry, and the presence of a
hydrogen bonding competitor and discovered end-to-end aggregation is the
predominant mode for PI3LG in toluene.
Sasaki et al. [38] discovered two transition temperatures when cooling a
PBLG-benzyl alcohol system from 70* C to room temperature. A different struc- S
ture of the aggregates exists at each of the transiton temperatures. The authors
assert that one transition is due to quenching and the other is due to slow cooling.
Additional studies have been done on PBLG structure [42-521, PBLG side-
chain mobility [26, 39, 53], PBLG birefringence [54, 55], and PBLG aggregation
[56, 571.
1.5 INTERPENETRATING POLYMER NETWORKS
IPN's have been studied in many forms. A problem continues to exist in the
identification of the type of IPN being studied. In this section, no attempt has
been made to classify the type of IPN being examined in a particular investigation.
This has been consciously omitted due to the lack of detail presented in the cited
references.
10
V ~ .,S ~ 5* "_ I ' % .

0
In many cases, the type of IPN is not specified; however, the synthesis tech-
niques and morphology are discussed. While, in these cases, it may have been pos-
sible to determine a specific type of IPN studied, the value of such a determination
would have little significance in view of the fact that no accepted standard
nomenclature exists.
1.5-1 EARLY STUDIES ON IPN'S
Some of the earliest work on IPN's was done by Klempner, Frisch, and Frisch
[58-59]. They looked at crosslinked poly(urethane-urea) (PUU) and linear
poly(butadiene-acryonitrile) (PBA) [581 as aqueous emulsions which were mixed,
together with crosslinking agents and stabilizers, cast as films, then cured to form
the IPN. Later, they studied PBA with poly(styrene-butadiene) (PSB) and
polychloroprene [59].
Other work on IPN's concludes that increasing the crosslink density of the ini-
tial polymer phase results in a noticeably finer cellular structure. This suggests
that cell size is controlled by the swellability of the initial polymer phase [60].
Donatelli et al. [61] derived a semiempirical equation for the phase domain size of
semi-l-IPN's with principal variables of the crosslink density of the initial polymer,
the mass fraction of the second polymer, and the interfacial tension.
The two phase morphology tends to be controlled by the initial polymer, which
generally forms a more continuous phase in IPN's, but is also modified by the de-
gree of compatibility of the two polymers, the polymerization method, and the IPN
composition [3]. 6%
11 Z4
• ' , ' , -I • ,,. " "'" "'° " " " " "' " " ' ' ''' ''' ° " " " " % ' '" $
_ .. s .J, , ." ' ,, v~.e.'_' .;, :. ,.'>r_,.'. .%... '. -. .. ..-.. _ ._.,. ' ,. ,,-....,..,

In 1973, Allen et al. [62-651 studied a poly(urethane)(PU)-poly(methyl
methacrylate)(PMMA) system. The system was prepared by interstital
polymerization of the MMA monomer in a PU gel. The PU gel had been ,,,
prepared in a state of dilution in the MMA monomer. The parameters varied
were initiator concentration for MMA, the molar ratio of isocyanate to hydroxyl
groups, time between gelation of PU and polymerization of MMA at various
polymerization temperatures, the theoretical PU crosslink density, and the overall ,,?
PU-PMMA composition. Some of the trends observed are:
1) the modulus decreases with increases in initiator concentration inthe MMA, while impact strength was relatively constant.
2) shear modulus increases as the time between PU gelation andMMA polymerization inicreases, while impact strength remained con-stant.
3) increases in theoretical molecular weight between crosslinks(decreasing crosslinks) increases impact strength while lowering themodulus. A critical theoretical molecular weight between crosslinksappears to exist where both traits level off. _
4) modulus decreases fairly rapidly from 0-10 % weight by weightPU from the PMMA homopolymer values. Above 10 % the decrease ismore gradual.
Allen et al. also investigated the system's morphology [63], the effects of graft
polymerization [64], and theoretical predictiOns of the modulus of interstitially
polymerized composites [651.
A similar study was done in the same time frame by Dickie et al. [66-681. A
two-stage emulsion polymerization technique was used to make a polyblend from
MMA and butyl acrylate (BA). Only the BA was crosslinked; however, both
semi-l-IPN's and semi-2-IPN's were formed. The morphology, optical properties. '
tensile modulus, thermal expansion coefficients [66], and Young's rnnd,,lls [671
12
'V 'V ~ %~%% ~ V~A~ 'V V~ ':;;. %<
h % ,

w
were examined. Also, a detailed investigation into the theoretical interpretation
and equivalent mechanical models was included [68].
Later, Jordan et al. [69-71] synthesized polyblends of butadiene and
acrylonitrile and copolymers of vinyl stearate and vinyl chloride. Glass transition
and the storage modulus versus temperature curves of he blends and copolymers
[69) and their variations caused by changing reaction temperature [701 were in-
vestigated. The results were analyzed in terms of compatibility of the polymers.
Theoretical treatment was then given to the data obtained [71]. The authors sug-
gested an explanation to the apparent contradiction that some polyblends are
compatible by mechanical spectroscopy and incompatible by thermal analysis.
Since the mechanical transition reflects the properties of a larger volume element
of the microstructure than the glass (thermal) transition, the mechanical transi-
tion would be less sensitive to motion in each separate phase [70].
Locke and Paul [72] studied the effects when grafting was present in a
poly(ethylene) (PE)-poly(styrene) (PS) system. They found both a higher yield
strength and a longer elongation to break in the system with grafting. However,
when crosslinking competes with grafting, the effects of increased grafting are
diminished.
1.5-2 A RANDOM COIL POLYMER IN IPN'S:POLY(ETHYL ACRYLATE) - PEA or
Ethyl acrylate (EA), shown in Figure 1.4, can be polymerized by free radical
polymerization. The resulting random coil polymer is poly(ethyl acrylate)
(PEA)(Figure 1.5). To control the reaction temperature, continuous addition of
13
e. J, % q t~N

monomer at a rate which allows the heat of reaction to be dissipated by the heat '
transfer capacity of the reactor is often necessary [73].
CH2 = CII .
C = 0
0
Cl, - Il3 -'"1
Figure 1.4. Ethyl Acrylate (EA). •
E-(-- C1 - C ----
C - -
0
&2 - CI13
Figure 1.5. Poly(ethyl acrylate) (PEA).
In the late 1960's and early 1970's, PEA was studied in an IPN with
poly(styrene-co-methyl-methacrylate) (PS-MMA) by Huelck et al. [74-75] and
with poly (styrene) (PS) by Sperling and Friedman [76].
Huelck et al. found that incompatible materials exhibit two sharp glass transi- ,
tions while semicompatible or compatible materials have one broad transition.
Synthesis details in forming polymer blends tend to control the supermolecular B
morphology. The morphology, in turn, controls the physical and mechanical
characteristics. Huelck et al. support the conclusion that the PEA-PMMA IPN's
have extensive but incomplete mixing while the PEA-PS IPN's are incompatible. S
Later, Jordan et al. [69] found that, in addition to the differences in glass transi-
tion temperatures in compatible and incompatible polymer systems, a similar "..
14
*4 % ;%% %

variation exists in the storage modulus versus temperature curves. Compatible
systems tend to have families of modulus versus temperature curves that shift to g
lower temperatures as the softer component prevails. Incompatible systems ex-
hibit a stepped nature in which two loss maxima, varying in intensity as composi- I
tion changes, exist.
Sperling and Friedman found that in a PS-PEA system, the networks can be
considered chemically independent but mechanically interlocked. Occasional
random chain transfer to polymer does cause some block or graft copolymer for- •
mation. They discovered two distinct glass transitions with a relatively flat
modulus plateau in between. Since the lower glass transition temperature in-
creased from that of the homopolymer and the higher glass transition tempera- S
ture decreased from that of the other homopolymer, this IPN affected the glass
transition temperature in a manner similar to copolymers. This observation sug-
gests that phase separation is incomplete.
1.6 A RIGID ROD POLYMER IN BLENDS AND COPOLYMERS: %POLY(-f-BENZYL-L-GLUTAMATE) - PBLG
Early on, PBLG was often studied with an isomer, poly(-'-benzyl-D-glutamate)
(PBDG). Mixtures of PBLG and PBDG are referred to as PBDLG. Various
studies have been conducted using different PBDLG's.
Baba and Kagemoto [77] determined average values of the heat of dissocia-
tion of stacked side-chain benzyl groups in mixtures of PBLG and PBDG. Also,
Tokita, et al. [78], studied the dynamic mechanical properties of various PBLG,
PBDG mixtures.
15

Iizuka [79] studied poly(-y-ethyl-L-glutamate) (PELG) with PBDLG and -
noticed that under shear stresses, long rod-like molecular clusters form in the
solution. Increases in shear rate produce a decrease in steady shear viscosity be-
cause of the orientation of molecular clusters or of aggregates.
Copolymers of BLG-butadiene, BLG-sytrene, and BLG-butadiene-BLG were
studied by Gallot et al. [801 to determine their structure and conformation. Elias
et al. [81], Aviram [451, and Kuroyanagi et al. [82], studied crosslinking of PBLG.
Elias et al. found that PBLG crosslinks upon transesterifications of diols.
Also, PBDLG [83], PBLG and PS [84], PBLG and poly(B -benzvl aspartate)
[84], PBLG and semi rigid poly(hexyl isocyanate) [85], and others [86, 87] have
been explored.
1.7 THEORETICAL DEVELOPMENT
In this section, theories developed to explain the motion of random coil and
rod-like particles in solution, the helix-random coil transition, and the modulus of
composites are briefly'discussed.
The theory pertaining to random coil and rod-like particles in solution relates
to a random coil or rigid rod polymer in a diluent. The theoretical portion on the ,J
helix-random coil transition is important to understand as this thesis considers
experiments done near the transition temperature. The third segment deals with
, 6the moduli of composites and parallels the rheological measurements conducted
in this study.
16
N- .°

1.7-1 MODELS OF RANDOM COILS IN VISCOUS FLOW
The earliest model of random coil macromolecules in solution was developed
by Kuhn in 1932 [881. This model was descibed by Kramers [89] as the "pearl A:
necklace" model. It consists of a number of particles in which successive particles
are connected by a weightless rod. The mass and frictional constant are the same
for all these particles. The simplest form of the model assumes that the two rods
which meet in the particle are completely free to rotate with respect to each
other. Kuhn developed formula for viscosities based on his model [88,90]. Work
done by Huggins [91], Kramers [89], and Kirkwood and Riseman [92] used the
same basic model, but attempted to account for oversites in Kuhn's theory when 0
developing their equations for viscosity of flexible macromolecules in a diluent.
Later, in the 1950's, Rouse [93] and Bueche [94] developed models. Rouse's
model was predicated on three factors affecting elastic and flow properties.
Those factors are the length of the polymer molecules, the flexibility of theo* '
molecular chains, and the interactions of the segments of a polymer molecule
with other segments of the same and other polymer molecules. Rouse did not at-
tempt to account for relaxation processes or the obstruction of the motions of a
segment by other segments with which it happens to be in contact. Because of
the latter exclusion, good agreement with experimental results can only be ex-
pected in dilute solutions. The model of a polymer molecule is a chain of freely
jointed links, each of identical length with an .ntical number of submolecules.
Rouse's model is less general than the Kirkwood-Riseman model because Rouseo
uses a less detailed description of the configuration of a molecule.
17%= %.] 3
I
R 2 .q,.'*.-5*1 , ."q' -":X ."j ," '"",- :.-:-* % % .*. "" ,.. .: -.. .,. .. ' ::,'"-"..'

-. _ --
Ne0
Bueche's model is a special chain having 3N links each having an identical
average length. He also assumes the bond angle to be 90 degrees with steric
hindrances such that the first link must be pointed in either the + x direction, the
second in the + y direction, the third in the + z direction, the fourth in the + x
direction, and so on. Bueche additionally assumes that any applied force acts in
the x direction and therefore no consideration of applied forces in the v and z
directions is given. Bueche's model fails to consider other than short time
periods nor does it allow for varying friction factors.
Both Rouse and Bueche altered the Kirkwood-Riseman model by eliminating
adjustable parameters from their theories.
In 1956, Zimm [95] made a model similar to Rouse and Bueche. Zimm's
molecule model is a chain of N identical segments joining N + 1 identical beads
with complete flexibility at each bead. He derived an exact solution, valid at all
frequencies and strengths of applied force or flow fields, for a three dimensional
chain problem with Brownian motion and hydrodynamic interaction. The cal-
culations are possible because Zimm ignored internal viscosities and other forms
of interaction which might introduce non-linearity into the coordinates.
1.7-2 MODELS OF RIGID ROD PARTICLES IN VISCOUS FLOW
As far back as 1951, Kirkwood and Auer [961 proposed a model for a rigid rod
molecule in a diluent. They suggested a rigid array of 2n + 1 groups, each with a
friction factor f, spaced at equal intervals b on a linear axis of length L. Each
molecule is bathed in solvent. From this scenario, they mathematically• . 41%
developed the value of intrinsic viscosity based on L, b, and molecular weight. -
18',
* 0 ~~- % ." % %

In the late 1960's, Ullman [971 attempted to improve the Kirkwood-Auer
model by considering the finite cross-section of the rod. He was able to remove
intrinsic viscosity's dependence on an arbitrary bond length that Kirk-wood and
Auer found.
In 1978, Doi and Edwards [98-99] expanded Kirkwood and Auer's theory to
deal with concentrated solutions. Doi and Edwards considered the difference in
diffusion coefficients for a rod based on direction; motion along the axis of the
rod having a greater diffusion coefficient than motion perpendicular to the rod
axis.
1.7-3 MODELS OF HELIX - RANDOM COIL TRANSITION
In 1959, Zimm and Bragg [1001 developed a theory for the phase transition
between helix and random coil in polypeptide chains. They attempted to distin- •
guish between the contributions of a bonded and of an unbonded segment to the
partition function. Additionally, the theory considers the influence of the state of
neighboring segments on these contributions. To accomplish this, Zimm and
Bragg assume the state of a chain can be completely described by the state of the
oxygen atoms alone or, in other words, that if bonding of a segment occurs, it is
always to the third preceding segment. Finally, since this theory deals with the ,
thermodynamics of the transition from random coil to helix, the authors do not
describe quantum states or phase space of individual segments in detail.
The next year, Nagai [101] derived formal expressions for the mean square of
the end-to-end distance and the electric moment of polypeptide molecules in the
helix-coil transition region. In 1961, Nagai [102] used a less rigorous model to
19
Il

account for the effect of degree of polymerization, which he had neglected in his
earlier model.
Also in 1961, Flory [103] outlined three first order transitions which are ob-
served in polypeptide solutions. The transitons are:
a) widely observed crystallization and melting of polymers; the crystal-line phase comprising close packed molecular chains in their preferredrod-like (helical) conformations.
b) dissolution and re-aggregation of the crystalline polymer to yield a ,dispersion of individual molecules without alternation of conformationand reversal of the process with reconstitution of fibrils.
c) the familiar helix-coil transiton featured by synthetic polypeptidesdispersed in dilute solutions.
Earlier, in 1956, Flory [104] used a model for long chain polymer molecules
consisting of isodimensional segments which tend to arrange themselves in co-
linear succession. A fraction of the bonds is assumed to be bent out of the direc-
tion of the preceding segments.
Then, in 1965, Flory and Leonard [105] expanded Flory's model above to ac-
count for coexistence of a phase of high concentration in equilibrium with a
dilute phase. This occurance suggests that the soluble-helical polypeptides, such
as PBLG, no longer exist in solution as mixing is unfavorable.
Also, theories have been proposed by Rajan and Woo [106] and Kubo [23].
1.7-4 MODELS FOR MODULUS OF COMPOSITES 0
The simplest model used to consider the modulus of a composite or a blend .'
was developed by MacKenzie [107] in 1950. The model has a bulk material that .
contains isolated spherical holes distributed at random throughout the volume of
20
** %, % *

the material. The bulk material has homogeneous and isotropic elastic
properties. Finally, the volume of holes is small compared to the total volume;
however, the total volume contains a large number of holes.
In 1956, Kerner [108] described the shear modulus and the bulk modulus of a
macroscopically homogeneous and isotropic composite in terms of the moduli
and concentrations of its components. Kerner assumes the components to be in
the form of grains. The grains are suspended in and bonded to some uniform
suspending medium. Also, the grains are spherical and distributed randomly in •
space.
Later in the 1950's, van der Poe] [109] calculated the rigidity of a concentrated
solution of elastic spheres in an elastic medium. The theory accounts for the
pure mechanical-geometrical effect of the presence of the particles only. Al- ." N
though the original theory was meant for dilute dispersions only, van der Poel ''
found fair agreement with experimental data up to a 60 % volume concentration.
The finding was supported in two systems. One system was mineral aggregate_%
particles, such as sand, in soft and hard bitumen. The second was glass spheres in %
PMMA.
A major effort to develop a mechanical model of a composite system was ,
made in 1963 by Takayanagi et al. [110]. A model for two components in parallel
and a model for two components in series were first explained (Table 1.1). They
then proposed two combinations of these parallel and series components to
describe the system of composites (Table 1.2 - Model 1 and Model 2). The main
difference in the two models is the relationship between the strain of the R ele-
ment and the strain of the P element. In Model 1, the strain in the R element is
always equal to the strain in the P element in parallel with it. In Model 2, the
21
OP 0144

%Table 1.1Takayanagis Parallel and Series Models
System Diagram Modulus
Parallel PR1-A (EQN 1.1)
PSeries G* +
R G; G;
(EON 1.2) 0
Table 1.2Takayanagi's Model 1 and Model 2 for a Composite Modulus
System Diagram Modulus
)_P_ _ _ _ 1-.Model 1 G"=( +-
(EON 1.3)
P P A
Model 2 R- G*=, G; G;
(EON 1.4)
22YI I " " -"-
- .v~.,- - - ".4,

strain in the R element differs from the value of the strain in the P element in
parallel with it. Later, they [111] computed two parameters, \ and , represent-
ing the mixing state for a system of spherical particles. With 02 representing the
volume fraction of the particles, equations 1.5 and 1.6 hold. Note that the
product of , and 0 is 02.
, = (2 + 3 15 (EQN 1.5)
0= 5 02/(2 + 3 02) (EQN 1.6)
In 1964, Fujino [112] made models very similar to Takayanagi et al.'s using
parallel and series mechanical relationships.
In the late 1960's and early 1970's, work by Neilsen and Lewis [113] lead to
modification of Kerner's theory to account for the maximum packing factor of the
filler [114-115]. Eventually, Neilsen and Lee [1161 developed a correction to the
modulus to account for skin effect in the rectangular cross section. They assumed
the film thickness to be approximately equal to the radius of the filler particles.
1.7-5 COMPARISON WITH EXPERIMENTAL DATA
In 1964, Tschoegl and Ferry [117] examined solutions of PBLG in
m-methoxyphenol and in dichloroacetic acid. Their findings suggested that the
solutions behaved as an intermediate between predictions of Kirkwood and Auer
for rigid rods and Zimm's theory for flexible random coils. At low frequencies,
the hydrodynamic behavior is essentially rod-like. As frequency increases, devia-
tions from the Kirkwood-Auer theory exist. •
A similar study was done by Warren et al. [27] where the viscoelastic %%'-
properties of solutions of PBLG in DMF and m-cresol were measured. They %
23
% %.
2 %,

found essentially the same results, but concluded that a hybrid function of
Zimm's flexible random coil theory and Ullman's rigid rod theory covered the en-
tire frequency range.
Matsuo et al. [118] collected data on the viscoelastic properties of
poly(acrylate) (PA)-PU IPN's and adequately described it by Model 2 presented
by Takayanagi. They concluded that, since the model is capable of describing the
IPN, the interaction between the two phases is very weak.
The work of Klempner et al. [58] cited previously also found that the Young's
modulus seems to fit Takayanagi's Model 2.
Kraus et al. [1191 studied the dynamic behavior of PS reinforced styrene-
butadiene copolymer. They fit the data to Takayanagi's Model 2 and found the
model reproduced all the essential features of the data. However, an exact fit of
the storage and loss moduli was not obtained. Also noted was the fact that using
the parameters for spherical inclusions did not produce a good fit with data.
The theories for elastic modulus of a composite are based on a rubbery matrix
reinforced with istropic rigid particles. In most cases, this morphology is not
present. Therefore, deviations from the calculated values should be expected.
The model presented by van der Poel appears to give better results than the un-
modified Kerner or Takayanagi models; however, it requires solving eight linear
equations simultaneously [120].
1.8 THE FOCUS OF THIS THESIS:A RANDOM COIL - RIGID ROD POLYMER SYSTEM
This thesis examines a combination of polymers that is relatively unknown.
Initially, the study of the network formed when the monomer solvent, ethyl acry-
24
or 0 , % 0 O 05 I I qP Ile
late, dissolves the rigid rod polymer, PBLG, and the system cools to form a gel is
presented. Next, the gel formed above has the ethyl acrylate polymerized to form
a network consisting of PEA, a random coil polymer, and PBLG, a rigid rod
polymer. Finally, the ethyl acrylate is simultaneously polymerized and
crosslinked throughout the PBLG gel state to form a semi-2-IPN.
Samples in each of the three catagories are investigated rheologically. The af-
fects of swelling and leaching various samples is studied. Additionally, discussion
of sample preparation considerations, to include changes in weight percent of
rigid rod polymer, initiator, and crosslinking agent, is presented.
This thesis extends the idea of polymer solvent systems to include the
polymer-monomer solvent system. Also, it extends IPN's to a new dimension as
the monomer solvent becomes the random coil portion of a random coil-rigid rod
semi-IPN.
25 , ,_r -
% %f" C,'-

CHAPTER TWO: EXPERIMENTAL
2.1 CHOICE OF THE PEA - PBLG SYSTEM
The initial choice of the system used in this research was based on two primary
considerations. First, the ability of the vinyl monomer to dissolve PBLG at
elevated temperature and form a visually uniform gel upon cooling to room tem-
perature. The second primary concern was that the polymer formed from the vinyl
monomer through polymerization after gel formation had to have a glass transition
temperature below room temperature. Secondary concerns were cost, monomer
volatility, and availability of the monomer. PBLG was mixed at about 4.8 weight
percent PBLG with eight different acrylates or methacrylates (weight by weight).
The eight solvents and the weight percent PBLG in the mixtures are shown in
Table 3.1, page 45, where the results are discussed. All mixtures were heated until
the PBLG went into solution or the solvent began boiling. When one of those
points was reached, the mixtures or solutions were allowed to cool. Upon cooling
to room temperature, acceptable systems could be identified by the formation of a
gel with a visually uniform appearance.
The lack of gel formation under these conditions does not mean that under dif-
ferent conditions a gel could not form from a mixture of PBLG with any of these
vinyl monomer solvents. Varying the weight percent of PBLG, the pressure, lower- -
lg the temperature even further, or changing the method of heating the mixtures
may allow the formation of a gel. On the other hand, there is no guarantee that
S
26 % %
-%.5,LW*. 5.5. % '% 5~, .

0any of the mixtures which did not form gels under the given conditions will ever
form a gel with PBLG.
This portion of the experimental work identified the monomer solvents which
easily formed gels with PBLG at room temperature. Thus, ethyl acrylate (EA) was
chosen as the solvent to use in this investigation.
The acrylate was purchased from Polysciences, Incorporated, lot number K595.
All of the PBLG was bought from Sigma Chemical Company. The 120,000
molecular weight PBLG was lot number 107F-5053. The lot number for the
165,000 molecular weight PBLG was 96F-5011, while the 343,000 molecular weight
PBLG was lot number 96F-5014.
2.2 FORMATION OF AN ETHYL ACRYLATE - PBLG GEL
The formation of an ethyl acrylate-PBLG gel was easily accomplished. Typi-
cally, an EA-PBLG sample was heated to about 80* C, stirred until the solution
was visually homogeneous, poured into a teflon mold, and then brought to room
temperature where a gel formed. The use of teflon molds was necessary to get
samples as 25 mm diameter disks needed for the rheological measurements (see
Figure 2.1). In making the 25 weight percent PBLG samples, it was necessary to
dissolve the PBLG in N,N-dimethylformamide (DMF). After at least two days of
stirring, the PBLG-DMF solution was poured into a teflon mold. Since a PBLG-
DMF solution does not gel at room temperature, the samples were then
refrigerated to form a PBLG-DMF gel. Once gelled, the sample was immersed in
ethyl acrylate for at least one day with occasional agitation. This allowed the diffu-
sion of the DMF out of the gel and diffusion of the ethyl acrylate into the gel.
27
~~~%A./ O0 ;P % f "NJV
*N or a..%'X' % 5,

IR
SIDE VIEW _
... .................. .. 40 mm
Teflon Mold K- 25 M M-A I0 mm
TOP VIEW
p rec ut,.- t
Gamles Plt 6mm.
38 l goove ,area 25 m for
o-rn
)- 40 mm -- 70
Figure 2.1. Teflon Mold for Preparation of Samples
Used in Rheological Measurements. ."';
,p%
28
TOP VIE
precutI

S
These samples were tested directly after removal from the ethyl acrylate. The
DMF was purchased from Fisher Scie~itific, lot number 871879.
There are many considerations that should be taken into account when trying to
utilize the gel for experimental purposes. In the following sections, those con-
siderations that needed special attention are addressed.
2.2-1 EVAPORATION OF THE SOLVENT
Ethyl acrylate evaporates readily at room temperature. For this reason, care
must be taken to insure that evaporation is minimized prior to or during an experi-
ment on a gel, or prior to polymerizing the solvent.
In the case of polymerizing the solvent from the gel, the heated solution was al-
lowed to gel by cooling to room temperature after being poured into a 25 mm
diameter teflon mold. The molds were either one or two millimeters deep. Upon
reaching room temperature, a rubber o-ring was placed around the sample in a
precut groove. The mold was then covered with a glass plate to minimize evapora- -Ition of EA. The glass plate was secured with a rubber band to provide tension on
the o-ring and the glass plate. Note also that the lower the weight percent of
PBLG present in the gel the longer it took for the gel to form. This may have al- " N
lowed a slightly larger amount of EA to evaporate from the samples with lower
PBLG concentration.
In the case of the rheological studies on the gels, the problem of EA evapora-
tion during measurements was of concern. Samples were still made as 25 mm
disks in the teflon molds. However, once removcd from the mold the disk shaped
gel went directly into the rheometer. The initial attempt to test the gel led to
29
'.P %

suspect results as the edges of the sample shrunk with the evaporation of EA. To
contend with the evaporation problem, the gel sample was enclosed. The im-
mediate environment became a volume of about 800 cubic centimeters. EA was -w
placed around the sample and in a sponge within the volume to keep the environ- Nment saturated with ethyl acrylate vapors. This minimized the evaporation in the
sample. By taking these precautions, no degradation of the sample was seen
during the rheological study of the samples.
2.2-2 SOLUBILITY OF PBLG IN THE SOLVENT
While the initiators used in this research are covered in detail in section 2.3-1, it
seems necessary to explain here their function so that their effect on PBLG
solubility can be considered. When excited thermally, or photochemically for
photoinitiators, an initiator forms free radicals which allow the vinyl monomer to
polymerize. The heating of a mixture of EA and PBLG could thermally excite an
initiator and bring about polymerization of the ethyl acrylate prior to the PBLG
going into solution.
When the monomer solvent in the gels was not to be polymerized, it was not
necessary to include an initiator in the sample when forming the gels. This made
the preparation of gels far easier to do because the sample could be heated longer
without fear of the initiator being thermally activated. Polymerization of the
monomer prior to a gel bcing formed causes phase separation of the PEA and the
PBLG. This results in a sticky white substance, which is similar to bubble gum in
the manner in which it sticks to objects and shows elasticity.
yS I % % %W % %

Solubility was also affected by the weight percent of PBLG in the sample and
the molecular weight of that PBLG. As the weight percent increased, it took
longer to get the sample into solution. For PBLG of molecular weight 165,000, a
five weight percent PBLG in EA mixture was about as high a weight percent as
would go into solution in the presence of an initiator. With a 343,000 molecular
weight PBLG, a four weight percent PBLG mixture could not be gotten completely
into solution even in the absence of an initiator. .k J
The samples of PEA-PBLG made with three percent or higher weight percent
PBLG were all made with PBLG of molecular weight 165,000 or less. At one and
two weight percent, both the 165,000 molecular weight and 343.000 molecular
weight PBLG were used. Attempts to obtain a five weight percent 343.000 PBLG
PEA-PBLG sample led to the boiling of the EA as the temperature needed to get
the PBLG into solution was higher. This was accompanied by a rapid increase in
the viscosity of the sample.
2.3 SOLVENT POLYMERIZATION IN THE PBLG - SOLVENT GEL
Once a way of forming the gel samples had been found, an extension of that . N.
technique allowing polymerization of the ethyl acrylate needed to be developed
(see Figure 2.2). To poi.!rnerize the vinyl monomer, an initiator would be iden-
tified which did not intc_ ?ere with the forming of the ethyl acrvlate-PBLG gel. The
PEA-PBLG film was formed by polymerizing the EA once an EA-PBLG gel had
been made. Normally, polymerization of EA in a solution of EA and PBLG, leads
to phase separation of the polymers as discussed above. By polymerizing the EA
in the gel state with PBLG, further phase separation is avoided. ,,
31
."-"..-,
*. -P -P4* e * * *4* %i
%~J~? ~

- - . .. s - • A.M ...-'.
7,~~ T7 1V0
S
A B C "
jib.
-.
Figure 2.2. Steps in the Processing of PEA-PBLG Films ''"
and Interpenetrating Polymer Networks.-%
A: Ethyl acrylate-PBLG mixture is heated and stirreduntil a solution is formed.
C: Solution is poured into a teflon mold, allowed to coolto room temperature, and a gel is formed.
C: Gel is subjected to ultraviolet radiation. If the gelcontains initiator, the ethyl acrylate will polymerize.If the gel contains both initiator and crosslinker, theethyl acrylate will polymerize and be crosslinked.
% %
32 %--II- -(, ,., ,., ,. ..., , ,. .., .--. .. _.... _ - .,. .....:, ....,,. ., ...,...... . ,. ,-. .. .- ,.-. -.... ,-..,..,. ....-..,.,. ..-,., ,S,

All of the gels formed were immediately put into the oven or photochemical
reactor, depending on the initiator being used, to begin the polymerization and
avoid evaporation of EA. To control EA evaporation, an open beaker of EA was
put into the oven or reactor to try to saturate the environment within. This did not
appear to affect the polymerization. The fact that the molds were covered with a
glass plate forming a seal with the o-ring or top of the mold makes the possibility - -
of evaporation small. The practice was discontinued after just a few reactions.
Again, the 25 weight percent PBLG samples were formed by diffusing EA into
a PBLG-DMF gel; however, now the samples were removed from an ethyl
acrylate-initiator solution after a day and put directly into the reactor. Both the
o-ring and glass plate cover were still used.
It should be noted that samples of PEA without any PBLG were also made.
These pure PEA samples served as a control group for the PEA-PBLG films being
tested. The major difference in the technique of forming a PEA film versus form-
ing a PEA-PBLG film was due to the differences in behavior before polymeriza-
tion of the solvent. With the EA, the teflon molds were still used. However, the
use of o-rings only facilitated the EA to leave the mold. Contact between the EA
and the glass cover would bring the EA over the mold's edge by capillary action.
This action would caus. contact with the rubber o-ring and the sample would fill
the void between the top of the mold and the glass plate. Thus, in the 25 mm
diameter mold about half of the EA would rise above the top of the mold. To al- •',-. "¢~~
leviate this problem, the o-ring was not used when polymerizing samples of liquid
EA. The samples done in this manner stuck to the glass plate when removed from
the reactor after polymerization. The sample was separated from the glass plate
with a razor blade. After an initial edge of a sample was free from the plate, the
33
, 'ri " -' # i;'P" ' i"- "'1 . ' " '' ''''-''€ ''' €''12''.. • . , ,, . --, . 2 .'2, ,'-,2.2..,'',,':2€q_.'.',L ,& ,2','',, ' .¢., ,., .. _ , . . ,, . ., ,,.' '. "' '€'', ,,.''.',..,,i..- "" ..',"", ",', ", ',*% -,._._. . ... . ... _. . ... . .. , '¢ .N

PEA samples could be removed from the glass plate without destroying or per- ,
manently deforming the sample. -
2.3-1 THERMAL VERSUS PHOTOCHEMICAL INITIATION FOR PEAFORMATION
The first attempts to make PEA-PBLG films were made using benzoyl peroxide
as the initiator. Benzoyl peroxide is a thermal initiator, meaning that free radicals
are formed at elevated temperatures. The benzoyl peroxide was from Matheson
Coleman and Bell, lot number BX470 2838. Attempting to reheat a gel into solu-
tion and then adding benzoyl peroxide was not successful. The benzoyl peroxide
would not dissolve in the solution as the increased temperature of the solution
caused the benzoyl peroxide to burn upon contact. The next step was adding ben-
zoyl peroxide to the mixture prior to heating and forming the gel. It was deter-
mined by trial and error that 0.25 weight percent benzoyl peroxide in the mixture
would allow heating the mixture to form a solution, and subsequent gel formation, ,0
without causing the EA to polymerize. , ,
Using a thermal initiator gave need to heating the sample in an oven to cause
polymerization to occur. There were several complications that arose. First, at
about 40* C the reaction could take up to four or five days to go to completion.
This was, obviously, very time consuming and sometimes lead to ethyl acrylate
evaporation. Higher temperatures, in the neighborhood of 60-70 *C, were near ,,-
the gel-sol temperature for the PBLG-solvent gel. Although gel was still visible, it
was also apparent that a liquid state was forming. Normally, at these elevated tern-
peratures, the reaction took less time (18-24 hours). However, the fatal drawback .
was that phase separation between the PEA and PBLG frequently occurred.
34
% %..
on wv * * *-.- **** *~*0

. , . , .W-W 1 , ., r .
Another, previously mentioned, complication also affected using a thrrmal in-
itiator. Evaporation of the EA was enhanced by the increases in temperature
needed to increase the number of free radicals generated by the initiator. This -
added to the difficulty in obtaining a usable sample from this technique.
In an attempt to overcome the complications of using a thermal initiator, a
photochemical initiator, 2,2-azobisisobutyronitrile (AIBN), was tried. By using a
comparable amount of AIBN instead of benzoyl peroxide, 0.25 weight percent,
heating of the mixture to form a gel was not a problem. AIBN is also a thermal in-
itiator. It is similar to benzoyl peroxide in its response to thermal decomposition
to form free radicals [121]; however, it is not necessary to heat the sample to cause
polymerization. Exposure to ultraviolet light will also produce the free radicals
necessary for polymerization. The AIBN was from Polysciences, Inc., lot number
23482.
The reactor was a Srinivasan-Griffen photochemical reactor from The Southern
New England Reactor Company. This model was named Rayonet and was Model
RPR-100. The Rayonet was outfitted with tubes radiating at a wavelength of 3500
nanometers. The Rayonet was fan cooled. The fan's efficiency was hampered by
the placement of aluminum foil over the top of the Rayonet. The purpose of the
foil was to keep the ultraviolet rays from harming human eyes. To compensate for
the increase in temperature from covering the Rayonet, it was necessary to place -
most samples in a cooling cylinder. The cylinder had cold water running through
its outer shell and keep samples at or below room temperature. Samples in the .,
bottom of the cooling cylinder were cold to the touch even after completion of
polymerization. Those samples supported in the top portion of the cooling -
cylinder were at room temperature when removed. Samples outside the cooling
35
-% %.
cylinder were warm when removed from the reactor. The cooling cylinder kept the
thermal effects of the photochemical reactor from dominating the reaction
kinetics.
2.3-2 REACTION TIME WINDOWS
The reaction time was varied. Three time windows were used. They were four
to six hours, 16 to 20 hours, and over 40 hours spent in the Rayonet with the
ultraviolet light on. By using time windows, the relative reaction time can be com-
pared. Actual reaction times would be meaningless for a number of reasons.
First, the variations in film depth caused by using molds of one or two mil-
limeters in depth meant variations in sample volume. Second, the temperature
variations due to the location of the sample within the Rayonet led to reaction
temperature variations. Third, the difficulty in measuring those different tempera-
tures made the errors difficult to quantify. Finally, the difficulty in controlling the
amount of sample going into the mold meant even molds of the same size did not
necessarily contain the same volume of sample. This was due to the fact that the
sample would gel in a pipet during transfer as the heat rapidly dissipated from the
glass pipet. Thus, time windows are thought to be well within the experimental er-
ror introduced by the factors mentioned.
36
%. lop 0 % g .% %
LM6 4. 1 NZ

2.3-3 CONFIRMATION OF PEA CHARACTERISTICS
PEA was purchased from Polysciences, Incorporated, lot number 42309, and
was shipped as a ten percent solution in toluene. To precipitate the PEA,
cyclohexanol was added to the PEA-toluene solution. The PEA was removed and
washed twice with cyclohexanol. The washed PEA was then placed in a vacuum
oven at approximately 800 C for 18 hours.
A PEA sample made from photochemical initiation was dissolved in methanol.
The solution was then treated as above with cyclohexanol and the precipitated
PEA vacuum dried. Similarly, a PEA-PBLG film was put in methanol. Methanol
is a non-solvent for PBLG. The film was battered by the stirring rod and lost all
continuity of its shape. The resulting mixture was centrifuged to separate the solu-
tion of PEA and methanol from the particulate matter. Once separated, the solu-
tion was also treated with cyclohexanol and the precipitated PEA vacuum dried.
Confirmation of the structure of the PEA samples was done by nuclear mag-
netic resonance (NMR) spectroscopy. Two weight percent PEA was dissolved in
deuterated methanol and a proton spectrum run on each sample. The spectra
were compared to varify that all the PEA samples were the same. The molecular
weight distribution, relative to polystyrene standards, was obtained by conducting
gel permeation chromatography. The samples were 0.5 weight percent in1-methyl-2-pyrrolidinone (NMP).
37

2.4 FORMATION OF PEA - PBLG IPN
The techniques used in forming the PEA-PBLG film from a gel state are basi-
cally the same as those used to form the PEA-PBLG IPN's from a gel state. The
only difference is the addition of a polyfunctional vinyl comonomer. Similar
problems with evaporation and formation of crosslinked PEA samples as a control
group existed. The initiator used was AIBN. The same Rayonet operating at
wavelength 3500 nanometers was also used.
As with the PEA-PBLG film, the 25 weight percent PBLG samples were
formed from the PBLG-DMF gels. The solution covering the gel contained the
AIBN, crosslinker, and EA. Again, samples went directly from the diffusing solu-
tion to the reactor.
Polymerization of the vinyl monomer in the gel state were uneventful.
Problems, however, arose in the absence of PBLG. The remainder of this section
will deal with the crosslinking agent used and the problem of stresses formed in the . C
preparation of crosslinked PEA samples. k-0
2.4-1 THE CROSSLINKING AGENT: ETHYLENE DIACRYLATE
Ethylene diacrylate (EDA) was used as the crosslinking agent because of its
similarity to the EA monomer. The EDA molecule has the form shown below.
The EDA was purchased from Polysciences, Inc., lot number 3-1003. It has a
functionality of four owing to the two carbon-carbon double bonds.
0
38 I41 011

CI2 CIlIii IICl[ Ci[
C - a CI[12 C1[2 0 C
0 4 -Figure 2.3. Ethylene Diacrylate (EDA). i.- ?¢
2.4-2 AVOIDING STRESS BUILD UP IN CROSSLINKED PEAThe technique used to polymerize EA worked well at one weight percent EDA
in the total mixture. However, at five and ten weight percent EDA the sample 0
would curl upon removal from the glass plate. This leads to the conclusion that
during polymerization the sample may not crosslink and polymerize uniformly
throughout the sample. Wetting of the glass plate may also lead to uneven
stresses. To avoid contact between the liquid sample and the glass plate, a deep
well teflon mold was used. The teflon mold was still 25 mm in diameter, but now it
was eight millimeters deep. The amount of sample put into the mold was still only
one to two millimeters deep. The extra space above the sample in the mold al-
lowed for use of the rubber o-ring without contact with the liquid sample. This was
not successful as it appeared that the ultraviolet rays did not reach the sample in _
the deep well. After four days in the Rayonet, polymerization of samples in the
deep well molds had not begun.
39 A
I'. *~ ,, **

2.4-3 SWELLING AND LEACHING OF CROSSLINKED SAMPLES
O
Crosslinked samples do not dissolve in solvents for the non-crosslinked
polymer. To insure that crosslinking was occurring in the samples polymerized
with ethylene diacrylate present, samples were soaked in methanol. Methanol is a
good solvent for PEA. To measure swelling the soaking lasted at least four hours kw*
with gentle stirring. This was accomplished by using a 190 millimeter diameter by
100 millimeter deep Pyrex dish. The sample was on one side of the dish while the
stir bar slowly rotated on the opposite side. The sample was gently pinned to the
bottom of the dish with a glass tube. Measurements of sample diameter and dry
weight were taken before and after soaking. Vacuum drying of the samples for 16
hours was completed after soaking and before the dry weight measurements were
taken.
The time required for the uncrosslinked PEA and unpolymerized EA monomer
to diffuse from the IPN was far longer than that needed for the film to swell to its
maximum size. Very little increase in size was observed after the first two hours of
soaking. So, while the set up of the leaching experiments was identical, the
amount of time spent in the solvent was over 48 hours. The equation governing
diffusion out of a slab [122] can be approximated at sufficiently long times as
cC 8 (-t jr2 D) f0- exp (EQN 2.1)
where eis the concentration of interest, ci is the initial concentration, cf is the final
concentration, t is the time in seconds, D is the diffusion constant in cm 2 /sec, and ,-0
h is the slab width in cm. This equation was used to predict the best and worstcase times for diffusion of half the uncrosslinked PEA and unpolymerized EA to
40
'~~~~~~I V ' ~ V ~ *-

diffuse from the film. With the left hand side of equation 2.1 equal to 0.5 and as-
surning D to be between 10.7 and 108 cm 2/'sec, the best case would be h equal tO
0.05 cm and D equal to 10- 7 cm 2/sec. This gives a result of 1223.8 seconds, or 20
minutes and 24 seconds. The worst case would be h equal to 0.1 cm and D equal
to 10-8 cm 2/sec; giving a result of 48951.2 seconds, or 13 hours and 36 minutes.
This depends, of course, on the accuracy of the estimated values for D. By almost
tripling this worst case figure, the 40 hours spent leaching the samples should give
an excellent indication of over eighty-five percent of the total amount leachable.
2.5 RHEOLOGY
Rheological measurements give the response of a material to an applied stress.
The rheological experiments were done on a Rheometrics System 4. The dynamic
mode with parallel plate fixtures was used. All samples tested were 25 mm in
diameter and varied from 0.75 to 2.5 mm in thickness. The experiments were run
as frequency sweeps from 0.1 to 100 radians per second. The percent strain util-
ized ranged from 0.3 % to 5.0 % strain. All runs were done at room temperature,
approximately 260 C. The storage modulus, G', and the loss modulus, G", were
recorded over the frequency and strain ranges.
The rest of this section gives the background and theory of the rheology -
measurements taken for this thesis. Emphasis is placed on the more conceptual
physical meaning as opposed to the mathematical derivation of the theory.
N
41
%- %1 OL
. . - - .~ ~~ ~~ V * '

_V * V W - *
2.5-1 RHEOLOGICAL BACKGROUND
Various rheological studies have been done on a number of PBLG systems.
None of them really compare to the type of data taken in this work. Most are
PBLG in dilute [27,117], semidilute [28, 123-125], or concentrated [791 solutions.
Some are of PBLG in a liquid crystiline phase [29, 79 126] or films [127]. Rao et
al. [128] also did a study comparing PBLG in solvents which broke down the
a-helix versus PBLG in solvents where the a-helix structure remained. S
Both PEA and PBIG have been studied as a copolymer [129-137]. The
majority of the literature on random coil and PBLG copolymers is on the synthesis
of block copolymers [129-136] with random coil polymers other than PEA. Syn- -
thesis of a block copolymer from EA and the N-carboxyanhydride of methyl
D-glutamate was studied by Yamashita [137]. No study of PBLG and PEA dealing
with synthesis techniques or rheology was found.
There was only Chen et al.'s rheological study [138] of a PBLG-polybutadiene- , -
PBLG tri-block copolymer. Most others dealt with whether PBLG was in the
a-helical conformation [134-135, 139-140]. Others dealt with PBLG-PS and
PBLG-PMMA systems [133, 14 1-142] and their relation to plasma proteins [133,
1421 or as concentrated solutions in dimethylformamide [141].
Chen et al.'s study looked at the dependence of the dynamic storage modulus
and loss modulus on temperature. They showed that Takayanagi's Model 1 and
Equation 1.3 yielded excellent results when the values of A and 0 were optimized.
The systems were PBDLG-polybutadiene-PBDLG and PBLG-polybutadiene-
PBLG. The systems had 81.1 mole percent PBDLG and 81.6 mole percent PBLG
42 V*'
l .] II - * l,*. *1 A AHH i B u 'II eeUci i trrl. Jr I . .V V * . c.. / .: '. -,,
respectively. Other mole percents were studied, but comparisons with
Takayauagi's ModA 1 were not given.
More recently, studies on the rheological properties of PBLG gels have been
done [143-144]. Murthy and Muthukumar [143] did studies of PBLG-benzyl al-
cohol gels. They found that both the storage and loss moduli increased as fre-
quency increased. Also, a maximum storage and loss moduli was found as a func-
tion of the weight percent of PBLG in the sample.
McKay [144] did studies of PBLG in gels with DMF, toluene, and benzyl al-
cohol. He found that the storage modulus increased with increasing weight per-
cent PBLG in PBLG-toluene gels up to two weight percent PBLG. McKay also
found that the stoi age modulus changed very little as a function of strain in
PBLG-toluene gels. However, with PBLG-benzyl alcohol gels, the storage
modulus decreased about an order of magnitude as strain was increased from one
to six percent.
2.5-2 RHEOLOGICAL THEORY
The complex shear modulus, G, of a substance is described as the sum of the
contributions of the storage modulus, G', and the loss modulus, G". The equation
form is
G* = G' + iG". (EQN 2.2)
The storage modulus [145] is defined as the stress in phase with the strain in a
sinusoidal deformation divided by the strain. It measures the energy stored and .
recovered per cycle. Normally, it is plotted versus the frequency in radians per
second with logarithmic scales.
43
k .%. o
- . # " - ° 'J -- ¢ . ¢ . 2 -" .''.''..% -.. '°.V-Z*-'Z'.. ". " ,".' e."."2 - .r".'.. _..

NThe loss modulus [145] is defined as the stress 90 degrees out of phase with the
strain divided by the strain. It measures the energy dissipated or lost as heat per
cycle. It also is plotted versus the frequency in radians per second with logarithmic
scales.
Both the stress and strain will oscillate sinusoidally at the same frequency;
however, the stress is usually shifted out of phase by a constant phase angle 6 withrespect to the strain wave. If -f and a,, are the maximum strain and maximum -
stress, respectively, then the strain and stress can be represented as
= rto sin (wt) (EQN 2.3)
and a =a sin (wt + 6) (EON 2.4)
where w is the frequency in radians per second and t is the time the stress is ap-
plied. This allows the storage and loss moduli to be mathematically expressed as '
G' = (ao/-io) cos 6 (EQN 2.5)
and G" = (ao/oy) sin 6. (EQN 2.6) S
The ratio of G"/G' is known as tan 6 as the sin function divided by the cos func-
tion is the tangent function. ,-" -a*
V l
%
N
44' €
. A
"- " %.. " - " " "yZ " .' % ", " %"- N"" " ''q .'8" ,' " " Z' ">;N.-," ; "" ". .

~2NWNa4 VW XP I~ AFi- U ' ~pj'7.U ~W ~E J J . '
CHAPTER 3: RESULTS AND DISCUSSION
3.1 FORMATION OF PBLG - VINYL MONOMER GELS
Many vinyl monomers were initially tried in an effort to form gels by cooling a
PBLG-vinyl monomer solution to room temperature. Including ethyl acrylate,
eight different vinyl monomers were used. The other seven were n-propyl acrylate, -
iso-butyl acrylate, tert-butyl methacrylate, sec-butyl methacrylate, n-hexyl acrylate,
n-octvl methacrylate, and n-octyl acrylate. Table 3.1 shows the results of those at-
tempts to form a gel with PBLG and the given vinyl monomer. It is not surprising
to find lack of gel formation in systems in which the PBLG did not dissolve sig-
nificantly at 1000 C.
Table 3.1Ability of Various Vinyl Monomers to Form Gels with Given Weight PercentPBLG at Room Temperature
PBLG Gels onChemical Wt L PBLG Dissolves Cooling
ethyl acrylate 4.41 YES YESn-propyl acrylate 4.78 YES YESiso-butyl acrylate 4.78 Partiallv NO 4tert-butyl methacrylate 4.77 Partially NOsec-butyl methacrylate 4.81 NO NO .-.
n-hexyl acrylate 4.81 NO NOn-octyl methacrylate 4.78 NO NO .-.
n-octvl acrylate 4.74 NO NO
45 -
%. % %. % % % %%

3.2 ETHYL ACRYLATE - PBLG GELS: RHEOLOGY %
The major difficulties in studying gels centered around keeping the gel in-
tact when transferring the disk from the teflon mold to the rheometer.
Rheological properties of the EA-PBLG gels were measured and effects of
variations in frequency, strain, and weight percent PBLG were determined.
3.2-1 FREQUENCY DEPENDENCE OF EA - PBLG GELS' DYNAMICMODULI
Ir
Frequency was varied from 0.1 to 100 radians per second. The results are
shown in Figures 3.1 and 3.2, pages 61 and 62, for plotted data and in the Ap-
pendix for tabulated data. At one weight percent PBLG, G' increased slightly
over a thousand fold increase in frequency. Under the same conditions, G"
decreased slightly over the range of frequencies, and was always lower than G'
except at high strain and PBLG concentration. With four and 25 weight per-
cent PBLG, both G' and G" increased slightly over the frequency range.
3.2-2 STRAIN DEPENDENCE OF EA - PBLG GELS' DYNAMIC "'N-MODULI
Strains of 0.3 %, 1.0 %, and 5.0 % were applied to the samples. The data
was shown in Figures 3.1 and 3.2 and replotted in Figures 3.3 (storage ".
modulus) and 3.4 (loss modulus) at selected frequencies. The data show that
G' decreased with increasing strain while G" increased with increasing strain.
At 25 weight percent PBLG the loss modulus showed an overall decrease, but
had a maximum. G' recovered as the strain was decreased back to 0.3 % - .
46 %,

strain, however only to 50 to 80 percent of the initial value. Complete tabu-
lated data can be found in the Appendix.
3.2-3 PBLG CONCENTRATION DEPENDENCE OF EA- PBLG GELS'DYNAMIC MODULI
Gels of one, four, and 25 weight percent PBLG were investigated. The in-
crease in PBLG concentration led to increases in both G' and G". At lower
percent strain, the effects were more dramatic than at 5.0 % strain. In most
cases, the increase was well over an order of magnitude when increasing from
one to 25 weight percent. At 0.3 % strain it was common to see a change of
over an order of magnitude, while at 5.0 % strain G' may have changed less
than an order of magnitude. The data is exhibited in Tables 3.2 (G') and 3.3
(G") below as well as in Figures 3.1 through 3.4.
3.2-4 TRENDS IN EA - PBLG GELS' DYNAMIC MODULI
The trends found in the behavior of ethyl acrylate-PBLG gels are sum-
marized below. The storage modulus increases with increasing frequency and
weight percent PBLG while decreasing with increasing strain. The most
dramatic response is when PBLG concentration is varied. The variations -
analyzed in both frequency and strain do not usually change the storage
modulus over an order of magnitude, ie, the storage modulus showed less thanthe cl PBLG concentration dependence. •
The loss modulus was not nearlv as easy to quantify. The trends were less
reliable. This is likely due to G" values being less reliable than G' values, as
0
47
.J.. . . .................

the stress-strain phase angle is typically close to zero. The loss modulus
generally showed a minimum over the frequency range investigated. The ex-
ception was at low PBLG concentration where G" was relatively constant or
decreasing over the entire frequency range. Variations in strain caused fluc- %
tuations in G". For 25 weight percent PBLG, G" tended to decrease with in-
creasing strain. With lower weight percent samples, G" tended to increase
with increasing strain. Finally, the effect of higher weight percent PBLG was
to increase the loss modulus. In the 25 weight percent PBLG gel, G' strain
softened to the point where it fell below the loss modulus. At lower PBLG
concentration, G' is typically two to ten times higher than G".
Table 3.2.Storage Moduli (G')[(dynes/cm2 ) x 104] for EA - PBLG Gels.
Frequency (rad/s) 0.1 1.0 10.0 100.0 .%Strain Wt % PBLG
1 4.8 7.8 8.8 9.90.3 4 23.0 29.8 32.6 36.6
25 139.8 174.4 176.9 195.0 '--................................... ....................................
1 5.4 6.7 7.7 8.61.0 4 22.4 25.0 27.5 31.3
25 87.6 73.6 76.1 105.9
1 3.9 4.4 4.8 5.75.0 4 7.9 7.8 8.4 9.7
25 7.2 7.6 11.2 24.
48
, % %.
7 :", , .' " '. : , 2 ,,, 2 ' . "" % '." .".2" .' " , , " " ,'¢,, ., ¢ '¢ '. " -..' " " ," .. ",, • " " .. ." . .• ." . " ." -. .".. . . "• • " ." - '."'

Table 3.3.Loss Moduli (G")[(dynes/cm) X 104] for EA - PBLG Gels.
Frequency (rad/s) 0.1 1.0 10.0 100.0% Strain Wt _ PBLG
1 2.7 1.3 0.75 0.880.3 4 4.0 2.8 3.5 3.3
25 67.6 30.9 33.7 34.6
1 2.0 1.2 0.88 0.861.0 4 3.8 4.4 4.7 5.0
25 57.9 53.7 64.9 86.3.......................................................................
1 1.8 1.6 1.7 1.65.0 4 6.2 6.7 7.7 8.8
25 17.6 19.2 25.9 43.5
3.3 PEA - PBLG FILMS: RHEOLOGYI •
i
PEA-PBLG films with zero, one, two, three, four, five, and 25 weight percent
PBLG were investigated. The dependence on frequency, strain, and PBLG con-
centration were determined. Typical data are shown in Figures 3.5-3.7.
3.3-1 FREQUENCY DEPENDENCE OF PEA - PBLG FILMS' DYNAMICMODULI
The storage modulus tended to increase very slightly with increasing frequency,
having typically a V-1 or less frequency dependence. Referring to Figure 3.5, one
observes that at 0.3 % strain from zero to five weight percent PBLG, G' increased .,- ..
over the frequency range. From Figure 3.6, it appears that the same trend holds at . -
1.0 % strain, however the increase is more modest. At 5.0 % strain (Figure 3.7), .,
all the values of G' are very similar from zero to five weight percent PBLG. It ap-
49 k% %
V J%.\..A ~ *. s,.d.% $.%

- - JI .. I . //L
- ' L -. * ,-
pears that the higher the strain the less effect frequency has on the storage
modulus. S
The loss modulus also increases over the frequency range investigated. The 0.3 .
and 1.0 % strain data again show slight increases. The 5.0 % strain exhibits even
less of an effect on G" as frequency increases. The final point is that the frequency - -
has only a small effect on the loss modulus of films with PBLG. More dramatic in-
creases in G" are observed with the pure PEA films over the frequency range. v .
3.3-2 STRAIN DEPENDENCE OF PEA - PBLG FILMS' DYNAMICMODULI
Figures 3.8 and 3.9 display the responses of G' and G", respectively, as strain
was varied. Films with one, three, and five weight percent PBLG were charted. -
G' exhibits minor decreases as percent strain increases. G" appeared far more
constant over the range of percent strains.. .
Figure 3.10 shows the effects of strain variations on the storage and loss moduli
for 25 weight percent PBLG films. At 25 weight percent, G' and G" decreased .. -.
from 0.3 to 5.0 % strain with an approximate dependence of-f' 2. This same
decrease in the moduli was observed with EA-25 weight % PBLG gels, though not
as dramatic.
In Figures 3.11 and 3.12, the effects of taking the rheological measurements at
increasing strain is compared to values obtained when decreasing the strain. In-
creasing strain went from 0.3 to 1.0 to 5.0 percent strain, decreasing strain was in
the reverse order. Notice, in nearly every case, the values for a sample type at the
given strain are very close to one another. However, two trends exist. For G'
higher values tend to be obtained when increasing strain, while for G" lesser
50
%' N. %* %* % %s'~ *,,p*...~ \~ %'~.~A.

values are obtained when increasing strain than when decreasing strain. Even so,
it is not a significant amount in relationship to the overall variance in data taken S
for a given sample type. The overlap of values at 5.0 % strain was considerable
and made a plot of that data of little value. The data for the two, four, and five
weight percent PBLG when increasing and decreasing strain are given in the Ap-
pendix.
3.3-3 PBLG CONCENTRATION DEPENDENCE OF PEA - PBLG FILMS'DYNAMIC MODULI
In contrast to the ethyl acrylate-PBLG gels, no distinct pattern of increases or
decreases in the storage modulus exists. At 0.3 % strain, G' appears to reach a
maximum as weight percent PBLG is increased. The storage moduli of all the
films with PBLG (one to five weight percent) are, in essence, equal at 1.0 % strain.
At 5.0 % strain, most of the data supports that G' has leveled out and is relatively
constant from one to five weight percent PBLG. When comparing one, five, and
25 weight percent PBLG data, as done in Figures 3.13 through 3.15 and Table 3.4,
there is an increase in the storage modulus as the PBLG concentration increases.
However, by 5.0 % strain, the previously consistent pattern of increasing G' is no
longer present.
The loss modulus does not show a distinct pattern either. While G" has a maxi-
mum at 0.3 and 1.0 % strain, it also levels out at 5.0 % strain. The comparison of
one, five and 25 weight percent PBLG data in Table 3.5 (also Figures 3.13-3.15)
shows that G" increases until a 5.0 % strain is applied. Then the increases in G"
with increased PBLG concentration is not present.
51
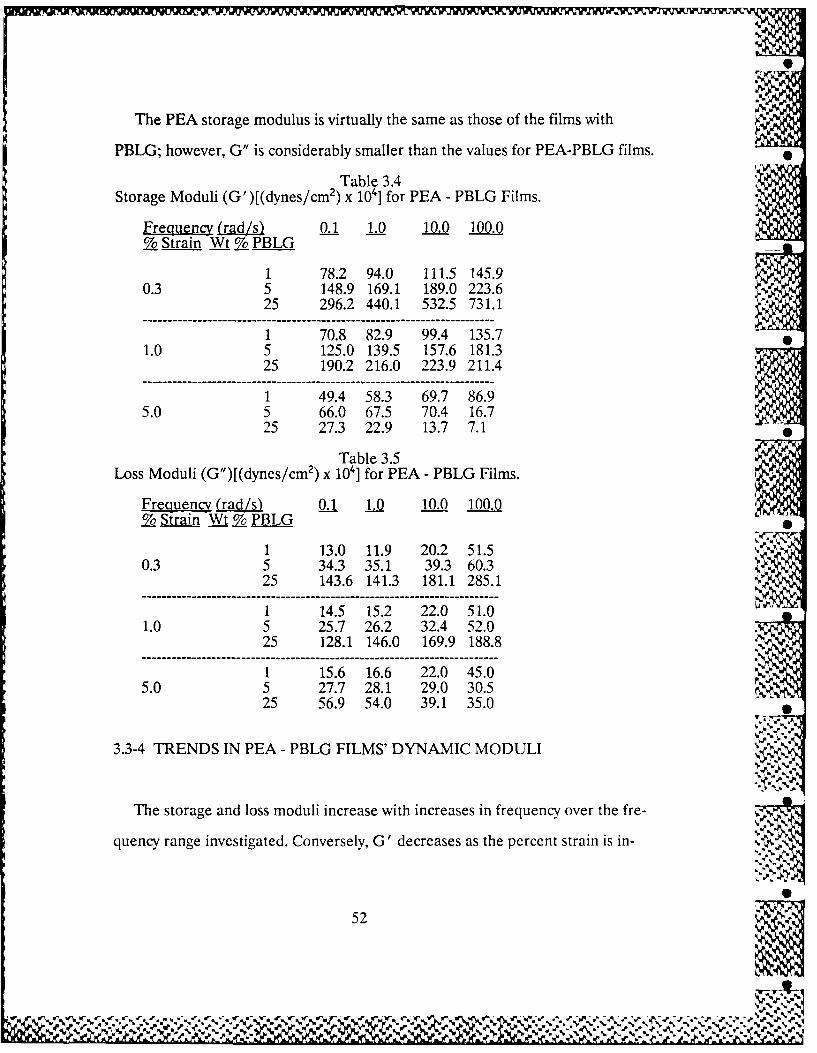
The PEA storage modulus is virtually the same as those of the films with
PBLG; however, G" is considerably smaller than the values for PEA-PBLG films.Storageny Moduli (G' )[(dynes/cm2 ) 3. x14] .__ o E 00 BG100im"Table 3.4,
Storage~~~~~ MouiiO)(ynsc 2 0] for PEA - PBLG Films.
Frequency (rad Is) 0.1 1.0 10.0 100.0Strain Wt . PBLG
1 78.2 94.0 111.5 145.90.3 5 148.9 169.1 189.0 223.6
25 296.2 440.1 532.5 731.1
1 70.8 82.9 99.4 135.71.0 5 125.0 139.5 157.6 181.3
25 190.2 216.0 223.9 211.4
1 49.4 58.3 69.7 86.95.0 5 66.0 67.5 70.4 16.7
25 27.3 22.9 13.7 7.1
Table 3.5Loss Moduli (G")[(dynes/cm 2 ) x 104] for PEA - PBLG Films.
Frequency (rad/s) 0.1 1.0 10.0 100.0.Strain Wt PBLG
1 13.0 11.9 20.2 51.50.3 5 34.3 35.1 39.3 60.3
25 143.6 141.3 181.1 285.1
1 14.5 15.2 22.0 51.01.0 5 25.7 26.2 32.4 52.0
25 128.1 146.0 169.9 188.8
1 15.6 16.6 22.0 45.05.0 5 27.7 28.1 29.0 30.5
25 56.9 54.0 39.1 35.0
3.3-4 TRENDS IN PEA - PBLG FILMS' DYNAMIC MODULI
The storage and loss moduli increase with increases in frequency over the fre-
quency range investigated. Conversely, G' decreases as the percent strain is in-
52
eI
.0 . , .

creased, while G" remains relatively constant from 0.3 to 5.0 % strain. The effects
of varying the weight percent PBLG from one to five in PEA-PBLG films is negli-
gible, but at 0.3 and 1.0 % strains a clear increase in G' and G" is observed from
one to 25 weight percent PBLG. A significant decrease in G' and G" for 25 41
weight percent PBLG films occurs at 5.0 % strain. .
3.4 PEA - PBLG INTERPENETRATING POLYMER NETWORKS:RHEOLOGY
The IPN's were primarily made at one weight percent PBLG with varying EDA
concentration (one to ten weight percent). Some difficulties in preparing samples
with ten weight percent EDA were encountered. Often ten weight percent EDA
samples could be put in the Rayonet for over 72 hours and still no polymerization
would be evident. Thus, when 25 weight percent PBLG samples were to be made
and crosslinked for comparison, the chosen weight percent EDA was only five
weight percent. The results are plotted in Figures 3.16-3.21 and discussed below.
3.4-1 FREQUENCY DEPENDENCE OF PEA - PBLG INTER-PENETRATING POLYMER NETWORKS' DYNAMIC MODULI
The storage modulus tends to increase slightly over the frequency range inves-
tigated. When the weight percent of both the crosslinker, EDA. and PBLG are
high, G' may decrease. The interaction between EDA and PBLG may lessen G',
in addition to the effects of high strain. With one weight percent PBLG and one
weight percent EDA, G' increases. But with one weight percent PBLG and five or
ten weight percent EDA, G' increases at 0.3 and 1.0 % strain while decreasing at
5.0 % strain. A 25 weight percent PBLG and five weight percent EDA sample has
53 1 W

EDA sample has a G' increase at 0.3 % strain, but a decrease at higher percent
strain. Comparison of Figures 3.16 - 3.18 exhibit these traits.
The loss modulus increases in every case except two. Those again correlate to
high PBLG (25 weight percent) and EDA (five weight percent) concentrations at
strains of 1.0 and 5.0 percent. Figures 3.19-3.21 confirm these characteristics of the -
loss modulus as a function of frequency.
3.4-2 STRAIN DEPENDENCE OF PEA - PBLG INTERPENETRATINGPOLYMER NETWORKS' DYNAMIC MODULI
Increasing the percent strain consistently reduced the storage modulus in the
IPN's. Figure 3.22 shows that, for IPN's with various weight percents of EDA, G'
does in fact decrease. In contrast, as shown in Figure 3.23, G' increases with in- .
creasing strain in PEA films.
A dramatic change in the response of G' to strain is seen as weight percent
PBLG is increased. At one weight percent PBLG, the decrease in G' is gradual
and small, while at 25 weight percent PBLG G' dives two orders of magnetude
from 0.3 to 5.0 % strain. Figures 3.22 and 3.23 illustrate the rate of change for G'.
For the loss modulus, increasing percent strain also tended to reduce its value. .-,
However, this trend was not as consistent nor as dramatic as it was for G'. Figures :3.24 and 3.25 illustrate the response of G" to strain. 6
54
. . . . ... . . .
J-'~ % N\
% % %3:kN .%VA

3.4-3 PBLG CONCENTRATION DEPENDENCE OF PEA - PBLG -.INTERPENETRATING POLYMER NETWORKS' DYNAMICMODULI
The storage modulus increased about two fold for a 25 fold increase in PBLG
at 0.3 % strain. As strain was increased to 1.0 %, a 25 fold increase in PBLG led
to a three to five fold decrease in G'. When strain was 5.0 %, the decrease in G'
was almost ten fold over the entire frequency range for a 25 fold increase in .
PBLG. This is shown in Figures 3.16-3.18.
The loss modulus shows increases of two to three fold at 0.3 % strain and of no S
increase to three fold at 1.0 % strain for a 25 fold increase in PBLG. A one to
three fold decrease in G" for a 25 fold increase in PBLG is seen at 5.0 % strain.
Again, this supports that the PBLG structure may be breaking at high strain.
These results are illustrated in Figures 3.19-3.21.
3.4-4 EDA CONCENTRATION DEPENDENCE OF PEA - PBLG 5INTERPENETRATING POLYMER NETWORKS' DYNAMICMODULI
Both the storage and loss moduli increase from one to five weight percent EDA
and then decrease from five to ten weight percent EDA. Figures 3.22 and 3.24
show the dependence on crosslinker concentration for G' and G" respectively.
Each weight percent of EDA is represented by a different type of line. Notice also G
that with variations in crosslinker concentration the storage modulus is more sensi-
tive at 5.0 % strain while the loss modulus is more sensitive at 0.3 % strain.
The fact that a maximum value for both G' and G" is found from one to ten
weight percent EDA is not expected. The increases in available crosslinker should k %.%--'
increase both G' and G". This increasc is observed for G" from 0.3 to 1.0 %
55
- .,.- .31,
% % .

strain. The decreases at 5.0 % strain may be due to the erosion of the PBLG .,..
matrix discussed earlier. However, this discrepancy may have been caused, or at
least assisted, by the fact that the crosslinker was not washed of its inhibitor.
While it was necessary to leave the inhibitor in the ethyl acrylate when heating the
solvent to avoid polymerization, the crosslinker's inhibitor concentration may have
been larger than that of the vinyl solvent. The increase in inhibitor may have
prevented the free radicals from being available to propagate as quickly as ex-
pected. This could lead to a reduction in actual crosslink density even though
more crosslinker was present. This possibility has not been explored as part of this
work.
3.4-5 TRENDS OF PEA - PBLG INTERPENETRATING POLYMER %NETWORKS' DYNAMIC MODULI
IPN's consistently have increasing G' as frequency increases. G" has the same
tendency, yet is not as consistent. Strain increases tend to decrease both moduli of J
IPN's, while the effects of weight percent PBLG on G' and G" of IPN's appears to
be strain dependent. At low strain, moduli increase with increasing weight percent
PBLG; at high strain, the opposite is true. Finally, increases in weight percent
crosslinker appear to have G' reach a maximum, while G" increases unless the
strain is large. This is based on the values obtained for the three different con-
centrations of EDA studied here.
I :1
56
.N% % %

3.5 PEA CHARACTERISTICS
Proton nuclear magnetic resonance spectra (NMR) were run on commercial
PEA, PEA made in the laboratory, and PEA made in the laboratory from the EA- V
PBLG gel. The latter two polymers were prepared using photoinitiation. The
mechanism of polymerization of the commercial sample is unknown. The spectra
of commercial and laboratory PEA are in Figures 3.26 and 3.27, respectively. The
spectrum of laboratory PEA formed from an EA-PBLG gel is shown in Figure
3.28. The resonances have been marked corresponding to the hydrogen atoms
which they represent. The similarity of the spectra indicate that little or no chain
transfer is present in the methanol soluble portion of the photochemical initiated •
PEA.
The molecular weight distribution of the PEA was examined by gel premeation
chromatogra, ny Seventeen polystyrene standards were used for calibration. The
polystyrene calibration data, standards' molecular weights and corresponding elu-
tion volumes in milliliters, is given in Table 3.6. The PEA from Polysciences, Incor-
porated is shown in Figure 3.29. This sample appears to have a bimodal distribu-
tion with a larger percent of low molecular weight PEA. This may be due to a dif-
ferent polymerization metnod. From Figures 3.30 and 3.31, it is apparent that in
contrast to commercial PEA both laboratory-made samples have similarly hugh •
molecular weights relative to polystyrene. Both also display polydispersity. .
% %
57% %%. % .%
0-.- 4"- -".
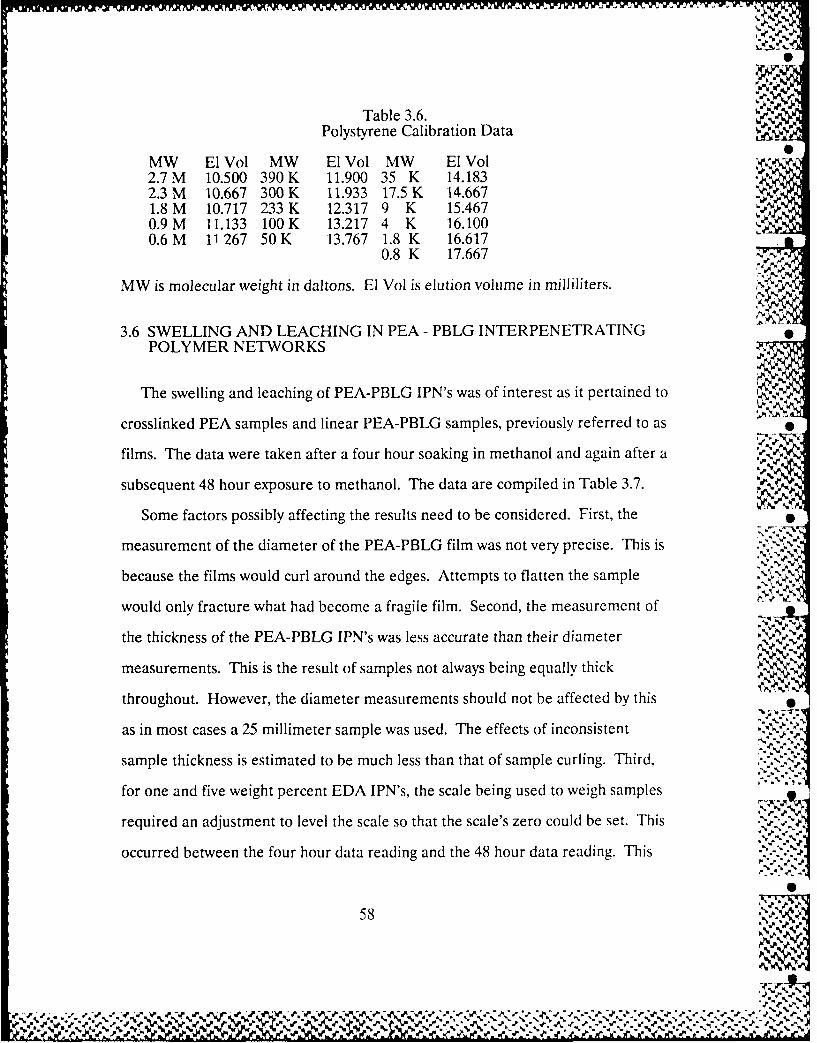
Table 3.6. --
Polystyrene Calibration Data
MW El Vol MW El Vol MW El Vol2.7 M 10.500 390 K 11.900 35 K 14.1832.3 M 10.667 300 K 11.933 17.5 K 14.6671.8 M 10.717 233 K 12.317 9 K 15.4670.9 M 11.133 100K 13.217 4 K 16.1000.6 M 11 267 50K 13.767 1.8 K 16.617
0.8 K 17.667
MW is molecular weight in daltons. El Vol is elution volume in milliliters.
3.6 SWELLING AND LEACHING IN PEA - PBLG INTERPENETRATINGPOLYMER NETWORKS
The swelling and leaching of PEA-PBLG IPN's was of interest as it pertained to
crosslinked PEA samples and linear PEA-PBLG samples, previously referred to as
films. The data were taken after a four hour soaking in methanol and again after a
subsequent 48 hour exposure to methanol. The data are compiled in Table 3.7.
Some factors possibly affecting the results need to be considered. First, the
measurement of the diameter of the PEA-PBLG film was not very precise. This is ..
because the films would curl around the edges. Attempts to flatten the sample
would only fracture what had become a fragile film. Second, the measurement of
the thickness of the PEA-PBLG IPN's was less accurate than their diameter -
measurements. This is the result of samples not always being equally thick
throughout. However, the diameter measurements should not be affected by this
as in most cases a 25 millimeter sample was used. The effects of inconsistent
sample thickness is estimated to be much less than that of sample curling. Third, ,.
for one and five weight percent EDA IPN's, the scale being used to weigh samples
required an adjustment to level the scale so that the scale's zero could be set. This
occurred between the four hour data reading and the 48 hour data reading. This
58
~% %N.- m -

may account for the apparent increase in weight for the one weight percent EDA
sample from the four hour data to the 48 hour data when leached in methanol.
Table 3.7 clearly shows that crosslinking the PEA allows for swelling of the
samples in methanol. As weight percent EDA is increased, swelling decreases. .,
Additionally, the presence of PBLG in the sample firms up the matrix and %.
decreases swelling. The greater the amount of PBLG present the less the swelling.
However, without the crosslinker present, swelling is drastically reduced.
The length of time the sample was soaked in solvent had a nonlinear effect on
the swelling. While crosslinked samples might swell to 25 percent greater
diameter in four hours, twelve times that length of time might only lead to a 27
percent increase in size for crosslinked samples. Linear PEA-PBLG films saw in-
creases of about ten percent of the total initial diameter from the four hour to the
48 hour data.
Swelling was not isotropic. Swelling in the plane of the diameter appeared to
be crosslinker concentration dependent. However, axial swelling was nearly equal
for the one and five weight percent EDA samples tested. This may partially be
due to the way the samples were formed. As polymerization occurred, the sample
was restricted by the edges of the teflon mold. This may have added stresses to the
edges of the sample not suffered by the top and bottom of the disk. Swelling in the
axial direction was nearly twice as great as that in plane.7
Leaching for the crosslinked PEA and crosslinked PEA-PBLG were very
similar at both the four and 48 hour measurements. In every crosslinked case, the
amount of leachable material was less than three percent over a 48 hour soaking.
From four to 48 hours exhibited increases in the amount leached, but never as
much as in the first four hour session.
59 .10 PIP
,-
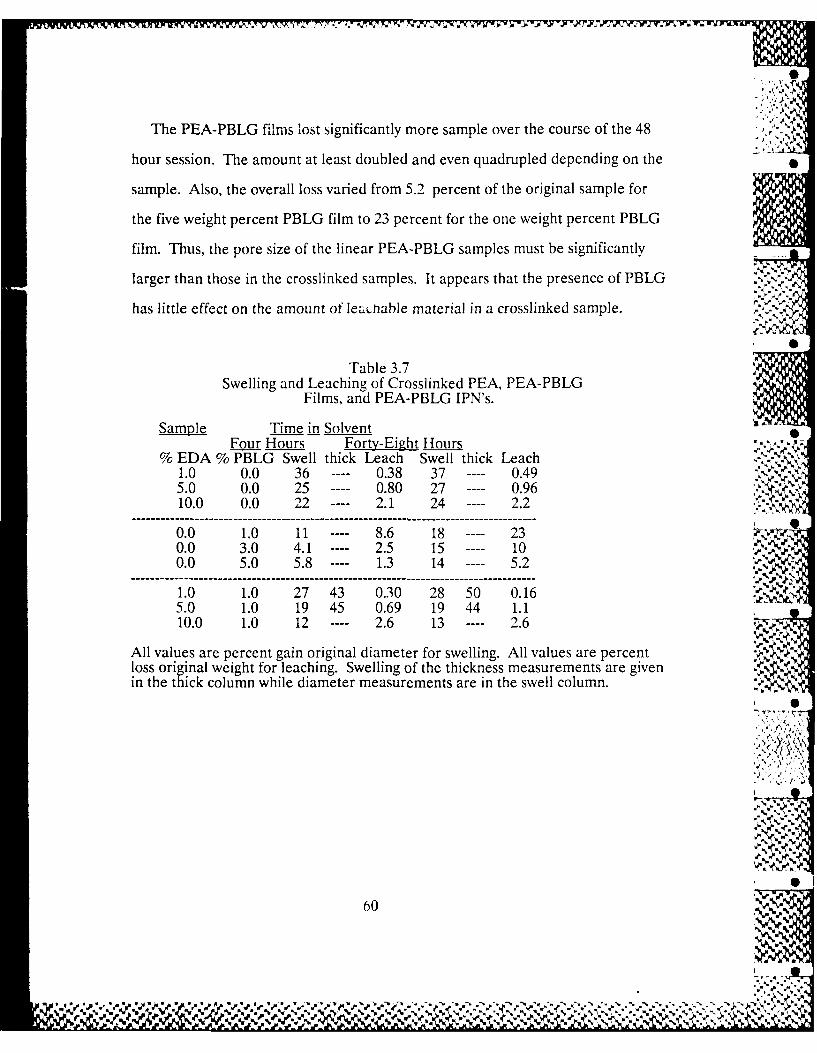
- ~= - •
The PEA-PBLG films lost significantly more sample over the course of the 48hour session. The amount at least doubled and even quadrupled depending on the
sample. Also, the overall loss varied from 5.2 percent of the original sample for
the five weight percent PBLG film to 23 percent for the one weight percent PBLG
film. Thus, the pore size of the linear PEA-PBLG samples must be significantly -
larger than those in the crosslinked samples. It appears that the presence of PBLG ". . Y
has little effect on the amount of leaLh.able material in a crosslinked sample.
Table 3.7Swelling and Leaching of Crosslinked PEA, PEA-PBLG
Films, and PEA-PBLG IPN's.
Sample Time in Solvent -
%EDA % PBLG Swell thick Leach Swell thick Leach
1.0 0.0 36 ---- 0.38 37 ---- 0.495.0 0.0 25 ---- 0.80 27 ---- 0.9610.0 0.0 22 ---- 2.1 24 ---- 2.2
0.0 1.0 11 ---- 8.6 18 ---- 230.0 3.0 4.1 ---- 2.5 15 ---- 10 l. .
0.0 5.0 5.8 ---- 1.3 14 ---- 5.2
1.0 1.0 27 43 0.30 28 50 0.165.0 1.0 19 45 0.69 19 44 1.110.0 1.0 12 ---- 2.6 13 ---- 2.6 j.
All values are percent gain original diameter for swelling. All values are percent %loss original weight for leaching. Swelling of the thickness measurements are givenin the thick column while diameter measurements are in the swell column.
.' , ..7 ..,
60 • .-,. ": :%
% % % 60------ -----

; ZIP
5" .• -
S. s $
..
• i ~ ~~REQUENCY (radians per second) i0:,,.,,. J
100.
Figure 3.1. Storaw *iodulus v,;. Frequen$ .s. •
f (r E'-lh v i A c r v ln te - P B L G t ,,21 s-.2 '
-J% %
A, j .E,1. *) .0 . 1).1..,:
- , T-;t L; j (-t 4 (- 4--" 1-.. )-i-.-'.-.
,- .-.-:-*
61~
" S .
.?,-:-q-:' %a
5.'. .: '.' > ,.-," ,'; ,..v -:. ,.::-.-, ,.--t .-. :-.'..'.4.v:. -..:o:...-,-'.--- :-..-.....-,."..- .,*,-,...',., £.-'-'¢:, -.-' -4 'a' ...%.: %IP*: ., X ,* 4 *''4': - -,-"4'4 ;.: . -">,..,<-"-:,'.,'' .-. :.' './.":- ..'': '-.',:-'',.,''. . ."..'.,..

o
So a"
* iS. . *.S *$ $1 1
-J
-. \
6N~~~1 01
• , 0
WI
.. v ,-
o+
FREQUENCY (radians per second) 100
Figure 3.2. Loss !odulus vs. Frequency 'for Ethyl AcryLate-PBLG
Gels.Strain: 0.3 ($), 1.0 (1), 5.0 (5) -.t. PBLG : I ( - ), 4 - ) 25 ( )
62

0+%
L6U
%4sr-0p'~-
I%
Wt-Z4LG 4 25
-63
-4-On -A%-
%. % %-

-~ ~~ ~~~~ Z - ~i. - ~
. .. ... .... ... ... .... ... ... .... ... . . .... ... ...
% JA
PERC14T TRAI
0iue34 os'oulsv.PretSri
q-64
I It
g;O. g..4
L ~ %e

tu0
-4
C) .
- ~ %FREQ E ; y (r dia s Pe se ond
-0Figure~~~i
3. . S o a e a d o s M d l sf o P A PB G Fi l a -3 P rc n F e ue c
PBLG: train
Mouls 2 (2,3() 4() 5Go
100 ..

+0
w
'44
0
Lwk
% Vw
FREQENC (rdin per seod100 -
Figue 3.. Strageand oss odul vs.Freqenc
for~ PE-BGFlsa . ecn tan
I-It 7 'V01 ( ) 2 ( ) ( ) 4) 5
Modulu: G' G
66A
-0-X0- . -N ~ W t%
40% 0
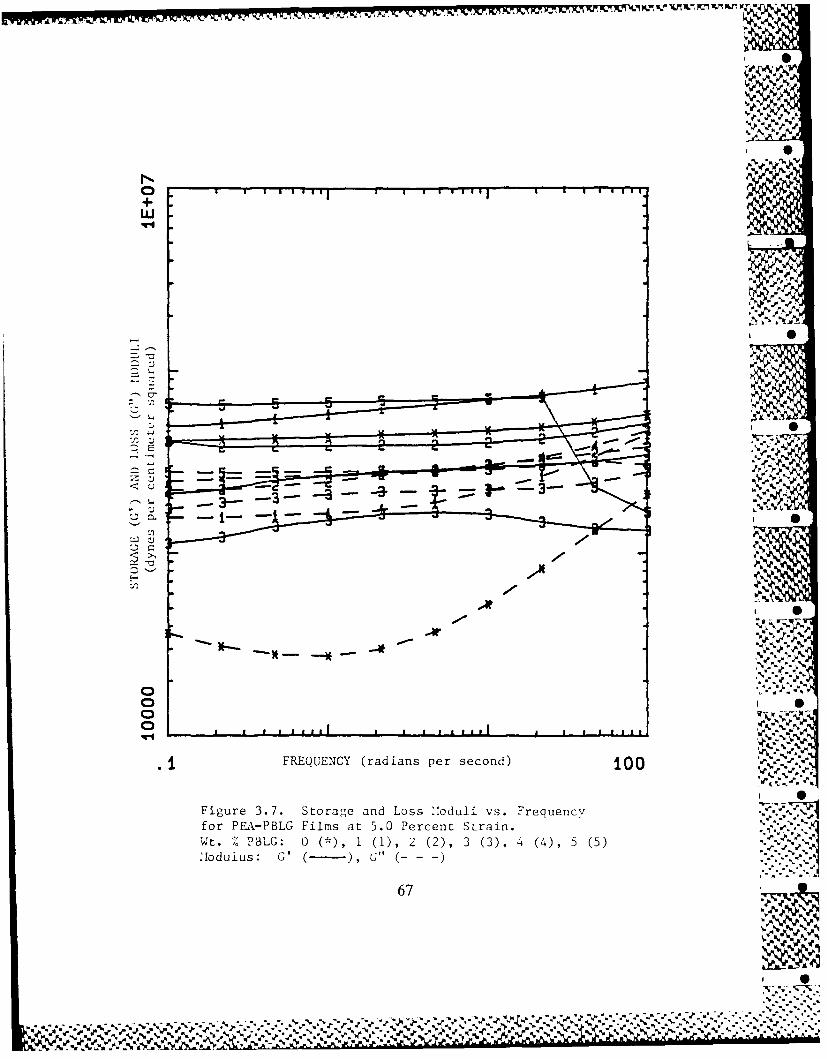
wx -to w -,- 2
w
TIl
0A
%1
Z, I
-'du s G'-G
6_7
%r .
% %
% %~
% % %% % % %0
L'

5%
% d
%
PECN SRI
Fiue380trg oulsv.PretSri
fo PE-BL ilsFrqec rdsc : 01 *,10 () 00 ()
%.~ %
% el .N N N IN %
% % v2%-k" % %% % % %% %
% %*'NVA
LY~

II.
S4-
00
N%
It,
2 -9 LOSS ... '.. s Pre t trai
0 ~ Wt PERCEN ST AI 3 : .
'S.--
6 *- ~- -. 5' '.5
6 o. o *-'* ..., -.5.fl* : ..........
Wt ,oP L : i ( - , 3 (- ) . .)Le ..]
'-' .'+ ."
_% .' .% .",'
o ,'.oo
Si 1o+, , 1 .. .+ .. .. +II ,,-.", ,.,+..,-,+,p.' ,,,. "+ .', L .".. .% ._+Q. .PERCENT STRAe.. N 6,.-. e,, +. .,•.. e .. . , ,.""""""",',' . .". .
- e ' '- 3 e ' ' ' Figur ' e 39. Lo s od lu .erc -+ £~ e nt.. 7"' Strain '.'.'.. . ".9, . .+"e'-',''-,, ,)

-;N
J'
7, %,
0 (U
I wo '
0
w%
0 ~~~PERCENT STRAIN 6"''"
q0
Figure 3.10. Storage and Loss ,11oduli vs. Percent Strain %'. ,for 25 Weight Percent PBLG P.A-PBLG Films.
Frequency (rad/sec): 0. i (*), 1.0 (0), i0.0 (1)', _
100.0 ( 2 )" ."",..:.
oulus : ' G- ) " L- -%) '
?w.
70
•
- .

4- - --..-
..' 1.. Re O '- - - .-- - -
-.%
0,a , , ,, I I , I , , , ,,I , , % ,
+ ItIL
.. .. FR QU N. (.di n per .eo d .. 0 ..... -. . -. ...
0 E 0
UO..#
-5- -5B: - - - 5 (odulus: -
FREQUENCY (radians per second) 100%
Figure 3.11. Storage and Loss Moduli vs. Frequencyfor PEA-PBLG Films at 0.3 Percent Strain.Wt. %/. PBLG: 1 (1), 3 (3), .5 (5)
number right side up: starting strainnumber sidewavs: finishing strain S
71
a,. ' %'
a., ", %

................
J vi
• - --. M -. "
0 j- 0
Wt /. " : 1 ( ), 3 (3'5 (5
'-'
II. -
Mouls G( ),G
n iub re right s tore p andcLossin strau i nv . F e u n y .,
number sides: ncreasing strain ,
-le
72ube
*b
numb r s dewa s: ecre sin str in-
... , .". ".".-".". ".

+ '
U
*'A4 %
7)-
.'
%. 4
-%
.4..
-- -4.-%
FR Q E C (r di n - * - -I e
r~4 second4.-'.100
Figure 3.13
G,~ I
-- 7 3
-4~~~~~ - -%!.- .~
%Ox %.--4-- -~ 4 5-
4N-
1-4 - ak A--OAMN' 4 P
% %.. a .
.44 '.4 4.
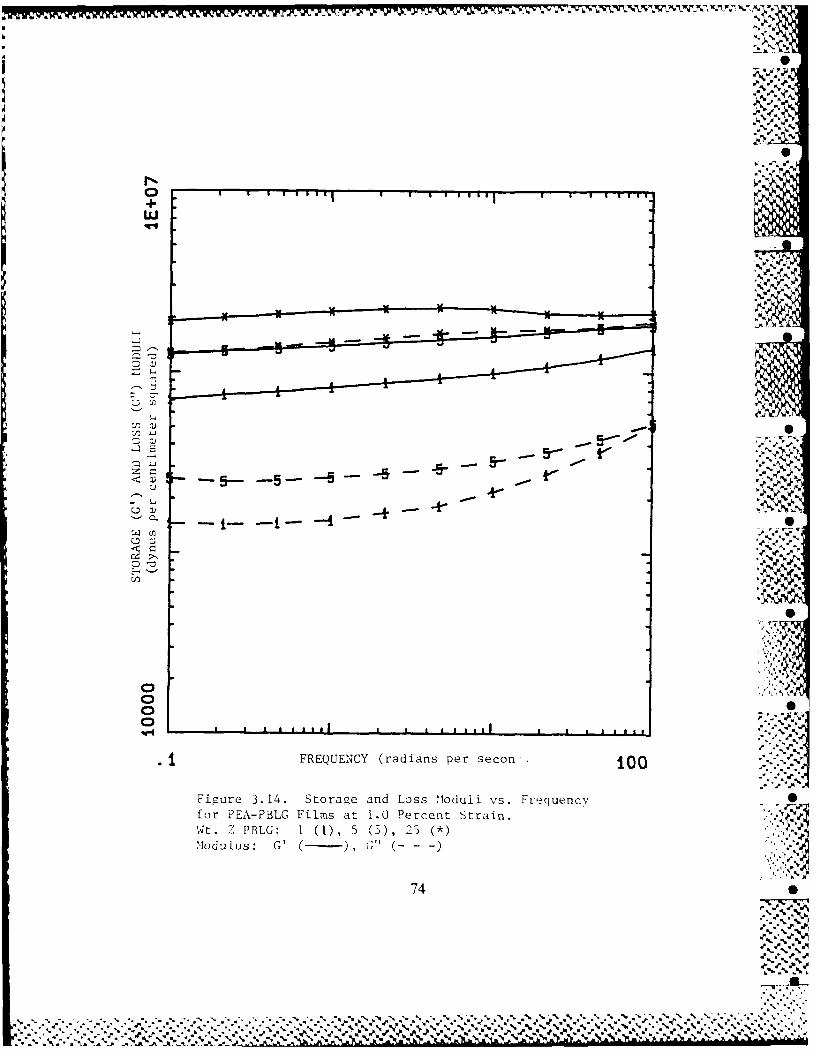
M- I- T -.7' i,
%4'0
+w
....................
I- %
U~ 5C
0.7 0 4-
r r I
C
-.
d, -P

100
r( 3. 15 S T- I s 1)d l vs.~ Frequ i 5 55 5
751

-- - - - - - - -- - - - - - - - - - - - -- 2V.vc"7::"
e %
N--.
$ $ $ $
_~
.--.-- ,,. ,.
%.-' % •
%
+]
% %
0z10
o%
SVl, a a ,lal I ~ ~~I I I III a .,
j FREQUENCY (radians per second) 10
Figure 3.16. Storage Modulus vs. Frequency 1 0for PEA-PBLG IPN's at 0.3 Percent Strain.Wt. Z PBLG: 0 (*), 1 (1), 25 ($)Wt. I% EDA: 0 ( ), 1 (- ), 3 (---),
1
j0
76
F..

'.' L --. 4. -- L -6 77 ; '71;
.
+0
% WJ
, A
%p' P%%~
N.$0~~ ~ $ .* III I III
+%
I Ia I1 t $ I A. 2
FRQEC (rdin per second- -!-I', M~~100
- igure 3 1 Strg- 'ou s rqec
for~ ~ ~ ~ PAPL P' at10PretS ai
%i %
----- ---- ---- -46

e 0
Jl.
4T-w
LI
A%
Figure~~~~~~*. 3.8 Strg odlsv. rqe
%
1% 4
.$%
I $s% %i%
%'~ -1- -- + -

*b~ V~, I- IV)I ~w V
X"F IS
.N
-I-
I L
Wt. Z BL : (),20 ... ....,0.
w -
5 10
79 , % %O .r, f
1%
1
Wt % E A .,.' I
"..1, 0'

F'I
..
N.0 . . 1 1!- . --i s u . r .
w
'--4
t /
-$-- --- -- -$.
4%
. %
FREQUENCY (radians per second) jOO . "
Figure 3.20. Loss Modulus vs. Frequency •
for PEA-PBLG IPN's at 1.0 Percent Strain.
Wt. /'. PBLG: 0 (*,1 (1), 25()Wt. Z EDA: 0 ( ), 1 (- ), .
5 (- - -) 1 0 (. )
80 S
",4
%. €
-. ,
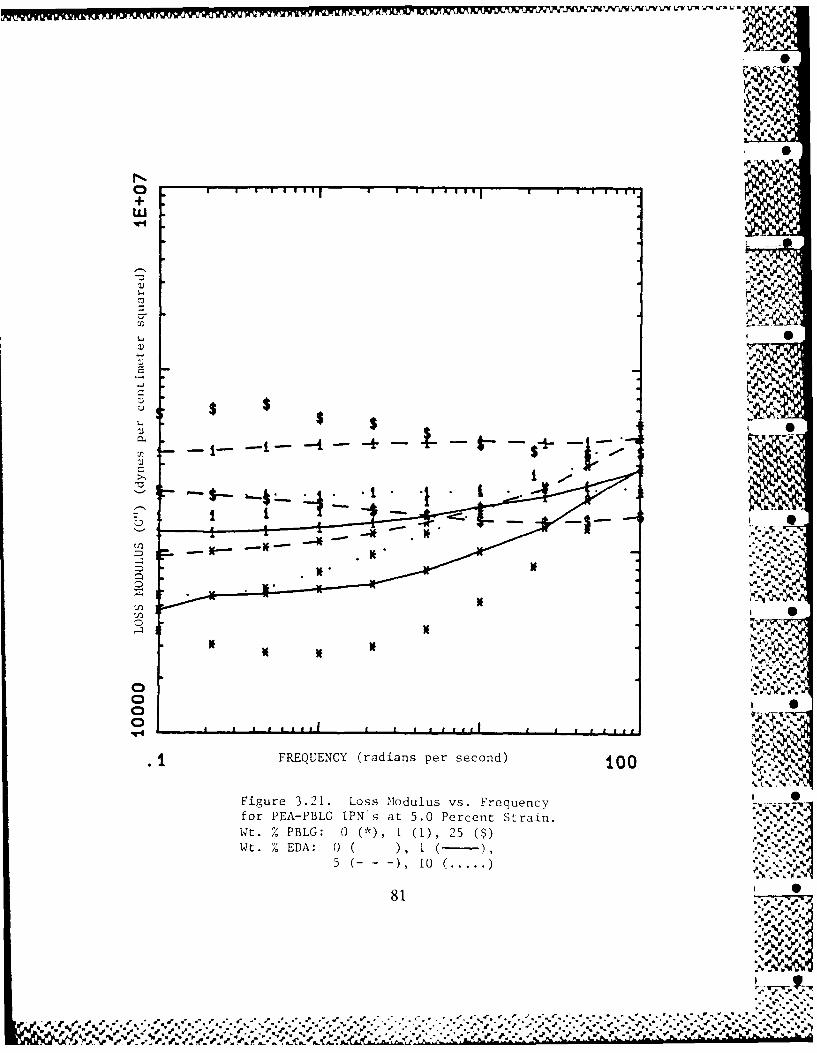
. j e.
$00 5 I I I I ll
N
• I ~FREQUENCY (radians per second) 0"-- %J
Figure 321. Loss Moduius vs. Frequency -.-----r
or PEA- PBL G IP N's at 5.0 ercent Stra i."". ..-/
Wt. /oPBLG: 0 1* , (1) , 25 ( ) -. -J
Wt. Eo EDA: 0 1 , I ( - ,''''7,,
5 1-- -) 0 (. . .)' .
...-e
% % - P
$ i
', .! .."::.", ". ..".".". .'. ,.' . . ..' ' ' ,. ." "-.. .-.. -"., , ..... : ."'" ..,..' '..,S.'. $.".' -",'.'.'.
t;m ',w,' f,, ' ", '.',,. e .,' " ,," '." ,,-" " ,""."""..••- /,. '"-.".'. . .,,-, ", .,-i"e .'-L'.,',-" -,,. . _, .. .".

7NN.02
.44:
% e
PERCENT STAI
Fiue32. Soaelodlsv.PretSri
fo E-BGINswt n eri ecn BG
Freqencv (radsec : 0. (*) 1.0 (0)10.0 ~ ~ (1,10. 2
01
o I82
o -V v%oJ .I I I I

20
2 6%,.,
U%
10.0 ( ), 10 .0 (2
Wt. ~ ~ ~ N~ 'Z BG: 0 ( ),12
5.583
% %v%-. - S

KnP
- --- ,.
LII,,~ -,
N
T.-
WN
a%
0
11F-- . - .
' ,i g
- " ,- --I
PEA-PBLG IPN's with One Weight Percent PBLG. , - ,
Frequency (radlsec): 0.1 () , 10 (0), " 710.0 (1), 100.0 (2)
Wt.: EDA: 0 - ) 5 ( - ). ..S.,,
_-*
% ~~

.0
p % W II
2
; 1%9.. %
PECN SRI
Fiur 3.25. Los -,lduu vs0ecn Sr o
W t . .B G 0 - ) 12
%% % % % *% %
o a 21

**'o -- V
* .1
%~ .'-II
^: %
%/ %%~3~ %
If
~ -~_ _____ __ ~ - 4* 'I'ved
_ _ _ _ _ _ _ 86
v ,%' % % %%~
.r %
aC

%m .
AJp
%- %
877
I% %

A S
.-t% . N .,
%.. %q
%~ %
-7 -.- ?,
.- -
" = " ,I, -- - ' ""
r •
," ,. J-L
"'" "1' % " % % " "% " " ' """" " " "% '""'% ""% " " ""'' "".''""" ' """" "'" *" -/,"d 88 " % %

LA0
rS
> 0.00
CL 4.J Y
xL
00L+
N
a. "
4,
0.
(4 1 9
89N

4Wt
+
z +
41.
z 0
0
I--
CLA / >o C14.2
-J
/ ~+ -
-JL Zt
CLC
00
900 CD0
+A +

+
-LU
> -4
CLo
-J U-4 ~
T~
-Q.-
v. -1 M -- D
o0 0 0 0 0 0 O~ 91
'NON N I

CHAPTER FOUR: CONCLUSIONS
The ability to form a polymer network from a rigid rod polymer-monomer sol-
vent gel has been shown. The use of a photoinitiator to initiate the polymerization
of the monomer allows better control of the process than the use of a strictly ther-
mal initiator. The use of a photoinitiator leads to a hugh molecular weight PEA
portion of the sample without inducing further phase separation.
In the study of the dynamic properties of the three different catagories of
samples, identification of the contribution from the separate constituents of the
sample to the storage and loss moduli was made. The rheological studies indicate
that G' is controlled by the PBLG concentration in the EA-PBLG gels. For the
PEA-PBLG films, the samples at or below three weight percent PBLG appeared
to have G' primarily controlled by PBLG concentration. The 25 weight percent
PBLG sample followed suit below 5.0 % strain; however, at 5.0 % strain it ex-
hibited a sharp decline in storage modulus. This might be due to a break down of
the rigid rod structure of the PBLG at that strain. However, the recovery of the
storage modulus upon returning to low strains was from 50 to over 90 % of its
original value for the 25 weight percent PBLG film. Thus, the film appears to suf-
fer little permanent structural damage. The four and five weight percent PBLG
films tended to be slightly lower than from the three weight percent film, however
the entire range of values for G' from one to five weight percent PBLG was small.'
Thus, although the decline in G' may be due to a minor break down in the PBLG
structure at these PBLG concentrations, any effects are small and less than the ex-
perimental error in the rheological measurements.
92
0 , .

The IPN's storage moduli were controlled by the PBLG concentration at 0.3
% strain. At higher strain, the effects of five or ten weight percent EDA could be S
observed. A drop in storage modulus was observed. This also may be attributed to
the breaking of the sample structure at high strain; however, here it may be the
crosslinked PEA portion of the sample being broken at 1.0 % strain as 1.0 % strain
did not appear to decrease G' as drastically in the gels or films. Breakage of both
the crosslinked PEA and PBLG may occur at 5.0 % strain. G' shows a drastic
decrease with increasing strain when the PBLG concentration is increased 25 fold
and the EDA is at 5 weight percent. G' drops almost an order of magnitude for a
three fold increase in strain and ten fold for a five fold percent strain increase.
This sample's rigidity makes it possible that the higher strain causes substantial
damage to the network structure.
The loss modulus' response in EA-PBLG gels and films was dominated by the
PBLG concentration also. Small increases in G" with a thousand fold increase fre-
quency are present, while increasing strain brings slight decreases in the loss
modulus. However, a four to six fold increase in PBLG concentration yields an in-
crease from three to ten fold in the loss modulus for both gels and films.
The IPN's loss moduli show a modest two fold increase when crosslinker is in-
creased from one to five weight percent, but the increase from five to ten weight
percent yields a drop of three to four fold in G". A 25 fold increase in PBLG con-
centration with constant crosslinker concentration brings a three fold increase at ". -.
0.3 % strain, virtually no change at 1.0 % strain, and a two fold decrease at 5.0 % -
strain. The strain dependence of the 25 weight percent PBLG-five weight percent
EDA sample showed a ten fold decrease over sixteen fold increase in strain. This :..
was less than G'.
93 U ,S
",.,

The NMR spectra support the conclusion that little or no grafting between the
PEA and PBLG was present in the portion that was methanol solubie during the 0
polymerization of the ethyl acrylate. Additional studies as to the amount of graft-
ing of PEA on to PBLG should be conducted. A possible scheme to attain more
information on the presence of grafting between the PEA and PBLG would be to
take the portion of the PEA-PBLG sample which did not dissolve in methanol and
dissolve it in a good solvent for PBLG. By comparing that spectrum with a
spectrum of pure PBLG in the same solvent, an idea of the amount of PEA graft- 0
ing to the PBLG could be obtained.
The GPC spectra show that a large molecular weight PEA sample forms when a
photochemical initiator is used. Though the method of initiation is unknown for 0
the commercial sample, the molecular weight is much lower. This suggests that L
photochemical initiation produces a small number of free radicals which terminate
slowly in comparison to their propagation rate.
Also, a calculation of the radius of gyration, rg, can be made from the best avail-
able data for both PEA and PS. Using the molecular weight of a monomer seg-
ment, M* (104 for PS and 100 for PEA), their characteristic ratios, C (10 for PS,
about 9 for PEA), and a arbitrary molecular weight, M (2 million), a comparison
can be made. Assuming both of the backbone segments to be a carbon-carbon
bond long, 1 (1.5 angstroms), and the number of bonds, n, to be twice the number
of monomeric units then using the relationships below (EQN's 4.1-4.3), the radii of
gyration are 380 and 367 angstroms for PS and PEA, respectively. This means that
the actual PEA molecular weights are most likely slightly less than those from the
GPC chromatograph. The solvent goodness for each of the polymers may change
the relative values.
94
%. . ... .
lO~', a~'m ',,Ck"KcJ'?-.Vr ,6: :''S.•
..;" ".',,"4;sT~,. -q""," - ,,'--"- % ',2..-,..'-".' . ';'.",,,. ",,,""",\4. w,",, . ."".,?'-'.;,. --

I 0
n = 2(M/M*) EQN 4.1
r2 = C n 12 EQN 4.2 ,
r = r 2/6 EQN 4.3
The swelling data show that while crosslinking the PEA leads to significant
swelling, the PEA-PBLG network is capable of swelling also. The PBLG .
structure alone, however, will not maintain the integrity of PEA-PBLG films
shape. Additionally, the amount of crosslinker present in the sample inversely
relates to the amount of swelling the sample does in methanol.
Leaching rate of the IPN's reaches a maximum much sooner than an un-
crosslinked sample. Also, the amount of leachable material for an IPN is far
less than for the linear PEA-PBLG samples. This indicates that the 9
crosslinked PEA forms a much tighter network than the linear PEA-PBLG V
films. Correspondingly, the pore size of the linear PEA-PBLG films is much
larger than that of the crosslinked PEA-PBLG IPN's. By assuming the 48 hour b S
data to be 100 percent of the leachable material, the four hour data and EQN -
2.1 can be used to estimate a diffusion coefficient. With a sample thickness of
two millimeters, h equals 0.1 centimeters, and D (X 10-8) equals 1.8, 5.4, and
8.3 for the five weight percent EDA IPN, the one weight percent PBLG film,
and the three and five weight percent PBLG films, respectively. These appear
reasonable when compared to the proposed values.
The combining of rigid rod and random coil polymers continues to be a
field where there is much progress to be made. This study only highlights the
fact that interpenetrating networks of polymers can be vastly different based
on the sequence of steps and conditions used in the formation of the network.
95
% %
Sr" ,

REFERENCES
1. J. R. Millar, J. Chem. Soc., London, Article 263, 1311-7, (1960).
2. D. Klempner, K. C. Frisch, and H. L Frisch, J. Elastoplast., 5, 196-200,(1973).
3. D. A. Thomas and L. H. Sperling, in Polymer Blends, Vol. 2, Chapter 1I, D.R. Paul and S. Newman, eds., Academic Press Inc., New York, 1978.
4. L. H. Sperling, in Recent Advances in Polymer Blends Grafts and Blocks,93-116, L. H. Sperling, ed., Plenum Press, New York, 1974.
5. L. H. Sperling and K. B. Ferguson, Macromolecules, 8, 691-4, (1975).
6. L. H. Sperling, K. B. Ferguson, J. A. Manson, E. M. Corwin, and D. L.Siegfried, Macromolecules, 9, 743-9, (1976).
7. P. J. Flory, J. Chem. Phys., 10, 51-61, (1942).
8. P. J. Flory and J. Rehner, Jr., J. Chem. Phys., 11, 521-6, (1943). _
9. P. J. Flory, J. Chem. Phys., 12, 425-38, (1944).
10. P. J. Flory, J. Chem. Phys., 13, 453-65, (1945).
11. A. R. Shultz and P. J. Flory, J. Amer. Chem. Soc., 74, 4760-7, (1952).
12. P. C. Hiemenz, Polymer Chemistry: The Basic Concepts, Marcel Dekker, Y"+Inc., New York, 1984.
13. P. J. Flory, Proc. Roy. Soc. London, Ser. A, 234, 73-89, (1956).
14. A. C. Griffin, S. R. Vaidya, and M. L. Steele, in Polymeric Liquid Crystals,1-19, A. Blumstein, ed., Plenum Press, New York, 1985.
15. W. G. Miller, Ann. Rev. Phys. Chem., 29, 519-35, (1978).
16. H. Block, Polymer Monographs, Vol. 9, Gordon and Breach SciencePublishers, Inc., New York, 1983.
17. R. D. Lundberg and P. Doty, J. Amer. Chem. Soc., 79, 3961-72, (1957).
18. W. G. Miller, P. S. Russo, and S. Chakrabarti, J. Appl. Polym. Sci.:Appl. Polym. Symp., 41, 49-63, (1985).
19. W. G. Miller, S. Chakrabarti, and K. M. Seibel, in Microdomains inPolymer Solutions, 143-56, P. Dubin, ed., Plenum Press, New York, 1985.
20. J. H. Rai and W. G. Miller, J. Phys. Chem., 76(7), 1081-5, (1972).
96

21. T. Imae and S. Ikeda, Biopolymers, 12(6), 1203-21, (1973).
22. B. Z. Volchek, A. V. Purkina, G. P. Vlasov, and L. A. Ovsyannikova, 0
Vysokomol. Soedin., Ser. B, 23(2), 154-7, (1981).
23. K. Kubo, Mol. Cryst. Liquid Cryst., 74(1-4), 71-87, (1981).
24. W. G. Miller, P. S. Russo, and S. Chakrabarti, Proc. I.U.P.A.C., I.U.P.A.C.,Macromol. Symp., 28, 822, (1982).
25. E. Wee and W. G. Miller, J. Phys. Chem., 75, 1446-52, (1971).
26. J. H. Rai, W. G. Miller, and R. G. Bryant, Macromolecules, 6 262-5, (1973).
27. T. C. Warren, J. L. Schrag, and J. D. Ferry, Biopolymers, 12, 1905-15, (1973). 0
28. T. Asada, H. Muramatsu, and S. Onogi, Nippon Reoroji Gakkaishi, 6(3),130-5, (1978).
29. G. Kiss and R. S. Porter, Mol. Cryst. Liquid Cryst., 60(4), 267-80, (1980).
30. P. Moldenaers and J. Mewis, J. Rheol., 30(3), 567-84, (1986).
31. N. Ookubo, M. Komatsubara, H. Nakajima, and Y. Wada, Biopolymers,15,929-47, (1976).
32. J. Hermans, Jr., J. Coll. Sci., 17, 638-48, (1962).
33. S. Chakrabarti and W. G. Miller, Biopolymers, 23, 719-34, (1984).
34. K. Kubo, S. Hiraga, and K. Ogino, Jap. J. Appl. Phys., 11(3), 427-8, (1972).
35. M. Matsuo, K. Kakei, F. Ozaki, and T. Ogita, J. Chem. Phys., 76(8), 3974-80,(1982).
36. J. Simon and F. E. Karasz, Thermochimica Acta, 8(1-2), 97-104, (1974).
37. A. Okamoto, K. Kenji, and K. Ogino, Bull. Chem. Soc. Japan, 47(5), 1054-7,(1974).
38. S. Sasaki, M. Hikata, C. Shiraki, and I. Uematsu, Polym. J., 14(3), 205- 13,(1982).
39. M. Chien, E. T. Samulski, and C. G. Wade, Macromolecules, 6(4), 638-42,(1973).
40. Y. Mohadger, T. K. Kwei, and A. V. Tobolsky, Macromolecules, 4(6), 755-7,(1971).
41. Y. Tajima. J. M. Anderson, and P. H. Geil, Int. J. Biol. Macromol., 2(4),186-92, (1980).
97
'- '.,-. , ,

42. K. Tohyama and W. G. Miller, Nature, 289, 813-4, (1981).
43. F. Dynikar and P. H. Geil, Makromol. Chem., 158, 39-51, (1972). * S
44. E. T. Samulski and A. V. Tobolsky, in Liquid Crystal Ordered Fluids, Proc.Amer. Chem. Soc. Symp., 1969, 111-21, J. F. Johnson, ed., Plenum Press,New York, 1970.
45. A. Aviram, J. Polym. Sci., Polym. Lett. Ed., 14(12), 757-60, (1976).
46. R. Subramanian, R. J. Wittebort, and D. B. DuPre, Mol. Cryst. LiquidCryst., 97(1-4), 325-36, (1983).
47. T. Matsumoto and A. Teramoto, Biopolymers, 13, 1347-56, (1974).
48. M. Oka and A. Nakajima, Polym. Bull. (Berlin), 11(5), 447-5 1, (1984).
49. M. Horio, Koenshu - Kyoto Daigaku Nippon Kagaku Seni Kenkvusho, 38,79-81, (1981).
50. M. M. lovleva and S. I. Banduryan, Vysokomol. Soedin., Ser. A, 22(11), Al2514-22, (1980).
51. T. Fukuzawa, I. Uematsu, and Y. Uematsu, Polym. J., 6(5), 431-7, (1974).
52. T. Watanabe, Y. Tsujita, and I. Uematsu, Polym. J., 7(2), 181-5, (1975).
53. J. M. Zimmel, C. C. Wu, W. G. Miller, and R. P. Mason, J. Phys. Chem.,87, 5435-43, (1983).
54. N. F. Bakeev and I. S. Lakoba, Vysokomol. Soedin., Ser. A, .14(11), 2443-9,(1972).
55. D. B. DuPre and F. M. Lin, Mol. Cryst. Liquid Cryst., 75(1-4), 217-24, (1981). '4-
56. A. K. Gupta, C. Dufour, and E. Marchal, Biopolymers, 13(7), 1293-308,(1974).
57. R. Sakamoto and M. Watanabe, Contemp. Top. Polym. Sci., 4, 259-68,(1984).
58. H. L. Frisch, D. Klempner, and K. C. Frisch, J. Polym. Sci., Part B, 7, 775-9,(1969).
59. D. Klempner, H. L. Frisch, and K. C. Frisch, J. Polym. Sci., A-2, 8,921-35, (1970).
60. A. A. Donatelli, D. A. Thomas, and L. H. Sperling, in Recent Advances inPolymer Blends Grafts and Blocks, 375-93, L. H. Sperling, ed., PlenumPress, New York, 1974.
98
,r, .. € , . _32 . - ,Z'" .. ,... . , " -, , ,'.,,,,. .'. .. ,,, . x . . ,. . ,. .. \ .,N .

61. A. A. Donetelli, L. H. Sperling, and D. A. Thiomas, J. Appi. Polym. Sci.,21,1189-97, (1977).
62. G. Allen, M. J. Bowden, D. J. Blundell, F. G. H-utchinson, G. M. Jeffs, andJ. Vyvoda, Polymer, 14 597-603, (1973).
63. G. Allen, M. J. Bowden, D. J. Blundell, G. M. Jeffs, J. Vvvoda, and T.White, Polymer, 14, 604-16, (1973).
64. G. Allen, M. J. Bowden, G. Lewis, D. J. Blundell, and G. M. Jeffs, ~Polymer, 15, 13-8, (1974).
65. G. Milen, M. J. Bowden, S. M. Todd, D. J. Blundell, G. M. Jeffs, and W.E. A. Davies, Polymer, 15, 28-32, (1974). -1
66. R. A. Dickie, Mo-F. Cheung, and S. Newman, J. Appi. Polym. Sci_, 1765-78, (1973).
67. R. A. Dickie and Mo-F. Cheung, J. Appi. Polym. Sci., 17, 79-94, (1973).
68. R. A. Dickie, J. Appi. Polym. Sd., 1.2, 45-63, (1973). S
69. E. F. Jordan, Jr., B. Artymyshyn, G. R. Riser, and A. N. Wrigley, J. Appi.Polym. Sci., 20, 2715-35, (1976). v A
70. E. F. Jordan, Jr., B. Artymyshyn, G. R. Riser, and A. N. Wrigley, J. Appi.Polym. Sc. LO20 2737-55, (1976).S
71. E. F. Jordan, Jr., B. Artymyshyn, and G. R. Riser, J. Appi. Polym. Sci.,20, 2757-78, (1976).
72. C. E. Locke and D. R. Paul, J. Appi. Polym. Sci., 12, 2791-800, (1973).
73. F. Rodriquez, Principles of Polymer Systems, Hemisphere PublishingCorporation, Washington, 1982.
74. V. Huelck, D. A. Thomas, and L. H. Sperling, Macromolecules, 5, 348-53,(1972).
75. V. Huelck, D. A. Thomas, and L. H. Sperling, Macromolecules, 5. 340-7,(1972).
76. L. H. Sperling and D. W. Friedman, J. Polym. Sd., A-2, 2, 425-7, (1969).
77. Y. Baba and A. Kagemoto, Macromolecules, 10(2), 458-60, (1977).
78. M. Tokita, Y. Yamashita, and K. Hikichi, Polymer J., 13 (6), 569-71, (198 1).
79. E. Iizuka, Mol. Cryst. Liquid Crvst., 25(3/4), 287-98, (1974).
99q
% % *0 % IN

80. B. Gallot, A. Douy, H. Hayanv, and C. Vigneron, Polym. Sci. Technol.,23(Polym. Med.), 247-60, (1983).
81. Hans-G. Elias, Mohammed-B. E1-Sabbah, W. M. Loris, and J. Semen, J.Macromol. Sci., Chem., A16(2), 529-32, (1981). .
82. Y. Kuroyanagi, K. Y. Kim, and M. Seno, J. Appi. Polym. Sci., 21(5),1289-303, (1983).
83. D. L. Patel and D. B. DuPre, Rheol. Acta, 18(5), 662-6, (1979). ~
84. B. Z. Voichek, A. V. Purkina. A. A. Merkureva, G. P. Vlasov, and L. A.Ovsyan-nikova, Vysokomol. Soedin., Ser. A, 26(4), 711-5, (1984).
85. E. Marsano, Polymer, r2(l), 118-22, (1986). S
86. B. Z. Voichek, A. V. Purkina, L. A. Ovsyannikova, and G. P. Vlasov,Vysokomol. Soedin., Ser. A, 21(5), 1037-42, (1979).
87. E. Friedman, C. Anderson, Ryong-J. Roe, and A. V. Toboisky, J. Polym.Sci., Part B, 10(10), 839-41, (1972).
88. W. Kuhn, Z. physik. Chem., A161, 1-32, (1932).
89. H. A. Kramers, J. Chem. Phys., 14, 4 15-24, (1946).
90. W. Kuhn, Z. physik. Chem., A1619 427-40, (1932).
91. M. L. Huggins, J. Phys. Chem_, 43, 439-56, (1939).
92. J. G. Kirkwood and J. Riseman, J. Chem. Phys_, 16 565-73, (1948).
93. P. E. Rouse, Jr., J. Chem. Phys., 21, 1272-80, (1953).
QI*F. Bueche, J. Chem. Phys., 22 603-9, (1954).
95. B. H. Zimm, J. Chem. Phys., 24, 269-78, (1956).
96. J. G. Kirkwood and P. L. Auer, J. Chem. Phys., 19, 281-3, (195 1).97. R. Ullman, Macromnolecules,2, "'7-30, (1969).
.1 O~(98. M. Doi and S. F. Edwards, J. Chem. Soc., Faraday 11, 74, 560-70, (1978).
99. M. Doi and S. F. Edwards, J. Chem. Soc., Faraday 11, 24, 918-32, (1978).
100. B. H. Zimm and J. K. Bragg, J. Chem. Phys., 31, 526-35, (1959).
101. K. Nagai, J. I iys. Soc. Japan, 15, 407-16, (1960).
102. K. Nagai, J. Chem. Phys., 34, 887-904, (196 1). S
100
Ove qr
4/ ~ Z

q •
103. P.J. Flory, J. Polym. Sci., 49, 105-28, (1961).9 0
104. P.J. Flory, Proc. Roy. Soc., London, Ser. A, 234, 60-73, (1956).
105. P. J. Flory and W. J. Leonard, Jr., J. Amer. Chem. Soc., 87, 2102-8, (1965).
106. V. T. Rajan and Chia-W. Woo, Phys. Rev. A, 2__(3), 990-7, (1980).
107. J. K. MacKenzie, Proc. Phys. Soc. London, 63, Part B, 2-11, (1950).
108. E. H. Kerner, Proc. Phys. Soc. London, 69, Part B, 803-13, (1956).
109. C. van der Poel, Rheol. Acta, 1, No. 2/3, 198-205, (1958).
110. M. Takayanagi, H. Harima, and Y. Iwata, Mem. Fac. Eng. Kyushu Univ..23,1-13, (1963).
111. M. Takavanagi, S. Uemura, and S. Minami, J. Polym. Sci., 3, Part C-5,113-22, (1965).
• •
112. K. Fujino, Y. Ogawa, and H. Kawai, J. Appl. Polym. Sci., 8, 2147-61, (1964).
113. L. E. Neilsen and T. B. Lewis, J. Polym. Sci., A-2, 7, 1705-19, (1969).
114. L. E. Neilsen, J. Appl. Phys., 41, 4626-7, (1970).
115. T. B. Lewis and L. E. Neilsen, J. Appl. Polym. Sci., 14, 1449-71, (1970).
116. L. E. Neilsen and Biing-L. Lee, J. Compos. Mater., 6, 136-46, (1972).
117. N. W. Tschoegl and J. D. Ferry, J. Amer. Chem. Soc., 86, 1474-7, (1964).
118. M. Matsuo, T. K. Kwei, D. Klempner, and H. L. Frisch, Polym. Eng. and Sci.,10(6), 327-31, (1970). .'V
119. G. Kraus, K. W. Rollman, and J. T. Gruner, Macromolecules, 3, 92-6, (1970).
120. L. Bohn, in Copolymers, Polyblends, Composites, 66-75, N. A. J. Platger, *ed., Amer. Chem. Soc., Washington, 1975.
121. J. Brandrup and E. H. Immergut, eds., Polymer Handbook, John Wileyand Sons, Inc., New York, 1975. - ,"? .'-
. ?
122. W. Jost, Diffusion in Solids, Liquids, Gases, Academic Press, Inc., New York,1952. .
123. E. lizuka, J. Phys. Soc. Japan, 35(6), 1792, (1973). %.
124. T. Asada and S. Onogi, Kyoto Daigaku Nippon Kagakuseni Kenkyusho ..
Kuenshu, 32, 27-40, (1975). *
101
t11P,PS

4w -
125. S. Jain and C. Cohen, Macromolecules, 14, 759-65, (1981).
126. T. Asada, Nihon Reoroji Gakkaishi, 10(2), 51-60, (1982).
127. S. Sasaki, M. Naka, and I. Uematsu, Polym. J. (Japan), 14(6), 465-70, (1982).
128. M. V. R. Rao, M. Atreyi, and A. R. Ray, J. Macromol. Sci., Chem., A11(9),1759-69, (1977).
129. G. P. Vlasov, G. D. Rudkovskava, and L. A. Ovsyannikova, Makromol.Chem., 183 (11), 2634-44, (1982). ,.".,'
130. B. Gallot, A. Douy, H. Hayany, and C. Vigneron, in Polymers in Medicine,247-60, E. Chiellini and P. Giusti, eds., Plenum Press, New York, 1983.
131. Y. Imanishi, J. Macromol. Sci., Chem., A21(8-9), 1137-63, (1984).
132. Y. Tsujita, T. Higaki, A. Takizawa, and T. Kinoshita, J. Polym. Sci.,Polym. Chem. Ed., 23(4), 1255-8, (1985).
133. Y. Imanishi, M. Tanaka, and C. H. Bamford, Int. J. Biol. Macromol., 7(2),89-99, (1985).
134. K. Kugo, H. Nishioka, and J. Nishino, Chem. Express, 2(l), 21-4, (1987).
135. A. Nakajima, T. Hayashi, K. Kugo, and K. Shinoda, Macromolecules, .12,840-3, (1979).
136. B. Perly, A. Douy, and B. Gallot, Makromol. Chem., 177, 2569-89, (1976).
137. Y. Yamamshita, Y. Iwaya, and K. Ito, Makromol. Chem., 176, 1207-16,(1975).
138. G. W. Chen, T. Hayashi, and A. Nakajima, Polym. J. (Tokyo), 16(11),805-14, (1984).
139. A. G. Walton, MMI Press Symp. Ser., 3(Block Copolym.), 109-28, (1983).
140. T. Hayashi, G. W. Chen, and A. Nakajima, Polym. J. (Tokyo), 16(10), 739-49,(1984).
141. T. A. Syromyatnikova, G. P. Vlasov, B. M. Ginzberg, R. A. Ivanova, L. A. '"
Ovsyannikova, G. D. Rudkovskaya, S. Ya. Frenkel, B. M. Shabsel's, andA. A. Shepelevskii, Vysokomol. Soedin. Ser. B, 27(3), 172-6, (1985).
142. A. Mori, Y. Ito, M. Sisido, and Y. Imanishi, Biomaterials, 7(5), 386-92,(1986).
143. A. K. Murthy and M. Muthukumar, Macromolecules, 20, 564-9, (1987).
102
?A
144. K. W. McKay, Masters Thesis, University of Minnesota, to be published.
145. J. D. Ferry, Viscoelastic Properties of Polymers, John Wiley and Sons,Inc.,New York, 1961.
L L.
~ N:? -2.;:?
W~j *~j R" ..%

APPENDIX
Table A.1List of Samples for Which Rheological Data is Included in Table A.2
ETHYL ACRYLATE-PBLG GELS
SAMPLE % AIBN Lo PBLG* % EDA* RXN T MM WD MW PBLG
1,I 0.00 0.99 0.00 N/A 2 343
2,I-D 0.00 1.00 0.00 N/A 1 343
3,1 0.00 3.96 0.00 N/A 1 120
4,1 0.00 3.94 0.00 N/A 2 343
5,1 0.00 24.99 0.00 N/A 2 120
LINEAR PEA-PBLG FILMS
SAMPLE % AIBN* c_. PBLG L EDA" RXN T MM WD MW PBLG
6,1 0.26 0.0 0.0 B 1 N/A
7,1 0.26 1.03 0.0 C 2 165
8,D 0.26 1.03 0.0 A 1 165
9,I 0.27 0.99 0.0 B 2 343
10,1 0.23 1.93 0.0 B 1 343
11,D 0.23 2.08 0.0 A 1 165
12,1 0.24 2.04 0.0 B 2 343
13,1 0.28 2.91 0.0 A 1 165
14,I-D 0.26 2.98 0.00 C 2 120 S
15,I-D 0.24 3.99 0.00 B 2 120
16,I-D 0.24 3.99 0.00 C 2 120
17,1 0.24 4.71 0.0 A 2 165
18,I-D 0.28 5.01 0.00 C 2 120
19,I-D 0.25 24.98 0.00 B 2 120
104
%~ ., :N-

CROSSLINKED PEA-PBLG IPN'S
SAMPLE Lo A1BN- To PBLG* % EDA" RXN T MM WI) MW PBLG
20,1 0.26 0.0 0.98 B 1 N/A
21,1 0.28 0.0 4.99 B 1 N/A
22,1 0.23 0.0 5.04 A 1 N/A
23,I-I) 0.23 0.00 9.89 C 1 N/A
24,1 0.22 1.03 1.04 B 2 343
25,1 0.25 1.00 1.00 A 1 343
26,1 0.23 0.98 5.13 B 2 343
27,1 0.15 1.11 5.26 B 2 343
28,1 0.20 0.98 10.30 C 1 343
29,I-D 0.24 1.00 9.91 B 2 343
30,1-D) 0.25 24.98 5.06 B 2 120
ALL % ARE WRIGHT PERCENT OF TOTAL MIXTURE
I represents taking data at 0.3, then 1.0, then 5.0 % strain.
D represents taking data at 5.0, then 1.0, then 0.3 % strain.
RXN T represents reaction time window:A: 4 to 6 hoursB: 16 to 20hoursC: over 40 hours
A
105~
% % % V

Table A.2Rheological Data for Selected Gel, Film, and IPN Samples.
(Sample Description from Table A. 1)
Storage Moduli for Ethyl Acrylate - PBLG Gels at VariousWeight Percent PBLG and Strains.
(All Moduli Values in Dynes per Centimeter Squared) '
SAMPLE 11 21 2D 31 41 51FREQ(rad/s)
0.3 PERCENT STRAIN
.1000 4.801E4 4.968E4 2.020E4 2.297E5 2.210E5 1.398E6
.2155 7.795E4 5.957E4 1. 180E4 2.490E5 2.153E5 1.460E6
.4642 6.7411E4 4.692E4 2.554E34 2.775E5 2.579E5 1.735E61.000 7.839E4 5.857E4 4.208E4 2.977E5 2.704E5 1.744E62.155 8.041E4 5.951E4 3.965E4 2.980E5 2.866E5 1.738E64.642 8.359E34 6.357E4 4.220E34 3.125E5 2.996E5 1.757E610.00 8.834E4 6.561E4 4.307E4 3.263E5 3.218E5 1.769E621.54 9.249E4 6.923E4 4.497E4 3.391E5 3.388E35 1.829E646.41 9.607E4 7.091E4 4.639E4 3.524E5 3.585E5 1.850E6100.0 9.876E4 7.519E4 4.911E4 3.656E5 3.766E5 1.950E6
1.0 PERCENT STRAIN
.1000 5.393E34 3.154E4 2.336E4 2.242E5 2.039E5 8.756E54
.2155 5.328E4 3.713E4 2.93 1E4 2.334E5 2.043E5 8.000E5
.4642 6.388E4 4.360E4 3.118E4 2.432E5 2.135E5 7.803E51.000 6.717E4 5.014E4 3.443E4 2.495E5 2.247E5 7.361E52.155 7.088E4 5.135E4 3.71 1E4 2.575E5 2.347E5 7.484E54.642 7.520E4 5.336E4 3.875E4 2.656E5 2.495E5 7.420E510.00 7.747E4 5.419E4 4.044E4 2.748E5 2.625E5 7.605E521.54 8.057E4 5.578E4 4.211 E4 2.841E5 2.772E5 8.104E546.41 8.347E4 5.775E4 4.369E4 2.960E5 2.933E5 9.402E5100.0 8.648E4 6.071E4 4.625E4 3.132E5 3.119E5 1.059E6
5.0 PERCENT STRAIN
.1000 3.912E4 1.826E4 1.841E4 7.906E4 1. 128E5 7.163E4
.2 155 4.236E4 2.092E4 2.020E4 7.735E4 1.063E5 1. 170E5
.4642 4.298E4 2.115E4 1.984E4 7.695E4 1.068E5 0.OOOEO1.000 4.398E4 2.201E4 1.935E4 7.774E4 1.085E5 7.578E42.155 4.521E4 2.058E4 1.776E4 7.929E4 1. 137E5 8.067E44.642 4.673E4 1.919E4 1.620E4 8.180E4 1.208E5 9.388E410.00 4.801E4 1.690E4 1.460E4 8.375E4 1.290E5 1.115E521.54 5.018E4 1.55 1E4 1.398E4 8.587E4 1.376E5 1.428E546.41 5.327E4 1.617E4 1.531E4 9.132E4 1.461E5 1.802E5100.0 5.702E4 2.05 1E4 1.961E4 9.693E4 1.527E5 2.457E5
106 p

KTK%9 FX-W(%)0
Loss Moduli for Ethyl Acrylate - PBLG Gels at VariousWeight Percent PBLG and Strains.
(All Moduli Values in Dynes per Centimeter Squared)
SAMPLE 11 21 2D 31 41 51FREQ(rad/s)
0.3 PERCENT STRAIN
.1000 2.685E4 1.478E4 1.170E4 4.049E4 1.486E4 6.760E5.2155 2.070E4 1.422E4 7.277E3 6.983E4 6.3 19E4 8.390E5.4642 1.141E4 1.399E4 1.673E4 2.816E4 4.050E4 2.765E51.000 1.292E4 1.626E4 2.042E3 2.828E4 4.155E4 3.089E52.155 9.098E3 1.376E4 2.846E3 3.464E4 4.913E4 3.307E54.642 1.557E4 7.225E3 5.-*98E3 3.524E4 5.306E4 3.304E510.00 7.532E3 7.972E3 5.337E3 3.473E4 4.844E4 3.368E521.54 8.082E3 8.168E3 5.412E3 3.5 10E4 4.747E4 3.467E546.41 8.400E3 7.936E3 5.943E3 3.509E4 5.150E4 4.125E5100.0 8.812E3 7.60003 5.542E3 3.316E4 4.750E4 3.459E5
1.0 PERCENT S TRAIN
.1000 1.988E4 1.466E4 1.221E4 3.754E4 4.684E4 5.791E5.2155 1.404E4 1.606E4 2.969E2 4.183E4 5.321E4 5.532E5.4642 1.424E4 1.476E34 6.733E3 4.388E4 4.898E4 5.733E51.000 1.183E4 9.019E3 6.930E3 4.361E4 5.043E4 S.370E52.155 9.892E3 9.690E3 5.244E3 4.374E4 5.690E4 6.117E54.642 9.069E3 9.729E3 7.130E33 4.490E4 5.939E4 6.302E510.00 8.800E3 9.920E3 7.340E3 4.658E4 6.140E4 6.485E521.54 8.552E3 1.031E4 7.362E3 4.736E4 6.268E4 6.892E546.41 7.904E3 1.061E34 7.548E3 4.809E4 6.578E4 8.130E5100.0 8.569E3 1. 123E4 8.323E3 5.018E4 6.627E4 8.632E5
5.0 PERCENT STRAIN
.1000 1.781E4 1.141E4 9.960E3 6.185E4 4.913E4 1.762E5
.2155 1.529E4 1.016E4 9.547E3 6.217E4 4.872E4 1.630E5
.4642 1.664E4 1.043E4 9.459E3 6.378E4 5.257E4 0.OOOEO ~-1.000 1.585E4 1.040E4 9.344E3 6.712E4 5.890E4 1.920E52.155 1.632E4 1.055E4 1.006E4 7.059E4 6.344E4 2.059E54.642 1.679E4 1.107E4 1.056E4 7.474E4 6.867E4 2.298E510.00 1.708E4 1.220E4 1. 167E4 7.688E4 7.240E4 2.594E521.54 1.702E4 1.400E4 1.328E4 7.925E4 7.478E4 3.082E546.41 1.662E4 1.689E4 1.586E4 8.343E4 7.595E4 3.659E5100.0 1.593E4 2.028E4 1.894E4 8.848E4 7.784E4 4.352E5 .. ~
107
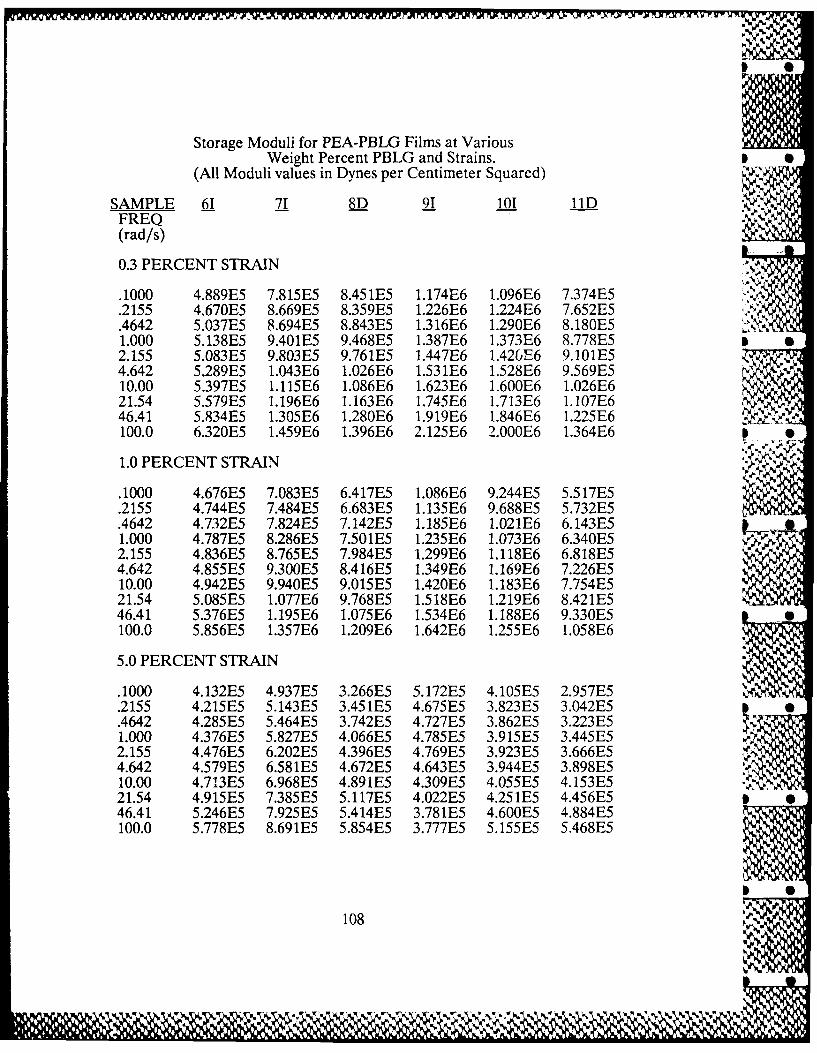
Storage Moduli for PEA-PBLG Films at VariousWeight Percent PBLG and Strains. 0
(All Moduli values in Dynes per Centimeter Squared)
SAMPLE 61 71 8D 91 101 11DFREQ(rad/s)
0.3 PERCENT STRAIN
.1000 4.889E5 7.815E5 8.45 1 E5 1.174E6 1.096E6 7.374E5.2155 4.670E5 8.669E5 8.359E5 1.226E6 1.224E6 7.652E5.4642 5.037E5 8.694E5 8.843E5 1.316E6 1.290E6 8.180E51.000 5.138E5 9.401E5 9.468E5 1.387E6 1.373E6 8.778E52.155 5.083E5 9.803E5 9.76 1E5 1.447E6 1.426E6 9.101E5r4.642 5.289E5 1.043E6 1.026E6 1.531E6 1.528E6 9.569E510.00 5.397E5 1.115E6 1.086E6 1.623E6 1.600E6 1.026E621.54 5.579E5 1. 196E6 1. 163E6 1.745E6 1.713E6 1. 107E646.41 5.834E5 1.305E6 1.280E6 1.919E6 1.846E6 1.225E6100.0 6.320E5 1.459E6 1.396E6 2.125E6 2.000E6 1.364E6
1.0 PERCENT STRAIN
.1000 4.676E5 7.083E5 6.417E5 1.086E6 9.244E5 5.517E5
.2155 4.744E5 7.484E5 6.683E5 1.135E6 9.688E5 5.732E5
.4642 4.7-32E5 7.824E5 7.142E5 1.185E6 1.021E6 6.143E51.000 4.787E5 8.286E5 7.501E5 1.235E6 1.073E6 6.340E52.155 4.836E5 8.765E5 7.984E5 1.299E6 1. 118E6 6.818E54.642 4.855E5 9.300E5 8.416E5 1.349E6 1. 169E6 7.226E510.00 4.942E5 9.940E5 9.015E5 1.420E6 1. 183E6 7.754E521.54 5.085E5 1.077E6 9.768E5 1.518E6 1.219E6 8.421E546.41 5.376E5 1. 195E6 1.075E6 1.534E6 1. 188E6 9.330E5100.0 5.856E5 1.357E6 1.209E6 1.642E6 1.255E6 1.058136
5.0 PERCENT STRAIN
.1000 4.132E5 4.937E5 3.266E5 5.172E5 4.105E5 2.957E5
.2155 4.215E5 5.143E5 3.45 1E5 4.675E5 3.823E5 3.042E5
.4642 4.285E5 5.464E5 3.742E5 4.727E5 3.862E5 3.223E51.000 4.376E5 5.827E5 4.066E5 4.785E5 3.9 15E5 3.445E52.155 4.476E5 6.202E5 4.396E5 4.769E5 3.923E5 3.666E54.642 4.579E5 6.581E5 4.672E5 4.643E5 3.944E5 3.898E510.00 4.713E5 6.968E5 4.891E5 4.309E5 4.055E5 4.153E5 ~..21.54 4.915E5 7.385E5 5.117E5 4.022E5 4.251E5 4.456E546.41 5.246E5 7.925E5 5.414E5 3.781E5 4.600E5 4.884E5100.0 5.778E5 8.691E5 5.854E5 3.777E5 5.155E5 5.468E5
108

Loss Moduli for PEA - PBLG Films at Various Weight Percent PBLG and Strains.(All Moduli Values in Dynes per Centimeter Squared)
SAMPLE 61 71 8D 91 101 11DFREQ(rad/s)
0.3 PERCENT STRAIN
.1000 2.102E4 1.302E5 1. 128E5 1.387E5 2.917E5 1.725E5
.2155 4.564E4 1.446E5 1.075E5 1,626E5 2.66 1E5 1.721E5
.4642 3.970E4 1.378E5 1.396E5 1.570E5 2.487E5 1: 69E51.000 1.31 1E4 1.188E5 1.216E5 1.748E5 2.642E5 2.172E52.155 4.644E4 1.301E5 1.588E5 1.891E5 2.533135 2.332E54.642 3.775E4 1.595E5 1.580E5 2.359E5 3.046E5 2.598E510.00 5.677E4 2.017E5 2.060E5 2.832E35 3.289E5 2.963E521.54 9.023E4 2.670E5 2.625E5 3.602E5 3.918E5 3.5 13E546.41 1.453E5 3.633E5 3.498E5 4.589E5 4.595E5 4.368E5100.0 2.350E5 5.15 1lE5 4.877E5 6.289E5 5.636E5 5.609E5
01.0 PERCENT STRAIN
.1000 4.110E4 1.450E5 1.588E5 1.768E5 2.472E5 1.703E5.215 5 3.594E4 1.427E5 1.625E35 1.619E5 2.503E5 1.779E5.4642 3.536E4 1.456E5 1.646E5 1.776E5 2.460E5 1.808E51.000 2.767E4 1.517E5 1.81 1E5 1.950E5 2.571E5 1.896E52.155 3.501E4 1.671E5 1.846E5 2.169E5 2.807E5 1.989E54.642 3.956E4 1.826E5 2.060E5 2.515SE5 3.008E5 2.265E510.00 5.677E4 2.196E5 2.364E5 2.950E5 3.373E5 2.536E521.54 8.695E4 2.747E5 2.836E5 3.618E5 3.699E5 2.982E546.41 1.362E5 3.649E5 3.629E5 4.989E5 4.263E5 3.691E5100.0 2.196E5 5.093E5 4.9 18E5 6.253E5 4.930E5 4.766E5
5.0 PERCENT STRAIN
.1000 3.636E4 1.560E5 1.755E5 2.445E5 2.206E5 1.543E5
.2155 3.083E4 1.570E5 1.790E5 2.654E5 2.229E5 1.511E5
.4642 2.776E4 1.616E5 1.839E5 2.756E5 2.345E5 1.569E51.000 2.731E4 1.660E5 1.873E5 2.827E5 2.470E5 1.668E5 0N
2.155 2.998E4 1.729E5 1.901E5 2.901E5 2.706E5 1.764E54.642 3.73 1E4 1.908E5 1.983E5 3.004E5 2.875E5 1.904E510.00 5.293E4 2.197E5 2.12 1E5 3.121E5 3.066E5 2.103E521.54 8.266E4 2.647E5 2.362E5 3.299E5 3.280E5 2.390E546.41 1.324E5 3.373E5 2.754E5 3.611 E5 3.539E5 2.859E5100.0 2.105E5 4.496E5 3.35 1E5 3.976E5 3.838E5 3.536E5
109

Storage Moduli for PEA-PBLG Films at VariousWeight Percent PBLG and Strains.
(All Moduli Values in Dynes per Centimeter Squared)
SAMPLE 121 131 141 14D 151 15DFREQ(rad/s)
0.3 PERCENT STRAIN
.1000 1.031E6 2.102E36 1.588E6 1.530E6 1.600E6 1.529E36
.2155 1.098E6 2.174E6 1.719E6 1.653E6 1.666E6 1.687E6
.4642 1. 129E6 2.326E6 1.925E6 1.733E6 1.785E6 1.809E61.000 1.188E6 2.411E6 2.010E6 1.853E6 1.891E6 1.933E62.155 1.257E6 2.605E6 2.084E6 1.913E6 2.054E6 2.031E64.642 1.302E6 2.798E6 2.225E6 2.034E6 2.167E6 2.169E610.00 1.368E6 2.963E6 2.361E36 2.177E6 2.322E6 2.349E62 1.54 1.443E6 3.246E6 2.539E6 2.376E6 2.542E6 2.582E646.41 1.555E36 3.586E6 2.884E6 2.884136 2.946E6 3.015E6100.0 1.733E5 4.109E6 3.348E6 3.534E6 3.472E6 3.561E6
1.0 PERCENT STRAIN
.1000 5.610E5 1.079E6 8.023E5 7.869E5 7.596E5 7.120E5
.2155 5.561E5 1.061E6 8.467E5 7.904E5 8.000E5 7.663E5
.4642 5.670E-; 1. 130136 8.533E5 7.938E5 8.476E5 8.334E51.000 5.810E5 1.203E6 9.024E5 8.067E5 9.019E5 8.866E52.155 6.011E5 1.282E6 9.115E5 8.534E5 9.660E5 9.524E54.642 6.180E5 1.360E6 9.492E5 9.068E5 1.012E6 1.020E610.00 6.439E5 1.435E6 9.870E5 9.955E5 1.060E6 1.087E6.21.54 6.709E5 1.535E6 1.059E6 1.145E6 1.110E6 1.166E646.41 7.116E5 1.681E6 1.203E6 1.389E6 1.226E6 1.298E6100.0 7.752E5 1.910E6 1.546E36 1.797E6 1.421E6 1.583E6
5.0 PERCENT STRAIN
.1000 2.782E5 1. 128E5 1.375E5 1.795E5 2.110OE5 2.149E5
.2155 2.840E5 1.222E5 1.246E5 1.803E5 2.235E5 2.282E5
.4642 2.996E5 1.403E5 1. 192E5 1.733E5 2.518E5 2.602E51.000 3.156E5 1.525E5 l.210E5 1.725E5 2.673E5 2.787E52.155 3.31 1E5 1.639E35 1.262E5 1.757E5 2.799E5 2.93 1E5 :4.642 3.446E5 1.687E5 1.436E5 1.919E5 2.877E5 3.056E5 %A10.00 3.560E5 1.642E5 1.798E5 2.316E5 2.981E5 3.162E5A21.54 3.658E5 1.485E5 2.341E5 2.863E5 3.063E5 3.296E546.41 3.818E5 1.359E5 3.086E5 3.574E5 3.180E5 3.447E5100.0 4.339E5 1.323E5 3.89 1E5 3.985E5 3.477E5 3.700E5
110
V.

Loss Moduli for PEA - PBLG Films at VariousWeight Percent PBLG and Strains. S
(All Moduli Values in Dynes per Centimeter Squared)
SAMPLE 121 131 141 14D 151 15DFREQ(rad/s)
0.3 PERCENT STRAIN
.1000 3.246E5 5.680E5 5.362E5 4.841E5 6.249E5 4.660E5
.2155 3.003E5 5.484E5 5.966E5 5.429E5 4.954E5 5.537E5
.4642 3.214E5 5.869E5 5.334E5 6.212E5 5.413E5 5.549E51.000 3.337E5 6.201135 6.216E5 6.437E5 5.901E5 6.269E52.155 3.598E5 6.477E5 7.325E5 7.146E5 6.574E5 7.252E54.642 3.908E5 7.177E5 8.336E5 8.218E5 7.7 14E5 7.962E510.00 4.412E35 8.333E5 9.901E5 9.758E5 8.808E5 8.774E521.54 5.082E5 9.749E5 1.209E6 1.194E6 1.037E6 1.031E646.41 6.317E5 1.175E6 1.550E6 1.528E6 1.255E6 1.246E6100.0 8.041E5 1.454E6 2.012E6 1.940E6 1.556E6 1.535E6
1.0 PERCENT STRAIN
.1000 2.822E5 6.454E5 5.796E5 4.662E5 5.766E5 5.391E5
.2155 2.783E5 6.585E5 5.573E5 4.946E5 5.574E5 5.442E5
.4642 2.873E5 6.685E5 5.858E5 5.388E5 5.785E5 5.825E5 S1.000 2.991E5 7.014E5 6.541E5 5.930E5 6.182E5 6.300E52.155 3.016E5 7.033E5 7.178E5 6.324E5 6.715E5 6.648E54.642 3.085E5 7.245E5 7.773E5 6.999E5 7.145E5 7.178E510.00 3.166E5 7.683E5 8.656E5 7.828E5 7.63 1E5 7.822E521.54 3.379E5 8.435E5 9.826E5 9.250E5 8.505E5 8.793E546.41 3.819E5 9.847E5 1.205E6 1.164E6 1.007E6 1.051E6100.0 4.618E5 1.191E6 1.566E6 1.540E6 1.265E6 1.330E6
5.0 PERCENT STRAIN
.1000 1.300E5 1.738E5 2.45 1E5 2.333E5 2.468E5 2.347E5
.2155 1.3 19E5 1-889E5 2.470E5 2.324E5 2.565E5 2.5 12E5
.4642 1.339E5 2.009E5 2.583E5 2.406E5 2.632E5 2.597E51.000 1.347E5 2.113E5 2.706E5 2.5 19E5 2.678E5 2.7 13E52.155 1.352E5 2.174F.5 2.904E5 2.726E5 2.71I5E5 2.829E54.642 1.357E5 2.212E5 3.179E5 3.052E5 2.820E5 2.988E510.00 1.425E5 2.249E5 3.595ES 3.587E5 3.036E5 3.164E521.54 1.612E5 2.271E5 4.193E5 4.339E5 3.350E5 3.513E546.41 1.944E5 2.431E5 5.234E5 5.445E5 3.885E5 4.081E5100.0 2.391E5 2.783E5 6.522E5 6.715E5 4.695E5 4.896E5
% %

Storage Moduli for PEA-PBLG Films at VariousWeight Percent PBLG and Strains.
(All Moduli Values in Dynes per Centimeter Squared)
SAMPLE 161 16D 181 18D 191 19DFREQ(rad/s)
0.3 PERCENT STRAIN
.1000 1. 146E6 1. 192E6 1.282E6 1. 196E6 2.962E6 3.514E6
.2155 1. 197E6 1.075E6 1.371E6 1.275E6 3.723E6 3.881E6
.4642 1.219E6 1.084E6 1.413E6 1.345E6 4.069E6 4.124E61.000 1.329E6 1. 165E6 1.437E6 1.389E6 4.401E6 4.423E62.155 1.425E6 1.285E6 1.522E6 1.469E6 4.683E6 4.725E64.642 1.533E6 1.363E6 1.583E6 1.494E6 5.043E6 5.039E610.00 1.681E6 1.481E6 1.674E6 1.563E6 5.325E6 5.322E621.54 1.873E6 1.643E6 1.760E6 1.617E6 5.734E6 5.61913646.41 2.168E6 1.924E6 1.960E6 1.800E6 6.417E6 6.116E6100.0 2.563E6 2.325E6 2.237E6 2.130E6 7.311E6 6.845E6
1.0 PERCENT STRAIN
.1000 8.288E5 6.888E5 7.247E5 6.130E5 1.902E6 1.609E6
.2155 8.899E5 7.170E5 7.174E5 6.311 ES 1.990E6 1.762E6
.4642 9.368E5 7.794E5 7.368E5 6.506E5 2.082E6 1.919E61.000 9.984E5 8.364E5 7.437E5 6.749E5 2.160E6 2.059E62.155 1.078E6 8.971E5 7.664E5 7.018E5 2.231E6 2.040E6 O4.642 1. 150E6 9.753E5 7.901E5 7.273E5 2.274E6 1.980E610.00 1.250E6 1.064E6 8.127E5 7.657E5 2.239E6 1.868E621.54 1.373E6 1.174E6 8.466E5 8.115E5 2.103E6 1.743E646.41 1.549E6 1.320E6 9.079E5 8.882E5 2.079E6 1.333E6100.0 1.819E6 1.573E6 1.007E6 1.020E6 2.114E6 1. 106E6
5.0 PERCENT STRAIN
.1000 2.572E5 2.576E5 1.859E5 1.917E5 2.731E5 2.436E5
.2155 2.835E5 3.134E5 2.046E5 2.162E5 2.693E5 2.623E5
.4642 3.352E5 3.534E5 2.185E5 2.31liE5 2.925135 2.3701351.000 3.689E5 3.841E5 2.24 1E5 2.379E5 2.288E5 2.178E52.155 3.802E5 3.914E5 2.19 1E5 2.347E5 2.015E5 1.877E54.642 3.659E5 3.760E5 2.03 1lE5 2.269E5 1.693E5 1.559E5 4le10.00 3.127E5 3.415E5 1.689E5 2.098E5 1.374E5 1.275E521.54 2.776E5 3.056E5 1.560E5 1.983E5 1. 152E5 1.070E546.41 2.876E5 3.020E5 1.650E5 2.110E5 9.203E4 8.559E4100.0 1.491E5 1.475E5 2.256E5 2.589E5 7.132E4 6.435E4
112

Loss Moduli for PEA - PBLG Films at VariousWeight Percent PI3LG and Strains.
(All Moduli Values in Dynes per Centimeter Squared)
SAMPLE 161 16D 181 18D 191 19DFREQ(rad/s)
0.3 PERCENT STRAIN
.1000 2.686E5 1.589E5 4.177E5 4.417E5 1.436E6 1.418E6
.2155 1.518E5 2.892E5 4.152E35 4.836E5 1.304E6 1.453E6
.4642 3.091E5 3.004E5 4.570E5 4.955E5 1.337E6 1.495E61.000 3.978E5 3.180E5 4.912E5 5.288E5 1.413E6 1.593E62.155 3.882E5 3.551E5 5.514E5 5.988E5 l.469E6 1.688E64.642 4.757E5 4.376E5 5.792E5 6.493E5 1.553E6 1.789E610.00 5.818E5 5.288E5 6.409E5 7.269E5 1.811E6 1.938E621.54 7.250E5 6.682E5 7.084E5 8.047E5 2.03 1E6 2.187E646.4 1 9.427E5 8.836E5 8.557E5 9.515SE5 2.390E6 2.570E6100.0 1.260E6 1. 172E6 1.046E6 1. 156E6 2.85 1E6 3.046E6
1.0 PERCENT STRAIN
.1000 2.858E5 2.308E5 3.503E5 3.562E5 1.281E6 1.276E6.2155 2.789E5 2.440E5 3.738E5 3.759E5 1.308E6 1.346E6.4642 3.104E5 2.558E5 3.890E5 3.891 E5 1.384E6 1.421E61.000 3.284E5 2.860E5 4.090E5 4.0 17E5 1.460E6 1.474E62.155 3.714E5 3.248E5 4.292E35 4.272E5 1.543E6 1.5 10E64.642 4.226E5 3.723E5 4.553E5 4.465E5 1.639E6 1.5 19E610.00 5.021E5 4.508E5 4.865E5 4.756E5 1.699E6 1.490E621.54 6.237E5 5.662E5 5.370E5 5.246E5 1.715E6 1.465E646.41 8.072E5 7.474E5 6.222E5 6.116E5 1.778E6 1.617E6100.0 1.076E6 9.920E5 7.526E5 7.484E5 1.888E6 1.706E6
5.0 PERCENT STRAIN
.1000 2.820E5 2.575E5 2.163E5 1.975E35 5.690E5 5.5 13E5' %A
.2155 2.927E5 2.638E5 2.145E5 1.969E5 6.074E5 5.928135
.4642 2.940E5 2.632E5 2.115E5 1.977E5 6.43 1E5 5.290E5 -
1.000 2.949E5 2.669E5 2.086E5 1.987F5 5.401E5 5.043E52.155 2.984E5 2.716E5 2.12 1E5 2.007E5 5.058E5 4.677E54.642 3.084E-5 2.830E5 2.167E5 2.084E5 4.493E5 4.208E5 .
10.00 3.294E5 3.082E5 2.307E5 2.256E5 3.911 E5 3.732E521.54 3.726E5 3.558E5 2.513E5 2.551E5 3.573E5 3.43 1E546.41 4.387E5 4.270E5 29 5 5E5 3.016E5 3.449E5 3.350E5100.0 4.137E5 4.038E5 3.633E5 3.698E5 3.499135 3.438E5
113
~~~.4*~~~~~~~~ z YM.~aC&JC?' . '-- --

Storage Moduli for PEA - PBLG IPN's at VariousWeight Percent PBLG and Strains.*
(All Moduli Values in Dynes per Centimeter Squared)
SAMPLE 171 201 211 221 231 23DFREQ
0.3 PERCENT STRAIN
.1000 1.489E6 4.131E5 4.496E5 2.150E5 6.097E5 3.788E5
.2155 1.569E6 4.175E5 4.674E5 2.352E5 5.409E5 5.085E5
.4642 1.628E6 4.326135 4.931E5 2.580E5 5.234E5 5.547E51.000 1.691E6 4.433E5 5.139E35 2.697E5 5.579E5 5.945E52.155 1.739E6 4.635E5 5.356E35 2.932E5 5.990E5 5.783E54.642 1.825E6 4.724E5 5.601E5 3.030E5 6.326E5 6.219E510.00 1.890E6 4.944E5 5.956E5 3.269E5 6.915E5 6.737E5211.54 1.986E6 5.246E5 6.363E5 3.577E5 7.589E5 7.450E546.41 2.115E6 5.839E5 6.984E5 4.003E5 8.642E5 8.517E5100.0 2.236E6 6.538E5 7.789E5 4.512E5 9.871E5 9.686E5
1.0 PERCENT STRAIN
.1090 1.250E6 3.995E5 4.544E5 2.296E5 4.601E5 4.654E5
.2155 1.301E6 4.063E5 4.682E5 2.423E5 5.145E5 4.899E5.4642 1.345E6 4.183E5 4.819E5 2.575E5 5.223E35 5.107E51.000 1.395E6 4.222E5 4.942E5 2.714E5 5.6CSE5 5.408E52.155 1.455E6 4.394E5 5.198E5 2.854E5 5.877E5 5.696E54.642 1.515E6 4.534E5 5.411E5 3.03 1E5 6.273E35 6.103E510.00 1.576E6 4.752E5 5.713E5 3.25 1E5 6.798E5 6.620E521.54 1.656E6 5.077E5 6.117E5 3.550E5 7.516E5 7.294E3546.41 1.747E6 5.587E5 6.699E5 3.962E5 8.476E5 8.243E5100.0 1.813E6 6.355E35 7.532E5 4.519E5 9.84 1E5 9.529E5
5.0 PERCENT STRAIN
.1000 6.601 E5 3.474E5 4.676E5 2.133E5 4.597E5 4.476E5
.2155 6.507E5 3.469E5 4.850E5 2.219E5 4.727E5 640E5.4642 6.630E5 3.582135 5.075E5 2.317E5 4.872E5 4.815E51.000 6.75 1E5 3.704E5 5.319E5 2.421E5 5.071 E5 5.028E52.155 6.839E5 3.844E5 5.593E5 2.544E5 5.344E5 5.306E54.642 6.930E5 4.012E5 5.918E5 2.699E5 5.719E5 5.683E510.00 7.036E5 4.247E5 6.347E5 2.910E5 6.190E5 6.158E521.54 7.185E5 4.609E5 6.897E5 3.189E5 6.803E5 6.781E546.41 2.300E5 5.138E5 7.658E5 3.568135 7.608135 7.591E5100.0 1.672E5 5.92 1lE5 8.74 1lE5 4.078E5 8.758E5 8.714E5
Sample 171 is a PEA-PBLG film which was carried over to this set of data.
114

Loss Moduli for PEA - PBLG IPN's at VariousWeight Percent PBLG and Strains."
(All Moduli Values in Dynes per Centimeter Squared)
SAMPLE 171 201 211 221 231 23DFREQ(rad/s)
0.3 PERCENT STRAIN O~
.1000 3.427E5 1.00114 5.018134 2.525E34 0.000E0 9.404E34.2155 3.393E5 1. 118E4 4.346E4 1. 178E4 1.230135 6.556E34.4642 3.421E5 3.278E4 4.875E34 2.312E4 7.554E4 8.436E341.000 3.514E35 1.928E4 6.310E4 3.495E4 8.455134 6.386E3412.155 3.505 E5 3.537E4 5.780134 3.702E4 8.562134 8.9731344.642 3.770135 5.225134 7.547E4 5.173134 1. 188135 1. 128E5 i
10.00 3.925E35 8.428134 9.850134 6.787E34 1.664E5 1.636E3521.54 4.356E35 1.239135 1.444E5 9.035E4 2.363E5 2.304E546.41 5.145135 1.901 E5 2.123E5 1. 193135 3.527135 3.357E35100.0 6.025E35 2.904E35 3.203E5 1.733135 5.346135 5.064E5 0 -
1.0 PERCENT STRAIN
.1000 2.7E .914 5.336E4 2.589E4 4.440134 8.185E34
.2155 2.457E35 2.423E4 5.054E34 2.626134 4.141E4 4.680E4
.4642 2.507E5 3.295134 4.947E4 2.940E4 6.533E34 6.1491341.000 2.618E35 3.487E4 5.317E4 3.368134 6.630134 7.6411342.155 2.751135 4.109134 6.423E4 4.284134 8.901E4 8.9451344.642 2.944E35 6.116E4 7.943E4 5.295134 1.221E5 1.191E510.00 3.241E5 8.428134 1.046135 6.972134 1.687135 1.61513521. 54 3.628135 1.240135 1.462135 9.301134 2.387E5 2.29: 3'
46.41 4.272E5 1.867135 2.127135 1.260135 3.481135 3.356135100.0 5.201135 2.884135 3.262135 1.775135 5.382135 5.154135
5.0 PERCENT STRAIN
.1000 2.771135 4.724134 9.356134 3.259134 5.702E34 5.902134
.2155 2.753135 5.693E34 9.984134 3.462134 5.671134 6.042134
.4642 2.791135 5.845134 1.050135 3.665134 6.236134 6.1991341.000 2.806135 6.164134 1. 129135 4.041134 7.678134 7.575E342.155 2.825135 6.609134 1.257E35 4.689134 9.637134 9.6251344.642 2.834135 7.912134 1.451135 5.685134 1.261E35 1.24613510.00 2.895135 1.003135 1.744135 7.314134 1.674135 1.646135 .
21.54 3.044E35 1.355135 2.209E35 9.416134 2.289135 2.27713546.41 3.185E35 1.920135 2.956135 1.25 1135 3.285135 3.276135100.0 3.047E35 2.852135 4.202135 1.715135 4.97 11E5 4.954E35
*Sample 171 is a PEA-PBLG film which was carried over to this set of data.
115
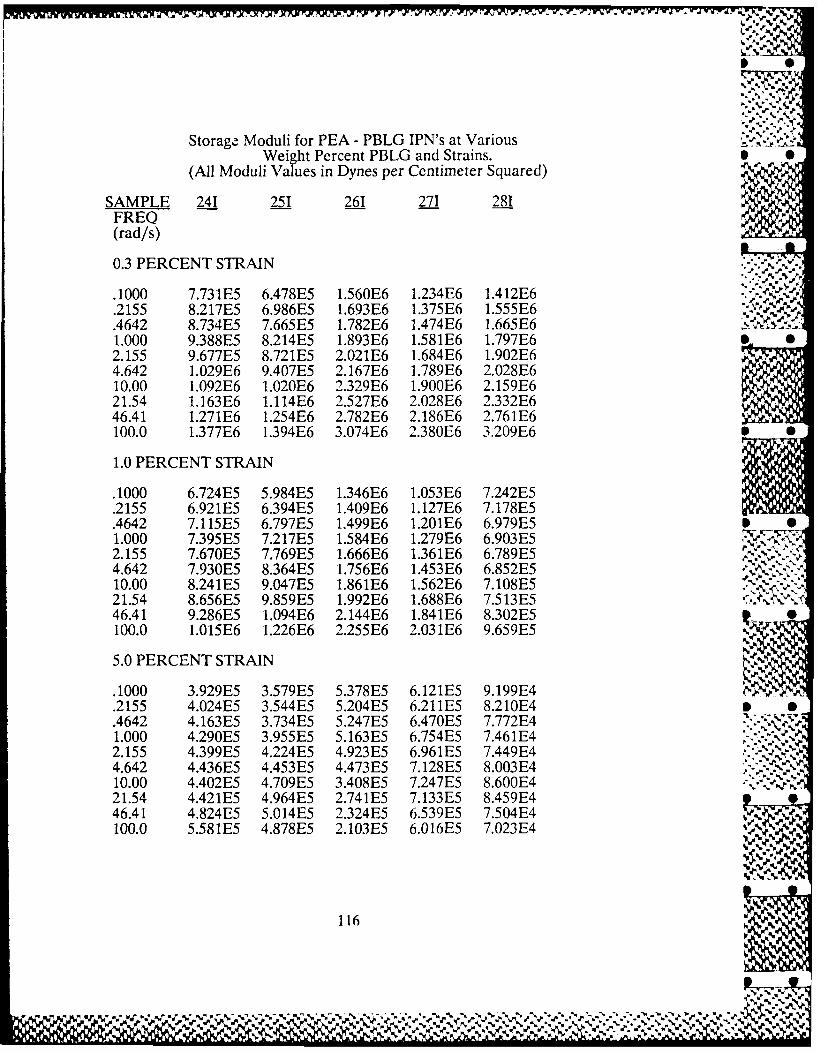
Storag Moduli for PEA - PBLG IPN's at VariousWeight Percent PBLG and Strains. S
(All Mod uli Values in Dynes per Centimeter Squared)
SAMPLE 2141 251 261 271 281FREQ(rad/s)
0.3 PERCENT STRAIN
.1000 7.731E5 6.478E5 1.560E6 1.234E6 1.412E6
.2155 8.217E5 6.986E5 1.693E6 1.375E6 1.555E6
.4642 8.734E5 7.665E5 1.782E6 1.474E6 1.665E61.000 9.388E5 8.214E5 1.893E6 1.581E6 1.797E62.155 9.677E5 8.721E5 2.021E6 1.684E6 1.902E64.642 1.029E6 9.407E5 2.167E6 1.789E6 2.028E610.00 1.092E6 1.020E6 2.329E6 1.900E6 2.159E621.54 1.163E6 1. 114E6 2.527E6 2.028E6 2.332E646.41 1.271E6 1.254E6 2.782E6 2.186E6 2.761E6100.0 1.377E6 1.394E6 3.074E6 2.380E6 3.209E6 S
1.0 PERCENT STRAIN
.1000 6.724E5 5.984E5 1.346E6 1.053E6 7.242E5
.2155 6.92 1E5 6.394E5 1.409E6 1. 127E6 7.178E5
.4642 7.115E5 6.797E5 1.499E6 1.201E6 6.979E5 S1.000 7.395E5 7.217E5 1.584E6 1.279E6 6.903E52.155 7.670E5 7.769E5 1.666E6 1.361E6 6.789E54.642 7.930E5 8.364E5 1.756E6 1.453E6 6.852E510.00 8.241E5 9.047E5 1.861E6 1.562E6 7.108E5 -
21.54 8.656E5 9.859E5 1.992E6 1.688E6 7.5 13E546.41 9.286E5 1.094E6 2.144E6 1.841E6 8.302E5100.0 1.015E6 1.226E6 2.255E6 2.03 1E6 9.659E5 N
5.0 PERCENT STRAIN
.1000 3.929E5 3.579E5 5.378E5 6.121E5 9.199E4
.2155 4.024E35 3.544E5 5.204E5 6.211 E5 8.210E4
.4642 4.163E5 3.734E5 5.247E5 6.470E5 7.772E41.000 4.290E5 3.955E5 5.163E5 6.754E5 7.46 1E42.155 4.399E5 4.224E5 4.923E5 6.961lE5 7.449E44.642 4.436E5 4.453E5 4.473E5 7.128E5 8.003E410.00 4.402E5 4.709E5 3.408E5 7.247E5 8.600E421.54 4.421E5 4.964E5 2.74 1E5 7.133E5 8.459E446.41 4.824E5 5.014E5 2.324E5 6.539E5 7.504E4100.0 5.58 1E5 4.878E5 2.103E35 6.016E5 7.023E4
116

Loss Moduli for PEA - PBLG IPN's at VariousWeight Percent PBLG and Strains.
(All Moduli Values in Dynes per Centimeter Squared)
SAMPLE 241 251 261 271 2814FREQ(rad/s)
0.3 PERCENT STRAIN
.1000 1.595E5 1.290E5 2.870E5 2.929E5 5.218E5
.2155 1.221E5 1.150E5 2.654E5 2.827E5 5.567E5
.4642 1.414E5 1.288E5 2.686E5 2.773E5 5.990E51.000 1.538E5 1.225E5 2.937E5 2.893E5 6.748E52.155 1.501E5 1.675E5 3.250E5 3.141E5 7.807E54.642 1.826E5 1.791E5 3.734E5 3.412E5 9.001E510.00 2.185E5 2.177E5 4.459E5 3.882E5 l.108E621.54 2.598E5 2.727E5 5.299E5 4.523E5 1.193E646.41 3.243E5 3.452E5 6.440E5 5.304E5 1.499E6100.0 4.067E5 4.330E5 8.172E5 6.338E5 1.780E6
1.0 PERCENT STRAIN
.1000 1.598E5 1.436E5 3.003E5 2.798E5 5.088E5
.2155 1.485E5 1.372E5 3.094E5 2.703E5 5.335E5 N.4642 1.555135 1.500E5 3.253E5 2.780E5 5.702E51.000 1.665E5 1.640E5 3.564E5 2.984E5 6.129E52.155 1.731E5 1.756E5 4.052E5 3.103E5 6.594E54.642 1.981E5 2.075135 4.615E5 3.378E5 7.05 1E5 pt
10.00 2.249E5 2.399E5 5.281E5 3.716E5 7.276E521.54 2.582E5 2.853E5 6.010E5 4.188E5 7.638E54o.41 3.063E5 3.518E5 7.205E5 4.852E5 8.587E5100.0 3.826E5 4.403E5 8.800E5 5.78 1E5 1.003E6
.J PERCENT STRAIN
.1000 1.278E5 1.468E5 3.512E5 2.570E5 2.040E5
.2155 1.269E5 1.582E5 3.594E5 2.546E5 2.027E5
.4642 1.297135 1.663E5 3.752E5 2.615E5 2.053E51.000 1.35 lE5 1.788E5 3.865E5 2.726E5 2.077E5 vJ.2.155 1.439E5 1.926E5 3.936E5 2.904E5 2.121E54.642 1.568E5 2.109E5 3.985E5 3.113E5 2.138E510.00 1.773E5 2.3711E5 4.086E5 3.350E5 2.142E521.54 2.005E5 2.709E5 3.965E5 3.728E5 2.139E546.41 2.294E5 3.220E5 4.016E5 4.069E5 2.149E5 0100.0 2.79 1E5 3.66 1E5 4.24 1E5 4.199E5 2.253E5
117
LkC

Storage Moduli for PEA - PBLG IPN's at VariousWeight Percent PBLG and Strains.
(All Moduli Values in Dynes per Centimeter Squared)
SAMPLE 291 29D 301 30DFREQ(rad/s)
0.3 PERCENT STRAIN
.1000 4.864E5 5.090E5 3.238E6 2.99 1E6
.2155 5.189E5 5.328E5 3.461E6 3.012E6.4642 5.478E5 5.503E5 3.572E6 2.984E61.000 5.724E5 5.752E5 3,670E6 .2.944E62.155 6.005E5 5.882E5 3.71 1E6 2.8 11 E64.642 6.265E5 6.292E5 3.661E6 2.474E610.00 6.627E5 6.638E5 3.578E6 2.226E621.54 7.064E5 7.037E5 3.51 1E6 2.077E646.41 7.574E5 7.538E5 3.878E6 2.159E6100.0 8.244E5 8.207E5 4.354E6 2.472E6
1.0 PERCENT STRAIN
.1000 4.489E5 4.392E5 7.269E5 7.225E5
.2155 4.720E5 4.616E35 6.994E5 6.660E5
.4642 4.924E5 4.82 1lE5 6.488E5 6.013E51.000 5.149E5 5.018E5 6.061E5 5.341E5 %
2.155 5.419E5 5.287E5 5.665E5 4.957E54.642 5.658E5 5.544E5 5.269E5 4.590E5 410.00 5.963E5 5.849E5 4.858E5 4.234E521.54 6.328E5 6.206E5 4.282E5 3.805E546.4 1 6.779E5 6.634E5 4.026E5 3.544E5100.0 7.35 lE5 7.204E5 3.999E5 3.637E5
5.0 PERCENT STRAIN ~S
.1000 2.589E5 2.791E5 5.103E4 5.302E4
.2155 2.637E5 2.836E5 4.552E4 4.64 1E4
.4642 2.705E5 2.910E5 3.918E4 4.048E41.000 2.75 1E5 2.972E5 3.572E4 3.766E42.155 2.770E5 3.010E5 3.491E4 3.512E44.642 2.790E5 3.037E5 3.655E4 3.46 1 E410.00 2.819E5 3.069E5 3.307E4 3.353E421.54 2.879E5 3.109E5 3.082E4 3.00911446.41 3.016E5 3.248E5 2.880E4 2.65 1 E4100.0 3.307E5 3.566E5 2.345E4 2.213E4 .
118
04~~~~* or. .01.401r. '

Loss Moduli for PEA - PBLG IPN's at VariousWeight Percent PBLG and Strains.
(All Moduli Values in Dynes per Centimeter Squared)
SAMPLE 291 29D) 301 30DFREQ(rad/s)
0.3 PERCENT STRAIN
.1000 8.119E4 6.396E34 1.201E6 1.312E6.2155 7.288E4 6.079E4 1.209E6 1.365E6.4642 6.233E4 6.084E4 1.307E6 1.429E61.000 6.975E4 5.706E4 1.387E6 1.487E62.155 7.172E4 7.366E4 1.556E6 1.519E64.642 7.996E4 8.421E4 1.698E6 1.627E610.00 9.608E4 9.628E4 1.788E6 1.597E621.54 1.193E5 1.180E5 1.963E6 1.621E646.41 1-532E5 1.531E5 2.199E6 1.849E6100.0 2.034E5 2.071E5 2.442E6 2.166E6
1.0 PERCENT STRAIN
.1000 8.442E4 7.315E4 1.043E6 8.641E5
.2155 8.136E4 7.479E4 1.020E6 8.458E5
.4642 8.207E4 7.782E4 9.986E5 8.257E51.000 8.718E4 8.148E4 9.778E5 7.881E52.155 8.977E4 8.772E4 9.343E5 7.448E54.642 1.015E5 9.672E4 8.769E5 7.044E510.00 1. 155E5 1. 10E5 8.050E5 6.603E521.54 1.352E5 1.316E5 7.713E5 6.438E3546.41 1.668E5 1.634E5 8.208E5 6.841E5100.0 2.168E5 2.124E5 8.977E5 7.644E5
5.0 PERCENT STRAIN
.1000 1. 123E5 9.367E4 2.143E5 1.840E5
.2155 1. 119E5 9.906E4 2.032E5 1.744E5
.4642 1. 152E5 1.041E5 1.923E5 1.672E51.000 1. 192E5 1.095E5 1.818E5 1.599E52.155 1.262E5 1.161E5 1.675E5 1.526E54.642 1.356E5 1.256E5 1.583E5 1.451E510.00 1.461E5 1.383135 1.476E5 1.403E521.54 1.624E5 1.566E5 1.439E5 1.386E546.41 1.857E5 1.801E5 1.470E5 1.429E5100.0 2.179E5 2.147E5 1.562E5 1.525E5
119
re ~.