Embed Size (px)
Citation preview
Louisiana State UniversityLSU Digital Commons
LSU Doctoral Dissertations Graduate School
2009
Creep behavior of natural fiber reinforced polymercompositesYanjun XuLouisiana State University and Agricultural and Mechanical College, [email protected]
Follow this and additional works at: https://digitalcommons.lsu.edu/gradschool_dissertations
Part of the Environmental Sciences Commons
This Dissertation is brought to you for free and open access by the Graduate School at LSU Digital Commons. It has been accepted for inclusion inLSU Doctoral Dissertations by an authorized graduate school editor of LSU Digital Commons. For more information, please [email protected].
Recommended CitationXu, Yanjun, "Creep behavior of natural fiber reinforced polymer composites" (2009). LSU Doctoral Dissertations. 1290.https://digitalcommons.lsu.edu/gradschool_dissertations/1290
CREEP BEHAVIOR OF NATURAL FIBER REINFORCED
POLYMER COMPOSITES
A Dissertation
Submitted to the Graduate Faculty of the
Louisiana State University and
Agricultural and Mechanical College
in partial fulfillment of the
requirements for the degree of
Doctor of Philosophy
In
The School of Renewable Natural Resources
by
Yanjun Xu
B.E., Sichuan University, June 2002
M.E., Sichuan University, June 2005
December 2009
ii
ACKNOWLEDGEMENTS
It is my pleasure to acknowledge some people who contributed to this dissertation.
I am heartily thankful to my advisor, Dr. Qinglin Wu, for his guidance and support during
my PhD study. His diligence and intelligence have motivated me to excel not only in this
program, but also in my future career.
I would also like to thank my committee members, Dr. Quang V. Cao, Dr. Ioan I.
Negulescu, Dr. Su-Seng Pang, and Dr. Paul Russo. Their suggestions and advices were very
valuable and constructive in my research and dissertation writing.
My special thanks go to my friend and lab mate, Dr. Yong Lei, for his help during this
program. My other lab mates, Dr. Hongzhi Liu, Dr. Fei Yao, Mr. Birm June Kim, Dr. Dagang
Liu, and Dr. Haiyun Liu, also helped me in my research in many different ways. Thanks. I also
thank Dr. Craig M. Clemons, Materials Research Engineer in USDA Forest Service, for his
revision on part of this dissertation.
My thanks also go to our host family, Virginia, Cheryl Elise, and Charles Grenier, and
Lucille Price Parsons. They made us feel at home in this country. I also want to thank our friends,
Hongyi Wu and Yingqin Zhang, and their host parents, Ronni and Richard DeBates, for their
sincere friendship and help in my life and work. Mr. DeBates also edited this dissertation.
Finally, I owe my deepest gratitude to my wife, Xian Guan, for her love, care, and
encouragement throughout our marriage. She is the most wonderful woman I have ever met in
my life, and she is the one who should receive credit for each and every single achievement I
made. I also thank our parents for their understanding and support.
iii
TABLE OF CONTENTS
ACKNOWLEDGEMENTS ............................................................................................................ ii
LIST OF TABLES ......................................................................................................................... vi
LIST OF FIGURES ..................................................................................................................... viii
NOMENCLATURE ...................................................................................................................... xi
ABSTRACT ................................................................................................................................. xiii
CHAPTER 1 INTRODUCTION .................................................................................................... 1
1.1 BACKGROUND .................................................................................................................. 1 1.2 OBJECTIVES ....................................................................................................................... 3
1.3 ORGANIZATION OF DISSERTATION ............................................................................ 4
1.4 REFERENCES ..................................................................................................................... 4
CHAPTER 2 NATURAL FIBER REINFORCED POLY(VINYL CHLORIDE) COMPOSITES:
EFFECT OF FIBER TYPE AND IMPACT MODIFIER .............................................................. 6 2.1 INTRODUCTION ................................................................................................................ 6
2.2 EXPERIMENTAL ................................................................................................................ 8 2.2.1 Raw Materials ................................................................................................................ 8 2.2.2 Composite Preparation ................................................................................................... 9
2.2.3 Measurements ................................................................................................................ 9 2.3 RESULTS AND DISCUSSION ......................................................................................... 12
2.3.1 Mechanical Properties .................................................................................................. 12 2.3.2 Glass Transition Temperature ...................................................................................... 15
2.3.3 Thermal Stability ......................................................................................................... 16 2.3.4 Water Absorption (WA) and Thickness Swelling (TS) ............................................... 19
2.4 CONCLUSIONS................................................................................................................. 23
2.5 REFERENCES ................................................................................................................... 24
CHAPTER 3 CREEP BEHAVIOR OF BAGASSE FIBER REINFORCED POLYMER
COMPOSITES .............................................................................................................................. 26 3.1 INTRODUCTION .............................................................................................................. 26
3.2 THEORETICAL BACKGROUND .................................................................................... 27 3.2.1 Creep Models ............................................................................................................... 27
3.2.2 Accelerated Testing ..................................................................................................... 29 3.3 EXPERIMENTAL .............................................................................................................. 30
3.3.1 Raw Material ................................................................................................................ 30 3.3.2 Composite Preparation ................................................................................................. 31 3.3.3 Characterization ........................................................................................................... 32 3.3.4 Creep Modeling ........................................................................................................... 32 3.3.5 Recovery Analysis ....................................................................................................... 33 3.3.6 Non-recoverable Deformation ..................................................................................... 34
iv
3.4 RESULTS AND DISCUSSION ......................................................................................... 34
3.4.1 Stress-Strain Behavior ................................................................................................. 34 3.4.2 Temperature Effect ...................................................................................................... 35 3.4.3 Time-Temperature Superposition ................................................................................ 42
3.4.4 Creep Modeling ........................................................................................................... 46 3.4.5 Recovery Analysis ....................................................................................................... 53
3.5 CONCLUSIONS................................................................................................................. 53 3.6 REFERENCES ................................................................................................................... 54
CHAPTER 4 THE EFFECT OF COUPLING AGENTS AND BAMBOO FLOUR LOADING
ON CREEP PROPERTY OF HDPE-BASED COMPOSITES .................................................... 55 4.1 INTRODUCTION .............................................................................................................. 55 4.2 EXPERIMENTAL .............................................................................................................. 57
4.2.1 Materials and Blend Design ......................................................................................... 57 4.2.2 Sample Preparation ...................................................................................................... 57
4.2.3 Creep Characterization................................................................................................. 58 4.2.4 Creep Modeling ........................................................................................................... 58
4.2.5 Time-Temperature Superposition (TTS) ..................................................................... 59 4.3 RESULTS AND DISCUSSION ......................................................................................... 59
4.3.1 Effect of Individual Modifier Type and Content ......................................................... 59
4.3.2 Effect of Combined Modifiers ..................................................................................... 65 4.3.3 Effect of BF Loading ................................................................................................... 66
4.3.4 Morphological Analysis on the Creep Mechanism of the Composites ........................ 66 4.3.5 Indexed Burgers Models .............................................................................................. 68 4.3.6 Creep Prediction........................................................................................................... 68
4.4 CONCLUSIONS................................................................................................................. 72
4.5 REFERENCES ................................................................................................................... 73
CHAPTER 5 CREEP BEHAVIOR OF COMPOSITES ENHANCED WITH ENGINEERING
PLASTIC MICROFIBRILS ......................................................................................................... 75 5.1 INTRODUCTION .............................................................................................................. 75
5.2. EXPERIMENTAL ............................................................................................................. 76 5.2.1 Materials ...................................................................................................................... 76
5.2.2 Preparation of the Composites ..................................................................................... 77 5.2.3 Characterization ........................................................................................................... 79 5.2.4 Creep Modeling ........................................................................................................... 79 5.2.5 Time-Temperature Superposition (TTS) ..................................................................... 80
5.3 RESULTS AND DISCUSSION ......................................................................................... 80
5.3.1 HDPE/PA6 Composites ............................................................................................... 80 5.3.2 HDPE/PET Composites ............................................................................................... 85
5.4 CONCLUSION ................................................................................................................... 91 5.5 REFERENCES ................................................................................................................... 91
CHAPTER 6 APPLICATION OF UHMWPE AND UV ABSORBER IN WOOD/HDPE
COMPOSITE: MECHANICAL PROPERTIES AND CREEP BEHAVIOR .............................. 93 6.1 INTRODUCTION .............................................................................................................. 93
v
6.2 EXPERIMENTAL .............................................................................................................. 95
6.2.1 Materials ...................................................................................................................... 95 6.2.2 Composite Preparation ................................................................................................. 96 6.2.3 Weathering ................................................................................................................... 97
6.2.4 Characterization ........................................................................................................... 97 6.2.5 Creep Modeling ........................................................................................................... 97
6.3 RESULTS AND DISCUSSION ......................................................................................... 98 6.3.1 Mechanical Properties .................................................................................................. 98 6.3.2 Creep Behavior .......................................................................................................... 101
6.4 CONCLUSION ................................................................................................................. 107 6.5 REFERENCES ................................................................................................................. 107
CHAPTER 7 CONCLUSIONS AND FUTURE WORK ........................................................... 110
7.1 OVERALL CONCLUSIONS ........................................................................................... 110 7.2 FUTURE WORK .............................................................................................................. 112
APPENDIX: PERMISSION LETTER ....................................................................................... 114
VITA ........................................................................................................................................... 115
vi
LIST OF TABLES
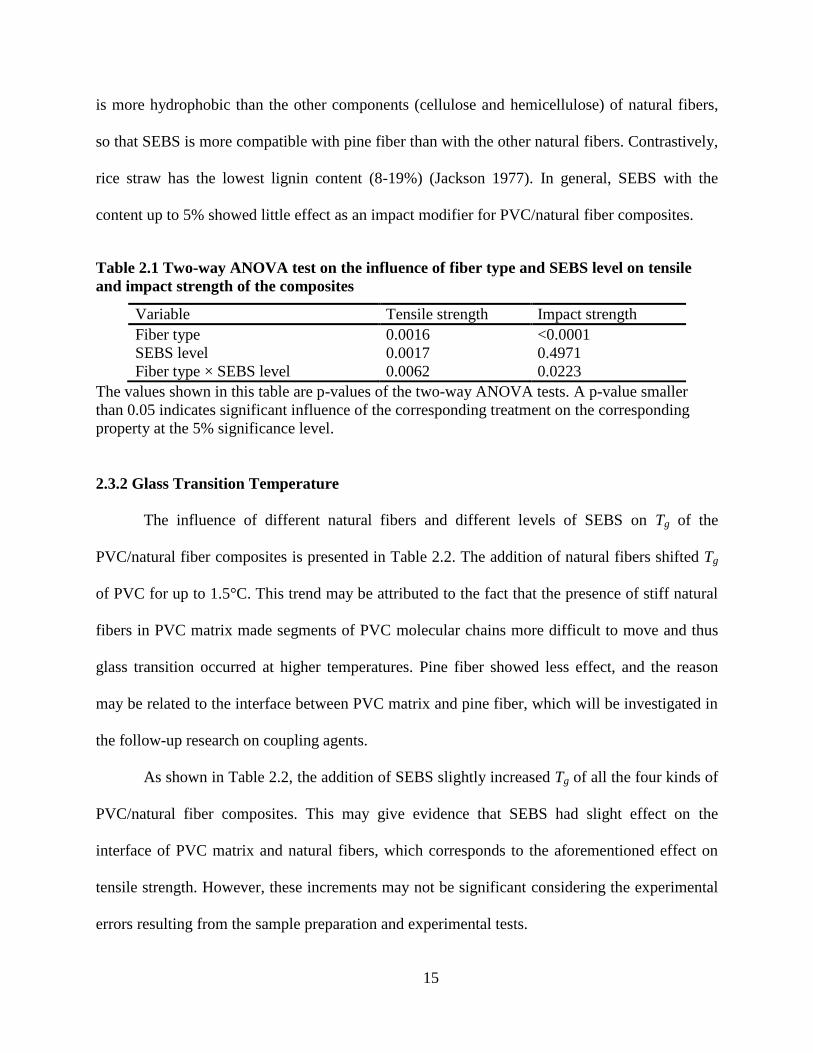
Table 2.1 Two-way ANOVA test on the influence of fiber type and SEBS level on tensile and
impact strength of the composites................................................................................................. 15
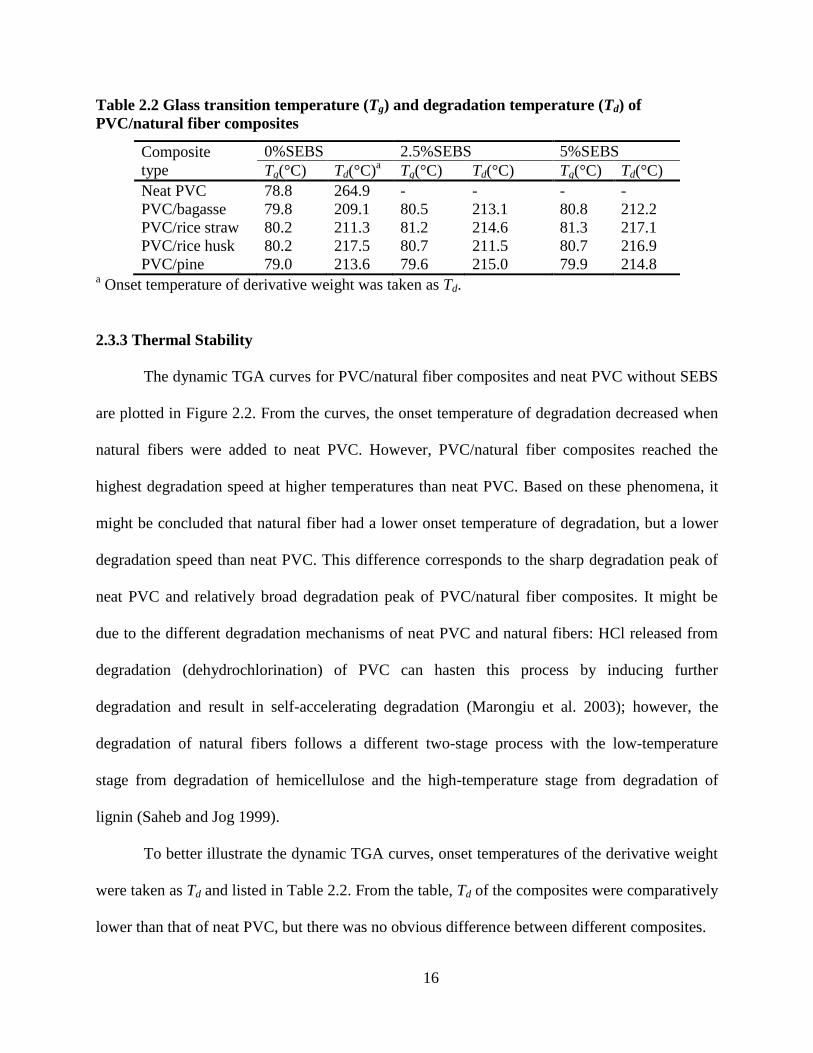
Table 2.2 Glass transition temperature (Tg) and degradation temperature (Td) of PVC/natural
fiber composites ............................................................................................................................ 16
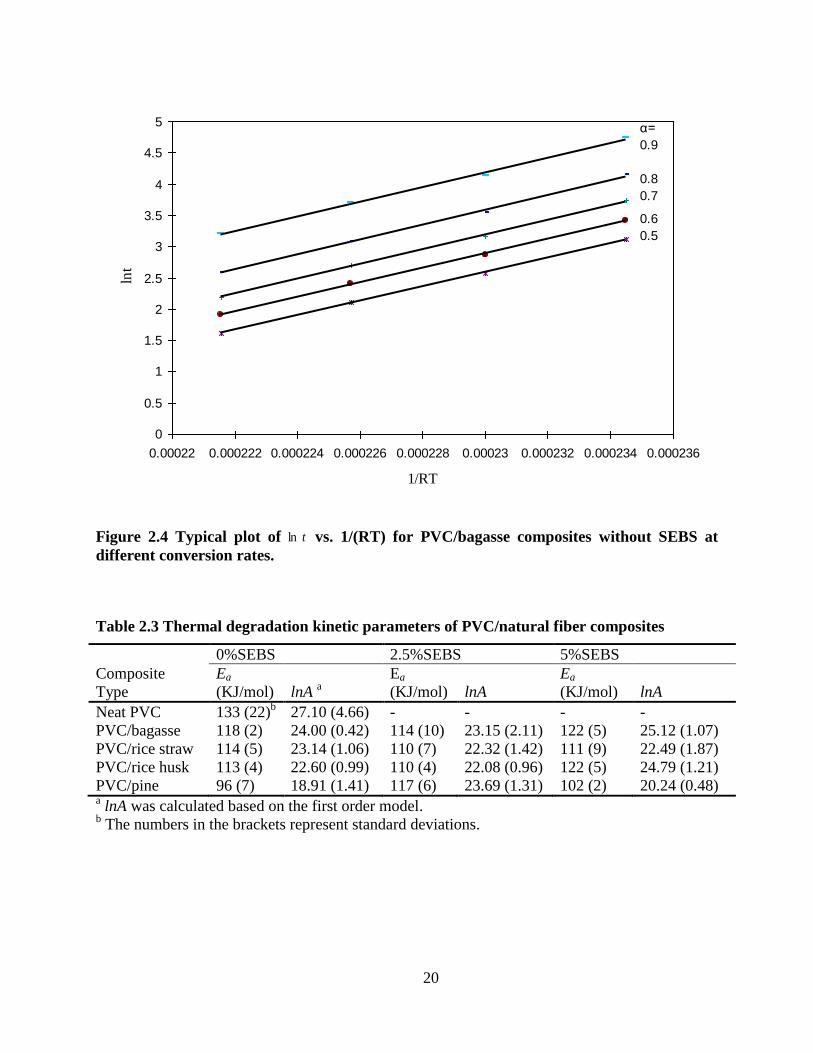
Table 2.3 Thermal degradation kinetic parameters of PVC/natural fiber composites .................. 20
Table 2.4 Water absorption rate (%) of PVC/natural fiber composites after being immersed in
water for 4 weeks .......................................................................................................................... 23
Table 2.5 Two-way ANOVA test on the influence of natural fiber type and SEBS level on WA
and TS after being immersed in water for four weeks .................................................................. 23
Table 3.1 Summary of parameters in Burgers model for thirty-minute creep of the composites . 41
Table 3.2 Summary of Ea calculated based on Arrhenius equation for the composites ............... 44
Table 3.3 Summary of model parameters for three-day creep of the composites ........................ 48
Table 3.4 Instantaneous creep deformation obtained from the 4-element, 6-element, and 8-
element Burgers models in comparison with real value ............................................................... 50
Table 4.1 Summary of parameters in Burgers model and recovery rate for one-day creep of the
composites with individual modifiers ........................................................................................... 63
Table 4.2 Summary of parameters in Burgers model for one-day creep of the composites with
combined modifiers ...................................................................................................................... 63
Table 4.3 Summary of parameters in Burgers model for one-day creep of the composites with
different BF loading levels............................................................................................................ 64
Table 4.4 Summary of the parameters for the new models in comparison with the 4-element
Burgers model for BF/HDPE/PE-g-MA composites .................................................................... 69
Table 5.1 Values of parameters for HDPE/PA6 composites obtained via fitting experimental data
with Burgers model ....................................................................................................................... 82
Table 5.2 Values of parameters for HDPE/PET composites obtained via fitting experimental data
with Burgers model ....................................................................................................................... 86
Table 6.1 Mechanical properties of samples with different UHMWPE and WF loading levels .. 99
vii
Table 6.2(a) Comparison of mechanical properties of samples with and without UV before
weathering ................................................................................................................................... 100
Table 6.2(b) Comparison of mechanical properties of samples with and without UV after
weathering ................................................................................................................................... 100
Table 6.3 Burgers parameters for samples with different UHMWPE and WF loading levels ... 105
Table 6.4(a) Burgers parameters for samples with different UHMWPE, WF and UV loading
levels before weathering ............................................................................................................. 105
Table 6.4(b) Burgers parameters for samples with different UHMWPE, WF and UV loading
levels after weathering ................................................................................................................ 105
viii
LIST OF FIGURES
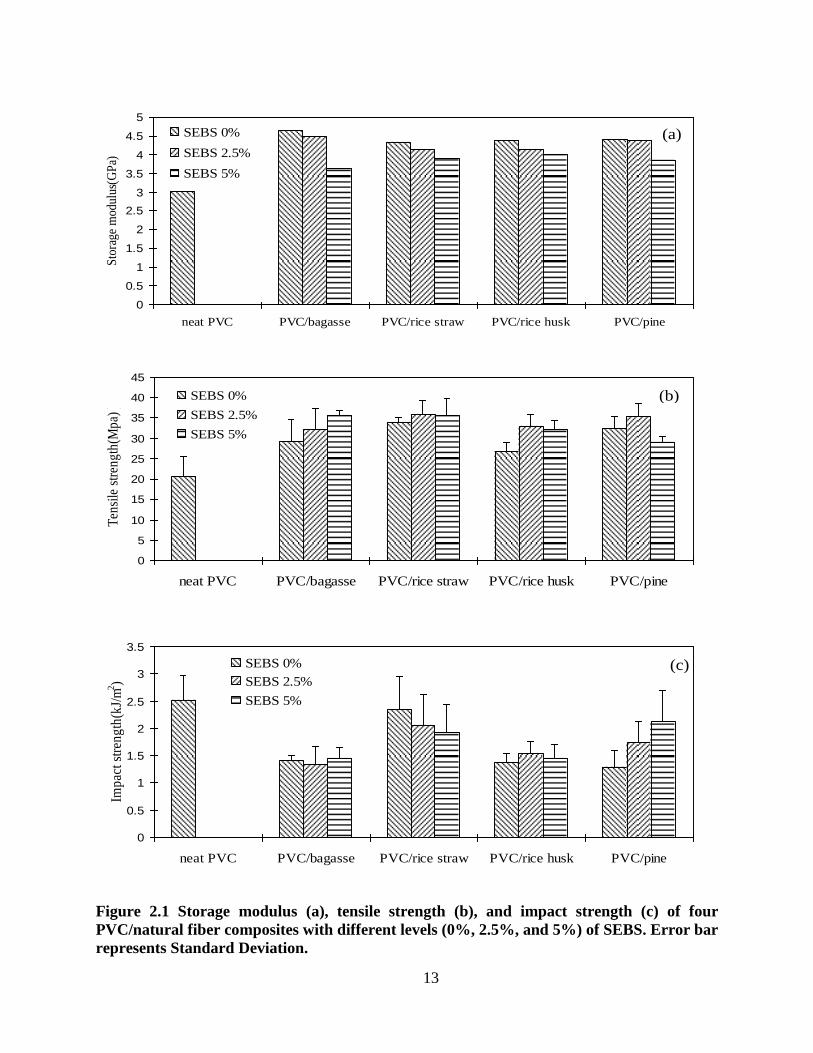
Figure 2.1 Storage modulus (a), tensile strength (b), and impact strength (c) of four PVC/natural
fiber composites with different levels (0%, 2.5%, and 5%) of SEBS. Error bar represents
Standard Deviation........................................................................................................................ 13
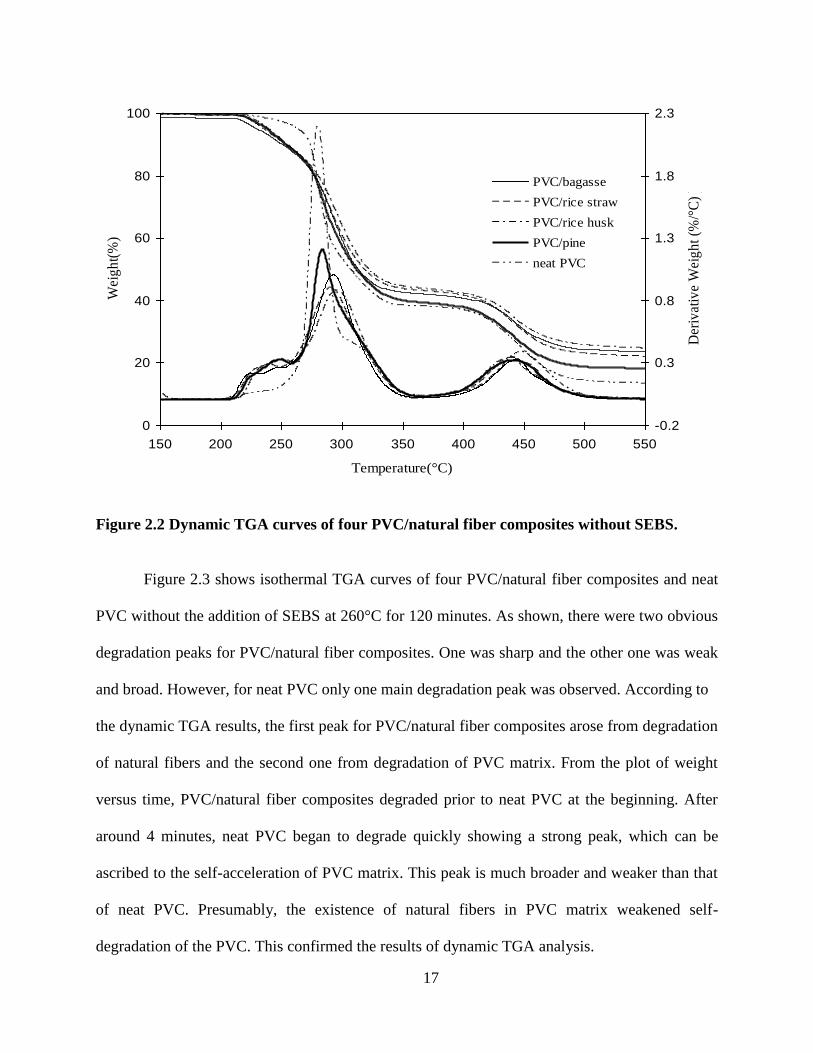
Figure 2.2 Dynamic TGA curves of four PVC/natural fiber composites without SEBS. ............ 17
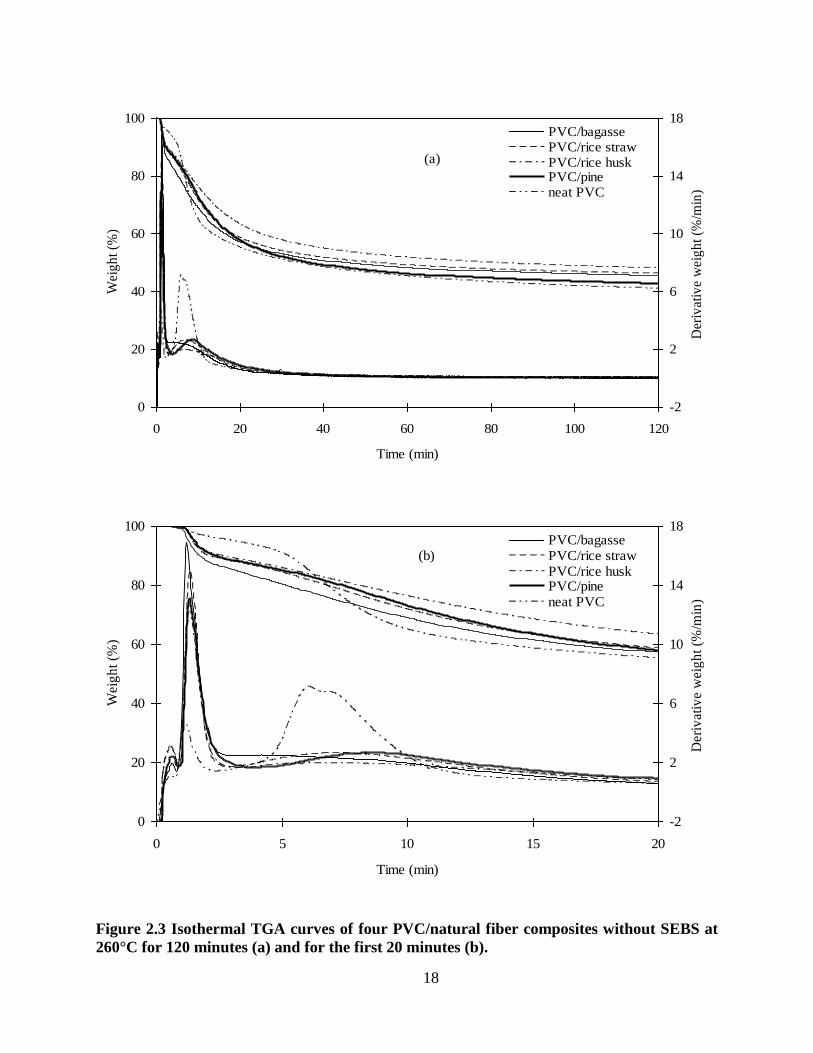
Figure 2.3 Isothermal TGA curves of four PVC/natural fiber composites without SEBS at 260°C
for 120 minutes (a) and for the first 20 minutes (b). ..................................................................... 18
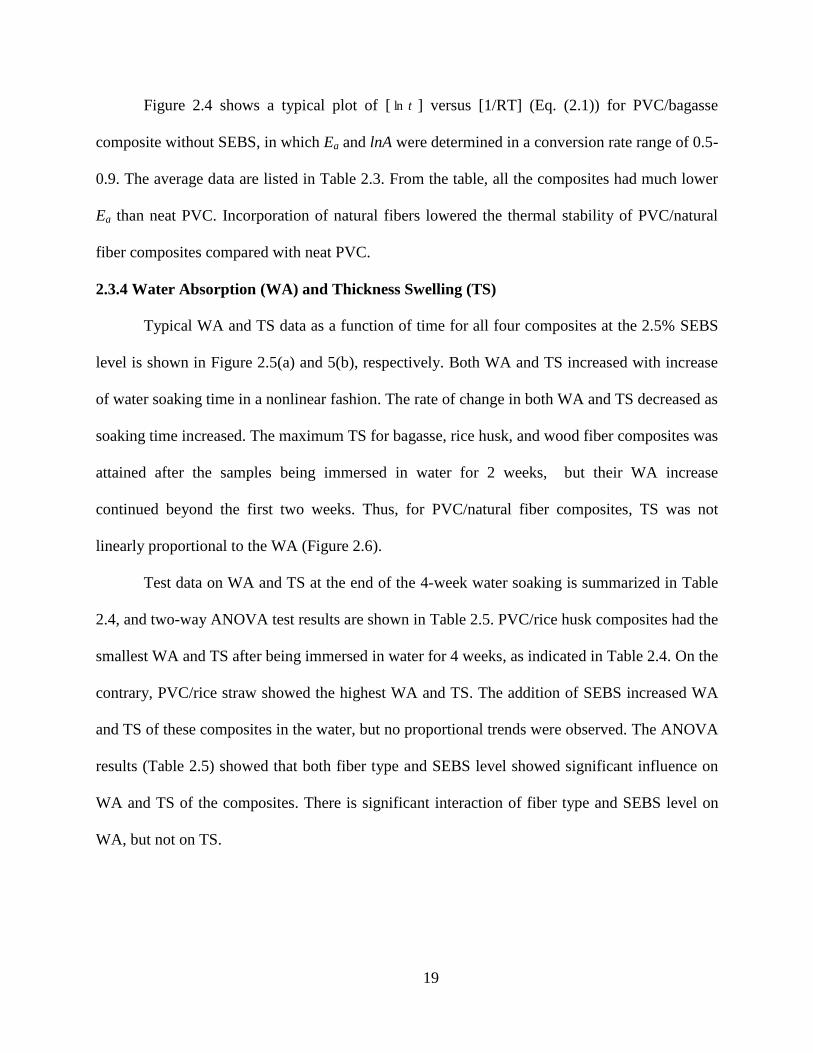
Figure 2.4 Typical plot of tln vs. 1/(RT) for PVC/bagasse composites without SEBS at different
conversion rates. ........................................................................................................................... 20
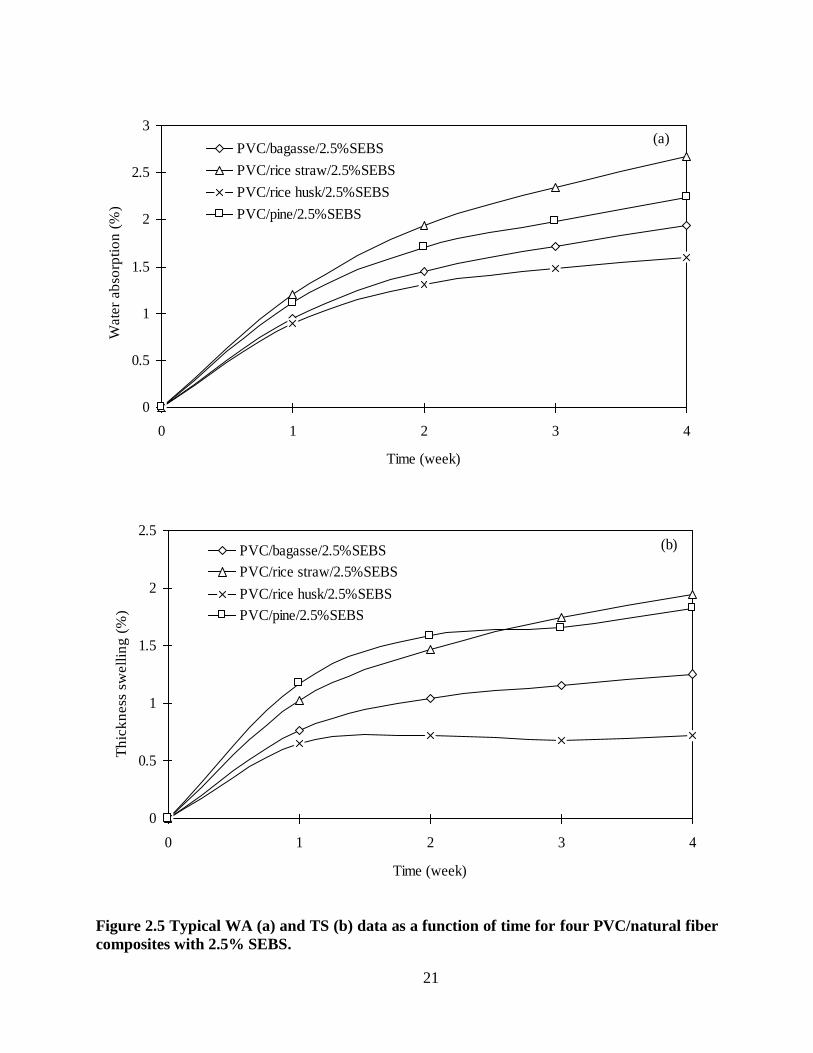
Figure 2.5 Typical WA (a) and TS (b) data as a function of time for four PVC/natural fiber
composites with 2.5% SEBS......................................................................................................... 21
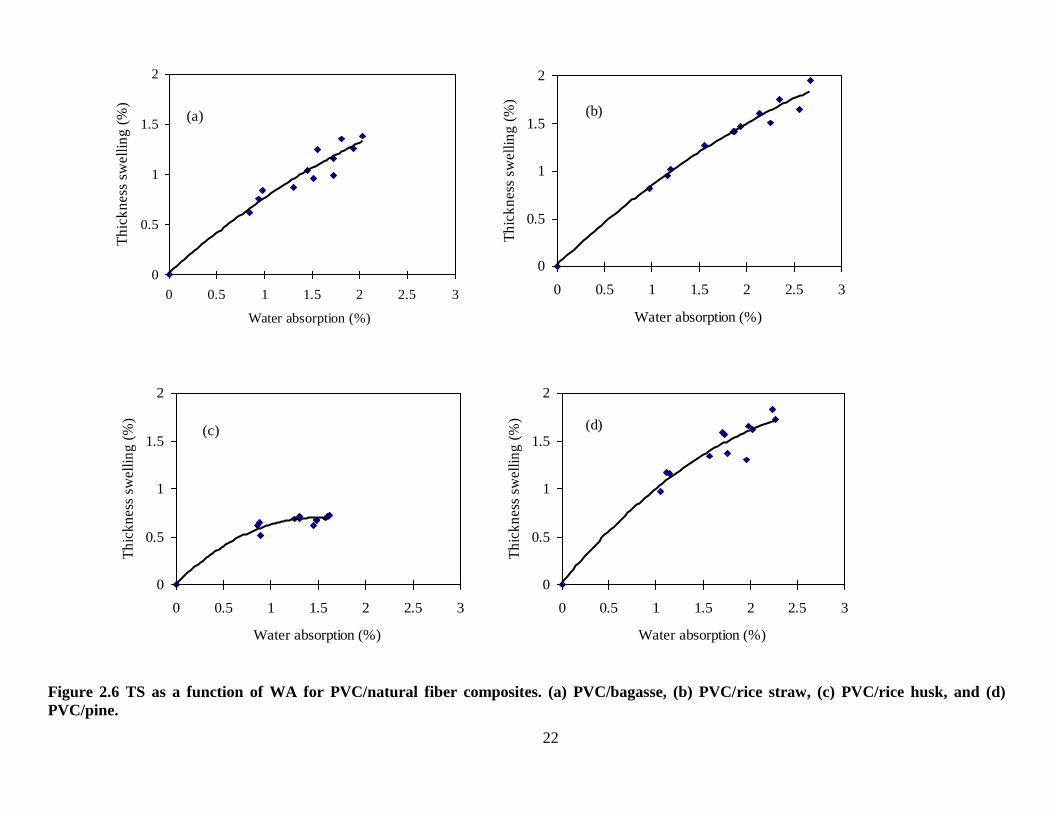
Figure 2.6 TS as a function of WA for PVC/natural fiber composites. (a) PVC/bagasse, (b)
PVC/rice straw, (c) PVC/rice husk, and (d) PVC/pine. ................................................................ 22
Figure 3.1 A diagram of generalized Burgers model .................................................................... 28
Figure 3.2 Stress-strain curves of the composites at (a) 35°C and (b) 65°C. ............................... 36
Figure 3.3 Creep curves of the composites at (a) 35°C and (b) 65°C. Symbols represent
experimental data and solid lines represent Burgers model simulation. ....................................... 37
Figure 3.4 Creep strain (a) and strain rate (b) of B/RPVC at different temperatures. Symbols
represent experimental data and solid lines represent the 4-element Burgers model simulation. 38
Figure 3.5 Creep strain (a) and strain rate (b) of B/RHDPE at different temperatures. Symbols
represent experimental data and solid lines represent the 4-element Burgers model simulation. 39
Figure 3.6 Log-scaled creep strain of (a) B/RPVC and (b) B/RHDPE. ....................................... 43
Figure 3.7 TTS master curves of creep for the composites. ......................................................... 44
Figure 3.8 Comparison of TTS predicted creep with experimental data for the composites.
Symbols represent experimental data; solid lines represent the 4-element Burgers model
simulation; dash lines represent TTS predicted data. Two lines with the same circle are for the
same composite. ............................................................................................................................ 45
Figure 3.9 Residual plot of 4, 6, and 8-element Burgers models for bagasse/RPVC composites: (a)
three days; (b) first 300 minutes. .................................................................................................. 49
ix
Figure 3.10 Comparison of 4, 6, and 8-element Burgers models when using two-day creep data
to predict the third day creep for bagasse/RPVC composites. ...................................................... 50
Figure 3.11 Creep (C), recovery (R), and non-recoverable deformation (NR) of B/VPVC (a),
B/VHDPE (b), and W/HDPE (c). ................................................................................................. 52
Figure 4.1 Creep and recovery curves of BF/HDPE composites with individual modifier: a) PE-
g-MA, b) sEPR-g-MA, and c) aEPR-g-MA. ................................................................................ 61
Figure 4.2 Creep and recovery curves of BF/HDPE composites with combined modifier at 5.7%
level: a) PE-g-MA/sEPR-g-MA and b) PE-g-MA/aEPR-g-MA. ................................................. 62
Figure 4.3 Creep and recovery curves of HDPE, BF/HDPE without modifier, BF/HDPE
composites at different BF loading levels with combined modifier of PE-g-MA/sEPR-g-MA at
15 wt% of the BF loading and PE-g-MA/sEPR-g-MA ratio of 2:1. ............................................. 64
Figure 4.4 Comparison of Burgers model, PIB and FIB models with fixed index, and power law
model used to predict one-day creep of BF/HDPE composite without modifier based on three-
hour creep data. ............................................................................................................................. 70
Figure 4.5 HDPE and BF/HDPE composite without modifier: a) TTS masters and b) Comparison
of the TTS predicted creep curves with the experimental curves. ................................................ 71
Figure 5.1 Creep and recovery behavior of different HDPE/PA6 composites. ............................ 81
Figure 5.2 SEM picture of HDPE/PA6 composite. ...................................................................... 81
Figure 5.3 Creep strain as a function of time during creep experiment at 35oC, together with the
fitted curves of Burgers model. ..................................................................................................... 82
Figure 5.4 The effect of temperature on the creep behavior of different composites in HDPE/PA6
system. The unit for temperature is °C. ........................................................................................ 83
Figure 5.5 TTS master curves in logarithmic scale (a) and normal scale (b) for HDPE/PA6
composites..................................................................................................................................... 84
Figure 5.6 Creep and recovery behavior of the HDPE/PET composites. ..................................... 87
Figure 5.7 SEM observation of HDPE/PET composite. ............................................................... 87
Figure 5.8 The effect of temperature on the creep behavior of different composites in HDPE/PET
system. The unit for temperature is °C. ........................................................................................ 88
Figure 5.9 TTS master curves in logarithmic scale (a) and normal scale (b) for HDPE/PET
composites..................................................................................................................................... 89
x
Figure 6.1 Creep and recovery curves of the composites with different HDPE/UHMWPE ratio:
(a) without WF, (b) with WF. ..................................................................................................... 102
Figure 6.2 Creep and recovery curves of the composites with and without UVA: (a) without WF,
(b) with WF. The HDPE/UHMWPE ratio is 80/20. ................................................................... 103
Figure 6.3 Creep and recovery curves of the composites before and after weathering (labeled
with *). The HDPE/UHMWPE ratio is 80/20. ........................................................................... 104
xi
NOMENCLATURE
ANOVA: analysis of variance
B: bagasse fiber
BF: bamboo Flour
DMA: dynamic mechanical analysis
Ea: Activation Energy
EPR-g-MA: ethylene propylene rubber-grafted- maleic anhydride
HDPE: high density polyethylene
MFC: microfibrillar composite
NF: natural fiber
NFPC: natural fiber/polymer composite
PA: polyamide
PE-g-MA: polyethylene-grafted-maleic anhydride
PET: polyethylene terephthalate
PP: polypropylene
PVC: poly (vinyl chloride)
SEBS: styrene-ethylene-butylene-styrene
Td: degradation temperature
Tg: glass transition temperature
TGA: thermogravimetric analysis
TS: thickness swelling
TTS: time-temperature superposition
UHMWPE: ultra-high molecular weight polyethylene
xii
UV: ultraviolet
UVA: UV absorber
WA: water absorption
WF: wood flour
WPC: wood/polymer composite
WSS: weighted sum of squares
αT: horizontal shift factor in TTS
ME : elastic modulus of the spring in Maxwell unit
M : viscosity of the dashpot in Maxwell unit
KE : elastic modulus of the spring in Kelvin unit
K : viscosity of the dashpot in Kelvin unit
xiii
ABSTRACT
Creep behavior of natural fiber/polymer composites (NFPCs) was studied in response to
the increasing application of this material as structural building products. Factors that influence
creep behavior of the composites were investigated by analyzing creep curves of several
different NFPC systems, which were designed for overall performance of the composites.
Among different models, the 4-element Burgers type was mostly used for quantitative
characterization of the creep curves to compare the properties of different composites. The
parameters from the 4-element Burgers model were easily interpretable due to their physical
meanings. Generalized Burgers models provided better fit by introducing extra Kelvin units, but
they are more complicated. Indexed Burgers models performed better for creep curves within the
primary stage in terms of both characterization and prediction.
Creep prediction was attempted through two approaches: modeling and accelerated
testing. Burgers models were proven unsuitable for long-term prediction if the creep test time
was not long enough. Comparatively, the indexed Burgers and 2-parameter power law models
performed better for prediction purposes. Accelerated creep tests were conducted at higher
temperatures, and smooth curves were obtained based on the time-temperature superposition
(TTS) principle. The accuracy of long-term prediction was unable to be evaluated due to the lack
of long-term experimental data.
Several factors were shown to affect the creep resistance of NFPCs. These include
polymer matrix type, natural fiber loading, additives, temperature, and weathering treatment.
PVC had higher creep resistance than HDPE, and HDPE showed better creep resistance than
ultra-high molecular weight polyethylene (UHMWPE). Introducing engineering plastics to form
microfibrils in HDPE matrix improved its creep performance. Certain recycled plastics had
xiv
smaller creep deformation than the corresponding virgin resin. Adding natural fibers into
polymer matrix greatly enhanced its creep resistance. The effect of a coupling agent on creep
property of NFPCs was dependent on its modulus and coupling effect. UVA, an ultrafine
titanium dioxide, slightly reduced the creep deformation of HDPE composites at a low loading
level. Higher temperatures led to not only larger instantaneous deformations, but also to higher
long-term creep rates. Weathering treatment also affected the creep properties of polymer and
NFPCs.
1
CHAPTER 1 INTRODUCTION
1.1 BACKGROUND
Natural fiber/polymer composites (NFPCs) are experiencing dramatic growth in
utilization because of low cost, low density, biodegradability, sound mechanical properties,
water and rot resistance, dimensional stability, and processing ability (Bledzki et al. 1998,
Clemons 2002). Moreover, NFPC can be made from recycled plastics and the waste part of
natural products, thus it can reduce the use of non-biodegradable plastics and make efficient use
of natural resources. The wood-like surface also makes this kind of material favorable for
construction, decking, railing, and automobile parts.
The polymers used in NFPCs are mainly thermoplastics, such as high and low density
polyethylene (HDPE and LDPE), polypropylene (PP), poly (vinyl chloride) (PVC), polystyrene
(PS), and polymethylmethacrylate (PMMA) (Jiang and Kamdem 2004a). The natural fibers used
to reinforce thermoplastics mainly include wood, cotton, flax, hemp, jute, sisal, and sugarcane
fibers (Wollerdorfer and Bader 1998, Bledzki and Gassan 1999, Mohanty et al. 2000).
The application of NFPC in construction raised the requirements of their mechanical
properties, especially their creep resistance under constant stress that commonly exists in
structural building products. Creep is deformation of material under constant stress, dependent
on time, stress, temperature, and material properties, etc. Creep deformation can exceed the creep
limit and cause product failure, especially in applications with long-term loading. Understanding,
evaluation and prediction of creep behavior of NFPC are thus of great importance for its
application (Park and Balatinecz 1998).
The creep process of polymeric material can be segregated into four stages: instantaneous
deformation, primary creep, secondary creep, and tertiary creep. When a load is applied, the
2
instantaneous deformation results from the elastic deformation of the material. The instantaneous
deformation is followed by the primary creep stage, during which the creep rate starts at a very
high value and decreases gradually to a relatively low value. In the secondary creep stage, the
viscous flow occurs, and the creep rate remains constant. Finally, the creep goes into the tertiary
stage with an increasing creep rate until creep rupture occurs (Yang et al. 2006a).
Since creep measurement requires a relatively long time, creep properties have not been
well studied for NFPCs. The limited research has been mainly focused on evaluating creep
property and enhancing creep resistance (Sain et al. 2000, Marcovich and Villar 2003, Nunez et
al. 2003, Bledzki and Faruk 2004, Acha et al. 2007). It was shown that increasing natural fiber
content within an appropriate range enhanced the creep resistance of the composite (Sain et al.
2000, Nunez et al. 2004, Acha et al. 2007). The use of maleated polypropylene (MAPP), a
coupling agent, reduced the creep deformation of natural fiber/PP composites by better
dispersing natural fibers in PP and improving interfacial adhesion (Bledzki and Faruk 2004,
Nunez et al. 2004, Acha et al. 2007). Sain et al. reported that maleated polypropylene
modification of wood fiber decreased the creep rate of wood fiber/PP composite, although there
was no obvious effect on the instantaneous deformation (Sain et al. 2000). However, Nunez et al.
found that esterifying wood fiber with maleic anhydride (MAN) increased the creep of PP/wood
composite (Nunez et al. 2003). Esterifying jute fiber with alkenyl succinic anhydride also
increased the creep deformation in a jute/PP composite. (Acha et al. 2007).
Modeling techniques have been applied to analyze and evaluate the creep behavior of
composites. Although recovery curves were presented in some research, no analysis has been
made for this relaxation stage (Acha et al. 2007). Among the different models for the creep
process, the 4-element Burgers model was widely adopted and the parameters of this model were
3
used to characterize the viscoelastic behavior of the materials (Marcovich and Villar 2003,
Nunez et al. 2004, Acha et al. 2007). Other models, such as Findley's power law type (Jiang et al.
2007) and a simpler two-parameter power law type (Tajvidi et al. 2005), also attempted to
simulate the creep curves of NFPCs. In these efforts, the 4-element Burgers model fitted the
curves but the parameters failed to predict long-term creep deformation. Findley’s model offered
a better prediction though the parameters of this model are not as interpretable as those from
Burgers model (Yang et al. 2006a). Time-temperature superposition (TTS) has been tried to
predict long-term creep deformation of NFPCs from the short-term experimental data at different
temperature levels (Acha et al. 2007). Though smooth master curves were obtained, various
NFPCs have been shown to be thermorheologically complex and their long-term creep
performance cannot be predicted by TTS through a single horizontal shift (Nunez et al. 2004,
Tajvidi et al. 2005). Thus, a systematic study of creep behavior for NFPCs is highly needed.
1.2 OBJECTIVES
The objectives of the research described in this work were:
1) To evaluate creep models for different applications, i.e., comparison, characterization,
and prediction;
2) To develop creep models suitable for comparison, characterization and prediction of
creep in NFPCs;
3) To predict long-term creep behavior of NFPCs through accelerated testing; and
4) To apply the developed techniques to investigate creep behaviors of various systems
aimed to improve the overall properties of NFPCs.
4
1.3 ORGANIZATION OF DISSERTATION
Chapter 1 provides an overall introduction of this research and the structure of this
dissertation.
Chapter 2 presents investigation on several PVC composites enhanced with different
natural fibers, including bagasse, rice straw, rice husk, and pine, in comparison with virgin PVC
in terms of mechanical and thermal properties.
Chapter 3 shows the study on composites of different polymers (recycled PVC, virgin
PVC, recycled PE, virgin PE) reinforced by bagasse fiber, with commercial wood/HDPE
composite as a control. Creep analysis methods were developed in this chapter and applied in the
later parts of this dissertation.
Chapter 4 discusses the effect of coupling agents and bamboo flour loading on creep
property of HDPE/bamboo composite system.
Chapter 5 presents creep behavior of HDPE composites enhanced with engineering
plastic microfibrils.
Chapter 6 shows the effect of ultra-high molecular weight polyethylene (UHMWPE) on
the properties of wood/HDPE composite by combining superior impact strength of UHMWPE
and satisfactory creep resistance from natural fibers. The effect of UVA on composite properties
and weathering was also discussed in this chapter.
Chapter 7 provides overall conclusions of this dissertation.
1.4 REFERENCES
Acha, B. A., M. M. Reboredo, and N. E. Marcovich. 2007. Creep and dynamic mechanical
behavior of PP-jute composites: Effect of the interfacial adhesion. Composites Part a-Applied
Science and Manufacturing 38:1507-1516.
5
Bledzki, A. K. and O. Faruk. 2004. Creep and impact properties of wood fibre-polypropylene
composites: influence of temperature and moisture content. Composites Science and Technology
64:693-700.
Bledzki, A. K. and J. Gassan. 1999. Composites reinforced with cellulose based fibres. Progress
in Polymer Science 24:221-274.
Bledzki, A. K., S. Reihmane, and J. Gassan. 1998. Thermoplastics reinforced with wood fillers:
A literature review. Polymer-Plastics Technology and Engineering 37:451-468.
Clemons, C. 2002. Wood-plastic composites in the United States - The interfacing of two
industries. Forest Products Journal 52:10-18.
Jiang, H. and D. P. Kamdem. 2004. Development of poly(vinyl chloride)/wood composites. A
literature review. Journal of Vinyl and Additive Technology 10:59-69.
Jiang, L., M. P. Wolcott, J. W. Zhang, and K. Englund. 2007. Flexural properties of surface
reinforced wood/plastic deck board. Polymer Engineering and Science 47:281-288.
Marcovich, N. E. and M. A. Villar. 2003. Thermal and mechanical characterization of linear low
density polyethylene/wood flour composites. Journal of Applied Polymer Science 90:2775-2784.
Mohanty, A. K., M. Misra, and G. Hinrichsen. 2000. Biofibres, biodegradable polymers and
biocomposites: An overview. Macromolecular Materials and Engineering 276:1-24.
Nunez, A. J., N. E. Marcovich, and M. I. Aranguren. 2004. Analysis of the creep behavior of
polypropylene-woodflour composites. Polymer Engineering and Science 44:1594-1603.
Nunez, A. J., P. C. Sturm, J. M. Kenny, M. I. Aranguren, N. E. Marcovich, and M. M. Reboredo.
2003. Mechanical characterization of polypropylene-wood flour composites. Journal of Applied
Polymer Science 88:1420-1428.
Park, B. D. and J. J. Balatinecz. 1998. Short term flexural creep behavior of wood-
fiber/polypropylene composites. Polymer Composites 19:377-382.
Sain, M. M., J. Balatinecz, and S. Law. 2000. Creep fatigue in engineered wood fiber and plastic
compositions. Journal of Applied Polymer Science 77:260-268.
Tajvidi, M., R. H. Falk, and J. C. Hermanson. 2005. Time-temperature superposition principle
applied to a kenaf-fiber/high-density polyethylene composite. Journal of Applied Polymer
Science 97:1995-2004.
Wollerdorfer, M. and H. Bader. 1998. Influence of natural fibres on the mechanical properties of
biodegradable polymers. Industrial Crops and Products 8:105-112.
Yang, J. L., Z. Zhang, A. K. Schlarb, and K. Friedrich. 2006. On the characterization of tensile
creep resistance of polyamide 66 nanocomposites. Part I. Experimental results and general
discussions. Polymer 47:2791-2801.
6
CHAPTER 2 NATURAL FIBER REINFORCED POLY(VINYL CHLORIDE)
COMPOSITES: EFFECT OF FIBER TYPE AND IMPACT MODIFIER1
2.1 INTRODUCTION
Poly(vinyl chloride) (PVC) is one of the most commonly used plastics in our society. Its
main applications include pipes, electric wires, window profiles, siding, etc. Recently, wood
fiber reinforced PVC is becoming more popular because of its acceptable mechanical properties,
moisture and fungus resistance, long lifetime, wood-like surface performance, and recyclability
(Clemons 2002). Some weakness of this material including low impact strength and thermal
stability imposes restriction on its application, which signals need for additional research on this
important product.
Incorporation of wood fiber in a plastic matrix can enhance the modulus of the resulting
composites, but decreases impact strength at the same time (Selke and Wichman 2004).
Considering the relative low impact resistance of the neat PVC matrix, it is of more practical
significance to improve the impact strength for PVC/natural fiber composites. Current research
in this field has been mainly focused on adding impact modifiers and using coupling agents to
improve composite properties. Coupling agents have been studied for PVC/natural fiber
composites to improve their overall properties (Maldas and Kokta 1989, Jiang and Kamdem
2004b). Maleated polypropylene was shown to be able to improve shear strength of PVC/wood
composites by 20% (Lu et al. 2002). Some organic acids were used to increase tensile modulus
for PVC/wood fiber composites, but there was no effect on tensile strength and impact strength
(Kokta et al. 1990). Coupling effectiveness of silane relied on both dispersion solvents and
interfacial reaction initiators (Bledzki et al. 1998). Few of these coupling agents significantly
1 Reprinted in part with permission from Journal of Polymers and the Environment.
Xu, Y.; Wu, Q.; Lei, Y.; Yao, F.; Zhang, Q., Natural Fiber Reinforced Poly(vinyl chloride) Composites: Effect of
Fiber Type and Impact Modifier. Journal of Polymers and the Environment 2008, 16, (4), 250-257.
7
improved the impact strength of PVC composites. Using a coupling agent to reduce the
hydrophilic property of wood fiber is not effective for enhancing the adhesion between PVC and
wood fiber (Shah et al. 2005). Some commonly used impact modifiers for PVC, such as
chlorinated polyethylene, ethylene vinyl acetate, methacrylate-butadiene-styrene, and all-acrylic
elastomer, were proved to be also effective in PVC/wood composites (Mengeloglu et al. 2000).
However, some other widespread impact modifiers for polymers and polymer blends, such as
styrene-ethylene-butylene-styrene (SEBS), have not been used in PVC/natural fiber composites.
SEBS proved to be able to improve the impact strength of the polymer blends (Schwarz et al.
1988, Hong and Jo 2000), but no work has been reported on its effect in PVC/natural fiber
composites.
Beside mechanical properties, water resistance and thermal stability are also important
for PVC/natural fiber composites. PVC resin shows relatively high water absorption compared
with polyolefin. With the existence of hydrophilic natural fibers, PVC/ natural fiber composites
tend to have higher water absorption rate than pure PVC, which further affects mechanical
properties and structural stability of the composites (Sombatsompop and Chaochanchaikul 2004).
As a weak point of both of PVC resin and natural fibers, their thermal stability and degradation
mechanisms have been investigated with kinetic analysis of thermogravimetric data (Jimenez et
al. 1993, Wu and Dollimore 1998). Combining the two components, thermal stability of
PVC/natural fibers composites was investigated, but no kinetic analysis has been reported (Ge et
al. 2004).
There are a large variety of natural fibers such as rice straw, rice husk, palm, bagasse,
hemp, flax, and other agricultural residues (Ayora et al. 1997, Sombatsompop et al. 2003, Jiang
and Kamdem 2004a). These cheap natural fibers are normally made from waste part of the
8
products. As different natural fibers have different chemical compositions, physical structures,
and mechanical properties, variation of properties can be expected from the composites of
different natural fibers (Bledzki and Gassan 1999). Little effort has been made so far to prepare
non-wood fiber (e.g., agricultural fibers) reinforced PVC composites and to improve their
properties. With increased wood costs and competition of wood resources from traditional wood
sectors, developing alternative, cheap, and environmentally friendly natural fiber sources for
plastic composite is highly needed.
In this study, three types of agricultural fibers (bagasse, rice straw, and rice husk) and one
wood fiber (pine) were used to prepare PVC composites through compression molding. SEBS
was used as an impact modifier. The objectives of this study were to investigate the influence of
fiber type and SEBS loading level on mechanical properties, thermal stability, and water
resistance of the composites.
2.2 EXPERIMENTAL
2.2.1 Raw Materials PVC SE-450 was obtained from Shintech, Inc. (Plaquemine, LA), with a bulk density of
612.7 kg/m3
and inherent viscosity of 0.515. SEBS G1650M was obtained from Kraton Polymers
LLC (Houston, TX), with a styrene/rubber ratio of 30/70 and specific gravity of 0.91. The
thermal stabilizer used was Mark 1900, from Chemtura Corporation (Middlebury, CT), with
specific gravity of 1.1768 and 19.5% Tin. Natural fibers included bagasse (sugarcane residue),
rice straw, rice husk, and wood fiber (pine).
Pine fiber was purchased from American Wood Fibers Co. (Schofield, WI), with a
nominal particle size of 20-mesh. Bagasse fiber was obtained from a local sugar mill in
Louisiana. Rice husk and rice-straw were obtained from Louisiana State University (LSU)
9
AgCenter's Crowley Rice Research Station in Crowley, LA. These raw materials were oven-
dried at 95°C for 24 hours to reduce moisture content to the level of about 2%. The oven-dry
material was ground with a Thomas-Wiley miller (Model 3383L10, Swedesboro, NJ) to pass
through a 20-mesh screen, and the fibers were stored in sealed plastic bags prior to compounding.
2.2.2 Composite Preparation
Experimental design included four natural fibers (bagasse, rice straw, rice husk, and pine),
one fiber/PVC loading rate (weight ratio=30/70), one thermal stabilizer/PVC loading rate (1.5%),
and three levels of SEBS (0%, 2.5%, and 5%). Pure PVC blend was used as control. This gave a
total of 13 blends.
The PVC/natural fiber composites were prepared as follows. Based on the formulations,
weighed amount of neat PVC, thermal stabilizer and SEBS were first mixed with each of the
four fibers in a K-mixer at 4800 rpm from room temperature to 196-202°C. The blended material
from K-mixing for each formulation was then cooled and granulated. Prior to sample
manufacturing, each blend was re-mixed with a Haake rheometer (Rheomix 600) at 60 rpm and
180°C for 10 minutes to provide more uniform fiber distribution.
The blends were then used to make test sample plates through compression molding
(Wabash V200) at 190°C with a pressure of 30 tons. The nominal thickness was 1 mm for tensile
strength and dynamic mechanical analysis (DMA) samples; while the nominal thickness was 4
mm for impact strength, water absorption (WA), and thickness swelling (TS) test samples.
2.2.3 Measurements
Mechanical Properties. Dynamic mechanical analysis (DMA) was carried out for all
composites and neat PVC with a TA Q800 DMA system (New Castle, DE). Specimens with a
nominal size of 60×12×1 mm were cut from the compression molded plates and two DMA

10
procedures were employed. One was with a dual cantilever mode at a frequency of 1Hz at room
temperature, from which the storage modulus of each specimen was measured. The second DMA
was also with a dual cantilever mode at a frequency of 1 Hz, but with temperature ramped from
40 to 105°C. From the second DMA, the relationship between modulus (storage modulus E' and
loss modulus E'') and temperature for each specimen was determined. The peak temperature of
loss modulus was taken as glass transition temperature (Tg) of these composites in this study.
The tensile strength was measured according to ASTM D 638-03, using a Model 1125
INSTRON machine (Boston, MA). Specimens with a nominal size of 60×12×1 mm were cut
from the compression molded plates. For each treatment level, six replications were used.
Izod impact tests were done on a TINIUS OLSEN 892T impact tester (Testing Machine
Company, Horsham, PA). Specimens with a nominal size of 60×12×4 mm were cut from the
compression molded plates and were then notched on the center of one longitudinal side
according to the ASTM D256. For each treatment level, six samples were tested.
Thermal Stability. Thermogravimetric analysis (TGA) was employed to observe the
thermal stability characteristics of composites with a TA Q50 Thermogravimetric Analyzer
(New Castle, DE) under a nitrogen atmosphere. Two TGA methods were used for each treatment
level: dynamic TGA at a scan rate of 10°C/min from room temperature to 650°C and isothermal
TGA at different constant temperatures over a period of 120 to 300 minutes. Dynamic TGA
mode was employed first to determine degradation temperature (Td) of the composites based on
the plot of sample weight versus temperature. Isothermal TGA mode was carried out at 4
different temperatures (240, 250, 260, and 270°C) for the composites and 5 different
temperatures (260, 265, 270, 275, and 280°C) for the neat PVC. These temperatures were
11
slightly higher than their corresponding Td and were kept constant during the experiment. For
each run, 6-10 mg specimen was tested.
In dynamic TGA, weight change during temperature increase was recorded, and the
values of Td for each treatment level were determined. In isothermal TGA, the time for a certain
percent of weight change was recorded. The data was modeled with a first order thermal kinetic
model to determine the kinetic parameters (i.e., activation energy, Ea and pre-exponential factor,
A) (Dollimore 1992, Vrandecic et al. 2005):
]/)(ln[/ln AgRTEta
(2.1)
where, t, Ea and T denote time, activation energy and temperature; is degree of
conversion; R is the gas constant. The first order model for thermal degradation, g( ), has the
following form:
)1ln()( g (2.2)
with conversion rate expressed as:
)(
)(
10
0
xx
xx
(2.3)
where, x0, x, and x1 denote initial, actual and final weight of specimen respectively. Based
on Eq. (2.1), the dependence of tln versus 1/RT was plotted, from which Ea at a given
conversion rate was determined from the slope.
Water absorption and thickness swelling. Water absorption (WA) and thickness swelling
(TS) rates of the composite were tested by measuring the weight and thickness increase of
specimens after being immersed in water for 1, 2, 3, and 4 weeks, respectively. Specimens with a
nominal size of 60×12×4 mm were cut from the compression molded plates. The thickness and
weight of these specimens were measured after initial drying to reach a constant weight at 80°C.
12
They were then immersed in water for 4 weeks. The specimens were removed from water at the
end of each week and conditioned for one hour. The thickness and weight of the conditioned
specimens were measured. WA and TS were calculated as:
%100(%)
o
o
WT
WTWTWA
(2.4)
%100(%)
o
o
TK
TKTKTS
(2.5)
where WT (g) and TK (mm) are the weight and thickness at a given time, and WT0 (g) and
TK0 (mm) are the initial weight and thickness, respectively.
Data Analysis. Measured data on mechanical, thermal, and physical properties of
composites were analyzed with a two-way analysis of variance (ANOVA) test in Statistical
Analysis System (SAS) to determine treatment effect at the 5% significance level.
2.3 RESULTS AND DISCUSSION
2.3.1 Mechanical Properties
Storage moduli of the four types of PVC/natural fiber composites are shown in Figure
2.1(a). As shown, the addition of natural fibers increased storage modulus of PVC by up to 50%
level. It is plausible that the stiff natural fibers contributed to overall stiffness of the composites.
Among the composites, PVC/bagasse composite presented the highest storage modulus at 0%
and 2.5% SEBS level. On the other hand, with the addition of SEBS, storage moduli of all four
composites decreased, especially for PVC/bagasse composite, whose storage moduli decreased
by more than 20% at the SEBS concentration of 5%. The existence of low-modulus SEBS might
increase the flexibility of the composites under stress and reduce their moduli.
Tensile strengths of PVC/natural fiber composites are shown in Figure 2.1(b), and two-
way ANOVA test results are shown in Table 2.1. As shown in Figure 2.1(b), the addition of four
13
Figure 2.1 Storage modulus (a), tensile strength (b), and impact strength (c) of four
PVC/natural fiber composites with different levels (0%, 2.5%, and 5%) of SEBS. Error bar
represents Standard Deviation.
0
0.5
1
1.5
2
2.5
3
3.5
4
4.5
5
neat PVC PVC/bagasse PVC/rice straw PVC/rice husk PVC/pine
Sto
rage
mod
ulus
(GP
a)
SEBS 0%
SEBS 2.5%
SEBS 5%
(a)
0
5
10
15
20
25
30
35
40
45
neat PVC PVC/bagasse PVC/rice straw PVC/rice husk PVC/pine
Ten
sile
str
eng
th(M
pa)
)
SEBS 0%
SEBS 2.5%
SEBS 5%
(b)
0
0.5
1
1.5
2
2.5
3
3.5
neat PVC PVC/bagasse PVC/rice straw PVC/rice husk PVC/pine
Imp
act
stre
ng
th(k
J/m
2 )
SEBS 0%
SEBS 2.5%
SEBS 5%
(c)
14
kinds of natural fibers increased the tensile strength of PVC by 30%-60%. During the tensile
deformation of composites, the applied stress was partially transferred to strong natural fibers,
especially those in the direction of elongation. Among the four composites, PVC/rice straw
composites showed the highest tensile strength. The increase in the content of SEBS led to
enhancement in tensile strength of most composites. For PVC/pine composites, tensile strength
of the composites decreased as SEBS content increased from 2.5% to 5%. This difference
suggests that for different PVC/natural fiber composites, the optimum SEBS contents are
different. Higher content of SEBS may impair the tensile strength of the PVC matrix, so as to
decrease the tensile strength of the composites. As indicated in Table 2.1, both fiber type and
SEBS level had influence on the tensile strength of the composites.
Impact strengths of the four types of PVC/natural fiber composites are shown in Figure
2.1(c); and two-way ANOVA test results are shown in Table 2.1. Based on Table 2.1, natural
fiber type showed significant influence on impact strength of the composites. As shown in Figure
2.1(c), the addition of all four types of natural fibers decreased the impact strength of the PVC
matrix. This negative effect may be ascribed to the reduction of polymer matrix content and poor
compatibility between the fiber and polymer matrix. Comparatively, rice straw offered superior
impact property to the other three kinds of natural fibers. SEBS had no obvious effect on impact
strength of PVC/bagasse composites and PVC/rice husk composites, as shown in Figure 2.1. For
PVC/pine composites, impact strength increased as SEBS content increased from 0% up to 5%.
However, for PVC/rice straw composites, addition of SEBS led to a slight decrease of impact
strength. The different trends reflect the different interactions among the components of the four
composites. A possible reason is the chemical composition of the natural fibers. Among the
natural fibers, pine fiber has the highest content (26-34%) of lignin (Bledzki et al. 2002), which
15
is more hydrophobic than the other components (cellulose and hemicellulose) of natural fibers,
so that SEBS is more compatible with pine fiber than with the other natural fibers. Contrastively,
rice straw has the lowest lignin content (8-19%) (Jackson 1977). In general, SEBS with the
content up to 5% showed little effect as an impact modifier for PVC/natural fiber composites.
Table 2.1 Two-way ANOVA test on the influence of fiber type and SEBS level on tensile
and impact strength of the composites
Variable Tensile strength Impact strength
Fiber type 0.0016 <0.0001
SEBS level 0.0017 0.4971
Fiber type × SEBS level 0.0062 0.0223
The values shown in this table are p-values of the two-way ANOVA tests. A p-value smaller
than 0.05 indicates significant influence of the corresponding treatment on the corresponding
property at the 5% significance level.
2.3.2 Glass Transition Temperature
The influence of different natural fibers and different levels of SEBS on Tg of the
PVC/natural fiber composites is presented in Table 2.2. The addition of natural fibers shifted Tg
of PVC for up to 1.5°C. This trend may be attributed to the fact that the presence of stiff natural
fibers in PVC matrix made segments of PVC molecular chains more difficult to move and thus
glass transition occurred at higher temperatures. Pine fiber showed less effect, and the reason
may be related to the interface between PVC matrix and pine fiber, which will be investigated in
the follow-up research on coupling agents.
As shown in Table 2.2, the addition of SEBS slightly increased Tg of all the four kinds of
PVC/natural fiber composites. This may give evidence that SEBS had slight effect on the
interface of PVC matrix and natural fibers, which corresponds to the aforementioned effect on
tensile strength. However, these increments may not be significant considering the experimental
errors resulting from the sample preparation and experimental tests.
16
Table 2.2 Glass transition temperature (Tg) and degradation temperature (Td) of
PVC/natural fiber composites
Composite
type
0%SEBS 2.5%SEBS 5%SEBS
Tg(°C) Td(°C)a Tg(°C) Td(°C) Tg(°C) Td(°C)
Neat PVC 78.8 264.9 - - - -
PVC/bagasse 79.8 209.1 80.5 213.1 80.8 212.2
PVC/rice straw 80.2 211.3 81.2 214.6 81.3 217.1
PVC/rice husk 80.2 217.5 80.7 211.5 80.7 216.9
PVC/pine 79.0 213.6 79.6 215.0 79.9 214.8 a Onset temperature of derivative weight was taken as Td.
2.3.3 Thermal Stability
The dynamic TGA curves for PVC/natural fiber composites and neat PVC without SEBS
are plotted in Figure 2.2. From the curves, the onset temperature of degradation decreased when
natural fibers were added to neat PVC. However, PVC/natural fiber composites reached the
highest degradation speed at higher temperatures than neat PVC. Based on these phenomena, it
might be concluded that natural fiber had a lower onset temperature of degradation, but a lower
degradation speed than neat PVC. This difference corresponds to the sharp degradation peak of
neat PVC and relatively broad degradation peak of PVC/natural fiber composites. It might be
due to the different degradation mechanisms of neat PVC and natural fibers: HCl released from
degradation (dehydrochlorination) of PVC can hasten this process by inducing further
degradation and result in self-accelerating degradation (Marongiu et al. 2003); however, the
degradation of natural fibers follows a different two-stage process with the low-temperature
stage from degradation of hemicellulose and the high-temperature stage from degradation of
lignin (Saheb and Jog 1999).
To better illustrate the dynamic TGA curves, onset temperatures of the derivative weight
were taken as Td and listed in Table 2.2. From the table, Td of the composites were comparatively
lower than that of neat PVC, but there was no obvious difference between different composites.
17
Figure 2.2 Dynamic TGA curves of four PVC/natural fiber composites without SEBS.
Figure 2.3 shows isothermal TGA curves of four PVC/natural fiber composites and neat
PVC without the addition of SEBS at 260°C for 120 minutes. As shown, there were two obvious
degradation peaks for PVC/natural fiber composites. One was sharp and the other one was weak
and broad. However, for neat PVC only one main degradation peak was observed. According to
the dynamic TGA results, the first peak for PVC/natural fiber composites arose from degradation
of natural fibers and the second one from degradation of PVC matrix. From the plot of weight
versus time, PVC/natural fiber composites degraded prior to neat PVC at the beginning. After
around 4 minutes, neat PVC began to degrade quickly showing a strong peak, which can be
ascribed to the self-acceleration of PVC matrix. This peak is much broader and weaker than that
of neat PVC. Presumably, the existence of natural fibers in PVC matrix weakened self-
degradation of the PVC. This confirmed the results of dynamic TGA analysis.
0
20
40
60
80
100
150 200 250 300 350 400 450 500 550
Temperature(°C)
Wei
gh
t(%
)
-0.2
0.3
0.8
1.3
1.8
2.3
Der
ivat
ive
Wei
gh
t (%
/°C
) )
PVC/bagasse
PVC/rice straw
PVC/rice husk
PVC/pine
neat PVC
18
Figure 2.3 Isothermal TGA curves of four PVC/natural fiber composites without SEBS at
260°C for 120 minutes (a) and for the first 20 minutes (b).
0
20
40
60
80
100
0 20 40 60 80 100 120
Time (min)
Wei
gh
t (%
)
-2
2
6
10
14
18
Der
ivat
ive
wei
gh
t (%
/min
) )
PVC/bagassePVC/rice strawPVC/rice huskPVC/pineneat PVC
(a)
0
20
40
60
80
100
0 5 10 15 20
Time (min)
Wei
gh
t (%
)
-2
2
6
10
14
18
Der
ivat
ive
wei
gh
t (%
/min
) )
PVC/bagassePVC/rice strawPVC/rice huskPVC/pineneat PVC
(b)
19
Figure 2.4 shows a typical plot of [ tln ] versus [1/RT] (Eq. (2.1)) for PVC/bagasse
composite without SEBS, in which Ea and lnA were determined in a conversion rate range of 0.5-
0.9. The average data are listed in Table 2.3. From the table, all the composites had much lower
Ea than neat PVC. Incorporation of natural fibers lowered the thermal stability of PVC/natural
fiber composites compared with neat PVC.
2.3.4 Water Absorption (WA) and Thickness Swelling (TS)
Typical WA and TS data as a function of time for all four composites at the 2.5% SEBS
level is shown in Figure 2.5(a) and 5(b), respectively. Both WA and TS increased with increase
of water soaking time in a nonlinear fashion. The rate of change in both WA and TS decreased as
soaking time increased. The maximum TS for bagasse, rice husk, and wood fiber composites was
attained after the samples being immersed in water for 2 weeks, but their WA increase
continued beyond the first two weeks. Thus, for PVC/natural fiber composites, TS was not
linearly proportional to the WA (Figure 2.6).
Test data on WA and TS at the end of the 4-week water soaking is summarized in Table
2.4, and two-way ANOVA test results are shown in Table 2.5. PVC/rice husk composites had the
smallest WA and TS after being immersed in water for 4 weeks, as indicated in Table 2.4. On the
contrary, PVC/rice straw showed the highest WA and TS. The addition of SEBS increased WA
and TS of these composites in the water, but no proportional trends were observed. The ANOVA
results (Table 2.5) showed that both fiber type and SEBS level showed significant influence on
WA and TS of the composites. There is significant interaction of fiber type and SEBS level on
WA, but not on TS.
20
Figure 2.4 Typical plot of tln vs. 1/(RT) for PVC/bagasse composites without SEBS at
different conversion rates.
Table 2.3 Thermal degradation kinetic parameters of PVC/natural fiber composites
Composite
Type
0%SEBS 2.5%SEBS 5%SEBS
Ea
(KJ/mol) lnA a
Ea
(KJ/mol) lnA
Ea
(KJ/mol) lnA
Neat PVC 133 (22)b 27.10 (4.66) - - - -
PVC/bagasse 118 (2) 24.00 (0.42) 114 (10) 23.15 (2.11) 122 (5) 25.12 (1.07)
PVC/rice straw 114 (5) 23.14 (1.06) 110 (7) 22.32 (1.42) 111 (9) 22.49 (1.87)
PVC/rice husk 113 (4) 22.60 (0.99) 110 (4) 22.08 (0.96) 122 (5) 24.79 (1.21)
PVC/pine 96 (7) 18.91 (1.41) 117 (6) 23.69 (1.31) 102 (2) 20.24 (0.48) a lnA was calculated based on the first order model.
b The numbers in the brackets represent standard deviations.
0
0.5
1
1.5
2
2.5
3
3.5
4
4.5
5
0.00022 0.000222 0.000224 0.000226 0.000228 0.00023 0.000232 0.000234 0.000236
1/RT
lnt
α=
0.9
0.8
0.7
0.6
0.5
21
Figure 2.5 Typical WA (a) and TS (b) data as a function of time for four PVC/natural fiber
composites with 2.5% SEBS.
0
0.5
1
1.5
2
2.5
3
0 1 2 3 4
Time (week)
Wate
r ab
sorp
tio
n (
%)
.
PVC/bagasse/2.5%SEBS
PVC/rice straw/2.5%SEBS
PVC/rice husk/2.5%SEBS
PVC/pine/2.5%SEBS
(a)
0
0.5
1
1.5
2
2.5
0 1 2 3 4
Time (week)
Th
ick
ness
sw
ell
ing
(%
)
.
PVC/bagasse/2.5%SEBS
PVC/rice straw/2.5%SEBS
PVC/rice husk/2.5%SEBS
PVC/pine/2.5%SEBS
(b)
22
Figure 2.6 TS as a function of WA for PVC/natural fiber composites. (a) PVC/bagasse, (b) PVC/rice straw, (c) PVC/rice husk, and (d)
PVC/pine.
0
0.5
1
1.5
2
0 0.5 1 1.5 2 2.5 3
Water absorption (%)
Th
ick
ness
sw
ell
ing
(%
) )
(a)
0
0.5
1
1.5
2
0 0.5 1 1.5 2 2.5 3
Water absorption (%)
Th
ick
ness
sw
ell
ing
(%
) )
(b)
0
0.5
1
1.5
2
0 0.5 1 1.5 2 2.5 3
Water absorption (%)
Th
ick
nes
s sw
elli
ng
(%
) )
(c)
0
0.5
1
1.5
2
0 0.5 1 1.5 2 2.5 3
Water absorption (%)
Th
ick
nes
s sw
elli
ng
(%
) )
(d)
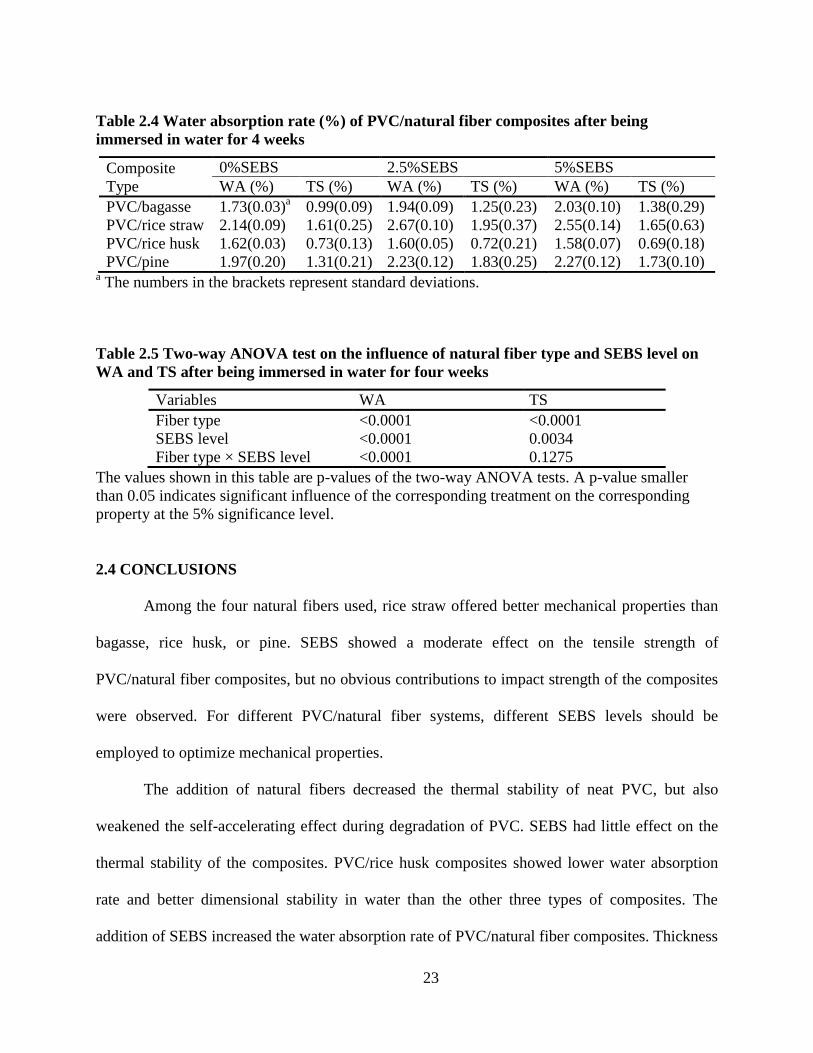
23
Table 2.4 Water absorption rate (%) of PVC/natural fiber composites after being
immersed in water for 4 weeks
Composite
Type
0%SEBS 2.5%SEBS 5%SEBS
WA (%) TS (%) WA (%) TS (%) WA (%) TS (%)
PVC/bagasse 1.73(0.03)a 0.99(0.09) 1.94(0.09) 1.25(0.23) 2.03(0.10) 1.38(0.29)
PVC/rice straw 2.14(0.09) 1.61(0.25) 2.67(0.10) 1.95(0.37) 2.55(0.14) 1.65(0.63)
PVC/rice husk 1.62(0.03) 0.73(0.13) 1.60(0.05) 0.72(0.21) 1.58(0.07) 0.69(0.18)
PVC/pine 1.97(0.20) 1.31(0.21) 2.23(0.12) 1.83(0.25) 2.27(0.12) 1.73(0.10) a The numbers in the brackets represent standard deviations.
Table 2.5 Two-way ANOVA test on the influence of natural fiber type and SEBS level on
WA and TS after being immersed in water for four weeks
Variables WA TS
Fiber type <0.0001 <0.0001
SEBS level <0.0001 0.0034
Fiber type × SEBS level <0.0001 0.1275
The values shown in this table are p-values of the two-way ANOVA tests. A p-value smaller
than 0.05 indicates significant influence of the corresponding treatment on the corresponding
property at the 5% significance level.
2.4 CONCLUSIONS
Among the four natural fibers used, rice straw offered better mechanical properties than
bagasse, rice husk, or pine. SEBS showed a moderate effect on the tensile strength of
PVC/natural fiber composites, but no obvious contributions to impact strength of the composites
were observed. For different PVC/natural fiber systems, different SEBS levels should be
employed to optimize mechanical properties.
The addition of natural fibers decreased the thermal stability of neat PVC, but also
weakened the self-accelerating effect during degradation of PVC. SEBS had little effect on the
thermal stability of the composites. PVC/rice husk composites showed lower water absorption
rate and better dimensional stability in water than the other three types of composites. The
addition of SEBS increased the water absorption rate of PVC/natural fiber composites. Thickness
24
swelling varied nonlinearly with water absorption rate. The results of the study demonstrate that
PVC composites filled with agricultural fibers (i.e., bagasse, rice straw, and rice husk) had
properties comparable with those of PVC/wood composite. Future work will deal with effective
coupling agents for PVC (virgin and recycled) and natural fibers.
2.5 REFERENCES
Ayora, M., R. Rios, Jafet Quijano, and Alfredo Marquez. 1997. Evaluation by torque-rheometer
of suspensions of semi-rigid and flexible natural fibers in a matrix of poly(vinyl chloride).
Polymer Composites 18:549-560.
Bledzki, A. K. and J. Gassan. 1999. Composites reinforced with cellulose based fibres. Progress
in Polymer Science 24:221-274.
Bledzki, A. K., S. Reihmane, and J. Gassan. 1998. Thermoplastics reinforced with wood fillers:
A literature review. Polymer-Plastics Technology and Engineering 37:451-468.
Bledzki, A. K., V. E. Sperber, and O. Faruk. 2002. Natural and Wood Fibre Reinforcement in
Polymers. Rapra Review Reports 13:10.
Clemons, C. 2002. Wood-plastic composites in the United States - The interfacing of two
industries. Forest Products Journal 52:10-18.
Dollimore, D. 1992. The application of thermal analysis in studying the thermal decomposition
of solids. Thermochimica Acta 203:7-23.
Ge, X. C., X. H. Li, and Y. Z. Meng. 2004. Tensile properties, morphology, and thermal
behavior of PVC composites containing pine flour and bamboo flour. Journal of Applied
Polymer Science 93:1804-1811.
Hong, B. K. and W. H. Jo. 2000. Effects of molecular weight of SEBS triblock copolymer on the
morphology, impact strength, and rheological property of syndiotactic polystyrene/ethylene-
propylene rubber blends. Polymer 41:2069-2079.
Jackson, M. G. 1977. Review article: The alkali treatment of straws. Animal Feed Science and
Technology 2:105-130.
Jiang, H. and D. P. Kamdem. 2004a. Development of poly(vinyl chloride)/wood composites. A
literature review. Journal of Vinyl and Additive Technology 10:59-69.
Jiang, H. and D. P. Kamdem. 2004b. Effects of copper amine treatment on mechanical properties
of PVC/wood-flour composites. Journal of Vinyl and Additive Technology 10:70-78.
25
Jimenez, A., V. Berenguer, J. Lopez, and A. Sanchez. 1993. Thermal degradation study of
poly(vinyl chloride): Kinetic analysis of thermogravimetric data. Journal of Applied Polymer
Science 50:1565-1573.
Kokta, B. V., D. Maldas, C. Daneault, and P. Beland. 1990. Composites of poly(vinyl chloride)
and wood fibers. Part II: Effect of chemical treatment. Polymer Composites 11:84-89.
Lu, J., Q. Wu, and I. Negulescu. 2002. The Influence of Maleation on Polymer Adsorption and
Fixation, Wood Surface Wettability, and Interfacial Bonding Strength in Wood-PVC
Composites1. Wood and Fiber Science 34:434-459.
Maldas, D. and B. V. Kokta. 1989. Improving adhesion of wood fiber with polystyrene by the
chemical treatment of fiber with a coupling agent and the influence on the mechanical properties
of composites. Journal of Adhesion Science and Technology 3:529-539.
Marongiu, A., T. Faravelli, G. Bozzano, M. Dente, and E. Ranzi. 2003. Thermal degradation of
poly(vinyl chloride). Journal of Analytical and Applied Pyrolysis 70:519-553.
Mengeloglu, F., L. M. Matuana, and J. A. King. 2000. Effects of impact modifiers on the
properties of rigid PVC/wood-fiber composites. Journal of Vinyl and Additive Technology
6:153-157.
Saheb, D. N. and J. P. Jog. 1999. Natural fiber polymer composites: A review. Advances in
Polymer Technology 18:351-363.
Schwarz, M. C., J. W. Barlow, and D. R. Paul. 1988. Mechanical properties of
HDPE/(PEC/PS)/SEBS blends. Journal of Applied Polymer Science 35:2053-2067.
Selke, S. E. and I. Wichman. 2004. Wood fiber/polyolefin composites. Composites Part A:
Applied Science and Manufacturing 35:321-326.
Shah, B. L., L. M. Matuana, and P. A. Heiden. 2005. Novel coupling agents for PVC/wood-flour
composites. Journal of Vinyl and Additive Technology 11:160-165.
Sombatsompop, N. and K. Chaochanchaikul. 2004. Effect of moisture content on mechanical
properties, thermal and structural stability and extrudate texture of poly(vinyl chloride)/wood
sawdust composites. Polymer International 53:1210-1218.
Sombatsompop, N., K. Chaochanchaikul, C. Phromchirasuk, and S. Thongsang. 2003. Effect of
wood sawdust content on rheological and structural changes, and thermo-mechanical properties
of PVC/sawdust composites. Polymer International 52:1847-1855.
Vrandecic, S. N., B. Andricic, I. Klaric, and T. Kovacic. 2005. Kinetics of isothermal
thermooxidative degradation of poly(vinyl chloride)/chlorinated polyethylene blends. Polymer
Degradation and Stability 90:455-460.
Wu, Y. and D. Dollimore. 1998. Kinetic studies of thermal degradation of natural cellulosic
materials. Thermochimica Acta 324:49-57.
26
CHAPTER 3 CREEP BEHAVIOR OF BAGASSE FIBER REINFORCED POLYMER
COMPOSITES
3.1 INTRODUCTION
Natural fiber/polymer composites (NFPCs) are being increasingly used in construction
and their creep behaviors under constant stress are receiving more research interest. One of the
main techniques for creep characterization is modeling. The 4-element Burgers model was
widely adopted to characterize the viscoelastic behavior of the materials (Marcovich and Villar
2003, Nunez et al. 2004, Acha et al. 2007). Findley's power law model (Jiang et al. 2007) and a
simpler two-parameter power law model (Tajvidi et al. 2005) were also attempted to simulate the
creep curves of NFPCs. Although recovery curves were presented in some research work, no
analysis has been made for this relaxation stage (Acha et al. 2007). Time-temperature
superposition (TTS) was tried to predict long-term creep deformation of NFPCs from the
accelerated testing data at different temperature levels and smooth master curves were obtained.
Some NFPCs, however, have been shown to be thermorheologically complex and TTS cannot be
applied to predict their long-term creep curves through a single horizontal shift (Nunez et al.
2004, Tajvidi et al. 2005).
Bagasse fibers are a by-product of sugar-cane processing. The composition of bagasse is
approximately 50% cellulose, 25% hemicellulose, and 25% lignin (Pandey et al. 2000). In
comparison with other agricultural residues, bagasse is regarded as a rich natural resource due to
high yield and annual regeneration capacity (Pandey et al. 2000). With increased wood costs and
competition of wood resources from traditional wood sectors, developing alternative,
environmentally friendly resources for natural fiber plastic composites is greatly needed.
Currently the main use of bagasse is for energy in the sugar-cane industry through burning, but
27
their caloric value is relatively low compared to other fuel resources (Vazquez et al. 1999). Thus,
utilization of bagasse fiber in NFPCs can lead to more efficient use of this bioresource.
The objectives of this study were to: 1) study the effect of temperature and composite
type on creep properties of bagasse fiber/polymer composites, 2) model the observed creep
behavior of the composites, and 3) predict long-term creep behavior of the composites based on
accelerated testing and the time-temperature superposition principle.
3.2 THEORETICAL BACKGROUND
3.2.1 Creep Models
Creep modeling is of considerable interest in creep analysis for NFPCs. Different models
have been proposed for viscoelastic polymeric materials and they can be classified into physical
models and empirical models based on the interpretation of the parameters.
Burgers model is the most commonly used physical model. A generalized Burgers model
has one Maxwell unit and one or multiple Kelvin units connected in series, as shown in Figure
3.1. The Burgers model divides the creep strain of a polymeric material into three parts:
instantaneous deformation resulting from the Maxwell spring; viscoelastic deformation resulting
from Kelvin units; and viscous deformation resulting from the Maxwell dashpot. All these can be
presented by the following mathematical equation:
ttE
EEt
M
n
j Kj
Kj
KjM
1
)]exp(1[)( (3.1)
where )(t is the creep strain, is the stress, t is the time, M
E and M
are the elastic
modulus of the spring and viscosity of the dashpot in the Maxwell unit, and Kj
E and Kj
are
elastic modulus of the spring and viscosity of the dashpot in the jth
Kelvin unit.
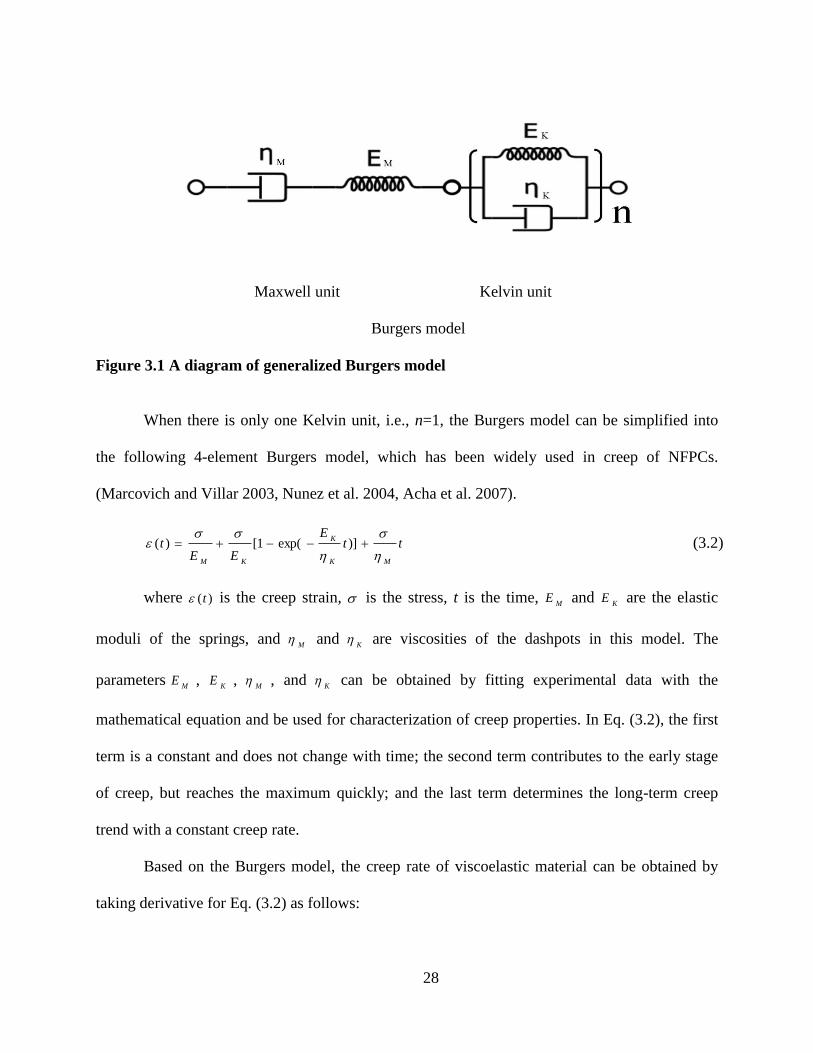
28
Maxwell unit Kelvin unit
Burgers model
Figure 3.1 A diagram of generalized Burgers model
When there is only one Kelvin unit, i.e., n=1, the Burgers model can be simplified into
the following 4-element Burgers model, which has been widely used in creep of NFPCs.
(Marcovich and Villar 2003, Nunez et al. 2004, Acha et al. 2007).
ttE
EEt
MK
K
KM
)]exp(1[)( (3.2)
where )(t is the creep strain, is the stress, t is the time, M
E and K
E are the elastic
moduli of the springs, and M
and K
are viscosities of the dashpots in this model. The
parametersM
E , K
E , M
, and K
can be obtained by fitting experimental data with the
mathematical equation and be used for characterization of creep properties. In Eq. (3.2), the first
term is a constant and does not change with time; the second term contributes to the early stage
of creep, but reaches the maximum quickly; and the last term determines the long-term creep
trend with a constant creep rate.
Based on the Burgers model, the creep rate of viscoelastic material can be obtained by
taking derivative for Eq. (3.2) as follows:
29
MK
K
K
tE
dt
td
)exp(
)( (3.3)
Besides the Burgers model, several empirical models were proposed to simulate creep
curves of polymeric material. One of the most commonly used empirical models is the Findley
power law model (Jiang et al. 2007):
0)(
batt (3.4)
where 0
is the initial strain, which is dependent on stress; a is a parameter dependent on
stress and b is one independent of stress.
A simpler 2-parameter power law model was also proposed and has been shown to be
applicable for the creep modeling of kenaf fiber/HDPE composite (Tajvidi et al. 2005):
batt )( (3.5)
Although much work has been done on modeling of creep behavior of polymeric
materials, no study has been reported on modeling of the recovery process, which is of
importance for applications under non-constant stress. Understanding of the recovery process can
also advance the modeling and prediction of creep behavior.
3.2.2 Accelerated Testing
Creep resistance is an important property for polymeric materials. However, it is often
impractical to test long-term creep behavior directly with experiment because of the extremely
long time required. Thus, predicting the creep behavior of polymers using short-term testing has
gained considerable attention. One of the most useful extrapolation techniques is time-
temperature superposition (TTS). It can be used to predict long-term creep behavior of certain
polymers by shifting the curves from tests at different temperatures horizontally along a
logarithmic time axis to generate a single curve known as the master curve (Ward 1971). Thus, a

30
long-term experiment can be replaced by shorter tests at higher temperatures. The shifting
distance is called shift factor. The materials for which TTS holds are called thermorheologically
simple materials and the rest are called thermorheologically complex materials (Tajvidi et al.
2005).
The shift factors of thermorheologically simple material can be related to temperature
using either Williams–Landel–Ferry (WLF) or Arrhenius equations. The WLF equation is:
)(
)(log
02
01
TTC
TTCa
T
(3.6)
where αT is the horizontal (or time) shift factor, C1 and C2 are constants, T0 is the
reference temperature (K) and T is the temperature at which the test is performed (K).
The Arrhenius equation is given by:
)11
(log
0TTR
Ea
a
T (3.7)
where Ea is the activation energy, R is the universal gas constant, T0 is the reference
temperature (K), and T is the temperature at which the test is performed (K). Regression analysis
can be done using Eq. (3.7) to determine the activation energy for various materials from the
experimental data.
3.3 EXPERIMENTAL
3.3.1 Raw Material
Polymers used in this work include recycled poly(vinyl chloride) (RPVC), virgin
poly(vinyl chloride) (VPVC), recycled high density polyethylene (RHDPE), and virgin high
density polyethylene (VHDPE). Both RPVC and RHDPE were obtained from Avangard
Industries, Ltd. (Houston, TX). The VPVC was Shintech SE-450 from Shintech, Inc.
(Plaquemine, LA), with an inherent viscosity of 0.515 (ASTM D 1243). VHDPE was Petrothene
31
LM 6007-00 with a MFI of 0.8 g/10min (190ºC and 2.16 kg) and a density of 960 kg/m3, from
Equistar Chemicals, LP. (Houston, TX). The coupling agent used for the HDPE composites was
Polybond 3009 (MAPE) from Chemtura Corporation (Middlebury, CT). The thermal stabilizer
for PVC was Mark 1900, a mixture of methyltin tris(2-ethylhexy thioglycolate and dimethyltin
bis(2-ethylhexyl thioglycolate) from Chemtura Corporation (Middlebury, CT), with a specific
gravity of 1.18 and 19.5% of Tin. The lubricant for PVC composite is TPW-012 from Struktol
Company of America (Stow, OH), with a dropping point of 122-128 ºC and a specific gravity of
0.98.
The raw bagasse fiber was obtained from a local sugar mill in Louisiana. The bagasse
fiber was oven-dried at 95°C for 24 hours to reduce the moisture content to below 2%. The dried
fiber was hammer milled to pass through a 20-mesh screen, and then was stored in sealed plastic
bags prior to compounding.
A commercial wood/HDPE composite decking material (W/HDPE) was used for
comparative purpose in this study. However, the details of the composite formulation and
processing conditions of the material were not known.
3.3.2 Composite Preparation
The plastic, bagasse fiber and additives were compounded in a 32-mm twin screw
extruder (D-TEX extruder, Davis Standard). Compositions for the HDPE composites were 42%
HDPE, 50% bagasse fiber, 2% MAPE, and 6% lubricant. For PVC composites, 41.2% PVC, 50%
bagasse fiber, 2% SEBS, 6% lubricant, and 0.8% heat stabilizer were used. The extruder was
then reconfigured for profiling and the compounded pellets were further processed into profiles
of 65 6.5 mm cross section. Thin sections were cross-cut from the profiles and then sanded to
yield 65 6.5 3 mm specimens.
32
3.3.3 Characterization
Three different tests were performed using a TA Q800 Dynamic Mechanical Analysis
(DMA) instrument (TA Instrument Inc., New Castle, DE) using the dual-cantilever configuration.
In each test, the sample was heated to the desired temperature and allowed to equilibrate for 5
minutes prior to beginning the test.
Strain sweep tests up to the maximum possible load level for the instrument (i.e., 18N)
were performed at a frequency of 1 Hz and at temperatures of 35, 45, 55, and 65°C.
Thirty-minute creep tests were performed at temperatures starting at 35°C and increasing
in 10°C increments up to 65°C for PVC composites and up to 85°C for HDPE composites. After
equilibrating at the desired temperature, 2 MPa of stress was applied and held constant for 30
minutes while the creep strain was measured. Three-day creep tests were also performed at a
temperature of 35°C with a stress level of 2 MPa. After 72 hours, the stress was released and the
sample was allowed to recover for 24 hours.
3.3.4 Creep Modeling
Eq. (3.3) can be approximated by the following regression model:
errortttiMV
k
j
iKVjKEjMEi
1
)]exp(1[)( (3.8)
where: )(i
t is the creep strain for the ith
observation at time ti, ME and MV are estimates for
/EM and /M, respectively. KEj and KVj are estimates for /EKj and EKj/Kj, respectively, for
the jth
Kelvin unit (j =1, 2, 3, …, k). Nonlinear regression techniques were used to obtain
estimates of the above parameters. Because the DMA instrument collected the data with
increasing step size, resulting in more observations near time zero and fewer as time elapsed,
each data point was weighted with the time interval from the previous point as follows:
33
1
iiittw (3.9)
Least-squares estimates of the regression parameters were computed by minimizing the
following weighted Sum of Squares (WSS):
2
1
)(ˆ)(
n
i
iiittwWSS (3.10)
where (ti) represents creep strain observed at time ti and )(ˆi
t is the predicted creep strain for
the thi observation at time
it . A smaller WSS value indicates better goodness-of-fit. When the
parameters are determined, the goodness-of-fit can be visualized with a residual plot, defined as
follows:
)(ˆ)()(Reii
ttisid (3.11)
Statistical Analysis System (SAS) was employed to perform the nonlinear regression
analysis on the creep curves. Gauss-Newton iterative method was implemented in this analysis to
find least-square estimates for the nonlinear model. The similar numerical procedures were
carried on the other models.
3.3.5 Recovery Analysis
When the stress was removed at time t0, test sample started the recovery process, which is
a reverse process of creep. The maximum creep deformation was reached right before the stress
was removed (at time t0). Taking the maximum creep strain as the original state for the recovery
process and the deformation reduction as recovery value, recovery curves were plotted in a way
similar to creep curves. The recovery function can be expressed as follows:
)()()(00
ttttR (3.12)
34
where R(t) stands for the recovery value at time t.
In Burgers model, the recovery function can be presented by the following mathematical
equation:
n
j Kj
Kj
KjM
B
Et
EEtR
1
)]exp(1[)(
(3.13)
3.3.6 Non-recoverable Deformation
With the introduction of recovery analysis, the creep deformation of the samples at time t
can be divided into two parts: recoverable deformation and non-recoverable deformation.
Denoting the non-recoverable deformation at time t as NR(t), it can be calculated by the
following equation:
)()()( tRttNR (3.14)
The non-recoverable deformation for Burgers model is this:
ttNR
M
B
)( (3.15)
3.4 RESULTS AND DISCUSSION
3.4.1 Stress-Strain Behavior
Figure 3.2(a) shows the strain sweep test results for the composites at 35°C. The stress
and strain showed a good linear relationship in the testing region up to about 8 MPa at 35°C,
except for the composite made with virgin HDPE. The bagasse/PVC composites (B/PVC)
showed higher stiffness than the bagasse/HDPE composites (B/HDPE) as a result of the stiffer
PVC matrix. Moreover, the composites of recycled polymers (RPVC and RHDPE) had slightly
higher moduli than the composites of virgin polymers (VPVC and VHDPE). At 35°C, W/HDPE
35
had a stiffness between that of the bagasse/RHDPE composite (B/RHDPE) and the
bagasse/VHDPE composite (B/VHDPE).
The linear viscoelastic regions were shortened to about 0-2 MPa when the temperature
was increased to 65°C (Figure 3.2(b)). This phenomenon indicates that viscous behavior was not
apparent during the test at 35°C, but a higher temperature (i.e., 65°C) enhanced polymer mobility.
For this reason, a stress of 2 MPa was used in the creep tests to ensure that the creep
deformations were within the linear viscoelastic range. The composite stiffnesses at 65°C
differed from those at 35°C, with W/HDPE being less affected by the temperature than B/HDPE
and the bagasse/RPVC composite (B/RPVC) being more affected than the bagasse/VPVC
composite (B/VPVC). The former can be caused by the difference in polymer matrix and fiber
loading, which is unknown for W/HDPE; the latter may be due to possible thermal degradation
of the recycled PVC.
3.4.2 Temperature Effect
Figure 3.3(a) shows the creep behavior of the five composites at 35°C. At this
temperature, B/PVC not only had lower instantaneous deformation, due to the higher stiffness of
PVC compared to HDPE as indicated in Figure 3.2, but also showed a smaller creep rate than the
HDPE composites. For the HDPE composites, their similar stiffness (Figure 3.2(a)) resulted in
similar instantaneous deformations, but they differed much in creep rate, with B/VHDPE
showing the highest creep rate and W/HDPE the lowest.
Figure 3.3(b) shows the creep behavior of the five composites at 65°C. The creep strains
of all composites increased at the higher temperature, but B/PVC were affected more than the
HDPE composites. Although B/PVC had smaller instantaneous deformations than the HDPE
composites, their long term creep was higher because of their high creep rates. This may be due
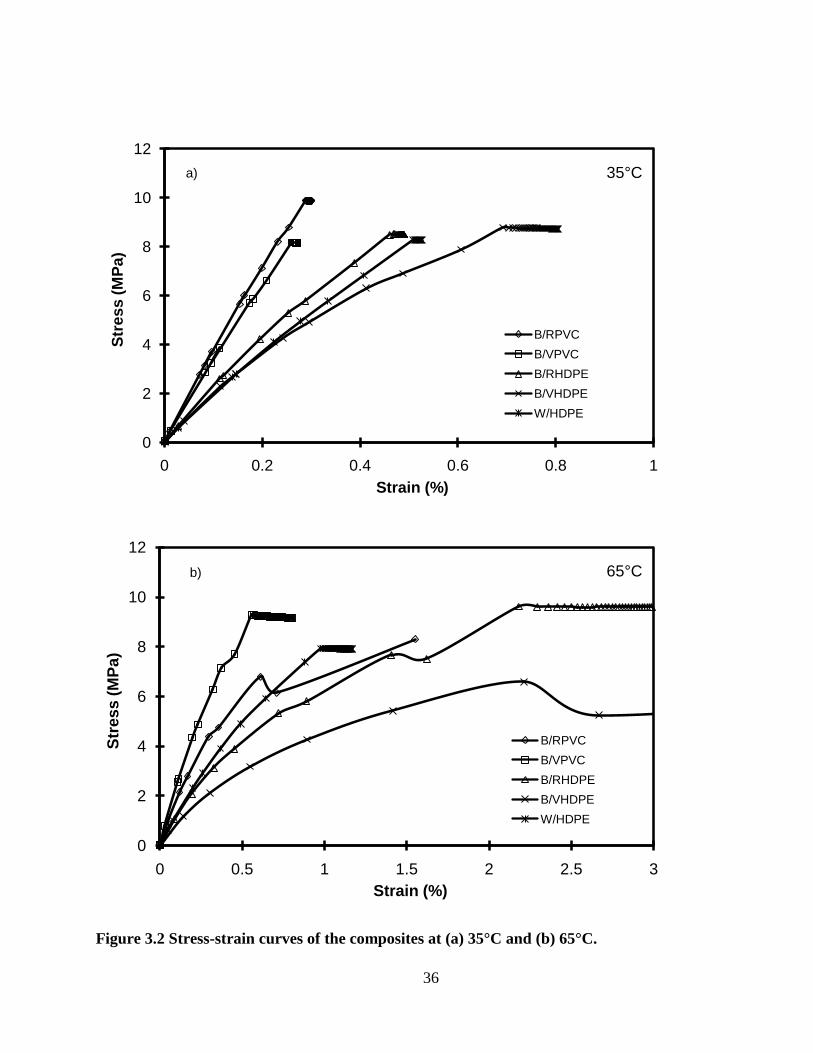
36
Figure 3.2 Stress-strain curves of the composites at (a) 35°C and (b) 65°C.
0
2
4
6
8
10
12
0 0.2 0.4 0.6 0.8 1
Str
es
s (
MP
a)
Strain (%)
35°C
B/RPVC
B/VPVC
B/RHDPE
B/VHDPE
W/HDPE
a)
0
2
4
6
8
10
12
0 0.5 1 1.5 2 2.5 3
Str
es
s (
MP
a)
Strain (%)
65°C
B/RPVC
B/VPVC
B/RHDPE
B/VHDPE
W/HDPE
b)
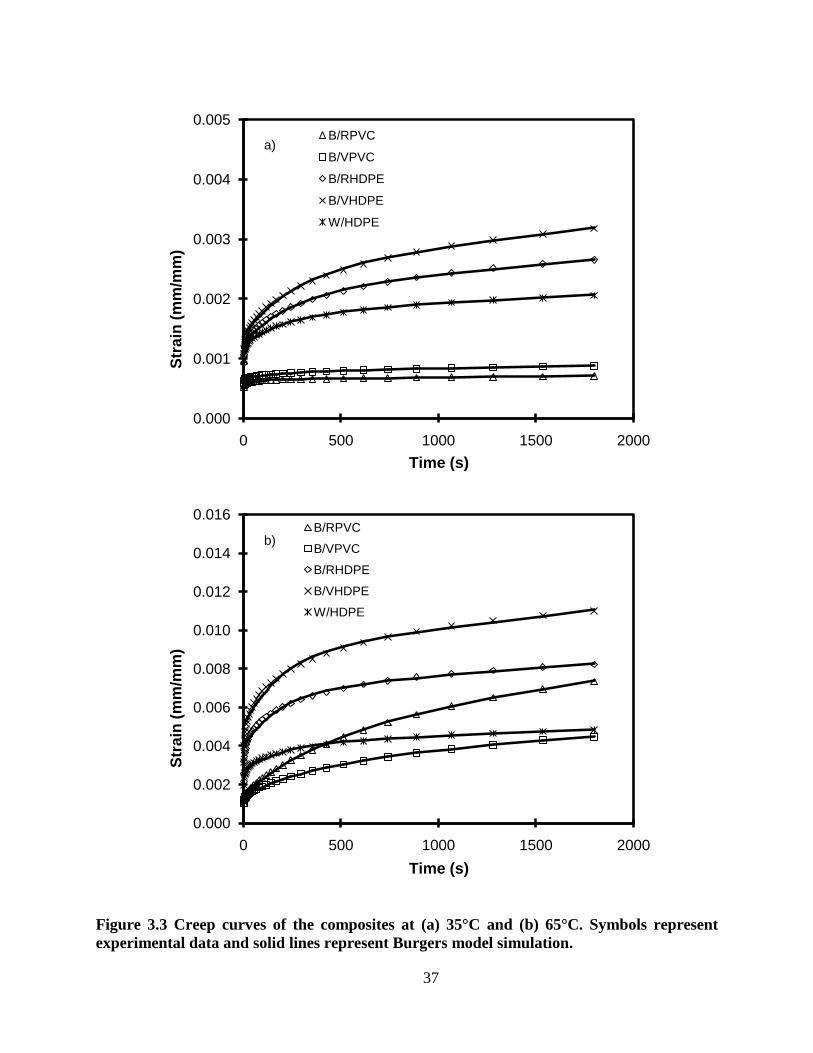
37
Figure 3.3 Creep curves of the composites at (a) 35°C and (b) 65°C. Symbols represent
experimental data and solid lines represent Burgers model simulation.
0.000
0.001
0.002
0.003
0.004
0.005
0 500 1000 1500 2000
Str
ain
(m
m/m
m)
Time (s)
B/RPVC
B/VPVC
B/RHDPE
B/VHDPE
W/HDPE
a)
0.000
0.002
0.004
0.006
0.008
0.010
0.012
0.014
0.016
0 500 1000 1500 2000
Str
ain
(m
m/m
m)
Time (s)
B/RPVC
B/VPVC
B/RHDPE
B/VHDPE
W/HDPE
b)
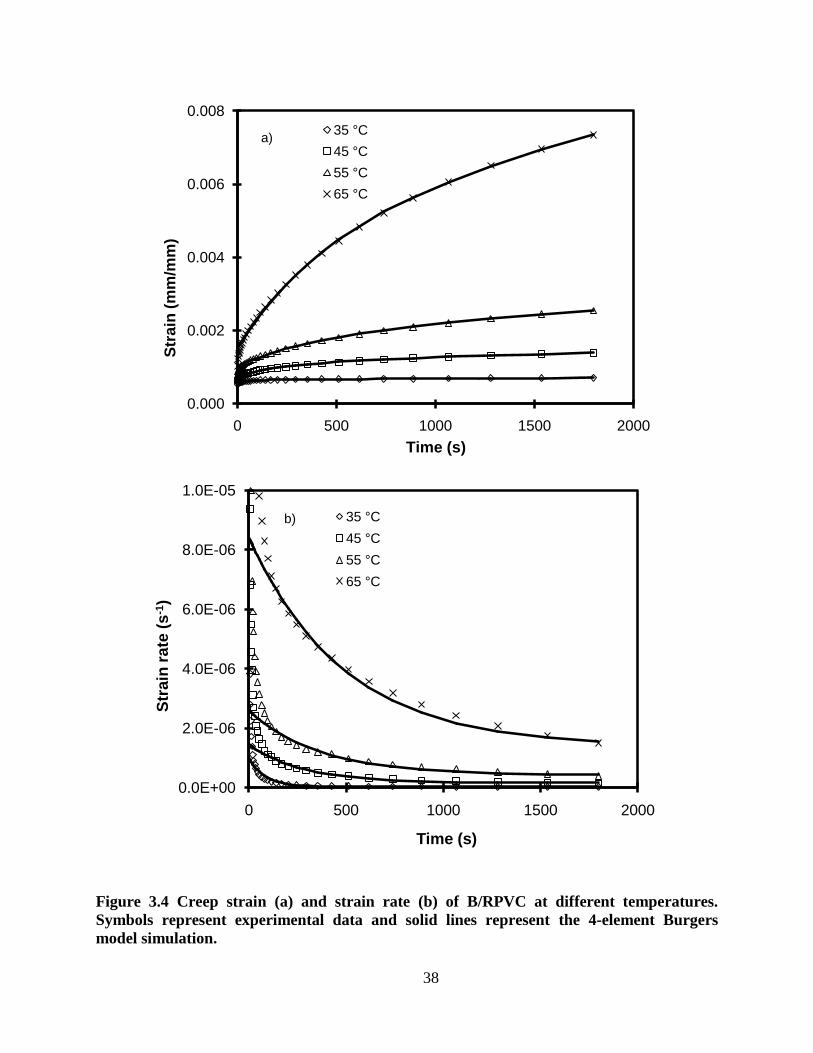
38
Figure 3.4 Creep strain (a) and strain rate (b) of B/RPVC at different temperatures.
Symbols represent experimental data and solid lines represent the 4-element Burgers
model simulation.
0.000
0.002
0.004
0.006
0.008
0 500 1000 1500 2000
Str
ain
(m
m/m
m)
Time (s)
35 °C
45 °C
55 °C
65 °C
a)
0.0E+00
2.0E-06
4.0E-06
6.0E-06
8.0E-06
1.0E-05
0 500 1000 1500 2000
Str
ain
ra
te (
s-1
)
Time (s)
35 °C
45 °C
55 °C
65 °C
b)
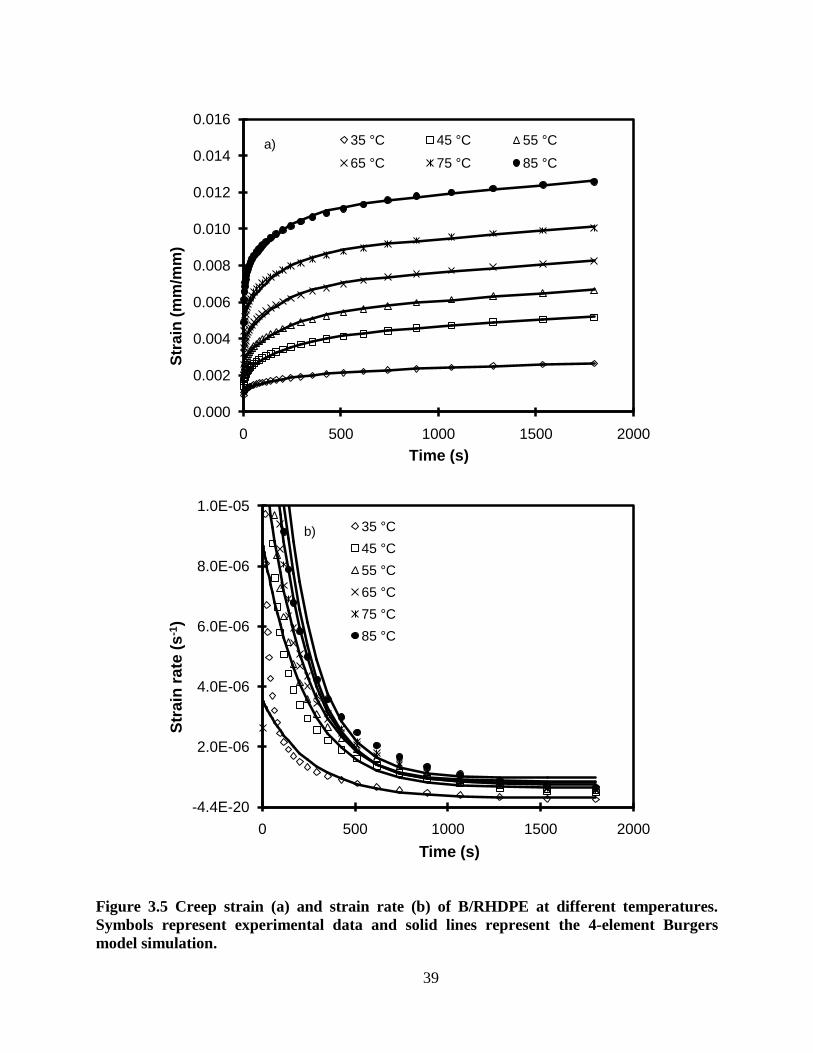
39
Figure 3.5 Creep strain (a) and strain rate (b) of B/RHDPE at different temperatures.
Symbols represent experimental data and solid lines represent the 4-element Burgers
model simulation.
0.000
0.002
0.004
0.006
0.008
0.010
0.012
0.014
0.016
0 500 1000 1500 2000
Str
ain
(m
m/m
m)
Time (s)
35 °C 45 °C 55 °C
65 °C 75 °C 85 °C
a)
-4.4E-20
2.0E-06
4.0E-06
6.0E-06
8.0E-06
1.0E-05
0 500 1000 1500 2000
Str
ain
ra
te (
s-1
)
Time (s)
35 °C
45 °C
55 °C
65 °C
75 °C
85 °C
b)
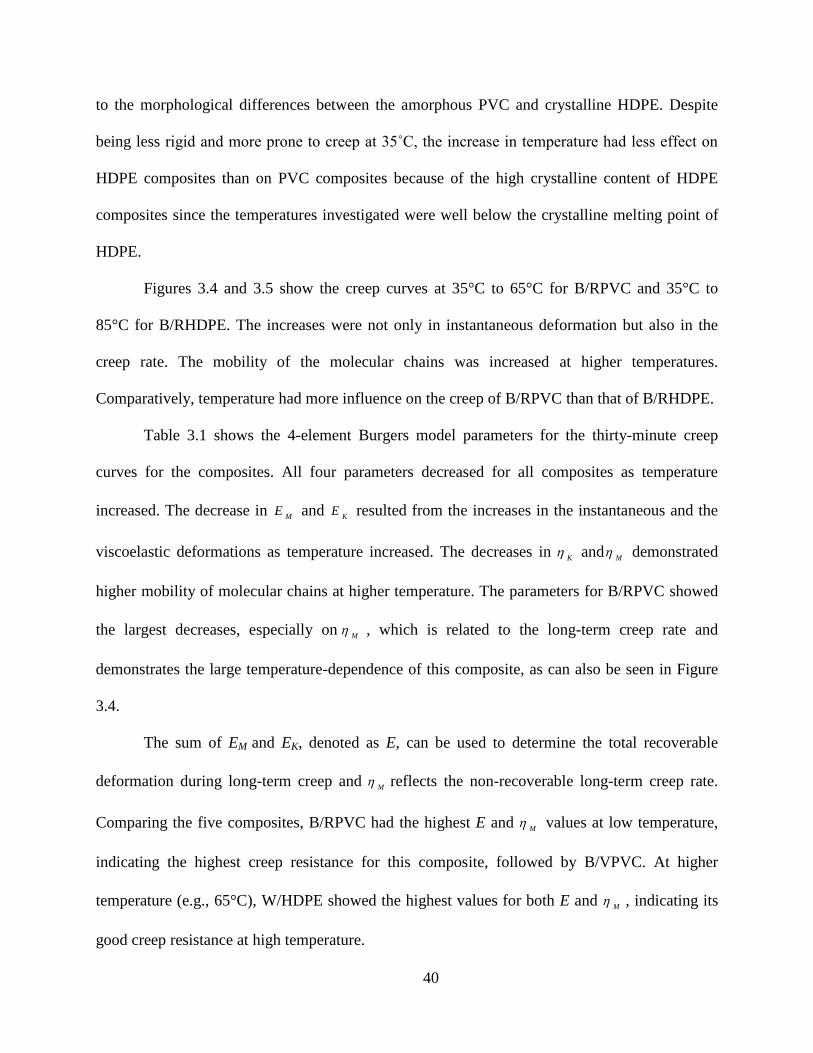
40
to the morphological differences between the amorphous PVC and crystalline HDPE. Despite
being less rigid and more prone to creep at 35˚C, the increase in temperature had less effect on
HDPE composites than on PVC composites because of the high crystalline content of HDPE
composites since the temperatures investigated were well below the crystalline melting point of
HDPE.
Figures 3.4 and 3.5 show the creep curves at 35°C to 65°C for B/RPVC and 35°C to
85°C for B/RHDPE. The increases were not only in instantaneous deformation but also in the
creep rate. The mobility of the molecular chains was increased at higher temperatures.
Comparatively, temperature had more influence on the creep of B/RPVC than that of B/RHDPE.
Table 3.1 shows the 4-element Burgers model parameters for the thirty-minute creep
curves for the composites. All four parameters decreased for all composites as temperature
increased. The decrease in M
E and K
E resulted from the increases in the instantaneous and the
viscoelastic deformations as temperature increased. The decreases in K
andM
demonstrated
higher mobility of molecular chains at higher temperature. The parameters for B/RPVC showed
the largest decreases, especially onM
, which is related to the long-term creep rate and
demonstrates the large temperature-dependence of this composite, as can also be seen in Figure
3.4.
The sum of EM and EK, denoted as E, can be used to determine the total recoverable
deformation during long-term creep and M
reflects the non-recoverable long-term creep rate.
Comparing the five composites, B/RPVC had the highest E and M
values at low temperature,
indicating the highest creep resistance for this composite, followed by B/VPVC. At higher
temperature (e.g., 65°C), W/HDPE showed the highest values for both E and M
, indicating its
good creep resistance at high temperature.
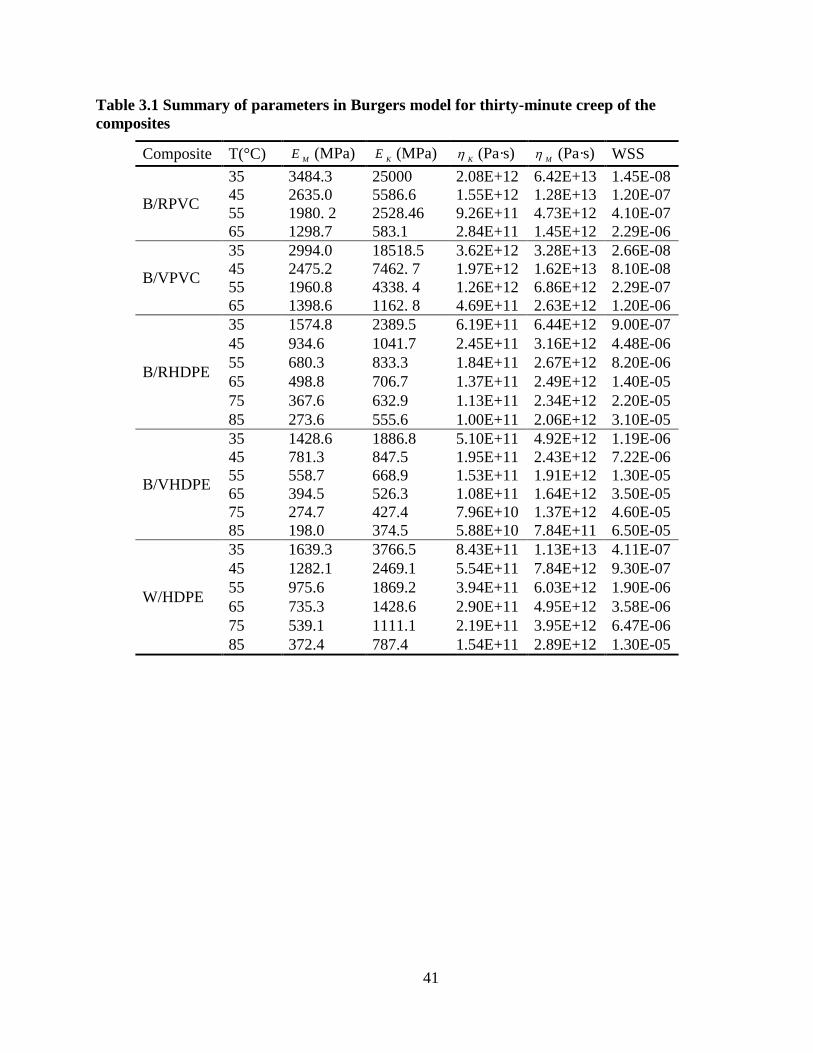
41
Table 3.1 Summary of parameters in Burgers model for thirty-minute creep of the
composites
Composite T(°C) ME (MPa)
KE (MPa)
K (Pa·s)
M (Pa·s) WSS
B/RPVC
35 3484.3 25000 2.08E+12 6.42E+13 1.45E-08
45 2635.0 5586.6 1.55E+12 1.28E+13 1.20E-07
55 1980. 2 2528.46 9.26E+11 4.73E+12 4.10E-07
65 1298.7 583.1 2.84E+11 1.45E+12 2.29E-06
B/VPVC
35 2994.0 18518.5 3.62E+12 3.28E+13 2.66E-08
45 2475.2 7462. 7 1.97E+12 1.62E+13 8.10E-08
55 1960.8 4338. 4 1.26E+12 6.86E+12 2.29E-07
65 1398.6 1162. 8 4.69E+11 2.63E+12 1.20E-06
B/RHDPE
35 1574.8 2389.5 6.19E+11 6.44E+12 9.00E-07
45 934.6 1041.7 2.45E+11 3.16E+12 4.48E-06
55 680.3 833.3 1.84E+11 2.67E+12 8.20E-06
65 498.8 706.7 1.37E+11 2.49E+12 1.40E-05
75 367.6 632.9 1.13E+11 2.34E+12 2.20E-05
85 273.6 555.6 1.00E+11 2.06E+12 3.10E-05
B/VHDPE
35 1428.6 1886.8 5.10E+11 4.92E+12 1.19E-06
45 781.3 847.5 1.95E+11 2.43E+12 7.22E-06
55 558.7 668.9 1.53E+11 1.91E+12 1.30E-05
65 394.5 526.3 1.08E+11 1.64E+12 3.50E-05
75 274.7 427.4 7.96E+10 1.37E+12 4.60E-05
85 198.0 374.5 5.88E+10 7.84E+11 6.50E-05
W/HDPE
35 1639.3 3766.5 8.43E+11 1.13E+13 4.11E-07
45 1282.1 2469.1 5.54E+11 7.84E+12 9.30E-07
55 975.6 1869.2 3.94E+11 6.03E+12 1.90E-06
65 735.3 1428.6 2.90E+11 4.95E+12 3.58E-06
75 539.1 1111.1 2.19E+11 3.95E+12 6.47E-06
85 372.4 787.4 1.54E+11 2.89E+12 1.30E-05
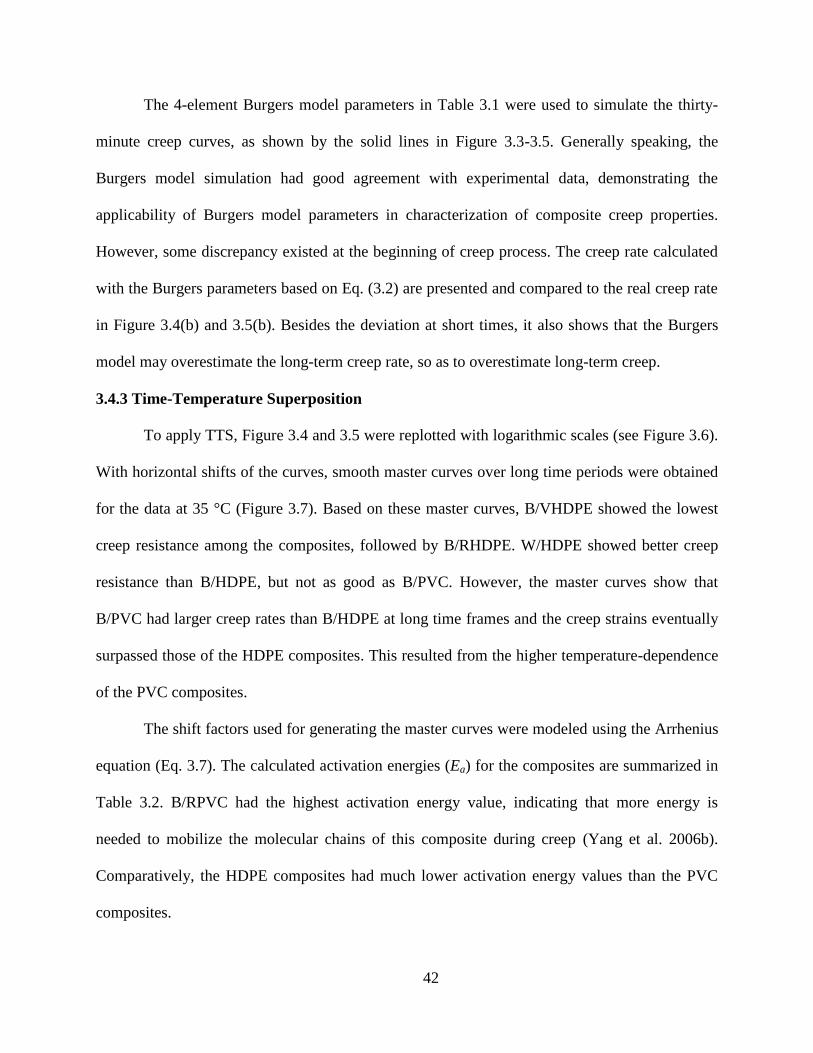
42
The 4-element Burgers model parameters in Table 3.1 were used to simulate the thirty-
minute creep curves, as shown by the solid lines in Figure 3.3-3.5. Generally speaking, the
Burgers model simulation had good agreement with experimental data, demonstrating the
applicability of Burgers model parameters in characterization of composite creep properties.
However, some discrepancy existed at the beginning of creep process. The creep rate calculated
with the Burgers parameters based on Eq. (3.2) are presented and compared to the real creep rate
in Figure 3.4(b) and 3.5(b). Besides the deviation at short times, it also shows that the Burgers
model may overestimate the long-term creep rate, so as to overestimate long-term creep.
3.4.3 Time-Temperature Superposition
To apply TTS, Figure 3.4 and 3.5 were replotted with logarithmic scales (see Figure 3.6).
With horizontal shifts of the curves, smooth master curves over long time periods were obtained
for the data at 35 °C (Figure 3.7). Based on these master curves, B/VHDPE showed the lowest
creep resistance among the composites, followed by B/RHDPE. W/HDPE showed better creep
resistance than B/HDPE, but not as good as B/PVC. However, the master curves show that
B/PVC had larger creep rates than B/HDPE at long time frames and the creep strains eventually
surpassed those of the HDPE composites. This resulted from the higher temperature-dependence
of the PVC composites.
The shift factors used for generating the master curves were modeled using the Arrhenius
equation (Eq. 3.7). The calculated activation energies (Ea) for the composites are summarized in
Table 3.2. B/RPVC had the highest activation energy value, indicating that more energy is
needed to mobilize the molecular chains of this composite during creep (Yang et al. 2006b).
Comparatively, the HDPE composites had much lower activation energy values than the PVC
composites.
43
Figure 3.6 Log-scaled creep strain of (a) B/RPVC and (b) B/RHDPE.
-3.50
-3.00
-2.50
-2.00
-1.50
-1.00
-0.50
0.00
0.00 1.00 2.00 3.00 4.00
Lo
g S
train
(m
m/m
m)
Log Time (s)
35 °C
45 °C
55 °C
65 °C
a)
-3.50
-3.00
-2.50
-2.00
-1.50
-1.00
-0.50
0.00
0.00 1.00 2.00 3.00 4.00
Lo
g S
train
(m
m/m
m)
Log Time (s)
35 °C
45 °C
55 °C
65 °C
75 °C
85 °C
b)
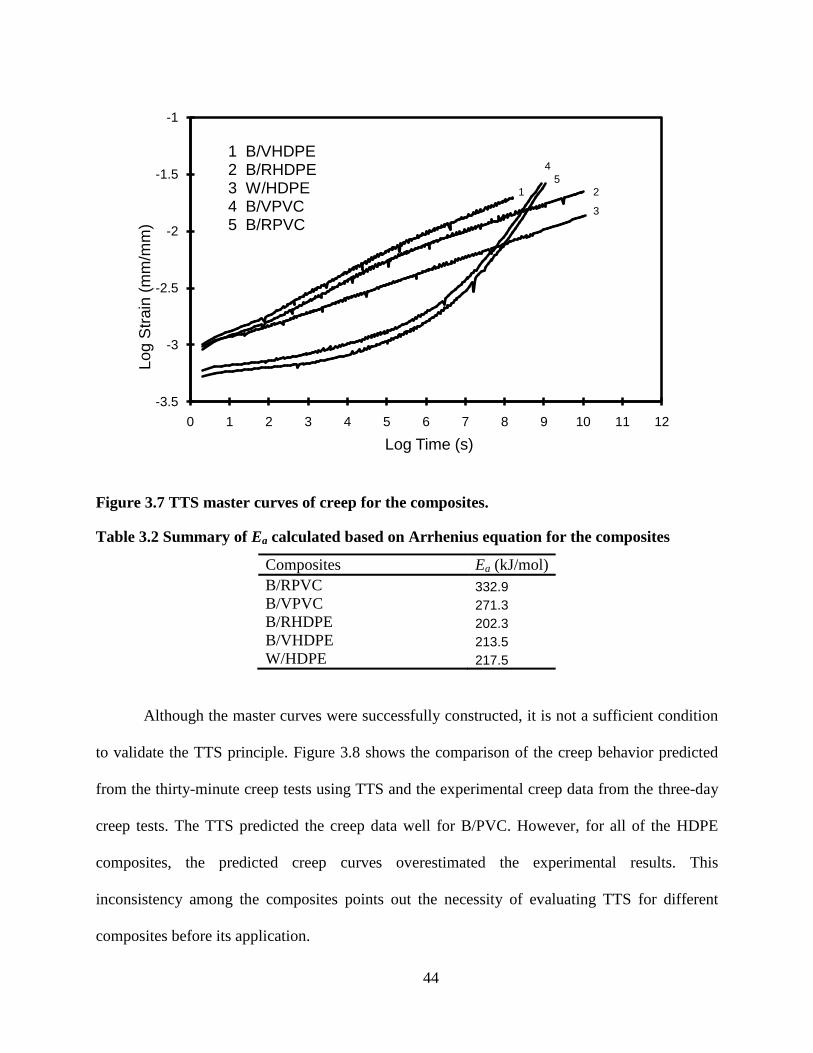
44
Figure 3.7 TTS master curves of creep for the composites.
Table 3.2 Summary of Ea calculated based on Arrhenius equation for the composites
Composites Ea (kJ/mol)
B/RPVC 332.9
B/VPVC 271.3
B/RHDPE 202.3
B/VHDPE 213.5
W/HDPE 217.5
Although the master curves were successfully constructed, it is not a sufficient condition
to validate the TTS principle. Figure 3.8 shows the comparison of the creep behavior predicted
from the thirty-minute creep tests using TTS and the experimental creep data from the three-day
creep tests. The TTS predicted the creep data well for B/PVC. However, for all of the HDPE
composites, the predicted creep curves overestimated the experimental results. This
inconsistency among the composites points out the necessity of evaluating TTS for different
composites before its application.
-3.5
-3
-2.5
-2
-1.5
-1
0 1 2 3 4 5 6 7 8 9 10 11 12
Lo
g S
train
(m
m/m
m)
Log Time (s)
1 2
3
4
5
1 B/VHDPE2 B/RHDPE3 W/HDPE4 B/VPVC5 B/RPVC
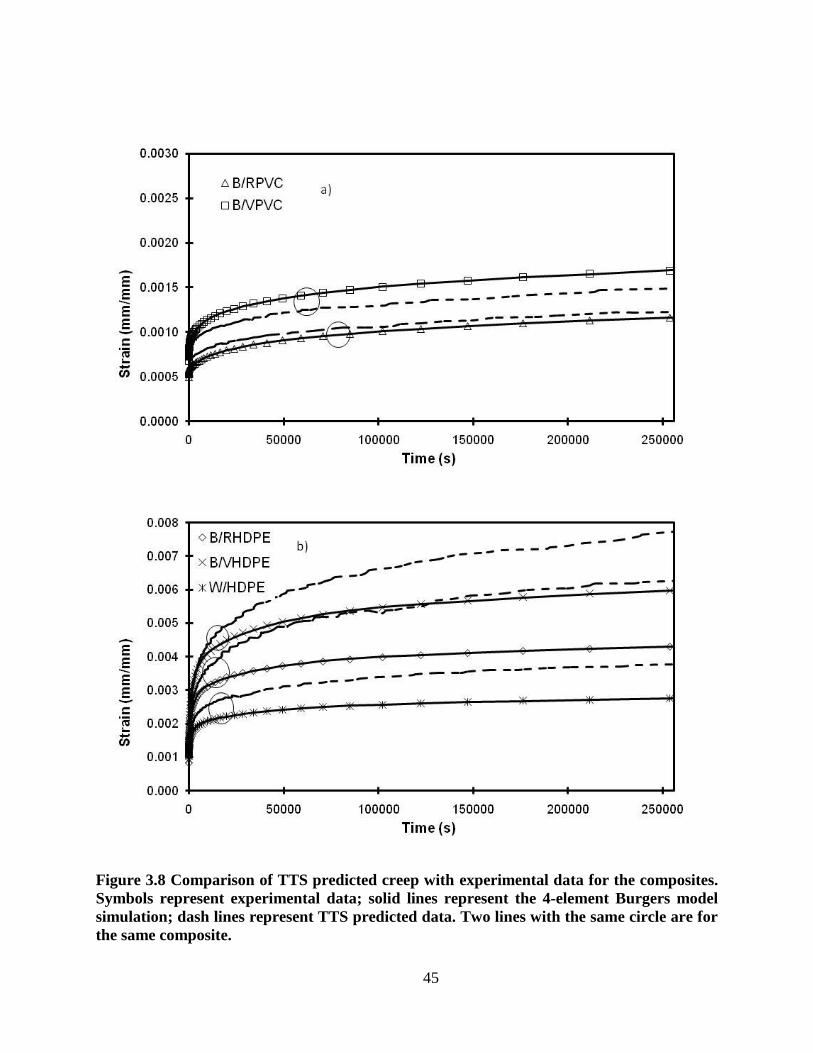
45
Figure 3.8 Comparison of TTS predicted creep with experimental data for the composites.
Symbols represent experimental data; solid lines represent the 4-element Burgers model
simulation; dash lines represent TTS predicted data. Two lines with the same circle are for
the same composite.
46
3.4.4 Creep Modeling
The thirty-minute creep data was fitted only with the 4-element Burgers model, as
described in Section 3.3.2. In this section several different models were evaluated on the three-
day creep data.
3.4.4.1 Burgers Models
Four-element Burgers model. As shown in Figure 3.8, the 4-element Burgers model
offered a good fit on the three-day creep curves of all three composites. It was capable of
representing the overall creep trend and predicting the creep for a longer time period. Table 3.3
shows that bagasse/VHDPE composite had the lowest M
E , which indicates the highest
instantaneous deformation under stress. Comparatively, bagasse/RPVC had the highest M
E
value and showed the smallest instantaneous strain at the beginning of the test. ParameterK
E
showed the same order as M
E , indicating that B/VHDPE also had the highest viscoelastic
deformation during the test. In Burgers model, the most important parameter for long-term creep
is M
, which determines long-term creep rate. Among the three composites, B/VHDPE had the
lowest M
, showing the highest long-term creep rate, while B/RPVC had the lowest long-term
creep rate with the smallest M
. Clearly, B/VHDPE composite had the worst creep resistance
among the composites based on Burgers model, followed by B/RHDPE composite.
Six-element Burgers model. A comparison of the Maxwell parameters M
E and M
from
the 4-element and 6-element Burgers models shows that they have the same trend for the 5
composites. M
E and M
from 6-element Burgers model are larger than that from the r-element
Burgers model, indicating that 6-element Burgers model offers smaller instantaneous
deformation value and smaller long-term creep rate prediction. This is because the extra Kelvin
47
unit introduced into this model accounted part of the instantaneous deformation and long-term
creep. The smaller instantaneous deformation and lower creep rate were examined and proved to
be more accurately later in this paper. Moreover, the WSS (Table 3.3) indicate that 6-element
Burgers model offered a much better fit than the r-element Burgers model.
Eight-element Burgers model. As shown in Table 3.3, 8-element Burgers model provided
even larger Maxwell parameters M
E and M
than 6-element Burgers model. This indicates that
8-element Burgers model results in smaller instantaneous deformation value and smaller long-
term creep rate prediction with the introduction of another Kelvin unit. The WSS in Table 3.3
also show that 8-element Burgers model had a better fit than the 6-element and 4-element
Burgers models.
Residual plot. Although 4, 6, and 8-element Burgers models were all capable of fitting
the creep curves of the composites, they had different fit accuracies, as shown by WSSs in Table
3.3. To illustrate the differences, the residuals of the models are plotted in Figure 3.9. It can be
seen that the 4-element Burgers model shows a poor fit, especially at the beginning, which
corresponds to the Kelvin unit of the physical model. The more complicated Burgers models
offered a better fit due to added flexibility resulting from additional Kelvin units.
Creep prediction. Figure 3.10 shows the comparison of the three models when being used
to predict the third day creep based on two-day creep data. It can be found that 8-element
Burgers model offered the best prediction and the 4-element Burgers model the worst. But all the
three models overestimated the long-term creep deformation, or the long-term creep rate. A more
complicated model might provide a smaller creep rate and offer better long-term prediction.
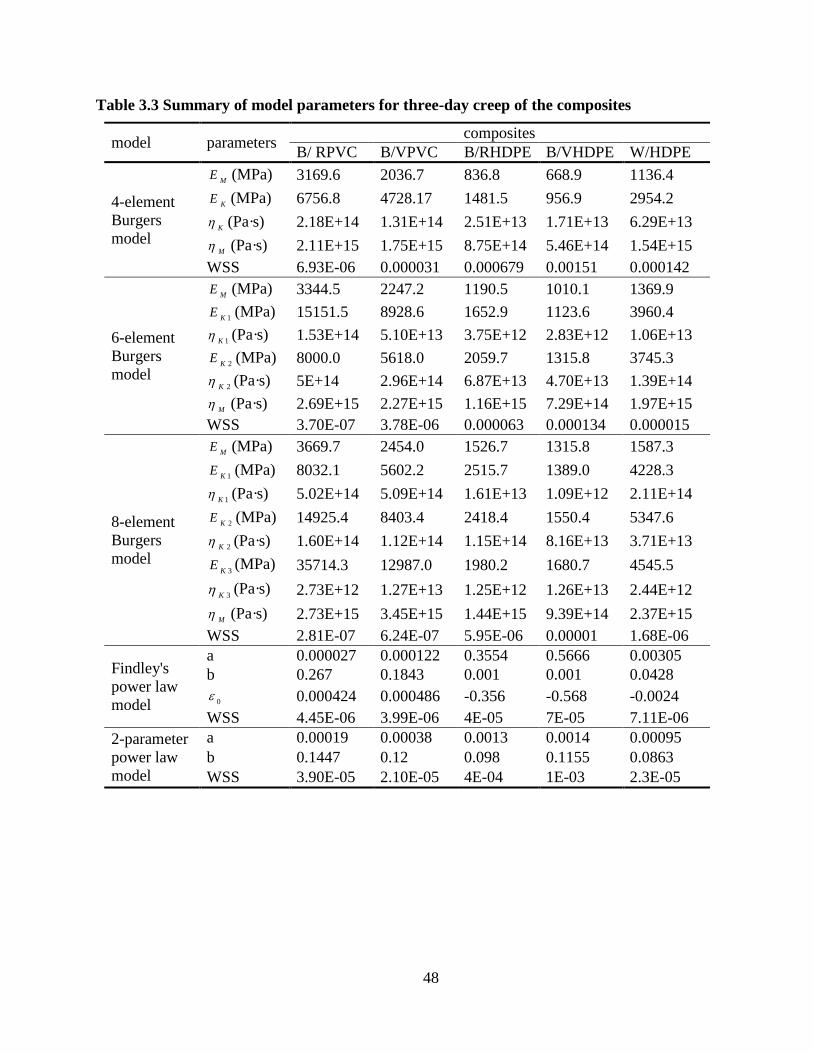
48
Table 3.3 Summary of model parameters for three-day creep of the composites
model parameters composites
B/ RPVC B/VPVC B/RHDPE B/VHDPE W/HDPE
4-element
Burgers
model
ME (MPa) 3169.6 2036.7 836.8 668.9 1136.4
KE (MPa) 6756.8 4728.17 1481.5 956.9 2954.2
K (Pa·s) 2.18E+14 1.31E+14 2.51E+13 1.71E+13 6.29E+13
M (Pa·s) 2.11E+15 1.75E+15 8.75E+14 5.46E+14 1.54E+15
WSS 6.93E-06 0.000031 0.000679 0.00151 0.000142
6-element
Burgers
model
ME (MPa) 3344.5 2247.2 1190.5 1010.1 1369.9
1KE (MPa) 15151.5 8928.6 1652.9 1123.6 3960.4
1K (Pa·s) 1.53E+14 5.10E+13 3.75E+12 2.83E+12 1.06E+13
2KE (MPa) 8000.0 5618.0 2059.7 1315.8 3745.3
2K (Pa·s) 5E+14 2.96E+14 6.87E+13 4.70E+13 1.39E+14
M (Pa·s) 2.69E+15 2.27E+15 1.16E+15 7.29E+14 1.97E+15
WSS 3.70E-07 3.78E-06 0.000063 0.000134 0.000015
8-element
Burgers
model
ME (MPa) 3669.7 2454.0 1526.7 1315.8 1587.3
1KE (MPa) 8032.1 5602.2 2515.7 1389.0 4228.3
1K (Pa·s) 5.02E+14 5.09E+14 1.61E+13 1.09E+12 2.11E+14
2KE (MPa) 14925.4 8403.4 2418.4 1550.4 5347.6
2K (Pa·s) 1.60E+14 1.12E+14 1.15E+14 8.16E+13 3.71E+13
3KE (MPa) 35714.3 12987.0 1980.2 1680.7 4545.5
3K (Pa·s) 2.73E+12 1.27E+13 1.25E+12 1.26E+13 2.44E+12
M (Pa·s) 2.73E+15 3.45E+15 1.44E+15 9.39E+14 2.37E+15
WSS 2.81E-07 6.24E-07 5.95E-06 0.00001 1.68E-06
Findley's
power law
model
a 0.000027 0.000122 0.3554 0.5666 0.00305
b 0.267 0.1843 0.001 0.001 0.0428
0 0.000424 0.000486 -0.356 -0.568 -0.0024
WSS 4.45E-06 3.99E-06 4E-05 7E-05 7.11E-06
2-parameter
power law
model
a 0.00019 0.00038 0.0013 0.0014 0.00095
b 0.1447 0.12 0.098 0.1155 0.0863
WSS 3.90E-05 2.10E-05 4E-04 1E-03 2.3E-05
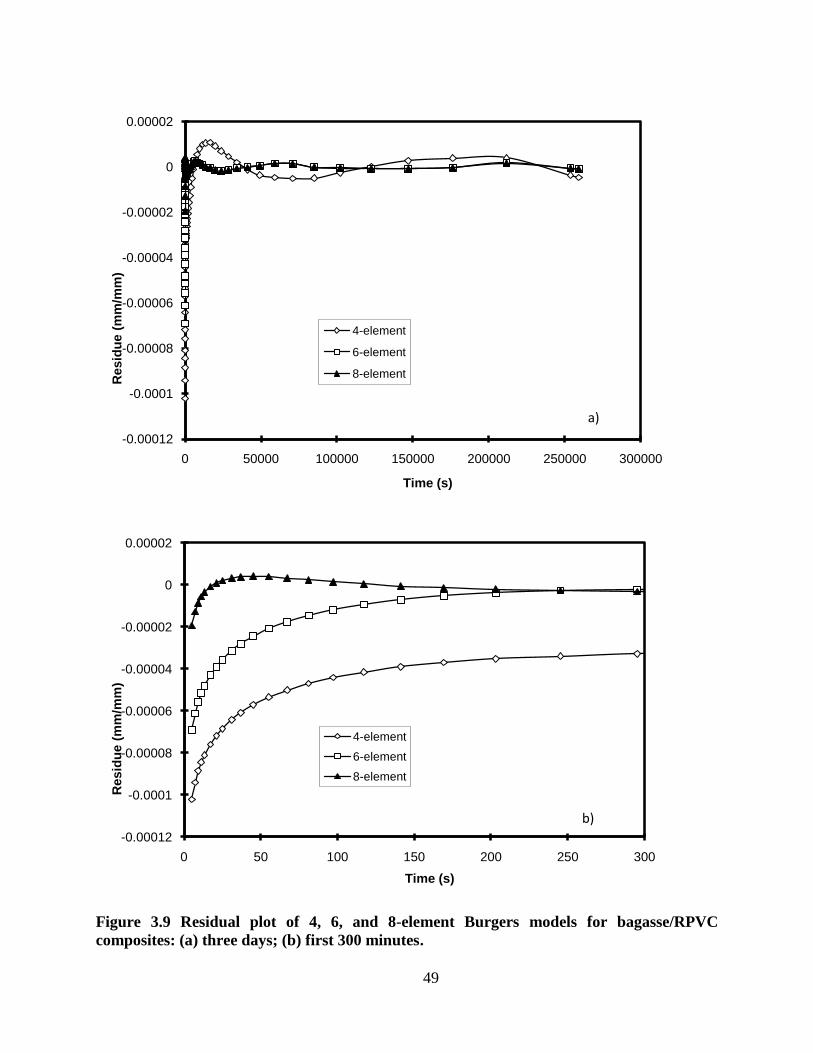
49
Figure 3.9 Residual plot of 4, 6, and 8-element Burgers models for bagasse/RPVC
composites: (a) three days; (b) first 300 minutes.
-0.00012
-0.0001
-0.00008
-0.00006
-0.00004
-0.00002
0
0.00002
0 50000 100000 150000 200000 250000 300000
Re
sid
ue
(m
m/m
m)
Time (s)
4-element
6-element
8-element
a)
-0.00012
-0.0001
-0.00008
-0.00006
-0.00004
-0.00002
0
0.00002
0 50 100 150 200 250 300
Re
sid
ue
(m
m/m
m)
Time (s)
4-element
6-element
8-element
b)
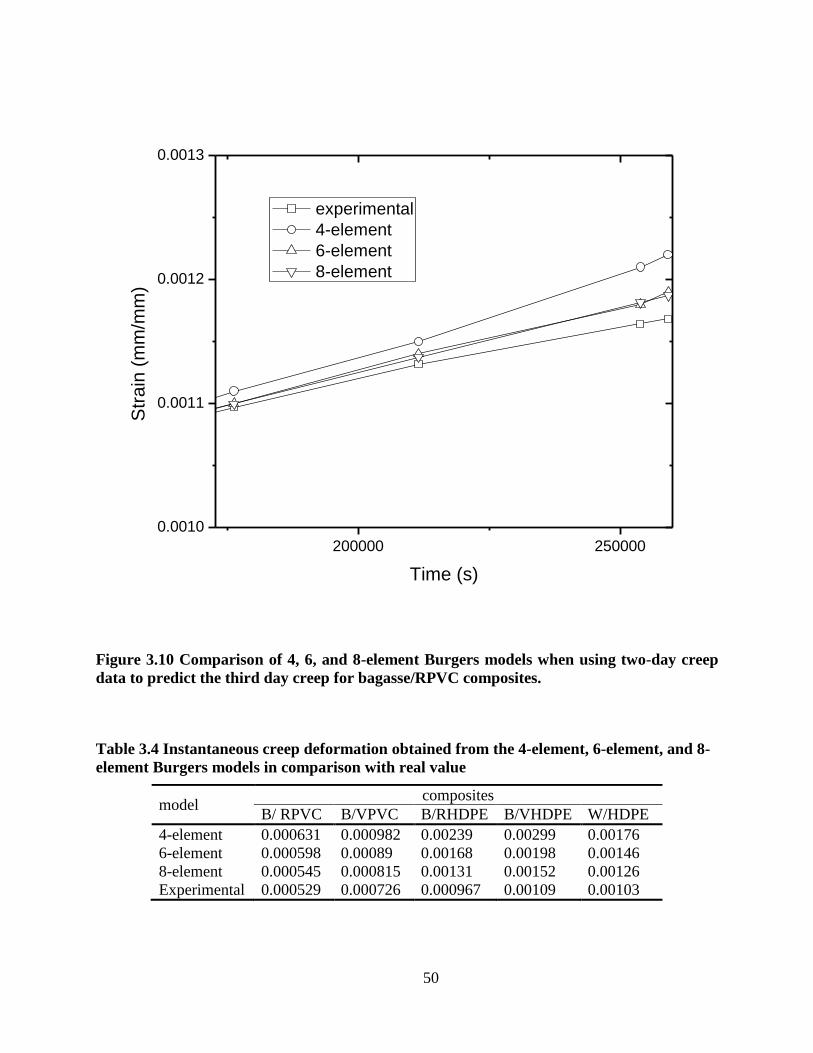
50
200000 250000
0.0010
0.0011
0.0012
0.0013
Str
ain
(m
m/m
m)
Time (s)
experimental
4-element
6-element
8-element
Figure 3.10 Comparison of 4, 6, and 8-element Burgers models when using two-day creep
data to predict the third day creep for bagasse/RPVC composites.
Table 3.4 Instantaneous creep deformation obtained from the 4-element, 6-element, and 8-
element Burgers models in comparison with real value
model composites
B/ RPVC B/VPVC B/RHDPE B/VHDPE W/HDPE
4-element 0.000631 0.000982 0.00239 0.00299 0.00176
6-element 0.000598 0.00089 0.00168 0.00198 0.00146
8-element 0.000545 0.000815 0.00131 0.00152 0.00126
Experimental 0.000529 0.000726 0.000967 0.00109 0.00103
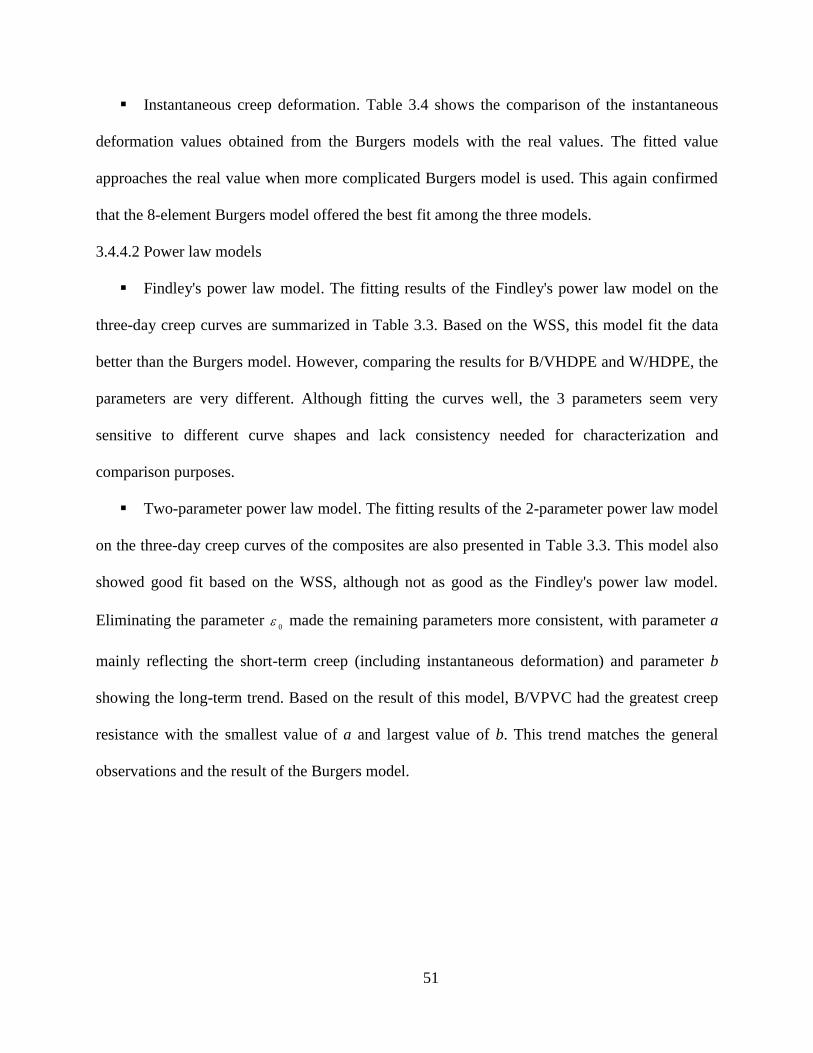
51
Instantaneous creep deformation. Table 3.4 shows the comparison of the instantaneous
deformation values obtained from the Burgers models with the real values. The fitted value
approaches the real value when more complicated Burgers model is used. This again confirmed
that the 8-element Burgers model offered the best fit among the three models.
3.4.4.2 Power law models
Findley's power law model. The fitting results of the Findley's power law model on the
three-day creep curves are summarized in Table 3.3. Based on the WSS, this model fit the data
better than the Burgers model. However, comparing the results for B/VHDPE and W/HDPE, the
parameters are very different. Although fitting the curves well, the 3 parameters seem very
sensitive to different curve shapes and lack consistency needed for characterization and
comparison purposes.
Two-parameter power law model. The fitting results of the 2-parameter power law model
on the three-day creep curves of the composites are also presented in Table 3.3. This model also
showed good fit based on the WSS, although not as good as the Findley's power law model.
Eliminating the parameter 0
made the remaining parameters more consistent, with parameter a
mainly reflecting the short-term creep (including instantaneous deformation) and parameter b
showing the long-term trend. Based on the result of this model, B/VPVC had the greatest creep
resistance with the smallest value of a and largest value of b. This trend matches the general
observations and the result of the Burgers model.
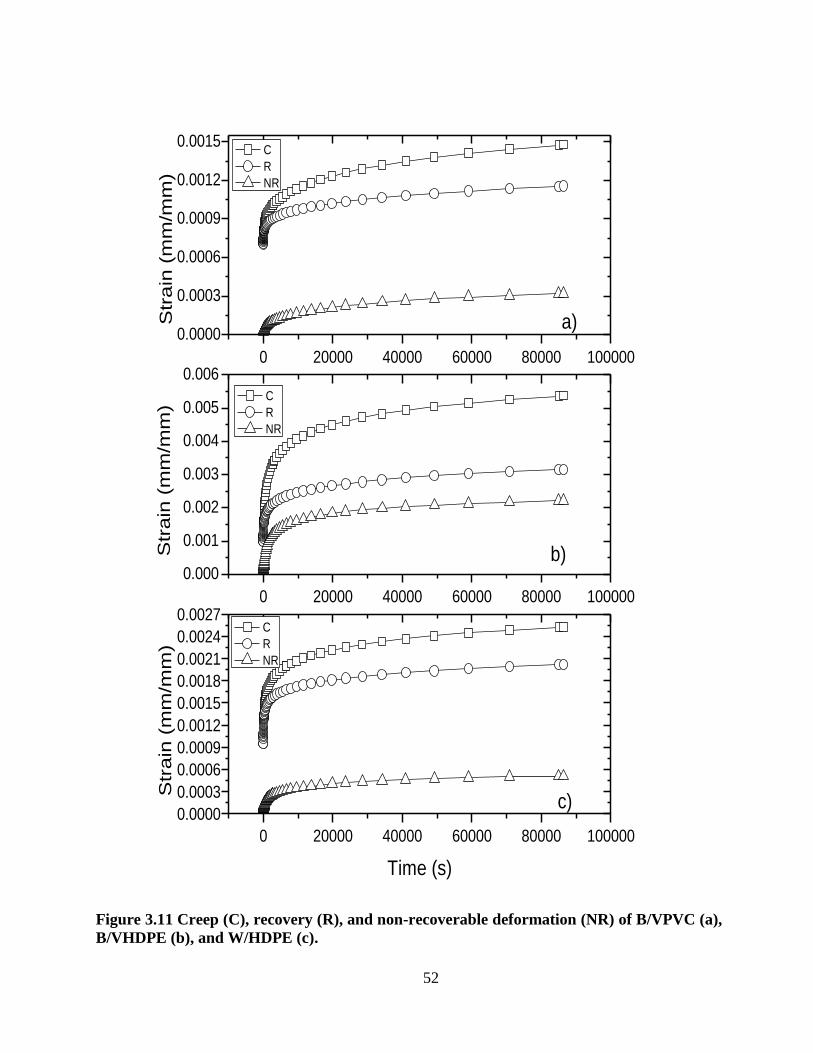
52
0 20000 40000 60000 80000 100000
0.0000
0.0003
0.0006
0.0009
0.0012
0.0015
0 20000 40000 60000 80000 100000
0.000
0.001
0.002
0.003
0.004
0.005
0.006
0 20000 40000 60000 80000 100000
0.0000
0.0003
0.0006
0.0009
0.0012
0.0015
0.0018
0.0021
0.0024
0.0027
Str
ain
(m
m/m
m)
C
R
NR
a)
Str
ain
(m
m/m
m)
C
R
NR
b)
C
R
NR
Str
ain
(m
m/m
m)
Time (s)
c)
Figure 3.11 Creep (C), recovery (R), and non-recoverable deformation (NR) of B/VPVC (a),
B/VHDPE (b), and W/HDPE (c).
53
3.4.5 Recovery Analysis
Figure 3.11 shows the curves for creep, recovery, and non-recoverable deformation of
the composites. As shown, the non-recoverable deformation started from 0, indicating that
instantaneous creep deformation was fully recovered. Based on the Burgers model, the dashpot
in the Maxwell unit creates the non-recoverable deformation, which is proportional to creep time.
However, the non-recoverable curves failed to follow a linear trend, suggesting that Burgers
model cannot be directly applied for recovery prediction.
Comparatively, B/VHDPE had more non-recoverable deformation than bagasse/VPVC
composite (B/VPVC) during the creep process. A possible explanation is that the high stiffness
of PVC molecules provides high inner force during creep deformation and the inner force drives
the recovery process. In HDPE composites, the flexibility of the HDPE molecules makes it easier
to release the inner force during creep process so that less deformation can be recovered. The
recoverability of creep deformation makes PVC composites more sustainable under
discontinuous forces.
3.5 CONCLUSIONS
The creep behaviors of bagasse/PVC (recycled and virgin) composites, bagasse/HDPE
(recycled and virgin) composites and a commercial wood/HDPE composite were investigated.
Temperature showed a large impact on creep behavior of all composites. B/PVC had better creep
resistance than B/HDPE at low temperature, but they showed higher temperature dependence.
The Burgers models were capable of fitting the creep data and characterize the overall trend, but
they failed to be used for prediction purpose. Comparatively, the more complicated 8-element
Burgers model offered better fit than the other two. It can be concluded that more Kelvin units in
the Burgers model can better describe the creep procedure for the composites. However, the
54
Burgers models are not directly applicable in recovery prediction. Comparatively, PVC
composites are more likely to recover than the HDPE composites. Findley's power law model
and 2-parameter power law model both fitted the creep data well, but the parameters in Findley's
power law model were very sensitive to curve shape. The Burgers model and 2-parameter power
law model yielded more consistent parameters between similar composites in three-day creep
tests, so the parameters can be used to characterize the creep behavior of the composites at long
time frames. The TTS principle was applied to these composites and smooth master curves were
obtained. The TTS better predicted long-term creep behavior from short term creep tests for the
PVC composites than the HDPE composites.
3.6 REFERENCES
Acha, B. A., M. M. Reboredo, and N. E. Marcovich. 2007. Creep and dynamic mechanical
behavior of PP-jute composites: Effect of the interfacial adhesion. Composites Part a-Applied
Science and Manufacturing 38:1507-1516.
Jiang, L., M. P. Wolcott, J. W. Zhang, and K. Englund. 2007. Flexural properties of surface
reinforced wood/plastic deck board. Polymer Engineering and Science 47:281-288.
Marcovich, N. E. and M. A. Villar. 2003. Thermal and mechanical characterization of linear low
density polyethylene/wood flour composites. Journal of Applied Polymer Science 90:2775-2784.
Nunez, A. J., N. E. Marcovich, and M. I. Aranguren. 2004. Analysis of the creep behavior of
polypropylene-woodflour composites. Polymer Engineering and Science 44:1594-1603.
Pandey, A., C. R. Soccol, P. Nigam, and V. T. Soccol. 2000. Biotechnological potential of agro-
industrial residues. I: sugarcane bagasse. Bioresource Technology 74:69-80.
Tajvidi, M., R. H. Falk, and J. C. Hermanson. 2005. Time-temperature superposition principle
applied to a kenaf-fiber/high-density polyethylene composite. Journal of Applied Polymer
Science 97:1995-2004.
Vazquez, A., V. A. Dominguez, and J. M. Kenny. 1999. Bagasse fiber-polypropylene based
composites. Journal of Thermoplastic Composite Materials 12:477-497.
Ward, I. M. 1971. Mechanical Properties of Solid Polymers. Wiley-interscience.
Yang, J. L., Z. Zhang, A. K. Schlarb, and K. Friedrich. 2006. On the characterization of tensile
creep resistance of polyamide 66 nanocomposites. Part II: Modeling and prediction of long-term
performance. Polymer 47:6745-6758.
55
CHAPTER 4 THE EFFECT OF COUPLING AGENTS AND BAMBOO FLOUR
LOADING ON CREEP PROPERTY OF HDPE-BASED COMPOSITES
4.1 INTRODUCTION
Wood/polymer composites (WPCs) are being widely used in construction because of
their natural appearance, sound mechanical properties, water resistance, and biodegradability.
However, the polarity difference between hydrophilic wood and hydrophobic polymer matrix
can lead to poor interfacial adhesion, and thus impair mechanical properties of final products. To
promote the interaction between them, various coupling agents or compatibilizers (mainly
functionalized polymers) have been used. The polymeric matrices used in WPCs are mainly
polyolefin, i.e., polyethylene (PE) and polypropylene (PP), due to of low processing temperature
that wood can sustain. Maleic anhydride-grafted PE or PP is commonly used as coupling agents
for WPCs due to their compatibility with both hydrophobic polyolefin matrix and hydrophilic
wood surfaces (Kazayawoko et al. 1997, Kazayawoko et al. 1999, Lai et al. 2003, Wang et al.
2003), leading to enhanced mechanical properties of the composites, such as flexural strength
and tensile strength. However, low impact strength is still a critical problem for the application
of WPCs and the toughening of this material has received much attention, mainly on polyolefin
elastomers (Oksman and Clemons 1998, Hristova et al. 2002, Wang et al. 2003, Sombatsompop
et al. 2005). To achieve superior overall mechanical properties, combinations of compatibilizers
and impact modifiers have been examined (Oksman and Clemons 1998, Sombatsompop et al.
2005).
Bamboo is an important renewable natural resource, especially in the tropics and the sub-
tropical areas, accounting for one quarter of the total biomass (Bansal and Zoolagud 2002). One
advantage of this biomass is its rapid renewability compared with wood. In addition, bamboo
56
shows good overall mechanical properties. These advantages make bamboo a good alternative
for wood in polymeric composites. Much work has been done in bamboo/polymer composites,
with the emphasis on bamboo’s reinforcing effect in polymer composites (Mi et al. 1997, Chen
et al. 1998, Thwe and Liao 2000, 2003, Ge et al. 2004, Okubo et al. 2004), but there was little
work on the coupling agents for the composites (Mi et al. 1997, Chen et al. 1998). In a previous
work (Liu et al. 2008), various coupling agents were used for bamboo/HDPE composite. Among
them, PE-g-MA was proven to be the most effective. In addition, two types of ethylene
propylene rubber-grafted-maleic anhydride (EPR-g-MA) were used as impact modifiers for the
bamboo/HDPE composites. It was found that semi-crystalline EPR-g-MA (sEPR-g-MA) showed
better toughening effect than the amorphous EPR-g-MA (aEPR-g-MA). Two combined
modifiers, PE-g-MA/sEPR-g-MA and PE-g-MA/aEPR-g-MA, were also examined and the
combined PE-g-MA/sEPR-g-MA modifier achieved optimum strength/toughness balance at low
percentage of sEPR-g-MA.
Creep behavior of WPC is critical for its application and the effect of coupling agents on
creep behavior of WPC has been investigated with different results reported (Sain et al. 2000,
Marcovich and Villar 2003, Nunez et al. 2003, Bledzki and Faruk 2004, Nunez et al. 2004, Acha
et al. 2007). The published research is limited on PP composites and the results failed to show
good agreement. In addition, no combined modifiers have been examined for their effect on
creep property of the NFPCs. The work described in this chapter focuses on the effect of both
individual and combined modifiers, and BF loading levels on the creep resistance of BF/HDPE
composites. The objectives of this research were to: 1) study the effect of coupling agents,
impact modifiers, combined modifiers, and BF loading rate on creep property of BF/HDPE
57
composites, 2) model the observed creep behavior of the composites, and 3) predict long-term
creep behaviors of the composites through modeling and time-temperature superposition (TTS).
4.2 EXPERIMENTAL
4.2.1 Materials and Blend Design
HDPE6761 from ExxonMobil Chemical Co. (Houston, TX) was used as polymer matrix
in this research. Coupling agent, PE-g-MA, is Epolene G2608 from Eastman Chemical Co.
(Kingsport, TN). The two impact modifiers are Exxelor VA 1801 (sEPR-g-MA) and Exxelor VA
1803 (aEPR-g-MA), both from ExxonMobil Chemical Co. (Houston, TX). Bamboo flour was
obtained by grinding bamboo flakes through a 28-mesh screen, and then oven-drying at 80°C for
2 days.
Experimental design included three parts. The first one included 10 blends with three
compatibilizers (PE-g-MA, sEPR-g-MA, and aEPR-g-MA), four loading rates (0, 2.9, 5.7 and
8.3wt% based on the total composite weight); and one HDPE/BF ratio (60/40 wt% ). The second
one consisted of nine blends covering two EPR-g-MAs (aEPR-g-MA, and sEPR-g-MA), five
PE-g-MA to EPR ratios (0, 33.3, 50.0, 66.7, and 100 wt%), and one HDPE/BF ratio (60/40
wt% ). The third one consisted of three blends with three HDPE/BF ratios (30, 40, and 50 wt%)
and one combined modifier (PE-g-MA/sEPR-g-MA=2:1 by weight at 15% of the BF weight).
4.2.2 Sample Preparation
Composite pellets were obtained through extrusion with an intermesh, counter-rotating
Brabender Intelli-Torque twin-screw extruder (Brabender Instruments Inc., Hackensack, NJ).
The temperature profile of barrels ranged from 150°C to 175°C with a screw speed at 30 rpm.
The pellets were oven-dried at 100°C for 12 hours before being made into standard mechanical
test specimens through injection molding (Batenfeld Plus 35, Batenfeld Inc, NJ) at 190°C
58
injection temperature and 68°C mold temperature. The impact test specimens with cross-section
size of 3 mm × 12 mm were machined for creep tests.
4.2.3 Creep Characterization
Two different tests were performed using a TA Q800 Dynamic Mechanical Analysis
(DMA) instrument (TA Instrument Inc., New Castle, DE) with a 3-point bending configuration.
In each test, the sample was heated to the desired temperature and allowed to equilibrate for 5
minutes prior to the test.
Thirty-minute creep tests were performed at temperatures of 35, 45, 55, 65, 75, 85, and
95°C. After equilibrating at the desired temperature, a stress of 2 MPa was applied and held
constant for 30 minutes while the creep strain was measured.
One-day creep tests were performed at a temperature of 35°C with a stress level of 2 MPa.
After 24 hours, the stress was released and the sample was allowed to recover for 24 hours.
4.2.4 Creep Modeling
Several models were discussed in Chapter 3 and it was found that a more complicated
Burgers model offered better fit of the data. Among them, the 8-element model fitted better than
the 4-element model and Findley’s power law model fitted the creep data better than the 2-
parameter power law model. However, Findley’s power law seemed not as stable as the 2-
parameter power law model and more Kelvin’s units in the generalized Burgers model made the
model complicated. In this chapter, the Burgers model was used to characterize the creep curves.
Two new models were developed by introducing power index to time t based on the 4-element
Burgers model. The first one, denoted as Partially-Indexed Burgers (PIB) model, has the index
only for the Kelvin unit, as shown in Eq. (4.1). The other one, denoted as Fully-Indexed Burgers
59
(FIB) model, has the index for both the Kelvin unit and the Maxwell unit, as shown in Eq. (4.2).
Since these models are not directly related to the physical models, they are simplified as follows:
tbtbbbtn
4321)]exp(1[)( (4.1)
nntbtbbbt
4321)]exp(1[)( (4.2)
Statistical Analysis System (SAS) was employed to estimate the model parameters by
performing nonlinear regression on the creep curves. The Gauss-Newton iterative method was
implemented in this analysis to find the least-square estimates for the nonlinear model. Since the
DMA instrument collected the data with an increasing step-size, every data point was weighted
with the time interval of data collection.
4.2.5 Time-Temperature Superposition (TTS)
TTS was also applied in this chapter to obtain the long term creep curves for different
composites. The details of TTS procedure were described in Chapter 3.
4.3 RESULTS AND DISCUSSION
4.3.1 Effect of Individual Modifier Type and Content
Figure 4.1(a) shows the one-day creep curves of the composites with different levels of
PE-g-MA modifier. As shown, the addition of PE-g-MA improved the creep resistance of
BF/HDPE composites, and different modifier loading levels led to different effects. The addition
of PE-g-MA up to 5.7% decreased creep strain of the composite by improving interfacial
adhesion between the fibers and the polymer matrix. However, further increase of PE-g-MA to
8.3% not only failed to offer better creep resistance, but also deteriorated it to the level obtained
with 2.7% PE-g-MA. This trend suggests that PE-g-MA played two roles in the composite: one
positive effect by improving interfacial adhesion between the fibers and the polymer matrix as
coupling agent, and one negative effect by softening HDPE matrix because of its relative low
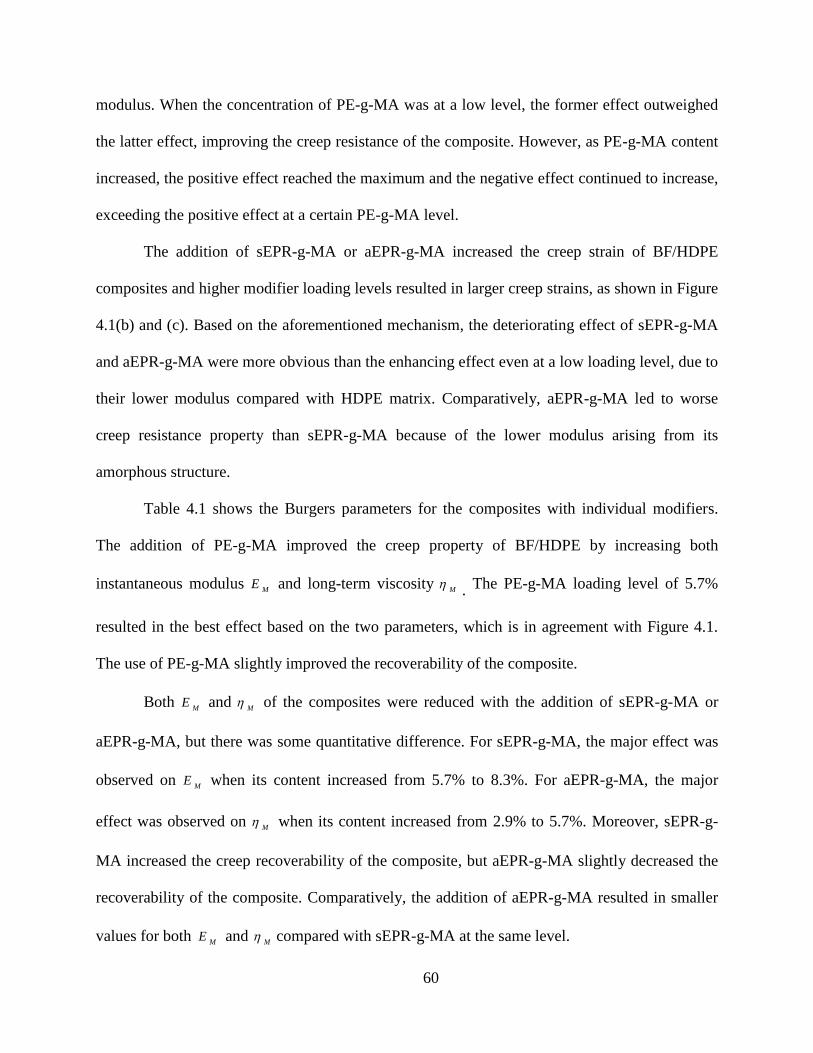
60
modulus. When the concentration of PE-g-MA was at a low level, the former effect outweighed
the latter effect, improving the creep resistance of the composite. However, as PE-g-MA content
increased, the positive effect reached the maximum and the negative effect continued to increase,
exceeding the positive effect at a certain PE-g-MA level.
The addition of sEPR-g-MA or aEPR-g-MA increased the creep strain of BF/HDPE
composites and higher modifier loading levels resulted in larger creep strains, as shown in Figure
4.1(b) and (c). Based on the aforementioned mechanism, the deteriorating effect of sEPR-g-MA
and aEPR-g-MA were more obvious than the enhancing effect even at a low loading level, due to
their lower modulus compared with HDPE matrix. Comparatively, aEPR-g-MA led to worse
creep resistance property than sEPR-g-MA because of the lower modulus arising from its
amorphous structure.
Table 4.1 shows the Burgers parameters for the composites with individual modifiers.
The addition of PE-g-MA improved the creep property of BF/HDPE by increasing both
instantaneous modulus M
E and long-term viscosity M
. The PE-g-MA loading level of 5.7%
resulted in the best effect based on the two parameters, which is in agreement with Figure 4.1.
The use of PE-g-MA slightly improved the recoverability of the composite.
Both M
E and M
of the composites were reduced with the addition of sEPR-g-MA or
aEPR-g-MA, but there was some quantitative difference. For sEPR-g-MA, the major effect was
observed on M
E when its content increased from 5.7% to 8.3%. For aEPR-g-MA, the major
effect was observed on M
when its content increased from 2.9% to 5.7%. Moreover, sEPR-g-
MA increased the creep recoverability of the composite, but aEPR-g-MA slightly decreased the
recoverability of the composite. Comparatively, the addition of aEPR-g-MA resulted in smaller
values for both M
E and M
compared with sEPR-g-MA at the same level.
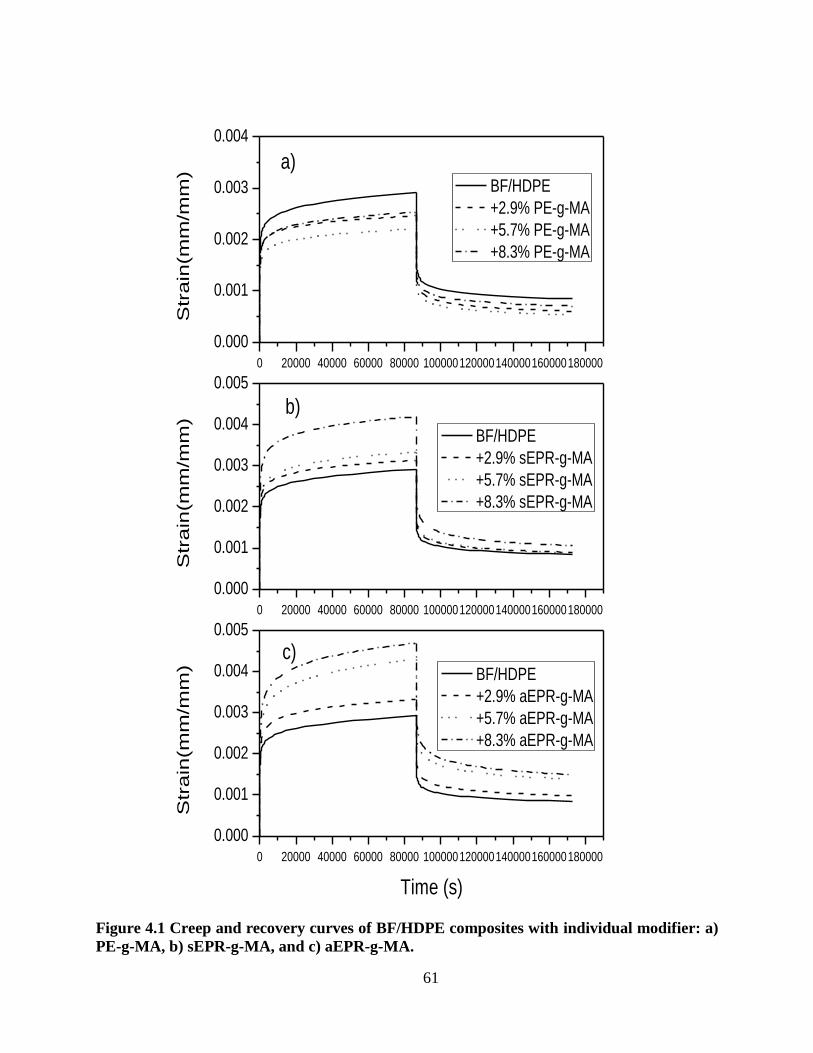
61
0 20000 40000 60000 80000 100000120000140000160000180000
0.000
0.001
0.002
0.003
0.004
0 20000 40000 60000 80000 100000120000140000160000180000
0.000
0.001
0.002
0.003
0.004
0.005
0 20000 40000 60000 80000 100000120000140000160000180000
0.000
0.001
0.002
0.003
0.004
0.005
Str
ain
(mm
/mm
) BF/HDPE
+2.9% PE-g-MA
+5.7% PE-g-MA
+8.3% PE-g-MA
a)S
tra
in(m
m/m
m)
BF/HDPE
+2.9% sEPR-g-MA
+5.7% sEPR-g-MA
+8.3% sEPR-g-MA
b)
Str
ain
(mm
/mm
)
Time (s)
BF/HDPE
+2.9% aEPR-g-MA
+5.7% aEPR-g-MA
+8.3% aEPR-g-MA
c)
Figure 4.1 Creep and recovery curves of BF/HDPE composites with individual modifier: a)
PE-g-MA, b) sEPR-g-MA, and c) aEPR-g-MA.
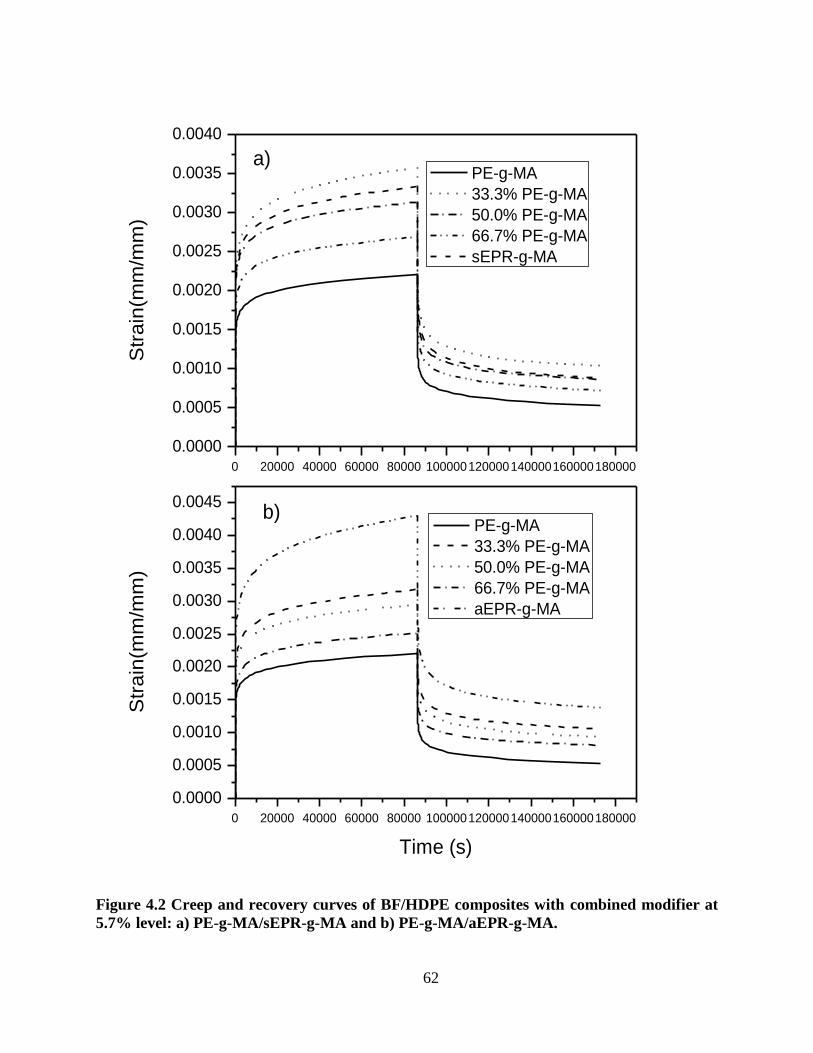
62
0 20000 40000 60000 80000 100000120000140000160000180000
0.0000
0.0005
0.0010
0.0015
0.0020
0.0025
0.0030
0.0035
0.0040
0 20000 40000 60000 80000 100000120000140000160000180000
0.0000
0.0005
0.0010
0.0015
0.0020
0.0025
0.0030
0.0035
0.0040
0.0045
Str
ain
(mm
/mm
)
PE-g-MA
33.3% PE-g-MA
50.0% PE-g-MA
66.7% PE-g-MA
sEPR-g-MA
a)S
tra
in(m
m/m
m)
Time (s)
PE-g-MA
33.3% PE-g-MA
50.0% PE-g-MA
66.7% PE-g-MA
aEPR-g-MA
b)
Figure 4.2 Creep and recovery curves of BF/HDPE composites with combined modifier at
5.7% level: a) PE-g-MA/sEPR-g-MA and b) PE-g-MA/aEPR-g-MA.
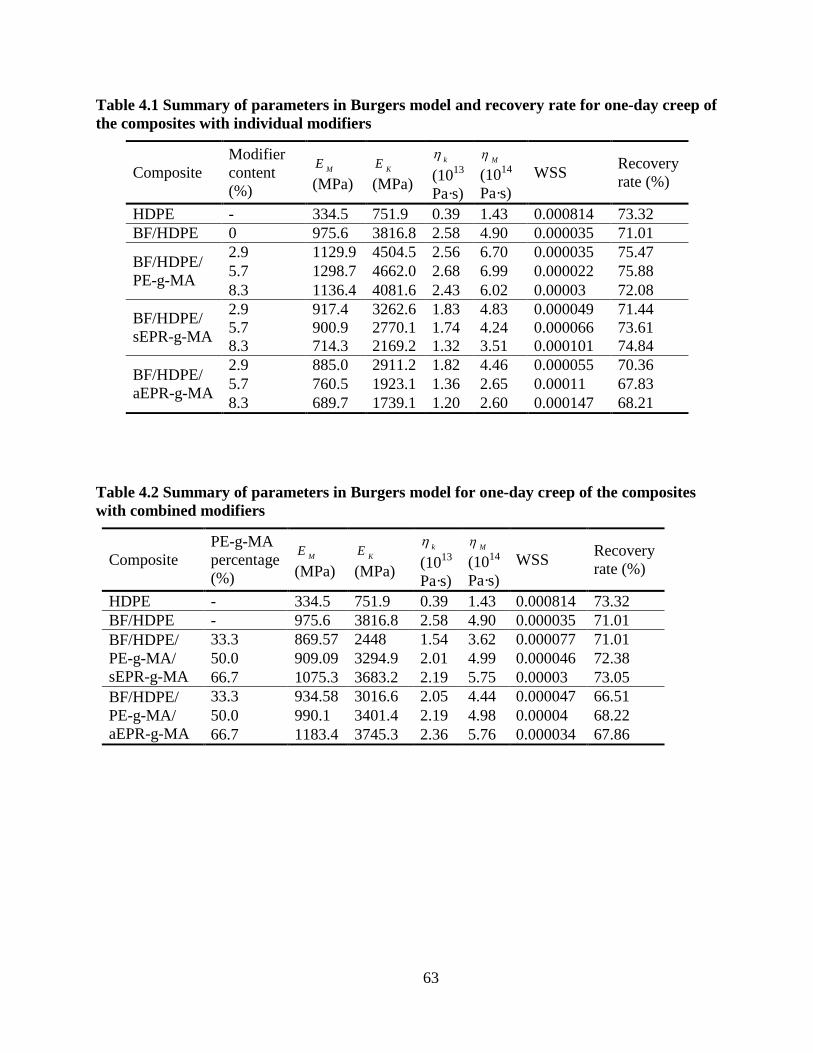
63
Table 4.1 Summary of parameters in Burgers model and recovery rate for one-day creep of
the composites with individual modifiers
Composite
Modifier
content
(%)
ME
(MPa) K
E
(MPa)
k
(1013
Pa·s)
M
(1014
Pa·s)
WSS Recovery
rate (%)
HDPE - 334.5 751.9 0.39 1.43 0.000814 73.32
BF/HDPE 0 975.6 3816.8 2.58 4.90 0.000035 71.01
BF/HDPE/
PE-g-MA
2.9 1129.9 4504.5 2.56 6.70 0.000035 75.47
5.7 1298.7 4662.0 2.68 6.99 0.000022 75.88
8.3 1136.4 4081.6 2.43 6.02 0.00003 72.08
BF/HDPE/
sEPR-g-MA
2.9 917.4 3262.6 1.83 4.83 0.000049 71.44
5.7 900.9 2770.1 1.74 4.24 0.000066 73.61
8.3 714.3 2169.2 1.32 3.51 0.000101 74.84
BF/HDPE/
aEPR-g-MA
2.9 885.0 2911.2 1.82 4.46 0.000055 70.36
5.7 760.5 1923.1 1.36 2.65 0.00011 67.83
8.3 689.7 1739.1 1.20 2.60 0.000147 68.21
Table 4.2 Summary of parameters in Burgers model for one-day creep of the composites
with combined modifiers
Composite
PE-g-MA
percentage
(%)
ME
(MPa) K
E
(MPa)
k
(10
13
Pa·s)
M
(1014
Pa·s)
WSS Recovery
rate (%)
HDPE - 334.5 751.9 0.39 1.43 0.000814 73.32
BF/HDPE - 975.6 3816.8 2.58 4.90 0.000035 71.01
BF/HDPE/
PE-g-MA/
sEPR-g-MA
33.3 869.57 2448 1.54 3.62 0.000077 71.01
50.0 909.09 3294.9 2.01 4.99 0.000046 72.38
66.7 1075.3 3683.2 2.19 5.75 0.00003 73.05
BF/HDPE/
PE-g-MA/
aEPR-g-MA
33.3 934.58 3016.6 2.05 4.44 0.000047 66.51
50.0 990.1 3401.4 2.19 4.98 0.00004 68.22
66.7 1183.4 3745.3 2.36 5.76 0.000034 67.86
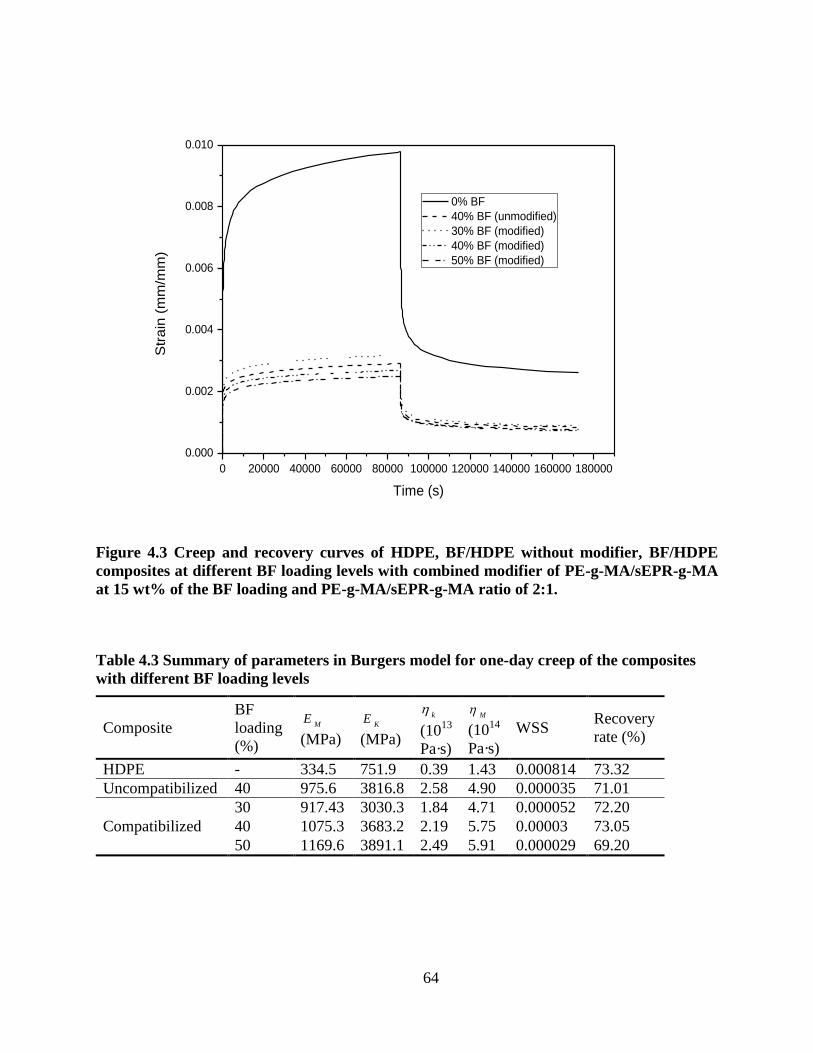
64
0 20000 40000 60000 80000 100000 120000 140000 160000 180000
0.000
0.002
0.004
0.006
0.008
0.010
Str
ain
(m
m/m
m)
Time (s)
0% BF
40% BF (unmodified)
30% BF (modified)
40% BF (modified)
50% BF (modified)
Figure 4.3 Creep and recovery curves of HDPE, BF/HDPE without modifier, BF/HDPE
composites at different BF loading levels with combined modifier of PE-g-MA/sEPR-g-MA
at 15 wt% of the BF loading and PE-g-MA/sEPR-g-MA ratio of 2:1.
Table 4.3 Summary of parameters in Burgers model for one-day creep of the composites
with different BF loading levels
Composite
BF
loading
(%)
ME
(MPa) K
E
(MPa)
k
(1013
Pa·s)
M
(1014
Pa·s)
WSS Recovery
rate (%)
HDPE - 334.5 751.9 0.39 1.43 0.000814 73.32
Uncompatibilized 40 975.6 3816.8 2.58 4.90 0.000035 71.01
Compatibilized
30 917.43 3030.3 1.84 4.71 0.000052 72.20
40 1075.3 3683.2 2.19 5.75 0.00003 73.05
50 1169.6 3891.1 2.49 5.91 0.000029 69.20

65
4.3.2 Effect of Combined Modifiers
The creep curves of the samples with 5.7% combined modifier of PE-g-MA/sEPR-g-MA
are shown in Figure 4.2(a). The smallest creep strain was observed for the sample with only PE-
g-MA. As the percentage of PE-g-MA was reduced, the creep strain increased gradually.
However, 5.7% combined modifier of PE-g-MA and sEPR-g-MA at 1:2 ratio resulted in larger
creep strain than either 5.7% of sEPR-g-MA or 5.7% PE-g-MA, suggesting that combined
modifiers may have a worse effect than either of its components presumably due to the
incompatibility between the two components.
Figure 4.2(b) shows the creep curves of the samples with 5.7% combined modifier of PE-
g-MA/aEPR-g-MA. Again, the smallest creep strain was observed for the sample with PE-g-MA
as the individual modifier. The creep strain increased as the percentage of PE-g-MA decreased in
the combined modifier. It should be noted that although aEPR-g-MA individually increased
creep strains of the samples more than sEPR-g-MA, it resulted in relatively better creep
resistance when being used together with PE-g-MA.
The Burgers parameters for the composites with the two combined modifiers are listed in
Table 4.2. As shown, the addition of the combined modifiers showed different effects on the
creep property of BF/HDPE with different PE-g-MA/EPR-g-MA ratios. Higher PE-g-MA
contents in the combined modifier resulted in larger M
E and M
. For PE-g-MA/sEPR-g-MA, a
positive effect on creep resistance was achieved at PE-g-MA/sEPR-g-MA ratio of 2:1. However,
for PE-g-MA/aEPR-g-MA, the enhancing effect was obtained at PE-g-MA/aEPR-g-MA ratio of
1:1 and higher.
Comparing PE-g-MA/sEPR-g-MA and PE-g-MA/aEPR-g-MA, the former had higher
values of all four Burgers parameters at PE-g-MA/EPR-g-MA ratio of 1:2. As the ratio increased,
66
the difference on M
became negligible. Again, the PE-g-MA/sEPR-g-MA combined modifier
improved the recoverability of the composite but the PE-g-MA/aEPR-g-MA combined modifier
decreased it.
4.3.3 Effect of BF Loading
Figure 4.3 shows the creep and recovery curves of HDPE, BF/HDPE without modifier,
BF/HDPE composites at different BF loading levels with combined modifier of PE-g-MA/sEPR-
g-MA at 15 wt% of the BF loading and PE-g-MA/sEPR-g-MA ratio of 2:1. The addition of BF
dramatically improved the creep resistance of HDPE due to its high modulus. With BF loading
increased from 30% to 50% at the presence of combined modifier, the creep strain of the
composite decreased. There was a clear trend that the increase of BF loading rate led to better
creep resistance of the composites. However, the recovery process was more complicated.
Although 50% BF loading resulted in smaller creep strain than 40% BF loading, it showed
slightly higher strain residual after a one-day recovery. Table 4.3 shows that the sample with 40%
BF loading had the highest recovery percentage. The recoverability of the samples failed to show
a clear trend with different BF loading levels.
4.3.4 Morphological Analysis on the Creep Mechanism of the Composites
Four additives were applied in the HDPE matrix in this study: BF, PE-g-MA, sEPR-g-
MA, and aEPR-g-MA, with their modulus in a decreasing order. With the observation and
discussion above, three roles of the additives on creep resistance of the composites can be
proposed to explain the experimental observations. The first is the volume effect, where the
additives reduced the relative volume of viscoelastic polymer matrix, which is prone to creep.
The second is the bridging effect, where the additives sustained part of the stress by connecting
to each other. The third is the blocking effect, where the additives interacted with the molecular
67
chains of polymer matrix and blocked them from moving under stress. BF alone showed
significant enhancing effect on the HDPE matrix by exhibiting the first two effects. Adding a
high percentage of the stiff BF largely decreased the relative volume of HDPE matrix, leaving
less material to creep under stress and improving the overall creep resistance of the composite.
Also, the high percentage of BF distributed in the HDPE matrix made part of them connected to
each other, so that the stress tended to be sustained by the high stiff additive network. Due to the
poor interfacial adhesion between BF and HDPE matrix, BF had little effect in stabilizing the
HDPE molecular chains movement.
Adding PE-g-MA into BF/HDPE composite increased the relative volume of the
polymeric material which tends to creep more. However, it improved the interfacial adhesion
between BF and HDPE matrix at the same time. The volume effect and blocking effect
introduced by PE-g-MA are contradictive and the overall effect varied as the PE-g-MA content
increased. The maximum blocking effect was achieved at a certain PE-g-MA level but the
volume effect kept increasing, resulting in optimum creep resistance at the 5.7% PE-g-MA level.
Addition of sEPR-g-MA or aEPR-g-MA had the similar effect, but the low moduli of the two
modifiers made its volume effect dominant over the blocking effect, leading to increased creep
strain even at low EPR-g-MA level.
The effect of combined modifier of PE-g-MA and EPR-g-MA was similar to the
individual modifier of EPR-g-MA, but more complicated due to the compatibility between the
two components. The addition of the combined modifier showed negative effect on creep
resistance of the composite because of its low modulus. The relatively higher creep resistance of
the composites modified with PE-g-MA/aEPR-g-MA might be obtained through a better
compatibility between the two components because of the amorphous structure of aPER-g-MA.
68
PE-g-MA is more compatible with HDPE matrix than EPR-g-MA. Combination of PE-g-MA
and aEPR-g-MA led to superior interfacial adhesion between BF and the HDPE matrix, so as to
enhance the blocking effect of BF on creep of the composites.
4.3.5 Indexed Burgers Models
As shown in Table 4.4, both PIB and FIB models (i.e., Equations 4.1 and 4.2) offered
better fit than the 4-element Burgers model based on WSS. This is because the power index for
time extended the functioning region of the units and made them more flexible. However, the
flexibility increased the variability of the parameters and made it hard to use them for
comparison purposes. To solve this problem, the index was fixed at a reasonable value both the
two Indexed Burgers Models. The parameters presented an order in agreement with Figure 4.1(a)
with fixed index value.
4.3.6 Creep Prediction
4.3.6.1 Prediction Through Modeling
The Burgers model parameters were used to characterize the creep curves and showed
good agreement with the curves. This modeling technique can only be used for characterization
purposes within the test period. Attempt to use the Burgers model for the prediction of long-term
creep behavior led to large error, as shown in Figure 4.4, in which the one-day creep was
predicted with the parameters obtained from the creep data for the first three hours.
The PIB model (i.e., Equation 4.1) offered much better prediction than the 4-element
Burgers model, but it still over-predicted the creep deformation. The FIB model (i.e., Equation
4.2) and the power law model performed better in terms of prediction. The one-day creep,
predicted with the parameters obtained from the first three hour data, showed good agreement
with the experimental curve, as shown in Figure 4.4.
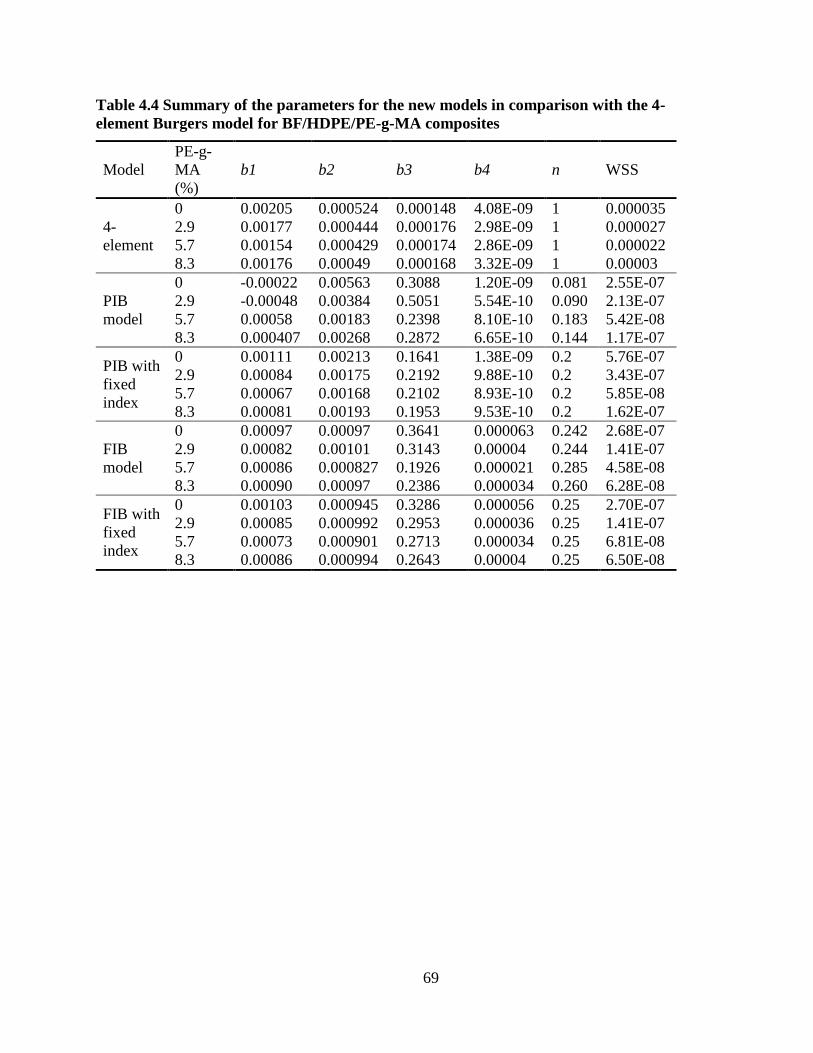
69
Table 4.4 Summary of the parameters for the new models in comparison with the 4-
element Burgers model for BF/HDPE/PE-g-MA composites
Model
PE-g-
MA
(%)
b1 b2 b3
b4 n WSS
4-
element
0 0.00205 0.000524 0.000148 4.08E-09 1 0.000035
2.9 0.00177 0.000444 0.000176 2.98E-09 1 0.000027
5.7 0.00154 0.000429 0.000174 2.86E-09 1 0.000022
8.3 0.00176 0.00049 0.000168 3.32E-09 1 0.00003
PIB
model
0 -0.00022 0.00563 0.3088 1.20E-09 0.081 2.55E-07
2.9 -0.00048 0.00384 0.5051 5.54E-10 0.090 2.13E-07
5.7 0.00058 0.00183 0.2398 8.10E-10 0.183 5.42E-08
8.3 0.000407 0.00268 0.2872 6.65E-10 0.144 1.17E-07
PIB with
fixed
index
0 0.00111 0.00213 0.1641 1.38E-09 0.2 5.76E-07
2.9 0.00084 0.00175 0.2192 9.88E-10 0.2 3.43E-07
5.7 0.00067 0.00168 0.2102 8.93E-10 0.2 5.85E-08
8.3 0.00081 0.00193 0.1953 9.53E-10 0.2 1.62E-07
FIB
model
0 0.00097 0.00097 0.3641 0.000063 0.242 2.68E-07
2.9 0.00082 0.00101 0.3143 0.00004 0.244 1.41E-07
5.7 0.00086 0.000827 0.1926 0.000021 0.285 4.58E-08
8.3 0.00090 0.00097 0.2386 0.000034 0.260 6.28E-08
FIB with
fixed
index
0 0.00103 0.000945 0.3286 0.000056 0.25 2.70E-07
2.9 0.00085 0.000992 0.2953 0.000036 0.25 1.41E-07
5.7 0.00073 0.000901 0.2713 0.000034 0.25 6.81E-08
8.3 0.00086 0.000994 0.2643 0.00004 0.25 6.50E-08
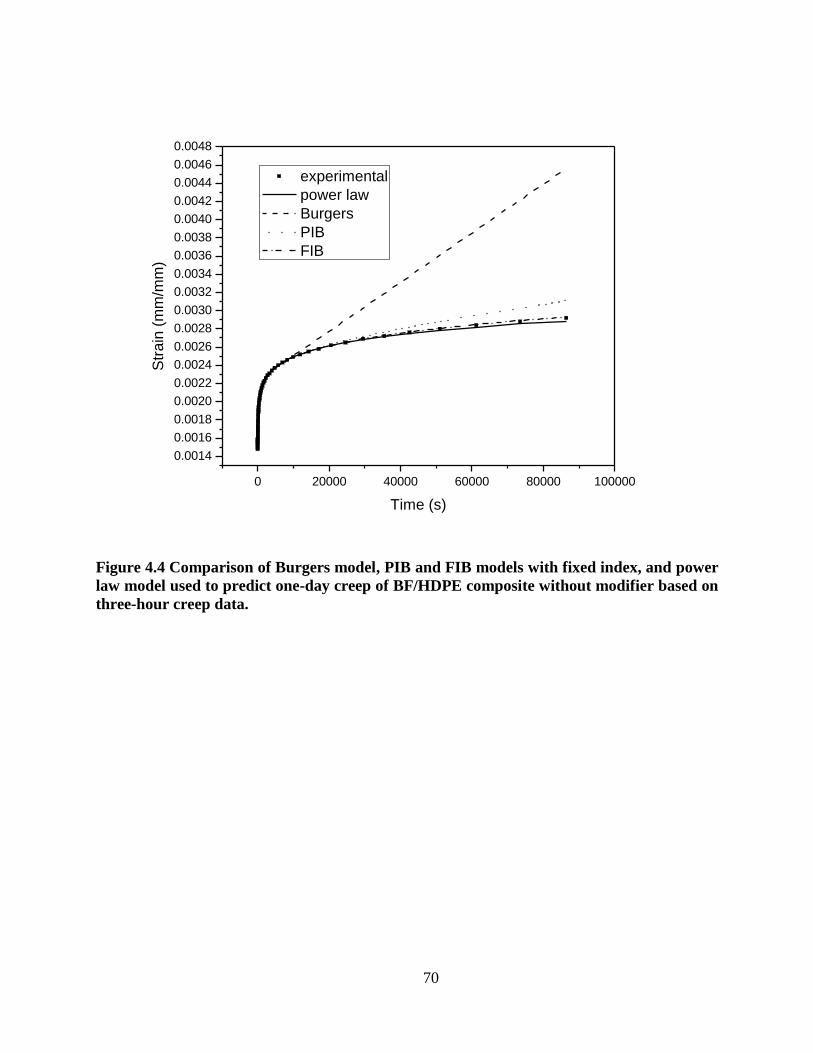
70
0 20000 40000 60000 80000 100000
0.0014
0.0016
0.0018
0.0020
0.0022
0.0024
0.0026
0.0028
0.0030
0.0032
0.0034
0.0036
0.0038
0.0040
0.0042
0.0044
0.0046
0.0048S
tra
in (
mm
/mm
)
Time (s)
experimental
power law
Burgers
PIB
FIB
Figure 4.4 Comparison of Burgers model, PIB and FIB models with fixed index, and power
law model used to predict one-day creep of BF/HDPE composite without modifier based on
three-hour creep data.
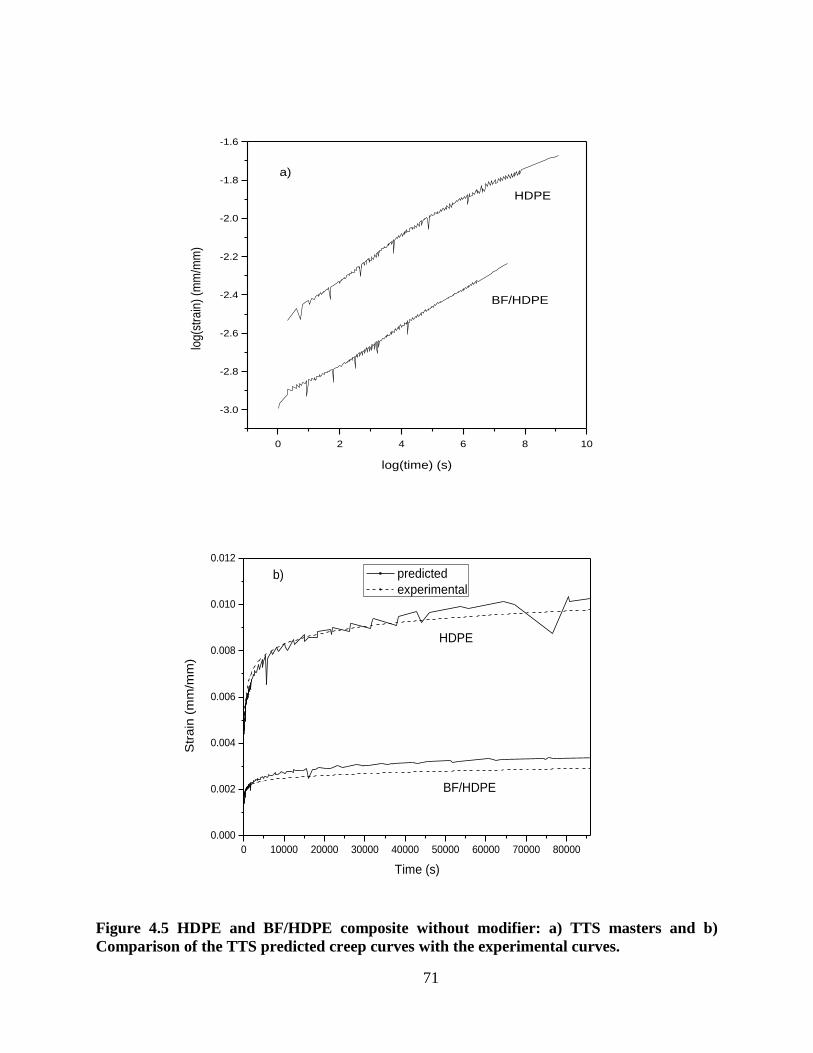
71
0 2 4 6 8 10
-3.0
-2.8
-2.6
-2.4
-2.2
-2.0
-1.8
-1.6
BF/HDPE
log
(str
ain
) (m
m/m
m)
log(time) (s)
HDPE
a)
0 10000 20000 30000 40000 50000 60000 70000 80000
0.000
0.002
0.004
0.006
0.008
0.010
0.012
Str
ain
(m
m/m
m)
Time (s)
predicted
experimental
HDPE
BF/HDPE
b)
Figure 4.5 HDPE and BF/HDPE composite without modifier: a) TTS masters and b)
Comparison of the TTS predicted creep curves with the experimental curves.
72
4.3.6.2 Prediction Through TTS
Smooth master curves were obtained through horizontal shifts of the short-term creep
curves in logarithmic scales. Typical curves can be seen in Figure 4.5(a). To verify these master
curves, they were transferred to regular time scale and compared with the long-term creep curves,
as shown in Figure 4.5(b). For pure HDPE, TTS prediction had a good agreement with the
experimental curve. However, TTS slightly over-predicted the creep strain of BF/HDPE
composite. The same trend was observed for the BF/HDPE composites with modifiers.
4.4 CONCLUSIONS
The creep behaviors of bamboo flour (BF)/HDPE composites were investigated to
examine the effect of coupling agents on creep property of the composites. The addition of PE-g-
MA enhanced the creep resistance of BF/HDPE composites at different loading levels and
achieved the optimum effect at the concentration of 5.7%. The incorporation of either sEPR-g-
MA or aEPR-g-MA decreased the creep resistance of BF/HDPE composites. Comparatively, the
composites with sEPR-g-MA showed better creep resistance than those with aEPR-g-MA.
However, when being combined with PE-g-MA, aEPR-g-MA resulted in better creep property
than sEPR-g-MA. In the combined modifiers, higher percentage of PE-g-MA led to better creep
resistance. Physical model (i.e., Burgers model) was able to characterize creep property of the
composites, but it was not applicable for long-term prediction purposes. Power index for time
was introduced to the 4-element burgers model and it was found that both PIB model and FIB
model can be applied for characterization/comparison purposes when the index was fixed. The
FIB model, as well as the power law model, offered better long-term prediction based on the
short-term data. Time-temperature superposition (TTS) produced smooth master curves through
73
horizontal shifts, but they slightly over-predicted the long-term creep for most of the BF/HDPE
composites.
4.5 REFERENCES
Acha, B. A., M. M. Reboredo, and N. E. Marcovich. 2007. Creep and dynamic mechanical
behavior of PP-jute composites: Effect of the interfacial adhesion. Composites Part a-Applied
Science and Manufacturing 38:1507-1516.
Bansal, A. K. and S. S. Zoolagud. 2002. Bamboo composites: Material of the future. Journal of
Bamboo and Rattan 1:119-130.
Bledzki, A. K. and O. Faruk. 2004. Creep and impact properties of wood fibre-polypropylene
composites: influence of temperature and moisture content. Composites Science and Technology
64:693-700.
Chen, X., Q. Guo, and Y. Mi. 1998. Bamboo fiber-reinforced polypropylene composites: A
study of the mechanical properties. Journal of Applied Polymer Science 69:1891-1899.
Ge, X. C., X. H. Li, and Y. Z. Meng. 2004. Tensile properties, morphology, and thermal
behavior of PVC composites containing pine flour and bamboo flour. Journal of Applied
Polymer Science 93:1804-1811.
Hristova, J., V. Valeva, and J. Ivanova. 2002. Aging and filler effects on the creep model
parameters of thermoset composites. Composites Science and Technology 62:1097-1103.
Kazayawoko, M., J. J. Balatinecz, and R. N. S. Sodhi. 1999. X-ray photoelectron spectroscopy of
maleated polypropylene treated wood fibers in a high-intensity thermokinetic mixer. Wood
Science and Technology 33:359-372.
Kazayawoko, M., J. J. Balatinecz, and R. T. Woodhams. 1997. Diffuse reflectance Fourier
transform infrared spectra of wood fibers treated with maleated polypropylenes. Journal of
Applied Polymer Science 66:1163-1173.
Lai, S.-M., F.-C. Yeh, Y. Wang, H.-C. Chan, and H.-F. Shen. 2003. Comparative study of
maleated polyolefins as compatibilizers for polyethylene/wood flour composites. Journal of
Applied Polymer Science 87:487-496.
Liu, H., Q. Wu, G. Han, F. Yao, Y. Kojima, and S. Suzuki. 2008. Compatibilizing and
toughening bamboo flour-filled HDPE composites: Mechanical properties and morphologies.
Composites Part A: Applied Science and Manufacturing 39:1891-1900.
Marcovich, N. E. and M. A. Villar. 2003. Thermal and mechanical characterization of linear low
density polyethylene/wood flour composites. Journal of Applied Polymer Science 90:2775-2784.
Mi, Y., X. Chen, and Q. Guo. 1997. Bamboo fiber-reinforced polypropylene composites:
Crystallization and interfacial morphology. Journal of Applied Polymer Science 64:1267-1273.
74
Nunez, A. J., N. E. Marcovich, and M. I. Aranguren. 2004. Analysis of the creep behavior of
polypropylene-woodflour composites. Polymer Engineering and Science 44:1594-1603.
Nunez, A. J., P. C. Sturm, J. M. Kenny, M. I. Aranguren, N. E. Marcovich, and M. M. Reboredo.
2003. Mechanical characterization of polypropylene-wood flour composites. Journal of Applied
Polymer Science 88:1420-1428.
Oksman, K. and C. Clemons. 1998. Mechanical properties and morphology of impact modified
polypropylene-wood flour composites. Journal of Applied Polymer Science 67:1503-1513.
Okubo, K., T. Fujii, and Y. Yamamoto. 2004. Development of bamboo-based polymer
composites and their mechanical properties. Composites Part A: Applied Science and
Manufacturing 35:377-383.
Sain, M. M., J. Balatinecz, and S. Law. 2000. Creep fatigue in engineered wood fiber and plastic
compositions. Journal of Applied Polymer Science 77:260-268.
Sombatsompop, N., C. Yotinwattanakumtorn, and C. Thongpin. 2005. Influence of type and
concentration of maleic anhydride grafted polypropylene and impact modifiers on mechanical
properties of PP/wood sawdust composites. Journal of Applied Polymer Science 97:475-484.
Thwe, M. M. and K. Liao. 2000. Characterization of bamboo-glass fiber reinforced polymer
matrix hybrid composite. Journal of Materials Science Letters 19:1873-1876.
Thwe, M. M. and K. Liao. 2003. Durability of bamboo-glass fiber reinforced polymer matrix
hybrid composites. Composites Science and Technology 63:375-387.
Wang, Y., F.-C. Yeh, S.-M. Lai, H.-C. Chan, and H.-F. Shen. 2003. Effectiveness of
functionalized polyolefins as compatibilizers for polyethylene/wood flour composites. Polymer
Engineering & Science 43:933-945.
75
CHAPTER 5 CREEP BEHAVIOR OF COMPOSITES ENHANCED WITH
ENGINEERING PLASTIC MICROFIBRILS
5.1 INTRODUCTION
Wood plastic composites (WPCs) have been mainly based on polyolefin (i.e., PE and PP)
and PVC resins due to the poor thermal stability of wood fibers. The properties of these
composites are often not sufficient for structural applications. Different ways have been
attempted to enhance the properties of WPCs. For example, structural WPCs with high flexural
toughness were made through cross-linking (Bengtsson et al. 2007). However, these kinds of
products are not easily recyclable and lose one of the main advantages of WPCs. Engineering
plastics were used as polymer matrices for WPCs in order to obtain better mechanical properties
(Klason et al. 1984), but high processing temperatures needed for engineering plastics caused
thermal degradation for the cellulose fibers (Caufield et al. 2001).
By incorporating microfibrils of high-melting temperature engineering plastics into low-
melting thermoplastic matrices, new kinds of polymer blends, known as microfibrillar
composites (MFCs), were obtained (Fakirov et al. 1993, Friedrich et al. 2005). With better
mechanical properties than the single-phase thermoplastic matrix and the same processing
temperature, this blend offers a good choice as the matrix for WPCs. Some work was done on
the application of MFCs in WPCs but no examination on their creep properties was reported (Lei
et al. 2009b). Due to the common existence of stress in structural building products, creep
resistance is essential to the application of this new product aimed for structural applications.
Previous creep research on WPCs were focused on the effect of wood flour, including
loading levels and wood flour treatment (Sain et al. 2000, Nunez et al. 2004), and additives, such
as coupling agents (Bledzki and Faruk 2004, Nunez et al. 2004), on creep resistance of WPCs.
76
Modeling techniques have been applied to analyze and evaluate the creep behavior of the
composites (Marcovich and Villar 2003, Nunez et al. 2004). Time-temperature superposition
(TTS) has also been tried to predict long-term creep deformation of NFPCs from the accelerated
tests at higher temperature levels (Nunez et al. 2004). However, little research has been done on
enhancing the creep resistance of WPCs through the modification of polymer matrix.
In this research, wood flour was successfully mixed into two pre-mixed MFCs, i.e., high
density polyethylene (HDPE)/polyamide 6 (PA6) blend and HDPE/ polyethylene terephthalate
(PET) blend, under the processing temperature of HDPE (Lei et al. 2009a, Liu et al. 2009). The
creep properties of these WPCs were investigated and analyzed. The objective of this study was
to evaluate the effect of engineering plastic microfibrils on polymer and WPC in terms of creep
resistance.
5.2. EXPERIMENTAL
5.2.1 Materials
5.2.1.1 HDPE/PA6 System
The HDPE was HD6706.17 from Exxon-Mobil Chemical Co, with a melt flow index of
6.1 g/10min (190 oC, 2.16 kg) and a density of 0.952 g/cm
3. An injection-molding grade PA6
(Aegis H8202NLB) was provided by Honeywell Co., with a density of 1.13 g/cm3 and a melting
temperature (Tm) of 220 oC. A maleated polyethylene (PE-g-MA) (Fusabond MB100D) was
supplied by Dupont Co., with a MA grafting ratio of about 1 wt% and a melt flow index of 2
g/10min (190 oC, 2.16 kg). Wood flour (WF) was provided by American Wood Fibers Inc.
(Madison, MI), with a 40-mesh particle size. Both PA6 and WF were dried at 90 oC for 24 hours
in an oven prior to use.
77
5.2.1.2 HDPE/PET System
The PET pellets were provided by Avangard Industries, Ltd. (Houston, TX) with a
melting peak temperature of 237.6ºC (10 ºC/min) and a density of 1.33 kg/m3. HDPE (HGB-
0760) pellets were from Channel Prime Alliance (Des Moines, IA), with a density of 960 kg/m3
and a melt index of 0.70 g/10min (190ºC). An ethylene-glycidyl methacrylate copolymer (E-
GMA) (LOTADER®AX 8840) was provided by Arkema Inc. (Philadelphia, PA), with a melt
index of 5 g/10min (190°C, 2.16 kg) and a glycidyl methacrylate content of 8%. A PE-g-MA (G-
2608) was purchased from Eastman Chemical Company (Kingsport, TN), with a melt index of 8
g/10min (190°C, 2.16 kg) and an acid number of 8 mg KOH/g. WF was from American Wood
Fiber Co. (Madison, MI), with a 40-mesh particle size.
5.2.2 Preparation of the Composites
5.2.2.1 HDPE/PA6 System
HDPE, PA6 and PE-g-MA were fed in an intermesh, counter-rotating Brabender twin-
screw extruder (Brabender Instruments Inc., Hackensack, NJ) with a weight ratio of 70/30/3. The
extruding speed was 40 rpm and the extruding temperature was between 220 - 235oC to melt
PA6 during extrusion. The extruded strands passed through a water bath before being drawn and
cut into pellets with a diameter of around 1 mm.
The HDPE/PA6 pellets were then extruded to make WPC with WF and PE-g-MA at a
weight ratio of 70/30/1.1, an extruding speed of 40 rpm and a temperature profile between 170 -
175oC. As a comparison, a composite with pure HDPE, WF and PE-g-MA was also extruded
into WPC with the same weight ration and processing condition.
Standard mechanical test samples were prepared through injection molding on Battenfeld
Plus 35 (Battenfeld of American Inc. South Elgin, IL) at 190 oC with four formulations: pure
78
HDPE, HDPE/PA6 composite, HDPE/WF composite, and HDPE/PA6/WF composite. The
impact test specimens with cross-section size of around 3 mm × 12 mm were further machined
for creep tests.
5.2.2.2 HDPE/PET System
HDPE and PET at a weight ratio of 75/25 were first extruded through a co-rotating twin
screw extruder MIC27/GL-400 (Leistritz Corporation, Allendale, NJ) with a screw
length/diameter of 40:1. The extrusion temperature was between 260 - 270ºC to melt PET and
the screw rotating speed was fixed at 150 rpm. The extruded strands were directly stretched with
a PV212 Puller (Al-Be Industries, Inc, Paramount, CA) without passing the water bath, and then
further stretched and pelletized with a BT 25 Strand Pelletizer (Scheer Bay Co., Bay City, MI).
E-GMA at 2.5 % of the total weight of PET/HDPE was used as compatibilizer for PET and
HDPE.
The MFC pellets were then melt blended with dried wood flour on the same extruder
with extrusion temperatures between 180 - 190ºC. Wood flour was fed by a side stuffer; the fiber
to plastic weight ratio was 40/60. The loading level of PE-g-MA was 1% based on the total
weight of dry wood flour and plastic matrix. The extrudates were cut into pellets after cooling in
a water bath and were dried before injection molding.
The test samples for mechanical properties were made through injection molding, using a
PLUS 35 injection molding machinese from Battenfeld of American Inc. (South Elgin, IL). The
WPC pellets were injection molded at 190ºC with a mold temperature of 85ºC. The impact test
specimens with cross-section size of around 3 mm × 12 mm were further machined for creep
tests.
79
5.2.3 Characterization
TA Q800 Dynamic Mechanical Analysis (DMA) instrument (New Castle, DE) was used
for short-term creep tests with a 3-point bending mode. The test samples with approximate cross-
section size of 3 12 mm were used for creep tests. In each test, the sample was heated to 35°C
and allowed to equilibrate for 5 minutes. A static stress level of 4 MPa was then applied for 12
hours, and the stress was released afterward to allow the sample to recover for 12 hours. The
sample deformation was measured during this process.
Accelerated creep tests were performed for 30 minutes at temperature levels starting at
35°C and increasing 10°C at a time up to 95°C. After equilibrating at the desired temperature for
5 minutes, 4 MPa of stress was applied and held constant for 30 minutes while the creep strain
was measured.
Morphological observations were done for the injection-molding samples using a Hitachi
S-3600N VP SEM (Hitaschi, Japan) as described by Lei et al. and Liu et al.(Lei et al. 2009a, Liu
et al. 2009).
5.2.4 Creep Modeling
The four-element Burgers model was used to fit the creep curves.
tE
tEE
t
MK
K
KM
)]exp(1[)( (5.1)
where (t) is the creep strain as a function of time (t) and is the applied stress; EM and
EK represent elastic moduli of the springs in this model; M and K represent viscosities of the
dashpots.
Statistical Analysis System (SAS) was employed to estimate the model parameters by
performing nonlinear regression on the creep curves. The Gauss-Newton iterative method was
implemented in this analysis to find the least-square estimates for the nonlinear model. Since the
80
DMA instrument collected the data with an increasing step-size, every data point was weighted
with the time interval of data collection.
5.2.5 Time-Temperature Superposition (TTS)
TTS was also applied to obtain the long term creep curves based on the accelerated
testing data for different composites, as introduced in Chapter 3.
5.3 RESULTS AND DISCUSSION
5.3.1 HDPE/PA6 Composites
As shown in Figure 5.1, both the addition of 30 % WF and the introduction of 30% PA6
remarkably reduced the creep response of the HDPE matrix. In the discussion shown in Chapter
4, it was proposed that the additives played three roles on creep resistance of the composites:
reducing the volume of polymer matrix (volume effect), connecting to each other to sustain part
of the stress (bridging effect), and reducing the mobility of polymer molecule chains by blocking
them from moving under stress (blocking effect). As shown in Figure 5.2, PA6 microfibrils were
successfully obtained during the stretching process and the diameter of the microfibrils is around
2 µm (Liu et al. 2009). These microfibrils were entangled into a three dimensional network
which provided good bridging effect during the creep process. Comparatively, HDPE/WF
composite had better creep resistance than HDPE/PA6 composite. Besides the property
differences between WF and PA6, one possible reason is that the low density of WF led to higher
volume percentage than PA6 at the same weight percentage, resulting in more volume effect and
bridging effect. Introducing PA6 microfibrils further decreased the creep of the HDPE/WF
composite, but this improvement was less pronounced in the HDPE/PA6/WF composite than in
the HDPE/PA6 composite. This phenomenon suggests that 30% WF played a dominant role in
creep resistance enhancement of HDPE/PA6/WF composite.
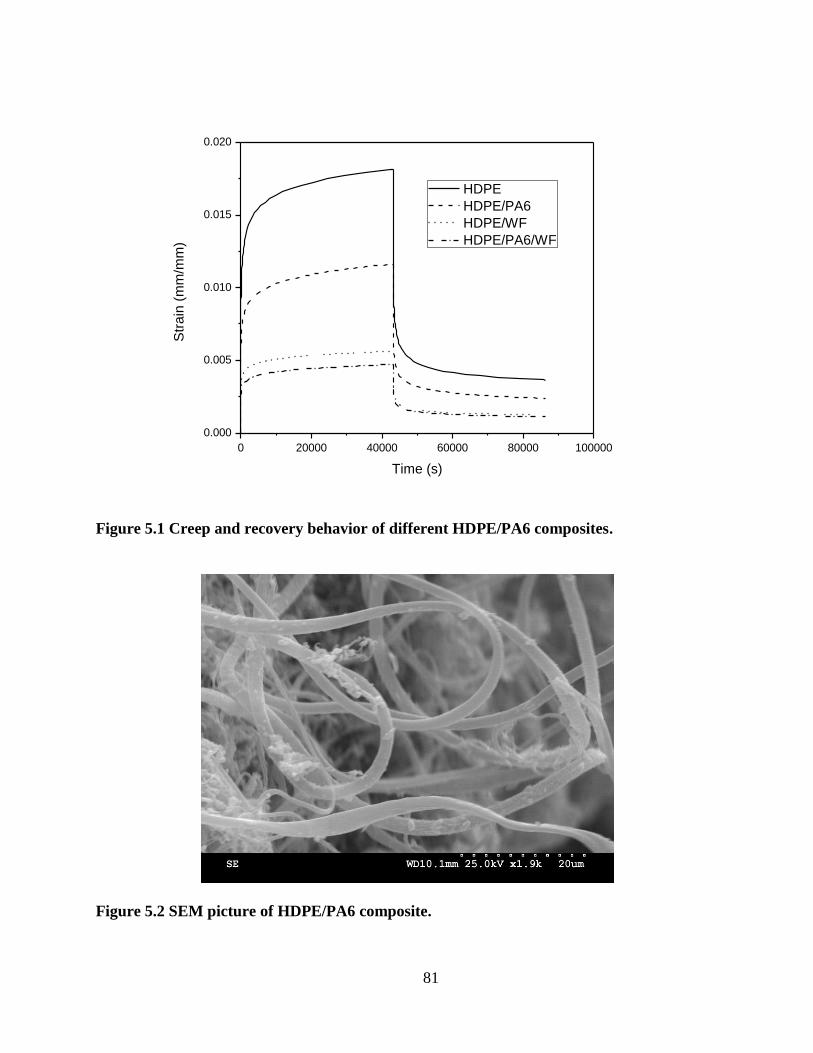
81
0 20000 40000 60000 80000 100000
0.000
0.005
0.010
0.015
0.020
Str
ain
(m
m/m
m)
Time (s)
HDPE
HDPE/PA6
HDPE/WF
HDPE/PA6/WF
Figure 5.1 Creep and recovery behavior of different HDPE/PA6 composites.
Figure 5.2 SEM picture of HDPE/PA6 composite.
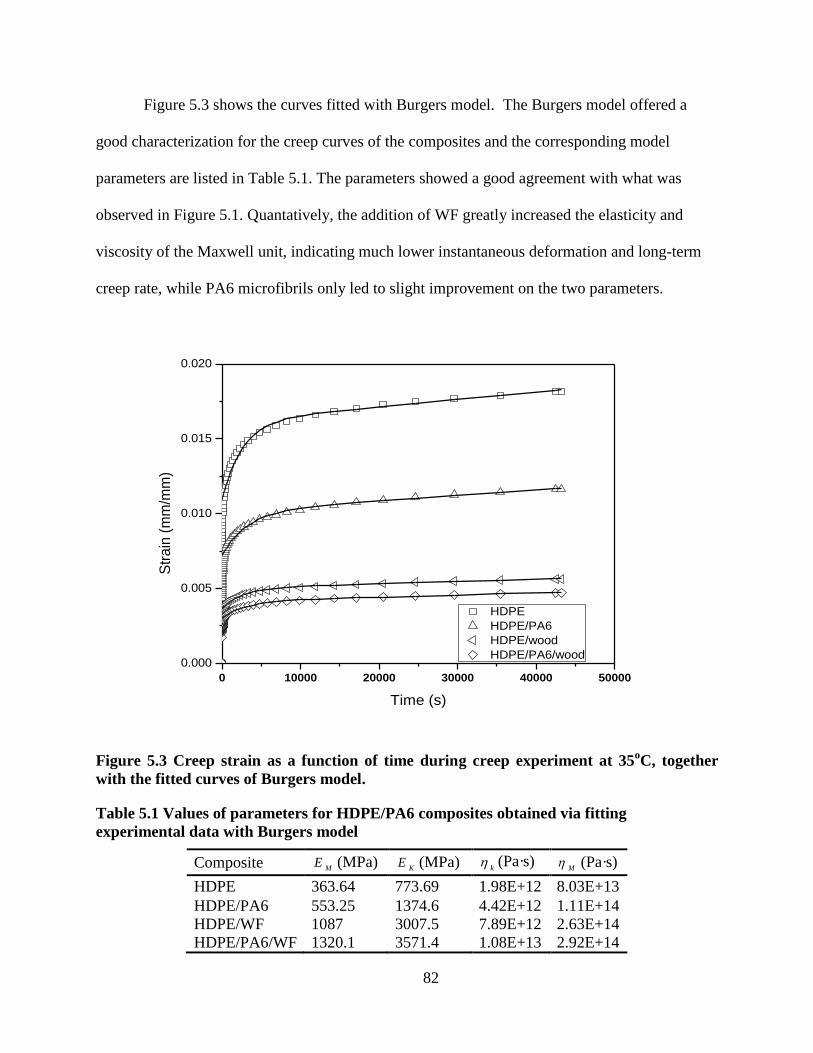
82
Figure 5.3 shows the curves fitted with Burgers model. The Burgers model offered a
good characterization for the creep curves of the composites and the corresponding model
parameters are listed in Table 5.1. The parameters showed a good agreement with what was
observed in Figure 5.1. Quantatively, the addition of WF greatly increased the elasticity and
viscosity of the Maxwell unit, indicating much lower instantaneous deformation and long-term
creep rate, while PA6 microfibrils only led to slight improvement on the two parameters.
0 10000 20000 30000 40000 50000
0.000
0.005
0.010
0.015
0.020
Str
ain
(m
m/m
m)
Time (s)
HDPE
HDPE/PA6
HDPE/wood
HDPE/PA6/wood
Figure 5.3 Creep strain as a function of time during creep experiment at 35oC, together
with the fitted curves of Burgers model.
Table 5.1 Values of parameters for HDPE/PA6 composites obtained via fitting
experimental data with Burgers model
Composite ME (MPa)
KE (MPa) k
(Pa·s) M
(Pa·s)
HDPE 363.64 773.69 1.98E+12 8.03E+13
HDPE/PA6 553.25 1374.6 4.42E+12 1.11E+14
HDPE/WF 1087 3007.5 7.89E+12 2.63E+14
HDPE/PA6/WF 1320.1 3571.4 1.08E+13 2.92E+14
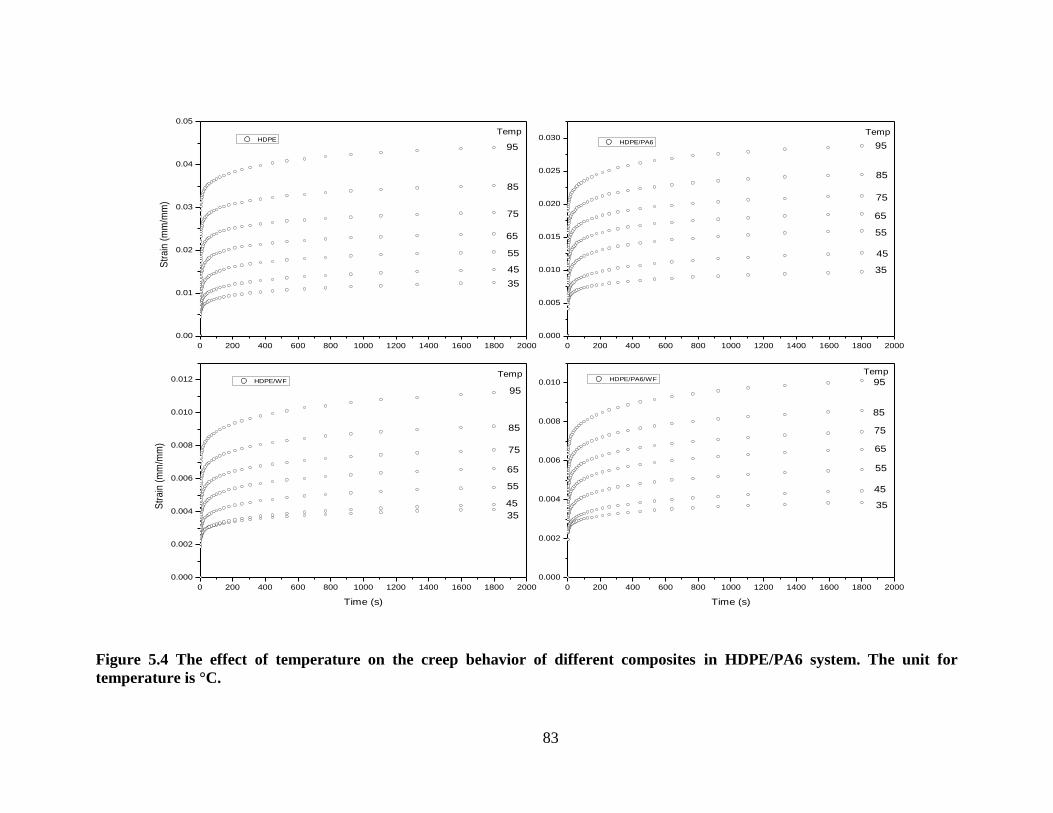
83
0 200 400 600 800 1000 1200 1400 1600 1800 2000
0.00
0.01
0.02
0.03
0.04
0.05
0 200 400 600 800 1000 1200 1400 1600 1800 2000
0.000
0.005
0.010
0.015
0.020
0.025
0.030
0 200 400 600 800 1000 1200 1400 1600 1800 2000
0.000
0.002
0.004
0.006
0.008
0.010
0.012
0 200 400 600 800 1000 1200 1400 1600 1800 2000
0.000
0.002
0.004
0.006
0.008
0.010
HDPE
Str
ain
(m
m/m
m)
35
45
55
65
75
85
95
Temp Temp
95
85
75
65
55
45
HDPE/PA6
35
Temp
95
35
45
55
65
75
85
HDPE/WF
Str
ain
(m
m/m
m)
Time (s)
Temp
35
45
75
85
95
65
55
HDPE/PA6/WF
Time (s)
Figure 5.4 The effect of temperature on the creep behavior of different composites in HDPE/PA6 system. The unit for
temperature is °C.
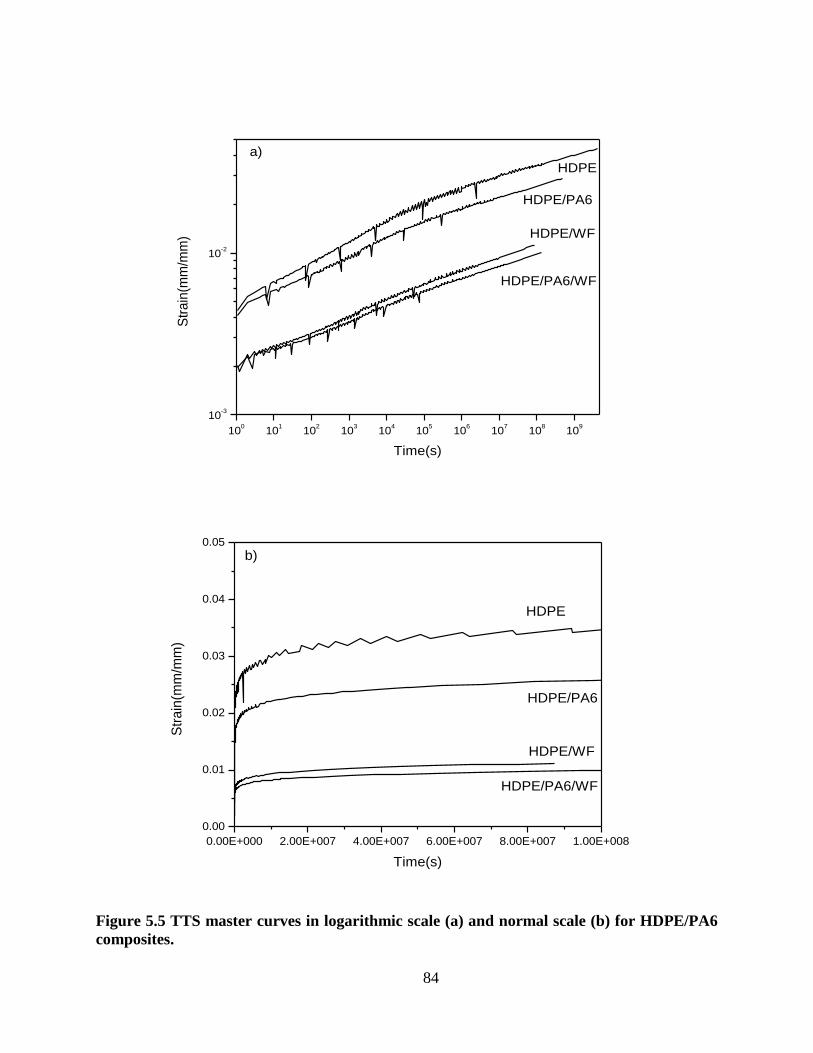
84
100
101
102
103
104
105
106
107
108
109
10-3
10-2
Str
ain
(mm
/mm
)
Time(s)
HDPE
HDPE/PA6
HDPE/WF
HDPE/PA6/WF
a)
0.00E+000 2.00E+007 4.00E+007 6.00E+007 8.00E+007 1.00E+008
0.00
0.01
0.02
0.03
0.04
0.05
Str
ain
(mm
/mm
)
Time(s)
HDPE
HDPE/PA6
HDPE/WF
HDPE/PA6/WF
b)
Figure 5.5 TTS master curves in logarithmic scale (a) and normal scale (b) for HDPE/PA6
composites.
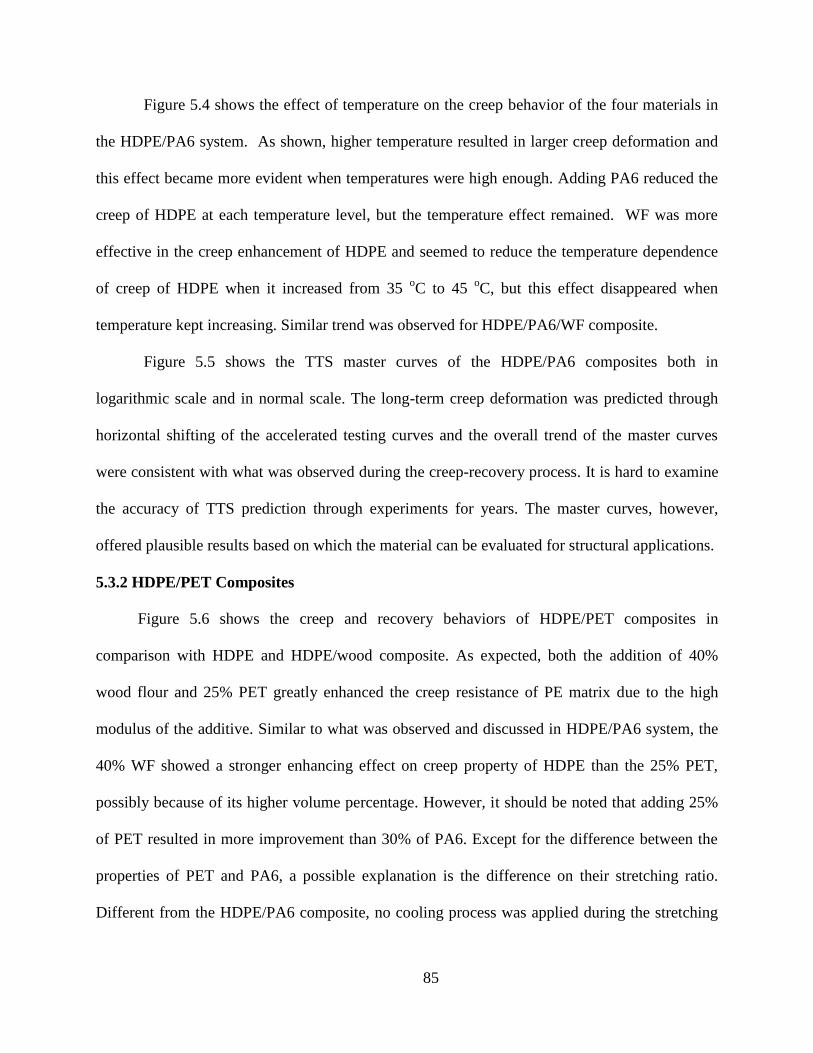
85
Figure 5.4 shows the effect of temperature on the creep behavior of the four materials in
the HDPE/PA6 system. As shown, higher temperature resulted in larger creep deformation and
this effect became more evident when temperatures were high enough. Adding PA6 reduced the
creep of HDPE at each temperature level, but the temperature effect remained. WF was more
effective in the creep enhancement of HDPE and seemed to reduce the temperature dependence
of creep of HDPE when it increased from 35 oC to 45
oC, but this effect disappeared when
temperature kept increasing. Similar trend was observed for HDPE/PA6/WF composite.
Figure 5.5 shows the TTS master curves of the HDPE/PA6 composites both in
logarithmic scale and in normal scale. The long-term creep deformation was predicted through
horizontal shifting of the accelerated testing curves and the overall trend of the master curves
were consistent with what was observed during the creep-recovery process. It is hard to examine
the accuracy of TTS prediction through experiments for years. The master curves, however,
offered plausible results based on which the material can be evaluated for structural applications.
5.3.2 HDPE/PET Composites
Figure 5.6 shows the creep and recovery behaviors of HDPE/PET composites in
comparison with HDPE and HDPE/wood composite. As expected, both the addition of 40%
wood flour and 25% PET greatly enhanced the creep resistance of PE matrix due to the high
modulus of the additive. Similar to what was observed and discussed in HDPE/PA6 system, the
40% WF showed a stronger enhancing effect on creep property of HDPE than the 25% PET,
possibly because of its higher volume percentage. However, it should be noted that adding 25%
of PET resulted in more improvement than 30% of PA6. Except for the difference between the
properties of PET and PA6, a possible explanation is the difference on their stretching ratio.
Different from the HDPE/PA6 composite, no cooling process was applied during the stretching
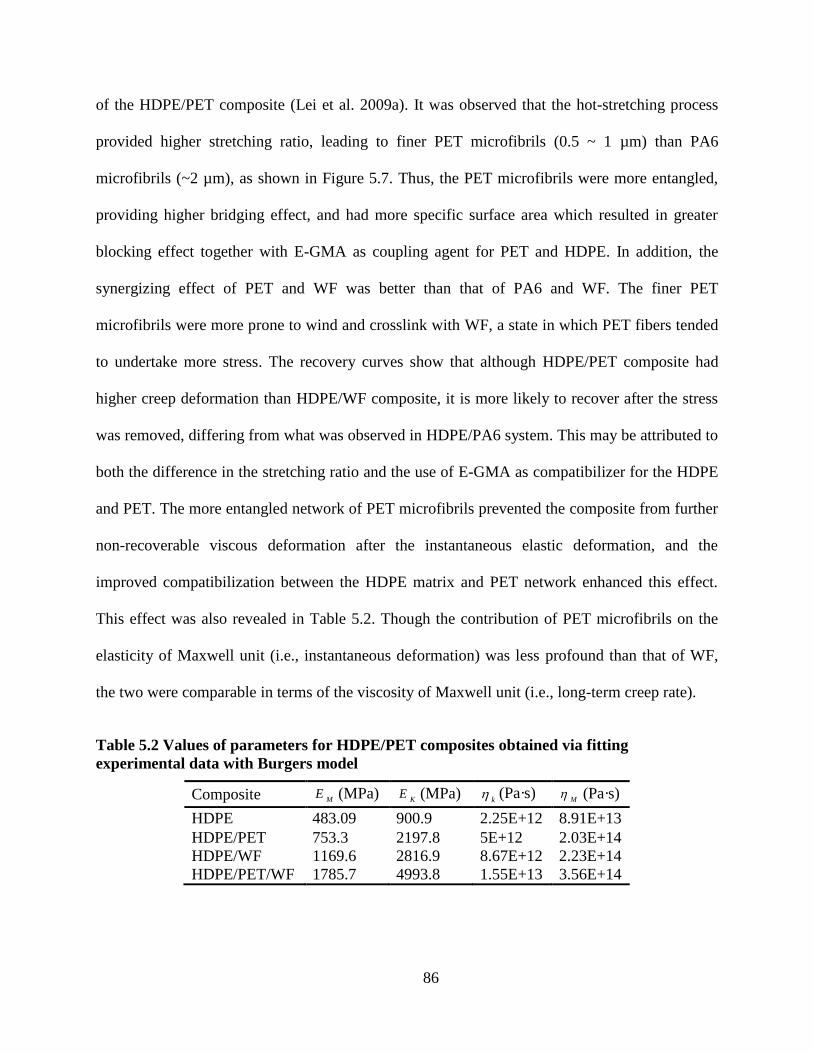
86
of the HDPE/PET composite (Lei et al. 2009a). It was observed that the hot-stretching process
provided higher stretching ratio, leading to finer PET microfibrils (0.5 ~ 1 µm) than PA6
microfibrils (~2 µm), as shown in Figure 5.7. Thus, the PET microfibrils were more entangled,
providing higher bridging effect, and had more specific surface area which resulted in greater
blocking effect together with E-GMA as coupling agent for PET and HDPE. In addition, the
synergizing effect of PET and WF was better than that of PA6 and WF. The finer PET
microfibrils were more prone to wind and crosslink with WF, a state in which PET fibers tended
to undertake more stress. The recovery curves show that although HDPE/PET composite had
higher creep deformation than HDPE/WF composite, it is more likely to recover after the stress
was removed, differing from what was observed in HDPE/PA6 system. This may be attributed to
both the difference in the stretching ratio and the use of E-GMA as compatibilizer for the HDPE
and PET. The more entangled network of PET microfibrils prevented the composite from further
non-recoverable viscous deformation after the instantaneous elastic deformation, and the
improved compatibilization between the HDPE matrix and PET network enhanced this effect.
This effect was also revealed in Table 5.2. Though the contribution of PET microfibrils on the
elasticity of Maxwell unit (i.e., instantaneous deformation) was less profound than that of WF,
the two were comparable in terms of the viscosity of Maxwell unit (i.e., long-term creep rate).
Table 5.2 Values of parameters for HDPE/PET composites obtained via fitting
experimental data with Burgers model
Composite ME (MPa)
KE (MPa)
k (Pa·s)
M (Pa·s)
HDPE 483.09 900.9 2.25E+12 8.91E+13
HDPE/PET 753.3 2197.8 5E+12 2.03E+14
HDPE/WF 1169.6 2816.9 8.67E+12 2.23E+14
HDPE/PET/WF 1785.7 4993.8 1.55E+13 3.56E+14
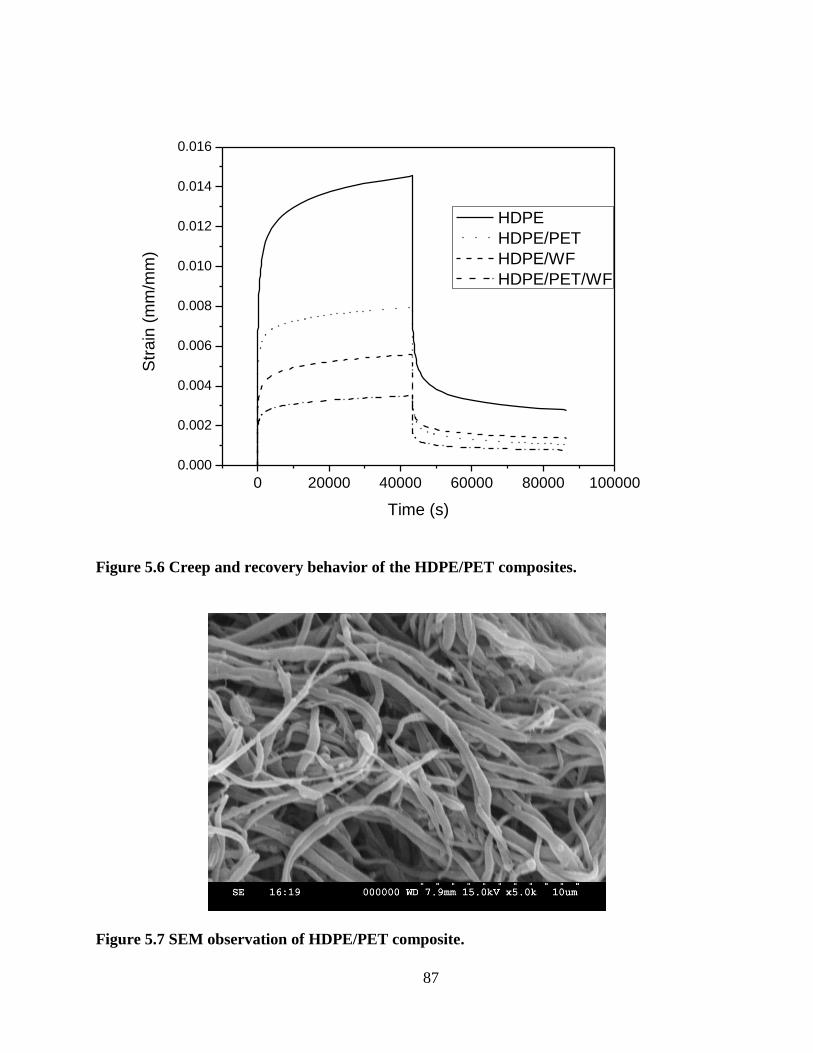
87
0 20000 40000 60000 80000 100000
0.000
0.002
0.004
0.006
0.008
0.010
0.012
0.014
0.016S
train
(m
m/m
m)
Time (s)
HDPE
HDPE/PET
HDPE/WF
HDPE/PET/WF
Figure 5.6 Creep and recovery behavior of the HDPE/PET composites.
Figure 5.7 SEM observation of HDPE/PET composite.
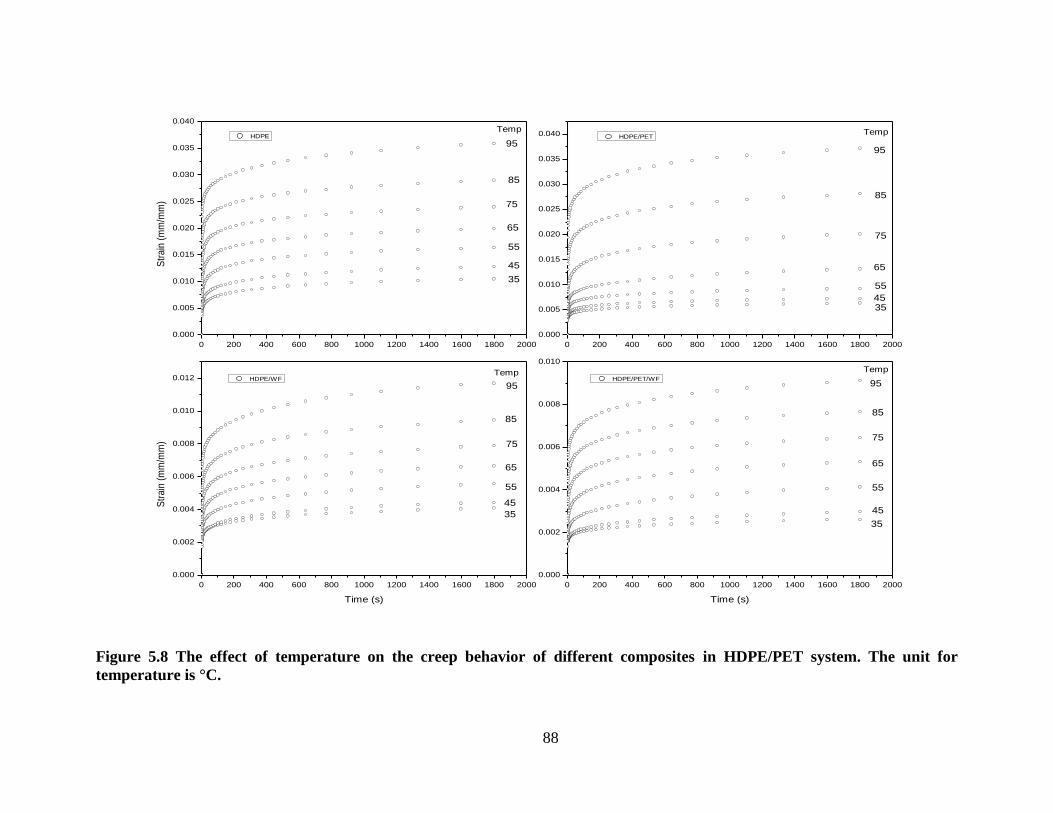
88
0 200 400 600 800 1000 1200 1400 1600 1800 2000
0.000
0.005
0.010
0.015
0.020
0.025
0.030
0.035
0.040
0 200 400 600 800 1000 1200 1400 1600 1800 2000
0.000
0.005
0.010
0.015
0.020
0.025
0.030
0.035
0.040
0 200 400 600 800 1000 1200 1400 1600 1800 2000
0.000
0.002
0.004
0.006
0.008
0.010
0.012
0 200 400 600 800 1000 1200 1400 1600 1800 2000
0.000
0.002
0.004
0.006
0.008
0.010
35
45
55
65
75
85
95
Temp HDPE
Str
ain
(m
m/m
m)
Temp
3545
55
65
75
85
95
HDPE/PET
Temp
35
45
55
65
75
85
9595
35
45
55
65
75
85
HDPE/WF
Str
ain
(m
m/m
m)
Time (s)
Temp HDPE/PET/WF
Time (s)
Figure 5.8 The effect of temperature on the creep behavior of different composites in HDPE/PET system. The unit for
temperature is °C.
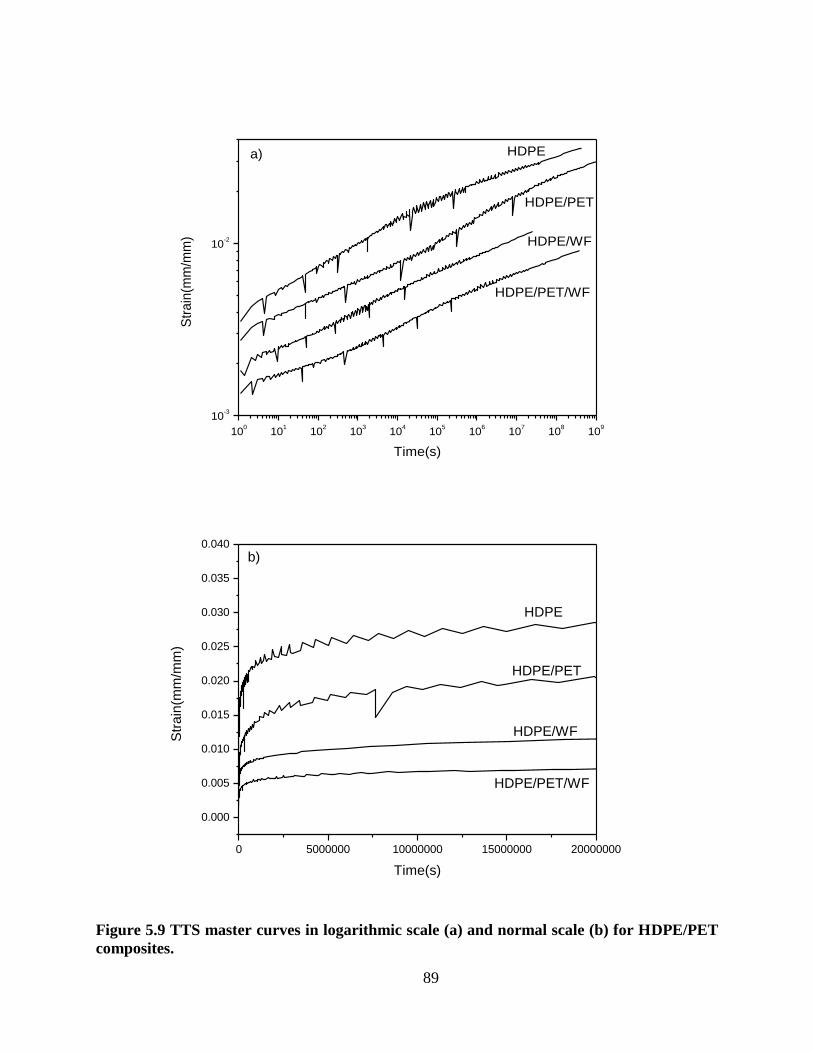
89
100
101
102
103
104
105
106
107
108
109
10-3
10-2
Str
ain
(mm
/mm
)
Time(s)
HDPE
HDPE/PET
HDPE/WF
HDPE/PET/WF
a)
0 5000000 10000000 15000000 20000000
0.000
0.005
0.010
0.015
0.020
0.025
0.030
0.035
0.040
Str
ain
(mm
/mm
)
Time(s)
HDPE
HDPE/PET
HDPE/WF
HDPE/PET/WF
b)
Figure 5.9 TTS master curves in logarithmic scale (a) and normal scale (b) for HDPE/PET
composites.
90
Figure 5.8 shows the effect of temperature on the creep behavior of the four materials in
the HDPE/PET system. Similar to what was observed above in HDPE/PA6 system, creep
deformation of HDPE increased as temperature increased, and the increment was larger at higher
temperatures. Adding WF also reduced the temperature effect on creep of HDPE when it
increased from 35oC to 45
oC. However, though introducing PET microfibrils reduced the creep
of HDPE at low temperature, it showed much larger temperature dependence, especially starting
from 65oC. As the temperature reached 95
oC, the HDPE/PET composite had almost the same
creep deformation as HDPE, suggesting that the PET microfibril network failed to function
against creep under that temperature. This is possibly because the fine PET mirofibrils network
had limited strength and started to break when the stress and strain increased to a certain value.
At low temperature, the strain was small and HDPE matrix sustained part of the stress. As
temperature increased, the strain approached the limitation of the PET microfibril network and
the stress was mainly transferred to this network due to the increased relaxation of HDPE matrix,
causing the network to fail. The criteria value of the strain is around 0.01 for the PET microfibril
network in the HDPE/PET composite, as shown in Figure 5.8. For the HDPE/PET/WF
composites, the maximum strain at all temperature levels was within 0.01, so no increase on
temperature dependence was observed.
TTS master curves of the HDPE/PET composites both in logarithmic scale and in normal
scale are shown in Figure 5.9. Similar to the HDPE/PA6 system, TTS provided long-term creep
prediction based on the accelerated testing results. These predictions were in good agreement
with the short-term data, but further verification would be needed if it is to be used for
quantitative assessment.
91
5.4 CONCLUSION
Engineering plastics, i.e., PA6 and PET, were introduced into WPCs in microfibril form
through a two-step extrusion method, which allows WF to be incorporated at a relative low
temperature and avoids thermal degradation. The engineering plastic microfibrils enhanced the
creep resistance of both HDPE and HDPE/WF composites. Comparatively, adding WF led to
better effect in terms of creep property, possibly because of its high volume percentage in the
composites. Hot-stretching process resulted in finer PET microfibrils, which formed a more
entangled network than the PA6 one. The microfibrils network was effective in reducing the
non-recoverable viscous deformation of the composites. However, the microfibrils network may
fail at high temperature, as observed in HDPE/PET system. The long-term creep deformations of
the composites were predicted with the accelerated testing results and TTS assumption. Though
it is not practical to examine their accuracy through experimental data, the master curves offered
plausible results based on which the material can be evaluated for potential structural
applications.
5.5 REFERENCES
Bengtsson, M., N. M. Stark, and K. Oksman. 2007. Durability and mechanical properties of
silane cross-linked wood thermoplastic composites. Composites Science and Technology
67:2728-2738.
Bledzki, A. K. and O. Faruk. 2004. Creep and impact properties of wood fibre-polypropylene
composites: influence of temperature and moisture content. Composites Science and Technology
64:693-700.
Caufield, D., R. Jacobson, K. Sears, and J. Underwood. 2001. Fiber reinforced engineering
plastics. 2nd International Conference on Advanced Engineered Wood Composites, Bethel,
Maine.
Fakirov, S., M. Evstatiev, and S. Petrovich. 1993. Microfibrillar reinforced composites from
binary and ternary blends of polyesters and nylon 6. Macromolecules 26:5219-5226.
92
Friedrich, K., M. Evstatiev, S. Fakirov, O. Evstatiev, M. Ishii, and M. Harrass. 2005.
Microfibrillar reinforced composites from PET/PP blends: processing, morphology and
mechanical properties. Composites Science and Technology 65:107-116.
Klason, C., J. Kubat, and H.-E. Stromvall. 1984. The Efficiency of Cellulosic Fillers in Common
Thermoplastics. Part 1. Filling without Processing Aids or Coupling Agents. International
Journal of Polymeric Materials 10:159 - 187.
Lei, Y., Q. Wu, and Y. Xu. 2009a. High density polyethylene and poly(ethylene terephthalate) in
situ nanostructured fibrillar blends as a matrix for wood-plastic composites. To be submitted.
Lei, Y., Q. Wu, and Q. Zhang. 2009b. Morphology and properties of microfibrillar composites
based on recycled poly (ethylene terephthalate) and high density polyethylene. Composites Part
A: Applied Science and Manufacturing 40:904-912.
Liu, H., F. Yao, Y. Xu, and Q. Wu. 2009. Novel Wood Flour-filled Microfibrillar High Density
Polyethylene and Nylon-6 Blend. Bioresource Technology:In submission.
Marcovich, N. E. and M. A. Villar. 2003. Thermal and mechanical characterization of linear low
density polyethylene/wood flour composites. Journal of Applied Polymer Science 90:2775-2784.
Nunez, A. J., N. E. Marcovich, and M. I. Aranguren. 2004. Analysis of the creep behavior of
polypropylene-woodflour composites. Polymer Engineering and Science 44:1594-1603.
Sain, M. M., J. Balatinecz, and S. Law. 2000. Creep fatigue in engineered wood fiber and plastic
compositions. Journal of Applied Polymer Science 77:260-268.
93
CHAPTER 6 APPLICATION OF UHMWPE AND UV ABSORBER IN WOOD/HDPE
COMPOSITE: MECHANICAL PROPERTIES AND CREEP BEHAVIOR
6.1 INTRODUCTION
Natural fiber/polymer composites (NFPCs) have been experiencing dramatic growth
because of their low cost, sound mechanical properties, water resistance, and biodegradability.
NFPCs can be made from recycled plastics and bio-based byproducts, reducing the use of non-
biodegradable plastics and efficiently using natural resources. The natural appearance also makes
this kind of material favorable for construction, decking, railing, and auto mobile components.
For example, wood/thermoplastic composite lumber has been widely recognized by the
construction industry and homeowners, primarily used for decking (Lundin et al. 2004). The
outdoor applications of NFPCs in construction require improved mechanical properties under
weathering conditions.
As introduced in Chapter 4, low impact strength is still one of the major concerns for the
application of WPCs. Ultra-high molecular weight polyethylene (UHMWPE) is a polyethylene
(PE) with extremely long molecular chains and high molecular weight. The long molecular
chains offer this material high toughness and good wear resistance, but also make it very hard to
process (Tincer and Coskun 1993). To take advantage of the good mechanical properties of
UHMWPE, conventional polyethylene has been tried as additive in UHMWPE to make it more
processable (Bhateja and Andrews 1983, Dumoulin et al. 1984, Kyu and Vadhar 1986,
Suwanprateeb 2000, Xue et al. 2006). A major drawback of UHMWPE is its poor creep
resistance, which is especially critical for its application in joint reconstruction (Deng et al. 1998).
Crosslinking and additives, such as carbon fibers, were proven to be effective for the creep
94
enhancement of UHMWPE and HDPE/UHMWPE composite (Wright et al. 1981, Penning et al.
1994, Lewis and Carroll 2001).
Weathering is a process of degradation resulting from UV radiation of sunlight, oxygen,
moisture, etc. It can change the morphology of polymeric material by means of chemical
crosslinking or chain scission (Davis and Sims 1983). It was reported that UV and moisture-
induced degradation significantly decreased the flexural modulus and strength of natural
fiber/high-density polyethylene (HDPE) composite (Lundin et al. 2004). However, screening
effect of wood particles confined the UV degradation to the surface of the composites, led to
better mechanical properties of composites compared with neat polymer after UV exposure
(Selden et al. 2004, LaMantia and Morreale 2008).
UV radiation has been shown to deteriorate creep resistance of polymeric materials with
the effect of breaking the polymer molecular chains, which has been confirmed by the
application of modern physical methods to detect the appearance of free radicals and the change
of molecular weight (Regel et al. 1967). The experiments show that UV radiation increased the
creep rate of different polymers and reduced their lifetime (Regel et al. 1967, Boboev et al. 1968,
Boboev et al. 1969). However, UV radiation also provided a way to improve creep resistance of
polymeric material when being used to create cross-linking in the material. Current research
showed good effect of UV radiation to improve creep property of Ultra-High Molecular Weight
Polyethylene (UHMWPE) (Penning et al. 1994, Jacobs et al. 2000).
Mineral fillers have been examined as UV stabilizer in different polymers and showed
various effects. Adding talc in PP as UV stabilizer resulted in higher degradation rate compared
with neat PP within an initial period (12 weeks in their research) and started to show some effect
after that (Rabello and White 1996). Similar results have been found when using CaCO3 in
95
HDPE composites (Valadez-Gonzalez et al. 1999). Yang et al. compared several mineral fillers
for HDPE composites and found that only CaCO3 and wollastonite had a little stabilizing effect,
while kaolin, diatomite and mica accelerated UV degradation of HDPE (Yang et al. 2005).
Based on the review of previous research, the objectives of this study were 1) to evaluate
the effect of UHMWPE as an impact modifier for wood flour (WF)/HDPE composite, 2) to
investigate the effect of UHMWPE on the creep resistance of HDPE and the effect of WF in
enhancing the creep of HDPE/UHMWPE composites, 3) to examine how UV affects the creep
resistance and other mechanical properties of the composites, and 4) to explore the effect of UV
absorber (UVA) on the properties of wood/HDPE composite before and after the outdoor
weathering.
6.2 EXPERIMENTAL
6.2.1 Materials
The HDPE was HD6706.17 from Exxon-Mobil Chemical Co, with a melt flow index of
6.1 g/10min (190 oC, 2.16 kg) and a density of 0.952 g/cm
3. UHMWPE was GUR4120 from
Ticona (Houston, TX). It is a powder with a density of 0.93 g/cm3 and an average molecular
weight of 5 million g/mol. DuPont DLS 210, from E.I. DuPont (New Johnsonville, TN) was used
as an UVA. It is an ultrafine titanium dioxide (TiO2) with a median particle size of 135 nm and a
surface area of 45 m2/g. Wood flour (WF) was provided by American Wood Fibers Inc.
(Madison, MI), with a 40-mesh particle size. A maleated polyethylene (PE-g-MA) G-2608 from
Eastman Chemical Company (Kingsport, TN, USA), with a melt index of 8 g/10min (190°C,
2.16 kg) and an acid number of 8 mg KOH/g, was used as a coupling agent for polymer matrix
and WF.
96
The experimental design included 4 levels of UHMWPE (0%, 10%, 20%, and 30% of
polymer loading), 2 levels of WF (0% and 40% of the total composite weight), and 1 level of
coupling agent (5% of WF loading). In addition, 2 levels of UVA (0% and 2% of the total weight
of polymer matrix) were added in the composites with UHMWPE levels of 0% and 20%. The
experimental design made up 12 formulations in total.
6.2.2 Composite Preparation
HDPE, fed through the main feeder, and UHMWPE/UVA, fed through the side feeder,
were first compounded through a co-rotating twin screw extruder MIC27/GL-400 (Leistritz
Corporation, Allendale, NJ) with a screw length/diameter of 40:1. In the case of both powders
were used, UHMWPE and UVA were well mixed by hand before feeding. The extrusion
temperature profile was 140-160-180-200-210-210-210-210-200-190-180ºC from the hopper to
the die and the screw rotating speed was fixed at 100 rpm. The extruded strands were cooled
through water bath, and then pelletized with a BT 25 Strand Pelletizer (Scheer Bay Co., Bay City,
MI).
The polymer pellets, fed through the main feeder, and WF, fed through the side feeder,
were then extruded to make WPC blends with the same extruder with a temperature profile of
140-160-180-190-190-190-190-180-175-175-175ºC from the hopper to the die and a screw
rotating speed of 100 rpm.
The test samples for mechanical properties were made through injection molding, using a
PLUS 35 injection molding machinese from Battenfeld of American Inc. (South Elgin, IL). The
composites with UHMWPE were injection molded at 200ºC and those without UHMWPE were
molded at 190ºC. The impact test specimens with cross-section size of around 3 mm × 12 mm
were machined for creep tests.
97
6.2.3 Weathering
Weathering specimens were exposed outdoors in Baton Rouge, LA for 5 consecutive
weeks from May to June, 2009. This was to investigate how UV radiation affects the mechanical
and creep properties of the composites and the effect of UVA in protecting the material from
weathering.
6.2.4 Characterization
Flexural and tensile strengths were measured according to the ASTM D790-03 and
D638-03, respectively, using an INSTRON 5582 Testing Machine (Instron Co., Grove City, PA).
A TINIUS 92T impact tester (Tinius Olsen, Inc., Horsham, PA, USA) was used for the Izod
impact test. All samples were notched at the center point of one longitudinal side according to
the ASTM D256. For each treatment level, five replicates were tested.
TA Q800 Dynamic Mechanical Analysis (DMA) instrument (New Castle, DE) was used
for short-term creep tests with a 3-point bending mode. The test samples with approximate cross-
section size of 3 12 mm were used for creep tests. In each test, the sample was heated to 35°C
and allowed to equilibrate for 5 minutes. A static stress level of 4 MPa was then applied for 12
hours, and the stress was released afterward to allow the sample to recover for 12 hours. The
sample deformation was measured during this process.
Accelerated creep tests were performed for 30 minutes at temperature levels starting at
35°C and increasing 10°C in steps up to 95°C. After equilibrating at the desired temperature for
5 minutes, 4 MPa of stress was applied and held constant for 30 minutes while the creep strain
was measured.
6.2.5 Creep Modeling
The four-element Burgers model was used to fit the creep curves.
98
tE
tEE
t
MK
K
KM
)]exp(1[)(
(6.1)
where (t) is the creep strain as a function of time (t) and is the applied stress; EM and
EK represent elastic moduli of the springs in this model; M and K represent viscosities of the
dashpots.
Statistical Analysis System (SAS) was employed to estimate the model parameters by
performing nonlinear regression on the creep curves. The Gauss-Newton iterative method was
implemented in this analysis to find the least-square estimates for the nonlinear model. Since the
DMA instrument collected the data with an increasing step-size, every data point was weighted
with the time interval of data collection.
6.3 RESULTS AND DISCUSSION
6.3.1 Mechanical Properties
6.3.1.1 UHMWPE Effect
Table 6.1 lists the mechanical properties of composites at different levels of UHMWPE
with and without WF. As shown, the addition of UHMWPE effectively improved the impact
strength of HDPE. For example, with the addition of 20% UHMWPE, the impact strength of
HDPE was doubled. This effect may be because the lowered crystallinity of HDPE at the
presence of UHMWPE and high flexibility of UHMWPE molecular chains facilitated the
transfer of stress during the impact process. With the addition of rigid WF, the UHMWPE
molecular chains had less free space and less flexibility. Most impact energy was transferred to
and sustained by the rigid WF which is prone to break during deformation, leading to a less
significant toughening effect from UHMWPE. Higher UHMWPE contents also resulted in
higher toughness with the existence of WF, though the impact strength of WPCs was much lower
than that of the corresponding polymer matrices.
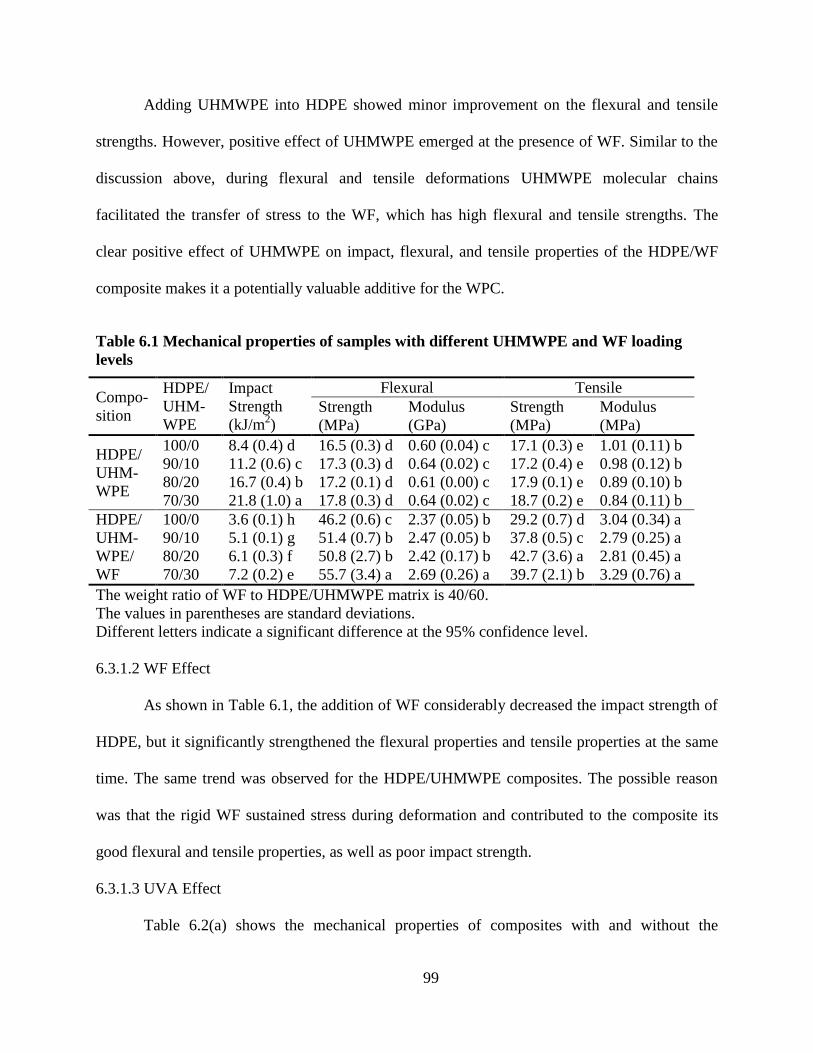
99
Adding UHMWPE into HDPE showed minor improvement on the flexural and tensile
strengths. However, positive effect of UHMWPE emerged at the presence of WF. Similar to the
discussion above, during flexural and tensile deformations UHMWPE molecular chains
facilitated the transfer of stress to the WF, which has high flexural and tensile strengths. The
clear positive effect of UHMWPE on impact, flexural, and tensile properties of the HDPE/WF
composite makes it a potentially valuable additive for the WPC.
Table 6.1 Mechanical properties of samples with different UHMWPE and WF loading
levels
Compo-
sition
HDPE/
UHM-
WPE
Impact
Strength
(kJ/m2)
Flexural Tensile
Strength
(MPa)
Modulus
(GPa)
Strength
(MPa)
Modulus
(MPa)
HDPE/
UHM-
WPE
100/0 8.4 (0.4) d 16.5 (0.3) d 0.60 (0.04) c 17.1 (0.3) e 1.01 (0.11) b
90/10 11.2 (0.6) c 17.3 (0.3) d 0.64 (0.02) c 17.2 (0.4) e 0.98 (0.12) b
80/20 16.7 (0.4) b 17.2 (0.1) d 0.61 (0.00) c 17.9 (0.1) e 0.89 (0.10) b
70/30 21.8 (1.0) a 17.8 (0.3) d 0.64 (0.02) c 18.7 (0.2) e 0.84 (0.11) b
HDPE/
UHM-
WPE/
WF
100/0 3.6 (0.1) h 46.2 (0.6) c 2.37 (0.05) b 29.2 (0.7) d 3.04 (0.34) a
90/10 5.1 (0.1) g 51.4 (0.7) b 2.47 (0.05) b 37.8 (0.5) c 2.79 (0.25) a
80/20 6.1 (0.3) f 50.8 (2.7) b 2.42 (0.17) b 42.7 (3.6) a 2.81 (0.45) a
70/30 7.2 (0.2) e 55.7 (3.4) a 2.69 (0.26) a 39.7 (2.1) b 3.29 (0.76) a
The weight ratio of WF to HDPE/UHMWPE matrix is 40/60.
The values in parentheses are standard deviations.
Different letters indicate a significant difference at the 95% confidence level.
6.3.1.2 WF Effect
As shown in Table 6.1, the addition of WF considerably decreased the impact strength of
HDPE, but it significantly strengthened the flexural properties and tensile properties at the same
time. The same trend was observed for the HDPE/UHMWPE composites. The possible reason
was that the rigid WF sustained stress during deformation and contributed to the composite its
good flexural and tensile properties, as well as poor impact strength.
6.3.1.3 UVA Effect
Table 6.2(a) shows the mechanical properties of composites with and without the
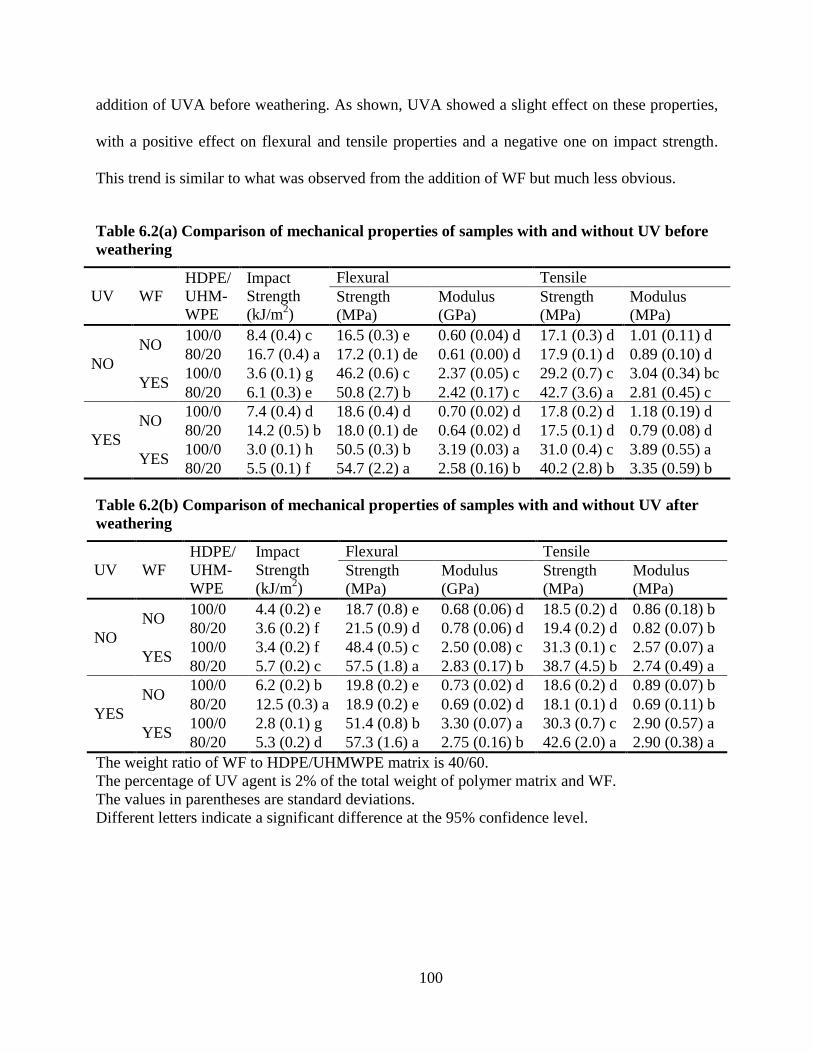
100
addition of UVA before weathering. As shown, UVA showed a slight effect on these properties,
with a positive effect on flexural and tensile properties and a negative one on impact strength.
This trend is similar to what was observed from the addition of WF but much less obvious.
Table 6.2(a) Comparison of mechanical properties of samples with and without UV before
weathering
UV WF
HDPE/
UHM-
WPE
Impact
Strength
(kJ/m2)
Flexural Tensile
Strength
(MPa)
Modulus
(GPa)
Strength
(MPa)
Modulus
(MPa)
NO
NO 100/0 8.4 (0.4) c 16.5 (0.3) e 0.60 (0.04) d 17.1 (0.3) d 1.01 (0.11) d
80/20 16.7 (0.4) a 17.2 (0.1) de 0.61 (0.00) d 17.9 (0.1) d 0.89 (0.10) d
YES 100/0 3.6 (0.1) g 46.2 (0.6) c 2.37 (0.05) c 29.2 (0.7) c 3.04 (0.34) bc
80/20 6.1 (0.3) e 50.8 (2.7) b 2.42 (0.17) c 42.7 (3.6) a 2.81 (0.45) c
YES
NO 100/0 7.4 (0.4) d 18.6 (0.4) d 0.70 (0.02) d 17.8 (0.2) d 1.18 (0.19) d
80/20 14.2 (0.5) b 18.0 (0.1) de 0.64 (0.02) d 17.5 (0.1) d 0.79 (0.08) d
YES 100/0 3.0 (0.1) h 50.5 (0.3) b 3.19 (0.03) a 31.0 (0.4) c 3.89 (0.55) a
80/20 5.5 (0.1) f 54.7 (2.2) a 2.58 (0.16) b 40.2 (2.8) b 3.35 (0.59) b
Table 6.2(b) Comparison of mechanical properties of samples with and without UV after
weathering
UV WF
HDPE/
UHM-
WPE
Impact
Strength
(kJ/m2)
Flexural Tensile
Strength
(MPa)
Modulus
(GPa)
Strength
(MPa)
Modulus
(MPa)
NO
NO 100/0 4.4 (0.2) e 18.7 (0.8) e 0.68 (0.06) d 18.5 (0.2) d 0.86 (0.18) b
80/20 3.6 (0.2) f 21.5 (0.9) d 0.78 (0.06) d 19.4 (0.2) d 0.82 (0.07) b
YES 100/0 3.4 (0.2) f 48.4 (0.5) c 2.50 (0.08) c 31.3 (0.1) c 2.57 (0.07) a
80/20 5.7 (0.2) c 57.5 (1.8) a 2.83 (0.17) b 38.7 (4.5) b 2.74 (0.49) a
YES
NO 100/0 6.2 (0.2) b 19.8 (0.2) e 0.73 (0.02) d 18.6 (0.2) d 0.89 (0.07) b
80/20 12.5 (0.3) a 18.9 (0.2) e 0.69 (0.02) d 18.1 (0.1) d 0.69 (0.11) b
YES 100/0 2.8 (0.1) g 51.4 (0.8) b 3.30 (0.07) a 30.3 (0.7) c 2.90 (0.57) a
80/20 5.3 (0.2) d 57.3 (1.6) a 2.75 (0.16) b 42.6 (2.0) a 2.90 (0.38) a
The weight ratio of WF to HDPE/UHMWPE matrix is 40/60.
The percentage of UV agent is 2% of the total weight of polymer matrix and WF.
The values in parentheses are standard deviations.
Different letters indicate a significant difference at the 95% confidence level.
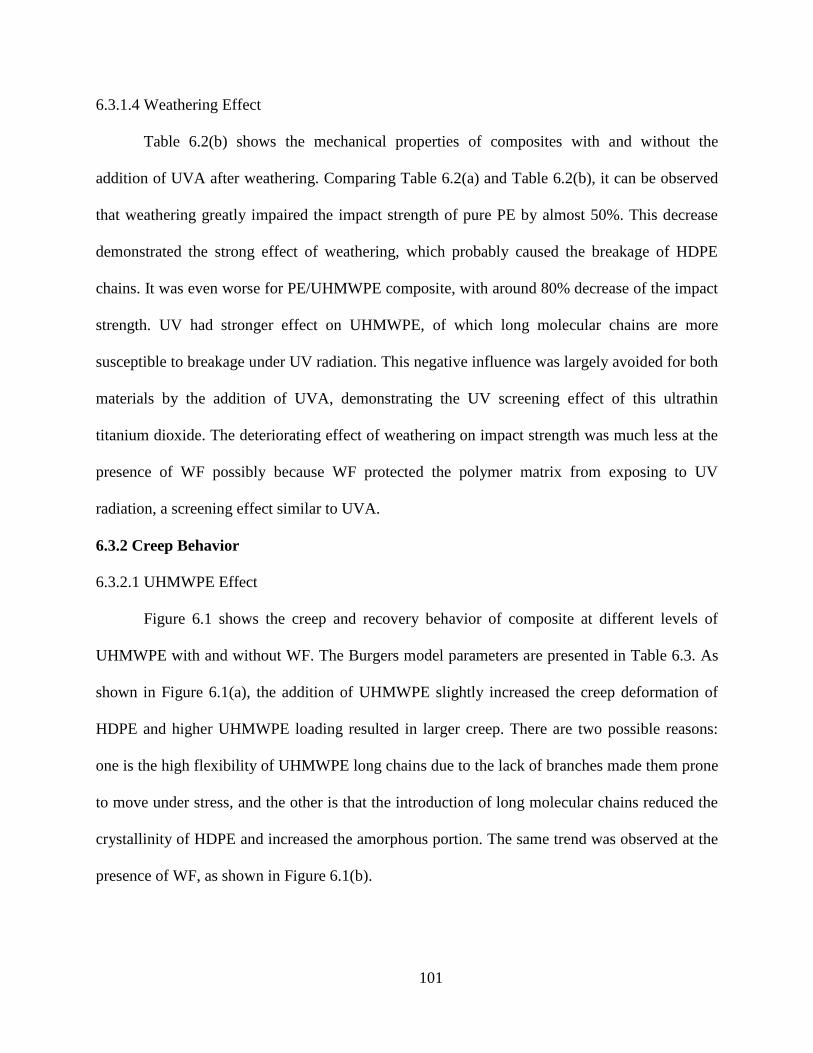
101
6.3.1.4 Weathering Effect
Table 6.2(b) shows the mechanical properties of composites with and without the
addition of UVA after weathering. Comparing Table 6.2(a) and Table 6.2(b), it can be observed
that weathering greatly impaired the impact strength of pure PE by almost 50%. This decrease
demonstrated the strong effect of weathering, which probably caused the breakage of HDPE
chains. It was even worse for PE/UHMWPE composite, with around 80% decrease of the impact
strength. UV had stronger effect on UHMWPE, of which long molecular chains are more
susceptible to breakage under UV radiation. This negative influence was largely avoided for both
materials by the addition of UVA, demonstrating the UV screening effect of this ultrathin
titanium dioxide. The deteriorating effect of weathering on impact strength was much less at the
presence of WF possibly because WF protected the polymer matrix from exposing to UV
radiation, a screening effect similar to UVA.
6.3.2 Creep Behavior
6.3.2.1 UHMWPE Effect
Figure 6.1 shows the creep and recovery behavior of composite at different levels of
UHMWPE with and without WF. The Burgers model parameters are presented in Table 6.3. As
shown in Figure 6.1(a), the addition of UHMWPE slightly increased the creep deformation of
HDPE and higher UHMWPE loading resulted in larger creep. There are two possible reasons:
one is the high flexibility of UHMWPE long chains due to the lack of branches made them prone
to move under stress, and the other is that the introduction of long molecular chains reduced the
crystallinity of HDPE and increased the amorphous portion. The same trend was observed at the
presence of WF, as shown in Figure 6.1(b).
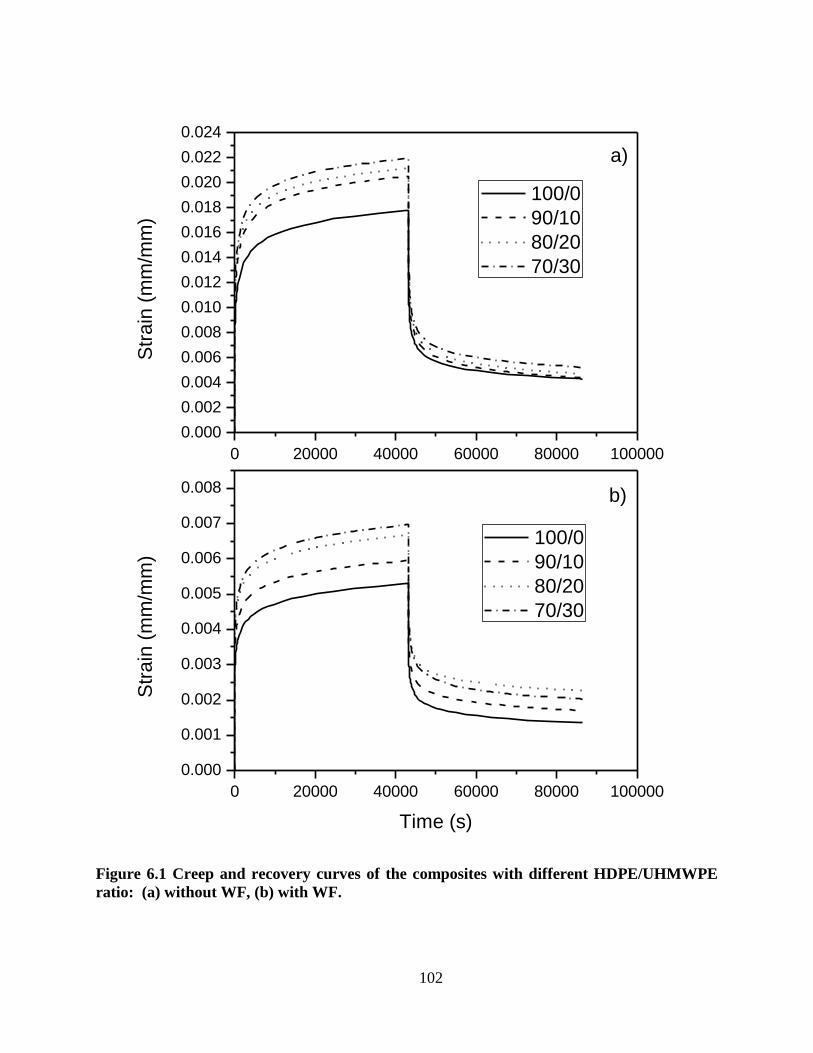
102
0 20000 40000 60000 80000 100000
0.000
0.002
0.004
0.006
0.008
0.010
0.012
0.014
0.016
0.018
0.020
0.022
0.024
0 20000 40000 60000 80000 100000
0.000
0.001
0.002
0.003
0.004
0.005
0.006
0.007
0.008
Str
ain
(m
m/m
m)
100/0
90/10
80/20
70/30
a)S
tra
in (
mm
/mm
)
Time (s)
100/0
90/10
80/20
70/30
b)
Figure 6.1 Creep and recovery curves of the composites with different HDPE/UHMWPE
ratio: (a) without WF, (b) with WF.
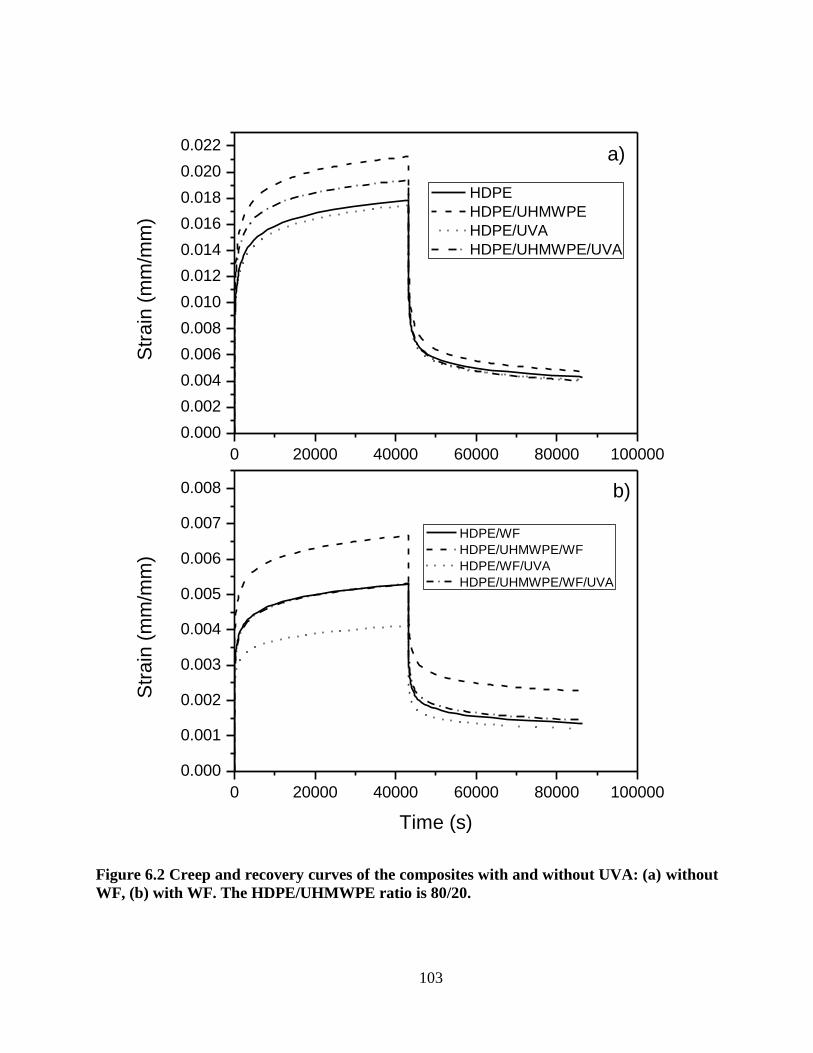
103
0 20000 40000 60000 80000 100000
0.000
0.002
0.004
0.006
0.008
0.010
0.012
0.014
0.016
0.018
0.020
0.022
0 20000 40000 60000 80000 100000
0.000
0.001
0.002
0.003
0.004
0.005
0.006
0.007
0.008
Str
ain
(m
m/m
m)
HDPE
HDPE/UHMWPE
HDPE/UVA
HDPE/UHMWPE/UVA
a)S
tra
in (
mm
/mm
)
Time (s)
HDPE/WF
HDPE/UHMWPE/WF
HDPE/WF/UVA
HDPE/UHMWPE/WF/UVA
b)
Figure 6.2 Creep and recovery curves of the composites with and without UVA: (a) without
WF, (b) with WF. The HDPE/UHMWPE ratio is 80/20.
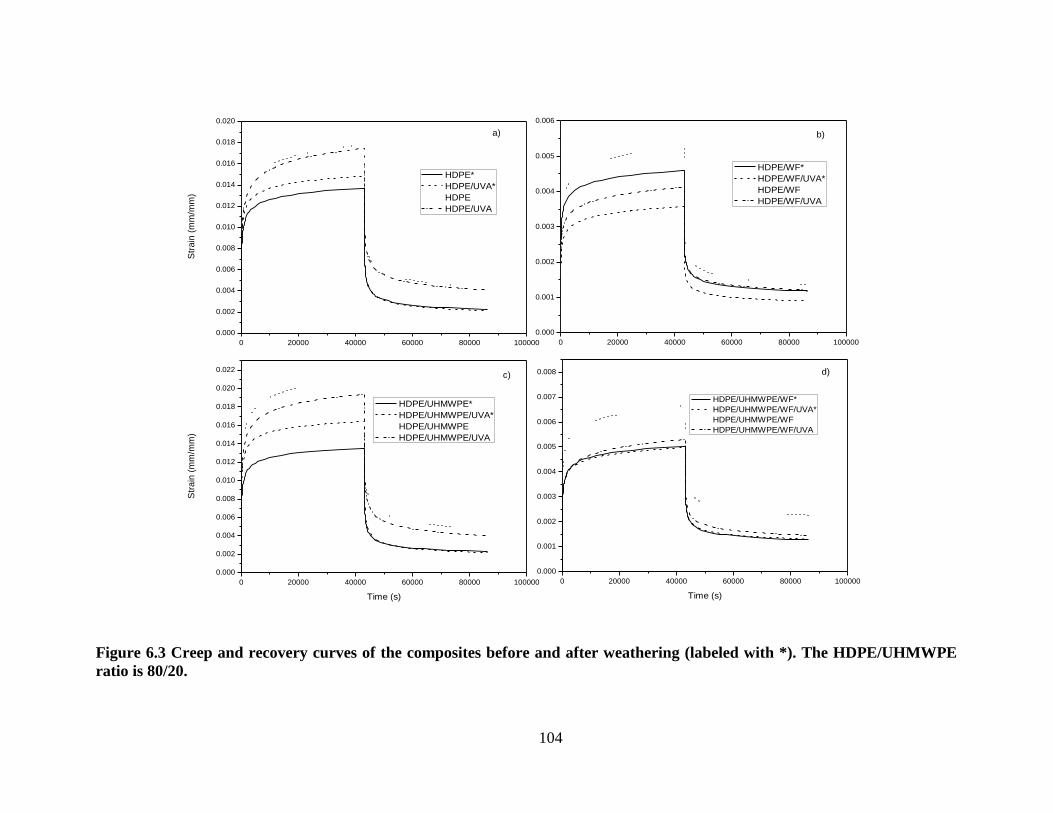
104
0 20000 40000 60000 80000 100000
0.000
0.002
0.004
0.006
0.008
0.010
0.012
0.014
0.016
0.018
0.020
0 20000 40000 60000 80000 100000
0.000
0.002
0.004
0.006
0.008
0.010
0.012
0.014
0.016
0.018
0.020
0.022
0 20000 40000 60000 80000 100000
0.000
0.001
0.002
0.003
0.004
0.005
0.006
0 20000 40000 60000 80000 100000
0.000
0.001
0.002
0.003
0.004
0.005
0.006
0.007
0.008
Str
ain
(m
m/m
m)
HDPE*
HDPE/UVA*
HDPE
HDPE/UVA
a)
Str
ain
(m
m/m
m)
Time (s)
HDPE/UHMWPE*
HDPE/UHMWPE/UVA*
HDPE/UHMWPE
HDPE/UHMWPE/UVA
c)
HDPE/WF*
HDPE/WF/UVA*
HDPE/WF
HDPE/WF/UVA
b)
Time (s)
HDPE/UHMWPE/WF*
HDPE/UHMWPE/WF/UVA*
HDPE/UHMWPE/WF
HDPE/UHMWPE/WF/UVA
d)
Figure 6.3 Creep and recovery curves of the composites before and after weathering (labeled with *). The HDPE/UHMWPE
ratio is 80/20.
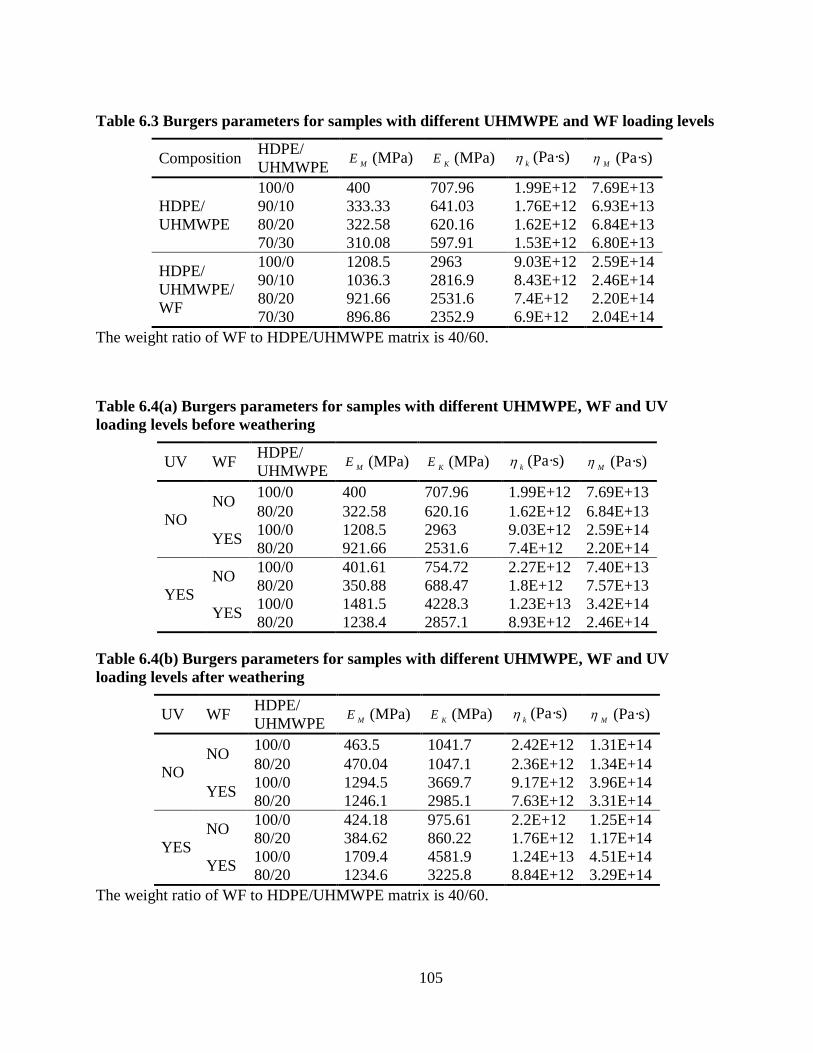
105
Table 6.3 Burgers parameters for samples with different UHMWPE and WF loading levels
Composition HDPE/
UHMWPE M
E (MPa) K
E (MPa) k (Pa·s)
M (Pa·s)
HDPE/
UHMWPE
100/0 400 707.96 1.99E+12 7.69E+13
90/10 333.33 641.03 1.76E+12 6.93E+13
80/20 322.58 620.16 1.62E+12 6.84E+13
70/30 310.08 597.91 1.53E+12 6.80E+13
HDPE/
UHMWPE/
WF
100/0 1208.5 2963 9.03E+12 2.59E+14
90/10 1036.3 2816.9 8.43E+12 2.46E+14
80/20 921.66 2531.6 7.4E+12 2.20E+14
70/30 896.86 2352.9 6.9E+12 2.04E+14
The weight ratio of WF to HDPE/UHMWPE matrix is 40/60.
Table 6.4(a) Burgers parameters for samples with different UHMWPE, WF and UV
loading levels before weathering
UV WF HDPE/
UHMWPE M
E (MPa) K
E (MPa) k (Pa·s)
M (Pa·s)
NO
NO 100/0 400 707.96 1.99E+12 7.69E+13
80/20 322.58 620.16 1.62E+12 6.84E+13
YES 100/0 1208.5 2963 9.03E+12 2.59E+14
80/20 921.66 2531.6 7.4E+12 2.20E+14
YES
NO 100/0 401.61 754.72 2.27E+12 7.40E+13
80/20 350.88 688.47 1.8E+12 7.57E+13
YES 100/0 1481.5 4228.3 1.23E+13 3.42E+14
80/20 1238.4 2857.1 8.93E+12 2.46E+14
Table 6.4(b) Burgers parameters for samples with different UHMWPE, WF and UV
loading levels after weathering
UV WF HDPE/
UHMWPE M
E (MPa) K
E (MPa) k (Pa·s)
M (Pa·s)
NO
NO 100/0 463.5 1041.7 2.42E+12 1.31E+14
80/20 470.04 1047.1 2.36E+12 1.34E+14
YES 100/0 1294.5 3669.7 9.17E+12 3.96E+14
80/20 1246.1 2985.1 7.63E+12 3.31E+14
YES
NO 100/0 424.18 975.61 2.2E+12 1.25E+14
80/20 384.62 860.22 1.76E+12 1.17E+14
YES 100/0 1709.4 4581.9 1.24E+13 4.51E+14
80/20 1234.6 3225.8 8.84E+12 3.29E+14
The weight ratio of WF to HDPE/UHMWPE matrix is 40/60.
106
6.3.2.2 WF Effect
Comparing Figure 6.1(a) and Figure 6.1(b), the creep deformation of HDPE/UHMWPE
composite was greatly reduced with the addition of WF, at each loading level of UHMWPE. The
enhancing effect of WF on creep resistance was much stronger than the deteriorating effect of
UHMWPE. Thus, UHMWPE can be used as impact modifier for HDPE/WF composite while
sustaining good creep resistance resulting from WF.
6.3.2.3 UVA Effect
As shown in Figure 6.2(a) and Figure 6.2(b), the addition of UVA reduced the creep
deformation of the composites with and without WF. This effect seemed to be more obvious for
the composites with WF.
6.3.2.4 Weathering Effect
As shown in Figure 6.3, the composites showed better creep resistance after weathering
than before weathering, especially on long-term creep rate, represented by M
in Table 6.4. The
smaller long-term creep rate resulted in less non-recoverable viscous deformation, so that higher
recoverability was observed for the composites after weathering, as shown in Figure 6.3. This
enhancing effect might be attributed to the UV radiation during weathering, which broke the
molecular chains and led to cross-linking. In Figure 6.3(a), HDPE showed larger creep
deformation than HDPE/UVA, but the order was reversed after weathering, demonstrating the
screening effect of UVA, which blocked the UV radiation and weakened its enhancing effect in
creep resistance. For HDPE/WF composites with and without UVA, weathering showed a
similar effect on their creep properties, suggesting that UVA had little extra protection for HDPE
at the presence of WF. For HDPE/UHMWPE composites without UVA, weathering improved
the creep resistance even greater, and addition of UVA effectively reduced this effect.
107
6.4 CONCLUSION
The addition of wood flour in HDPE composites improved main mechanical properties,
such as tensile strength, tensile modulus, flexural strength, flexural modulus, and creep resistance
of polymer matrix. However, the gain in these properties was at the expense of lowered impact
strength. UHMWPE was successfully introduced into HDPE/WF composite as an impact
modifier and improved the toughness of HDPE both with and without WF. It also improved
flexural and tensile properties of the composites at the presence of WF. Although the addition of
UHMWPE slightly decreased the creep resistance of HDPE/WF composites, the resulting creep
property was still much better than that of pure HDPE, due to the significant enhancing effect of
WF. Thus, UHMWPE and WF worked complementarily on the two properties when being used
together with HDPE. Weathering dramatically impaired impact strength of HDPE and
HDPE/UHMWPE, but both WF and UVA effectively inhibited this effect. A slight increase was
observed in flexural property, tensile property, and creep resistance after weathering.
6.5 REFERENCES
Bhateja, S. K. and E. H. Andrews. 1983. Thermal, mechanical, and rheological behavior of
blends of ultrahigh and normal-molecular-weight linear polyethylenes. Polymer Engineering &
Science 23:888-894.
Boboev, T. B., V. R. Regel, and N. N. Chernyi. 1969. Comparison of the effect of ultraviolet
radiation on polymer creep rate in a vacuum and in air. Mechanics of Composite Materials
5:481-483.
Boboev, T. B., V. R. Regel, T. P. Sanfirova, and N. N. Chernyi. 1968. Effect of ultraviolet
radiation on the life of stressed polymers under vacuum and in air. Mechanics of Composite
Materials 4:511-513.
Davis, A. and D. Sims. 1983. Weathering of polymers. Elsevier Applied Science Publishers,
London.
Deng, M., R. A. Latour, A. A. Ogale, and S. W. Shalaby. 1998. Study of creep behavior of ultra-
high-molecular-weight polyethylene systems. Journal of Biomedical Materials Research 40:214-
223.
108
Dumoulin, M. M., L. A. Utracki, and J. Lara. 1984. Rheological and mechanical behavior of the
UHMWPE/MDPE mixtures. Polymer Engineering & Science 24:117-126.
Jacobs, M., N. Heijnen, C. Bastiaansen, and P. Lemstra. 2000. A novel, efficient route for the
crosslinking and creep improvement of high modulus and high strength polyethylene fibres.
Macromolecular Materials and Engineering 283:120-125.
Kyu, T. and P. Vadhar. 1986. Cocrystallization and miscibility studies of blends of ultrahigh
molecular weight polyethylene with conventional polyethylenes. Journal of Applied Polymer
Science 32:5575-5584.
LaMantia, F. P. and M. Morreale. 2008. Accelerated weathering of polypropylene/wood flour
composites. Polymer Degradation and Stability 93:1252-1258.
Lewis, G. and M. Carroll. 2001. Effect of crosslinking UHMWPE on its tensile and compressive
creep performance. Bio-Medical Materials and Engineering 11:167-183.
Lundin, T., S. M. Cramer, R. H. Falk, and C. Felton. 2004. Accelerated Weathering of Natural
Fiber-Filled Polyethylene Composites. Journal of Materials in Civil Engineering 16:547-555.
Penning, J. P., H. E. Pras, and A. J. Pennings. 1994. Influence of chemical crosslinking on the
creep behavior of ultra-high molecular weight polyethylene fibers. Colloid & Polymer Science
272:664-676.
Rabello, M. S. and J. R. White. 1996. Photodegradation of talc-filled polypropylene. Polymer
Composites 17:691-704.
Regel, V. R., N. N. Chernyi, V. G. Kryzhanovskii, and T. B. Boboev. 1967. Effect of ultraviolet
radiation on the creep rate of polymers. Mechanics of Composite Materials 3:272-275.
Selden, R., B. Nystrom, and R. Langstrom. 2004. UV aging of poly(propylene)/wood-fiber
composites. Polymer Composites 25:543-553.
Suwanprateeb, J. 2000. Binary and ternary particulated composites: UHMWPE/CACO3/HDPE.
Journal of Applied Polymer Science 75:1503-1513.
Tincer, T. and M. Coskun. 1993. Melt blending of ultra high molecular weight and high density
polyethylene: The effect of mixing rate on thermal, mechanical, and morphological properties.
Polymer Engineering & Science 33:1243-1250.
Valadez-Gonzalez, A., J. M. Cervantes-Uc, and L. Veleva. 1999. Mineral filler influence on the
photo-oxidation of high density polyethylene: I. Accelerated UV chamber exposure test. Polymer
Degradation and Stability 63:253-260.
Wright, T. M., T. Fukubayashi, and A. H. Burstein. 1981. The effect of carbon fiber
reinforcement on contact area, contact pressure, and time-dependent deformation in polyethylene
tibial components. Journal of Biomedical Materials Research 15:719-730.
109
Xue, Y., W. Wu, O. Jacobs, and B. Schadel. 2006. Tribological behaviour of UHMWPE/HDPE
blends reinforced with multi-wall carbon nanotubes. Polymer Testing 25:221-229.
Yang, R., J. Yu, Y. Liu, and K. Wang. 2005. Effects of inorganic fillers on the natural photo-
oxidation of high-density polyethylene. Polymer Degradation and Stability 88:333-340.
110
CHAPTER 7 CONCLUSIONS AND FUTURE WORK
7.1 OVERALL CONCLUSIONS
Natural fiber/polymer composites (NFPCs) are being increasingly used in construction
due to its sound mechanical properties, processability, water and rot resistance, low maintenance
requirement, and wood-like appearance. The increasing application of NFPCs in building
products made creep resistance an important property for this material. The work described in
this dissertation includes research on creep behavior of NFPCs with different polymer matrices,
natural fiber types, additives and modifiers. The objectives of this research were: 1) To evaluate
creep models for different applications, i.e., comparison, characterization, and prediction; 2) To
develop creep models suitable for comparison, characterization and prediction of creep in NFPCs;
3) To predict long-term creep behavior of NFPCs through accelerated testing; and 4) To apply
the developed techniques to investigate creep behaviors of various systems aimed to improve the
overall properties of NFPCs. Based on the discussions in this dissertation, the following
conclusions can be made.
The creep curves of NFPCs were fitted with both physical models and empirical models.
Among these models, the 4-element Burgers model was most interpretable and fitted the overall
creep curves well. The parameters obtained from the 4-element Burgers model were used to
characterize the viscoelastic properties of NFPCs and to compare their creep resistances. The
disadvantage of the 4-element Burgers model was that it lacks the flexibility to fully describe the
transition region at the beginning of creep, tending to provide an instantaneous deformation
larger than the real value. It also tended to give a larger long-term creep rate by concluding that
the creep process enters the linear region during the experimental period, though the creep rate
kept decreasing during that process. Thus, the 4-element Burgers model is not suitable for long-
111
term prediction. Generalized Burgers model, such as 6 and 8–element models, provided better fit
by introducing extra Kelvin units, so that smaller instantaneous deformation and long-term creep
rate were obtained. However, the Kelvin units in the generalized Burgers models only functioned
within the experimental span well, predicting a linear trend starting within the experimental
region, which was actually still within the nonlinear primary stage. Indexed Burgers models
performed better for creep curves within primary stage in terms of both characterization and
prediction.
Creep prediction was attempted using two approaches: modeling and accelerated testing.
Based on the experimental data, Burgers models are not recommended for prediction because the
experiments were done within the primary nonlinear stage and Burgers models predicted a linear
trend before that stage was observed. Long-term experiments are needed for the Burgers model
to provide a better prediction. Comparatively, the Indexed Burgers models and 2-parameter
power law model performed better in terms of prediction. Accelerated creep tests were
conducted at higher temperatures and smooth curves were obtained based on time-temperature
superposition principle. TTS offered good prediction for creep of PVC composites but over-
predicted that of HDPE composites. These assessments were based on the limited experimental
data. The accuracy of long-term prediction was unable to be evaluated due to the lack of long-
term experimental data.
Creep resistance of NFPCs was affected by many factors, including formulation,
temperature, and weathering. Different polymers showed different creep properties due to
structural and morphological differences. PVC had higher creep resistance than HDPE; HDPE
showed better creep property than UHMWPE. Introducing engineering plastics to form
microfibrils in HDPE matrix improved its creep performance. Recycled plastics resulted in
112
smaller creep deformation than the corresponding virgin resin, probably because of the additives
from previous use. Natural fibers, such as bamboo flour and wood flour, greatly enhanced the
creep resistance of NFPCs. This enhancing effect outweighed other effects resulting from change
in polymer matrix or addition of other small-amount additives. The effect of coupling agent on
creep was dependent on its modulus and coupling effect. For example, PE-g-MA improved the
creep property of BF/HDPE composite but EPR-g-MA showed a reverse effect. UVA, an
ultrafine titanium dioxide, slightly reduced the creep deformation of HDPE composites at a low
loading level. Creep behaviors of both pure polymer and NFPCs were very sensitive to
temperature. Higher temperatures led to not only larger instantaneous deformation, but also
higher long-term creep rate. Weathering also affected the creep property of polymer and NFPCs.
Five-week outdoor exposure led to improvement on creep resistance of HDPE composites,
especially a smaller long-term creep rate. However, a long-term exposure may deteriorate this
property, as reported in previous literature.
7.2 FUTURE WORK
Future work is needed to further the understanding of the creep properties of NFPCs.
Based on the results shown in this dissertation, future work will need to be focused on the
following aspects.
First, long-term creep tests are needed to evaluate the prediction performance of
modeling techniques and accelerated testing. Our current equipment only allows one test on one
sample at one time, which makes long-term creep tests impractical. New equipment would be
needed to perform these long-term creep tests for a series of samples at the same time. Long-
term creep data will also give better accuracy for creep modeling, especially for Burgers models.
113
Secondly, long-term weathering or accelerated weathering treatment is needed to
simulate the circumstances in real applications. NFPCs used outdoors last for many years.
Though positive effect was observed on main mechanical properties of WF/HDPE composites
after 5 weeks outdoor exposure, a reverse effect may appear as weathering advances.
Finally, recovery process needs to be researched more extensively. Some brief discussion
and analysis were done on recovery process of NFPCs in this dissertation, but more detailed
study on this aspect will be needed to deepen the understanding of the viscoelastic behavior of
polymer composites during the creep and recovery process.
114
APPENDIX: PERMISSION LETTER
From: McCarthy, Stephen <[email protected]>
Date: Mon, Jul 20, 2009 at 6:52 AM
Subject: RE: permission for reprint of my paper as part of dissertation
To: Yanjun Xu <[email protected]>
Yes, that is fine
---------- Forwarded message ----------
From: Yanjun Xu <[email protected]>
Date: 2009/7/9
Subject: permission for reprint of my paper as part of dissertation
Dear Dr. McCarthy,
This is Yanjun Xu, PhD candidate at Louisiana State University. I published the following article
on your journal and I am writing to ask for permission to reprint it as part of my dissertation.
Xu, Y., Q. Wu, Y. Lei, F. Yao, and Q. Zhang. 2008. Natural Fiber Reinforced Poly(vinyl chloride)
Composites: Effect of Fiber Type and Impact Modifier. Journal of Polymers and the Environment
16(4):250-257.
Thanks and best regards,
Yanjun
_____________________________________________________
Yanjun Xu
PhD Graduate Research Assistant
School of Renewable Natural Resources
Louisiana State University, Baton Rouge, LA 70803
Tel: 225-578-4358; Cell: 225-362-0275
E-mail: [email protected]
_____________________________________________________
115
VITA
Yanjun Xu was born in August 1979 in Changshu, Jiangsu, China. He has an older sister.
He attended Sichuan University and received his Bachelor’s degree in polymer science and
engineering in 2002 and Master’s degree in polymer processing engineering in 2005. After that,
he joined Shanghai Kingfa Sci. & Tech. Co. Ltd. and worked there until December 2005. Yanjun
Xu will graduate with a Doctor of Philosophy degree in forestry and a Master in applied statistics
from Louisiana State University in December 2009. He and his wife are expecting their first
baby in January 2010.


![Composites] Fiberglass Reinforced Plastics](https://img.pdfslide.us/doc/110x75/54357942219acdd95f8b47ae/composites-fiberglass-reinforced-plastics.jpg)