Embed Size (px)
Citation preview

Canada Pension Plan Actuarial Adjustment Factors Study
ACTUARIAL STUDY NO. 2
Office of the Chief Actuary
March 2003

Actuarial Study No. 2 Canada Pension Plan Actuarial Adjustment Factors Study
2 |
Foreword
Flexible retirement provisions were introduced in the Canada Pension Plan (CPP) in January 1987. Since that date, the retirement pension is subject to an actuarial adjustment that depends on the contributor�s age at commencement of the retirement pension. The retirement pension is permanently adjusted downwards or upwards by 0.5% for each month between age 65 and the age when the pension commences, which can be as early as age 60 or as late as age 70, at the discretion of the contributor. The main purpose of this study is to review the appropriateness of the actuarial adjustment factor of 0.5% per month, fixed since 1987. The CPP legislation provides a role for the Chief Actuary in this respect. This study found that the current actuarial adjustments are too generous for contributors who elect to take their retirement benefit before age 65. Conversely, benefit uptake after age 65 is penalized. However, it is worth noting that the Plan is financially sustainable even though the legislated actuarial adjustments are no longer cost neutral to the Plan. In the context of an aging population, where life expectancy at age 65 is expected to continue to increase and projected labour force shortages could induce older workers to stay at work longer, policy makers will have to determine whether the current actuarial adjustments should be changed or certain plan provisions modified to restore neutrality to the Plan�s flexible retirement provisions.

Actuarial Study No. 2 Canada Pension Plan
Actuarial Adjustment Factors Study
| 3
TABLE OF CONTENTS Executive Summary ....................................................................................................................... 5 I. Introduction ........................................................................................................................... 7
A. Purpose of Study .......................................................................................................... 8 B. Overview of Study ....................................................................................................... 8
II. Individual Method ................................................................................................................. 9
A. Overview ...................................................................................................................... 9 B. General Approach ........................................................................................................ 9 C. Results ........................................................................................................................ 11 D. Observations .............................................................................................................. 12 E. Conclusion ................................................................................................................. 12
III. Collective Method ............................................................................................................... 13
A. Overview .................................................................................................................... 13 B. General Approach ...................................................................................................... 14 C. Results ........................................................................................................................ 17 D. Observations .............................................................................................................. 19 E. Conclusion ................................................................................................................. 20
IV. Steady-State Contribution Rate Method ............................................................................. 21
A. Overview .................................................................................................................... 21 B. General Approach ...................................................................................................... 21 C. Results ........................................................................................................................ 22 D. Observations .............................................................................................................. 23 E. Conclusion ................................................................................................................. 23
V. Sensitivity Analysis ............................................................................................................ 24
A. Introduction ................................................................................................................ 24 B. Results ........................................................................................................................ 24
1. Individual Method ................................................................................................. 24 2. Collective Method ................................................................................................. 26 3. Steady-State Contribution Rate Method ................................................................ 28
VI. Reconciliation With Legislated Actuarial Adjustments ..................................................... 29 VII. Comparison With Québec Pension Plan ............................................................................. 30 VIII. International Comparison .................................................................................................... 31 IX. Conclusion .......................................................................................................................... 38 X. Appendix A: Key Economic Assumptions ......................................................................... 40

Actuarial Study No. 2 Canada Pension Plan Actuarial Adjustment Factors Study
4 |
TABLES Table 1: Actuarial Adjustments (Individual Method: Males) ................................................... 11 Table 2: Actuarial Adjustments (Individual Method: Females) ............................................... 11 Table 3: Summary of Assumptions Regarding Loss of Contributions ..................................... 15 Table 4: Actuarial Adjustments (Collective Method)............................................................... 17 Table 5: Actuarial Adjustment Components (Cohort Age 60 in 2004) .................................... 18 Table 6: Actuarial Adjustment Components (Cohort Age 60 in 2024) .................................... 18 Table 7: Actuarial Adjustments (Steady-State Method) ........................................................... 22 Table 8: Actuarial Adjustments (Male Age 60) ........................................................................ 24 Table 9: Actuarial Adjustments (Female Age 60) .................................................................... 25 Table 10: Ultimate Actuarial Assumptions................................................................................. 26 Table 11: Actuarial Adjustments (Male Cohort Age 60 in 2004)............................................... 26 Table 12: Actuarial Adjustments (Female Cohort Age 60 in 2004) ........................................... 27 Table 13: Actuarial Adjustments (Entire Cohort Age 60 in 2004) ............................................. 27 Table 14: Actuarial Adjustments (Steady-State Method) ........................................................... 28 Table 15: Comparison of Steady-State and Legislated Actuarial Adjustments.......................... 29 Table 16: International Comparison of Actuarial Adjustments .................................................. 31 Table 17: OASDI Actuarial Adjustments ................................................................................... 33 Table 18: Eighteenth CPP Actuarial Report Economic Assumptions ........................................ 40

Actuarial Study No. 2 Canada Pension Plan
Actuarial Adjustment Factors Study
| 5
Executive Summary Purpose of Study Flexible retirement provisions were introduced in the Canada Pension Plan (CPP) in January 1987. At the same time, the CPP legislation was amended to provide for the adjustment of basic monthly pension if taken before or after the age of 65. Subsection 46(3) of the governing legislation stipulates that the amount of a retirement pension that becomes payable after 31 December 1986 will be adjusted if it commences in a month other than the month in which the contributor reaches 65 years of age with the basic monthly amount adjusted by a factor fixed by the Minister of HRDC. Since 1987 this adjustment factor has been fixed at 0.5% per month. The main purpose of this study is to review the appropriateness of the actuarial adjustment factor of 0.5% per month. The CPP legislation provides a role for the Chief Actuary in this respect. Main Findings
•••• While there are a variety of methods for determining whether actuarial adjustments are neutral, the best method, in the context of the CPP, is the steady-state contribution rate method. The individual method is not appropriate, as it would imply having as many factors as there are beneficiaries; for this reason it is not applied in employer sponsored defined benefit pension plans either. In addition the individual method does not take into account the following important elements of the CPP:
• Loss of contributions to the Plan due to more benefit uptakes prior to age 65 than at ages 65 and over; and
• Loss of eligibility for disability benefits due to benefit uptake prior to age 65. The collective method determines actuarial adjustments for each age using the present values of contributions, retirement benefits and disability benefits; it is equitable for a cohort of individuals (e.g. same year of birth). This method uses methodology familiar to private sector actuaries but it has an important shortcoming from the perspective of its use in the Canada Pension Plan in that it does not take into account the financing requirements of the governing legislation.
The steady-state contribution rate method determines the actuarial adjustment for each age of benefit uptake by first determining the steady-state contribution rate � the lowest contribution rate able to sustain the Plan into the foreseeable future - for a benchmark scenario where each individual takes CPP retirement pension at age 65. This scenario produces a steady-state contribution rate of 9.7% while the steady-state contribution rate of the Eighteenth CPP Actuarial report is 9.8%. This method is preferable as it recognizes the Plan�s current benefit provisions and financing elements.
•••• In this study actuarial neutrality is used to mean Plan Neutrality, which exists when the cost
to the CPP is the same regardless of whether contributors take their benefit at age 65 as opposed to any other age from 60 to 70, inclusive. That is, there is no advantage or disadvantage to the other Plan members arising from a given Plan member choosing to take the retirement benefit at a particular age. Plan neutrality takes into consideration all Plan provisions, including benefits and contributions. The purpose of actuarial adjustment is to

Actuarial Study No. 2 Canada Pension Plan Actuarial Adjustment Factors Study
6 |
ensure Plan neutrality. Actuarial adjustment is needed to take account of the fact that, in the case of early retirees, fewer years of contributions will be made and more years of benefits will be received; the opposite is true of late retirees.
•••• Economic and demographic variables, including wage growth, inflation, rate of return on
Plan assets, mortality, as well as changes in Plan provisions that effect the benefits received or contributions paid to those who take their benefit at age 65 relative to any other age of pension take up, are the key factors used to determine the neutral adjustments.
•••• At its introduction in 1987, the 0.5 per cent adjustment factor was about neutral for pre-65
pension take up but non-neutral for post-65 pension take up. Since then, the evolution of economic conditions � weaker than anticipated real wage growth and a higher than anticipated real rate of return on Plan assets (new Plan�s investment policy since 1998) � have resulted in the 0.5 per cent adjustment factor no longer being neutral for early or deferred retirement pension take up.
Actuarial Opinion This study found that the current actuarial adjustments are too generous for contributors who elect to take their benefit before age 65 and are therefore disadvantageous to the Plan. That is, early retirement benefit uptake is subsidized. Conversely, benefit uptake after age 65 is penalized. With early benefit uptake being far more prevalent than late benefit uptake, the net result of the current actuarial adjustments is a disadvantage to the Plan. However, it is worth noting that the Plan is financially sustainable even though the legislated actuarial adjustments are no longer cost neutral. This is because the legislated contribution rate of 9.9% exceeds both the Eighteenth CPP Report steady-state rate of 9.8% and the steady-state rate of 9.7% where each individual opts for their benefit at age 65. However, it may be possible to eliminate the incentive for early benefit uptake and restore cost neutrality to the Plan without changing the current 0.5% factor. This could be achieved by modifying some of the existing Plan provisions. Ending the contributory period at age 65 for those electing CPP pension before age 65 or requiring working beneficiaries to pay contributions are examples of such possibilities. If a revision is decided upon, for simplicity we recommend approximate monthly actuarial adjustments based on the results of both the steady-state contribution rate and collective methods. To better replicate the exact actuarial adjustments by age, we recommend the use of a uniform approximate monthly factor for ages under 65 that would be different than for ages 65 and over. This approach is consistent with that adopted in a number of other social security programs. Also, the actuarial adjustments should be reviewed periodically to reflect changes in plan provisions and/or in the demographic and economic environments. In the context of an aging population, where life expectancy at age 65 is expected to continue to increase and projected labour force shortages could induce older workers to stay at work longer, policymakers will have to determine whether the current actuarial adjustments should be changed or certain Plan provisions modified to restore neutrality.

Actuarial Study No. 2 Canada Pension Plan
Actuarial Adjustment Factors Study
| 7
I. Introduction On 1 January 1987 the Canada Pension Plan (CPP) introduced a flexible retirement age provision making it possible for contributors to begin receipt of a retirement pension between the ages of 60 and 70. Prior to this amendment, retirement pensions were only payable starting at the normal retirement age of 65. Subsection 46(3) of the governing legislation stipulates that the amount of a retirement pension that becomes payable after 31 December 1986 will be adjusted if it commences in a month other than the month in which the contributor reaches 65 years of age. The basic monthly amount calculated will be adjusted by a factor fixed by the Minister, on the advice of the Chief Actuary of the Office of the Superintendent of Financial Institutions. The factor reflects the time interval between the month in which the retirement pension commences and the month in which the contributor reached, or would reach, 65 years of age, but such time interval shall be deemed to never exceed five years. Currently the amount of retirement pension, payable for life, is adjusted downward by an actuarial adjustment factor of 0.5% per month if retirement benefit uptake occurs prior to the normal retirement age of 65 or is adjusted upward by the same factor if retirement benefit uptake occurs after the normal retirement age. Thus, the pension payable to a contributor who elects to take the retirement benefit at age 60 is equal to 70% of the accrued pension normally payable at age 65. Likewise, the pension payable to a contributor who elects the retirement benefit at age 70 is equal to 130% of the pension otherwise payable. The 0.5% adjustment factor is an approximation to the exact factor by which the amount of a retirement pension should be reduced or increased, depending on the age at which the retirement pension starts being paid. The majority of social security programs use approximate factors to calculate the retirement pension payable at an age other than the normal retirement age. The purpose of the actuarial adjustment is that it should not be more advantageous for individuals to opt for their retirement pensions at age 60 rather than at age 65.
Please note that throughout the study the following two expressions will be used:
Actuarial Adjustment Factor: This expression makes reference to the approximate monthly factor that would be used to calculate the actuarial adjustments at the particular benefit uptake age. This factor would be multiplied by the number of months between the age of benefit uptake and exact age 65. An example is the legislated factor of 0.5% per month. Actuarial Adjustment: This expression makes reference to the adjustment that would be applied to the retirement pension at the particular benefit uptake age. An example would be an actuarial adjustment of 70% at age 60.

Actuarial Study No. 2 Canada Pension Plan Actuarial Adjustment Factors Study
8 |
A. Purpose of Study
The purpose of this study is to review the appropriateness of the actuarial adjustment factor of 0.5% per month. Changing economic and demographic conditions, along with the introduction of new Plan provisions during the last 15 years, have caused the current factor of 0.5% per month to be no longer neutral either to the Plan or to contributors under current Plan provisions. The study looks at how these changes have affected the suitability of the actuarial adjustment factor, using the individual, collective and steady-state contribution rate methods. Such information should facilitate a better understanding of the financial basis of the flexible retirement provision and the elements that influence the choice of a cost neutral adjustment factor.
B. Overview of Study
The determination of actuarial adjustments involves the projection of CPP contributions, retirement and disability benefits. For this purpose all results presented in this study are based on the data, methods and assumptions included in the Eighteenth Actuarial Report on the Canada Pension Plan as at 31 December 2000. Sections II, III and IV present the results under the individual method, the collective method and the steady-state contribution rate method, respectively. Section V presents results of a sensitivity analysis based on changes in three key economic and demographic assumptions. This information shows the impact on the size of the required actuarial adjustments based on changes in the mortality, real wage increase and real rate of return assumptions. Section VI reconciles the current study�s actuarial adjustments with the legislated actuarial adjustments currently in effect. Section VII and VIII provide general information about early and deferred retirement benefit uptake provisions under other social insurance programs around the world.

Actuarial Study No. 2 Canada Pension Plan
Actuarial Adjustment Factors Study
| 9
II. Individual Method A. Overview
The individual method consists of evaluating actuarial adjustments for a single individual. In this context the only elements considered are mortality, rates of return and inflation rates as well as the annual increase in wages. The actuarial adjustment can be defined as the fraction or multiple, depending on the age at retirement pension uptake, that must be applied to a retirement pension such that the present value will be equivalent to the present value, at the same age, of the accrued retirement pension payable at age 65.
B. General Approach
For the individual method we define fx as the actuarial adjustment at age x applicable to the retirement pension such that the present value (PVx) at age [x] of future retirement benefits for an individual opting for the retirement pension at age [x] will be identical to the present value at age [x] of the accrued retirement benefits if the individual opts for the retirement pension at the age of 65. fx PVx (if opts for retirement benefits at age x) = PV65 (if opts for retirement benefits at age 65) P([x], y):Unadjusted pension amount in year y if opts for retirement pension at age [x]. fx: Actuarial adjustment for age [x]. i: Constant annual rate of return for all years. pi: Constant pension indexation rate such that P([x], y+t) = P([x],y) (1 + pi)t
Benefit Payments for Individuals Taking Benefit at Age 60 in Year y
Year Age Amount of Retirement Pension Probability of Survival
Rate of Return PV Factor
y 60 f60 P([60],y) 160/l60 1 y + 1 61 f60 P([60],y) (1 + pi)1 161/l60 (1 + i)-1 y + 2 62 f60 P([60],y) (1 + pi)2 162/l60 (1 + i)-2 y + 3 63 f60 P([60],y) (1 + pi)3 163/l60 (1 + i)-3 y + 4 64 f60 P([60],y) (1 + pi)4 164/l60 (1 + i)-4 y + t 60+t f60 P([60],y) (1 + pi)t 160+t/l60 (1 + i)-t
Benefit Payments for Individuals Taking Benefit at Age 65 in Year y+5
Year Age Amount of Retirement Pension Probability of Survival
Rate of Return PV Factor
y + 5 65 P([65],y+5) 165/l60 (1 + i)-5 y + 6 66 P([65],y+5) (1 + pi)1 166/l60 (1 + i)-6 y + 7 67 P([65],y+5) (1 + pi)2 167/l60 (1 + i)-7 y + 8 68 P([65],y+5) (1 + pi)3 168/l60 (1 + i)-8 y + 9 69 P([65],y+5) (1 + pi)4 169/l60 (1 + i)-9 y +5+t 65+t P([65],y+5) (1 + pi)age-65 165+t/l60 (1 + i)-(5+t)
Actuarial Study No. 2 Canada Pension Plan Actuarial Adjustment Factors Study
10 |
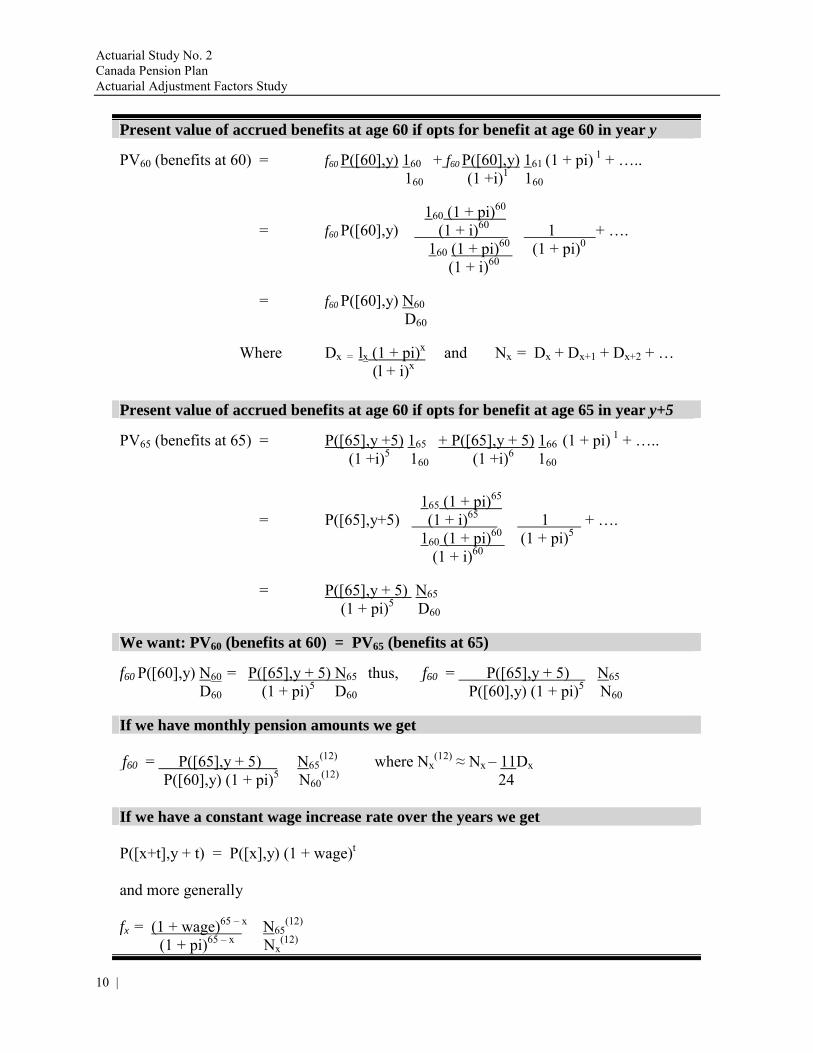
Present value of accrued benefits at age 60 if opts for benefit at age 60 in year y PV60 (benefits at 60) = f60 P([60],y) 160 + f60 P([60],y) 161 (1 + pi) 1 + �.. 160 (1 +i)1 160 160 (1 + pi)60 = f60 P([60],y) (1 + i)60 1 + �. 160 (1 + pi)60 (1 + pi)0 (1 + i)60 = f60 P([60],y) N60 D60 Where Dx = lx (1 + pi)x and Nx = Dx + Dx+1 + Dx+2 + � (l + i)x
Present value of accrued benefits at age 60 if opts for benefit at age 65 in year y+5 PV65 (benefits at 65) = P([65],y +5) 165 + P([65],y + 5) 166 (1 + pi) 1 + �.. (1 +i)5 160 (1 +i)6 160
165 (1 + pi)65 = P([65],y+5) (1 + i)65 1 + �. 160 (1 + pi)60 (1 + pi)5 (1 + i)60 = P([65],y + 5) N65 (1 + pi)5 D60 We want: PV60 (benefits at 60) = PV65 (benefits at 65) f60 P([60],y) N60 = P([65],y + 5) N65 thus, f60 = P([65],y + 5) N65 D60 (1 + pi)5 D60 P([60],y) (1 + pi)5 N60
If we have monthly pension amounts we get
f60 = P([65],y + 5) N65(12) where Nx
(12) ≈ Nx � 11Dx P([60],y) (1 + pi)5 N60
(12) 24 If we have a constant wage increase rate over the years we get P([x+t],y + t) = P([x],y) (1 + wage)t and more generally fx = (1 + wage)65 � x N65
(12) (1 + pi)65 � x Nx
(12)

Actuarial Study No. 2 Canada Pension Plan
Actuarial Adjustment Factors Study
| 11
C. Results
Because the actuarial adjustment at each age depends on each individual circumstance, especially in terms of expectations of wage increases and mortality, the individual method can produce as many actuarial adjustments for each age as there are individuals. For simplicity, the results presented in Tables 1 and 2 below assume that the individual has always earned, and will continue to earn, 100% of the YMPE and that the annual rates of return, inflation and wage increases are as assumed under the Eighteenth CPP Actuarial Report (see Appendix A). For comparison purposes, results are shown for individuals reaching age 60 in 2004, 2014 and 2024. Results based on other rates of return, inflation, and wage increase assumptions are presented in Section V of this report.
Table 1: Actuarial Adjustments (Individual Method: Males) (Male individual always earned 100% of YMPE)
Individual Aged 60 in Age
Legislated Adjustments 2004 2014 2024
60 0.70 0.696 0.717 0.721 61 0.76 0.746 0.763 0.766 62 0.82 0.801 0.814 0.816 63 0.88 0.861 0.869 0.872 64 0.94 0.927 0.931 0.932 65 1.00 1.000 1.000 1.000 66 1.06 1.080 1.077 1.075 67 1.12 1.170 1.162 1.159 68 1.18 1.271 1.259 1.253 69 1.24 1.386 1.368 1.359 70 1.30 1.516 1.492 1.479
Table 2: Actuarial Adjustments (Individual Method: Females) (Female individual always earned 100% of YMPE)
Individual Aged 60 in Age
Legislated Adjustments 2004 2014 2024
60 0.70 0.727 0.745 0.747 61 0.76 0.774 0.787 0.789 62 0.82 0.824 0.834 0.835 63 0.88 0.878 0.884 0.885 64 0.94 0.937 0.939 0.940 65 1.00 1.000 1.000 1.000 66 1.06 1.069 1.067 1.066 67 1.12 1.144 1.140 1.138 68 1.18 1.228 1.222 1.218 69 1.24 1.321 1.312 1.307 70 1.30 1.425 1.413 1.406

Actuarial Study No. 2 Canada Pension Plan Actuarial Adjustment Factors Study
12 |
D. Observations
It is worth noting from Tables 1 and 2 that the actuarial adjustments increase as the year when the individual reach age 60 is further out. This is because the Eighteenth CPP actuarial report assumptions do not reach their ultimate values until about 2015 and as a consequence each individual is not subject to the same economic assumptions as regards real wage increases, real rates of return and mortality. The tables reveal that the actuarial adjustment for females is higher than for males in all cells. This can be explained by the fact that females have lower mortality than males and are expected to live longer than males. Therefore, five additional years of pension payments represent a smaller relative increase in value for females than for males. It should be noted that for the same retirement pension the actuarial present value of retirement benefits for a female aged 65 is greater than for a male of the same age because women live longer. As an example, a female retiring at age 65 in 2004 receiving the maximum CPP retirement pension would have a present value of retirement benefits about 15% higher than for a male.
E. Conclusion
The individual method is strictly based on present values of retirement benefits and is generally easy to understand. From an individual perspective, this method could be viewed as the most appropriate in terms of actuarial neutrality as the actuarial adjustments are determined taking into account only the retirement benefit and the individual�s own particular set of circumstances at time of benefit uptake. On the other hand, this method could prove to be too subjective as two individuals with relatively the same set of circumstances at time of benefit uptake could end up with different actuarial adjustments because of differences in their expectations in respect of future wage increases and life expectancy. Even though actuarial neutrality is achieved on an individual basis, the individual method is not the appropriate lens through which to assess actuarial neutrality in a pension plan such as the CPP because it requires different factors for each individual and is typically focused solely on benefits received at various ages and therefore does not capture all Plan provisions, including the financing. It would also be extremely difficult to administer because subjective decisions would have to be made to take into account each individual�s circumstances and this would result in a multitude of different actuarial adjustments. Another approach, referred to as the collective method, is discussed in the next section of this report. The collective method eliminates the most important caveats to the individual method by recognizing the benefit provisions of the CPP and by determining actuarial adjustments in terms of present values on a collective instead of individual basis.

Actuarial Study No. 2 Canada Pension Plan
Actuarial Adjustment Factors Study
| 13
III. Collective Method A. Overview
For each possible benefit uptake age, the collective method determines actuarial adjustments that are equitable among an open group of individuals, e.g. with the same year of birth. There is a starting population, which is projected to evolve as a result of demographic flows like births, deaths, immigration and emigration. The collective method relies on the CPP valuation model used to make projections underlying the CPP statutory actuarial reports and provides results consistent with the latest actuarial projections included in the Eighteenth CPP Actuarial Report. Notwithstanding the fact that this method does not take into account the steady-state contribution rate financing approach of the Plan, it is more appropriate than the individual approach outlined in the previous section. This is because the collective method takes into account the following two important elements: • Loss of contributions to the Plan due to benefit uptake, and • Loss of eligibility for disability benefits due to benefit uptake before age 65. In other words, the collective method, because it looks at contributions as well as benefits, recognizes key Plan provisions, such as, in the CPP, the contributory period ends at the age of pension take up, not at age 65. As a result, the collective method explicitly recognizes the loss of contributions to the Plan from those who opt for their benefit before the normal retirement age of 65 and the gain in contributions from those who opt for their benefit after age 65. The individual method for calculating actuarial adjustments does not capture this Plan provision since it looks only at the flow of retirement benefits. Indeed, the difference between the results of the two methods is explained in good measure by the failure of the individual method to capture this Plan provision. As individuals opt for the retirement benefit prior to age 65 they forego the possibility of receiving a CPP disability pension if they ever become disabled between the ages of 60 and 64. This potential loss of benefit is taken into account in the collective method but is not recognized under the individual method. It is worth noting that this component of the actuarial adjustment is relatively less important than the contribution component of the collective method and its importance decreases as the age of benefit take up is closer to 64. Under the collective method actuarial neutrality occurs when the net cost to the Plan (contributions and benefits) is the same whether a cohort of individuals take their benefit at age 65 or at any other age from 60 to 70. Actuarial adjustments that are set to achieve this objective are said to be actuarially cost neutral for the Plan and for Plan members on a collective basis. However, it is important to note that an actuarial adjustment derived in this manner may not be actuarially neutral for a particular individual Plan member.

Actuarial Study No. 2 Canada Pension Plan Actuarial Adjustment Factors Study
14 |
B. General Approach
For a cohort of individuals, the actuarial adjustments are simply determined by comparing the present values of the contribution, retirement benefit and disability benefit streams under the various benefit uptake ages with those of a benchmark scenario where all individuals in the cohort opt to take their retirement pension at age 65. The collective actuarial adjustment can be defined as:
Actuarial Adjustment = P – C + D Where: P deals with the retirement pension payment period. It represents the fraction or multiple applied to the pension amount because the pension is payable for a shorter or longer period, depending on the age the cohort opts for the retirement pension. P is thus directly linked to life expectancy and is the most important element of the actuarial adjustment; C deals with the gain or loss of contributions for the Plan when all individuals in the cohort opt for their CPP retirement pension at an age other than 65; and D deals with the loss of eligibility for a disability pension between the ages of 60 to 64 if all individuals in the cohort opt for their CPP pension before age 65. Mathematically, fx = PVR60
65 - (PVC6065 - PVC60
x) + (PVD6065 - PVD60
x) --------------------------------------------------------------- PVR60
x Where: fx= Actuarial adjustment applied to the base pension at age x. PVR60
y= Present value as at age 60 of the retirement pensions paid to the specific cohort if all individuals in the cohort (contributors) opt for their pension at age y.
PVC60
y= Present value as at age 60 of the contributions made between the age of 60 and an age of benefit uptake y. Contributions follow the contribution rate schedule established in the law (i.e. 9.9% for year 2003 and thereafter).
PVD60
y= Present value as at age 60 of the disability pensions paid to the specific cohort at ages 60 and over if all individuals in the cohort (contributors) opt for their retirement pension at age y.
The collective method also requires an assumption about how severe the loss of contributions to the Plan will be if each individual in the cohort opts for the retirement pension at only one specific age, be it 60, 65 or any other age between 60 and 70, inclusive. Table 3 presents a summary of three possible alternative loss-of-contributions assumptions.

Actuarial Study No. 2 Canada Pension Plan
Actuarial Adjustment Factors Study
| 15
Table 3: Summary of Assumptions Regarding Loss of Contributions
Assumption Description
Full Loss of
Contributions
Assumes the same labour force participation rates, job creation rate and unemployment rate as in the Eighteenth CPP Actuarial Report. The plan loses all contributions from individuals who are at or above the age at which all individuals are assumed to take the CPP retirement pension. This is consistent with current plan provisions, where individuals in receipt of a CPP retirement pension are not required to contribute even if they choose to return to work after taking their benefit.
Partial Loss of Contributions
Assumes that the labour force participation rates at or above the age at which all individuals are assumed to take the CPP retirement pension are reduced and the rates under that age are increased to partially offset the loss of contributions from those at or above that age. This is done under the condition that the ultimate unemployment rate remains the same as in the Eighteenth CPP Actuarial Report. The plan loses all contributions from individuals who are at or above the age at which all individuals are assumed to take the retirement pension but it recaptures some of the lost contributions by increasing the labour force participation rates at ages below that age. This could be viewed as akin to the situation that currently exists in the QPP, where working QPP beneficiaries are required to contribute but generally have lower earnings than prior to benefit take up. The reduced earnings indicate that working beneficiaries work fewer hours than prior to benefit uptake and this would leave room to increase the labour force at younger ages.
No Loss of
Contributions
Assumes that the total contributory earnings basis remains unchanged from the one assumed under the Eighteenth CPP Actuarial Report. This assumption ensures the same number of contributors but yields a different ultimate unemployment rate than in the Eighteenth CPP Actuarial Report. The plan loses all contributions from individuals who are at or above the age at which all individuals are assumed to take the retirement pension but it recaptures all the lost contributions by assuming the same total contributory earnings basis. In essence the job creation rate is increased to create one new contributor with the same average contributory earnings for each lost contributor. This scenario is not consistent with the projected working labour force of the Eighteenth CPP Actuarial Report as it projects more workers in the future. It is not consistent with the current reality (as seen in the QPP) where beneficiaries reduce their working activity but stay in the labour force as workers.

Actuarial Study No. 2 Canada Pension Plan Actuarial Adjustment Factors Study
16 |
The full-loss-of-contributions assumption should be considered as the best-estimate assumption for the determination of the actuarial adjustments as it assumes labour force participation rates are the same as in the Eighteenth CPP Actuarial Report, regardless of the assumed age of benefit uptake. When viewed in the context of empirical evidence that suggests that the Canada Pension Plan is not a key determinant in the decision of Canadians to retire from the labour force, the assumption appears appropriate.
On the other hand, the no-loss-of-contributions assumption can be viewed as unrealistic. It requires that new contributors replace all lost contributors with the same average contributory earnings without major changes to the best-estimate labour force assumptions presented in the Eighteenth CPP Actuarial Report. In effect this approach amounts to assuming that the CPP has a very major impact on working or not. It is interesting to note that the results under the no-loss approach would be almost equivalent to the individual method results since contributions would not be a factor in the determination of the actuarial adjustments. For these reasons the remainder of the study will present results that are based on the full-loss-of-contributions assumption. 1. Benchmark: Each individual opts for CPP retirement pension at age 65
The first step of the collective method consists of evaluating for a specific cohort of individuals (i.e. people with the same year of birth) the present value at age 60 of their post-60 contributions (assuming a contribution rate of 9.9% for 2003 and later), retirement benefits and disability benefits if each individual opts for the retirement pension at exact age 65 with no actuarial adjustments. This scenario then becomes a benchmark and is used to determine the actuarial adjustments for any other benefit uptake age. For this benchmark scenario, individuals aged 60 to 64 are not allowed to apply for the retirement pension until they reach the age of 65. The labour force participation rates, job creation rate and the unemployment rate are the same as assumed in the Eighteenth CPP Actuarial Report. There are no contributors at ages 65 and over. The present values of the contribution and benefit streams are calculated using a rate of return discount rate equal to the nominal yield on CPP assets using the best-estimate assumptions of the Eighteenth CPP Actuarial Report and where contributions are determined using the scheduled contribution rate of 9.9% for 2003 and thereafter (see Table 12 of the Eighteenth CPP Actuarial Report).
2. Each individual opts for CPP retirement pension at age 60
The second step of the collective method simply consists of determining the same present values under a scenario where each individual in the cohort is assumed to opt for the retirement pension at age 60. This is done using the same rate of return discount rate as for the benchmark scenario. Again, the labour force participation rates, job creation rate and unemployment rate are the same as assumed under the Eighteenth CPP Actuarial Report. There are no contributors at ages 60 and over.

Actuarial Study No. 2 Canada Pension Plan
Actuarial Adjustment Factors Study
| 17
3. Each individual opts for CPP retirement pension at an age other than 60 or 65
The subsequent steps use the same methodology as for the scenario where each individual opts for the retirement pension at age 60 except that the present values are determined for each possible benefit take up age.
C. Results
Table 4 presents the actuarial adjustments for three different cohorts. For each cohort, the steady-state contribution rate is then derived by application of the collective-method actuarial adjustments and shown in the table. It is clear from the table that the steady-state contribution rates are lower than under the Eighteenth CPP Actuarial Report. This clearly shows that the actuarial adjustments currently in force are not cost neutral for the Plan. This can be easily explained by the fact that for each cohort the collective-method actuarial adjustment for each age under 65 is somewhat lower than that obtained using the current actuarial adjustment factor of 0.5% per month. The chief reason why the currently legislated adjustments are no longer cost neutral under current Plan provisions is the difference between the following two important assumptions used to determine the current actuarial adjustments in 1987 compared with the experience of the CPP since 1987 (see Section VI): ! Rate of return higher than expected, and ! Wage increases lower than expected.
Table 4: Actuarial Adjustments (Collective Method)
Cohort Age 60 in Age
Legislated Adjustments 2004 2014 2024
60 0.70 0.655 0.683 0.685 61 0.76 0.711 0.738 0.739 62 0.82 0.772 0.796 0.797 63 0.88 0.840 0.857 0.858 64 0.94 0.916 0.925 0.925 65 1.00 1.000 1.000 1.000 66 1.06 1.088 1.075 1.077 67 1.12 1.182 1.161 1.165 68 1.18 1.287 1.257 1.263 69 1.24 1.406 1.363 1.370 70 1.30 1.537 1.482 1.480
Steady-State Rate 9.80% 9.62% 9.72% 9.73%

Actuarial Study No. 2 Canada Pension Plan Actuarial Adjustment Factors Study
18 |
Table 5 presents the three components of the actuarial adjustments for the cohort age 60 in 2004. The first and most important component deals with the payment period of the retirement pension. The second component deals with the loss or gain in contributions to the plan due to benefit uptake before or after age 65. The third component is associated with the loss of eligibility for disability benefits if benefit uptake occurs prior to age 65.
Table 5: Actuarial Adjustment Components (Cohort Age 60 in 2004)
Age
Payment Period of Pension Contributions
Loss of Eligibility for
Disability Pension Total
60 0.693 -0.047 0.009 0.655 61 0.741 -0.036 0.006 0.711 62 0.794 -0.025 0.003 0.772 63 0.854 -0.016 0.001 0.840 64 0.922 -0.007 0.000 0.916 65 1.000 0.000 0.000 1.000 66 1.083 0.004 0.000 1.088 67 1.175 0.007 0.000 1.182 68 1.277 0.009 0.000 1.287 69 1.395 0.011 0.000 1.406 70 1.525 0.012 0.000 1.537
Table 6 presents the same information as in Table 5 but for the cohort reaching age 60 in 2024. As discussed earlier, the differences relative to Table 5 are mainly due to the fact that this cohort is not subject to the same economic assumptions as regards mortality, real wage increases and real rates of return.
Table 6: Actuarial Adjustment Components (Cohort Age 60 in 2024)
Age
Payment Period of Pension Contributions
Loss of Eligibility for
Disability Pension Total
60 0.738 -0.062 0.008 0.685 61 0.781 -0.047 0.006 0.739 62 0.827 -0.033 0.003 0.797 63 0.877 -0.020 0.001 0.858 64 0.934 -0.009 0.000 0.925 65 1.000 0.000 0.000 1.000 66 1.072 0.006 0.000 1.077 67 1.156 0.009 0.000 1.165 68 1.251 0.012 0.000 1.263 69 1.358 0.013 0.000 1.370 70 1.475 0.014 0.000 1.489

Actuarial Study No. 2 Canada Pension Plan
Actuarial Adjustment Factors Study
| 19
D. Observations
Actuarial adjustments derived by this method show some sensitivity to underlying economic and demographic assumptions (see Table 4). Namely, actuarial adjustments at ages 60 to 64 increase for cohort 2004 to cohort 2024 and at ages 66 to 69 they decrease reflecting the fact that each successive cohort, especially until 2015, is subject to a different set of assumptions. This effect gradually disappears after 2015 since most of the Eighteenth CPP Actuarial Report assumptions have reached their ultimate values by that time (see Appendix A). As a consequence, we observe much less difference between the cohort age 60 in 2024 compared to 2014 than between the cohort age 60 in 2004 compared to 2014. The results for the cohort reaching age 60 in 2004 better reflect the current economic environment than the results for later cohorts. The contribution component, loss of eligibility of disability component and the payment period component impact the actuarial adjustment for each age differently (see Tables 5 and 6). The contribution component adjustment has more effect on the actuarial adjustments as cohorts opt for their benefit earlier and more contributions are foregone. Similarly, the disability component has a diminishing effect as the age of benefit uptake rises toward the normal retirement age of 65 because the loss of eligibility for disability covers a shorter time period. It is also interesting to note that the payment period component for the cohort aged 60 in 2004 is very close to the actuarial adjustments derived using the individual method since this method looks only at the present value of the retirement benefits.
Analysis of the actuarial adjustments by component underlines that actuarial adjustments are not only dependent on economic and demographic assumptions but also on Plan provisions. This underscores that cost neutrality to the Plan can be restored without necessarily having to change the current actuarial adjustments. For instance, if contributions were required from working beneficiaries (in contrast to current Plan provisions) then the contribution component could be eliminated and the actuarial adjustments for early benefit uptake would be in line with the currently legislated adjustments. This is because by having working beneficiaries contribute, there would no longer be a loss of contributions to the Plan due to early benefit uptake and the contribution component of the collective method would equal zero. The QPP has had this provision since 1998, along with annual benefit recalculations based on post-benefit uptake employment earnings. Alternatively, extending the contributory period to age 65 for everyone (under current Plan provision the contributory period ends at the age of benefit uptake) would increase the payment period component and help to restore cost neutrality without recourse to a change in current actuarial adjustments. In other words for someone who started to contribute at age 18 and then opts for the benefit at age 60, the contributory period would be 47 years and five years of zero earnings would be added between the ages of 60 and 65. Under such circumstances, the payment period component would be higher than under current plan provisions and could entirely offset the contribution component and bring the actuarial adjustments for early benefit uptake to the same level as the currently legislated actuarial adjustments.

Actuarial Study No. 2 Canada Pension Plan Actuarial Adjustment Factors Study
20 |
E. Conclusion
The collective method is a method that is appropriate as it recognizes specific CPP benefit provisions and leads to unique actuarial adjustments that can be applied to a cohort of individuals. The method is also familiar to private sector actuaries. The method can lead to the use of simple approximate monthly actuarial adjustment factors for ages before and after the normal retirement age. The collective method does require that the adjustments be reviewed periodically due to their dependence on the underlying demographic and economic assumptions. Results for the collective method using different assumptions regarding mortality, real wage increases and real rates of return are presented in Section V. Because the collective method ignores the financing aspects of the CPP, in the sense that the steady-state financing principle is not integral to deriving the actuarial adjustments, the next section introduces the steady-state contribution rate method for determining the actuarial adjustments. This new method recognizes all CPP benefit provisions as well as the steady-state contribution rate financing aspects of the CPP.

Actuarial Study No. 2 Canada Pension Plan
Actuarial Adjustment Factors Study
| 21
IV. Steady-State Contribution Rate Method A. Overview
The steady-state contribution rate method is simple and does not involve the calculation of present values of contributions or benefits, as is the case for the individual method (see Section I) and the collective method (see Section II). Even though the method does not use present values, it yields results relatively similar to the more common collective method known to private sector actuaries. Because the steady-state contribution rate method recognizes all the Plan�s current benefit provisions, as well as the financing elements introduced in the 1998 amendments, the method is the preferred one. Under the steady-state method actuarial neutrality occurs when the net cost to the Plan (steady-state contribution rate) is the same whether each individual takes the benefit at age 65 or at any other age from 60 to 70, inclusive. Actuarial adjustments that are set to achieve this objective are said to be actuarially cost neutral for the Plan and for Plan members on a collective basis. However, it is important to note that an actuarial adjustment derived in this manner may not be actuarially neutral for a particular individual Plan member.
B. General Approach
The actuarial adjustment for each possible age of benefit uptake between the ages of 60 and 70 inclusive is determined using an iterative process that yields the same steady-state contribution rate as for the benchmark scenario where each individual takes the CPP retirement pension at age 65. As an example, if the steady-state contribution rate is 9.7% when each individual opts for the retirement benefit at age 65, then the actuarial adjustment at age 60 is the one that will yield a steady-state contribution rate of 9.7% if each individual opts for the benefit at age 60. As was the case for the collective method, the steady-state contribution rate method requires an assumption in respect of the loss of contributions (see Table 3). For the same reasons as discussed earlier for the collective method, the results using the steady-state method are presented using only the full-loss-of-contributions assumption. Benchmark: Each individual opts for CPP retirement pension at age 65
The labour force participation rates are not changed and are the same as assumed under the Eighteenth CPP Actuarial Report. However, there are no contributors at ages 65 and over, because an individual who takes the retirement pension is not required to contribute upon a return to work (based on CCRA data there may be as much as 5% of CPP beneficiaries who return to work). No change in behaviour is assumed for those under 65 in terms of participation in the labour force reflecting the full-loss-of-contributions assumption. The resulting steady-state contribution rate is 9.69% as opposed to the 9.80% in the Eighteenth CPP Actuarial Report.

Actuarial Study No. 2 Canada Pension Plan Actuarial Adjustment Factors Study
22 |
Each individual opts for CPP retirement pension at age 60
The second step consists of determining the actuarial adjustment by an iterative process that yields the same steady-state contribution rate as for the benchmark scenario (retirement at 65) but where each individual is now assumed to take the retirement pension at age 60 instead of 65. In this scenario, there are no contributors aged 60 and over. The labour force participation rates are the same as those assumed in the Eighteenth CPP Actuarial Report. Those aged 60 and over, even if they continue to work, are not required to contribute to the Plan because they have all elected to take the CPP retirement pension.
For this scenario, the actuarial adjustment at age 60 is 64.9%. This adjustment yields the same steady-state contribution rate of 9.69% obtained under the benchmark scenario where each individual opted to take the benefit at 65. Each individual opts for CPP retirement pension at an age other than 60 or 65
The subsequent steps use the same methodology as for the age 60 scenario except that the actuarial adjustment is determined for each possible age of benefit uptake other than 60 or 65.
C. Results
Table 7 presents the actuarial adjustment for each age using the full-loss-of-contributions assumption. Results using different assumptions regarding mortality, real wage increases and real rates of return are presented in Section V.
Table 7: Actuarial Adjustments (Steady-State Method)
Age Legislated
Adjustments Full-Loss-of-Contributions Assumption 60 0.70 0.649 61 0.76 0.708 62 0.82 0.772 63 0.88 0.839 64 0.94 0.914 65 1.00 1.000 66 1.06 1.081 67 1.12 1.176 68 1.18 1.283 69 1.24 1.403 70 1.30 1.540
Steady-State Rate 9.80% 9.60% (1) (1) The steady-state rate of 9.60% is lower than the 9.69% when everyone opts for benefit at age 65 because of the differences in the distribution of retirement rates by age and sex. Note that even though each age of benefit uptake scenario yields the same steady-state rate of 9.69% the resulting funding level for each scenario is different. The 9.60% rate is also lower than the rate of 9.80% of the Eighteenth report because the actuarial adjustments at ages under 65 are lower than the legislated actuarial adjustments.

Actuarial Study No. 2 Canada Pension Plan
Actuarial Adjustment Factors Study
| 23
D. Observations The benchmark steady-state contribution rate of 9.69% obtained when each individual opts for the benefit at age 65 is 0.1% lower than under the Eighteenth CPP Actuarial Report. The moderate downward pressure on the steady-state contribution rate is the net effect of two competing pressures:
•••• Downward pressure on the contribution rate because plan expenditures are reduced
over the short to medium term. This is because benefit uptake is at age 65 rather than average age 62 as in the Eighteenth CPP report.
•••• Upward pressure on the steady-state contribution rate because of somewhat higher
average benefit paid and loss of contributions for ages 65 and over.
The actuarial adjustments under the steady-state approach are close to those obtained for the collective method and show that adjustments currently in force are not cost neutral under current Plan provisions and that there should be greater reductions for early retirement benefit uptake and greater increases in benefits for late retirement benefit uptake. This results in a steady-state contribution rate of 9.60% or 0.2% lower than the 9.80% of the Eighteenth CPP Actuarial Report. As discussed under the collective method section, cost neutrality could also be restored without having to change the current actuarial adjustments for early retirement benefit uptake by changing some of the existing plan provisions as regards contributions and/or length of the contributory period.
E. Conclusion
The steady-state method, which does not require the calculation of actuarial present values, is easy to understand and is appropriate in the context of the CPP as it recognizes all CPP benefit and financing provisions. The method yields unique actuarial adjustments that can be applied to all future cohorts of individuals (same factor for each individual regardless of year of birth). The method can lead to the use of simple approximate monthly actuarial adjustment factors for ages before and after the normal retirement age. The next section shows how the actuarial adjustments determined so far under each of the three methods are affected by changes in certain key demographic and economic assumptions.

Actuarial Study No. 2 Canada Pension Plan Actuarial Adjustment Factors Study
24 |
V. Sensitivity Analysis A. Introduction
An examination of the actuarial adjustments at each age involves the projection of streams of contributions and of retirement and disability benefits over a long period of time. Both the length of the projection period and the number of assumptions required mean that the �true � actuarial adjustments will not be precisely in accordance with the results obtained in this study, which are based on the best-estimate assumptions of the Eighteenth CPP Actuarial Report. For this reason, for each of the methods presented in this study, a sensitivity analysis has been performed to determine the required actuarial adjustments under alternative assumptions. While this study has noted that actuarial adjustments are not only dependent on assumptions but also on Plan provisions, we do not assess the impacts on actuarial adjustments due to changes in certain Plan provisions.
B. Results
1. Individual Method
The individual method requires assumptions regarding inflation, wage increase, rate of return and mortality rates. Tables 8 and 9 show the actuarial adjustments at age 60 for males and females under various combinations of inflation, wage increase and rate of return, respectively. The shaded cells show the results using the ultimate economic assumptions of the Eighteenth CPP Actuarial Report and mortality projected to 2004.
Table 8: Actuarial Adjustments (Male Age 60) (Using different assumptions under the individual method)
Increase in Wages Rate of Return Inflation 0% 1% 2% 3% 4.1%
8.0% 3.0% 0.563 0.591 0.621 0.652 0.688 7.2% 3.0% 0.579 0.608 0.639 0.671 0.707 7.0% 2.0% 0.590 0.620 0.651 0.684 0.721 5.0% 2.0% 0.632 0.664 0.698 0.733 0.773 0.0% 0.0% 0.767 0.807 0.847 0.890 0.938

Actuarial Study No. 2 Canada Pension Plan
Actuarial Adjustment Factors Study
| 25
Table 9: Actuarial Adjustments (Female Age 60) (Using different assumptions under the individual method)
Increase in Wages Rate of Return Inflation 0% 1% 2% 3% 4.1%
8.0% 3.0% 0.588 0.618 0.650 0.682 0.719 7.2% 3.0% 0.605 0.636 0.668 0.701 0.739 7.0% 2.0% 0.617 0.648 0.681 0.715 0.754 5.0% 2.0% 0.660 0.694 0.729 0.766 0.807 0.0% 0.0% 0.800 0.841 0.883 0.928 0.978 The above tables reveal that the stronger the wage growth, the higher the actuarial adjustment must be for any given combination of inflation and rate of return in order to maintain neutrality between individuals taking their pension at different ages. This can be explained by the fact that the adjustment is directly proportional to the amount of pension paid at age 65. The amount of pension that would be paid at age 65 in respect of service to age 60 is the amount of pension accrued at age 60 increased for five years of wage growth. If the wages grow faster than the indexation of the pension taken at age 60 (which is indexed to prices), the individual would be better off retiring at age 65. Thus for this individual not to be affected, the pension reduction would have to be small, and consequently the actuarial adjustment would have to be higher.
The tables also reveal that the actuarial adjustment for females is higher than for males in all cells. This can be explained by the fact that females have lower mortality than males and are expected to live longer than males. Therefore, five additional years of pension payments represent a smaller relative increase in value for females than for males. It should be noted that for the same retirement pension the actuarial present value of retirement benefits for a female aged 65 is greater than for a male of the same age because women live longer. As an example, a female retiring at age 65 in 2004 receiving the maximum CPP retirement pension would have a present value of retirement benefits about 15% higher than for a male.
The rate of return and inflation rate are inversely related to the actuarial adjustment. This can be explained by the fact that the rates of return and inflation have the same effect on the actuarial adjustment. As inflation increases, the value at age 65 of the pension payable at age 60 increases and thus more reduction is required of the pension at age 60 to maintain equivalence at age 65. As the rate of return increases, the value of the pension at age 60 increases relative to the pension payable at age 65 and thus the pension at age 60 requires more reduction.
The proper actuarial adjustments for the 15-year period since the introduction of flexible retirement are found somewhere in the upper left quadrant of the tables, reflecting the fact that the CPP has experienced an economic environment with lower wage increases and higher rate of returns than anticipated in 1987.

Actuarial Study No. 2 Canada Pension Plan Actuarial Adjustment Factors Study
26 |
2. Collective Method
For simplicity, sensitivity tests under the collective method have been performed only for the cohort of people reaching age 60 in 2004. The tests deal with the mortality, real rate of return and real wage increase assumptions. The assumptions for mortality and rate of return are the same as described in the sensitivity analysis section of the Eighteenth CPP Actuarial Report and consist of high- and low-cost scenarios. Results are presented for males, females and both sexes combined. Table 10 below presents a summary description of the sensitivity tests performed under the collective method. Tables 11, 12 and 13 below present the results of the sensitivity analysis.
Table 10: Ultimate Actuarial Assumptions
Low Cost Best-Estimate High-Cost 1. Mortality Improvement Rates 50% of best-estimate CPP#18 150% of best-estimate 2. Real-wage Differential* Best-estimate + 0.5% CPP#18 Best-estimate �0.5% 3. Real Rate of Return Best-estimate + 1.0% CPP#18 Best-estimate �1.0% 4. Combined 1,2 and 3 1,2 and 3 1,2 and 3
* For wages, a slight modification from the Eighteenth CPP report tests had to be made.
Table 11: Actuarial Adjustments (Male Cohort Age 60 in 2004) (Using different assumptions under the collective method)
Mortality Real Wages Real Return Combined
Age Best
Estimate High Cost
Low Cost
High Cost
Low Cost
High Cost
Low Cost
High Cost
Low Cost
60 0.640 0.646 0.635 0.633 0.647 0.663 0.617 0.662 0.618 61 0.699 0.704 0.694 0.692 0.706 0.719 0.679 0.716 0.681 62 0.764 0.768 0.760 0.757 0.772 0.780 0.748 0.777 0.751 63 0.835 0.838 0.832 0.829 0.840 0.846 0.823 0.843 0.825 64 0.913 0.914 0.911 0.909 0.916 0.919 0.906 0.917 0.908 65 1.000 1.000 1.000 1.000 1.000 1.000 1.000 1.000 1.000 66 1.089 1.087 1.091 1.093 1.084 1.082 1.096 1.084 1.093 67 1.184 1.179 1.188 1.193 1.173 1.170 1.199 1.175 1.193 68 1.290 1.282 1.298 1.306 1.274 1.268 1.315 1.276 1.306 69 1.415 1.403 1.427 1.437 1.391 1.383 1.450 1.393 1.438 70 1.553 1.536 1.570 1.583 1.522 1.511 1.600 1.523 1.585
Actuarial Study No. 2 Canada Pension Plan
Actuarial Adjustment Factors Study
| 27
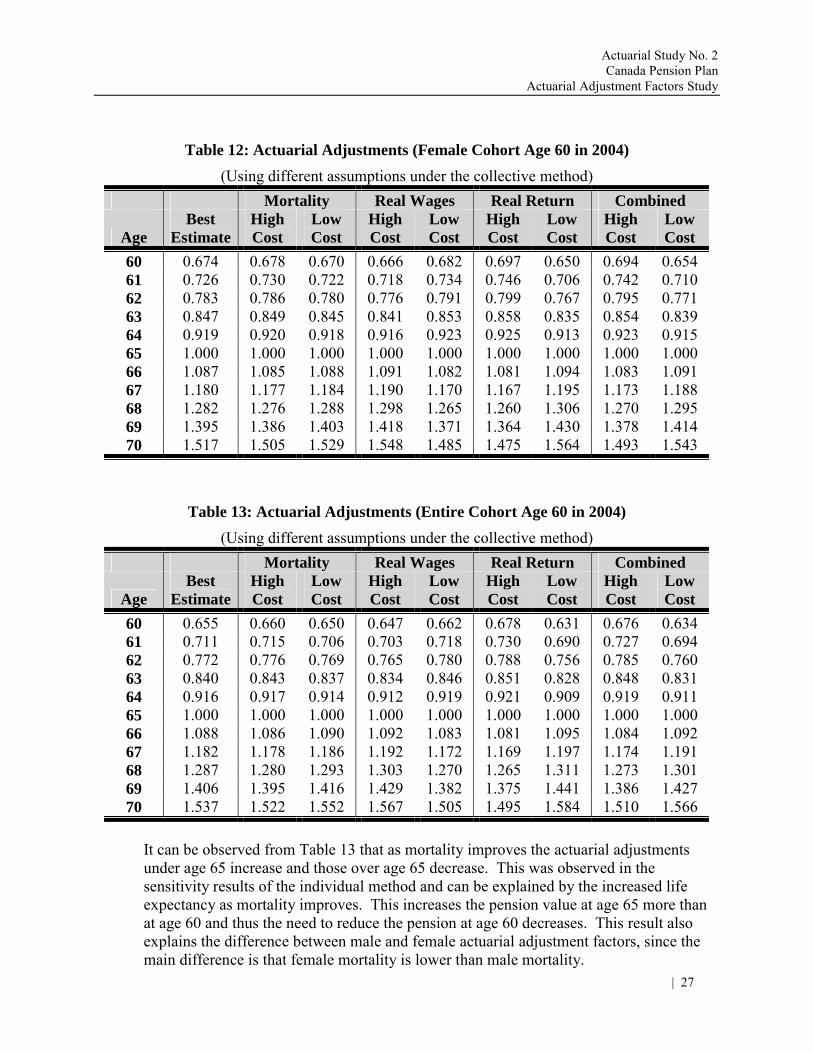
Table 12: Actuarial Adjustments (Female Cohort Age 60 in 2004)
(Using different assumptions under the collective method) Mortality Real Wages Real Return Combined
Age Best
Estimate High Cost
Low Cost
High Cost
Low Cost
High Cost
Low Cost
High Cost
Low Cost
60 0.674 0.678 0.670 0.666 0.682 0.697 0.650 0.694 0.654 61 0.726 0.730 0.722 0.718 0.734 0.746 0.706 0.742 0.710 62 0.783 0.786 0.780 0.776 0.791 0.799 0.767 0.795 0.771 63 0.847 0.849 0.845 0.841 0.853 0.858 0.835 0.854 0.839 64 0.919 0.920 0.918 0.916 0.923 0.925 0.913 0.923 0.915 65 1.000 1.000 1.000 1.000 1.000 1.000 1.000 1.000 1.000 66 1.087 1.085 1.088 1.091 1.082 1.081 1.094 1.083 1.091 67 1.180 1.177 1.184 1.190 1.170 1.167 1.195 1.173 1.188 68 1.282 1.276 1.288 1.298 1.265 1.260 1.306 1.270 1.295 69 1.395 1.386 1.403 1.418 1.371 1.364 1.430 1.378 1.414 70 1.517 1.505 1.529 1.548 1.485 1.475 1.564 1.493 1.543
Table 13: Actuarial Adjustments (Entire Cohort Age 60 in 2004) (Using different assumptions under the collective method)
Mortality Real Wages Real Return Combined
Age Best
Estimate High Cost
Low Cost
High Cost
Low Cost
High Cost
Low Cost
High Cost
Low Cost
60 0.655 0.660 0.650 0.647 0.662 0.678 0.631 0.676 0.634 61 0.711 0.715 0.706 0.703 0.718 0.730 0.690 0.727 0.694 62 0.772 0.776 0.769 0.765 0.780 0.788 0.756 0.785 0.760 63 0.840 0.843 0.837 0.834 0.846 0.851 0.828 0.848 0.831 64 0.916 0.917 0.914 0.912 0.919 0.921 0.909 0.919 0.911 65 1.000 1.000 1.000 1.000 1.000 1.000 1.000 1.000 1.000 66 1.088 1.086 1.090 1.092 1.083 1.081 1.095 1.084 1.092 67 1.182 1.178 1.186 1.192 1.172 1.169 1.197 1.174 1.191 68 1.287 1.280 1.293 1.303 1.270 1.265 1.311 1.273 1.301 69 1.406 1.395 1.416 1.429 1.382 1.375 1.441 1.386 1.427 70 1.537 1.522 1.552 1.567 1.505 1.495 1.584 1.510 1.566
It can be observed from Table 13 that as mortality improves the actuarial adjustments under age 65 increase and those over age 65 decrease. This was observed in the sensitivity results of the individual method and can be explained by the increased life expectancy as mortality improves. This increases the pension value at age 65 more than at age 60 and thus the need to reduce the pension at age 60 decreases. This result also explains the difference between male and female actuarial adjustment factors, since the main difference is that female mortality is lower than male mortality.

Actuarial Study No. 2 Canada Pension Plan Actuarial Adjustment Factors Study
28 |
As real wages increase at a higher rate (other things being equal), the actuarial adjustments under age 65 increase and those over age 65 decrease. This result is observed under the individual method and is explained by the fact that the actuarial adjustment is directly proportional to the amount of pension paid at age 65, which is the amount of pension at age 60 together with wage increases for five years. If wages increase faster than, for example, the indexation of the pension taken at age 60, the individual would be better off retiring at age 65. Thus, for this individual not to be affected the reduction would have to be small, i.e. the actuarial adjustment would have to be higher. Finally, as the real rate of return increases, the actuarial adjustments under age 65 decrease and those over 65 increase. This result is explained by the fact that as real rates of return increases the relative decrease in value of the pension at age 65 is less than the relative decrease in the value of a pension payable from an earlier age. Therefore, the pension payable at ages under 65 needs more reduction to maintain the equivalence.
3. Steady-State Contribution Rate Method
The sensitivity tests performed under the steady-state contribution rate method mirror those performed under the collective method. However, under the steady-state approach results by sex are irrelevant as the current Plan financing is based on a unisex contribution rate. Table 14 summarizes the results of the sensitivity analysis if the actuarial adjustments apply starting in 2004.
Table 14: Actuarial Adjustments (Steady-State Method) (Using different assumptions under the steady-state method)
Mortality Real Wages Real Return Combined
Age Best
Estimate High Cost
Low Cost
High Cost
Low Cost
High Cost
Low Cost
High Cost
Low Cost
60 0.649 0.660 0.637 0.633 0.665 0.677 0.621 0.674 0.625 61 0.708 0.718 0.697 0.695 0.721 0.732 0.684 0.730 0.687 62 0.772 0.780 0.763 0.762 0.782 0.791 0.753 0.790 0.754 63 0.839 0.846 0.833 0.833 0.846 0.853 0.826 0.854 0.826 64 0.914 0.918 0.910 0.911 0.917 0.921 0.907 0.923 0.906 65 1.000 1.000 1.000 1.000 1.000 1.000 1.000 1.000 1.000 66 1.081 1.077 1.085 1.089 1.074 1.072 1.090 1.076 1.087 67 1.176 1.167 1.185 1.191 1.162 1.157 1.195 1.162 1.190 68 1.283 1.268 1.299 1.305 1.262 1.252 1.314 1.258 1.307 69 1.403 1.380 1.429 1.434 1.374 1.360 1.449 1.365 1.441 70 1.540 1.506 1.576 1.581 1.500 1.480 1.602 1.484 1.594

Actuarial Study No. 2 Canada Pension Plan
Actuarial Adjustment Factors Study
| 29
VI. Reconciliation With Legislated Actuarial Adjustments The legislated actuarial adjustments, which came into force in 1987, set the actuarial adjustment factor at 0.5% for each month the retirement pension uptake date precedes or follows the attainment of age 65. The actuarial adjustment is 70% at age 60 and 130% at age 70. As can be seen from the first two columns of Table 15, the actuarial adjustments obtained using the steady-state contribution rate method are lower than the legislated adjustments for ages under 65. The differences are mainly due to changes in economic conditions since the implementation of the flexible retirement provision in 1987. To demonstrate this, the last column of Table 15 uses the key economic assumptions underlying the Tenth CPP Actuarial Report as at 31 December 1985 (inflation 3.5%, wages 5% and rate of return 6%). As can be seen, the actuarial adjustments shown in the last column are fairly close at most ages to the legislated adjustments.
Table 15: Comparison of Steady-State and Legislated Actuarial Adjustments
Age Steady-State
(18th CPP report) Legislated Actuarial
Adjustments
Steady-State (18th CPP report
but 1985 Economic Assumptions)
60 0.649 0.700 0.717 61 0.708 0.760 0.761 62 0.772 0.820 0.814 63 0.839 0.880 0.869 64 0.914 0.940 0.929 65 1.000 1.000 1.000
The principal reason why the legislated actuarial adjustments, which were established in 1987, are no longer actuarially cost neutral is because the economic environment over the last 15 years was different than expected. First, the real rate of return was higher than expected. Second, the real wage increases experienced by the work force were smaller than expected. If both a higher real rate of return and lower real wage had been assumed in 1987, the legislated actuarial adjustments would have been close to the ones presented in this study and would have resulted in cost neutrality. Differences with the legislated actuarial adjustments for ages above 65 are not shown but would generally be greater than for ages under 65. This is because the legislated actuarial adjustments are based on a simple actuarial adjustment factor of 0.5% per month while the exact actuarial adjustments grow exponentially by age. It is worth noting that only about 3% of contributors actually opt for the retirement pension after age 65.

Actuarial Study No. 2 Canada Pension Plan Actuarial Adjustment Factors Study
30 |
VII. Comparison With Québec Pension Plan The Québec Pension Plan (QPP) was put in place at the same time as the CPP (in 1966) and provides persons who work in Québec (or have worked in Québec) and their families with basic financial protection in the event of retirement, death or disability. The QPP is a compulsory public insurance plan and is very similar to the CPP, which covers workers in the rest of Canada. The contributory period for both the CPP and QPP begins in the month following the 18th birthday or on 1 January 1966 if the person turned 18 before that date and ends in the month preceding the one in which a retirement pension begins, the 70th birthday is reached or the death of the contributor occurs. However, QPP contributions are required as long as the individual works and the retirement pension is increased proportionately if the earnings are greater than those of a year that was taken into consideration in the calculation of the pension. Under the CPP once an individual opts for the retirement benefit no contributions are required on post benefit uptake work earnings. Just as for the CPP, the QPP retirement pension is calculated on the basis of employment earnings on which contributions were made, and its amount is adjusted depending on how many months the pension starts being payable before or after the normal retirement age of 65. Under both the CPP and QPP, to be eligible to start receiving the retirement pension before the age of 65 the estimated employment earnings for the twelve months after the one in which the pension starts must be no greater than 25% of the maximum pensionable earnings, that is, the maximum annual amount on which a worker can make contributions to the Plan. Also, for ages under age 65, the pension under both Plans is reduced by 6% per year (1/2% for each month) preceding the 65th birthday. For example, if the pension starts at age 63, it will be decreased by 12% (two years times 6%). This is the same as under the CPP. For pension starting over age 65, there is no work cessation test under either Plan and the pension is increased by 6% per year (1/2% for each month) between the 65th birthday and the time when the pension begins. For example, if the pension starts at age 68, it is increased under both Plans by 18% (three years times 6%). This increase applies as long as the pension is paid.

Actuarial Study No. 2 Canada Pension Plan
Actuarial Adjustment Factors Study
| 31
VIII. International Comparison This section shows what other jurisdictions are doing in respect of early and deferred retirement benefit uptake. The social security programs of the United States, Germany, Sweden, France, the United Kingdom and Spain are included herein. Table 16 shows a summary of the various flexible retirement provisions that exist under the various programs presented in this section.
Table 16: International Comparison of Actuarial Adjustments
Adjustment Factor (% per month) Program
Normal Retirement Age (NRA) Under NRA Over NRA Work Earnings
CPP (Canada less Québec)
65 0.50 0.50
To receive pension, must earn less than a maximum pension at time of
application. No contributions required on post-benefit earnings
QPP (Québec) 65 0.50 0.50
To receive pension, must earn less than a maximum pension at time of application. Contributions required on post-benefit earnings but also
annual benefit recalculation
United States
Currently 65 8/12. Varies with year of birth and will
reach age 67 for those aged 62 in 2022 and later
First 36 months 0.55
Subsequently
0.42
0.625 (if 62 in 2003-04)
0.667
(if 62 in 2005+)
Pension reduction on earnings before NRA. Reduction varies by level of earnings. Contributions
required on post-benefit earnings but also annual benefit
recalculation
Germany 65 0.30 0.50 Pension reduction on earnings
before NRA. Reduction varies by level of earnings
Sweden
Old system 65
New System
Available from age 61
Old system 0.50
New system Based on life expectancy
Old system 0.70
New system Based on life expectancy
Old system Pension reduction on earnings
before NRA. Reduction varies by level of earnings
France
Compulsory Program 60
Supplemental Regimes
65
Compulsory Program No early benefits
Supplemental Regimes
0.33 first 36 months 0.42 next 24 months 0.58 next 60 months
No deferred increments
Pension reduction on earnings after NRA. Reduction varies by level of
earnings
United Kingdom
Men 65
Women
60 but set to increase to 65 from 2010 to 2020
No early benefits About 0.60 No pension reduction due to earnings
Spain 65 0.67 or 0.5
(depends on years of contributions)
No deferred increments
To receive pension must be out of work force

Actuarial Study No. 2 Canada Pension Plan Actuarial Adjustment Factors Study
32 |
United States The Old-Age and Survivors and Disability Insurance program (OASDI) in the United States provides retirement benefit coverage to gainfully occupied persons, including self-employed persons with some exclusions. The source of funds is contributions on earnings from insured persons, with the rate of contributions being 6.2% of earnings for both employees and their employers and 12.4% for the self-employed. There are maximum earnings for contribution and benefit purposes. The retirement pension is based on covered earnings averaged over the period after 1950 (or age 21, if later), and is indexed for past wage inflation, up to age 62 (or death, if earlier), with the five years of lowest earnings being excluded. Earnings in years outside this period may be substituted, if higher. The pension is available as early as age 62, but reduced for each month of receipt prior to the normal retirement age. It is also reduced to take account of work earnings before the normal retirement age. The pension is incremented for each month the worker delays retirement after the normal retirement age. Once a pension is payable there is an automatic annual cost-of-living adjustment. Note that under the OASDI program the earliest age for retirement benefit uptake is 62 and not 60 as is the case under the CPP and QPP. The normal retirement age (NRA) in OASDI is planned to gradually increase from age 65 for those reaching age 62 before 2000 to age 67 for those reaching age 62 in 2022 and later. For those opting for their benefit before the NRA, the adjustment factor is 5/9 of 1% for each of the first 36 months and 5/12 of 1% for each subsequent month. As an example, when the NRA will be 66 in 2005 for those born in 1943, the actuarial adjustment will be 75% at age 62. This can be compared to an actuarial adjustment of 76% at age 61 (four years before the NRA) for the CPP and QPP. For OASDI, in general, the reduction in the pension for early benefit uptake is slightly higher than for the CPP and QPP. In OASDI, the increase in the pension for individuals opting for their benefit after their NRA is planned to increase from 7.5% per year of deferral for those reaching age 62 in 2003 and 2004 to 8% per year for those reaching age 62 in 2005 and later. For the CPP and QPP this factor is only 6% per year after age 65. Table 16 presents a summary of the early and delayed retirement actuarial adjustments under the OASDI program. It is worth noting that under OASDI, contributions are required on post benefit uptake employment earnings. If a working beneficiary has earnings in any post-entitlement year that are larger than the smallest earnings (after indexing, if appropriate) in his/her computation years, the post-entitlement year replaces the lowest earnings year in the computation period, and the recalculated benefit is payable beginning with January of the following year. Benefit recalculation is thus triggered by the attainment of some relative level of post-entitlement earnings, that is, in comparison to the lowest (indexed) yearly earnings in the computation period. Also, if an individual keeps working while in receipt of a retirement pension the benefit amount may be reduced until the NRA (formerly until age 70). If the individual is under the NRA when the pension starts, then one dollar in benefits is deducted for every two dollars earned above an

Actuarial Study No. 2 Canada Pension Plan
Actuarial Adjustment Factors Study
| 33
annual limit, which is $11,520 in 2003. In the year where the individual reaches the NRA, one dollar in benefits will be deducted for every three dollars earned above a different limit, but only counting earnings before the month in which the individual reaches the NRA. As an example, if the individual reached age 65 during 2002 (born in 1937), the limit on earnings for the months in 2002 before age 65 is $30,000. For people born in 1938 who reach the NRA of 65 and 2 months in 2003, the limit increases to $30,720. Finally, starting with the month the individual reaches the NRA the benefits are no longer reduced because of earnings. It is important to note that when benefits are withheld during any month because of the earnings-test, benefits are recalculated at the normal retirement age to exclude any month for which benefits were partially or totally withheld. The recalculation of benefits compensates for forgone benefits resulting from working. For example, if a beneficiary looses an entire year of benefits due to the earnings-test, her/his benefit will be recalculated at his/her normal retirement age to take into account that he/she did not receive a benefit for a full year. The beneficiary will receive an adjustment to the actuarial factor
Table 17: OASDI Actuarial Adjustments
Actuarial Adjustments by Age (%) Year of birth
Normal Retirement Age (NRA)
Annual Adjustment factor for delayed
retirement 62 65 66 67 70 1941 65, 8 mo 7.5% 76.7 95.6 102.5 110.0 132.5 1942 65, 10 mo 7.5% 75.8 94.4 101.3 108.8 131.3 1943-54 66 8.0% 75.0 93.3 100.0 108.0 132.0 1955 66, 2 mo 8.0% 74.2 92.2 98.9 106.7 130.7 1956 66, 4 mo 8.0% 73.3 91.1 97.8 105.3 129.3 1957 66, 6 mo 8.0% 72.5 90.0 96.7 104.0 128.0 1958 66, 8 mo 8.0% 71.7 88.9 95.6 102.7 126.7 1959 66, 10 mo 8.0% 70.8 87.8 94.4 101.3 125.3 1960+ 67 8.0% 70.0 86.7 93.3 100.0 124.0
*Adjustment factors for ages under NRA are 5/9 of 1% for first 36 months and 5/12 of 1% for subsequent months. Pensions before NRA are also subject to further reductions due to work earnings.
Germany Following the unification of the Federal Republic of Germany (FRG) and the German Democratic Republic (GDR), the two systems were merged effective 1 January 1992, at which time Part VI of the Social Act came into force throughout the entire federal territory. Germany provides retirement pension coverage to employed persons (including apprentices), certain self-employed persons, persons caring for a child under age three, recipients of social benefits (such as unemployment benefits), conscripts or persons doing community service instead of military service, and voluntary care workers. The source of funds is contributions from and in respect of insured persons, with the contribution rate being 9.55% for both

Actuarial Study No. 2 Canada Pension Plan Actuarial Adjustment Factors Study
34 |
employees and employers on earnings above a minimum and subject to a maximum. The rate is 19.1% for the self-employed. The retirement pension is payable at age 65 with a minimum of five years of contributions. Early retirement is possible from age 63 with 35 years of contributions or from age 60 with 15 years of contributions and specific conditions of employment before age 60. For females, early retirement is possible from age 60 with ten years of compulsory contributions after age 40. Early retirement is also possible from age 60 for severely disabled individuals with a minimum of 35 years of contributions. The retirement pension is based on the total of individual earnings points (individual's annual earnings divided by the average earnings of all contributors), multiplied by the normal entry factor of 1.0 and the pension value. The pension value is the monthly benefit amount for one year of average covered earnings, adjusted for changes in wages. Periods of incapacity for work, unemployment, and schooling after age 17 are also taken into account. The normal entry factor is 1.0 and increases or decreases depending on the age at which the pension is drawn. For early retirement, the entry factor reduces the pension by 0.3% for every calendar month a pension is drawn before age 65. For deferred retirement, the entry factor increases the pension by 0.5% for every calendar month a pension is drawn after age 65. The early retirement benefits are not reduced as much in Germany as it is the case for the CPP, i.e. 0.3% per month as opposed to 0.5% per month, while the factor for deferred retirement is the same. Partial retirement is available for pensioners under age 65 with employment earnings; if the earnings are less than a minimum, the full pension is paid. However, if the earnings are above that amount, partial pension is paid at 2/3, 1/2 or 1/3 depending on the individual's earnings level. Benefits are adjusted annually on 1 July for changes in the pension value in proportion to changes in earnings and the contribution rate. Sweden In 1999, a new social insurance system, including mandatory private "premium pension" accounts, was established. There is a gradual transition from the old system to the new system for persons born between 1938 and 1953. Persons born in 1954 and later are completely covered under the new system; those born in 1937 or earlier will remain entirely covered under the old system. The old system covers all employees and self-employed persons earning over an increased base amount. The new system covers all employed and self-employed residents and provides for an earnings-related premium pension. Since 1999, the old and the new system have had the same source of funds. Insured persons are required to contribute 7% of assessable income (up to 7.5 times the increased base amount) while self-employed persons are required to contribute 10.21% of assessable earnings. Employers contribute 10.21% of payroll.

Actuarial Study No. 2 Canada Pension Plan
Actuarial Adjustment Factors Study
| 35
Old system The earnings-related pension is equal to 60% of the current base amount multiplied by the insured's average annual number of pension points in the 15 years with most points. The full pension requires 30 years of coverage; for shorter coverage, the pension is reduced accordingly. The pension is payable with a minimum of three years coverage. The normal retirement age is 65 and early retirement from age 61 is possible with a permanent 0.5% reduction per month, while delayed retirement until age 70 is also possible with a permanent increment of 0.7% per month. New system The new system earnings-related pension consists of a system of notional accounts. The pension formula consists of an annual index based on the development of average wages reported to the pension system (disability pension payments are counted as earnings for this purpose) plus an annuity factor which depends on average life expectancy at the time of retirement for the appropriate age cohort and on a "norm" for expected increase of average wages in future years. The pension payments are calculated by dividing total accrued pension assets by this factor. The life expectancy is based on the most recent average unisex life expectancy statistics over a five-year period. The "norm" for increase in average wages is set at 1.6% and is used for annual adjustment of pensions in current payment as well as for calculating the first-year pension amounts. Early retirement is possible from age 61 and is based on all lifetime earnings reported to the scheme from age 16. There exist no explicit actuarial adjustments for early or deferred retirement as the pension benefit automatically takes into account changes in life expectancy at time of benefit uptake through the annuity factor, which is also affected by the wage growth. The lower the age at benefit uptake, the higher is the annuity factor (denominator) used in the pension formula and thus the lower is the benefit payment since it will be paid over a longer period of time. France France provides for compulsory basic old-age pension coverage for all employed persons. The source of funds is contributions from insured persons of 6.55% of insurable earnings plus 0.1% of total earnings for the surviving spouse's allowance. Employers contribute 8.2% of insurable earnings plus 1.6% of total payroll. There are maximum insurable earnings for contributions and benefit purposes. To qualify for the basic old-age pension an individual must be 60 years old with at least one quarter of insurance coverage. The old-age pension depends on age and the duration of insurance coverage. As of 1 January 2008 it is 25% to 50% of average salary for the best 25 years (between 1 January 1994 and 31 December 2007, the number of years taken into account varies between 11 and 24, depending on the year of birth). The full pension of 50% of adjusted average salary is paid if the insured has reached 65 years of age or has 160 quarters of insurance coverage in any scheme as of 1 January 2003. Between 1 January 1994 and 31 December 2002,

Actuarial Study No. 2 Canada Pension Plan Actuarial Adjustment Factors Study
36 |
the number of quarters required will vary between 151 and 159 according to the year of birth. The pension is reduced for coverage of less than the required number of quarters. Benefits are adjusted for changes in the cost of living. The pension is payable only when employment in the previous occupation has ceased definitely. Taking another job is permitted, but pension will be reduced by 30%, 50% or 70% according to the level of post-benefit employment earnings. Employers and employees can also take part in supplemental retirement regimes under which the individuals can opt for a reduced benefit as early as age 55. The actuarial adjustment factors before age 65 are about 0.33% per month for the first 36 months, 0.42% per month for the next 24 months and about 0.58% per month for the next 60 months. United Kingdom In the United Kingdom, the coverage consists of a basic retirement pension (flat rate) and an additional pension commonly known as the State Earnings-Related Pension Scheme (SERPS). Employer or employee may contract out of SERPS according to specified conditions. The pension scheme is financed by employees� contributions and is 10% of weekly earnings between a minimum and a maximum. Participating employers contribute 11.9% of employee earnings over a weekly minimum. If an employer and an employee contract out of SERPS, the rate is 8.9% and 8.4% respectively. Self-employed people contribute a weekly flat rate plus 7% of net income between annual earnings limits. Basic Retirement Pension To qualify for the pension a man must be at least age 65 and a woman must be at least age 60. The age for women is set to gradually rise to 65 from 2010 to 2020. To receive the flat-rate basic retirement pension one must have paid 50 weeks of contributions before April 1975 or contributions based on earnings of at least 50 times the lower earnings level in tax years April 1975 to April 1978. Since 1978, contributions have been based on earnings 52 times the lower earnings level. Coverage is required for approximately 90% of working life years. A pension is reduced proportionately for shorter coverage. The number of years required for a full pension is reduced for a period of caring for a child or an elderly or disabled relative. Coverage is credited for periods covered by claims for certain benefits (such as incapacity benefit and jobseeker's allowance). The basic retirement pension is a weekly flat rate (subject to a maximum). There are no early benefit provisions, but there are increments for deferred retirement of 1/7 of 1% for each week (or about 0.6% per month) of delayed retirement between the ages 65 and 70 for men or 60 and 65 for women (between 65 and 70 after 2020 for women) subject to a minimum deferment period of seven weeks. There is a small weekly age addition for a person aged 80 or over. Post-benefit work earnings do not affect the pension. The pension is increased annually according to price changes.

Actuarial Study No. 2 Canada Pension Plan
Actuarial Adjustment Factors Study
| 37
State Earnings-Related Pension Scheme (SERPS) The SERPS pension is based on employee contributions paid on earnings between the National Insurance lower and upper earnings levels commencing April 1978. The accrual rate is 1.25% per year of coverage, based on average indexed surplus earnings after 1978, equal to 25% of average earnings over a notional working life of the best 20 years. For a pensioner reaching pensionable age between April 1999 and April 2009, the accrual rate on earnings after April 1988 decreases gradually from 25% to 20% of average earnings over the entire working life. Spain The old-age pension covers employees in industry and services (classified according to 11 occupational classes). The program is financed through employee and employer contributions at rates of 4.7% and 23.6%, respectively, of covered earnings based on wage classes that vary according to the occupational classes. Contributions are subject to maximum earnings. To qualify for the old age pension a person must be age 65 (lower for difficult, dangerous, or unhealthy work) or age 64 if the employer replaces the retiree with a registered unemployed. A person must have 15 years of contributions, including two years of contributions in the last 15 years. Retirement from employment is necessary. The old-age pension is 50% of the benefit base for the first 15 years of contributions, plus 3% for each year between 16 and 25 years, and 2% for each year beginning with the 26th year, up to a maximum of 100%. If a person who has 30 years of contributions opts for the benefit before the age of 65, the pension is reduced by 8% for each year less than 65 (0.67% per month), or by 7.5% with 31 to 34 years of contributions, 7% with 35 to 37 years of contributions, 6.5% with 38 to 39 years of contributions or by 6% (0.5% per month) with 40 years or more of contributions. There is a periodic adjustment of pensions each year according to anticipated changes in the consumer price index for that year.

Actuarial Study No. 2 Canada Pension Plan Actuarial Adjustment Factors Study
38 |
IX. Conclusion In this study actuarial neutrality is used to mean Plan Neutrality, which exists when the net cost to the Plan (steady-state contribution rate) is the same regardless of whether contributors take the retirement benefit at age 65 as opposed to any other age between 60 and 70, inclusive. That is, the timing of any Plan member�s retirement benefit uptake is neither advantageous nor disadvantageous to all Plan members taken as a group. Plan neutrality takes into consideration all Plan provisions, including benefits and contributions. The purpose of actuarial adjustment is to ensure Plan neutrality. Actuarial adjustment is necessary to take account of the fact that, in the case of early benefit uptake, fewer years of contributions will be made and more years of benefits will be received. In the case of late retirement benefit uptake, actuarial adjustment takes into account the fact that more years of contributions will be made and fewer years of benefits will be received. Currently the amount of the CPP retirement pension is adjusted by a factor of 0.5% for each month (or 6% for each year) that the retirement pension commences prior to or after the month a contributor turns 65. This study found that the legislated actuarial adjustments are too generous for contributors who elect for the retirement benefit before age 65 and are therefore disadvantageous to the Plan. That is, early retirement benefit uptake is subsidized. The study also found that the legislated actuarial adjustments are not generous enough for contributors who elect to take the retirement benefit after age 65 and are therefore advantageous to the Plan. That is, benefit uptake after age 65 is penalized. However, it is worth noting that the Plan remains financially sustainable even though the legislated adjustments are no longer cost neutral. This is because the legislated contribution rate of 9.9% exceeds both the Eighteenth CPP Report steady-state rate of 9.8% and the steady-state rate of 9.7% for a scenario where each individual opts for their benefit at age 65. As discussed under the collective method, it may be possible to restore cost neutrality to the Plan without having to change the legislated adjustments. This could be achieved by modifying some of the existing Plan provisions. Requiring working beneficiaries to pay contributions or ending the contributory period at age 65 for everyone are examples of such possibilities. Whichever approach is used to restore neutrality, for simplicity we recommend the use of approximate actuarial adjustment factors based on the actuarial adjustments obtained under the collective and steady-state methods. Also, to better replicate the exact actuarial adjustments by age, we recommend the use of a uniform approximate monthly factor for ages under 65 that would be different from the one used after the 65th birthday. This approach is consistent with that adopted in other social security programs. Also, the monthly actuarial adjustment factors should be reviewed periodically to reflect changes in Plan provisions and/or in the demographic or economic environment. The generosity of the current legislated actuarial adjustments creates an incentive for individuals to opt for the CPP retirement pension at an early age (currently about age 62 on average). In the context of an aging population, where life expectancy at age 65 is expected to continue to increase, and projected labour force shortages could induce older workers to stay at work longer, policymakers will have to determine whether the legislated actuarial adjustments now in force

Actuarial Study No. 2 Canada Pension Plan
Actuarial Adjustment Factors Study
| 39
should be changed or whether certain Plan provisions should be changed to restore cost neutrality. In particular, should the actuarial adjustments at ages 65 and over be increased so as to provide increases in post-65 pensions that would be more in line with the theoretical actuarial adjustments obtained under the methods studied? These are questions that policymakers will have to answer but that fall beyond the scope of this study.

Actuarial Study No. 2 Canada Pension Plan Actuarial Adjustment Factors Study
40 |
X. Appendix A: Key Economic Assumptions
Table 18: Eighteenth CPP Actuarial Report Economic Assumptions
Labour Force
Year
Real Increase in
Average Annual Wage
Real Increase in Average
Weekly Earnings
(AWE/YMPE) Price
Increase Participation
Rate
Job Creation
Rate Unemployment
Rate
Labour Force Annual Increase
(%) (%) (%) (%) (%) (%) (%)
2001 (0.50) (1.00) 2.8 66.1 0.5 7.4 1.2 2002 0.00 0.20 2.0 65.8 0.3 7.8 0.7 2003 0.55 0.30 2.0 65.4 1.0 7.5 0.6
2004 0.60 0.40 2.0 65.4 1.4 7.2 1.2 2005 0.65 0.50 2.0 65.4 1.3 7.1 1.2 2006 0.70 0.60 2.1 65.4 1.2 7.1 1.1
2007 0.75 0.70 2.2 65.3 1.1 7.0 1.0 2008 0.80 0.80 2.3 65.1 1.0 6.9 0.9 2009 0.90 0.90 2.4 65.0 0.9 6.8 0.9
2010 1.00 1.00 2.5 65.0 0.9 6.8 0.9 2015 1.10 1.10 3.0 64.1 0.4 6.5 0.4 2020 1.10 1.10 3.0 62.9 0.3 6.5 0.3
2025 1.10 1.10 3.0 61.7 0.2 6.5 0.2 2050 1.10 1.10 3.0 59.7 0.1 6.5 0.1 2075 1.10 1.10 3.0 59.1 0.2 6.5 0.2