Embed Size (px)
Citation preview
Forschungszentrum Julich
lnstitut fur Nuklearchemie
Activntion cros« Seetions ~uld
"
<£jq trl!' &"'~ @IF'g"#'C<ff?'tT"fJ<5; Ci:' cti~ "'" IQl ~ t/l~~ Ci:'. ""j) t~JJ f1 Jjf fjJ~ lij .~" -'"J 11 ~D,;:jjJ,;;jJ ~ 1Jh, ~J Ii IJ If" @ lb \1,,9 pd;}
in Neutron Indu,'ed Reactions"' 'ft'·, .... <. d'" L'U" .. ,. q .. ,11, / .... ......" ." ..on cr-, "» eru: lid" sotopes m
the erg,v l?iulge [9 to 1J AllIe IV
Andreas Fessler

Berichte des Forschungszentrums Hilich 3502
Activation Cross Sections andIsomeric Cross Section Ratiosin Neutron Induced Reactionson Cr-, Pe-, and Ni-Isotopes inthe Energy Range 9 to 21 MeV
Andreas Fessler
Berichte des Forschungszentrums JUlich ; 3502ISSN 0944-2952Institut fOr Nuklearchemie JOI-3502D38 (Diss. Universitat K61n)
Zu beziehen durch: Forschungszentrum JOlich GmbH· ZentralbibJiothekD-52425 Jullch . Bundesrepublik Deutschlande 02461/61-6102· Telefax: 02461/61-6103· e-mail: [email protected]
Abstract
A knowledge of cross sections of neutron induced reactions on the structural materialsCr, Fe and Ni is important for practical applications in fusion reactor technology as well asfor testing nuclear models. In the present study excitation functions were measured for the50Cr(n,pn+np+d)49y, 52Cr(n,2ni1Cr, 52Cr(n,pi2y, 53Cr(n,pi3y 53Cr(n,pn+np+d)52y,54Cr(n,p)54y 54Cr(n,pn+np+di3y, 54Cr(n,ui1Ti, 54pe(n,2n)53pe, 54pe(n,t)52Mn,58Ni(n,ui5pe, 58Ni(n,pu+uPi4Mn and 62Ni(n,u)59pe reactions from 9 to 21 MeY. In
addition, isomeric cross section ratios were also measured for the isomeric pairs formed in54pe(n,2n)53m,gPe and 54pe(n,t+dn)52m,gMn processes.
Use was made of the activation technique. The radioactivity was measured via highresolution gamma-ray and X-ray spectrometry, the latter in combination withradiochemical separation and preparation of thin samples. Monoenergetic neutronsproduced via the 2H(d,niHe reaction at the FZ Julich and the 3H(d,n)4He reaction at theIRMM at Geel, Belgium, were used to irradiate samples of metallic natural chromium,iron and nickel as well as samples of enriched 53Cr203, 54Cr203 and 54Pe203' The neutronflux density was determined via the 27AI(n,p)27Mg, 27AI(n,u)24Na, 56pe(n,p)56Mn and93Nb(n,2n)92mNb monitor reactions. A pneumatic sample transport system was installed atGeel to enable measurements of short-lived reaction products. This system wassuccessfully applied to the determination of reaction products with half-lives ~ 10 seconds,
For all the studied reactions substantial new information was obtained and the presentdata should contribute appreciably to solving large discrepancies in the major evaluationsfor most of the reactions. For the (n.p) and (n.np) reactions on the four stable Cr-isotopes,viz, 50Cr, 52Cr, 53Cr and 54Cr, a systematic trend in the excitation functions could be
observed which is ascribed to the Q-values of the reactions. The isomeric cross sectionratio for the 54pe(n,2n)53m,gPe reaction increases with the increasing neutron energywhereas the ratio for the 54pe(n,t+dn)52m,gMn reaction decreases with the increasingneutron energy. These trends are explained in terms of the involved spins of the respectivenuclides.
The experimentally determined cross sections and isomeric cross section ratios werecompared with the results of nuclear model calculations carried out using the codeSTAPRE-H, The aim was to test the underlying models. STAPRE-H uses the HauserFeshbach formula for the equilibrium and the Exciton or Geometry Dependent Hybrid(GDH) Model for the pre-equilibrium (PE) contribution. Neutron, proton and alphaemission were taken into account. The influence of the PE contribution on the crosssection was investigated with the two PE models and by varying the PM parameter in theExciton Model. Most of the reactions could be described by the model calculation withdeviations of ± 10 % to the experiment. This shows that the underlying models canreproduce the excitation functions satisfactorily, provided the input parameters are wellchosen.
Table of Contents
Preface 1
1. Introduction 3
1.1 Nuclear Reactions .. Basic Properties and Concepts 3
1.2 Some Systematics of (n,charged particle) and (n,xn) Reactions 51.2.1 Integral Cross Sections 51.2.2 Isomeric Cross Section Ratios (ICSR) 6
1.3 Techniques for (n,charged particle) and (n,xn) Cross Section Measurements 81.3.1 Detection of Emitted Particle 81.3.2 Activation Method 91.3.3 Role of Radiochemistry in Activation Measurements 12
1.4 Monoenergetic Neutron Sources 151.4.1 Neutron Source Reactions and Experimental Details 151.4.2 Neutron Fluence Determination and the Use of Cross Section Standards 18
1.5 Status of Available Neutron Activation Cross Section Data for Cr, Fe and Ni 20
2. Aim and Scope of this work ••.••.•••..••••..••.•••..•..••.•..•..•.•..•••.•••.•••••••••• 27
3. Experimental Methods 29
3.1 Irradiations 293.1.1 Setup -Julich- 293.1.2 Setup -Geel1- 313.1.3 Setup -GeeI2- 313.1.4 Sarnples 343.1.5 Summary of Irradiations Performed 34
3.2 Neutron Fields 373.2.1 DD-Neutron Source Reaction (JUlich) 373.2.2 DT-Neutron Source Reaction (Geel1 and Geel2) 393.2.3 Determination of Mean Flux Density within a Thick Sarnple 433.2.4 Neutron Flux Fluctuations 433.2.5 Neutron Multiple Scattering Corrections .45
3.3 Gamma-Ray Spectrometry 463.3.1 Data Acquisition 463.3.2 Gamma-Ray Spectrum Analysis 493.3.3 BPGe Detector Efficiency 503.3.4 Photon Absorption Corrections 553.3.5 Coincidence Summing Corrections 56
3.4 Radiochemical Separation and Sample Preparation 593.4.1 "Fe from Ni-Target 593.4.2 4' y from Cr-Target. 653.4.3 4By Standard Source for Calibration of X-Ray Detector 68
3.5 X-Ray Spectrometry 693.5.1 Data Acquisition 693.5.2 Si(Li) Detector Efficiency 70
Table of Contents i
3.6 Data Processing 723.6.1 Experimental Cross Sections 723.6.2 Experimental Isomeric Cross Section Ratios 743.6.3 Uncertainties 76
4. Nuclear Model Calculations 79
4.1 Introduction 79
4.2 The Code STAPRE·H 804.2.1 General Remarks 804.2.2 Formalism and Program Flow 814.2.3 Pre-Equilibrium Emission (PE) 834.2.4 Level Densities 86
4.3 Input Parameters '.., 88
5. Results and Discussion 93
5.1 Data for Reactions on Chromium 935.1.1 Experimental Data 935.1.2 Comparison with Literature Data, Evaluations and STAPRE-H Calculation 945.1.3 Influence of Model Parameters 1015.1.4 Isotope Effect in (n,p) and (n.pn-snp-d) Reactions 106
5.2 Data for Reactions on Iron 1085.2.1 Experimental Data 1085.2.2 Comparison with Literature Data, Evaluations and STAPRE-H Calculation 108
5.3 Data for Reactions on Nickel 1115.3.1 Experimental data 1115.3.2 Comparison with Literature Data, Evaluations and STAPRE-H Calculation 112
5.4 Isomeric Cross Section Ratios 1155.4.1 Experimental Data 1155.4.2 Isomeric Cross Section Ratios of S3m"Fe and 52m"Mn in various Nuclear Reactions 1165.4.3 Model Calculation 119
6. Summary and Conclusions 121
7. Zusammenfassung 125
References 129
Acknowledgements •.....................•.•...••••••.•.••.••.•••••••••••.•••....•.••.•....... 145
ii Activation Cross Sections and Isomeric Cross Section Ratios ...
Preface
The discovery of the neutron by Chadwick in 1932 [Cha 32a, Cha 32b] gave a greatimpetus to the study of nuclear reactions. The absence of charge enables the neutron tointeract with a nucleus at close distances and at all neutron energies. Therefore it was thefirst projectile to be used in the study of nuclear structure and nuclear reactionmechanisms. Even today, many decades after the first experiments, the need to understandthe fundamental nuclear processes has remained unchanged. Accurate experimental dataare required upon which theories and computational techniques can be based.
Along with these interests in the basic physics, precise nuclear data became importantfor applications in many disciplines, such as nuclear energy (fission and fusion systems),medicine and biology (radiotherapy for cancer treatment, diagnostics, radio-biologicalstudies), materials science and industry (production of radioisotopes, neutron radiography,materials analysis). Since many of the requests for data cannot be met by experimentalmeasurements alone, the quantification of neutron interaction parameters must also beapproached by a better quantitative understanding of the nuclear processes. Establishingsystematic trends from high quality measurements and good fundamental understanding ofthe subject would allow the calculation of unmeasured data.
Thus neutron activation cross sections over a wide energy range are of fundamentalsignificance for testing nuclear models. However, extensive data exist only around 14MeV. In the energy range from 15 to 20 MeV only a few measurements have been doneand the results are often inconsistent. Different cross section evaluations, mostly based oncalculations, differ frequently by a factor of two to three. In this energy region manyreaction channels are open (e. g. elastic scattering, inelastic scattering, radiative capture,(n,2n), (n.p), (n,«), (n.np), (n.d), (n.no) etc.) and different reaction mechanisms need to beconsidered (compound, precompound and direct interactions). For nuclear reaction modelcalculations several computer codes are available but the parameterization is oftenuncertain. Therefore more experimental data are needed to test the modelparameterizations. Apart from this fundamental interest, the activation data are importantfor practical applications in fusion reactor technology, e.g. estimation of activity level,hydrogen and helium gas production, nuclear heating or radiation damage. With the D-Tfusion reaction the neutron energy of primary interest is 14MeV. However, cross sectionsat lower neutron energies are also needed since neutrons are degraded in the reactorblanket. Neutron cross sections above 14 MeV are of interest mainly in radiation damagestudies. The testing of fusion materials is often done with broad spectrum neutron sourceswith neutron energies up to 50 MeV. In order to predict the behaviour at and below 14MeV on the basis of measurements with such sources, the dependence of the relevantcross section on neutron energy needs to be known.
Preface 1
The investigation of isomeric cross section ratios is another interesting subject. Sincethe discovery of the first isomer by Hahn [Hah 21], the 234mpa with a half-life of 70
seconds, many isomers have been identified. However, the quantitative formation of thosestates in different nuclear reactions is still not exactly understood. The lack of data is dueto many reasons, namely, very short or very long half-lives of the isomers, low crosssections for the population of the individual levels, close level spacings or low transitionenergies make experiments difficult. Thus more experimental and theoretical studies areneeded to shed some more light on the reaction mechanisms involved.
Radiochemical methods accompanied the study of nuclear reactions right from thebeginning. The production of suitable targets, the separation of the reaction products andthe preparation of appropriate samples for activity measurement are essential aspects ofaccurate cross section measurements.
This thesis describes neutron activation cross section measurements on Cr, Fe and Niisotopes in the energy ranges 9 to 12 MeV and 14 to 20 MeV. In addition isomeric crosssection ratios have been measured in two reactions on 54Fe.
In chapter 1 the basic properties and concepts of nuclear reactions are given, followedby a discussion of the status and some systematic trends of (n,charged particle) and (n.xn)cross sections. Also some systematics of isomeric cross section ratios are discussed. Thetechniques of cross section measurements including radiochemical methods are outlinedand the available neutron sources for the production of monoenergetic neutrons are
reviewed.Chapter 2 is devoted to a more detailed description of the motivation of the present
investigation. The needs of precise nuclear data for the selected reactions on structuralmaterials are explained.
Chapter 3 describes the experimental techniques, dealing with the sample irradiation atdifferent facilities and the gamma- and X-ray spectrometry in detail. The radiochemicalseparations and the sample preparation for the X-ray spectrometry are also considered inthis chapter. Finally, the determination of the experimental cross sections and isomericcross section ratios from the analysed gamma- and X-ray spectra are explained.
In chapter 4 the principle of nuclear model calculation is presented together with adetailed description of the calculations performed using the code STAPRE-H [Avr 87].The selection of the input parameters is discussed in detail.
Chapter 5 compares the experimental results with the model calculations and somemajor evaluations. Some observed systematic trends are discussed.
Finally, in chapter 6 a short summary of the work performed is given together withsome conclusions.
2 Activation Cross Sectionsand Isomeric CrossSectionRatios ...
1. Introduction
1.1 Nuclear Reactions - Basic Properties and Concepts
• Cross SectionsWe speak of a nuclear reaction X(n,x)Y when an incident particle n hits a target nucleusX, a particle x is emitted, leaving a residual nucleus Y. The probability for this type ofreaction to occur is called the cross section ern,x. It is defined as the number of reactions(n,x) on a target nucleus per unit time and unit incident particle flux. The cross section isgiven in barns (1b = 10.28 m2
) ; integrated over all angles it is called integral cross section.
It is a function of the energy of the incident particle and the plot of er(E) versus E is calledthe excitation function. Taking into account the angular distribution of the emitted particlein the solid angle dO one obtains the differential cross section der/dO. The doubledifferential cross section d2er/dndE is a function of the kinetic energy E of the emittedparticle and of the angle of emission e.
In a nuclear reaction the energy is conserved. The remaining kinetic energy of thereaction products is described by the Q-value. It can be derived from the difference in thenuclidic masses and serves as an indication whether a reaction is energetically possible ornot. The minimum incident energy which is required to initiate a reaction is called thethreshold energy. It takes also into account the energy which is needed to conserve themomentum in the reaction and can be described as
(M il )
Etkres = -Q. 1+ M x (1.1)
where M, and Mx are the mass of the projectile and the target nucleus, respectively. Otherquantities which are also conserved are the charge, the angular momentum, the parity, theisospin and the number of nucleons.
• Isomeric Cross Section Ratios (ICSR)Nuclides with the same mass and proton number (i. e. the same chemical properties) butdifferent decay properties (different half-lives, different decay modes and energies) areconsidered as isomers. They occur when an excited energy state has a measurable half-life(T1/2 -0.1 s to several years). The isomeric state decays either by gamma-ray emission tothe ground state or by EC, beta- or alpha-particle emission to another nuclide. The "halflife" of the isomeric state is explained in terms of the difference in the spins of the isomers[Wei 36]. Furthermore, the momentum and the energy of the projectile influence the
I. Introduction 3
population of isomeric states. With increasing energy of the projectile the isomer with thehigher spin is preferably populated. Therefore, the determination of ICSR's providesuseful information on the influence of energy and spin of the isomeric state as well as ofthe energy and momentum of the projectile on nuclear reactions. Generally the ICSR isgiven as O"m I O"m + O"g (m denotes the metastable state, g the ground state) or as O"m I O"g.
• Reaction ChannelsIf different reactions are energetically possible for a defined incident particle energy wespeak of different reaction channels. For example, at incident neutron energies between 10and 20 MeV, the energy range of this work, generally the following reactions areenergetically possible: elastic scattering, inelastic scattering, radiative capture, (n,2n),(n.p), (n,«), (n.np), (n,d), (n.t), (n,3He), and (n.nn), The sum of the cross sections of allthese reaction channels is called the total cross section, O"T. It can be easily determined bytransmission measurements. The typical shapes of some threshold reactions, e. g. the (n.p),(n.c) or (n,2n) reactions, can be explained by the coexistence of these different reactionchannels. Above the threshold the excitation function increases steadily, reaching a smallplateau, and then decreases above energies where other reactions are also energeticallypossible.
• Reaction MechanismsIn general, one can distinguish between three types of reaction mechanisms: direct,compound nucleus and preequilibrium or precompound. For a given reaction all threemechanisms contribute to the cross section, depending on the type of reaction (projectileand emitted particle), the incident energy and the excitation energy of the residual nucleus.
Direct reactions occur mainly as binary processes and are characterized by a directtransition from the entrance to the exit channel in a very short time (_10-23 - 10-22 s), Nointermediate state is formed. Typical examples of direct reactions are elastic and inelasticscattering, charge-transfer (p,n), stripping (d.p) or pick-up (n.d).
Compound nucleus reactions occur mainly at low energies and proceed via anintermediate state. The energy of the projectile is distributed over all nucleons. Thedeexcitation of the nucleus is finally reached by evaporation of nucleons with aMaxwellian energy distribution. The time-scale for this type of reaction is much longerthan that for the direct reaction (10-16 s).
The precompound or preequilibrium reactions are somehow intermediate processesbetween the two other ones. They occur when an incident particle has stilI enough energy,after the first collision, to leave the nucleus via direct emission or to collide with anothernucleus. This process can be continued until the typical energy distribution over manydegrees of freedom of the nucleus is reached. We speak of pre-equilibrium emission whena particle is emitted in between this relaxation period. A more detailed description of thedifferent reaction mechanisms is given in chapter 4 together with the nuclear modelcalculations.
4 Activation Cross Sections and Isomeric Cross Section Ratios ...
1.2 Some Systematics of (n,charged particle) and (n,xn) Reactions
1.2.1 Integral Cross Sections
Several reports have been published on the systematic trends in cross sections for(n,2n), (n,p), (n,«), (n,np+pn+d), (n/He) and (n,t) reactions at 14 MeV. In most of thoseworks the experimentally determined cross sections were plotted as a function of theasymmetry parameter (S = (N-Z)/A). Some systematics are based purely on cross sectioncalculations using the statistical model, but considering the effective Coulomb barrier forthe emitted particle (e. g. [Gul 95]). Extensive reviews about cross section systematicswere given by Qaim [Qai 86b], Forrest [For 86] and others (for example [Ede 72], [Lev73], [Byc 80], [Ait 87], [Bad 91] and [Kas 96]). Recently, Doczi et al. [Doc 97a] andMajdeddin et al. [Maj 97] presented new empirical formulas for the (n.p) and (n,«)reactions, respectively, and compared their results with the available systematics. Some ofthe conclusions from the systematics are briefly summarized below.
The cross sections of (n,charged particle) reactions decrease with the increasingasymmetry parameter whereas the emission of neutrons increases [Mol 77]. This fact is
. explained by the increasing Coulomb barrier for charged particles. Possible effects ofproton and neutron shell closures on 'the three major nuclear reactions - (n,p), (n,«) and(n,2n) - have been stated to be negligible [Qai 72]. Mostly the systematics are based on thefirst order asymmetry term in the exponential. Forrest also included the second orderasymmetry term and a term which involves the mass number A [For 86]. Doczi et al. [Doc97b] stated that both for (n.p) and (n,«) cross sections the simple expression
(1.2)
gives a substantial improvement in fitting the experimental data. Nevertheless, theyrecommend for the fitting of the (n.p) cross sections formulas containing additional termsin the exponential depending either on A, Z or N (as done by Forrest [For 86]).
For (n,p) and (n,«) reactions an isotope effect was demonstrated: it means that the crosssection for a particular reaction on two adjacent isotopes of the same element may vary byabout a factor of two [Gar 62, Gar 64]. This observation is understood to be essentially aQ-value effect. With higher incident neutron energies this effect should decrease andincrease with lower values. The isotopic dependence of the (n.p) and (n,«) cross sectionscan be well approximated by the following expression [Doc 97a]
(1.3)
Also for the (n,t) reaction a similar trend was found [Qai 76]. Here the systematic trendfor the cross section behaviour could be split into two parts, one for odd mass nuclei
1. Introduction 5
(higher 0") and the other for even mass nuclei (lower 0"). For (n,np+pn+d) reactions adependence of the cross section on the separation energies for neutrons Sn and protons Spwas found. The values for reactions on nuclei with Sn>Sp are somewhat larger than thosefor nuclei with Sn<Sp. This is explained as follows. Generally the (n.np) reaction channelis very weak, since the excited levels of the (n.n') reaction product tend to emit a secondneutron rather than a proton. However, in cases where Sn>Sp, after the emission of the firstneutron, a large number of levels of the excited nucleus have no neutron decay width andthe only open channels are gamma or proton emission. Due to the rather high excitationenergy of the (n.n') reaction product, it is expected that a considerable number of protonswill be emitted at the second stage [Qai 82].
Some systematics are also devoted to the complete excitation functions of (n,p), (n,«),(n.t), (n,2n) and (n,3n) reactions [Zha 86a, Zha 86b]. They all rely on some simplifiedanalytical expressions on the bases of the evaporation model, considering the preequilibrium part, which are fitted to the experimental data. Nevertheless, the prediction ofunknown excitation functions out of these systematics is quite unsatisfactory. Betterpredictions can be drawn from simple nuclear model codes containing one parameter setfor all mass numbers and projectile energies like the code EXIFON [Kal 90, Kal 91].
1.2.2 Isomeric Cross Section Ratios (lCSR)
In contrast to the systematics of the integral cross sections for neutron inducedreactions, those predicting the isomeric cross section ratio are rather incomplete. Theempirical formula for the cross section prediction is usually simply a least squares fit ofexperimentally determined cross section values versus the asymmetry parameter (oneparameter fit, see above). To predict the isomer ratios with certainty more parameters areneeded, in particular those related to the distribution and population of competing levels.Therefore, the level density parameters and the nuclear structure become important (seealso chapter 4).
The first studies of ICSR's were reported by Dray et al. [Ura 78] who plotted the ratioO"m I O"g versus the spin of the isomeric state Jm. Data on (n,2n), (n,p) and (n,«) reactionsgave a parabolic curve with the peak maximum at Jm - 5, based on a purely visualtreatment. Later Qaim [Qai 85] suggested a similar parabolic dependence for the (n,t)reaction plotting the isomeric ratio O"m I O"m + O"g versus Jm. He found a maximum at Jm- 2- 3. However, this study suffered from the facts that limited experimental data wasavailable and that some of the O"g values had to be estimated from the cross sectionsystematics. In addition to these experimentally based systematics Kopecky and Gruppelar[Kop 87] calculated the isomeric ratio as a function of the two spins Jmand Jg with thecode GNASH [You 77]. Their calculation confirmed the parabolic dependence (maximumat Jm- 3 - 5). The ICSR's are almost similar for the (n,p), (n,c), (n,2n) and (n,t) reactions(height and maximum of the parabolic curve). Only the (n,2n) reaction shows a slowerdecrease of isomer ratios for Jm>Jg. The reason for this effect is probably the emission of
6 Activation Cross Sections and Isomeric Cross Section Ratios ...
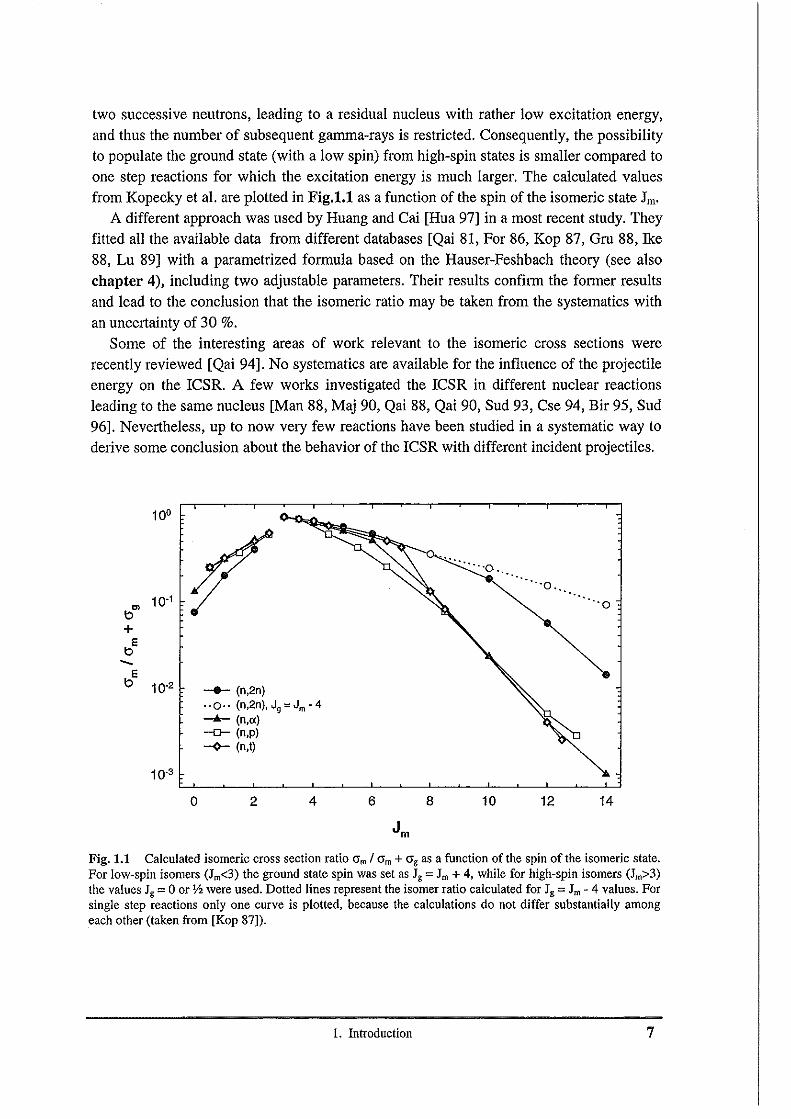
two successive neutrons, leading to a residual nucleus with rather low excitation energy,and thus the number of subsequent gamma-rays is restricted. Consequently, the possibilityto populate the ground state (with a low spin) from high-spin states is smaller compared toone step reactions for which the excitation energy is much larger. The calculated valuesfrom Kopecky et al. are plotted in Flg.t.I as a function of the spin of the isomeric state Jrn•
A different approach was used by Huang and Cai [Hua 97] in a most recent study. Theyfitted all the available data from different databases [Qai 81, For 86, Kop 87, Gru 88, Ike88, Lu 89] with a parametrized formula based on the Hauser-Feshbach theory (see alsochapter 4), including two adjustable parameters. Their results confirm the former resultsand lead to the conclusion that the isomeric ratio may be taken from the systematics withan uncertainty of 30 %.
Some of the interesting areas of work relevant to the isomeric cross sections wererecently reviewed [Qai 94]. No systematics are available for the influence of the projectileenergy on the ICSR. A few works investigated the ICSR in different nuclear reactionsleading to the same nucleus [Man 88, Maj 90, Qai 88, Qai 90, Sud 93, Cse 94, Bir 95, Sud96]. Nevertheless, up to now very few reactions have been studied in a systematic way toderive some conclusion about the behavior of the ICSR with different incident projectiles.
10°
". · .. ·0 ..
···0 .•..'"
'"10.1 "0
t>+
Et>-t>E
10-2 __ (n,2n)
.. 0 .. (n,2n), J, = Jm - 4-4- (n,o)-0- (n,p)-9- (n.t)
10-3
0 2 4 6 8 10 12 14
Jrn
Fig. 1.1 Calculated isomeric cross section ratio O"m I O"m + O"g as a function of the spin of the isomeric state.For low-spin isomers (Jm<3) the ground state spin was set as Jg = Jm+ 4, while for high-spin isomers (Jm>3)the values Jg =0 or Yz were used. Dotted lines represent the isomer ratio calculated for Jg =Jm - 4 values. Forsingle step reactions only one curve is plotted, because the calculations do not differ substantially amongeach other (taken from [Kop 87]).
1. Introduction 7
1.3 Techniques for (n,charged particle) and (n,xn) Cross SectionMeasurements
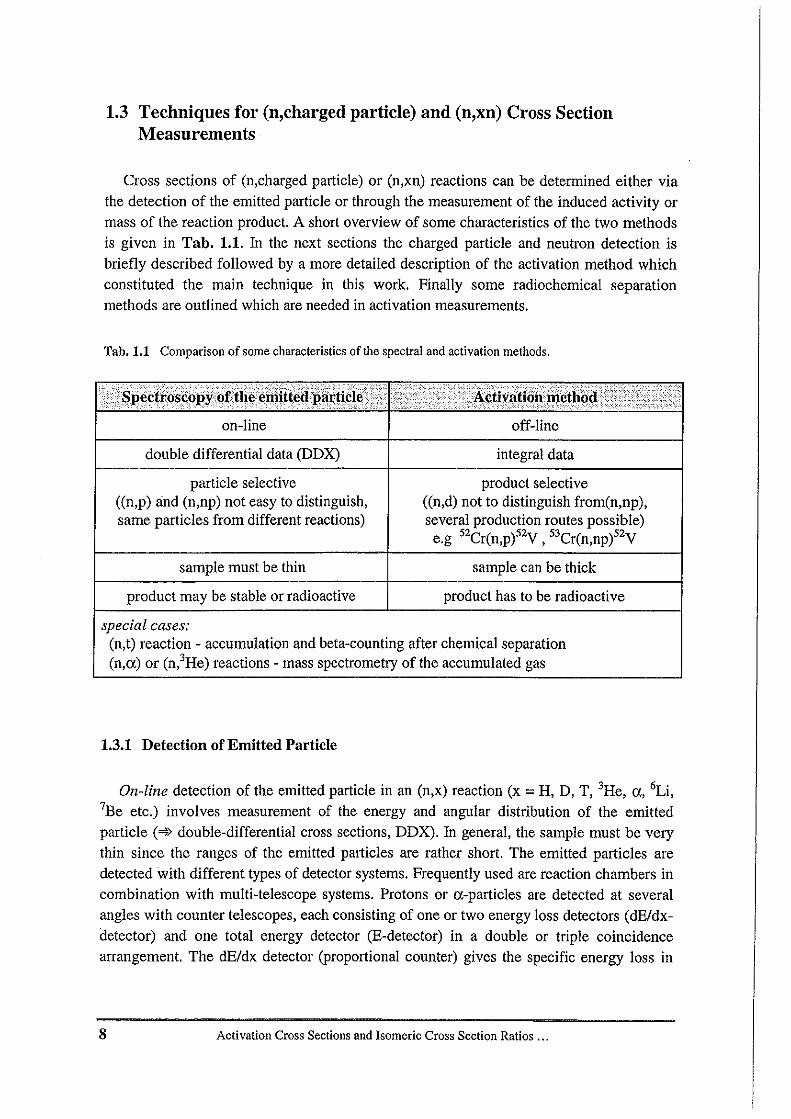
Cross sections of (n,charged particle) or (n,xn) reactions can be determined either viathe detection of the emitted particle or through the measurement of the induced activity ormass of the reaction product. A short overview of some characteristics of the two methodsis given in Tab. 1.1. In the next sections the charged particle and neutron detection isbriefly described followed by a more detailed description of the activation method whichconstituted the main technique in this work. Finally some radiochemical separationmethods are outlined which are needed in activation measurements.
Tab. 1.1 Comparisonof some characteristics of the spectraland activation methods.
",;';'f"">"/'~;;,s;:n"":;'" ".•;,)' ",.,.,,"". ;'·l;))······l.·i~>·· ,. """"'!!,:' W;;;;';i;i.;;."""."0<;",, ..".,; ..•.
on-line off-line
double differential data (DDX) integral data
particle selective product selective(m.p) and (n,np) not easy to distinguish, (m.d) not to distinguish from(n,np),same particles from different reactions) several production routes possible)
e.g 52Cr(n,p)52y , 53Cr(n,npi2y
sample must be thin sample can be thick
product may be stable or radioactive product has to be radioactive
special cases;(n.t) reaction - accumulation and beta-counting after chemical separation(n,«) or (n,3He) reactions - mass spectrometry of the accumulated gas
1.3.1 Detection of Emitted Particle
On-line detection of the emitted particle in an (n,x) reaction (x = H, D, T, 3He, a, 6Li,7Be etc.) involves measurement of the energy and angular distribution of the emittedparticle (""> double-differential cross sections, DDX). In general, the sample must be verythin since the ranges of the emitted particles are rather short. The emitted particles aredetected with different types of detector systems. Frequently used are reaction chambers incombination with multi-telescope systems. Protons or a-particles are detected at severalangles with counter telescopes, each consisting of one or two energy loss detectors (dE/dxdetector) and one total energy detector (E-detector) in a double or triple coincidencearrangement. The dE/dx detector (proportional counter) gives the specific energy loss in
8 Activation Cross Sections and Isomeric Cross Section Ratios ...
the detector and thus leads to an identification of the emitted particle, whereas the Edetector (surface barrier detector) defines the total energy of the registered particle [Bre 70,Mil 70, Alv 72, Bre 72, Per 74, Pau 81, Wat 83, Wat 91, Tsa 94, Tsa 97].
Quadrupole spectrometer systems used in some laboratories transport the emittedparticle 2 - 3 m away from the neutron field. The background with such an arrangement isdrastically reduced since neutrons and gamma-rays are not focussed by the magnetic field[Gri 77, Gri 78, Gri 79, Hai 81]. However, their use is generally limited to 14 MeVneutrons due to intensity problems in other neutron fields.
Recently, precise measurements for (n.xo) cross sections have been performed withgridded ionization chambers (0lC) employing high-Z structural elements to suppresscharged particle background [Oov 94, Bab 94a, Bab 94b, Ito 94]. Other advantages of theOlC are the good energy resolution (50 - 70 keV) for measuring cross sections for separatea-groups and the high counting efficiency due to the large solid angle (- 41t) whichpermits the use of very thin targets (- 300 ug/cnr),
For investigating the neutron emission in (n,n') and (n,xn) reactions, lime Qf flight(TOF) techniques are used in combination with large liquid scintillation detectors [Fre 80].The relative contributions of the emitted first and second chance neutrons can be resolvedby the angular correlations between the various outgoing neutrons [Sal 71, Han 73]. Forthe measurement of (n,2n) cross sections also a method has been employed which uses awatertank to thermalise the emitted neutrons prior to identification [Har 71].
1.3.2 Activation Method
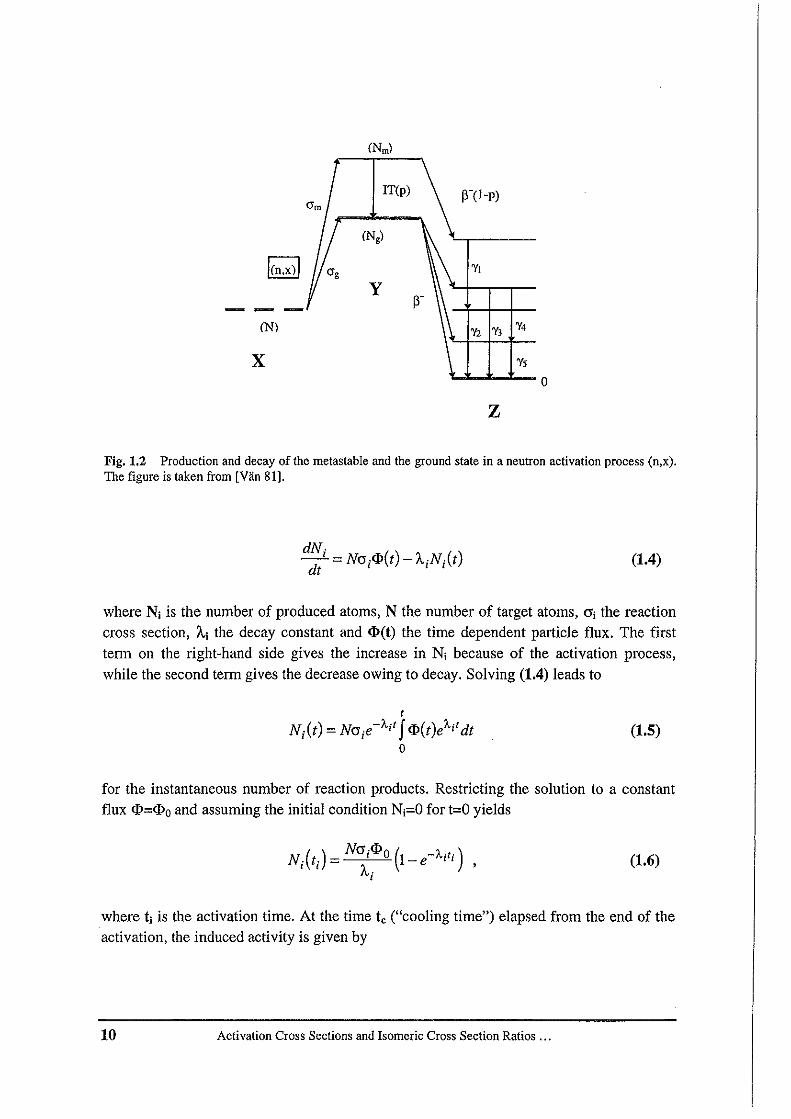
This technique involves an off-line identification and quantitative determination of aradioactive reaction product. The principle of the method is illustrated in Fig. 1.2.
Considering a nuclear reaction of the type
x(n, x )Y ----'~'----"'.~_+.:..c0r_E::..'c=----7) Z
the cross section can be determined by measuring the induced activity of the product Y.Normally this is done by measuring the gamma-ray emission, which follows the beta decay(here 13, 14 or 15), with HPOe or Nal detectors. In cases where there is no gamma-rayemission the activity has to be determined by beta-counting or X-ray spectroscopy. If ametastable state is populated, the isomeric cross section ratio (ICSR) can be determinedeither by measuring the gamma-ray of the internal transition (IT) leading to the groundstate or the 11 or 1z which follow the beta decay from the metastable state.
Let us consider now the basic underlying equations. The production rate of aradioactive nuclide can be described as a function of the irradiation time by the followingfirst order linear differential equation:
I. Introduction 9
iNm)
IT(p) ~-(I-p)
iNg)
kn,x)1 VI
y
-- ~-
iN) V2 V3 V4
X V5
0
Z
Fig. 1.2 Production and decay of the metastable and the ground state in a neutron activation process (n,x),The figure is taken from [Van 81].
dN·-'=No.<P(t)-'A.N.(t)dt I I I(1.4)
where N j is the number of produced atoms, N the number of target atoms, OJ the reactioncross section, ~ the decay constant and <P(t) the time dependent particle flux. The firstterm on the right-hand side gives the increase in N, because of the activation process,while the second term gives the decrease owing to decay. Solving (1.4) leads to
I
Ni(t) = No.e -'Ailf<p(t)eAjtdto
(1.5)
for the instantaneous number of reaction products. Restricting the solution to a constantflux <P=<Po and assuming the initial condition Ni=O for t=O yields
Ni(t j ) = N~<Po (l_e-'Ajt;) ,t
(1.6)
where ti is the activation time. At the time tc ("cooling time") elapsed from the end of theactivation, the induced activity is given by
10 Activation Cross Sections and Isomeric Cross SectionRatios ...
(1.7)
the so-called activation formula. By determining the activity the cross section can becalculated if N and <I> are known. As can be seen from (1.7) the activation method is alsouseful for the determination of N or <I> if c is known. Similar to the measurement ofradioactivity, an analogous method involves the determination of the mass of the reactionproduct, if a stable nuclide is formed. This can be done by mass §Pectrometry (MS) [Kne86, Hai 96] or gcceleraror mass §pectrometry CAMS) [Mul77, Elm 87, Dit 90, Sut 90, Sch95]. The determination of cross sections of (n.t) and (n,7Be) reactions constitutes twospecial cases. Here not the activity of the reaction product is measured but the activity ofthe emitted particle 3H [Qai 73, Qai 74c, Bir 75, Qai 78, Sud 79, wei 84, WOl 85, Lis 88,Suh 88a, Suh 88b, wei 90, W0l93] or 7Be [Sch 93].
Let us come back to Fig. 1.2 and consider a case where also a metastable state of thefinal nucleus is populated. For the formation of the metastable state one can use similarexpressions as outlined above (eq. 1.4 . 1.7). For example, if there is only isomeric feedingfrom one single metastable state, the formation of the metastable (m) and the ground state(g) can be described by
(1.8)
and
(1.9)
where p denotes the probability for the isomeric [ransition (IT). Assuming again a constantflux <1>=<1>0 and initial conditions Nm=Ng=O for t=O, the solutions for (1.8) and (1.9) will be
(1.10)
and
(1.11)
The activity at the time tc will be
A - 0 N (t t) -,,~ m (1- -Amti) -Am'cm - I\;m m j, c - H'vm,*,o e e
and
I. Introduction
(1.12)
11
Ag = AgNg(ti,tc ) =N<PO[Pcr", 'A ~A (l_e-1.mt,) e-1.mt,
g 111
+(«, - pcr'" AgA~1l'A1JI-e-1.'t') e-1.,t']
(1.13)
If the metastable state decays directly via beta emission, i. e. there is no IT (p=O), then(1.13) becomes similar to (1.7) and (1.12); the ICSR can be determined by two separatecross section measurements for both states, especially when the half-lives of themetastable and ground states are very different. In the case where p;tO, the ICSR can bederived by a straightforward calculation from (1.12) and (1.13) combined. We obtain
(1.14)
Here the sample mass and the neutron flux do not have to be known. It is morecommon to give the ratio crm I crm + crg
1.3.3 Role of Radiochemistry in Activation Measurements
Radiochemical separations of the reaction products from the irradiated samples are usedfrequently in nuclear data measurements via the activation method. They are mandatorywheno low yield reactions are studied [Hus 68, Qai 73, Qai 74a, Qai 74b, Qai 74c],o large samples are irradiated (9) bad counting geometry),o short-lived isotopes have to be separated from strong long-lived matrix activities
(9) overlapping gamma-rays, high detector dead time) [Fes 94a, Fes 96],o thin samples of the reaction products have to be prepared for beta- or X-ray counting
(9) self-absorption) [Yaf 62, Bos 94, Qai 96, Klo 97].
The criteria for a good radiochemical separation areo high decontamination from radioactive impuritieso high chemical separation yieldo simplicity, fastness and easy reproduction (mandatory in case of short-lived isotopes)
[Her 82].
12 Activation Cross Sections and Isomeric Cross SectionRatios ...
The radiochemical methods commonly used involve
o Precipitation and crystallization [Oki 92, Bos 94, Qai 96]o Co-precipitation by adsorption [Hay 51, Fes 94a, Fes 94b]
o Electroplating [Hah 45, Qai 84, Zwe 88, Fes 94a, Fes 94b]o Solvent extraction [Fre 59, De 67, Oki 92]
o Ion exchange (anion- or cation-exchange) [Kra 57, Ne164, Qai 84, Kor 89, Old 92, Fes94a, Fes 94b, Qai 96, Klo 97]
o HPLC (high performance liquid chromatography) [Qai 79, Sch 82a, Wei 91, Fas 96]
o Thermochromatography [Fas 94, Neu 94, Den 95]
Some of the techniques used in this work are briefly described below.
• Co-precipitation by adsorptionThe principle is based on the adsorption of the radionuclide on gelatinous or colloidal
precipitates (e. g. Fe(OHh, Al(OH)3, MnO(OH), AgBr, AgI, AszS3, BaS04 or aluminiumsilicates) which offer a large surface. Adsorption of metal cations is also possible if theprecipitate is negatively charged. After the precipitation the precipitate is dissolved and the
radionuclide is separated from the carrier with one of the numerous methods listed above.
Co-precipitation is used when no farrier .!!dded (n.c.a.) radionuclides have to be separatedfrom the targets. If very low radionuclide concentrations have to be separated from strongmatrix solutions (high concentrations of metal ions) and the concentration of the
radionuclide is too low to allow precipitation, or when no isotopic carrier can be added (e.g. when very thin samples for X-ray counting have to be prepared), co-precipitation withnon-isotopic carrier sometimes offers the only possibility of a quantitative separation.
• ElectroplatingMetal cations are plated out from an electrolytic solution on a metal cathode if a potentialis put between the two electrodes. In principle it is possible to separate two or more
cations because of their different standard potentials, or by masking one component by a
complexing agent. Nevertheless, the method is normally used to prepare thin samples forbeta- 01' X-ray counting rather than for separating radioactive products from matrix
activities.
• Solvent extraction (liquid-liquid extraction)Solvent extraction involves the interchange of ions between an aqueous solution and a
liquid organic solvent. Let us consider the reaction
(1.15)
in which the reagent HL, initially dissolved in an organic phase reacts with a metal ionM+n in the aqueous solution to form a product MLn which is more soluble in the organic
I. Introduction 13
phase than in water. The extraction equilibrium constant for this reaction may be writtenas (nomenclature used in the solvent extraction process see [Ric 81])
(1.16)
The whole process can be divided into three steps:o extraction - initial transfer step in which the main solute, often together with some of
the impurities is transferred from the aqueous solution to the solvent.o scrubbing - process of selectively removing the coextracted solutes (impurities) from
the loaded solvent by treatment with a new immiscible (aqueous) phase.o stripping - process of recovering the main solute(s) from the solvent or for extracting
back into an aqueous phase.
• Ion exchangeIon exchange separation involves the interchange of ions between an aqueous solution and,a solid resin. The ion exchange resins are insoluble, porous, resinous structures to whichactive groups such as (-S03r or (COOr or (-NR3/ are attached. These active groups,depending on their own charge, selectively pick up cations (e. g. simple metal ions M+,M++, =-> cation exchanger) or anions (e. g. negatively charged metal complexes, =-> anion
exchanger) from aqueous solutions. A typical cation exchange equilibrium reaction can berepresented as
(1.17)
where R is the designation for the ion exchange resin, M is the metal which has to beseparated and recovered, and H is hydrogen. This equation represents a chemicalequilibrium and is amenable to shifting in either direction by a suitable choice of theconditions. The equilibrium constant is given by:
(1.18)
Ion exchange essentially involves a three step operation in columns filled with resin. Theseareo loading (adsorption) - transfer of the desired metal ion from the solution to the ion
exchange resin.c washing - physical separation of the depleted solution from the resin.
14 Activation Cross Sectionsand Isomeric Cross Section Ratios ...
o elution (desorption) - transfer of the metal ion from the resin into a fresh aqueoussolution.
1.4 Monoenergetic Neutron Sources
Neutron beams with well-defined energies can be provided either by the source itself orneutrons of a particular energy can be selected from a continuum by a TOF measurementover a fixed flight path. In the first case we speak of monoenergetic or quasi
monoenergetic neutron sources. In the latter case we call them continuum or white neutronsources. Since this work deals with the activation measurements which yield integratedresults over the time of the irradiation, no information can be immediately derived aboutthe effective energy of the neutron as it is possible in combination with TOFmeasurements. Therefore, pointwise measurements of energy-dependent cross sectionsrequire the usage of monoenergetic neutron sources. Some of such sources, mainlyaccelerator based monoenergetic neutron sources, are given below. For more details, thereader is referred to some review articles [e. g. aka 80, aka 87, Cie 83, BOd87].
1.4.1 Neutron Source Reactions and Experimental Details
Most of the activation cross section measurements to date have employed the reactionsT(p,n)3He, T(d,n)4He, D(d,n)3He and 7Li(p,n/Be using electrostatic accelerators (Van de
Graaff accelerators) or cyclotrons to produce incident charged particle beams of properenergies. The limitations for their usage are given by their intensity and spectraldistribution. To achieve a high specific yield, it is necessary to have a high neutronproduction cross section and a small energy loss of the projectile in the target. All of thesesource reactions, when used over a wide energy range, not necessarily produce onlymonoenergetic neutrons. The primary neutron group is contaminated by secondary neutrongroups due to breakup of the projectile or the target nucleus (see Tab. 1.2). Otherbackground neutrons are produced by reactions of the incident charged particles with thebeam stop and other components of the target construction. In some cases these neutronscan be measured, e. g. with gas-in I gas-out measurements in the case of a gas target (see
below).The different energy regions in which the sources can be used are compared in Fig. 1.3.
The yields for many reactions are given by Drosg [Dro 90]. A difficult region for neutronactivation is from 8 to 12 MeV. Here none of the sources behaves as monoenergetic. Butwith the precise measurement of the cross section of the breakup reaction D(d,np)D byCabral et al. [Cab 90], the D(d,n)3He source reaction was made available for adequatemeasurements in this energy region [e. g. Bir 94b, Bos 94, Mia 94, Man 94, Klo 97,
1. Introduction 15
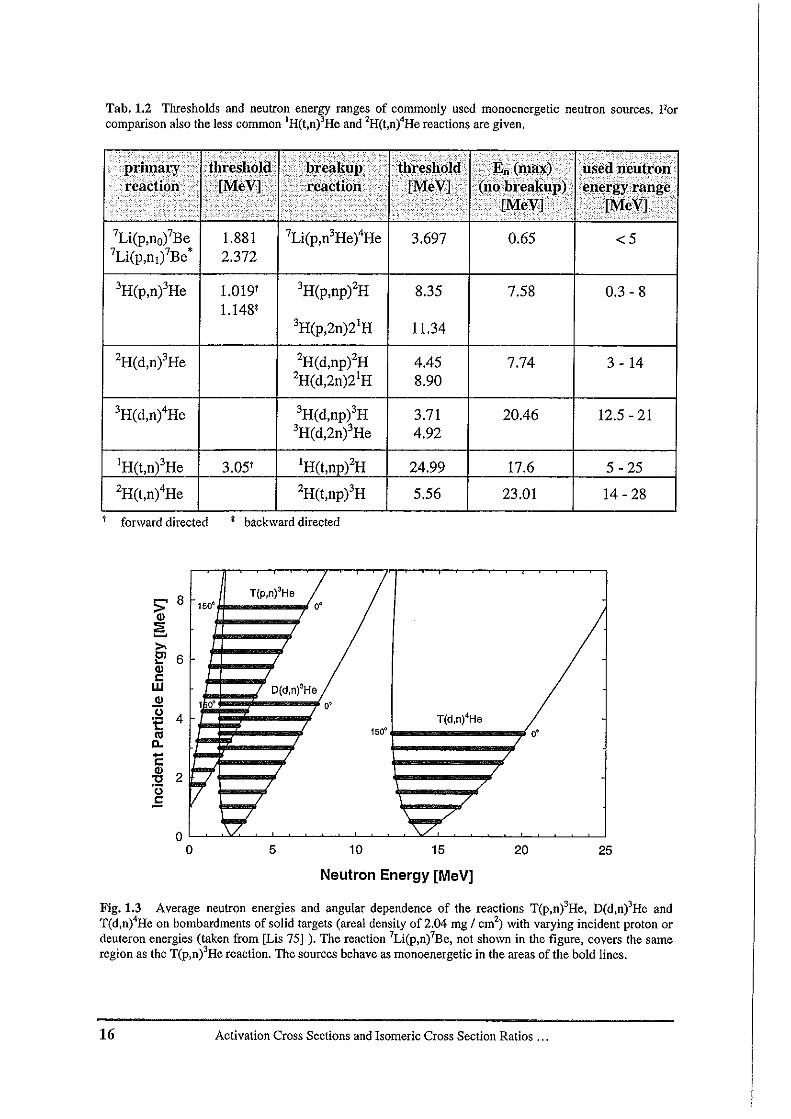
Tab. 1.2 Thresholds and neutron energy ranges of commonly used monoenergetic neutron sources. Forcomparison also the less common 'H(t,n)'He and 2H(t,n)'He reactions are given.
1 ' .' >. ~ 1-: c ,.' '. . I·. .', ~ ',y)' 1'. '- . ....I ... • "'~~J Jl~ I . <,:'[: r~;ll( . ,k.:..:,I-'''''--1; ..·."'''< .. t..· •. •.·•••:·.·.·:.:··1 '-;:· ',:-' ·.L. " .. I~.·. ':1 _c :';.!.: : ..~ ; I' ."
• :' -: :;'. . . '. " .' -:.,. ,- ,-, • J ;.-': _. _ •
7Li(p,nofBe 1.881 7Li(p,n3He)4He 3.697 0.65 < 57Li(p,nlfBe* 2.372
3H(p,n)3He 1.019' 3H(p,np)2H 8.351.148'
3H(p,2n)2 IH 11.34
2H(d,n)3He 2H(d,np)2H 4.452H(d,2n)21H 8.90
3H(d,n)4He 3H(d,np)3H 3.713H(d,2niHe 4.92
IH(t,niHe 3.05' IH(t,np)2H 24.99
2H(t,n)4He 2H(t,npi H 5.56
t forward directed ' backward directed
7.58
7.74
20.46
17.6
23.01
0.3 - 8
3 - 14
12.5 -21
5 - 25
14 - 28
~ 8T(p,n)'He
> 150·Ql~~
>-OJ 6...Qll:W D(d,n)'HeQl o''0'f 4 T(d,n)'He
'"150· o'
D.....eQl
2'tl'0.E
00 5 10 15 20 25
Neutron Energy [MeV]
Fig.1.3 Average neutron energies and angular dependence of the reactions T(p,n)'He, D(d,n)'He andT(d,n)'He on bombardments of solid targets (areal density of 2.04 mg / cm2
) with varying incident proton ordeuteron energies (taken from [Lis 75] ). The reaction 'Li(p,n)'Be, not shown in the figure, covers the sameregion as the T(p,n)'He reaction. The sources behave as monoenergetic in the areas of the bold lines.
16 Activation Cross Sections and Isomeric Cross Section Ratios ...
Man 97]. Recently, the 14N(d,n)150, 15N(d,n)160 and IH(llB,n) l1C reactions were
successfully used to produce quasi-monoenergetic neutrons with energies between 7 and12 MeV [Chi 89, Ike 92, Mat 94].
The spallation neutron source at Los Alamos (LAMPpl/WNR2/LANSCE3) [Lis 90b]provides data over the continous neutron energy range from threshold to 50 MeV [Gri 96,Hai 97a, Hai 97b]. The neutrons are identified with TOP techniques. Quasi-monoenergeticneutron fields used for neutron energies up to 40 MeV are the 9Be(p,n)9B reaction [Uwa88, Uwa 92, Uwa 94] or the 7Li(p,n/Be reaction [Uno 96, Uwa 97]. POI' these type ofneutron fields accelerators are needed which can provide 40 MeV proton beams.
As the last point should be mentioned the kinematically collimated sources, e. g.2H(t,n)4He, IH(t,niHe, IHCLi,n)7Be, IH(llB,n) l1C, IH(13C,n)13N and IH(15N,n)150. These
sources emit neutrons only in the forward direction which gives a minimum roombackground and simplifies shielding [Dro 90]. They might be also usable in the gapregion, i. e. at -10 MeV, but surprisingly they are not commonly used for cross sectionmeasurements. Even the outstanding feature of the IH(t,n)3He reaction [Hai 89, Hai 90],the specific yield over most of the energy range (1000 times more than the T(d,ntHereaction at 14 MeV with a Tiff target), does not overcome the main disadvantage of thesource, i. e. the handling of the radioactive triton beam. Nevertheless, some measurementswere done for neutron energies up to 13 MeV [Dra 77, Hai 90, Hai 96].
Different types of targets are commonly used [Dro 90]. Gas targets consist of a smallthin-walled cell of stainless steel with a thin entrance window (made of Havar, Ni or Mo;5 - 10 urn thick) towards the accelerator vacuum. On the other end a solid disk (made ofAu, Pt, Ta or W) serves as a beam stop. Because of much lower neutron backgroundtungsten has been proven to be a more advantageous material for the beam stop [Gra 93,Gra 94] than brass and molybdenum, as used earlier. Usually the gas pressure is around 2bar (2 x 10⁵ Pa) and beam currents of 4 - 5 uA are used. With special target arrangements,e. g. beam diffusion [Mea 80] or rotating cells [Hai 90], currents up to 20 f.lA can be used.
Solid hydrogen targets usually consist of deuterium or tritium impregnated titanium orzirconium foils (l to 1.5 deuterium or tritium atoms per titanium atom). Lithium is usedeither as metal or fluoride.
Solid targets are more easy to handle (no leakage problems) and have a better geometrythan gas targets (point source instead of line source). Their disadvantage is the stronglyreduced yield (by about one order of magnitude) and neutron energy width and that thetarget nuclide is not uniformly distributed over the target area (beamspot position becomesvery important). There is also no easy way to produce a dummy target for the simulation ofthe target background. With gas targets the background can be estimated using gas-outruns, i. e. via irradiations with an empty gas cell.
I Los Alamos Meson Physics Facility2 Weapons Nuclear Research Facility3 Los AlamosNeutron ScienceCentre
1. Introduction 17
For the determination of the neutron energy spectrum several methods are applied [Csi87]. The scattering of neutrons on hydrogen is used in the proton recoil method. The recoilspectrum of protons is determined using proportional counters, scintillation orsemiconductor detectors. The relationship between proton and neutron energy is given by
2Ep = Ell cos 0. (1.19)
High energy resolution spectra can be obtained in combination with theTOF method(see chapter 3.2.2). Another popular method is the multiple foil activation technique incombination with computer codes such as SAND II [McE 67, Ost 73], CRYSTAL BALL[Kam 74] or RFSP [Fis 72] for the spectrum unfolding. Several metal foils are activatedand by measuring the activity of different threshold reactions the spectrum can be unfolded[Qai 84, wer 84, WOl 85, Man 90, Uwa 92, WOl 93]. The requirements of the method area good knowledge of the excitation functions and decay characteristics of the reactionproducts. The programs obtain their solution by introducing an input spectrum and makingan iterative refinement of this input spectrum. The problem of this procedure is that thesolution depends more or less on the quality of the input spectrum. Sudar solved thisproblem by developing the code SULSA [Sud 89] which is based on the iterative solutionof the generalized least squares method. Here only the individual reaction rates have to beknown but no input spectrum is needed.
1.4.2 Neutron Fluence Determination and the Use of Cross Section Standards
The measurement of activation cross sections requires a knowledge of the neutronfluence <P(E) according to (1.4). Absolute fluence measurements are possible with theassociated-particle method. The emitted 3He or 4He particle of the D(d,n)3He, T(p,n)3Heor T(d,n)4He neutron source reaction can be counted with high accuracy (-1 %) with asurface barrier detector [Bar 52, Few 68, Lis 69, Pau 71, Fow 80, Win 91]. Nevertheless,the method is difficult to use since the geometry has to be measured with the sameaccuracy.
Therefore, most nuclear cross section measurements are done relative to a cross section"standard" [BOd 87, Con 92]. The cross section in question is then derived from the ratioof the measured reaction rates in the investigated sample material to the reference material.Besides a good knowledge of the cross section the reference reaction should haveo a low sensitivity to contaminant low energy neutrons (high reaction threshold),o an excitation function which does not vary too rapidly with the energy (the response of
the reference is less sensitive to the correct energy scale),o a half-life of the reaction product which is long compared to the irradiation time in
order to enable integration over a time-dependent neutron flux.The detection techniques for the reference reaction should fulfil the same accuracy
18 Activation Cross Sectionsand Isomeric Cross Section Ratios ...
requirements to which the standard is known. As an example, the accuracy of the verywell-known elastic scattering cross section of hydrogen [Ran 92, Hal 92] is somehowaffected by the uncertainty of the proton recoil detection efficiency of the employedtelescope counter incorporating the hydrogen-containing substance (i. e. polyethylene) andthe uncertainty in the arial density of the hydrogen atoms.
The fission reaction 238U(n,f) has also been very reliably evaluated over the wholeenergy range up to 20 MeV [Kan 92]. The method is based on the prompt detection offission fragments by means of a low-mass ionization chamber [Win 80, Wag 88a, Wag88b, Win 91, Man 97]. The accuracy depends on the precise knowledge of the propertiesof the thin uranium deposit (mass, thickness, areal density, isotopic purity) and the fissionfragment detection efficiency (corrections have to be applied for attenuation and totalabsorption of some fission fragments) [Win 89, Dra 89].
If the fluence value determined by the monitor has to be adjusted to the sampleposition, the accuracy of the fluence determination will be influenced by a knowledge ofthe relative positions of sample and monitor. Also the fluence gradient will affect theresults.
Several source reactions produce a radioactive product which can be measured viagamma-ray spectrometry and therefore used as a fluence monitor. For example, the7Li(p,n)7Be reaction has the property that the number of 7Be atoms produced in the 7Litarget is equal to the number of the monoenergetic peak neutrons released in the 41tdirection [Tak 96].
As a conclusion, the simplest way to monitor the neutron fluence is to use metalmonitor foils which are chemically pure and stable and where the induced radioactivitycan easily be measured. Generally these foils are used in "sandwich" arrangements (almostsame geometry of sample and reference). An even better way is the use of twoindependent methods (i. e. activation of metal foils and proton recoil telescope, see [Wol88, Lis 89a, Lis 89b, Lis 90a, Mol 91]). In any case the influence of possible contaminantneutrons has to be estimated or measured botb for the sample and the reference.
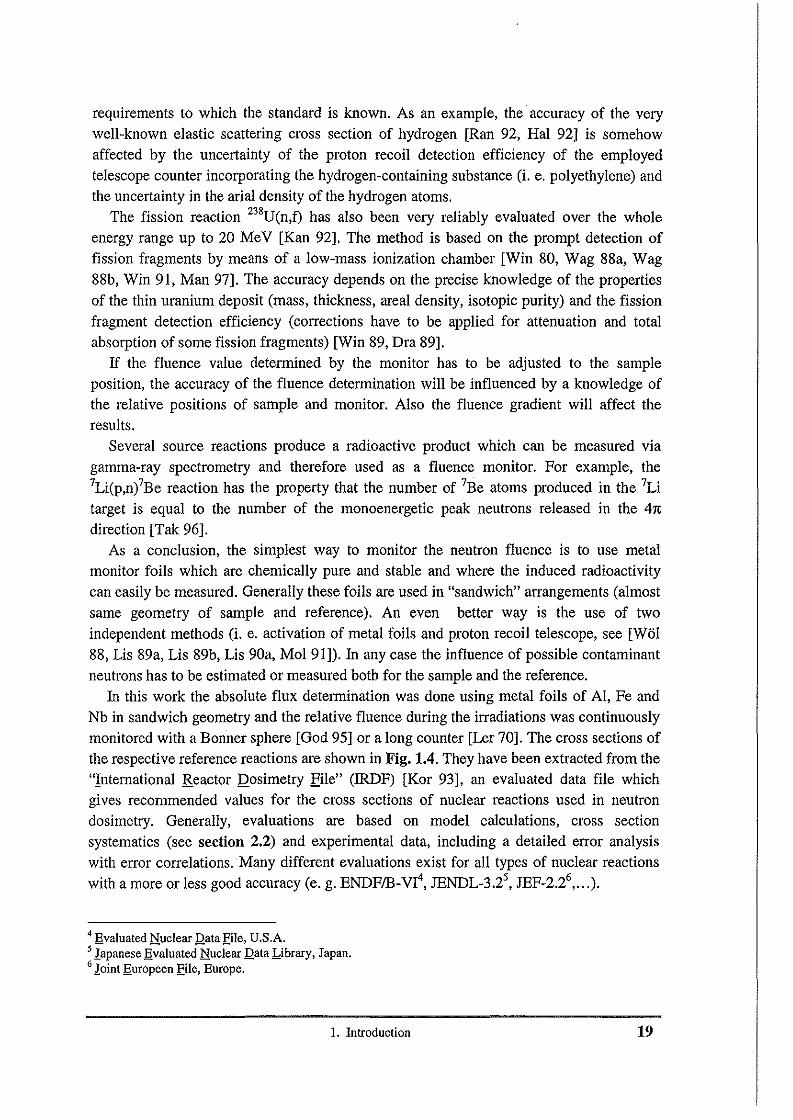
In this work the absolute flux determination was done using metal foils of AI, Fe andNb in sandwich geometry and the relative fluence during the irradiations was continuouslymonitored with a Bonner sphere [God 95] or a long counter [Ler 70]. The cross sections ofthe respective reference reactions are shown in Fig. 1.4. They have been extracted from the"International Reactor Dosimetry Eile" (IRDF) [Kor 93], an evaluated data file whichgives recommended values for the cross sections of nuclear reactions used in neutrondosimetry. Generally, evaluations are based on model calculations, cross sectionsystematics (see section 2.2) and experimental data, including a detailed error analysiswith enol' correlations, Many different evaluations exist for all types of nuclear reactionswith a more or less good accuracy (e. g. ENDFIB-VI4, JENDL-3.25
, JEF-2.26, ... ).
4 Evaluated Nuclear Data File, U.S.A.s Japanese Q~aluatedNuckar Qata Library, Japan.6 Ioint Quropeen Eile, Europe.
1. Introduction 19

201510
Neutron Energy [MeV]
5
(1 )
/'~'~'(~'-'-'-'-'-'~'~
/I. ..., .' .:.:..::..:.;:.:.:.::.:..:.".:..:,.~:..:..:. ...:..:....:.."...
····1····.-.- ~.,' /' ~
~r/I -,~-~ . '.
/.' If/.... '/ .... !
/ i I/ i 'i , !I : (2) I
(3)/! .( ! !( ! I( j .
-- 27A1(n,p)"Mg (1)
........ 27AI(n,a)24Na (2)
--- "Fe(n,p)"Mn (3)
_.- "Nb(n,2n)'2mNb (4)
o
:cE
...... 102ConQl
en~eo 10'
Fig. 1.4 Evaluated cross sections for the reference reactions used in this work. The data are taken fromIRDF-90, Version 2 [Koc 93].
1.5 Status of Available Neutron Activation Cross Section Data for Cr,Fe andNi
The elements Cr, Fe and Ni consist of several stable isotopes (see Tab. 1.3). They areimportant constituents of structural materials for fission or fusion reactors. Extensivestudies of activation cross sections at neutron energies around 14 MeY have been done on(n,p), (n.o) and (n,2n) reactions. At neutron energies below and above 14 MeY, mainlyreactions on the high abundant isotopes 52Cr, 56Pe and 58,60Ni have been investigated.
Complete excitation functions from threshold to 20 MeY with good accuracy « 5%) havebeen measured for the 56pe(n,pi 6Mn and 58Ni(n,p)58Co reactions which are now
frequently used as reference cross sections in activation cross section measurements.Activation cross sections on Cr have been measured for 50Cr(n,np)49y, 52Cr(n,pi2y,
52Cr(n,2ni1Cr, 53Cr(n,pi3y, 53Cr(n,npi2y, 54Cr(n,pi4y, 54Cr(n,npi3y and 54Cr(n,ai1Ti
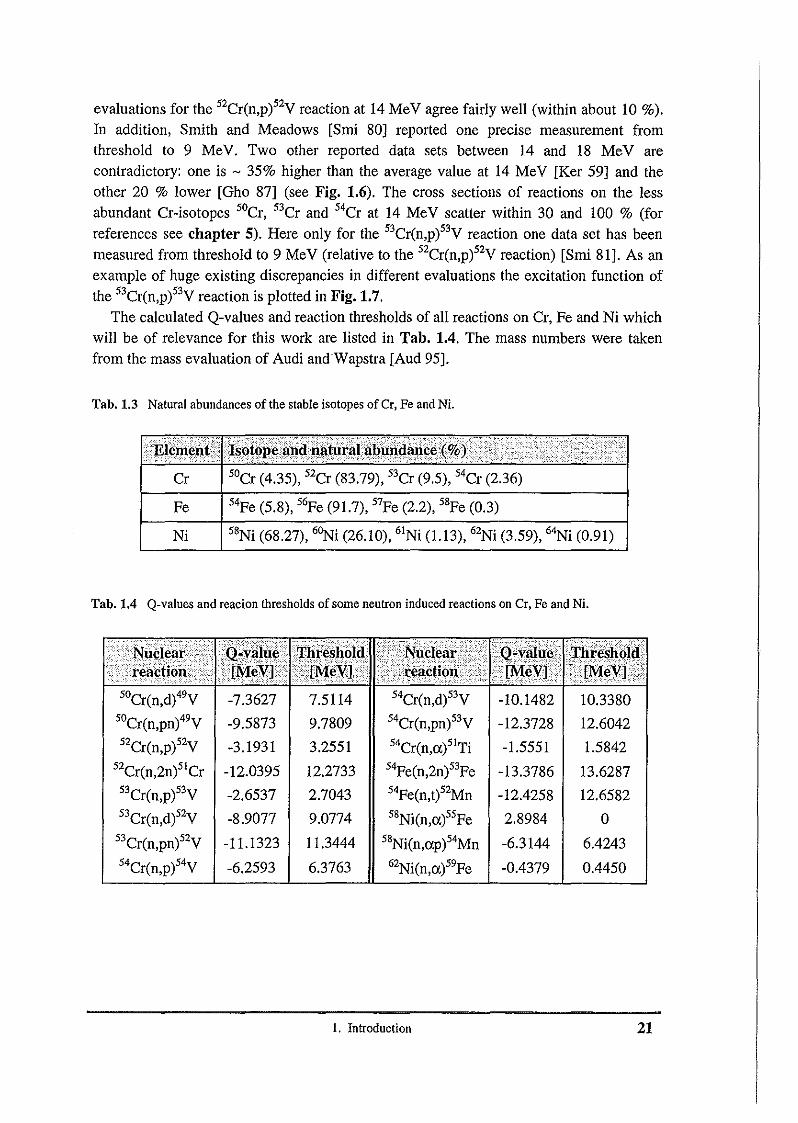
reactions around 14 MeY. The 52Cr(n,2n)5tCr reaction has been investigated from
threshold to 20 MeY. The data below 16 MeY agree within IS % whereas beyond thatenergy the three available data sets bifurcate into two groups (see Fig. 1.5): the data ofLiskien et at [Lis 89b] rise up to a value of 650 mb at 20 MeY whereas the two other datasets [Bor 68, Gho 87] give a lower value (ermax - 500 mb at 18 MeY). The different
20 Activation Cross Sections and Isomeric Cross Section Ratios ...
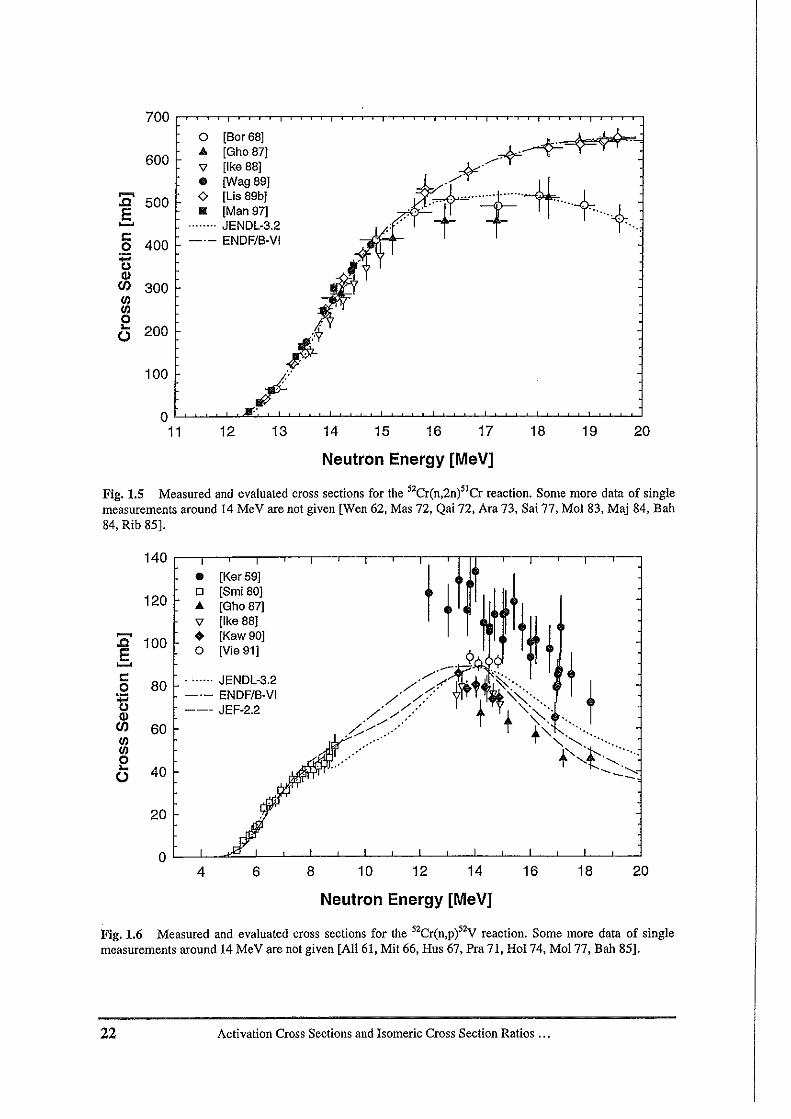
evaluations for the 52Cr(n,pi2y reaction at 14 MeY agree fairly well (within about 10 %).In addition, Smith and Meadows [Smi 80] reported one precise measurement fromthreshold to 9 MeY. Two other reported data sets between 14 and 18 MeY arecontradictory: one is - 35% higher than the average value at 14 MeY [Ker 59] and theother 20 % lower [Gho 87] (see Fig. 1.6). The cross sections of reactions on the lessabundant Cr-isotopes 50Cr, 53Cr and 54Cr at 14 MeY scatter within 30 and 100 % (for
references see chapter 5). Here only for the 53Cr(n,pi 3y reaction one data set has beenmeasured from threshold to 9 MeY (relative to the 52Cr(n,p)52y reaction) [Smi 81]. As anexample of huge existing discrepancies in different evaluations the excitation function ofthe 53Cr(n,pi3y reaction is plotted in Fig. 1.7.
The calculated Q-values and reaction thresholds of all reactions on Cr, Pe and Ni whichwill be of relevance for this work are listed in Tab. 1.4. The mass numbers were takenfrom the mass evaluation of Audi andWapstra [Aud 95].
Tab. 1.3 Natural abundances of the stable isotopes of Cr, Fe and Ni.
Cr 50CI' (4.35), 52Cr (83.79), 53Cr (9.5), 54Cr (2.36)
Pe 54Pe (5.8), 56Pe (91.7), 57Pe (2.2), 58Pe (0.3)
Ni 58Ni (68.27), 6~i (26.10), 61Ni (1.13), 62Ni (3.59), 64Ni (0.91)
Tab. 1.4 Q-values and reacion thresholds of some neutron induced reactions on Cr, Fe and Ni.
~j;;;~ ,<;?; hi~
5 "'}:>'»;::;'
I:;li",i<: F·
i~~~il~1{{XS :WS' 1\: gT~r~!wI,~i; :':.: ::::·'.;:i:tM:~¥]g: I: IJ lIlev
);"
5OCr(n,d)49y -7.3627 7.5114 54Cr(n,di3y -10.1482 10.33805OCr(n,pn)49y -9.5873 9.7809 54Cr(n,pni3y -12.3728 12.604252Cr(n,pi2y -3.1931 3.2551 54Cr(n,a)5ITi -1.5551 1.5842
52Cr(n,2niICr -12.0395 12.2733 54pe(n,2n)53pe -13.3786 13.628753Cl'(n,p)53y -2.6537 2.7043 54pe(n,ti2Mn -12.4258 12.6582
53Cl'(n,di2y -8.9077 9.0774 58Ni(n,ai5pe 2.8984 0
53Cr(n,pni2y -11.1323 11.3444 58Ni(n,ap)54Mn -6.3144 6.4243
54Cr(n,pi4y -6.2593 6.3763 62Ni(n,a)59pe -0.4379 0.4450
I. Introduction 21
o [Bor68J"" [Gho 87J'V [Ike 88J• [Wag 89J<) [Us 89b].. [Man 97]
........ JENDL-3.2_.- ENDF/B-VI
700
600
~.c 500E.......c
4000:;::;0Ql
(J) 300IIIIII0... 2000
100
011 12 13 14 15 16 17 18 19 20
Neutron Energy [MeV]
Fig. 1.5 Measured and evalnated cross sections for the 52Cr(n,2n)51Cr reaction. Some more data of singlemeasurements around 14 MeV are not given [Wen 62, Mas 72, Qai 72, Ara 73, Sai 77, Mol 83, Maj 84, Bah84, Rib 85].
140
• [Ker59J
1200 [Smi 80J
"" [Gho 87]'V [Ike 88].....,
100 • [Kaw 90].cE 0 [Vie 91]
/>/~~'\< tt.......c
80 ....... JENDL-3.20
n _.- ENDF/B·VI
Ql--- JEF·2.2 / /' .:' + +"~'(J) 60 /-'..../ .. ' ". ....
III --- ..... +"".-;........III +";t-<......0... 400 --~
20
04 6 8 10 12 14 16 18 20
Neutron Energy [MeV]
Fig. 1.6 Measured and evaluated cross sections for the 52Cr(n,p)'2V reaction. Some more data of singlemeasurements around 14 MeV are not given [All 61, Mit 66, Hus 67, Pra 71, Hal 74, Mol 77, Bah 85].
22 Activation Cross Sections and Isomeric Cross Section Ratios ...
. .
60
• [All 61J.. [Hus 67J
50 'V [Pra71]A [Hal74]
~ • [Mol77]..0 0 [8m; 81JE 40....... 0 [Yie 91]t: . ..... JENDL·3.20 _.- ENDF/B·YI:;:::0 30 -_. JEF·2.2Ql(/)(f)(f)
200...0
10
02 4 6 8 10 12
"
14 16 18 20 22
Neutron Energy [MeV]
Fig. 1.7 Measured and evaluated cross sections for the "Cr(n,p)"V reaction.
140
• [Chi 61J.. [And 68J120 A [OaI72]
0 [Kur 75],......, V [Bor 76]..0 100E • [Ryv 78a]
....... <> [Ryv78b]s:::
80 V [Osa 89J0
:;::: 0 [Yie 91]0 JENDL·3.2Ql
_.- ENDF/B·YI(/) 60(f) -_. JEF·2.2(f)0... 400
20
20191817161514OL..L~~)LJ~~--'---~~...l-~~......L.~~""""'~~""""'~~....-l
13
Neutron Energy [MeV]
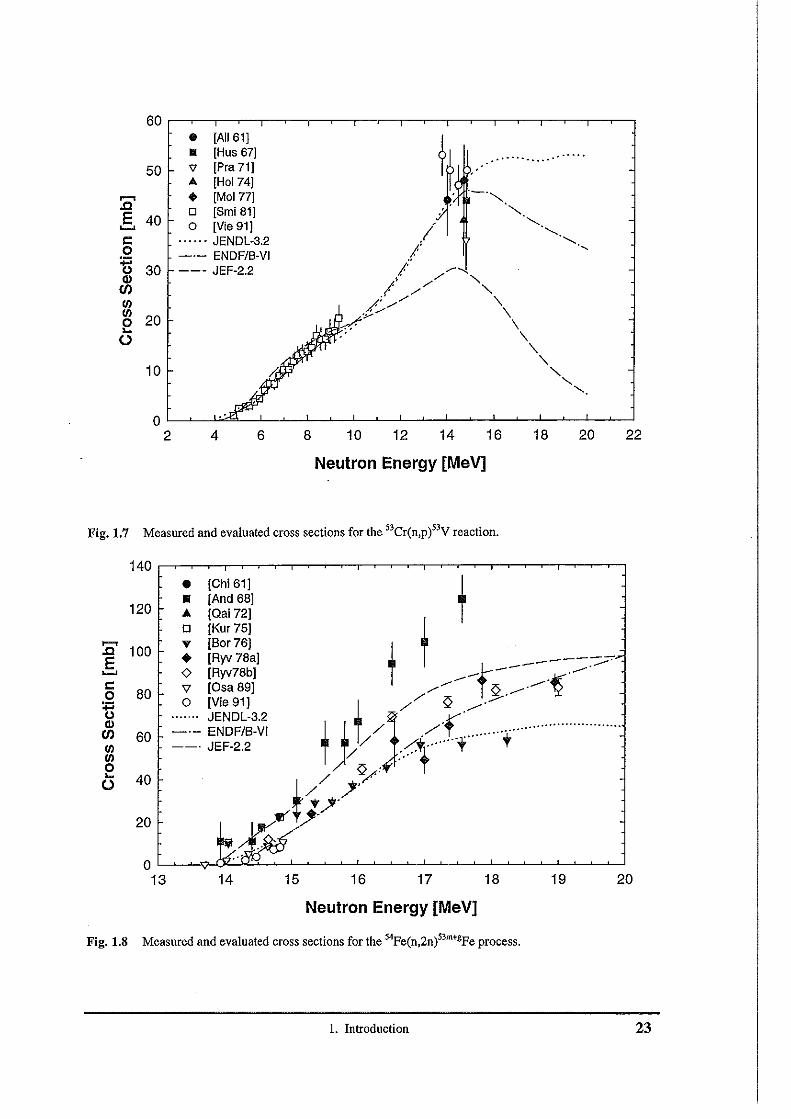
Fig. 1.8 Measured and evaluated cross sections for the 54Fe(n,2n)" m+gFe process.
1. Introduction 23
20
,
181614
,
12108
,
6
........ JENDL-3.2_.- ENDF/B-VI--- JEF-2.2
t·.~ 1. '-.. . ~.~.:. c, J.. /' ..... "\.."
~.' Df¥+ /' -, -,
/ .-- ".: -- -. "\.. ".I : .....:" -,
/~ ....:~ "
<:II """:~/4
42
,
• [See 65Jo [Kha 73J.... [Do176Jv [OaI76]III [Grt 79]o [Oa; 84JA [Kne86).., [Gra 87]• [Wat 91]o [Gov94]a [fsa 94](j) [Hai96]
O'----~.......,=-'-L~~'----~..l-~-L.~--'-~--'----~_'_~__'_'___'
o
40
160
:0E.......c: 120onQl
enf/I 80
eo
Neutron Energy [MeV]
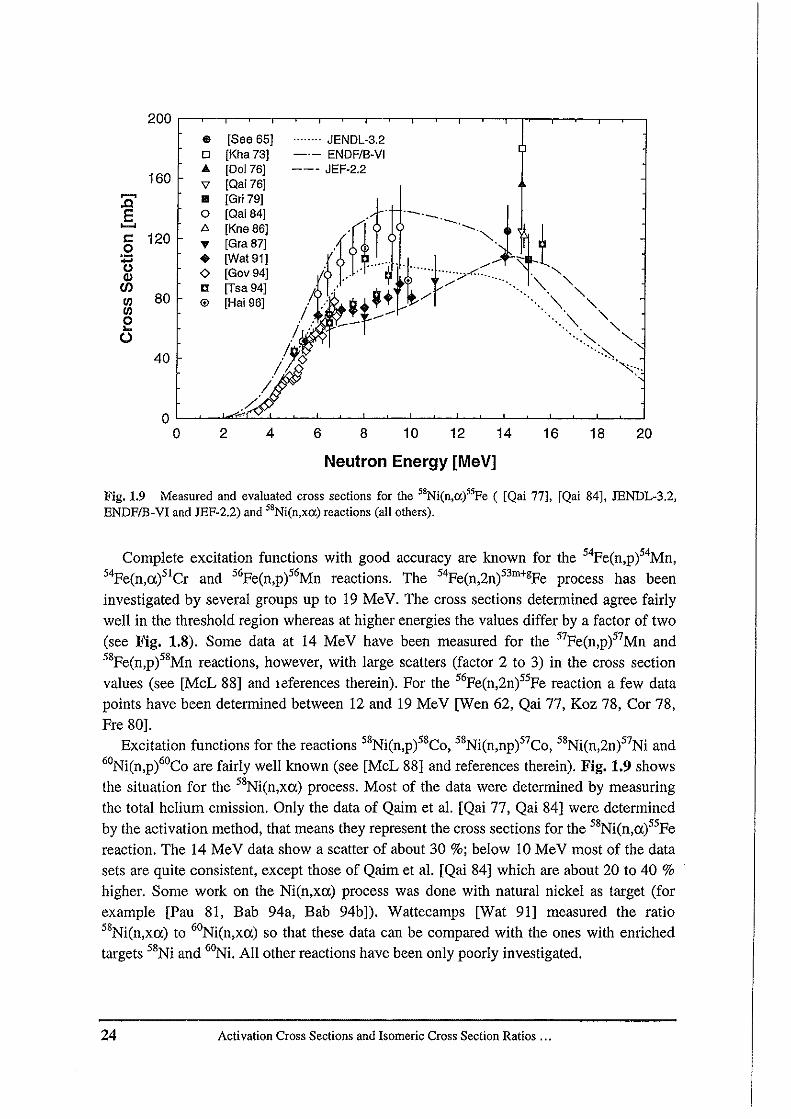
Fig. 1.9 Measured and evaluated cross sections for the "Ni(n,a)"Pe ( [Qai 77), [Qai 84), JENDL-3.2,ENDPIB-VI and JEP-2.2) and 5'Ni(n,xa) reactions (all others).
Complete excitation functions with good accuracy are known for the 54Fe(n,pi4Mn,
54Fe(n,a/'Cr and 56Fe(n,p)56Mn reactions. The 54Fe(n,2n)53m+gFe process has been
investigated by several groups up to 19 MeV. The cross sections determined agree fairlywell in the threshold region whereas at higher energies the values differ by a factor of two(see Fig. 1.8). Some data at 14 MeV have been measured for the 57Fe(n,pi7Mn and58Fe(n,pi 8Mn reactions, however, with large scatters (factor 2 to 3) in the cross sectionvalues (see [McL 88] and references therein). For the 56Fe(n,2ni5Fe reaction a few datapoints have been determined between 12 and 19 MeV [Wen 62, Qai 77, Koz 78, Cor 78,Fre 80].
Excitation functions for the reactions 58Ni(n,pi8Co, 58Ni(n,npi7Co, 58Ni(n,2n)57Ni and
6oNi(n,p)60Co are fairly well known (see [McL 88] and references therein). Fig. 1.9 showsthe situation for the 58Ni(n,xa) process. Most of the data were determined by measuringthe total helium emission. Only the data of Qaim et al. [Qai 77, Qai 84] were determinedby the activation method, that means they represent the cross sections for the 58Ni(n,ai5Fereaction. The 14 MeV data show a scatter of about 30 %; below 10 MeV most of the datasets are quite consistent, except those of Qaim et al. [Qai 84] which are about 20 to 40 %
higher. Some work on the Ni(n,xa) process was done with natural nickel as target (forexample [Pau 81, Bab 94a, Bab 94bJ). Wattecamps [Wat 91] measured the ratio58Ni(n,xa) to 6oNi(n,xa) so that these data can be compared with the ones with enrichedtargets 58Ni and 6~i. All other reactions have been only poorly investigated.
24 Activation Cross Sections and Isomeric Cross Section Ratios ...
In summary, for the three elements under consideration, a few reactions have beeninvestigated in detail whereas for several others either there are gaps or only scantyinformation is available. Furthermore, in a few cases of key importance, considerablediscrepancies exist, so that a new attention is necessary.
1. Introduction 25
26 Activation Cross Sections and IsomericCrossSectionRatios ...
2. Aim and Scope of this Work
As mentioned in the Introduction, the elements chromium, iron and nickel are allimportant constituents of structural materials for fission or fusion reactors. The main aimof this work was to study the excitation functions of (n.p), (n.np), (n,e), (n.op), (n,2n) and(n.t) reactions which lead to radioactive products and are therefore measurable via theactivation method. Special emphasis was on those energy regions where no data existed.
For the measurement of short-lived activities involved in this work, a special pneumatictransport system should be developed to transport the irradiated samples from the neutronsource area to the counting area. This system would allow the first activity measurements
-lOs after the end of irradiation.The reactions 52Cr(n,pi2V, 53Cr(n,p/3V and 54Cr(n,pi4V all lead to short-lived
radioactive products. The reaction on the main isotope 52Cr is the only one which is fairlywell investigated. The high abundance and the substantial cross section (- 100 mbbetween 14 and 15 MeV) make this reaction of practical interest. Nevertheless, no data areavailable between 10 and 14 MeV (a region rather difficult to investigate) and beyond 15MeV there is considerable scatter in the two existing data sets. The reactions on the twoless abundant isotopes 53Cr and 54Cr have been poorly characterized. It was thereforethought worthwhile to investigate those reactions. Since very few (n.np) reactions havebeen studied in any detail, the 50Cr(n,np)49V reaction is of considerable interest. It poses agreat challenge since the product 49V emits only soft X-rays with energies of 4 and 4.5 keVwhich cannot be studied by routine gamma-ray spectrometry. An additional problem is thenon-availability of standard extended sources for those soft X-rays. The use of aradiochemical separation and preparation of a thin sample for X-ray counting appears verypromising. In addition a standard source of 49V for the calibration of the Si(Li) detectoralso needs to be prepared. Prom a fundamental point of view, the measured reaction crosssections on the different stable isotopes of chromium should shed some light on the effectof varying neutron and proton binding energy on the reaction cross section.
The reactions 54pe(n,2ni3m,gPe and 54pe(n,ti2m,gMn are of appreciable fundamental
interest. Both of them lead to high spin isomeric states. Their formation was recentlyinvestigated in charged particle induced reactions like eHe,2n) and eHe,t+dn+p2n),respectively, A comparison of the isomeric cross section ratios in neutron and chargedparticle induced reactions should lead to some information about the effect of mass andcharge of the projectile on the population of the isomeric state,
The natNi(n,xa) process is of practical importance for the estimation of heliumproduction in structural materials. Although extensive measurements have been performedrecently to determine the total helium production in natNi and 58,6tNi below 15 MeV, theindividual contributions of the reactions like 58Ni(n,ai5pe, 62Ni(n,ai9pe or58Ni(n,api4Mn to the total production cross section have hitherto not been investigated
2. Aim and Scope of this Work 27
beyond 15 MeV. These individual reaction cross sections are important for theimprovement of the calculation of excitation functions with nuclear model codes. Thereasons for this lack of experimental data are the low abundance of 62Ni and the fact thatthe reaction product 55Pe decays only via soft X-ray emission. In this work the58Ni(n,a)55pe reaction should be investigated for the first time between 13 and 20 MeVwith the activation method after a radiochemical separation and thin sample preparation byelectrolysis. The reaction 62Ni(n,ai9pe should also be investigated for the first time
beyond 14 MeV.For most of the experimentally determined excitation functions nuclear model
calculations using the code STAPRE-H should be done in order to test the quality of theunderlying models and to help develop input parameters for reactions on adjacent isotopeswhich are difficult to measure or which are not measurable at all.
28 ActivationCross Sectionsand IsomericCross SectionRatios ...
3. Experimental Methods77Trz·· T'W
3.1 Irradiations
Three series of irradiations (in the following called Julich, Geel land Geel 2) were
carried out using different experimental facilities with different neutron sources. In theneutron energy range of 9.3 to 12.3 MeV irradiations were performed at the variable
energy Compact Cyclotron CV 28 at the Forschungszentrum Jiilich GmbH using the2H(d,ni He reaction (Q-value = 3.269 MeV) on a deuterium gas target. In the energy range
from 13.3 to 21.0 MeV irradiations were conducted at the 7 MV Van de Graaff acceleratorat the CEC-JRC, IRMM at Geel using the 3H(d,n)4He reaction (Q-value = 17.59 MeV) on
a solid-state Tiff target. Here two different irradiation geometries were used. One allowedthe irradiation of several samples simultaneously under several angles (Geell), useful for
long irradiations; the other used a pneumatic sample transport system (Geel 2), especiallydesigned for measurements on short-lived isotopes. The details are given below.
3.1.1 Setup «[illich-
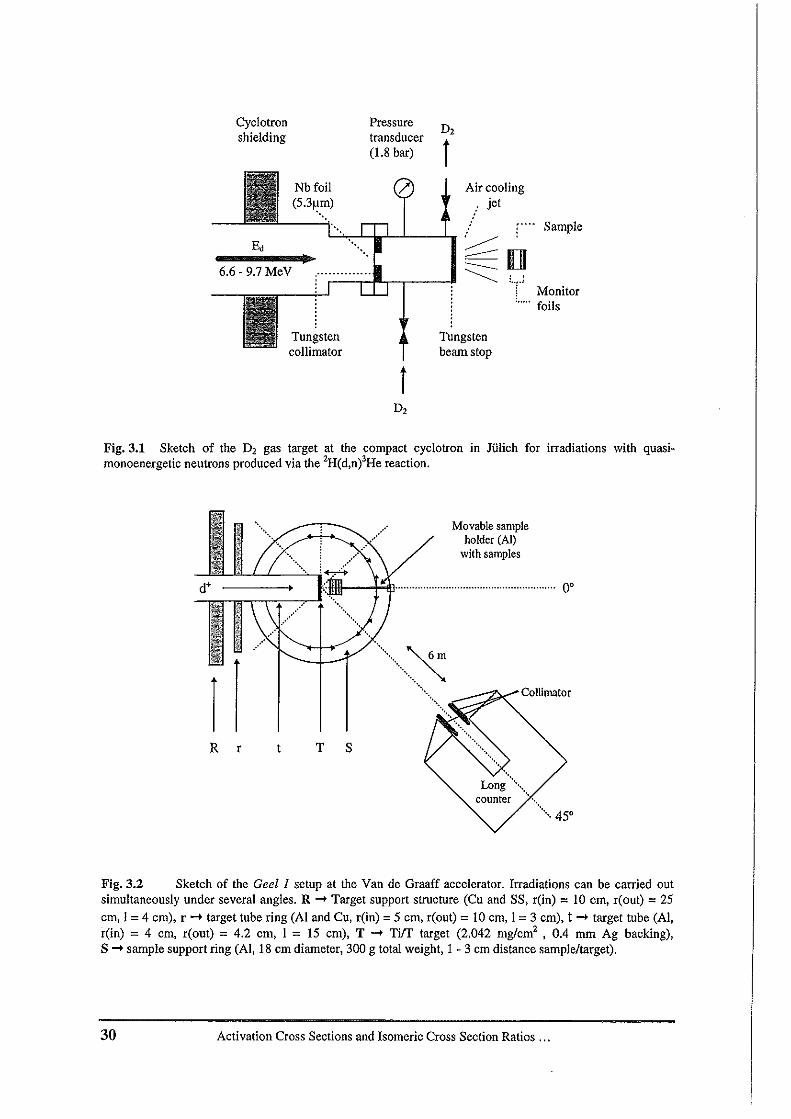
A sketch of the irradiation geometry is shown in Fig. 3.1. A more detailed descriptionof the gas target is given by Qaim et al. [Qai 84). The collimated deuteron beam from the
cyclotron enters the deuterium gas cell (3.7 em long, 4.0 cm in diameter, 1.8 x 10⁵ Pa
pressure of deuterium gas) via the 5.3 JIm niobium window, loses some energy in thewindow and the gas and is stopped in the tungsten "beam stop" which is cooled by a jet ofair. The samples irradiated in the 0° direction relative to the incident beam were placed at
a distance of 1 em from the back of the beam stop. The target is insulated against the beam
tube and the integrated charge is recorded for each individual irradiation. The deuteronenergies were measured by a time-of-flight technique [Kor 94).
For each chosen deuteron energy one irradiation was done with a filled cell (gas-in) andone with an empty cell (gas-out), both of them in an identical geometry. The gas-outirradiations are needed to allow a correction of the corresponding background neutronsstemming from interactions of the deuterons with structural materials (entrance window,beam stop, cell wall, ... ). At the highest incident deuteron energy of 9.7 MeV the
'contribution of these background neutrons to the total activation was 5 to 10 % for the
investigated reactions, depending on the reaction threshold involved.
3. Experimental Methods 29
Cyclotronshielding
Pressuretransducer(1.8 bar)
D2
t
6.6 - 9.7 MeV
Nb foil(5.3~m)
.....-.
/'
Sample
Tungstencollimator
tTungstenbeam stop
Fig. 3.1 Sketch of the D2 gas target at the compact cyclotron in Jtilich for irradiations with quasimonoenergetic neutrons produced via the 2R(d,n)'Re reaction.
11R r
Movable sampleholder(AI)
with samples
-flJ·························································0'
-. ~................................::::;;:~~ Collimator
T S
Fig. 3.2 Sketch of the Geel 1 setup at the Van de Graaff accelerator. Irradiations can be carried outsimultaneously under several angles. R ... Target support structure (Cu and SS, r(in) = 10 em, r(out) = 25em, 1=4 em), r'" target tube ring (AI and Cu, r(in) = 5 em, r(out) =10 em, I =3 em), t ... target tube (AI,rein) = 4 em, r(out) = 4.2 em, I = 15 em), T ... Tiff target (2.042 mg/cm' , 0.4 mm Ag backing),S ... sample support ring (AI, 18 em diameter, 300 g total weight, I - 3 em distance sample/target).
30 Activation Cross Sections and Isomeric Cross SectionRatios ...
3.1.2 Setup -Geell-
This irradiation facility (Fig. 3.2) uses the beamline L3 at the 7 MV Van de Graaffaccelerator in Gee!. The deuteron beam impinges on a solid Ti/T target (2.042 mg/cm''thickness, backed by a 0.4 mm silver foil) where the neutrons are generated. The energyscale of this accelerator is calibrated via a nuclear magnetic resonance system relative towell-known reaction thresholds and resonances with an accuracy of ± 5 keV. The targettube is wobbled and air cooled. The samples were fixed in an aluminium sample holderring of 18 cm diameter, as described by Pavlik et a!. [Pav 82]. This sample holder ring wasthen adjusted with its centre above the nominal source position. The whole target assemblywas designed for the purpose of cross section measurements to keep the amount ofstructural material around the target small and as light as possible and to allowmeasurements under different angles with respect to the incident d+ beam direction. Eitheronly one or several samples under different angles were mounted. During all irradiations,the source intensity was continuously monitored by counting the neutrons in a longcounter using the Multi-Channel-~caling (MCS) method. The beam current was recordedin a charge integrator.
3.1.3 Setup -Geel Z-
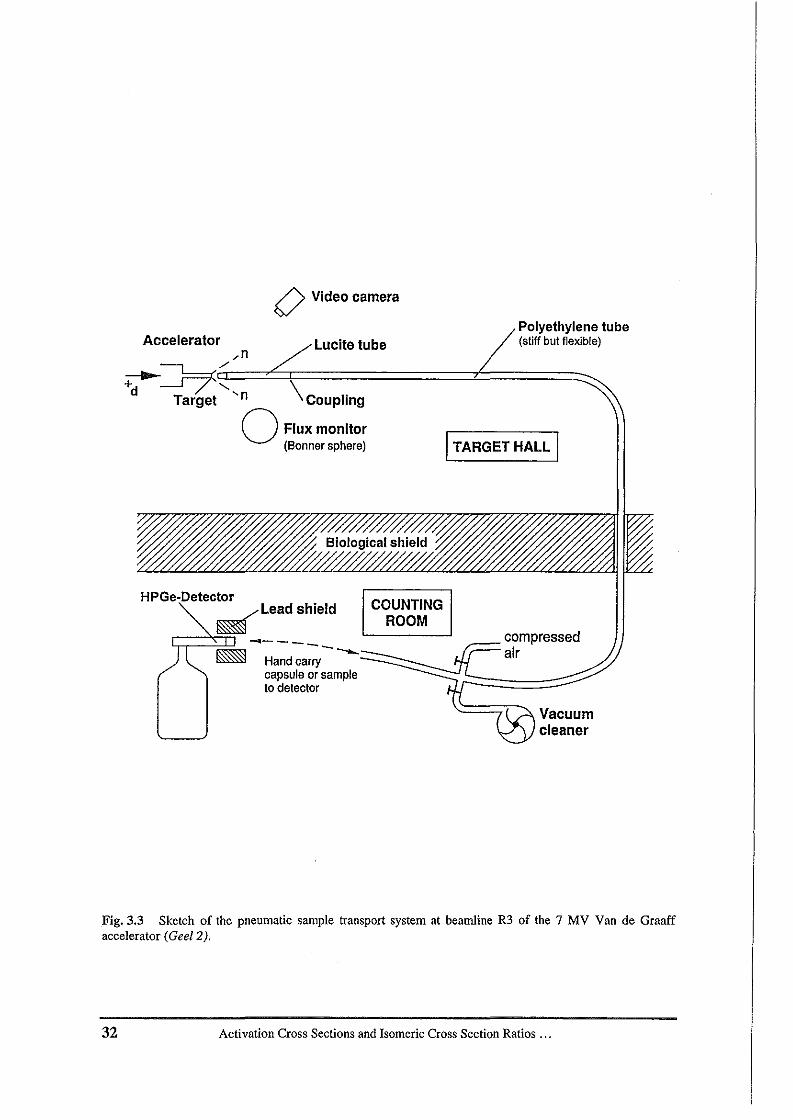
A pneumatic sample transport system ("rabbit system") was especially designed foractivation measurements of activities with short half-lives. A sketch of the target assemblyis shown in Fig. 3.3. The same Ti/T target is used as for the GeelI setup (same neutronfield). The samples are placed in a small container ("rabbit"), shown in Fig. 3.4, which ispushed with compressed air through a plastic tube (20 m long, 4 em in diameter) to thetarget and sucked back with a commercial vacuum cleaner. The front part of the tube ismade of transparent lucite to allow a check of the positioning of the rabbit during theirradiations from the counting room (hot lab) with a video camera. The pushed rabbit isstopped at I em distance to the target through two steel wires (see Fig. 3.5). Since thesamples are irradiated very close to the target, a careful check of the beam position ismandatory. This was done by irradiating four aluminium foils which were glued on thefront side of the lucite tube, one on the top, one on the bottom, one on the left side and oneon the right side. The measured activity of all the four foils agreed within 3 %, the order ofthe uncertainty of the count rates, implying that the beam was well centered. A HPGedetector is placed outside the target hall in the counting room behind a thick concrete wall.The time for retrieving, unpacking and placing the sample on the detector was on theaverage 12 to IS seconds. A Bonner sphere was placed at 2.5 m distance and at 45° to thedirection of the deuteron beam. It was operated in MCS mode and served as a relativefluence monitor for each irradiation (same as Long Counter in GeelI).
3. Experimental Methods 31
() Video camera
Polyethylene tube(stiff but flexible)
ITARGET HALL I
Lucite tubeAccelerator... n
~:J=77l:==~\========::t::====:::::---...Target -n Couplingo Flux monitor
(Bonnersphere)
Vacuumcleaner
compressedair
COUNTINGROOM
......---Handca;- -.....-..:.:::::::::::::::::::::~~~::::~~==::::::::::~capsule or sampleto detector
HPGe-Detector~Lead shield
r;::;=:@
Fig. 3.3 Sketch of the pneumatic sample transport system at beamline R3 of the 7 MV Van de Graaffaccelerator (GeeI2).
32 Activation Cross Sections and Isomeric Cross Section Ratios ...
6.2em
Styrofoam
d" - ~
Ti-T target film12.042mg/em'
JJ!
Target tube (Al) Lucite Samples Rabbitd(in)= 4 em, disk Nylon, PVCd(out) =4.2 em d =1.5em weight =20 g
=oI;-====l:;J.5 mm lh\[ic:=k-:ttt:::t t :=:::::::::::::::::::=:: -,,-,,-,,-,,-,
Backing (Ag) Front capO.4mmthickglued on target tube(AI)
Thread Metalwirestop
Lucite tubed(in)= 3.5 emd(out) = 4.0 em
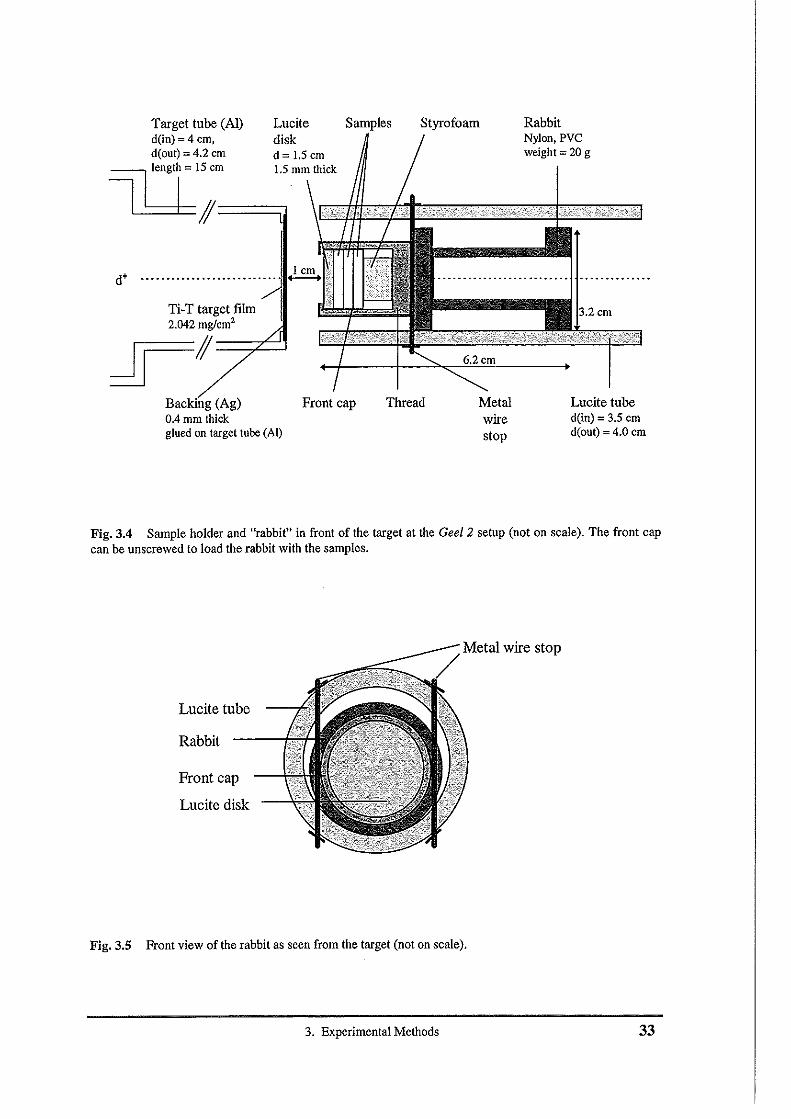
Fig.3.4 Sample holder and "rabbit" in front of the target at the Gee! 2 setup (not on scale). The front capcan be unscrewed to load the rabbit with the samples.
Lucite tube
Rabbit
Front cap
Lucite disk
Metal wire stop
/
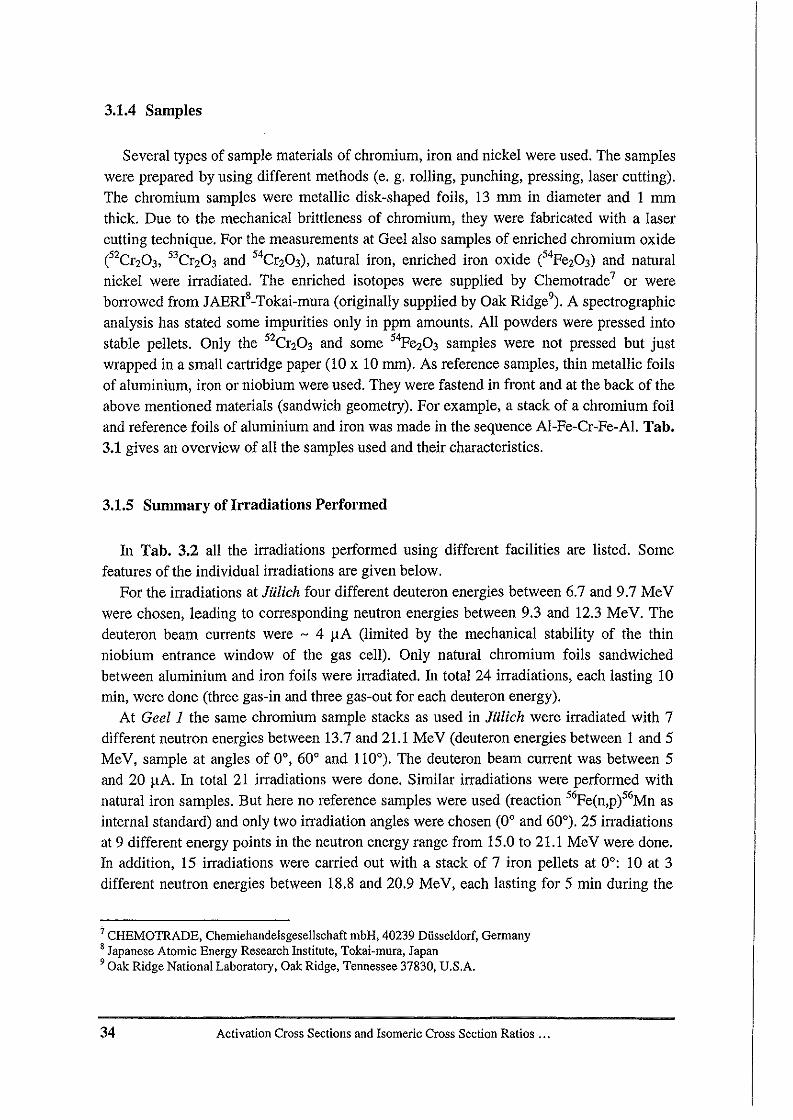
Fig. 3.5 Front view of the rabbit as seen from the target (not on scale).
3. Experimental Methods 33
3.1.4 Samples
Several types of sample materials of chromium, iron and nickel were used. The sampleswere prepared by using different methods (e. g. rolling, punching, pressing, laser cutting).The chromium samples were metallic disk-shaped foils, 13 mm in diameter and 1 mmthick. Due to the mechanical brittleness of chromium, they were fabricated with a lasercutting technique. For the measurements at Geel also samples of enriched chromium oxideeZCrZ03, 53CrZ03 and 54Crz03), natural iron, enriched iron oxide e4FeZ03) and naturalnickel were irradiated. The enriched isotopes were supplied by Chemotrade7 or wereborrowed from JAERI8-Tokai-mura (originally supplied by Oak Ridge\ A spectrographicanalysis has stated some impurities only in ppm amounts. All powders were pressed intostable pellets. Only the 5ZCrz03 and some 54Fez03 samples were not pressed but justwrapped in a small cartridge paper (10 x 10 mm). As reference samples, thin metallic foilsof aluminium, iron or niobium were used. They were fastend in front and at the back of theabove mentioned materials (sandwich geometry). For example, a stack of a chromium foiland reference foils of aluminium and iron was made in the sequence AI-Fe-Cr-Fe-Al. Tab.3.1 gives an overview of all the samples used and their characteristics.
3.1.5 Summary of Irradiations Performed
In Tab. 3.2 all the irradiations performed using different facilities are listed. Somefeatures of the individual irradiations are given below.
For the irradiations at Julien four different deuteron energies between 6.7 and 9.7 MeVwere chosen, leading to corresponding neutron energies between 9.3 and 12.3 MeV. Thedeuteron beam currents were - 4 l-lA (limited by the mechanical stability of the thinniobium entrance window of the gas cell). Only natural chromium foils sandwichedbetween aluminium and iron foils were irradiated. In total 24 irradiations, each lasting 10min, were done (three gas-in and three gas-out for each deuteron energy).
At Geel 1 the same chromium sample stacks as used in Julien were irradiated with 7different neutron energies between 13.7 and 21.1 MeV (deuteron energies between I and 5MeV, sample at angles of 0°,60° and 110°). The deuteron beam current was between 5and 20 l-lA. In total 21 irradiations were done. Similar irradiations were performed withnatural iron samples. But here no reference samples were used (reaction 56Fe(n,p)56Mn as
internal standard) and only two irradiation angles were chosen (0° and 60°). 25 irradiationsat 9 different energy points in the neutron energy range from 15.0 to 21.1 MeV were done.In addition, 15 irradiations were carried out with a stack of 7 iron pellets at 0°: 10 at 3different neutron energies between 18.8 and 20.9 MeV, each lasting for 5 min during the
7 CHEMOTRADE, Chemiehandelsgesellschaft mbH, 40239 DUsseldorf, Germany8 Japanese Atomic Energy Research Institute, Tokai-mura, Japan, Oak Ridge National Laboratory, Oak Ridge, Tennessee 37830, U.S.A.
34 Activation Cross Sections and Isomeric Cross Section Ratios ...
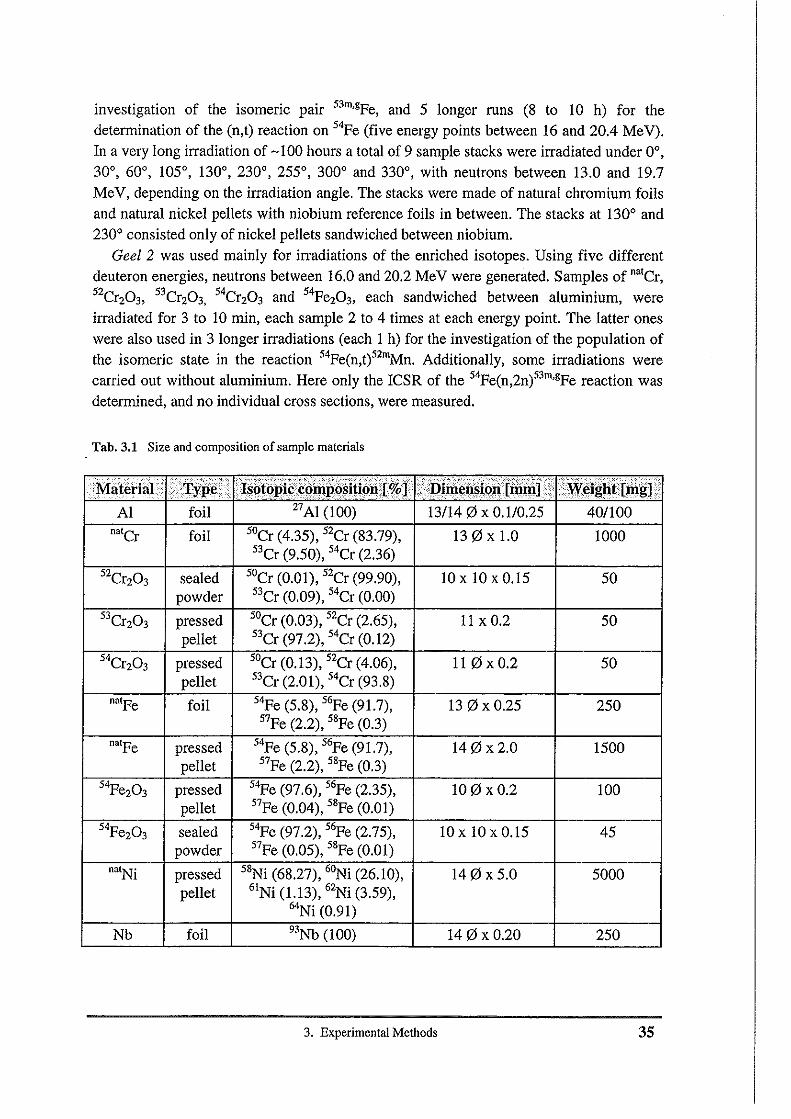
investigation of the isomeric pair 53m,gpe, and 5 longer runs (8 to 10 h) for thedetermination of the (n,t) reaction on 54Pe (five energy points between 16 and 20.4 MeV),In a very long irradiation of -100 hours a total of 9 sample stacks were irradiated under 0°,30°, 60°, 105°, 130°, 230°, 255°, 300° and 330°, with neutrons between 13.0 and 19,7MeV, depending on the irradiation angle, The stacks were made of natural chromium foilsand natural nickel pellets with niobium reference foils in between. The stacks at 130° and230° consisted only of nickel pellets sandwiched between niobium.
Geel 2 was used mainly for irradiations of the enriched isotopes. Using five differentdeuteron energies, neutrons between 16.0 and 20.2 MeV were generated. Samples of natCr,5ZCrZ03, 53CrZ03, 54CrZ03 and 54PeZ03, each sandwiched between aluminium, were
irradiated for 3 to 10 min, each sample 2 to 4 times at each energy point. The latter oneswere also used in 3 longer irradiations (each I h) for the investigation of the population ofthe isomeric state in the reaction 54pe(n,t)5zmMn. Additionally, some irradiations werecarried out without aluminium. Here only the ICSR of the 54pe(n,2n)53m,gPe reaction was
determined, and no individual cross sections, were measured.
Tab. 3.1 Size and composition of sample materials
il\1~f~ri~1 > iT...."..•. ,
i!;iQih\~lJ'$~~fi't~jii >;i~~f~ijti(iWgjiI$qtQpiii>~Qiil'positiQ~T%l,','.____.":'_:""_"_"'"_':":':',__.;-:-:-;':'::'::-,',C:-,-.:';.:' _,',..c.:.":" __
Al foil Z7Al (100) 13/140 X 0.1/0.25 40/100
n"Cr foil 50Cr (4.35), 5ZCr (83.79), 13 0x 1.0 100053Cr (9.50), 54Cr (2.36)
5ZCrz03 sealed 50Cr (0.01), 5ZCr (99.90), 10 x 10 x 0.15 50powder 53Cr (0.09), 54Cr (0.00)
53CrZ03 pressed 50Cr (0.03), 5ZCr (2.65), II x 0.2 50pellet 53Cr (97.2), 54Cr (0.12)
54CrZ03 pressed 50Cr (0.13), 5ZCr (4.06), II 0xO.2 50pellet 53Cr (2.01), 54Cr (93.8)
nntpe foil 54Pe (5.8), 56Pe (91.7), 13 0xO.25 25057Pe (2.2), 58Pe (0.3)
natFe pressed 54Pe (5.8), 56Pe (91.7), 140x2.0 1500pellet 57Pe (2.2), 58Pe (0.3)
54PeZ03 pressed 54Pe (97.6), 56Pe (2.35), 10 0 xO.2 100pellet 57Pe (0.04), 58Pe (0.01)
54Pez03 sealed 54Pe (97.2), 56Pe (2.75), 10 x 10 x 0.15 45powder 57Pe (0.05), 58Pe (0.01)
natNi pressed 58Ni (68.27), 6~i (26.10), 140x5.0 5000pellet 61Ni (1.13), 6zNi (3.59),
64Ni (0.91)
Nb foil 93Nb (100) 140 x 0.20 250
3. Experimental Methods 35
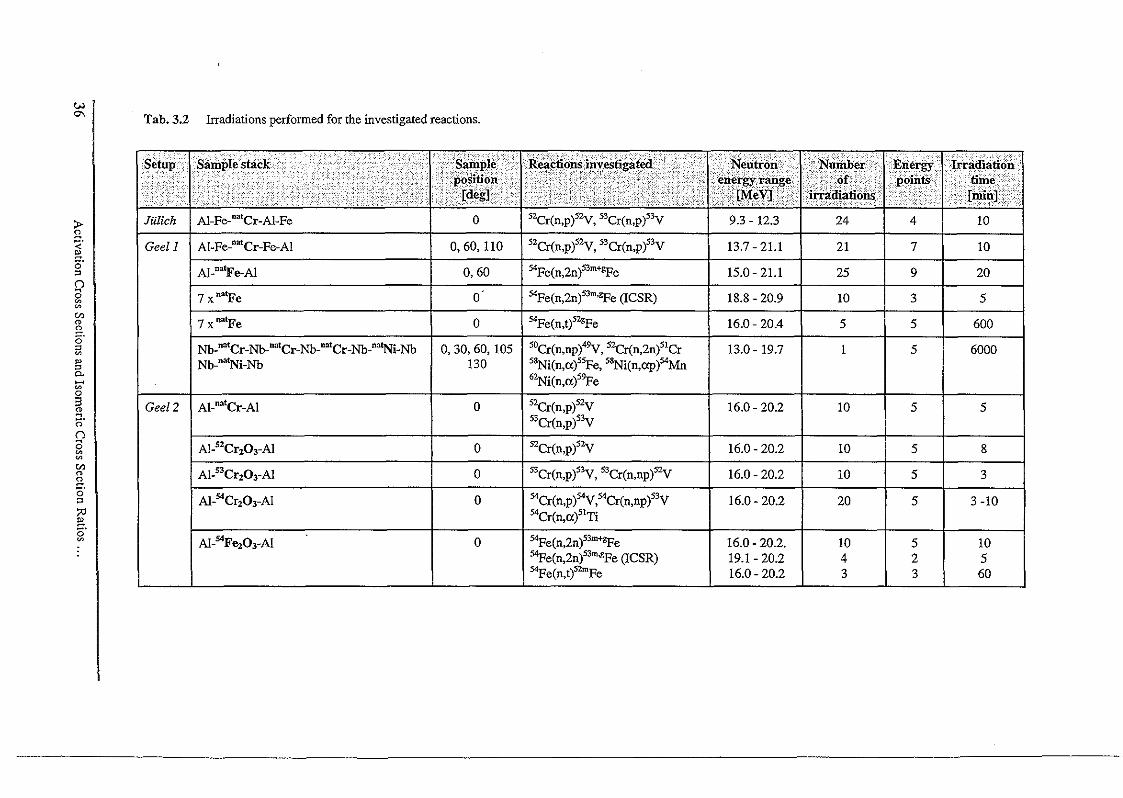
wc-,
:.~
~.
o'"o~~
en"~o'"~~
"0-~o3go'o<3~
~
en"~o'"~~o'~
Tab. 3.2 Irradiations performed for the investigated reactions.
' i; : ~~ : ,i .:i; i· i ' : ··i;;';::;'?:::" ,.j:!;';:. 1.1: '.~;;.';;' :". ··,·····S':}ili i.' Ii;:':~' "',I:.; txt,. it:. Ii 1·)< i'it:;· iii :)/}'} ;;I0~i§< ~;tJ ~~ti.iI22i:;, ,iii leg!",}", :i; ?!"'~; I'.G.': i:
Jtdich: A1,Fe''''Cr-Al-Fe 0 "Cr(n,p)'Zy, "Cr(n,p)"y 9.3 - 12.3 24 4 10
Geell A1-Fe-'''Cr-Fe-A1 0,60, 110 5ZCr(n,p)'2y, "Cr(n,p)"y 13.7 - 21.1 21 7 10
AI-"'Fe-A1 0,60 54Fe(n,2n)"m+'!'e 15.0 - 21.1 25 9 20
7 x "'Fe 0 54Fe(n,2n)"m·gFe (ICSR) 18.8 - 20.9 10 3 5
7 x "'Fe 0 54Fe(n,t)"'!'e 16.0 - 20.4 5 5 600
Nb-'''Cr-Nb-'''Cr-Nb-'''Cr-Nb-'''Ni-Nb 0,30,60,105 50Cr(n,np)"V,52Cr(n,2n)'lCr 13.0 - 19.7 I 5 6000Nb-'''Ni-Nb 130 "Ni(n,o:)'5Fe, "Ni(n,o:p)54Mn
62Ni(n,o:)59Fe
Geel2 AI-""'Cr-Al 0 52Cr(n,p)'2y 16.0 - 20.2 10 5 553Cr(n,p)"y
A1-"CrzO,-A1 0 5ZCr(n,p)"V 16.0 - 20.2 10 5 8
Al-"CrzO,-Al 0 "Cr(n,p)"V, "Cr(n,np)"y 16.0 - 20.2 10 5 3
AI-54CrzO,-Al 0 54Cr(n,p)54V,54Cr(n,np)"V 16.0 - 20.2 20 5 3 -10
54Cr(n,o:)51Ti
AI-54FezO,-AI 0 54pe(n,2n)"m+gFe 16.0 - 20.2. 10 5 10
54Fe(n,2n)"m'&Fe (ICSR) 19.1 - 20.2 4 2 554pe(n,t)'2mFe 16.0 - 20.2 3 3 60
3.2 Neutron Fields
3.2.1 DD-Neutron Source Reaction (JiiUch)
• Neutron Energy SpectraThe average neutron energy effective at each sample was calculated with the Monte Carlocode NEUT_HAV [Bir 94]. The program is an improved version of the code NEUT [Bir92]. It takes into account
+ the energy loss and the straggling of the deuterons in the entrance window of the gastarget,
+ the energy loss in the Dz gas according to the Dzpressure,+ the angular distribution of the zH(d,niHe reaction [Lis 73],+ the production of the neutrons in the space of the gas cell,+ the dimensions of the sample and the distance between the sample and the beam
stop,+ the break-up of the deuterons in the Dz gas according to the results from Cabral et aI.
[Cab 90].
The program calculates the average neutron energy impinging on the sample and itsuncertainty as well as the neutron spectrum in the sample in energy bins of 50 keV(monoenergetic part) and 200 keV (breakup part) width (normalized to unit area). Theneutron spectra for the chosen four different incident deuteron energies are shown in Fig.3.6. For comparison the spectra are all normalized to the same height of the monoenergeticpeak. The breakup part in the spectrum increases with increasing deuteron energy. Fig. 3.7shows a similar spectrum for an identical gas target measured by a TOF method at PTB10
[Cab 90].
• Background SubtractionThe contribution of background neutrons stemming from interactions of the deuteronswith structural materials to the total reaction rate can be calculated from the gas-in / gasout ratios (i. e. the ratios of the induced activities measured in the irradiations with filledand empty gas cell). The correction factor cgas is
10 Physikalisch _Technische Bundesanstalt, Braunschweig, Germany
3. Experimental Methods
(3.1)
37
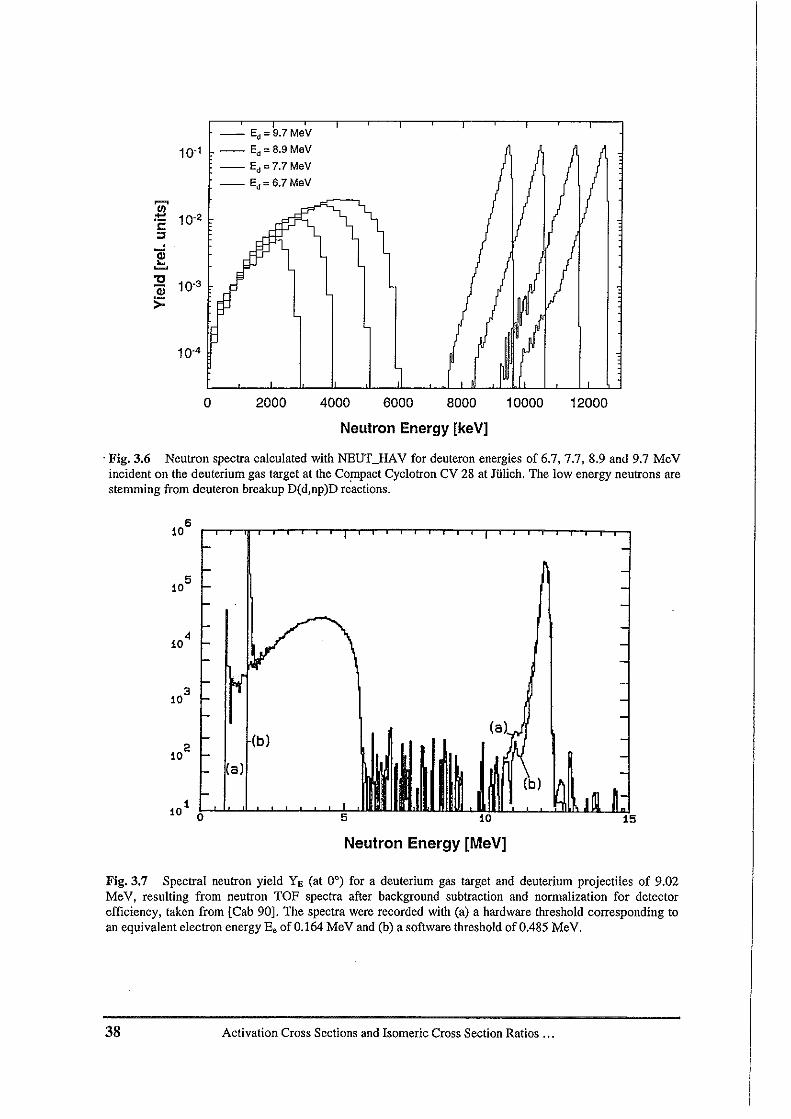
10.4
-- Ed = 9.7 MeV
10-1 -- Ed = 8.9 MeV
-- Ed= 7.7 MeV
-- Ed = 6.7 MeV
~
•
__UJ
10-2r::;j
~ 10.3
>=
o 2000 4000 6000 8000 10000 12000
Neutron Energy [keV]
. Fig. 3.6 Neutron spectra calculated with NEUT_HAV for deuteron energies of 6.7. 7.7,8.9 and 9.7 MeVincident on the deuterium gas target at the Compact Cyclotron CV 28 at Jiilich. The low energy neutrons arestemming from deuteron breakup D(d,np)D reactions.
106
105
104
103
102
(b)
(a)
101
0 5 10
(b)
Neutron Energy [MeV]
Fig.3.7 Spectral neutron yield YE (at 0°) for a deuterium gas target and deuterium projectiles of 9.02MeV, resulting from neutron TOF spectra after backgronnd subtraction and normalization for detectorefficiency, taken from [Cab 90]. The spectra were recorded with (a) a hardware threshold corresponding toan equivalent electron energy Beof 0.164 MeV and (b) a software threshold of 0,485 MeV.
38 Activation Cross Sections and Isomeric Cross Section Ratios ...
where A is the measured activity, t the irradiation time, q the integrated beam current andm the sample mass. The indices refer to the gas -in or gas-out irradiations, respectively.
The corrections for the breakup neutrons were determined from the calculated neutronspectra. The spectra are split in a breakup part and a monoenergetic part and the fractionalcontribution of the breakup neutrons to the total reaction rate, Clow, was calculated.
Clow = I =1Emax
Lai(E)· !i(E). dEi=O
(3.2)
The cross sections criCE) are taken from evaluations or model calculations. fiCE) denotesthe relative yield of neutrons with the energy E. The applied correction for these breakupneutrons was in the order of a few percent, depending on the reaction threshold and theexcitation function of the investigated reaction.
3.2.2 DT-Neutron Source Reaction tGeel l and Geel2)
• Neutron Energy SpectraThe neutron energy spectra were determined in two independent ways. In the firstapproach the average neutron energy within the sample was determined in a similar way asdone for the DD gas target. Therefore the program NEUT_HAV was slightly modified[Fes 97a]. The geometry of the Ti/T target was implemented as well as the angulardistribution of the T(d,n)4He reaction [Lis 73] was considered.
In the second approach the spectra were determined experimentally by TOFmeasurements in order to estimate the contribution of background neutrons. The principleinvolves the measurement of the time the neutron takes to traverse a flight path of lengthL. The velocity and therefore the kinetic energy of the neutron is deduced from the flighttime T. If the neutrons, as a first approximation, are considered as non-relativistic, therelation between the neutron energy, the neutron mass, the flight time and the flight path issimply the expression for the kinematic energy
(3.3)
By using the dimensions meter, nanoseconds and MeV for the flight path length, time offlight and neutron energy, respectively, the expression becomes in numerical form
3. Experimental Methods 39
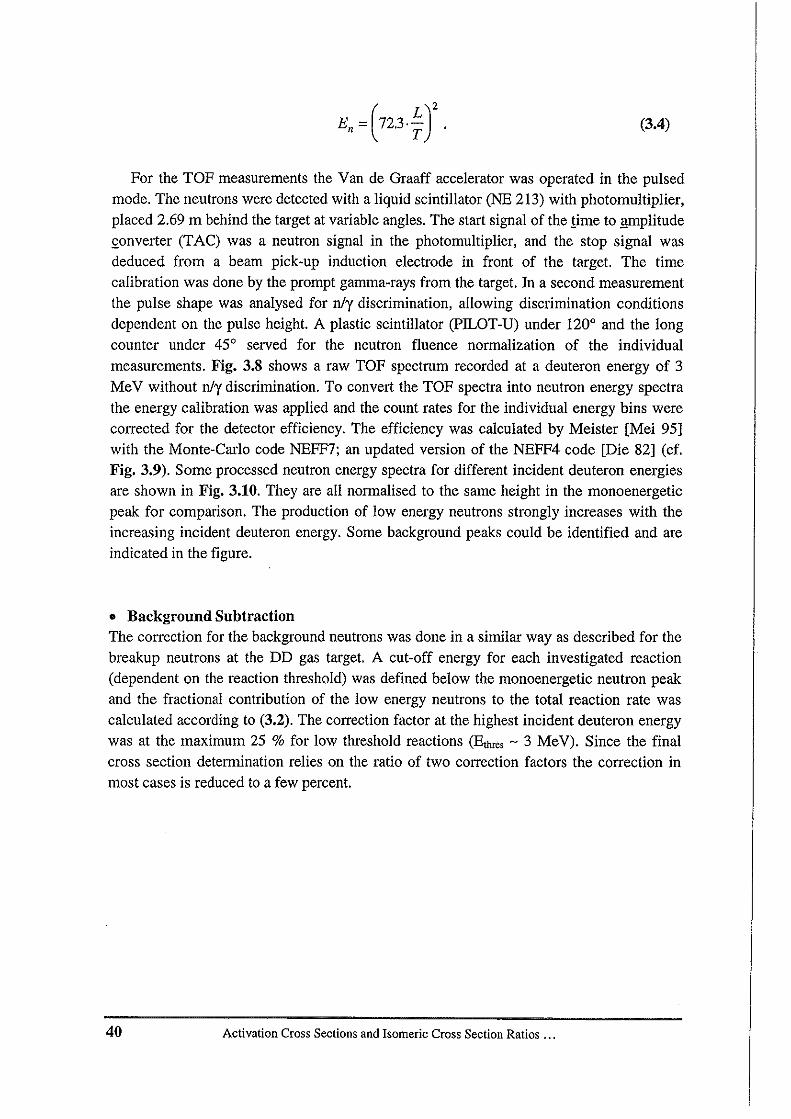
(3.4)
For the TOF measurements the Van de Graaff accelerator was operated in the pulsedmode. The neutrons were detected with a liquid scintillator (NE 213) with photomultiplier,placed 2.69 m behind the target at variable angles. The start signal of the lime to gmplltudeQonverter (TAC) was a neutron signal in the photomultiplier, and the stop signal wasdeduced from a beam pick-up induction electrode in front of the target. The timecalibration was done by the prompt gamma-rays from the target. In a second measurementthe pulse shape was analysed for n/y discrimination, allowing discrimination conditionsdependent on the pulse height. A plastic scintillator (PU-OT-U) under 1200 and the longcounter under 450 served for the neutron fluence normalization of the individualmeasurements. Fig. 3.8 shows a raw TOF spectrum recorded at a deuteron energy of 3MeV without n/y discrimination. To convert the TOF spectra into neutron energy spectrathe energy calibration was applied and the count rates for the individual energy bins werecorrected for the detector efficiency. The efficiency was calculated by Meister [Mei 95]with the Monte-Carlo code NEFF?; an updated version of the NEFF4 code [Die 82] (cf.Fig. 3.9). Some processed neutron energy spectra for different incident deuteron energiesare shown in Fig. 3.10. They are all normalised to the same height in the monoenergeticpeak for comparison. The production of low energy neutrons strongly increases with theincreasing incident deuteron energy. Some background peaks could be identified and areindicated in the figure.
• Background SubtractionThe correction for the background neutrons was done in a similar way as described for thebreakup neutrons at the DD gas target. A cut-off energy for each investigated reaction(dependent on the reaction threshold) was defined below the monoenergetic neutron peakand the fractional contribution of the low energy neutrons to the total reaction rate wascalculated according to (3.2). The correction factor at the highest incident deuteron energywas at the maximum 25 % for low threshold reactions (Etme, - 3 MeV). Since the finalcross section determination relies on the ratio of two correction factors the correction inmost cases is reduced to a few percent.
40 Activation Cross Sections and Isomeric Cross Section Ratios ...
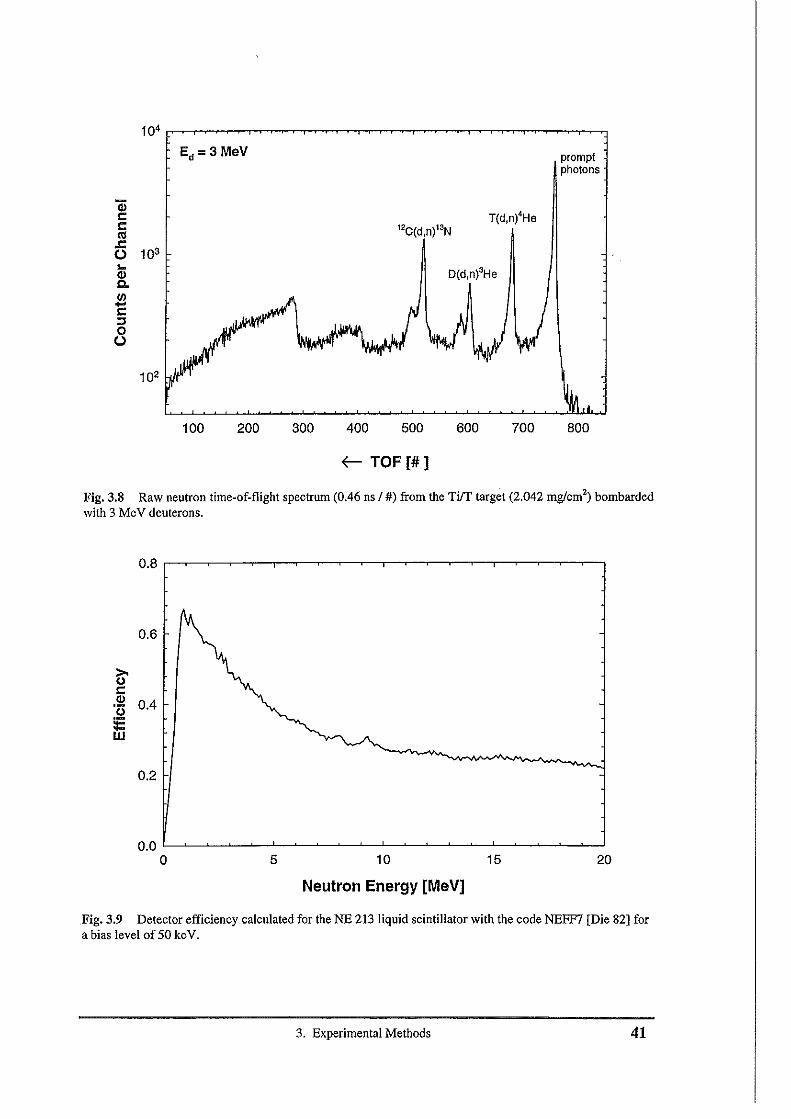
Ed=3 MeV promptphotons
Qil:l:('<l.r:o 103
...C!)a.
E:::s8
12C(d.n)13N
D(d,n)'He
100 200 300 400 500 600 700 800
~ TOF[#]
Fig. 3.8 Raw neutron time-of-flight spectrum (0.46 ns I #) from the Ti/T target (2.042 mg/crrr') bombardedwith 3 MeV deuterons.
201510
Neutron Energy [MeV]
50.0 L-~~~~--'-~_~~~---'---~~~_~-L.-~~~~--'
o
0.6
~l:C!) 0.4'0:ew
0.2
Fig.3.9 Detector efficiency calculated for the NE 213 liquid scintillator with the code NEFF? [Die 82] fora bias level of 50 keV.
3. Experimental Methods 41
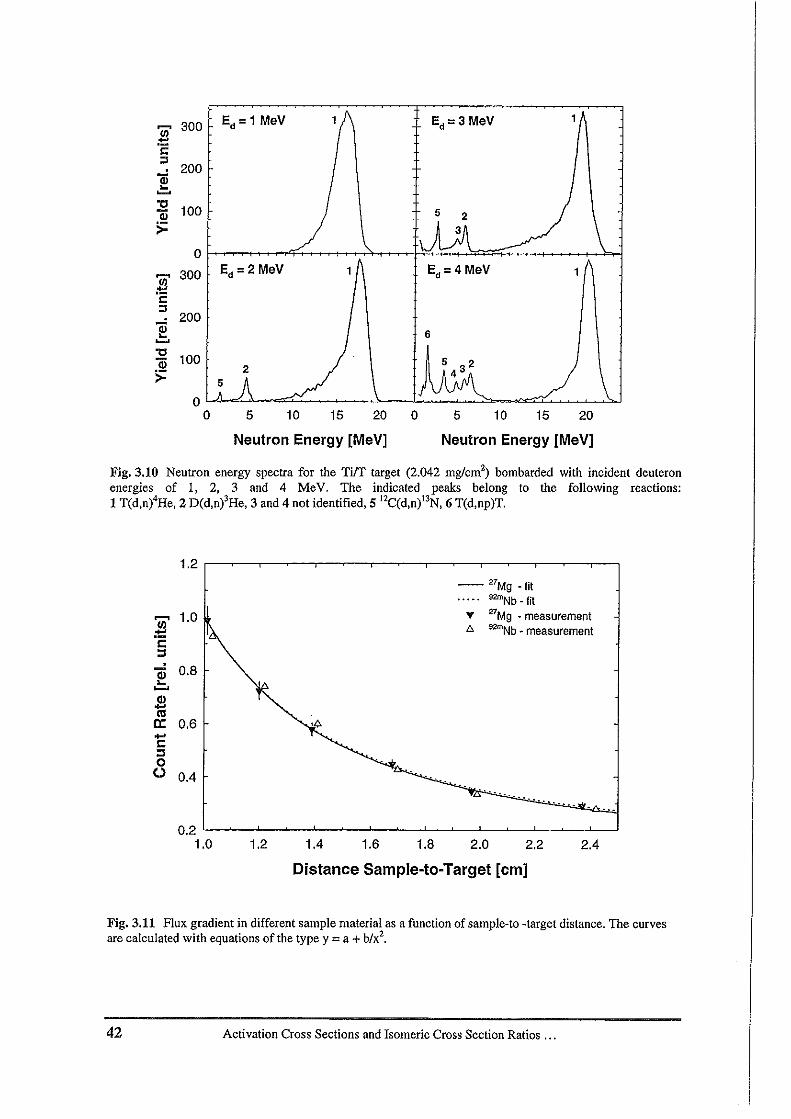
1
5 10 15 20
Neutron Energy [MeV]
Ed =3 MeV
Ed=4MeV
6
o5 10 15 20
Neutron Energy [MeV]
~ 300 Ed= 1 MeV
~t::::l
200l!!~
'tl100iii
>=0
~ 300 Ed=2 MeV 1
'".'!::t::::l
200l!!~
'tl100iii
>=2
Fig. 3.10 Neutron energy spectra for the Ti/T target (2.042 mg/cm'') bombarded with incident deuteronenergies of i, 2, 3 and 4 MeV. The indicated peaks belong to the following reactions:1 T(d,n)4He, 2 D(d,n)'He, 3 and 4 not identified,S 12C(d,n)13N, 6 T(d,np)T.
-- 27Mg • fit9""Nb • fit
" 27Mg ~ measurementD. 92mNb ~ measurement
~a: 0.6....t::::loo 0.4
.... ....
2.41.20.2 '-~-'-_~-'-~_-'-~_L--~-'-_~-'-~_-'---.J
1.0
Fig.3.11 Flux gradient in different sample material as a function of sample-to -target distance. The curvesare calculated with equations of the type y = a + b1x2•
42 Activation Cross Sections and Isomeric Cross Section Ratios ...
3.2.3 Determination of Mean Flux Density withiu a Thick Sample
For thick samples the arithmetic mean of the measured activity in the monitor foils infront and at the back of the sample does not give the mean neutron flux. To determine theeffective flux on the sample the flux gradient in the sandwich was measured with a simplemethod. In long stacks with many monitor foils at different distances (separated by 1.5 mmthick polyvinyl fhloride (PVC) disks) the activity of each foil was determined. Taking intoaccount the different neutron energies at the respective distances, the gradient is then givenby the relation
Al '0'1c -grad - A 'O'X
x(3.5)
where AI is the activity at the foil closest to the target and 0'1 the cross section for the usedreaction. Axand ax are the activity and the cross section at the distance x. Fig. 3.11 showsthe flux gradient as a function of the sample-to-target distance for two different samplematerials. The lines are least-squares fits of the determined ratios. A similar figure wasobtained by Qaim et aJ. [Qai 92b]. They calculated the flux gradient inside a thick sampleboth by Monte Carlo and numerical integration methods.
3.2.4 Neutron Flux Fluctuations
Usually, the neutron flux varies during an irradiation due to the fluctuation of thedeuteron beam intensity. The depletion of tritium is only of relevance for targets used athigh flux neutron generators. When the flux variation is drastic, the assumption of aconstant neutron flux is no longer valid. In this work the neutron production rate wasalways monitored by recording either the integrated deuteron beam charge (JaUch) or theneutron counts in a long counter (Gee! 1) or Bonner sphere (Gee! 2) using the MCSmethod throughout each irradiation. The gwell lime (DT) was set according to theirradiation time, usually between 5 sec and lO min. The correction factor Cflux for fluxfluctuations is then calculated from the ratio
<p.(I_e-A.·ti )
c flux =-,-,------'-----'-------~;n (I -A..At) -A.·(n-i)·At£.J\.J!i" -e ·ei=1
(3.6)
where <P is the mean flux of the irradiation, <Pi the relative flux at the time bin l, n thetotal number of time bins (i=I, n), tt the irradiation time and ilt the dwell time of the MCS.
3. Experimental Methods 43
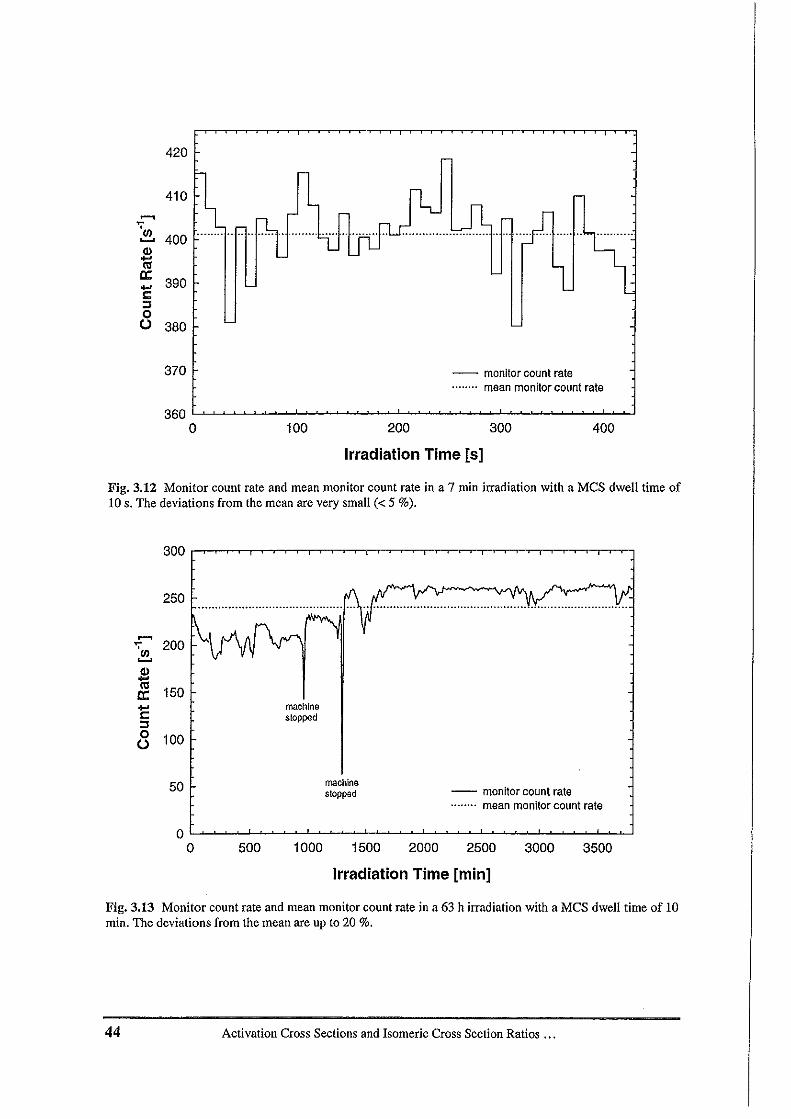
-- monitor count rate........ mean monitor count rate
420
410
~
';"til~
ell'tila:
390....s::::::l0c 380
370
3600 100 200 300
Irradiation Time [5]
400
Fig.3.12 Monitor count rate and mean monitor count rate in a 7 min irradiation with a MCS dwell time of10 s. The deviations from the mean are very small « 5 %).
-- monitor count rate........ mean monitor count rate
300
250
~
200';"til~
ell....ca150a:....
s::::::l0 100o
50
00 500
machinestopped
1000
machineSlopped
1500 2000 2500 3000 3500
Irradiation Time [min]
Fig. 3.13 Monitor count rate and mean monitor count rate in a 63 h irradiation with a MCS dwell time of 10min. The deviations from the mean are up to 20 %.
44 Activation Cross Sections and Isomeric Cross Section Ratios ...
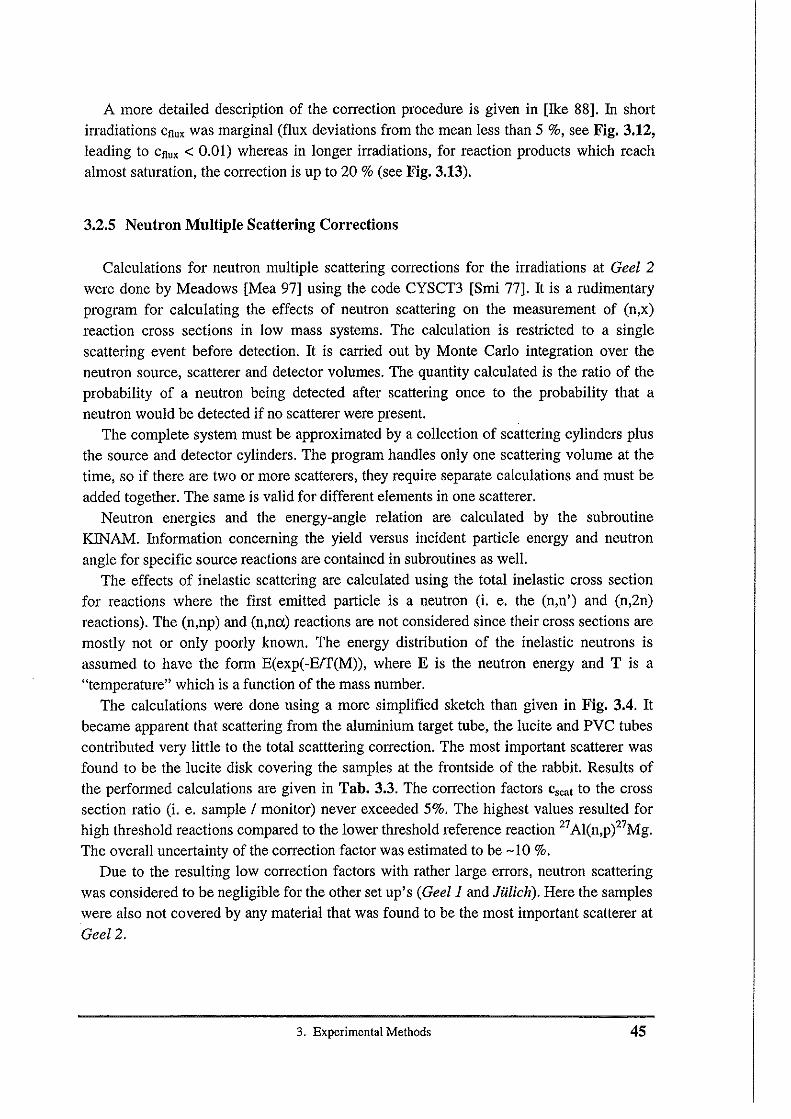
A more detailed description of the correction procedure is given in [Ike 88]. In short
irradiations Cflux was marginal (flux deviations from the mean less than 5 %, see Fig. 3.12,leading to Cflux < 0.01) whereas in longer irradiations, for reaction products which reach
almost saturation, the correction is up to 20 % (see Fig. 3.13).
3.2.5 Neutron Multiple Scattering Corrections
Calculations for neutron multiple scattering corrections for the irradiations at Geel 2were done by Meadows [Mea 97] using the code CYSCT3 [Smi 77]. It is a rudimentaryprogram for calculating the effects of neutron scattering on the measurement of (n,x)
reaction cross sections in low mass systems. The calculation is restricted to a singlescattering event before detection. It is carried out by Monte Carlo integration over the
neutron source, scatterer and detector volumes. The quantity calculated is the ratio of theprobability of a neutron being detected after scattering once to the probability that a
neutron would be detected if no scatterer were present.The complete system must be approximated by a collection of scattering cylinders plus
the source and detector cylinders. The program handles only one scattering volume at the
time, so if there are two or more scatterers, they require separate calculations and must beadded together. The same is valid for different elements in one scatterer.
Neutron energies and the energy-angle relation are calculated by the subroutineKINAM. Information concerning the yield versus incident particle energy and neutron
angle for specific source reactions are contained in subroutines as well.The effects of inelastic scattering are calculated using the total inelastic cross section
for reactions where the first emitted particle is a neutron (1. e. the (n.n') and (n,2n)reactions). The (n.np) and (n.nn) reactions are not considered since their cross sections are
mostly not or only poorly known. The energy distribution of the inelastic neutrons is
assumed to have the form E(exp(-Err(M», where E is the neutron energy and T is a"temperature" which is a function of the mass number.
The calculations were done using a more simplified sketch than given in Fig. 3.4. Itbecame apparent that scattering from the aluminium target tube, the lucite and PVC tubes
contributed very little to the total scatttering correction. The most important scatterer wasfound to be the lucite disk covering the samples at the frontside of the rabbit. Results of
the performed calculations are given in Tab. 3.3. The correction factors Cscat to the crosssection ratio (1. e. sample / monitor) never exceeded 5%. The highest values resulted forhigh threshold reactions compared to the lower threshold reference reaction 27AI(n,pi 7Mg.The overall uncertainty of the correction factor was estimated to be -10 %.
Due to the resulting low correction factors with rather large errors, neutron scattering
was considered to be negligible for the other set up's (Geel l and JaUch). Here the sampleswere also not covered by any material that was found to be the most important scatterer at
Geel2.
3. Experimental Methods 45
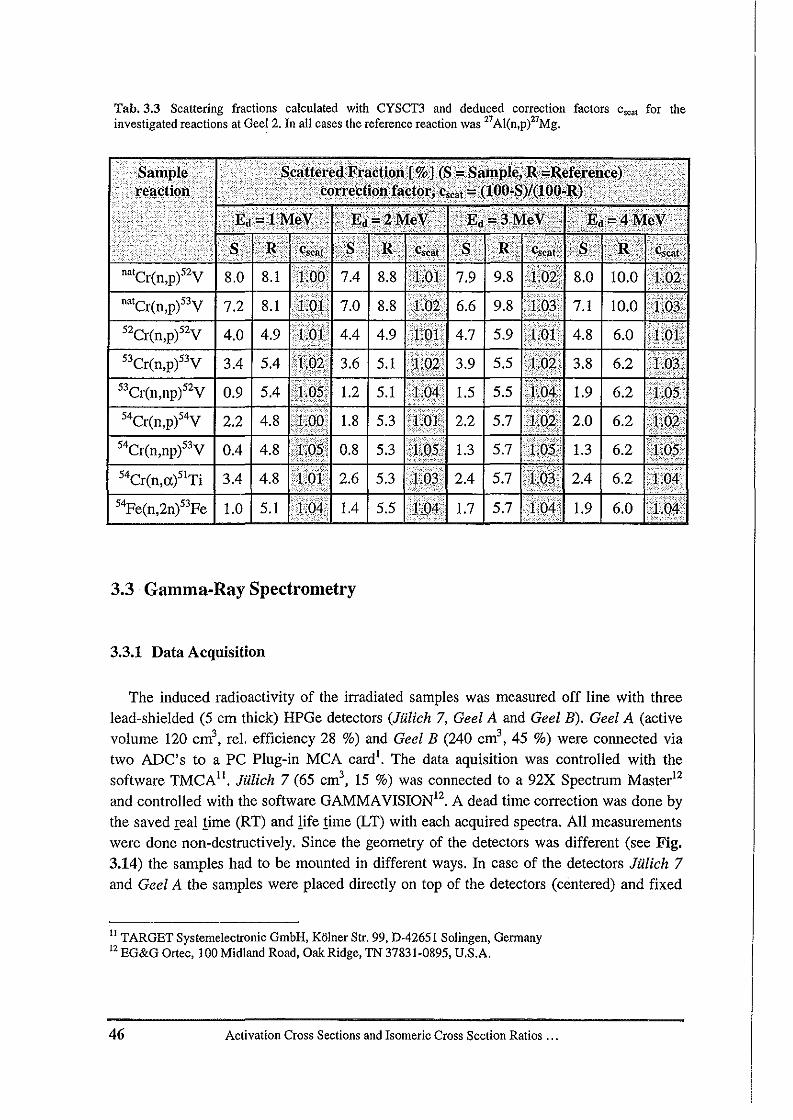
Tab. 3.3 Scattering fractions calculated with CYSCT3 and deduced correction factors C=l for theinvestigated reactions at Geel2. In all cases the reference reaction was 27Al(n,p)27Mg.
I, 5,6.2
6.2
10.0
6.0
6.2
1.9
2.0
7.1
4.8
3.8
,.~
~L03\~~~,1 II A
!If
9.8
9.8
5.9
5.5
)1 4.7
7.9
6.6
of'1 2.2
,~3.91.5
54Cr(n,p/4V 2.2 4.8 1.8 5.3
" "'-,," 'j,
'j" '~scilr L', ,-nalCr(n,p)52V 8,0 8,1 l~( 7.4 8.8
natCr(n,p/3V 7.2 8.1 l} 7.0 8.8
52Cr(n,p)52V 4.0 4.9 • 4.4 4.9
53Cr(n,p/3V 3.4 5.4 ~ 3.6 5.1
53Cr(n,np)52V 0.9 5.4 1.2 5.1
54Cr(n,np/3V 0.4 4.8 b~'j. 0.8 5.3 1.3 5.7
54Cr(n,a)51Ti 3.4 4.8 ~.~ 2.6 5.3 2.4 5.7
1.3 6.2
2.4 6.2
L
1.9 6.0
3.3 Gamma-Ray Spectrometry
3.3.1 Data Acquisition
The induced radioactivity of the irradiated samples was measured off line with threelead-shielded (5 em thick) HPGe detectors Uuticn 7, Gee! A and Gee! B). Gee! A (activevolume 120 em', rel. efficiency 28 %) and Gee! B (240 em', 45 %) were connected viatwo ADC's to a PC Plug-in MCA card'. The data aquisition was controlled with thesoftware TMCAll
. Julien 7 (65 cnr', 15 %) was connected to a 92X Spectrum Master12
and controlled with the software GAMMAVISION 12. A dead time correction was done by
the saved real lime (RT) and life lime (LT) with each acquired spectra. All measurementswere done non-destructively. Since the geometry of the detectors was different (see Fig.3.14) the samples had to be mounted in different ways. In case of the detectors Julien 7and Gee! A the samples were placed directly on top of the detectors (centered) and fixed
11 TARGET Systemelectronic GmbH, Kolner Sir. 99, D-42651 Solingen, Germany12EG&G Ortec, 100 Midland Road, OakRidge, TN 37831-0895, U.S.A.
46 Activation Cross Sections and Isomeric Cross Section Ratios ...
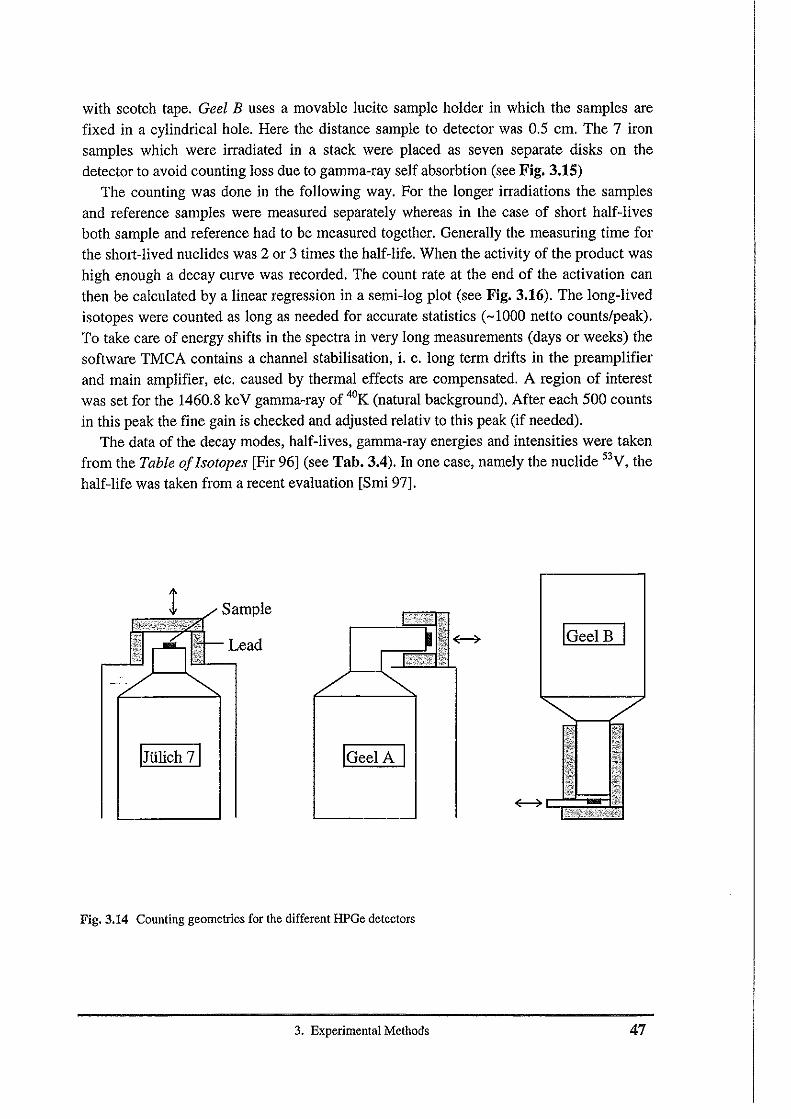
with scotch tape. Geel B uses a movable lucite sample holder in which the samples arefixed in a cylindrical hole. Here the distance sample to detector was 0.5 em. The 7 ironsamples which were irradiated in a stack were placed as seven separate disks on thedetector to avoid counting loss due to gamma-ray self absorbtion (see Fig. 3.15)
The counting was done in the following way. For the longer irradiations the samplesand reference samples were measured separately whereas in the case of short half-livesboth sample and reference had to be measured together. Generally the measuring time forthe short-lived nuclides was 2 or 3 times the half-life. When the activity of the product washigh enough a decay curve was recorded. The count rate at the end of the activation canthen be calculated by a linear regression in a semi-log plot (see Fig. 3.16). The long-livedisotopes were counted as long as needed for accurate statistics (-1000 netto counts/peak).To take care of energy shifts in the spectra in very long measurements (days or weeks) thesoftware TMCA contains a channel stabilisation. i, e. long term drifts in the preamplifierand main amplifier, etc. caused by thermal effects are compensated. A region of interestwas set for the 1460.8 keY gamma-ray of 4oK (natural background). After each 500 countsin this peak the fine gain is checked and adjusted relativ to this peak (if needed).
The data of the decay modes, half-lives, gamma-ray energies and intensities were takenfrom the Table ofIsotopes [Fir 96] (see Tab. 3.4). ill one case, namely the nuclide 53y, thehalf-life was taken from a recent evaluation [Smi 97].
t
!Jiilich 71
Sample
Lead
IGeelA 1
IGeelB I
Fig. 3.14 Counting geometries for the different HPGe detectors
3. Experimental Methods 47
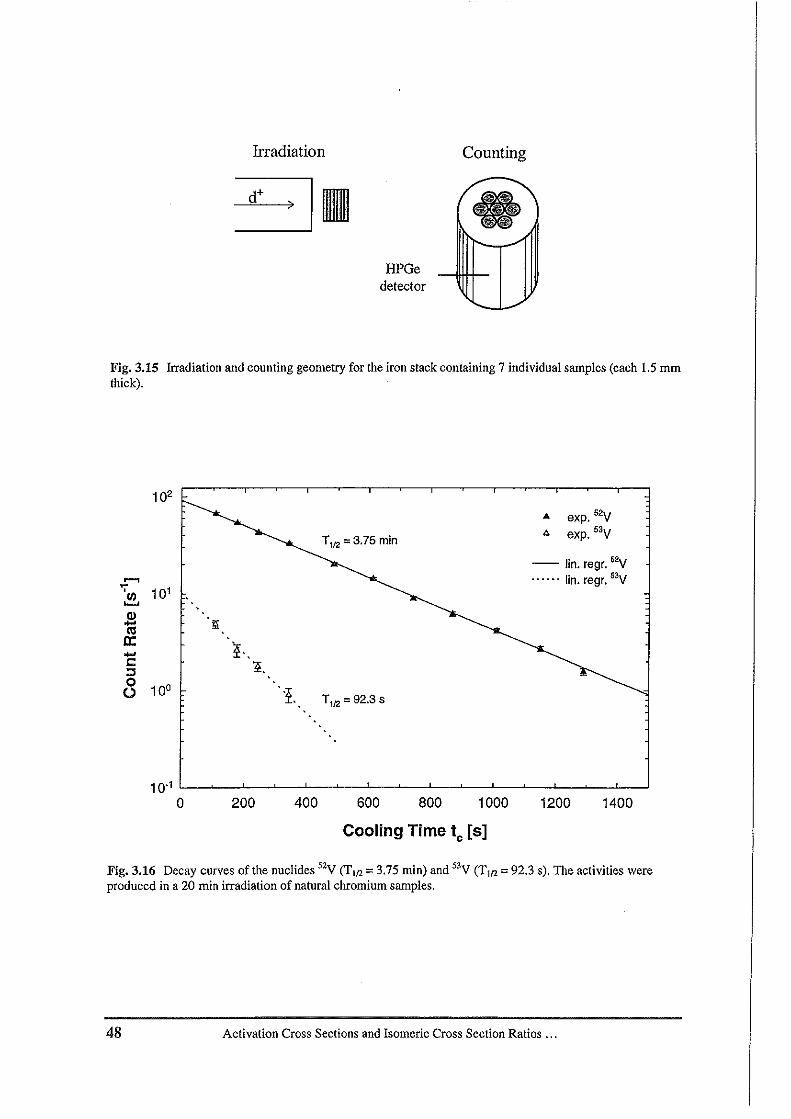
Irradiation Counting
•HPGe
detector
Fig.3.15 Irradiation and counting geometry for the iron stack containing 7 individual samples (each 1.5 mmthick).
102
.. exp. 52V
T'/2=3.75 minA exp. 53V
-- lin. regr. 52V...... ...... lin. regr. 53V~
~ 101
Ql
rtl ;;;a: l .....s:::
~.::l0
100o ·i. T'/2=92.3 s
14001200100080060040020010.1 '--~_-'-_~-'-_~--'_~_-'----~_-'-_~-'-_~--'_....J
oCooling Time to [8]
Fig. 3.16 Decay curves of the nuclides 52y (Till =3.75 min) and 53y (Till =92.3 s). The activities wereproduced in a 20 min irradiation of natural chromium samples.
48 Activation Cross Sections and Isomeric Cross Section Ratios ...
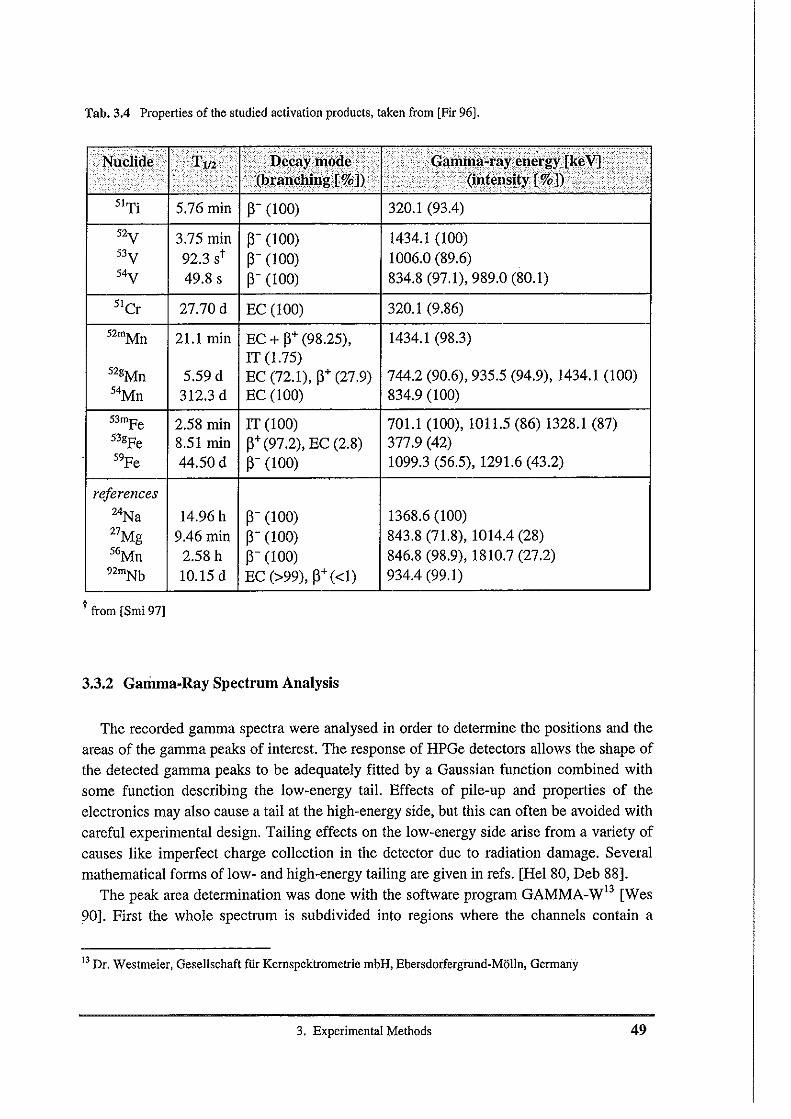
Tab. 3.4 Properties of the studied activation products, taken from [Fir 96].
y ,
5tTi 5.76 min ~- (l00) 320.1 (93.4)
52y 3.75 min ~- (l00) 1434.1 (l00)53y 92.3 st ~- (100) 1006.0 (89.6)54y 49.8 s W(100) 834.8 (97.1),989.0 (80.1)
51Cr 27.70 d EC (100) 320.1 (9.86)
52mMn 21.1 min EC + ~+ (98.25), 1434.1 (98.3)IT (1.75)
52gMn 5.59d EC (72.1), ~+ (27.9) 744.2 (90.6), 935.5 (94.9),1434.1 (l00)54Mn 312.3 d EC (l00) 834.9 (100)
53mFe 2.58 min IT (l00) 701.1 (l00), 1011.5 (86) 1328.1 (87)53gFe 8.51 min ~+ (97.2), EC (2.8) 377.9 (42)59Fe 44.50d ~- (l00) 1099.3 (56.5), 1291.6 (43.2)
references24Na27Mg56Mn92mNb
t from [Smi 971
14.96 h9.46 min
2.58h10.15 d
~- (100)~- (100)~- (l00)EC (>99), ~+ «1)
1368.6 (l00)843.8 (71.8), 1014.4 (28)846.8 (98.9),1810.7 (27.2)934.4 (99.1)
3.3.2 Gamma-Ray Spectrum Analysis
The recorded gamma spectra were analysed in order to determine the positions and theareas of the gamma peaks of interest. The response of HPGe detectors allows the shape ofthe detected gamma peaks to be adequately fitted by a Gaussian function combined withsome function describing the low-energy tail. Effects of pile-up and properties of theelectronics may also cause a tail at the high-energy side, but this can often be avoided withcareful experimental design. Tailing effects on the low-energy side arise from a variety ofcauses like imperfect charge collection in the detector due to radiation damage. Severalmathematical forms of low- and high-energy tailing are given in refs. [Hel 80, Deb 88].
The peak area determination was done with the software program GAMMA-W13 [Wes90]. First the whole spectrum is subdivided into regions where the channels contain a
13Dr. Westmeier, Gesellschaft ftlr Kernspektrometrie mbH, Ebersdorfergrund-Molln, Germany
3. Experimental Methods 49
smoothly varying background distribution with some peaks on top. Then the background
in each region is calculated with an algorithm [Wes 81, Wes 86] where the number ofbackground counts in each channel is analytically determined from the experimental
number of peak counts in all higher channels. The resulting background function is a
smooth step function. Finally the peaks are fitted by a least-squares routine. The highenergy part is fitted by the basic analytical function
(3.7)
where HGT is the height of the Gaussian (in counts), pas is the peak position (in
channels), FWHM is the full width at half maximum, and YG(x) the height of theGaussian in channel x. The deviation from a pure Gaussian due to low-energy tailing isconsidered with a fifth order term, The empirical function
(3.8)
where G(x) is the height of the peak function in channel x and 1C is a free fit parameter,
allows the generation of a long low-energy tail due to the high power of the (x-POS) term.
3.3.3 HPGe Detector Efficiency
• MeasurementsSeveral standard single and multi gamma-ray point sources (energies from 59 to 1836keV) were measured at several sample-to-detector distances (between 0.1 and 20.1 ern).
The measuring time for each source was set in order to achieve a peak area of :2: 10000counts and the peak area evaluation was done as described in section 3.3.2. The sourceswere obtained from DAMRI14 and PTB. For the double gamma-ray emitters 60Co and 88y
coincidence summing corrections had to be performed (see section 3.3.5). The propertiesof the used standard sources are given in Tab. 3.5.
• Photopeak Efficiency CalculationThe photopeak efficiency 8ph was calculated by the equation
(3.9)
14 Departemenl des Applications et de la Metrologiedes RayonnementsIonisants, 91193 Gif-Sur-YvetteCedex France
50 ActivationCross SectionsandIsomeric Cross Section Ratios ...
where Nph(x, Ey) is the count rate of the peak area corresponding to the energy Ey at the
source-to-detector distance x, A is the source activity at the time of standardization, py isthe absolute y-ray emission probability, 'A is the decay constant and t the elapsed time since
standardization.
Tab. 3.5 Properties of the gamma-ray calibration sources, taken from [Fir 96].
24lAm 432.7 a462.6 d
59.54 (35.9)88.03(3.65)
'. -r1l<eV] '.
13'Ce
"SrJj7Cs'4MnO'Zn
"y
271.79d137.640d27.706 d115.09d64.849d30.15 a312.3 d244.26d5.271 a
106.630d
122.06 (85.68), 136.47 (10.67)165.86 (79.87)320.08 (9.85)391.70(64.89)514.01 (99.29)661.66(85.2)834.84(99.98)1115.55 (50.75)1173.2(99.89), 1332.5 (99.98)898.04(94.1), 1836.06 (99.36)
• Photopeak Efficiency as a Function of EnergyA number of analytical functions describing the dependence of the photopeak efficiencyversus the energy have been proposed by several authors [e. g. Wi! 70, McN 73, Gmu 82,
Gra 85, San 87, Deb 88]. The efficiency function used in this work has been proposed byJackel et al. [lac 87]. The high energy part (-200 up to -2500 keY) is well described by a
second order polynomial in a log-log display whereas the sharp decrease of the efficiencyat low energies is characterized appropriately by an arctangent function. The function can
be expressed as
(3.10)
where the constant 2ht serves for the normalization of the arctangent function and the
constant -25 shifts the In eCEy) values to positive numbers. This efficiency function wasfitted to the experimental points as can be seen in Fig. 3.17 for some selected source-to
detector distances.
3. Experimental Methods 51
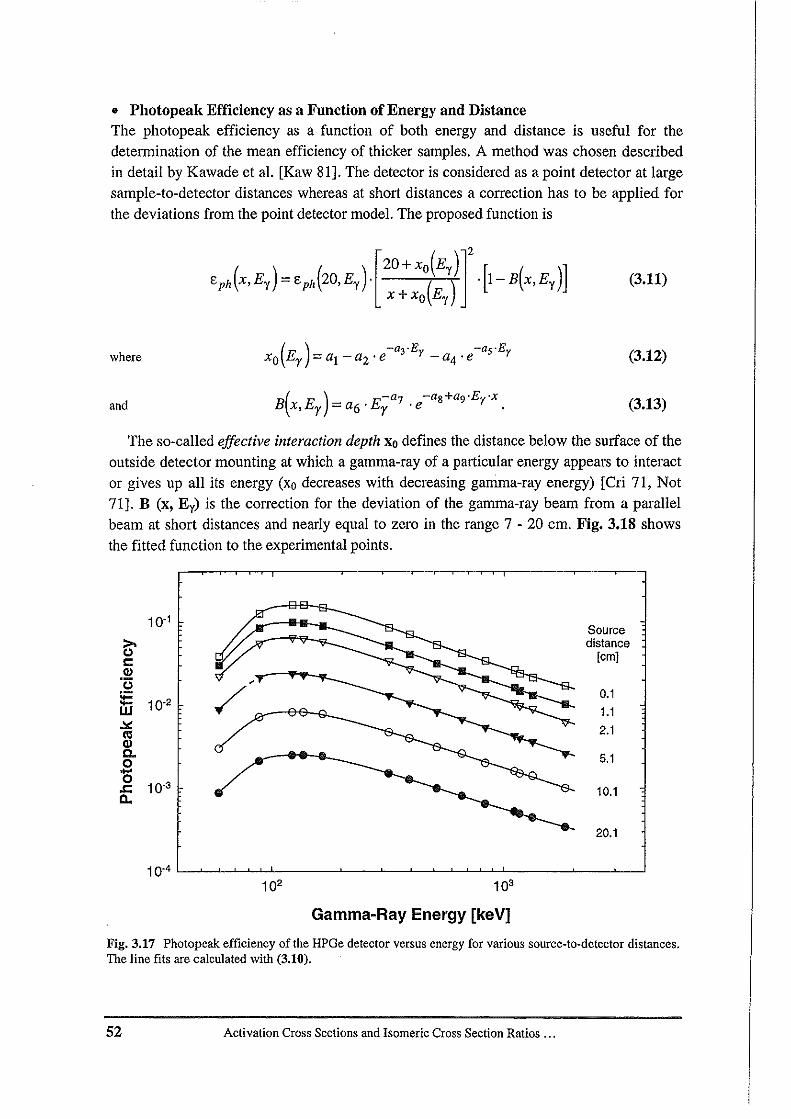
• Photopeak Efficiency as a Function of Energy and DistanceThe photopeak efficiency as a function of both energy and distance is useful for thedetermination of the mean efficiency of thicker samples. A method was chosen describedin detail by Kawade et al. [Kaw 81]. The detector is considered as a point detector at largesample-to-detector distances whereas at short distances a correction has to be applied forthe deviations from the point detector model. The proposed function is
(3.11)
where (3.12)
and (3.13)
The so-called effective interaction depth Xo defines the distance below the surface of theoutside detector mounting at which a gamma-ray of a particular energy appears to interactor gives up all its energy (xo decreases with decreasing gamma-ray energy) [Cri 71, Not71]. B (x, E y) is the correction for the deviation of the gamma-ray beam from a parallelbeam at short distances and nearly equal to zero in the range 7 - 20 cm. Fig. 3.18 showsthe fitted function to the experimental points.
10.1Source
~distance
c [em]Q)
'0 ,:;:: ,/ 0.1jjj 10-2
1.1..:.: 2.1IIIQ)Co 5.10-0 10-3.c 10.10..
20.1
Gamma-Ray Energy [keY]
Fig. 3.17 Photopeak efficiency of the HPGe detector versus energy for various source-to-detector distances.TIle line fits are calculated with (3.10).
52 Activation Cross Sections and Isomeric Cross Section Ratios ...
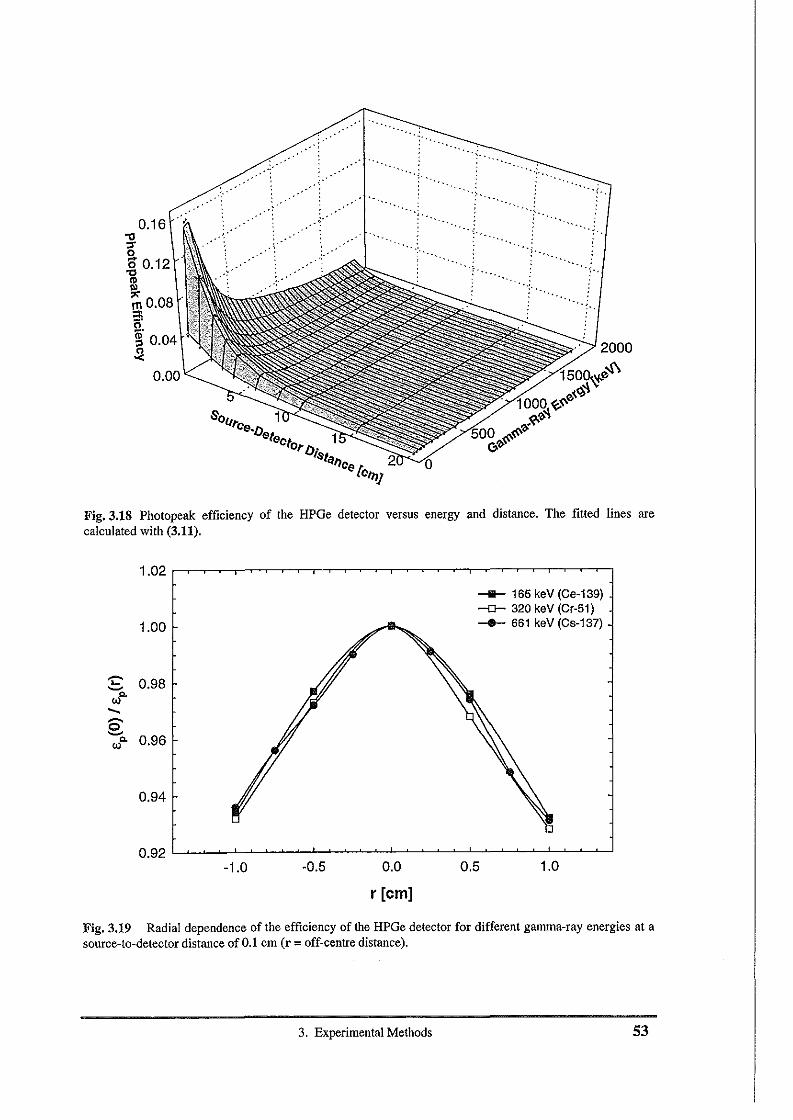
.... ~..".'. '~..
-'.... :
0.16"0".o.g 0.12
~mO.08
~~ 0.04-2
",,'
, "
"'.,;
"':'"
-v.:: "
".":"
'. ~"
Fig. 3.18 Photopeak efficiency of the HPOe detector versus energy and distance, The filled lines arecalculated with (3.11),
1.00
'C' 0.98~
w'""-~
0~
0.96w'"
0.94
__ 165 keY (Ce-139)-0- 320 keY (Cr-51)__ 661 keY (Cs-137)
-1.0 -0.5 0.0
r [em]
0.5 1.0
Fig. 3.19 Radial dependence of the efficiency of the HPOe detector for different gamma-ray energies at asource-to-detector distance of 0.1 em (r = off-centre distance).
3. Experimental Methods 53
(3.14)
• Corrections for Disk and Cylinder Type SourcesIn order to determine a correction factor for the efficiency of disk type sources, cph(R), thepoint sources were measured in several off-centre distances r and the efficiency Cph(r) wascalculated. According to Helmer [Hel 83] the correction factor Cdisk for a disk source withradius R is given by
R
JCpfl(r)---!:.-"--7--,-. 2nrdr
cpfl(R) 0 cp/z(O)cdisk = C fl(O) = R
p J2nrdro
Fig. 3.19 shows the efficiency as a function of the off-centre distance for different pointsources. In contradiction to Helmer, no dependence of Cdisk from the gamma-ray energycould be determined due to the somewhat bigger experimental errors. In addition,measurements were done with two multi gamma-ray disc sources which were prepared inthe IRMM Radionuclides Group. They were made of a mixed standard solution poureddropwise on two thin papers (13 and 14 mm in diameter). These were placed in stainlesssteel rings (34 mm outer diameter) and covered on both sides with self-adhesive plasticfoil (O.Olglcm2
) . The correction factors Cdisk determined with these sources agreed withthose determined with the point sources to within 5 % (the order of the uncertainty of theactivity of the standard sources). Generally the correction factors were in the order of 2 to
8%.Cylindrical sources can be interpreted as multilayered disk sources where for each layer atthe distance x from the detector equation (3.14) must be applied. If self absorption cannotbe neglected and the activity in the sample is not homogeneously distributed, then theintegrand has to be multiplied by a self-absorption correction term T(x) (s. below) and bythe activity gradient Cgrad in the sample (see 3.2.3). The correction factor CvGI for theefficiency of a cylindrical sample of thickness X is given finally by the expression
1 xcval =-. JCgrad(X)'Cdisk(X).T(x).dx •
X 0(3.15)
• Total Detector EfficiencyThe total efficiency e, is defined as the ratio of the number of pulses recorded in the entirespectrum and the number of photons emitted from a source. The pulses need not to be dueto photons originally emitted in the direction of the detector, but they may result fromsecondary photons produced by source photons in the surroundings.
C, is important in the calculation of coincidence-summing corrections (see followingchapter), since the loss of events from the full-energy peak of one photon line isproportional to the total efficiencies for the coincident photons.lt is
54 Activation Cross Sections and Isomeric Cross Section Ratios ...
(3.16)
where N, is the total count rate (extrapolated to zero keY). For the calibration the singlegamma-ray emitters 139Ce, SICr, 8SSr, l37Cs, and 54Mn were used. In the case of S7CO and
60Co, radionuclides emitting two photons of not too different energies, for Pr the sum~f
the individual emission probabilities was inserted and lOt assigned to the mean energy ECS7Co, E =124 keY and 60Co, E =1253 keY). In the case of 113Sn and 65Zn , where the
source emits two gamma-rays with well separated energies, the total efficiency lO,(E1) forone energy was interpolated from other measured values. Then the corresponding number
of total counts was subtracted and lO,(E2) was obtained. The experimental data points werethen fitted with a linear regression in a semi-log plot.
3.3.4 Photon Absorption Corrections
It was assumed that most of the samples can be considered as plane sources of thickness xwith a homogeneous distribution of the attenuating material and the activity. Thetransmission T through a layer of thickness x (usually mass areal density in g/crrr') is given
by the expression
T - -J1 x-e .
where ,.. is the absorption coefficient (usually
transmission T through a source is given by
(3.17)
mass absorption in cm2/g) The mean
_ IX I ( )T=-fe-J1 xdx=-- I-e-/l x .x 0 f1 x
T may be expressed in T:
- T-IT=-
InT
(3.18)
(3.19)
The values of ,.. were calculated with the program XCOM [Ber 87]. Additionally,
transmission measurements were done to determine the self-absorption for the thickirradiated nickel cylinders (5 mm thick). The standard disk source was measured with
increasing number (l to 4) of thin nickel cylinders (1.5 mm thick) in between source anddetector. The ratio of the count rates of measurements with absorber to the one withoutabsorber gives the transmission T(x) as a function of absorber thickness.
3. Experimental Methods 55
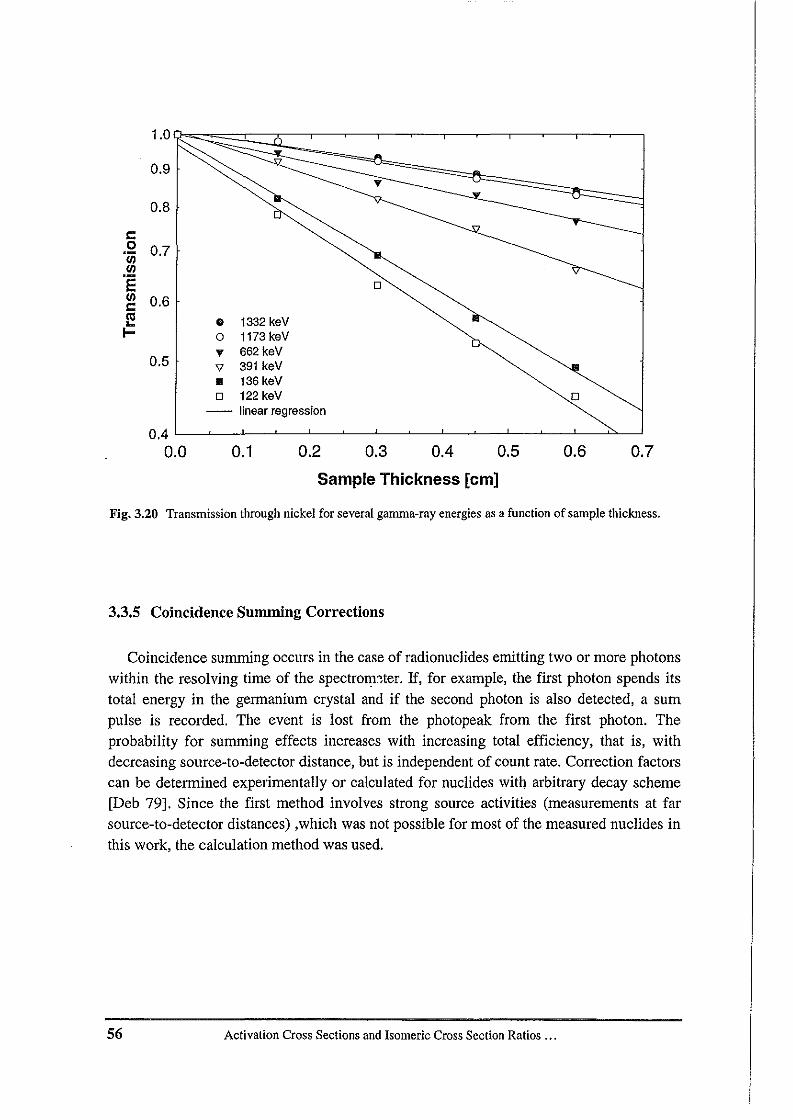
1.0
0.9
0.8
s::,~ 0.7II)
'E:g 0.6~I-
0.5
• 1332 keYo 1173keV,.. 662 keYV 391 keY• 136 keYo 122 keY-- linear regression
o
o
0.70.60.50.40.30.20.10.4 L-~_-'-_~----L_~_L-~_--'---~_--'-_~--'_---'-"-----J
0.0
Sample Thickness [cm]
Fig. 3.20 Transmission through nickel for several gamma-ray energies as a function of sample thickness.
3.3.5 Coincidence Summing Corrections
Coincidence summing occurs in the case of radionuclides emitting two or more photonswithin the resolving time of the spectrometer. If, for example, the first photon spends itstotal energy in the germanium crystal and if the second photon is also detected, a sumpulse is recorded. The event is lost from the photopeak from the first photon. Theprobability for summing effects increases with increasing total efficiency, that is, withdecreasing source-to-detector distance, but is independent of count rate. Correction factorscan be determined experimentally or calculated for nuclides with arbitrary decay scheme[Deb 79]. Since the first method involves strong source activities (measurements at farsource-to-detector distances) ,which was not possible for most of the measured nuclides inthis work, the calculation method was used.
56 Activation Cross Sections and Isomeric Cross Section Ratios ...
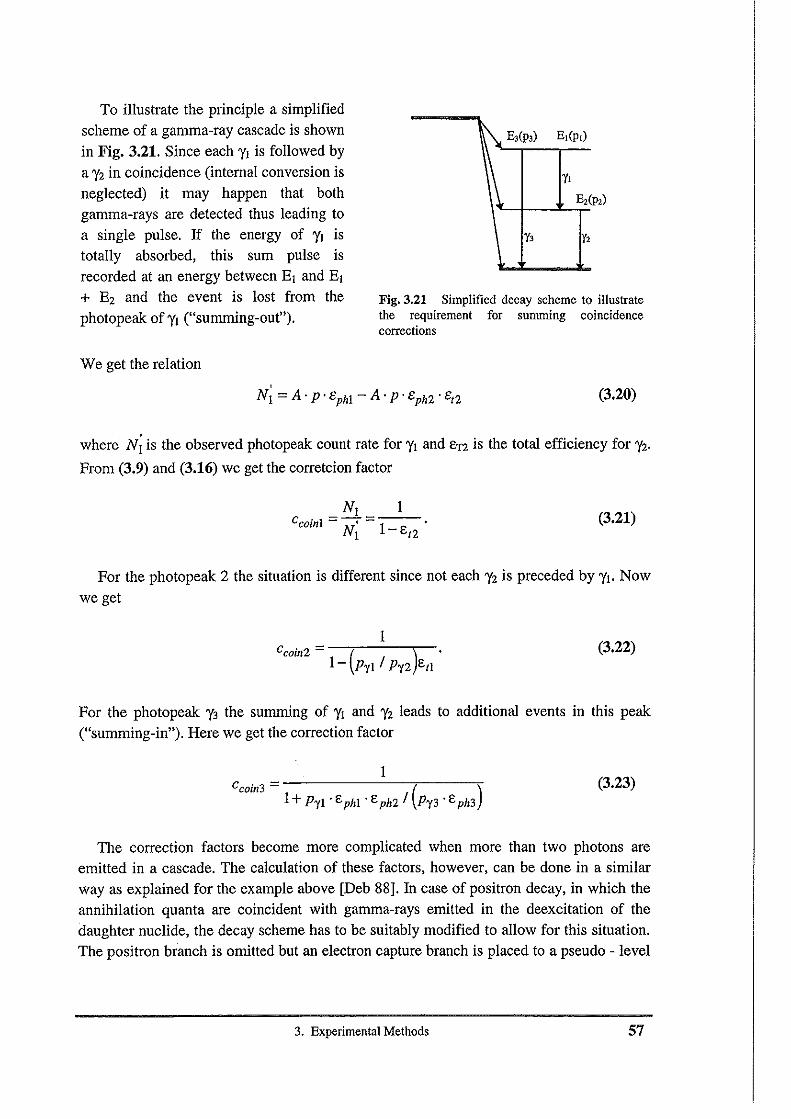
P2)
1\\. E,(p,) E,(p,)
\\ t.E,(
y, ~2
Fig. 3.21 Simplified decay scheme to illustratethe requirement for summing coincidencecorrections
To illustrate the principle a simplifiedscheme of a gamma-ray cascade is shownin Fig. 3.21. Since each 'Yl is followed bya 'Yz in coincidence (internal conversion isneglected) it may happen that bothgamma-rays are detected thus leading toa single pulse. If the energy of 'Yl istotally absorbed, this sum pulse isrecorded at an energy between El and E1
+ Ez and the event is lost from thephotopeak of 'Yl ("summing-out").
We get the relation
(3.20)
where N; is the observed photopeak count rate for 'Y1 and E1'2 is the total efficiency for 'Yz.From (3.9) and (3.16) we get the corretcion factor
(3.21)
For the photopeak 2 the situation is different since not each 'Y2 is preceded by 'Yl. Now
we get
ICcoin2 = ( ).
1- PyJ / Py2 Etl
(3.22)
For the photopeak 'Y3 the summing of 'YI and 'Yz leads to additional events in this peak("summing-in"). Here we get the correction factor
1Ccoin3 = ()
1+ PyJ . EphJ . Eph2 / Py3' Eph3
(3.23)
The correction factors become more complicated when more than two photons areemitted in a cascade. The calculation of these factors, however, can be done in a similarway as explained for the example above [Deb 88]. In case of positron decay, in which theannihilation quanta are coincident with gamma-rays emitted in the deexcitation of thedaughter nuclide, the decay scheme has to be suitably modified to allow for this situation.The positron branch is omitted but an electron capture branch is placed to a pseudo - level
3. ExperimentalMethods 57
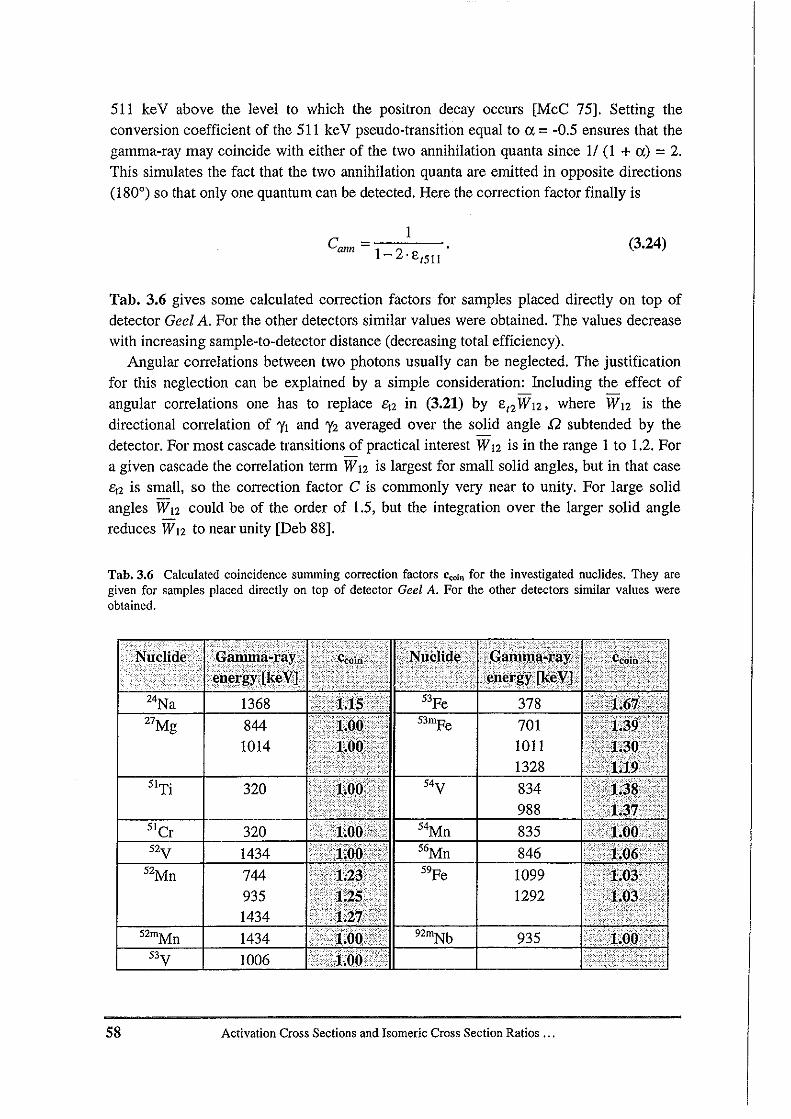
511 keY above the level to which the positron decay occurs [McC 75]. Setting theconversion coefficient of the 511 keY pseudo-transition equal to a = -0.5 ensures that thegamma-ray may coincide with either of the two annihilation quanta since II (I + 0:) = 2.This simulates the fact that the two annihilation quanta are emitted in opposite directions(180°) so that only one quantum can be detected. Here the correction factor finally is
ICann =---
1-2'8t511
(3.24)
Tab. 3.6 gives some calculated correction factors for samples placed directly on top ofdetector Geel A. For the other detectors similar values were obtained. The values decreasewith increasing sample-to-detector distance (decreasing total efficiency).
Angular correlations between two photons usually can be neglected. The justificationfor this neglection can be explained by a simple consideration: Including the effect of
- -angular correlations one has to replace Bt2 in (3.21) by 8 t2WI2, where W12 is thedirectional correlation of 'VI and 'V2 averaged over the solid angle ,Q subtended by thedetector. For most cascade transitions of practical interest W 12 is in the range 1 to 1.2. Fora given cascade the correlation term W12 is largest for small solid angles, but in that caseCt2 is small, so the correction factor C is commonly very near to unity. For large solidangles WI2 could be of the order of 1.5, but the integration over the larger solid anglereduces W12 to near unity [Deb 88].
Tab. 3.6 Calculated coincidence summing correction factors Croin for the investigated nuclides. They aregiven for samples placed directly on top of detector Gee! A. For the other detectors similar values wereobtained.
;:
935
378
7011011132883498883584610991292
" :
54y
."
320
320
1434744
93514341434100653y
58 Activation Cross Sections and Isomeric Cross Section Ratios ...
3.4 Radiochemical Separation and Sample Preparation
Measurement of activity via X-Ray spectrometry, as applied in a few cases, demanded aspecial sample preparation using radiochemical methods. These methods can be divided inthree parts. In the first step the radioactive product was separated from the bulk of thetarget material, then a thin sample was prepared for X-Ray counting, and finally thechemical yield of the first two steps was determined. The steps involved in the separationof 55Pe from nickel and 49y from Cr are described below. Furthermore, the preparation ofa 48y standard source for the Si(Li) detector calibration is outlined.
3.4.1 55Fe from Ni-Target
• SeparationThe irradiated Ni-samples contained the long-lived radioisotopes 56CO (TI/2 =78.8 d), 57CO(TI/2 =271.3 d), 58CO (Tl/z =70.8 d), 60Co (Tl/z =5.272 a), 59Pe (TI/2 =45.1 d) and 54Mn
(Tl/z =312.2 d). All of them could be measured via gamma-ray spectrometry. In additionsome 55Pe was also formed. To determine its activity via X-ray spectrometry, it wasmandatory to separate the iron from the radiocobalt, radiomanganese and the thick Nitarget due to two reasons. Firstly, the soft X-rays MnKu (5.89 keY) and MnK~ (6.49 keY)are almost completely stopped due to self-absorption. Secondly, 56.57.58Co and 54Mn decay
with similar X-ray energies (FeK" =6.4 keY and CrK~ =5.9 keY, respectively).In order to obtain better counting statistics the pairs of samples which were irradiated
under the same angle (0°, 30° and 330°, 60° and 300°, 105° and 255°, 130° and 230°, intotal five samples) were dissolved in a hot solution of 50 ml cone. HCI and 20 ml 30%HzOz. After complete dissolution, 1.5 mg PeCh, 1 mg MnCh and 1 mg CoCh were addedas carriers. This solution was then passed through an anion-exchange column (DOWEXlX8, chloride form, 3 em X 1 ern 0) which was saturated with 8N HCI. The column waswashed with 50 rnl of 8N HCI (to remove nickel and manganese). Thereafter, 20 ml of 4NHCI were used to remove the cobalt from the column. The iron was finally eluted with 10ml of 0.05N HCI. The flow chart of the whole separation is shown in Fig. 3.22. Fer furtherpurification the eluted iron was evaporated to dryness, taken up in 8N HCI and the anionexchange process was repeated. For quantification, the different eluents were checked viagamma-ray spectrometry of the lines 122 keY (57CO), 835 keY e4Mn) and 1099 keY(59pe). Fig. 3.23 shows the gamma-ray spectrum of a Ni-target before the separationcompared with the spectrum taken from the separated iron fraction. The iron was almostquantitatively (> 95 %) separated without any contamination from cobalt or manganese.
3. Experimental Methods 59
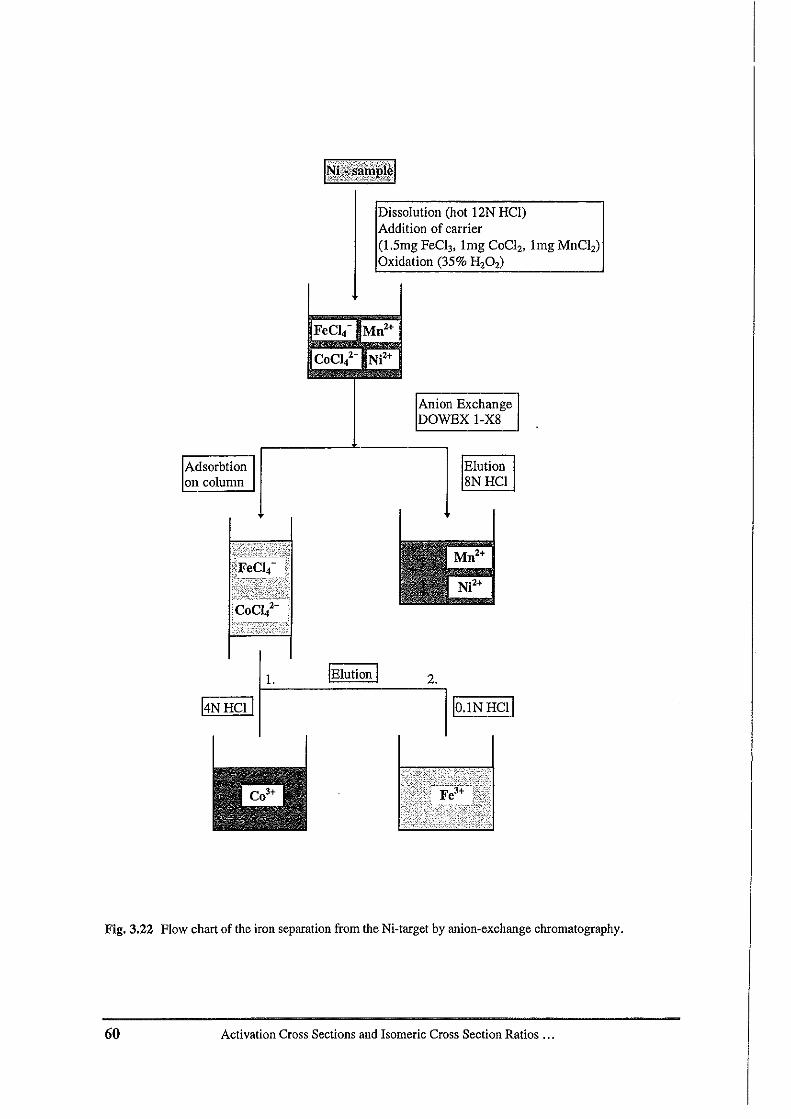
Dissolution (hot 12N HCI)Addition of carrier(I.5mg FeCI3, lmg CoCI" lmg MnCI,)Oxidation (35% H,O,)
ExchangeWEX I-X8
FeCI.- Mn'+
CoCil IN!'+
AnionDO
1. IElution I 2.
14NHCI I IO.INHCII
Fig. 3.22 Flow chart of the iron separation from the Ni-target by anion-exchange chromatography.
60 Activation Cross Sections and Isomeric Cross SectionRatios ...
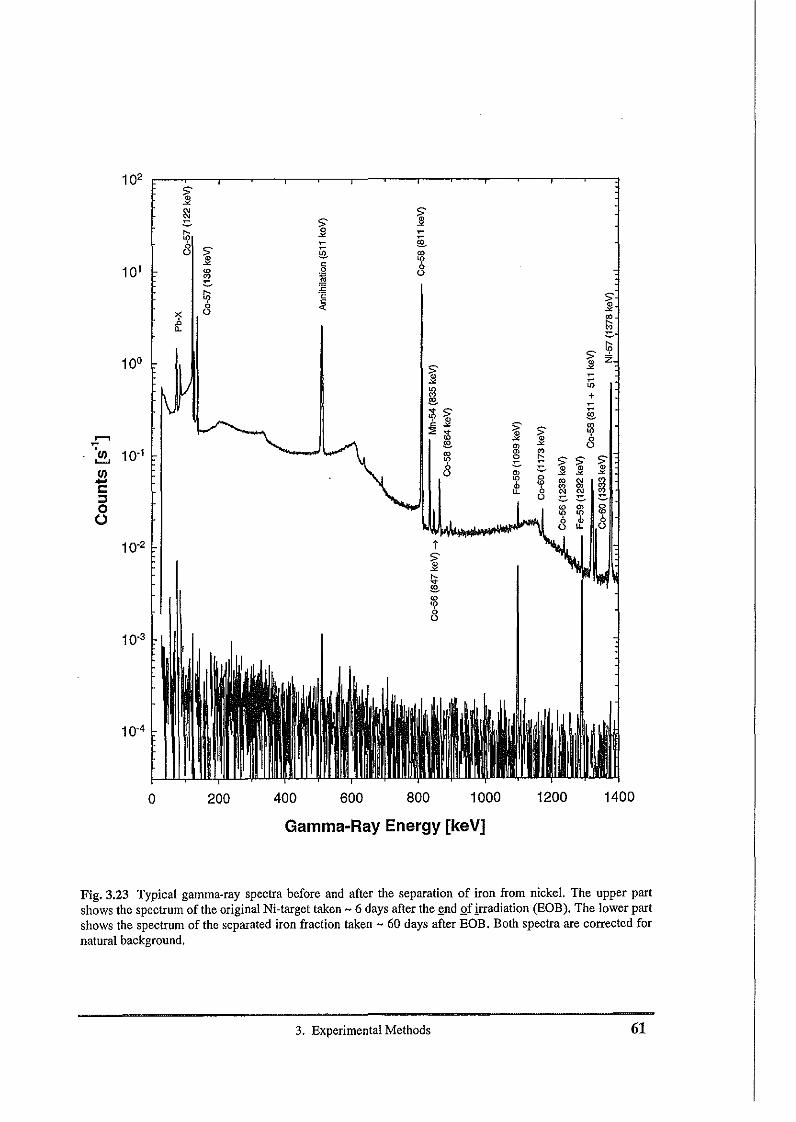
10-4
102
~~ ~'" ~~
~
~ !!1-
~ ~ <0
C '?101 <0
~0
co 0
'"~
'"c~c
."'! <0.0 ga.
"-
~"'
10°,"z
~ ;;;lil +!!1-
~ ~ ec ~
~ ~<0
,...., :;; ;1; ~'7 !!1- illUI 10-1 <0 '"~ '? 0 ~ >- ~ ~20 '" .110 '"'? 0 <0 gj ~s:: ~ b co
'" '":::s 0 c, '" '"0o10-2 t
~~!!1-<0'?00
10-3
o 200 400 600 800 1000 1200 1400
Gamma-Ray Energy [keV]
Fig. 3.23 Typical gamma-ray spectra before and after the separation of iron from nickel. The upper partshows the spectrum of the original Ni-target taken - 6 days after the ~nd Qfirradiation (EOB). The lower partshows the spectrum of the separated iron fraction taken - 60 days after EOB. Both spectra are corrected fornatural background.
3. Experimental Methods 61
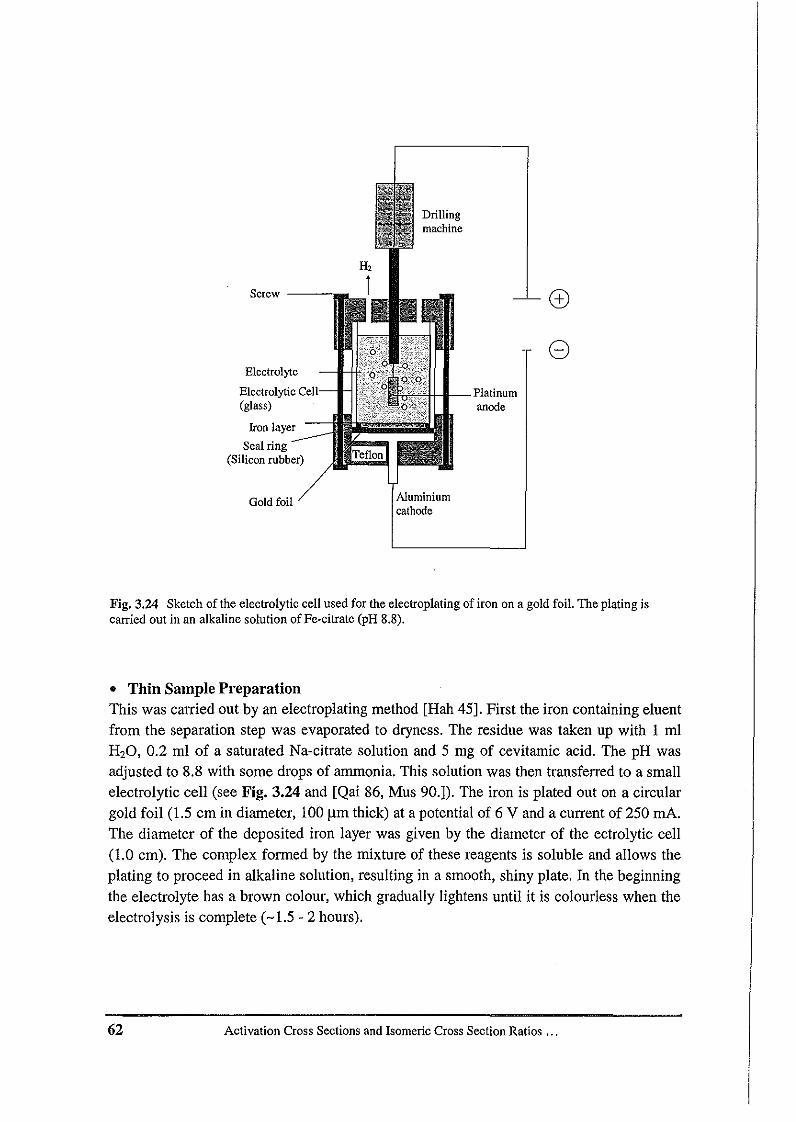
Screw ---
Electrolyte
Electrolytic Cell(glass)
Iron layer
Seal ring(Silicon rubber)
Gold foil
+-1-- Platinumanode
Aluminiumcathode
8
Fig. 3.24 Sketch of the electrolytic cell used for the electroplating of iron on a gold foil. The plating iscarried out in an alkaline solution of Fe-citrate (pH 8.8).
• Thin Sample PreparationThis was carried out by an electroplating method [Hah 45]. First the iron containing eluent
from the separation step was evaporated to dryness. The residue was taken up with I mlH20, 0.2 ml of a saturated Na-citrate solution and 5 mg of cevitamic acid. The pH wasadjusted to 8.8 with some drops of ammonia. This solution was then transferred to a smallelectrolytic cell (see Fig. 3.24 and [Qai 86, Mus 90.]). The iron is plated out on a circular
gold foil (1.5 em in diameter, 100 urn thick) at a potential of 6 V and a current of 250 m.A,The diameter of the deposited iron layer was given by the diameter of the ectrolytic cell
(1.0 em). The complex formed by the mixture of these reagents is soluble and allows theplating to proceed in alkaline solution, resulting in a smooth, shiny plate. In the beginning
the electrolyte has a brown colour, which gradually lightens until it is colourless when theelectrolysis is complete (-1.5 - 2 hours).
62 Activation Cross Sections and Isomeric Cross Section Ratios ...
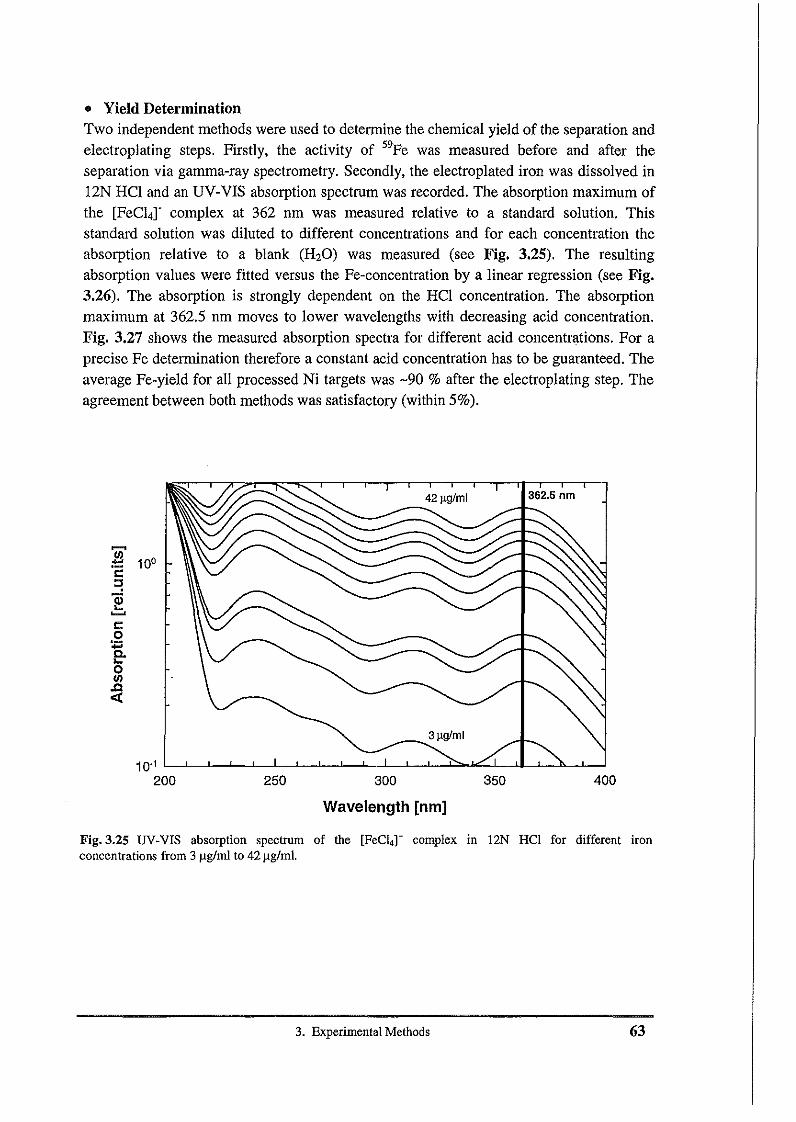
• Yield DeterminationTwo independent methods were used to determine the chemical yield of the separation andelectroplating steps. Firstly, the activity of 59Fe was measured before and after theseparation via gamma-ray spectrometry. Secondly, the electroplated iron was dissolved in12N HCI and an UV-VIS absorption spectrum was recorded. The absorption maximum ofthe [FeC14r complex at 362 nm was measured relative to a standard solution. Thisstandard solution was diluted to different concentrations and for each concentration theabsorption relative to a blank (H20) was measured (see Fig. 3.25). The resultingabsorption values were fitted versus the Fe-concentration by a linear regression (see Fig.3.26). The absorption is strongly dependent on the HCI concentration. The absorptionmaximum at 362.5 nm moves to lower wavelengths with decreasing acid concentration.Fig. 3.27 shows the measured absorption spectra for different acid concentrations. For aprecise Fe determination therefore a constant acid concentration has to be guaranteed. Theaverage Fe-yield for all processed Ni targets was -90 % after the electroplating step. Theagreement between both methods was satisfactory (within 5%).
r:::o~o/JI.c«
421lglml 362.5 nm
400350300
Wavelength [nm]
25010.1 L..-,----'--'---,--l--''---.l.-..l-....l.-.....L--,---,--,c:""JL-L...J.I--l--.l>---l--l
200
Fig.3.25 UV·VIS absorption spectrum of the [FeC4r complex in 12N HCI for different ironconcentrations from 3 ug/ml to 42ug/ml,
3. ExperimentalMethods 63
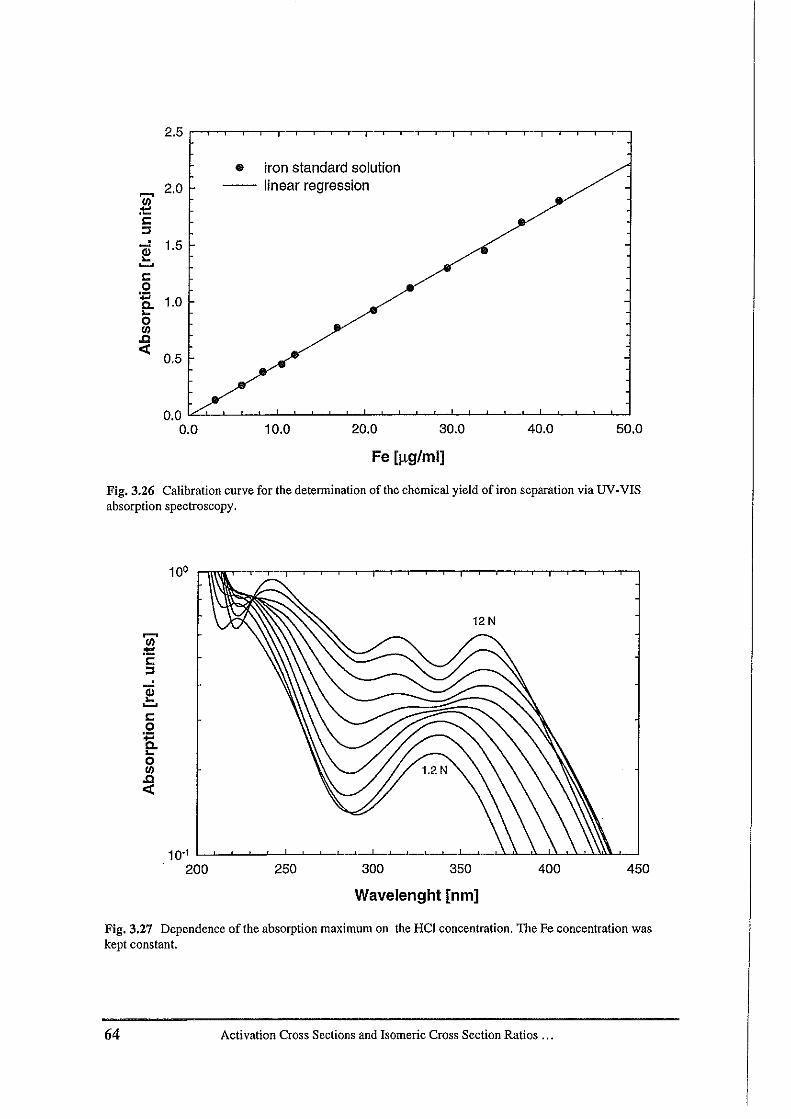
2.5
• iron standard solution
~2.0 linear regression
<II:t::l::::l
iI!1.5
~
e0
+:: 1.0c....0<II.c« 0.5
50.040.030.020.010.00.0 '""-''-'-----'--'--'---'---'--'--'--'---'--'--'---'-----'--'----'----'--'-----'-----'--l.-.l..-.L......J
0.0
Fe [J!g/ml]
Fig.3.26 Calibration curve for the determination of the chemical yield of iron separation via UV-VISabsorption spectroscopy.
l:o
~o<II.c«
10"200 250 300 350 400 450
Wavelenght [nm]
Fig. 3.27 Dependence of the absorption maximum on the HCI concentration. The Fe concentration waskept constant.
64 Activation Cross Sections and Isomeric Cross Section Ratios ...
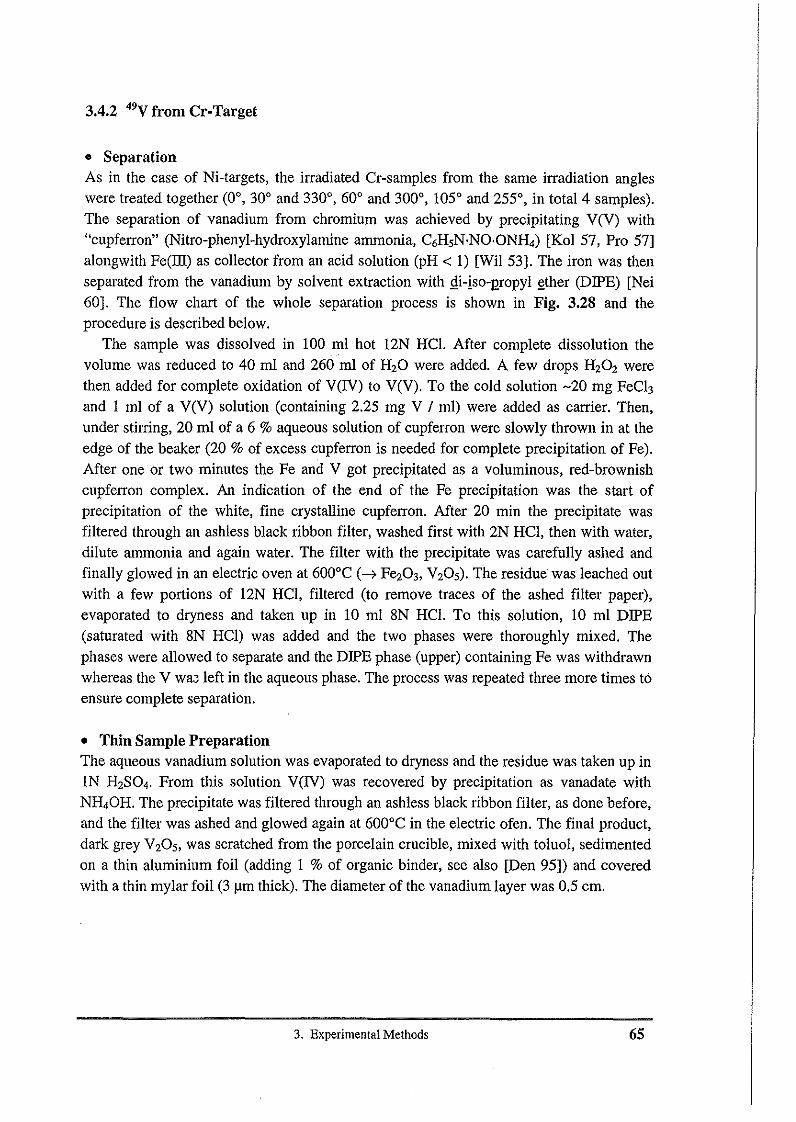
3.4.2 49V from Cr-Target
• SeparationAs in the case of Ni-targets, the irradiated Cr-samples from the same irradiation angleswere treated together (0°, 30° and 330°, 60° and 300°, 105° and 255°, in total 4 samples).The separation of vanadium from chromium was achieved by precipitating V(V) with"cupferron" (Nitro-phenyl-hydroxylamine ammonia, C6HsN·NO·ON~) [Kol 57, Pro 57]alongwith Fe(Ill) as collector from an acid solution (pH < 1) [Wil 53]. The iron was thenseparated from the vanadium by solvent extraction with f!i-iso-J2ropyl l'ther (DlPE) [Nei60]. The flow chart of the whole separation process is shown in Fig. 3.28 and theprocedure is described below.
The sample was dissolved in 100 ml hot 12N HCI. After complete dissolution thevolume was reduced to 40 ml and 260 ml of H20 were added. A few drops H202 werethen added for complete oxidation of YeN) to V(V). To the cold solution -20 mg FeCband 1 ml of a V(V) solution (containing 2.25 mg V / ml) were added as carrier. Then,under stirring, 20 ml of a 6 % aqueous solution of cupferron were slowly thrown in at theedge of the beaker (20 % of excess cupferron is needed for complete precipitation of Fe).After one or two minutes the Fe and V got precipitated as a voluminous, red-brownishcupferron complex. An indication of the end of the Fe precipitation was the start ofprecipitation of the white, fine crystalline cupferron. After 20 min the precipitate wasfiltered through an ashless black ribbon filter, washed first with 2N HCI, then with water,dilute ammonia and again water. The filter with the precipitate was carefully ashed andfinally glowed in an electric oven at 600°C (--7 Fe203, V20S). The residue was leached outwith a few portions of 12N HCI, filtered (to remove traces of the ashed filter paper),evaporated to dryness and taken up in 10 ml 8N HCI. To this solution, 10 ml DlPE(saturated with 8N HCI) was added and the two phases were thoroughly mixed. Thephases were allowed to separate and the DlPE phase (upper) containing Fe was withdrawnwhereas the V wac left in the aqueous phase. The process was repeated three more times toensure complete separation.
• Thin Sample PreparationThe aqueous vanadium solution was evaporated to dryness and the residue was taken up inIN H2S04. From this solution YeN) was recovered by precipitation as vanadate withN~OH. The precipitate was filtered through an ashless black ribbon filter, as done before,and the filter was ashed and glowed again at 600°C in the electric ofen. The final product,dark grey V20S, was scratched from the porcelain crucible, mixed with toluol, sedimentedon a thin aluminium foil (adding 1 % of organic binder, see also [Den 95]) and coveredwith a thin mylar foil (3 urn thick). The diameter of the vanadium layer was 0.5 cm.
3. Experimental Methods 65
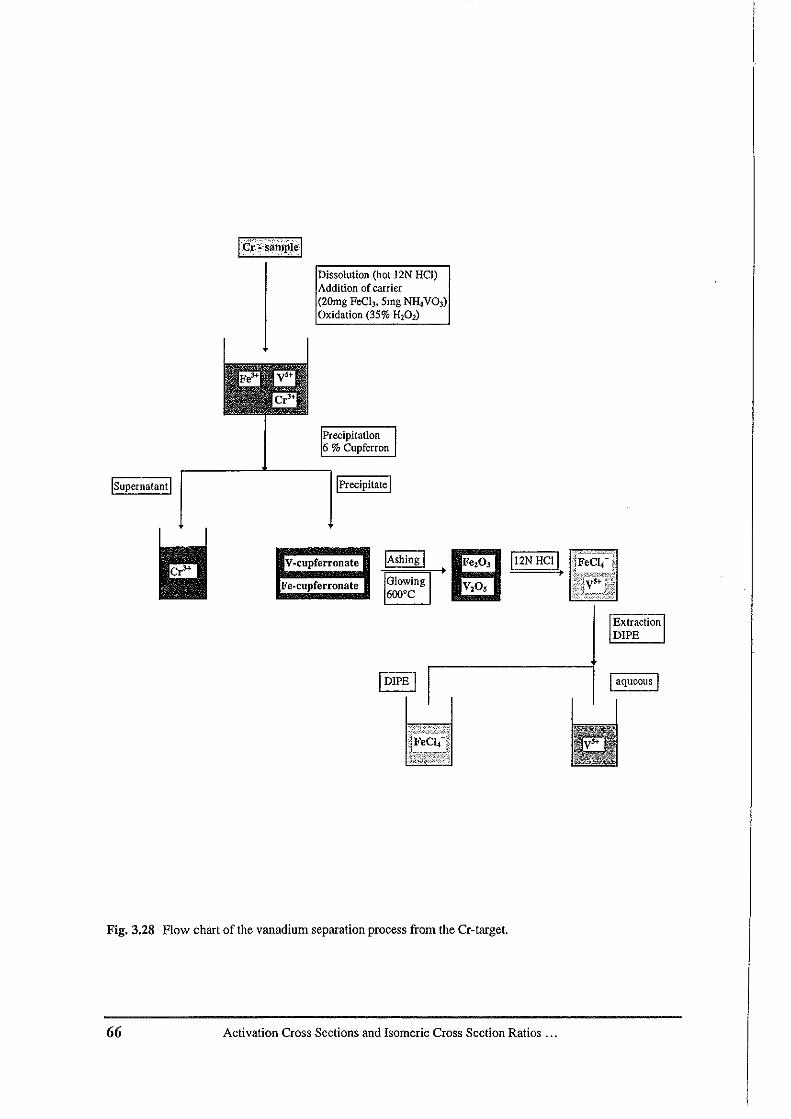
Isupernatant I
Dissolution (hot 12NHel)Addition ofcarrier(20mgFeci,. 5mgNH,VO,)Oxidation (35% H,O,)
Precipitation6 % Cupferron
IPrecipitate I
~I
V~cupferronate
Fe·cupferronate
Fig. 3.28 Flow chart of the vanadium separation process from the Cr-target,
66 Activation Cross Sections and Isomeric Cross Section Ratios ...
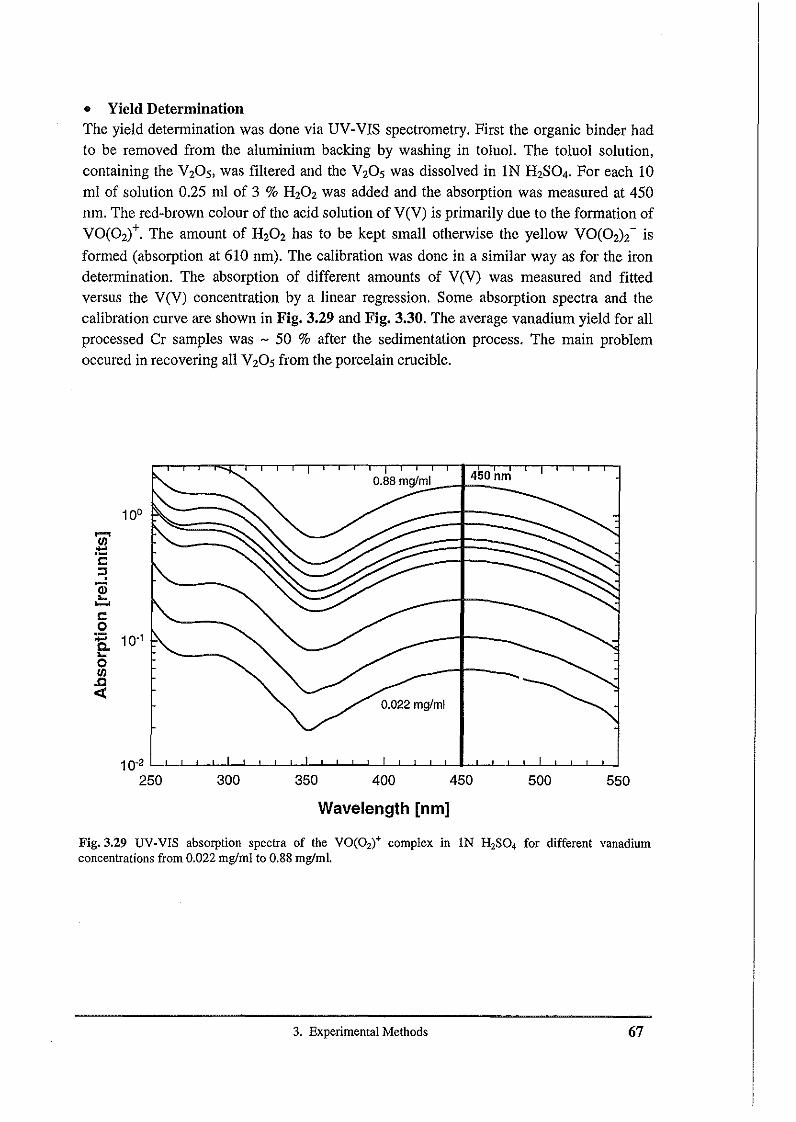
• Yield DeterminationThe yield determination was done via UV-VIS spectrometry. First the organic binder hadto be removed from the aluminium backing by washing in toluol. The toluol solution,containing the VzOs, was filtered and the VzOs was dissolved in IN HzS04. For each 10ml of solution 0.25 ml of 3 % HzOz was added and the absorption was measured at 450nm. The red-brown colour of the acid solution of V(V) is primarily due to the formation ofVO(Oz)+. The amount of HzOz has to be kept small otherwise the yellow VO(Oz)z- is
formed (absorption at 610 nm). The calibration was done in a similar way as for the irondetermination. The absorption of different amounts of V(V) was measured and fittedversus the V(V) concentration by a linear regression. Some absorption spectra and thecalibration curve are shown in Fig. 3.29 and Fig. 3.30. The average vanadium yield for allprocessed Cr samples was - 50 % after the sedimentation process. The main problemoccured in recovering all VzOs from the porcelain crucible.
10°
s:::o:a 10-1I-
oIII.c«
450nm
300 350 400 450 500
Wavelength [nm]
Fig. 3.29 UV-VIS absorption spectra of the VO(02t complex in IN H2S04 for different vanadiumconcentrations from 0.022 mg/ml to 0.88 mg/ml,
3. Experimental Methods 67
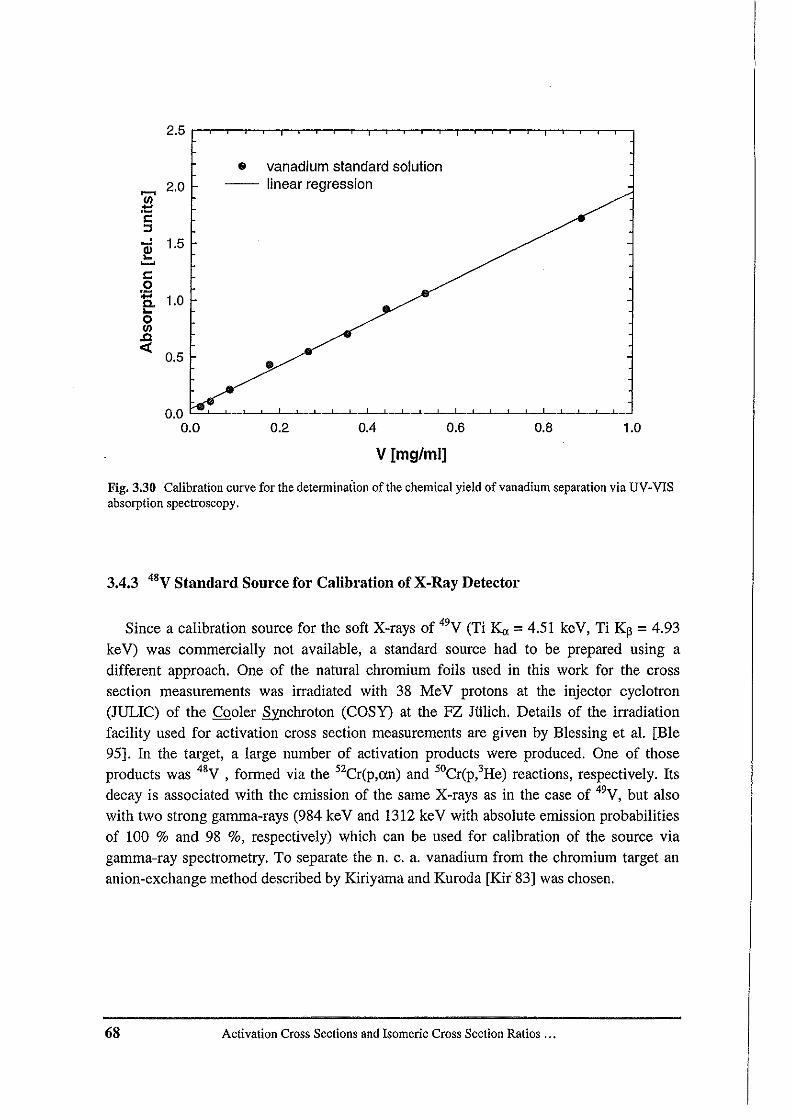
2.5
• vanadium standard solution
~2.0 -- linear regression
/II.~s:::l
~1.5
~
s::0+= 1.0a...0/IIJ:l<I:
0.5 •0.0
0.0 0.2 0.4 0.6 0.8 1.0
V [mg/ml]
Fig. 3.30 Calibrationcurve for the determination of the chemicalyieldof vanadium separation via UV-VISabsorptionspectroscopy.
3.4.3 48V Standard Source for Calibration of X-Ray Detector
Since a calibration source for the soft X-rays of 49V (Ti K" = 4.51 keY, Ti Kp = 4.93
keV) was commercially not available, a standard source had to be prepared using a
different approach. One of the natural chromium foils used in this work for the cross
section measurements was irradiated with 38 MeV protons at the injector cyclotron(JULIC) of the Cooler ~chroton (COSY) at the FZ Jiilich. Details of the irradiationfacility used for activation cross section measurements are given by Blessing et a1. [Ble
95]. In the target, a large number of activation products were produced. One of thoseproducts was 48V , formed via the 52Cr(p,an) and 50Cr(p,3He) reactions, respectively. Its
decay is associated with the emission of the same X-rays as in the case of 49V, but also
with two strong gamma-rays (984 keV and 1312 keV with absolute emission probabilitiesof 100 % and 98 %, respectively) which can be used for calibration of the source via
gamma-ray spectrometry. To separate the n. c. a. vanadium from the chromium target an
anion-exchange method described by Kiriyama and Kuroda [Kir 83] was chosen.
68 ActivationCross Sections and Isomeric Cross SectionRatios ...
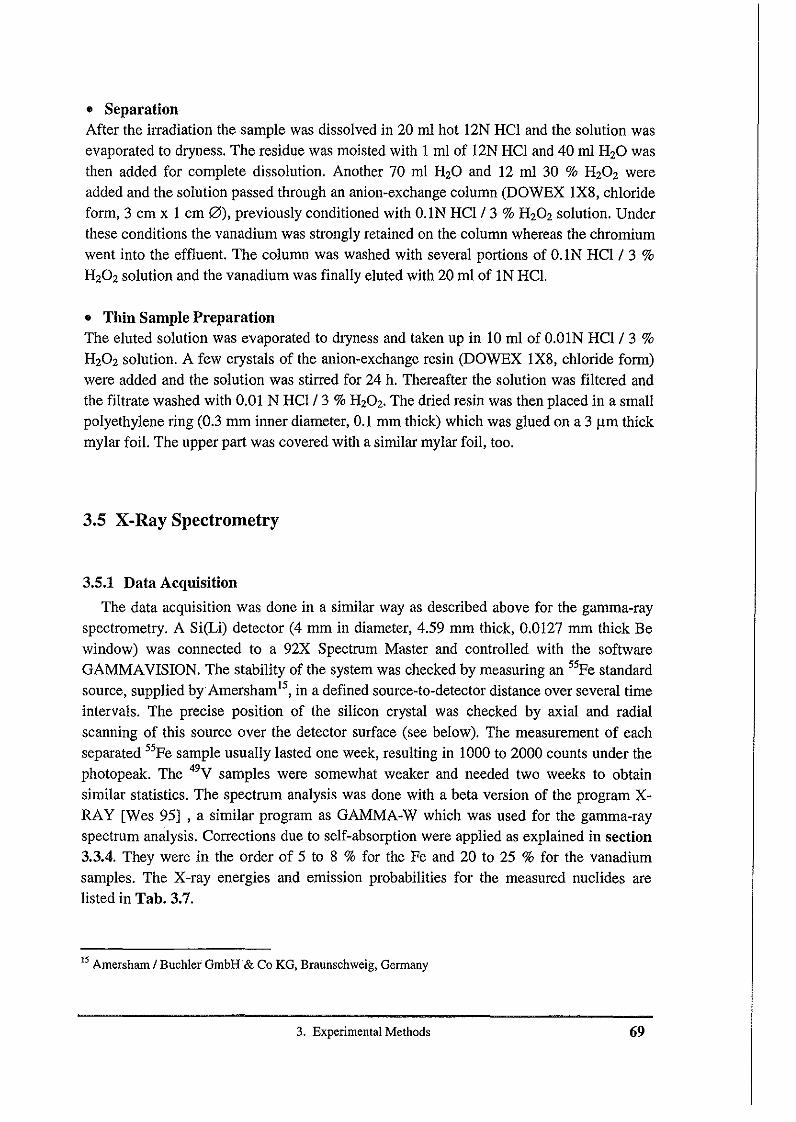
• SeparationAfter the irradiation the sample was dissolved in 20 ml hot 12N HCI and the solution wasevaporated to dryness. The residue was moisted with I ml of 12N HCI and 40 ml H20 wasthen added for complete dissolution. Another 70 ml H20 and 12 ml 30 % H202 wereadded and the solution passed through an anion-exchange column (DOWEX 1X8, chlorideform, 3 em x 1 ern 0), previously conditioned with O.lN HCl / 3 % H202solution. Underthese conditions the vanadium was strongly retained on the column whereas the chromiumwent into the effluent. The column was washed with several portions of O.lN HCI / 3 %
H202solution and the vanadium was finally eluted with 20 ml of IN HCI.
• Thin Sample PreparationThe eluted solution was evaporated to dryness and taken up in 10 ml of O.OIN HCl / 3 %
H202 solution. A few crystals of the anion-exchange resin (DOWEX 1X8, chloride form)were added and the solution was stirred for 24 h. Thereafter the solution was filtered andthe filtrate washed with 0.01 N HCl / 3 % H202. The dried resin was then placed in a smallpolyethylene ring (0.3 mm inner diameter, 0.1 mm thick) which was glued on a 3 um thickmylar foil. The upper part was covered with a simllar mylar foil, too.
3.5 X-Ray Spectrometry
3.5.1 Data Acquisition
The data acquisition was done in a similar way as described above for the gamma-rayspectrometry. A Si(Li) detector (4 mm in diameter, 4.59 mm thick, 0.0127 mm thick Bewindow) was connected to a 92X Spectrum Master and controlled with the softwareGAMMAVISION. The stability of the system was checked by measuring an 55Pe standardsource, supplied by Amersham'", in a defined source-to-detector distance over several timeintervals. The precise position of the silicon crystal was checked by axial and radialscanning of this source over the detector surface (see below). The measurement of eachseparated 55Pe sample usually lasted one week, resulting in 1000 to 2000 counts under thephotopeak. The 49V samples were somewhat weaker and needed two weeks to obtainsimilar statistics. The spectrum analysis was done with a beta version of the program XRAY [Wes 95] , a similar program as GAMMA-W which was used for the gamma-rayspectrum analysis. Corrections due to self-absorption were applied as explained in section3.3.4. They were in the order of 5 to 8 % for the Fe and 20 to 25 % for the vanadiumsamples. The X-ray energies and emission probabilities for the measured nuclides arelisted in Tab. 3.7.
15 Amersham / Buchler GmbH & Co KG, Braunschweig, Germany
3. Experimental Methods 69
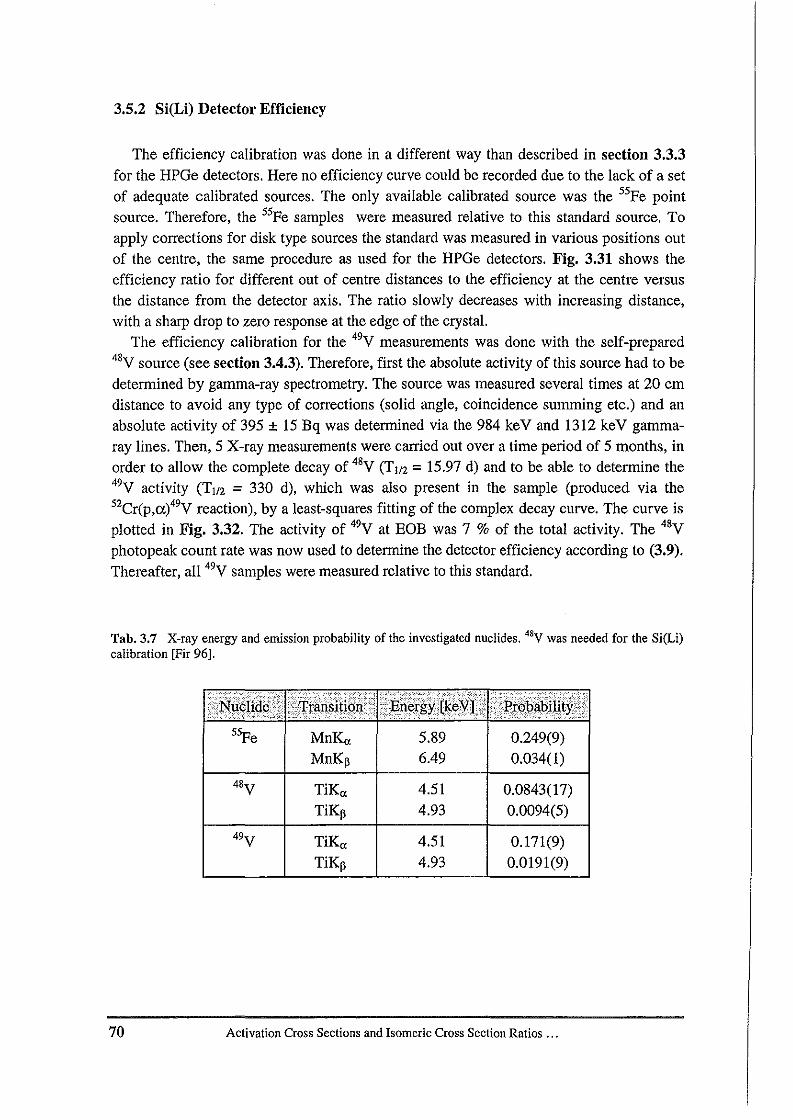
3.5.2 Si(Li) Detector Efficiency
The efficiency calibration was done in a different way than described in section 3.3.3for the HPGe detectors. Here no efficiency curve could be recorded due to the lack of a setof adequate calibrated sources. The only available calibrated source was the 55Pe pointsource. Therefore, the 55Pe samples were measured relative to this standard source. Toapply corrections for disk type sources the standard was measured in various positions outof the centre, the same procedure as used for the HPGe detectors. Fig. 3.31 shows theefficiency ratio for different out of centre distances to the efficiency at the centre versusthe distance from the detector axis. The ratio slowly decreases with increasing distance,with a sharp drop to zero response at the edge of the crystal.
The efficiency calibration for the 49y measurements was done with the self-prepared48y source (see section 3.4.3). Therefore, first the absolute activity of this source had to bedetermined by gamma-ray spectrometry. The source was measured several times at 20 emdistance to avoid any type of corrections (solid angle, coincidence summing etc.) and anabsolute activity of 395 ± 15 Bq was determined via the 984 keY and 1312 keY gammaray lines. Then, 5 X-ray measurements were carried out over a time period of 5 months, inorder to allow the complete decay of 48y (TI/2 = 15.97 d) and to be able to determine the49y activity (TI/2 = 330 d), which was also present in the sample (produced via the52Cr(p,a)49y reaction), by a least-squares fitting of the complex decay curve. The curve isplotted in Fig. 3.32. The activity of 49y at EOB was 7 % of the total activity. The 48yphotopeak count rate was now used to determine the detector efficiency according to (3.9).Thereafter, all 49y samples were measured relative to this standard.
Tab.3.7 X-ray energy and emission probability of the investigated nuclides. 48V was needed for the Si(Li)calibration [Fir 96].
1,)8,,\<'2),<.<i~!ti~fit 1~J3gS~I'YiL!I;U.\~ H':<·;·, ;;
55Pe MnK" 5.89 0.249(9)
MnK~ 6.49 0.034(1)
48y TiK" 4.51 0.0843(17)
TiK~ 4.93 0.0094(5)
49y TiK" 4.51 0.171(9)
TiK~ 4.93 0.0191(9)
70 Activation Cross Sections and Isomeric Cross Section Ratios ...
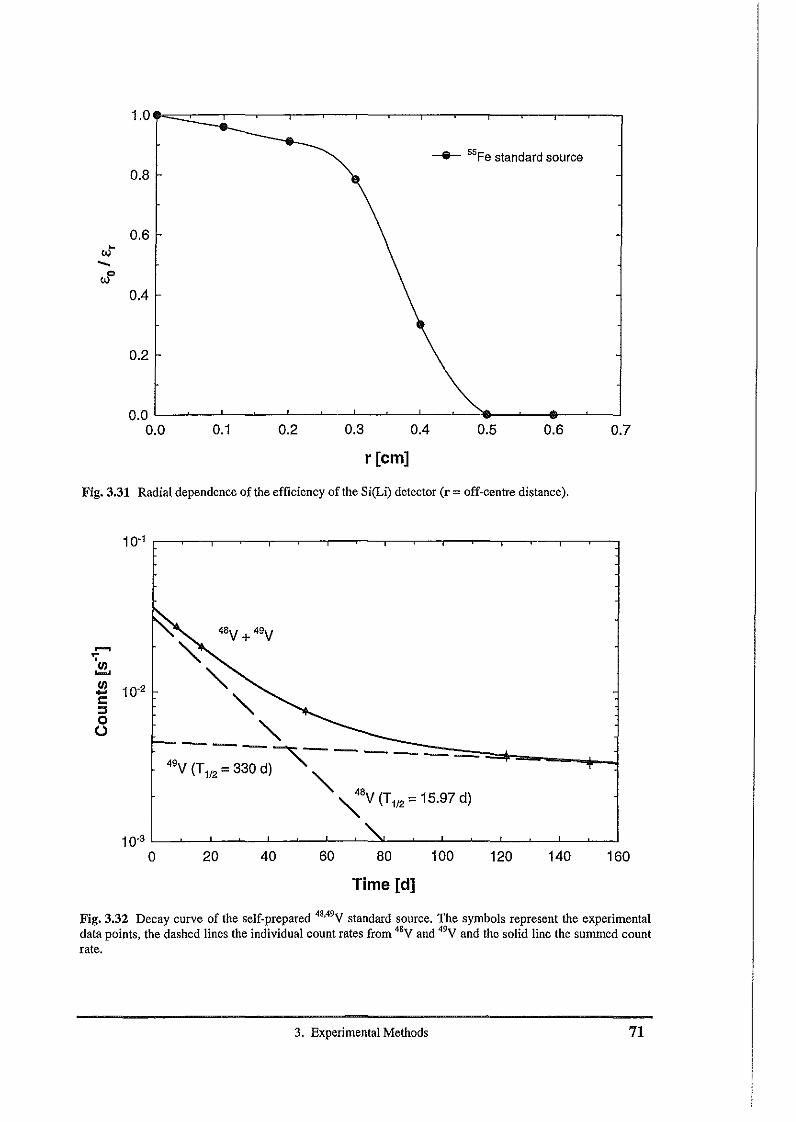
-- 5SFe standardsource0.8
0.6
0.4
0.2
0.70.60.50.40.30.20.10.0 L-~_-L-~_--'---~~--'-_~----'-_~4~~~.-~-----.J
0.0
r [em]
Fig. 3.31 Radial dependence of the efficiency of the Si(Li) detector (r = off-centre distance).
48V + 49V
~-,
-,-,
49 - - - ~- - --=::-:::=-=-==+-=----....JV (TV2 = 330 d) <,
" 48'" V (T1/2 = 15.97 d)
16014012010060402010'3 L-~_L--~_L--~_L--~---""--~_L--~_..L.....~_..L-~--.J
o
Fig. 3.32 Decay curve of the self-prepared 48,4,y standard source. The symbols represent the experimentaldata points, the dashed lines the individual count rates from 48y and "Y and the solid line the summed countrate.
3. Experimental Methods 71
3.6 Data Processing
3.6.1 Experimental Cross Sections
The activity of the reaction products was calculated from the net count rate under thephotopeak determined by gamma- or X-ray spectrometry. Substituting the activity A andthe number of target atoms N in (1.7) by
A = (-AI ) GjGz .. • GilPyEph l-e m
and
N =_m_·_a_·_N~A,,-
M
leads to an expression for the cross section
(3.25)
(3.26)
(3.27)
where ill is the sample mass, M the molar mass, a the isotopic abundance of the targetnuclide, NA the Avogadro Number, tm the measuring time and c, =cgas, Clow, Cnw<, Ccoin,
csca,) . Corrections for the gamma-ray self-absorption T(x) and for the flux gradient in thesample Cgrad are included in the term Cvol (see section 3.3.3). The term cgas disappears in
the case of a solid target.To avoid the determination of the absolute neutron flux, finally all cross section values
were obtained relative to the standard cross sections of the reactions 27AI(n,p/7Mg,27A1(n,a)24Na, 56pe(n,pi 6Mn and 93Nb(n,2n)92ffiNb (all taken from [Koc 93], see section
1.4.2). Using (3.26) for the sample and the reference reaction and forming the ratio leadsto the following expression for the cross section
N pre: rarM (1- e-.1,rl j) e-.1,rlc A(1- e-.1,rlm ) C~aln c,
rphyph m j(J' =(J' -- •»: Mr (1 -J.t.) -?tc 1 r (1 -?t) n rph PySph m a - e 'e fl, - e m Cval . Cj,
(3.28)
72 Activation Cross Sections and Isomeric Cross Section Ratios ...
where the index r denotes the variables for the reference reaction. In cases where two or
more reference reactions were used the weighted mean m" of the individual results XI was
calculated. It is given by
Il (x )2:-fm-«; J (3.29)
2: 2;=1 s;
and
[ ( )T12
funw Il 1-=2:- (3.30)m" ;=1 s;
where 81 denotes the standard deviation of Xi. Tab. 3.8 gives the neutron fluence obtainedvia three different reference reactions for the irradiation of natCr foils at Gee! 1. The
agreement between the individual results is in the order of 5 %. If some cross sectionmeasurements at a given neutron energy were repeated several times the cross section is
given as a weighted mean.When two different reactions produce the same activity in one sample, e. g. the active
product 52V in the reactions 53Cr(n,np) and 52Cr(n~p) while using natural chromium
samples, the cross sections for those reactions were deduced in the following way. Two
irradiations were performed with samples of different target constituents. For the abovementioned reaction an irradiation had to be performed with a chromium sample enriched
in 53Cr. The mean production rates PR1 and PR2 of the activities in the two samples are
(3.31)
(3.32)
Solving these equations leads to the cross sections 0"1 and 0"2
(3.33)
(3.34)
where
Nn is the number of target nuclei for the reaction I in the sample I,
N12 is the number of target nuclei for the reaction I in the sample 2,
3. Experimental Methods 73
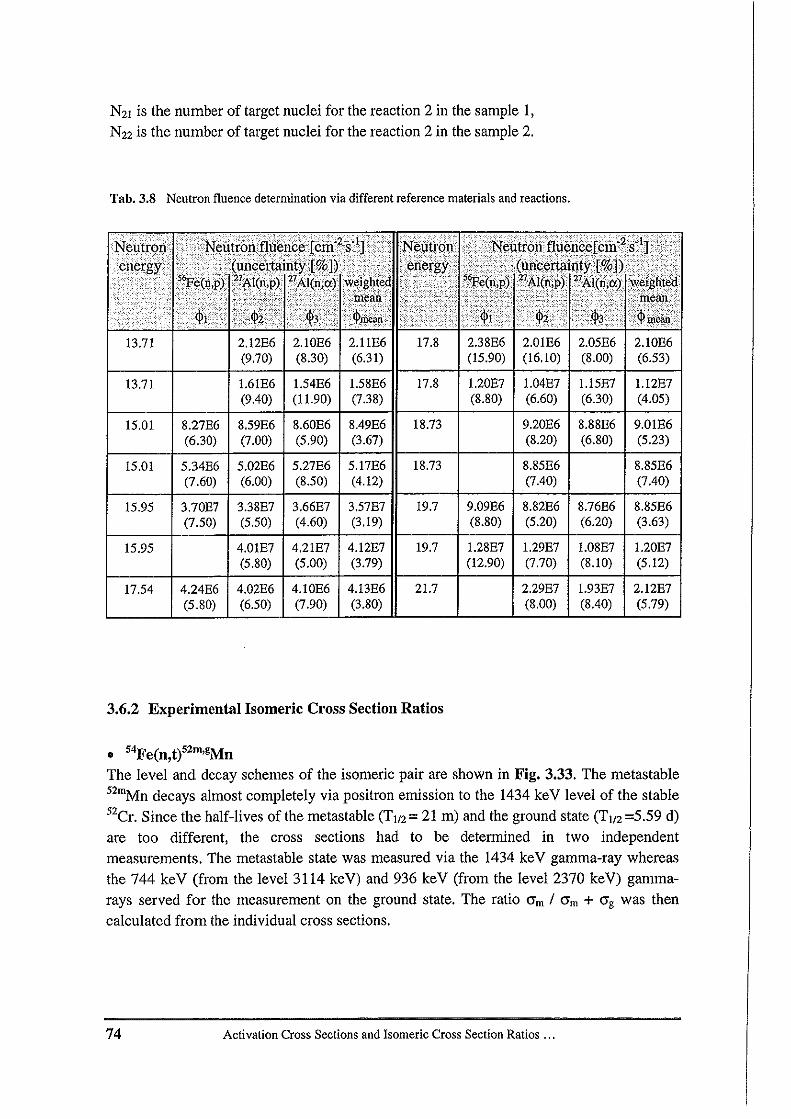
N21is the number of target nuclei for the reaction 2 in the sample I,N22 is the number of target nuclei for the reaction 2 in the sample 2.
Tab. 3.8 Neutron fluence determination via different reference materials and reactions .
. "1_ ,: -.' ' ' "
-', "', >;;~: ":
2.IOE6(8.30)
2.11E6(6.31)
"'/, ,','
17.8
.,',
2.38E6(15.90)
,{'I,\
I, ,:r",
2.OlE6(16.10)
27.
I' ".~ .., _:"0
2.05E6(8.00)
2.IOE6(6.53)
13.71
15.01
15.Q1
15.95
15.95
17.54
8.27E6(6.30)
5.34E6(7.60)
3.70E7(7.50)
4.24E6(5.80)
1.6lE6(9.40)
8.59E6(7.00)
5.02E6(6.00)
3.38E7(5.50)
4.01E7(5.80)
4.02E6(6.50)
1.54E6(11.90)
8.60E6(5.90)
5.27E6(8.50)
3.66E7(4.60)
4.21E7(5.00)
4.IOE6(7.90)
1.58E6(7.38)
8.49E6(3.67)
5.17E6(4.12)
3.57E7(3.19)
4.12E7(3.79)
4.13E6(3.80)
17.8
18.73
18.73
19.7
19.7
21.7
1.20E7(8.80)
9.09E6(8.80)
1.28E7(12.90)
1.04E7(6.60)
9.20E6(8.20)
8.85E6(7.40)
8.82E6(5.20)
1.29E7(7.70)
2.29E7(8.00)
l.15E7(6.30)
8.88E6(6.80)
8.76E6(6.20)
1.08E7(8.10)
1.93E7(8.40)
l.12E7(4.05)
9.0lE6(5.23)
8.85E6(7.40)
8.85E6(3.63)
1.20E7(5.12)
2.12E7(5.79)
3.6.2 Experimental Isomeric Cross Section Ratios
• 54Fe(n,t)52m,gMn
The level and decay schemes of the isomeric pair are shown in Fig. 3.33. The metastable52mMn decays almost completely via positron emission to the 1434 keV level of the stable52Cr. Since the half-lives of the metastable (T1I2= 21 m) and the ground state (Tt/2=5.59 d)are too different, the cross sections had to be determined in two independentmeasurements. The metastable state was measured via the 1434 keY gamma-ray whereasthe 744 keY (from the level 3114 keY) and 936 keY (from the level 2370 keY) gammarays served for the measurement on the ground state. The ratio crm I crm + crg was thencalculated from the individual cross sections.
74 Activation Cross Sections and Isomeric Cross Section Ratios ...
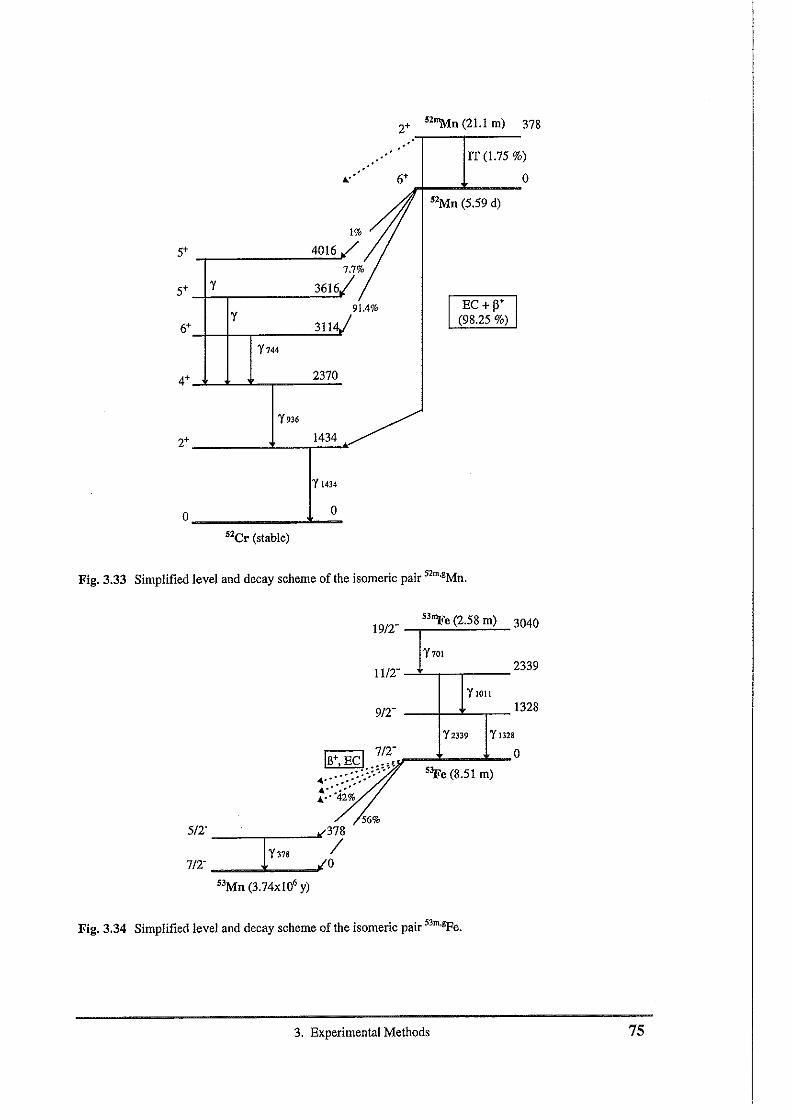
2+ 52"Mn (21.1 m) 378
.'... .'
IT (1.75 %)
6+,.1-_-2,-__0
5+
5+ 1
16+
1744
4+
4016
3616
311
2370
91.4%
52Mn(5.59 d)
193'1434
y 1434
oO *--.;..
52Cr (stable)
Fig. 3.33 Simplified level and decay scheme of the isomeric pair 52m,gMn.
""'Fe (2.58 m) 3040
't 701
lilT ----"'---1-,---- 2339
1'1011
91T _-4----'"--...,-_1328
'Y 2339
"Fe (8.51 m)
56%
5/2' --- ~30/
7/2' __.....;11 378 !"Mn (3.74xIO' y)
Fig. 3.34 Simplified level and decay scheme of the isomeric pair 53m·gPe.
3. Experimental Methods 75
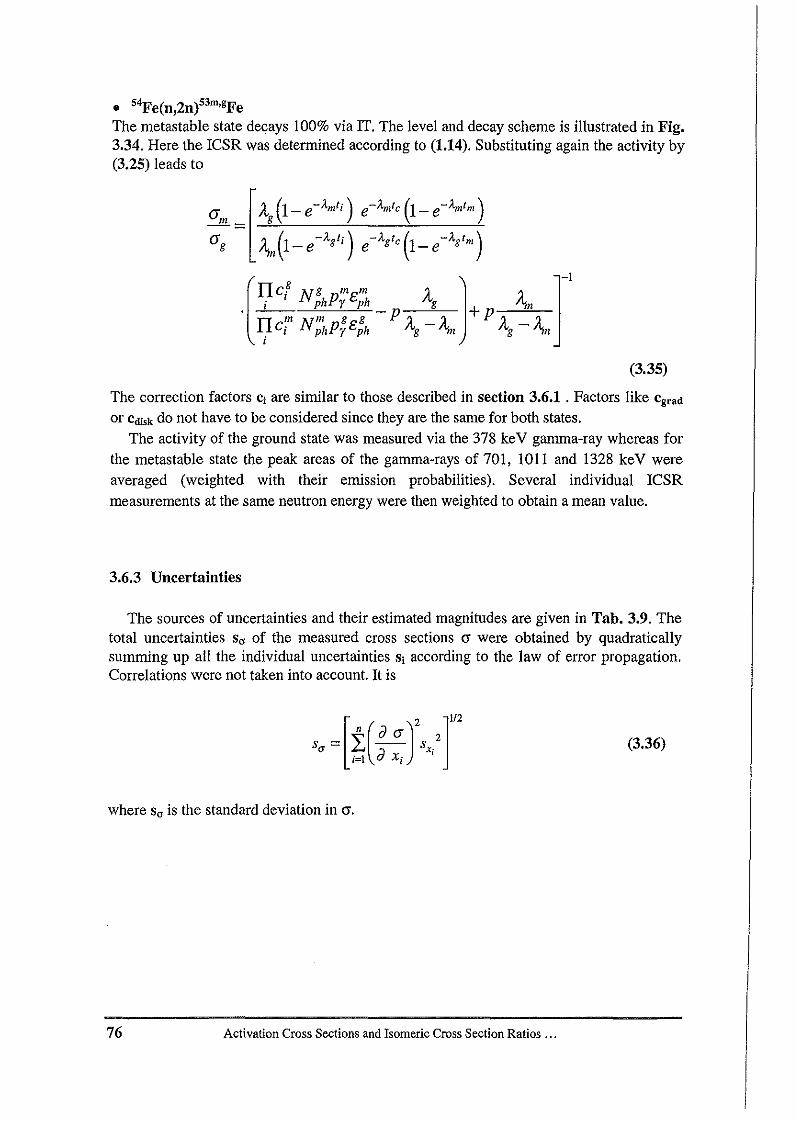
• 54Fe(n,2n)53m,gFeThe metastable state decays 100% via IT. The level and decay scheme is illustrated in Fig.3.34. Here the ICSR was determined according to (1.14). Substituting again the activity by(3.25) leads to
(3.35)
The correction factors Ci are similar to those described in section 3.6.1 . Factors like Cgrad
or Cdisk do not have to be considered since they are the same for both states.The activity of the ground state was measured via the 378 keV gamma-ray whereas for
the metastable state the peak areas of the gamma-rays of 701, 1011 and 1328 keY wereaveraged (weighted with their emission probabilities). Several individual ICSRmeasurements at the same neutron energy were then weighted to obtain a mean value.
3.6.3 Uncertainties
The sources of uncertainties and their estimated magnitudes are given in Tab. 3.9. Thetotal uncertainties SC5 of the measured cross sections 0' were obtained by quadraticallysumming up all the individual uncertainties SI according to the law of error propagation,Correlations were not taken into account. It is
(3.36)
where SC5 is the standard deviation in 0',
76 Activation Cross Sections and Isomeric Cross Section Ratios i..
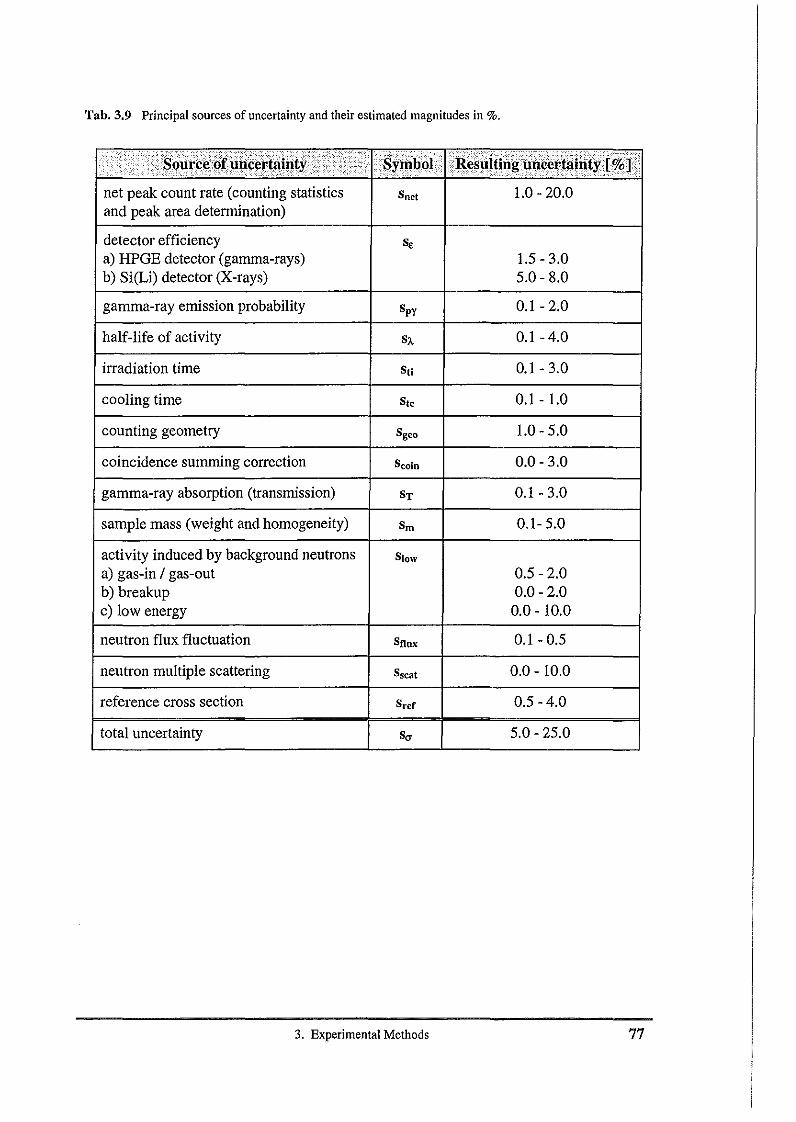
Tab. 3.9 Principal sources of uncertainty and their estimated magnitudes in %.
•Ti'r;···· .... };:;•. r.,.·•• ·'''i····;}·}<··'~tf~;2;·;i:·~·j '\"\;; :·i~~!~i*~!iffi~~~·~l~t~e~]iS...... ?"-net peak count rate (counting statistics Snct 1.0 - 20.0and peak area determination)
detector efficiency Se
a) HPGE detector (gamma-rays) 1.5 - 3.0b) Si(Li) detector (X-rays) 5.0 - 8.0
gamma-ray emission probability Spy 0.1 - 2.0
half-life of activity SA 0.1 -4.0
irradiation time Sn 0.1- 3.0
cooling time Stc 0.1 - 1.0
counting geometry Sgec 1.0 - 5.0
coincidence summing correction Seoin 0.0 - 3.0
gamma-ray absorption (transmission) ST 0.1 - 3.0
sample mass (weight and homogeneity) Sm 0.1- 5.0
activity induced by background neutrons Slow
a) gas-in / gas-out 0.5 - 2.0b) breakup 0.0 - 2.0c) low energy 0.0 - 10.0
neutron flux fluctuation Sflux 0.1 - 0.5
neutron multiple scattering Sscat 0.0 - 10.0
reference cross section Seef 0.5 - 4.0
total uncertainty Sa 5.0 - 25.0
3. Experimental Methods 77
78 ActivationCross Sections and IsomericCross SectionRatios ...
f ; §t\t#t'@, if 1
4. Nuclear Model Calculations
4.1 Introduction
Neutron cross section calculations started to play an important role in the dataevaluation process from the beginning of the eighties, a progress which was favoured byachievements in the seventies regarding the use of nuclear models and related computercodes. Since neutron, charged-particle and gamma-ray emission cross sections (as afunction of energy and angle) are important for many applications, extensive efforts havebeen devoted to reproduce the rather scarce experimental data and to use realistic modelsto provide reliable interpolation and extrapolation to other energy and angular regionswhere no data are available. The main improvements in the calculational methodsconsisted of
• a unified description of the 12re-"quilibrium (PE) and equilibrium processes or, at least,a unitary use of the common parameters for both reaction mechanisms,
• the use of consistent input parameters, determined or validated by means of variousindependent experimental data, and
• a unitary account of a whole body of related data for an isotope chain or neighbouringelements (e. g. [Avr 87b, Avr 88a, Avr 90].
Examples of model codes of this type, i. e. Hauser-Eeshbach (HF) codes withprecompound option, are GNASH [You 77], GRAPE [Gru 85], MAURINA [Uhl,unpublished], SINCROS-II [Yam 90], STAPRE [Uhl 76], STAPRE-H [Avr 87b] andTNG [ Fu 80, SH 86].
In the present work, the STAPRE-H code was used to perform a comprehensive set ofnuclear model calcuiations for neutron activation reactions on Cr, Fe and Ni, guided by thedetermined experimental data. The aim was to achieve a better understanding of nuclearmodels for this particular mass range (A - 50) and type of reactions and therefore toimprove the reliability of extrapolations based on these models. As an example, excitationcurves will be given for two reactions on an unstable nucleus, namely the 51Cr(n,pi1yand 51Cr(n,np)50y reactions, calculated with parameters established by the goodreproduction of 8 reactions on different stable Cr-isotopes, This is a so-called "blind"calculation since no experimental data of any type can be measured and thus a parameteradjustment is not possible.
4. Nuclear Model Calculation 79
4.2 The Code STAPRE·H
4.2.1 General Remarks
STAPRE-H [Avr 87a] is an extension of the computer code STAPRE [UhI76] which isdesigned to calculate energy-averaged cross sections for particle-induced nuclear reactionswith several emitted particles and gamma-rays under the assumption of sequentialevaporation, Both codes are written in FORTRAN and are available from the NEA DataBank'". The original STAPRE code takes into accounto equilibration of the compound system formed in the first stage of a reaction by means
of the particle precompound emission !<xciton model (EM) [Gri 66, Cli 71, Bra 72, Kal75],
o statistical de-excitation in the frame of the Hauser-Eeshbach-Moldauer (HFM) modelwith consideration of angular momentum and parity conservation [Hau 52, Mol 64],
o intermediary gamma-ray cascades,o fission mechanism.
The extensions in STAPRE-H are mainlyo calculation of particle transmission coefficients by means of the spherical optical model
code SCAT 2 [Ber 81] as a subroutine,o inclusion of the pre-equilibrium emission geometry-dependent hybrid (GDH) model
code HYBRID [B1a 73] as a subroutine with a version including the angularmomentum, parity conservation and alpha-particle emission,
o computation of the nuclear level densities taking into account the analytical formulas ofIgnatyuk et al. [Ign 75] and Schmidt et al. [Sch 82b] for higher excitation energies withan interpolation range between them and the !2ack-§.hifted Eermi-gas (BSFG) model[Lan 66, Von 69, Dil 73] which is used at medium excitation energies,
o inclusion of the energy-dependent Breit-Wigner model (EDBW) [Gar 79, Gar 81] forthe electric dipole gamma-ray strength function evaluation.
For a specified sequence of emitted particles the following quantities can be obtained forall nuclei involved in the cascadec activation cross sections,o population of isomeric states,o production cross sections for gamma-rays from low excited levels,o energy spectra for all emitted particles,o gamma-ray production spectra.
16 NuclearEnergy Agency, Issy-lesMoulineaux, France
80 Activation Cross Sections and Isomeric Cross Section Ratios ...
In the following the main steps of the nuclear model calculations done by STAPRE /STAPRE-H are briefly described (for a complete description of STAPRE see [UhI76, Uhl81] and STAPRE-H see [Avr 87a, Avr 88b, Avr 88c, Avr 95a]). Thereafter some aspectsof the treatment of PE emission and the calculation of level densities by differentapproaches are outlined.
4.2.2 Formalism and Program Flow
The different ways of populating a particular state of a final nucleus in a particleinduced nuclear reaction are illustrated in Fig. 4.1. In the first step of a nuclear reaction theincident particle '1r1l, and the target nucleus T are assumed to form a composite system,formally called first compound nucleus (I" CN) even if not yet in the equilibrium stage.Emission of the (i - 1) particle of a specified sequence (7t!> 7tz, 7t3, ...) is regarded as leadingto the population of the i lh CN (i ;::: 2). The de-excitation of each CN can proceed throughemission of particles (n, p, a, d) and gamma-rays or by fission.
In the first step of the evaporation cascade pre-equilibrium particle emission is takeninto account in the frame of either the EM, the GDH model or the modified GDH modelincluding angular momentum and parity conservation. The results of this calculation areo the PE emission differential cross sections which finally contribute to the particle
production spectra calculationo the PE contribution to the initial population of the 2nd CN (if the modified GDH model
including angular momentum and parity conservation is used)o the fraction of the 1st CN initial population surviving PE emission.
For that fraction of the population of the composite system that survives PE decay thewell-known Hauser Eeshbach-Moldauer (HFM) formula is applied.
(HFM)( ,_~. (). Te Te, . ( ). ( )(Jee' E,J,nj- kZ g J Nj(E,J,n) Sec' E,J,n Pc' E,J,n (4.1)
where k is the wave number of the relative motion, g(J) is a statistical factor, T, and Te,
the transmission coefficients for the entrance and outgoing particle channels, Sec' is thewidth fluctuation correction and pc' the level density of the residual nucleus. The HFdenominator N1 consists of the sums of the transmission coefficients for all open channelsconsistent with angular momentum and parity selection rules
Nj(E, J,n) =IJe =Ntrt(E, r.rn- Nl(E, J,n)+ Nt (E, J,n) (4.2)e
4. Nuclear Model Calculation 81
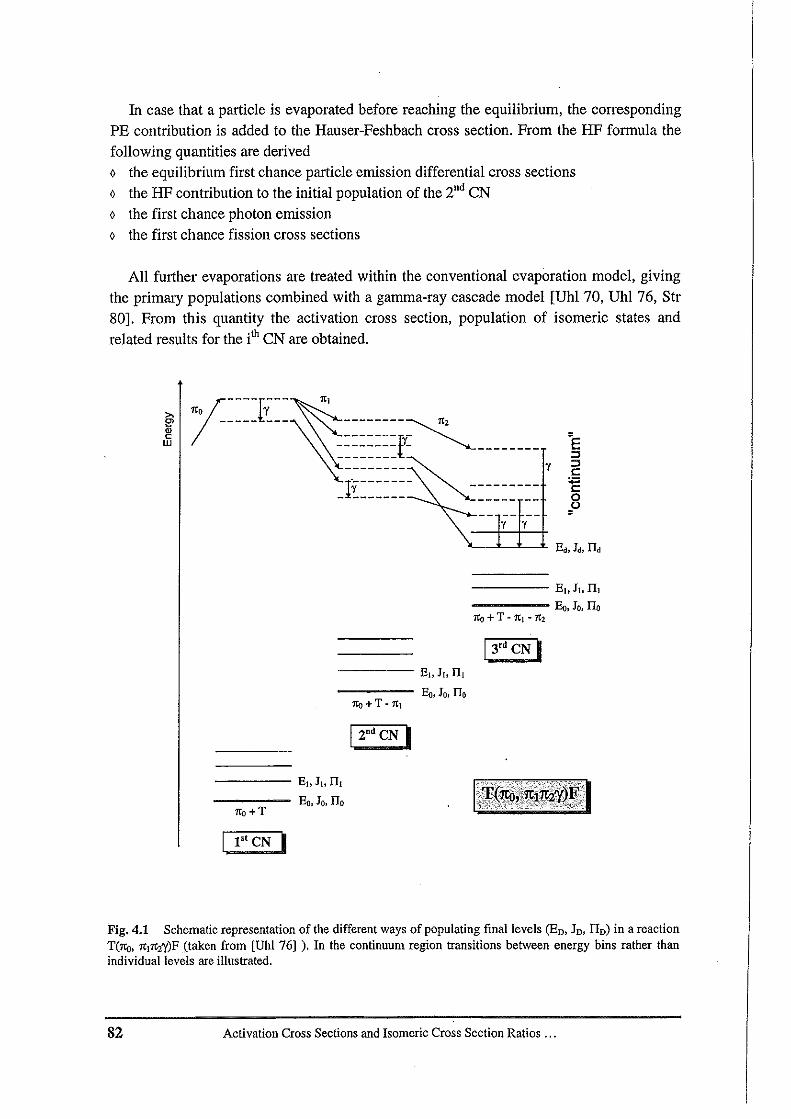
In case that a particle is evaporated before reaching the equilibrium, the correspondingPE contribution is added to the Hauser-Feshbach cross section. From the HF formula thefollowing quantities are derivedo the equilibrium first chance particle emission differential cross sectionso the HF contribution to the initial population of the 2nd CNo the first chance photon emissiono the first chance fission cross sections
All further evaporations are treated within the conventional evaporation model, givingthe primary populations combined with a gamma-ray cascade model [Uhl 70, Uhl 76, Str80]. From this quantity the activation cross section, population of isomeric states andrelated results for the i'hCN are obtained.
1_~~~~r{~ ~~nl ~
--------£1--------- - --------
--------~-------- 1
T1------- ----------*------- ------ --
1 1
----- Ell It. III
----- Eo. Jo, no
----- E,. JI> n,----- Eo. Jo, no
1l{)+T-n,
----- Eh JI. III
----- Eo. Jo• no
1" eN I
Fig. 4.1 Schematic representation of the different ways of populating final levels (En. In• nn) in a reactionT(no. n!'I<''Y)F (taken from [Uhl 761 ). In the continuum region transitions between energy bins rather thanindividual levels are illustrated.
82 Activation Cross Sections and Isomeric Cross Section Ratios ...
4.2.3 Pre-Equilibrium Emission (PE)
Since the basic work of Griffin [Gri 66] a variety of pre-equilibrium models have been
developed (see reviews [Bla 75, Gad 76, Dun 78]. The most widely used models are theintranuclear ,£ascade (INC) model, the Harp-Miller-Berne (HMB) model '[Har 68], the!<xciton model (EM) and the geometry-dependent hYbrid (GDH) model. These are all
semi-classical models which provide a simple means of calculating the energydistributions of the emerging particles, using parametrized expressions for the interaction
matrix. In more recent years fully quantum-mechanical theories have been developed thatprovide, at least in principle, a parameter free method of calculating the required cross
section [Tam 77, Tam 82, Fes 80, Fes 85]. The semi-classical models are conceptually
simpler, more flexible and the corresponding computer codes are generally much faster.Therefore, they have become the most popular PE models for applications in nuclear data
evaluation [Hod 88].In the following the basic features of the EM and GDH model, which are optionally
used in the STAPRE-H calculations, are briefly described.
• Exciton model (EM)The EM assumes that, after the initial interaction between the incident particle and the
target nucleus, the excited system can pass through a series of states of increasingcomplexity before equilibrium is reached, and emission of particles may occur from all
intermediate states. The different states of the system are classified according to the
number of particles p and holes h excited, called excitons n = p + h. The application of atwo-body interaction to states of a (p,h) configuration leads to states with (p+l, h+l), (p,h)
or (p-I, h-l) excited particle. For all these processes transition rates averaged over allstates of a configuration are employed. Let bk (n) =bk (p.h) be the population probability
of the states of a (p.h) configuration resulting from k internal transitions. Thecorresponding quantity bk+1(n) for k+1 internal transitions is obtained from
where
and
Ae(n) = If devAev(n,ev)v
(4.4)
(4.5)
A+(n), AO(n) and A-(n) are the internal average transition rates for n --+ n + 2 , n --+ nand
n --+ n • 2, respectively, and A'(n) represents the total rate for emission of particles. The
initial condition for solution of these equations is
4. Nuclear Model Calculation 83
(4.6)
where the initial particle number is Po = 2 and the initial hole number is ho = 1. The PEcontribution to the differential cross section is given by
(4.7)
where O'~~" represents the optical model absorption cross section for the projectile 1to andA.~I (n, £1) is the average rate for emission of a particle 1t1 with energy of relative motion
£1.
The internal transition rates are calculated using Fermi's "Golden Rule";
(4.8)
where IMI2 is the averaged squared matrix element for two-body interactions betweenspecific initial and final states (parametrized according to the Kalbach systematics [Kal85]) and Y is an expression for the accessible phase-space for the transition. IMI2 isdependent on the mass number A and the excitation energy E through the expression
(4.9)
proposed by Kalbach-Cline [Kal 73]. A way to calculate values for the parameter C will begiven later in section 4.3 (page 88, eq. 4.23). To calculate the accessible phase-space, theequidistant single-particle state density expression of Williams [Wil71] is used as follows:
( ),,- 1
)g" E-Ap.1I
(J),,(p,h,E = Ih l( -1)'p . . n .(4.10)
where Ap,h is a factor which restricts the number of allowed states due to the Pauliexclusion principle and g is obtained from the level density parameter a by the relationg =6a/~.
84 Activation Cross Sections and Isomeric Cross Section Ratios ...
• Geometry-dependent hybrid (GDH) modelThe hybrid model PE cross section is calculated from the expression
acr:" (e) d =cr"OlP(e) de=cr"Ol ±[x O)ll(p,h,U,e)] de [ "'c(e) ] Dde I'. x x X 1l=1l0 1l,X O)ll(p,h,E) "'c(e) +"'+(1'.) 1l
AII=+2
(4.11)
Px(e)de describes the number of particles of the type x emitted into the unboundcontinuum with channel energy between I'. and e+de, no is the initial exciton number andIi the equilibrium exciton number. The quantity in the first set of brackets describes thefraction of the n exciton state population such that one of the excitons is in an unboundlevel with the energy within de around 1'., while the remaining p-I particles and h holesshare the residual energy U.
U = E-Bx-e (4.12)
where E is the composite excitation energy and Bx the particle binding energy, Xn,x
denotes the number of all particles of type x in an n exciton state. The second set ofbrackets represents the fraction of the x type particles at energy I'. which should undergoemission into the continuum rather than making an intranuclear transition, Dn representsthe fraction of the initial population which has survived to an n exciton state (also calleddepletion factor), The main quantity entering (4.11) is the single-particle state densityco.(p,h,E) which is calculated according to (4.10), The quantity co.(p,h,U,e) is calculatedin a similar way (replacing n by n+l and E by U in (4.10», The continuum transition ratesAc(e) are calculated with the expression
(4.13)
where Sx is the spin of the nucleon of type x, Jl is the reduced mass in the emergentchannel, cr~v is the inverse reaction cross section and gx the single-particle level density,
The intranuclear transition rates "'+(1'.) can be derived by the equation
(4.14)
where Vre•1 is the real potential, p the nuclear matter density, (o (E» the average effectivenucleon-nucleon scattering cross section and m, the nucleon mass, In (4.14) lies one of theimportant differences between hybrid model and EM since the transition rate "'+(1'.) is a
4. Nuclear Model Calculation 85
function of e referring to the individual particle rather than to the nuclear system as awhole as in the EM.
Comparisons between experimental results, EM and INC calculations [Har 71] showedthat the EM model gave too few PE particles and that these were too soft in spectraldistribution for the expected initial exciton configurations. The INC results indicated thatthe exciton model deficiency resulted from a failure in reproducing properly the enhancedemission from the nuclear surface. The GDH model considers the diffuse surfaceproperties. Here the emission cross section is calculated by the function
(4.15)
where A is the reduced de Broglie wavelength, l is the orbital angular momentum in unitsof Ii and T1 is the transmission coefficient for the ltb partial wave.
4.2.4 Level Densities
The excited states of all nuclei relevant for a particular reaction are described by meansof a level density formula. At low excitation energy, where the experimental informationon the quantum numbers Ej, Ji and IIi (i = 1, ..., d) of the "discrete levels" is complete, the
level density reads
P (E,J,II) =La (E-E,) 0ll,Onn,i
(4.16)
where E represents the excitation energy, J the angular momentum and II the parity. Atmedium excitation energy (E :s; 10 MeV), where the information on discrete levels is notcomplete ("continuum region"), the level density is calculated by means of the empirical!2ack-§.hifted-Eermi gas (BSFG) model. The energy and spin-dependent level density at anexcitation energy E is thus given by
21+1 [ (J+05)2]P (E,J)=~(j (E) exp - 2 2
81r(j' a
and the total state density ro(E) has the form
(4.17)
(4.18)
86 Activation Cross Sections and Isomeric Cross Section Ratios ...
and the spin cut-off parameter 0' is given by
2 I (E_li)O.50'=-0 --1i2 eft a (4.19)
The parameters in the relations (4.18) and (4.19) are the so-called level density parameter
a which determines the energy dependence, the back-shift Ii which determines the zeropoint of the effective excitation energy, and the effective moment of inertia eefr whichdetermines the spin dependence of the nuclear level density. Usually eerr is expressed asthe rigid body moment of inertia erigid = 2/5 MR2
, with the nuclear radius R = 1.25 A II3•
The level density parameter a and the back-shift Ii can be determined by least-squaresfitting of discrete levels and s-wave neutron resonance spacings D obtained in the neutronenergy range ffi above the neutron binding energy Sn. Compilations of level densityparameters and back-shifts are given by Dilg et al. [Dil 73], Ivascu et al. [Iva 87] or
Avrigeanu et al. [Avr 95b].At higher excitation energies (~ 10 MeV) the strong shell effects observed for the a
values in the E< 10 MeV region gradually disappear. Therefore energy-dependent leveldensity parameters are needed to describe the vanishing shell effects with increasingenergy. Ignatyuk et al. [Ign 75] use the parametrization
(4.20)
where the high energy asymptotic value aLDM has the form
(4.21)
and 8W is an experimental shell correction. Microscopic calculations by Schmidt et al.[Sch 82b], including realistic single-particle levels, have confirmed the results obtainedwith the Ignatyuk formula. They used for the level density parameter an expression for aFermi gas with a diffuse surface
A( -113)a=14.61 1+4A F2 (4.22)
proposed by Toke and Swiatecki [Tok 81], where Fz is an expression for the surface areaof the nucleus.
4. Nuclear Model Calculation 87
4.3 Input Parameters
For calculations with STAPRE-H several parameters have to be supplied in an inputfile. These areo Optical modell2otential (OMP) parameterso PE parameter,o Reduction factor related to non-CN and non-PE reaction mechanismso Separation energies,o Discrete levels (energy, spin, parity, gamma-ray branching),o Level density parameter.The parameters used in the present calculations are given below.
• OMP'sBoth the HF theory and the EM require optical potentials to calculate transmissioncoefficients and inverse reaction cross sections. Before using an optical potential togenerate transmission coefficients and reaction cross sections, the potentials were checkedby comparing their predictions of nonelastic and total cross sections with experimentaldata, where available. The calculation of the transmission coefficients is done with thecode SCAT2 which is implemented as subroutine. The optical model parameters used aregiven in Tab. 4.1 - Tab 4.4. They are selected from a huge list included in the subroutineSYSPOT. Proton and alpha transmission coefficents for all investigated reactions werecalculated with the optical model potential of Arthur and Young [Art 80] and Avrigeanu etal. [Avr 94a], respectively. The neutron transmission coefficients were calculated withdifferent OMP's in order to reproduce the experimental data. For Cr the OMP of Ferrer etal. [Fer 77], modified by Uhl et al. [Uhl 92] gave best results whereas for Fe and Ni theOMP's of Arthur and Young [Art 80] and Ferrer et al. [Fer 77] were preferred.
• PE parameterThe only free parameter in the exciton model is the parameter C in (4.9), in the followingcalled PM. It was calculated according to Strohmaier [Str 82]:
(4.23)
where the single-particle state density was derived by g=6a1-w-, 'A+ is approximately5.1021S'I (with n = 3 , E - 21 MeV), found by extensive data analysis by Braga et al. [Brag72] and Gadioli et al. [Gad 75], 1'1 is 6.58·10'22 MeVs and C3,2 is 6.5. The parameter valuesfor a and !:J. are given in Tab. 4.5. The dependence of the FM parameter on the crosssection was tested by modifying its value by ±20 to ±30 %.
88 ActivationCrossSections andIsomericCross SectionRatios ...
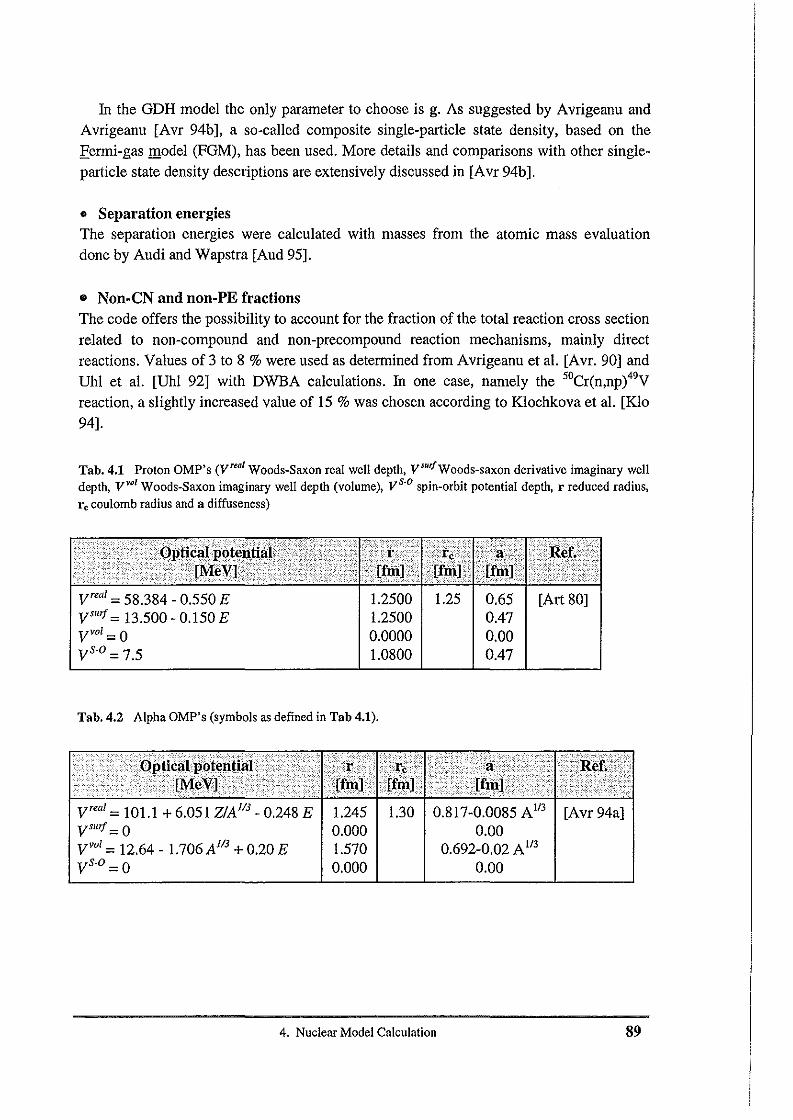
In the GDH model the only parameter to choose is g. As suggested by Avrigeanu andAvrigeanu [Avr 94b], a so-called composite single-particle state density, based on thefermi-gas model (FGM), has been used. More details and comparisons with other singleparticle state density descriptions are extensively discussed in [Avr 94b].
• Separation energiesThe separation energies were calculated with masses from the atomic mass evaluationdone by Audi and Wapstra [Aud 95].
• Non·CN and non-Pli fractionsThe code offers the possibility to account for the fraction of the total reaction cross sectionrelated to non-compound and non-precompound reaction mechanisms, mainly directreactions. Values of 3 to 8 % were used as determined from Avrigeanu et al. [Avr. 90] andUhl et al. [Uhl 92] with DWBA calculations. In one case, namely the 50Cr(n,np)49V
reaction, a slightly increased value of 15 % was chosen according to Klochkova et al. [Klo
94].
Tab.4.1 Proton OMP's (y"al Woods-Saxon real well depth, y'"'fWoods-saxon derivative imaginary welldepth, V'"~ Woods-Saxon imaginary well depth (volume), yS.o spin-orbit potential depth, r reduced radius,r, coulomb radius and a diffuseness)
vrea1= 58.384 - 0.550 EV'fIIf =13.500 - 0.150 EVyo1=0Vs.o = 7.5
1.2500 1.251.25000.00001.0800
0.650.470.000.47
[Art 80]
Tab. 4.2 Alpha OMP's (symbols as defined in Tab 4.1).
vrea1= lOLl + 6.051 Z/A113- 0.248 E
V'fIIf =0Vyo1= 12.64 - 1.706 Al13 + 0.20 EVs.o=O
1.2450.0001.5700.000
1.30 0.817-0.0085 A lI3 [Avr 94a]0.00
0.692-0.02 A1/3
0.00
4. Nuclear Model Calculation 89
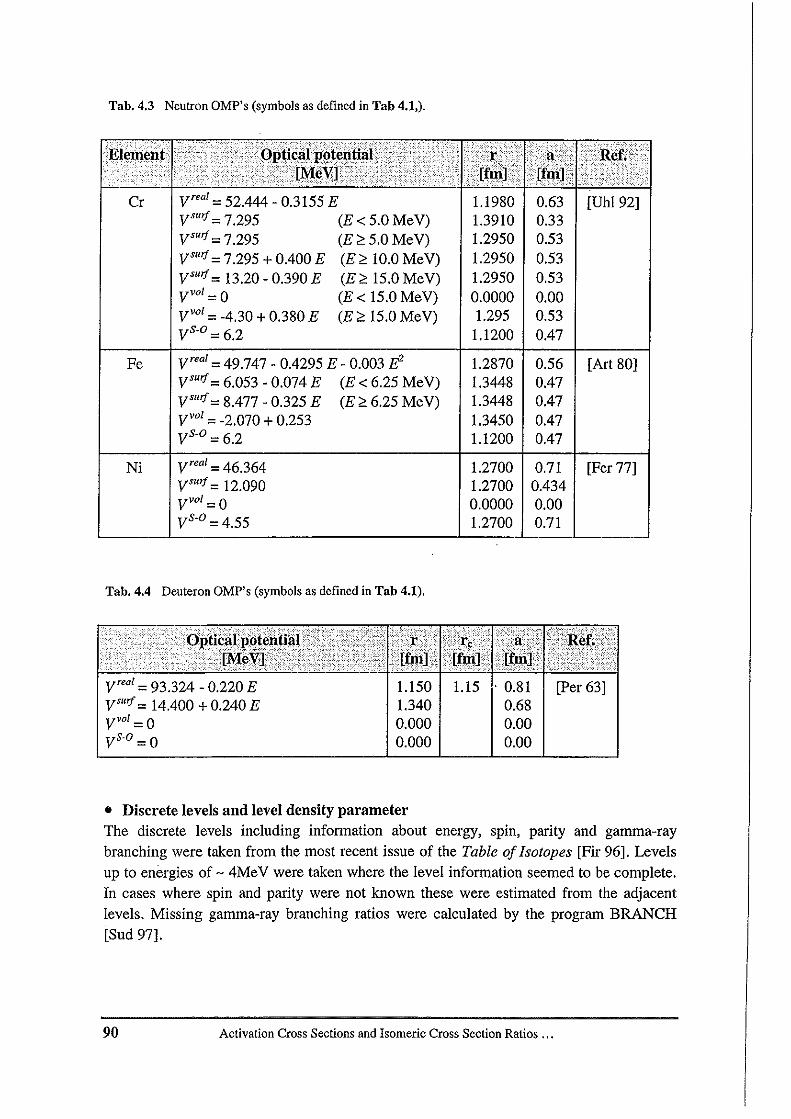
Tab.4.3 Neutron OMP's (symbols as defined in Tab 4.1,).
~.. ....;.. l!;epl' . '. ...· .•.····1 .. •·.·•··..·.< •• ·.. ., ..•.............•..
Cr Vreal = 52.444 - 0.3155 E
V suif = 7.295 (E < 5.0 MeV)V suif= 7.295 (E ~ 5.0 MeV)V suif = 7.295 + 0.400 E (E ~ 10.0 MeV)V suif = 13.20 - 0.390 E (E ~ 15.0 MeV)Vvol = 0 (E < 15.0 MeV)Vvol = -4.30 + 0.380 E (E ~ 15.0 MeV)V s.o=6.2
1.1980 0.631.3910 0.331.2950 0.531.2950 0.531.2950 0.530.0000 0.001.295 0.53
1.1200 0.47
" ' ..
[UhI92]
Fe
Ni
vreal = 49.747 - 0.4295 E - 0.003 IfV suif= 6.053 - 0.074 E (E < 6.25 MeV)V suif= 8.477 - 0.325 E (E ~ 6.25 MeV)V
vol = -2.070 + 0.253Vs.o = 6.2
Vreal = 46.364
Vsmf = 12.090
Vvol = 0
Vs.o = 4.55
1.28701.34481.34481.34501.1200
1.27001.27000.00001.2700
0.560.470.470.470.47
0.710.4340.000.71
[Art 80]
[Fer 77]
Tab.4.4 Deuteron OMP's (symbols as defined in Tab 4.1).
Vreal = 93.324 - 0.220 E
VSlIif = 14.400 + 0.240 EV vol = 0Vs.o = 0
1.1501.3400.0000.000
1.15 '0.810.680.000.00
[Per 63]
• Discrete levels and level density parameterThe discrete levels including information about energy, spin, parity and gamma-ray
branching were taken from the most recent issue of the Table of Isotopes [Fir 96]. Levelsup to energies of - 4MeV were taken where the level information seemed to be complete.ill cases where spin and parity were not known these were estimated from the adjacent
levels. Missing gamma-ray branching ratios were calculated by the program BRANCH[Sud 97].
90 Activation Cross Sections and Isomeric Cross Section Ratios ...
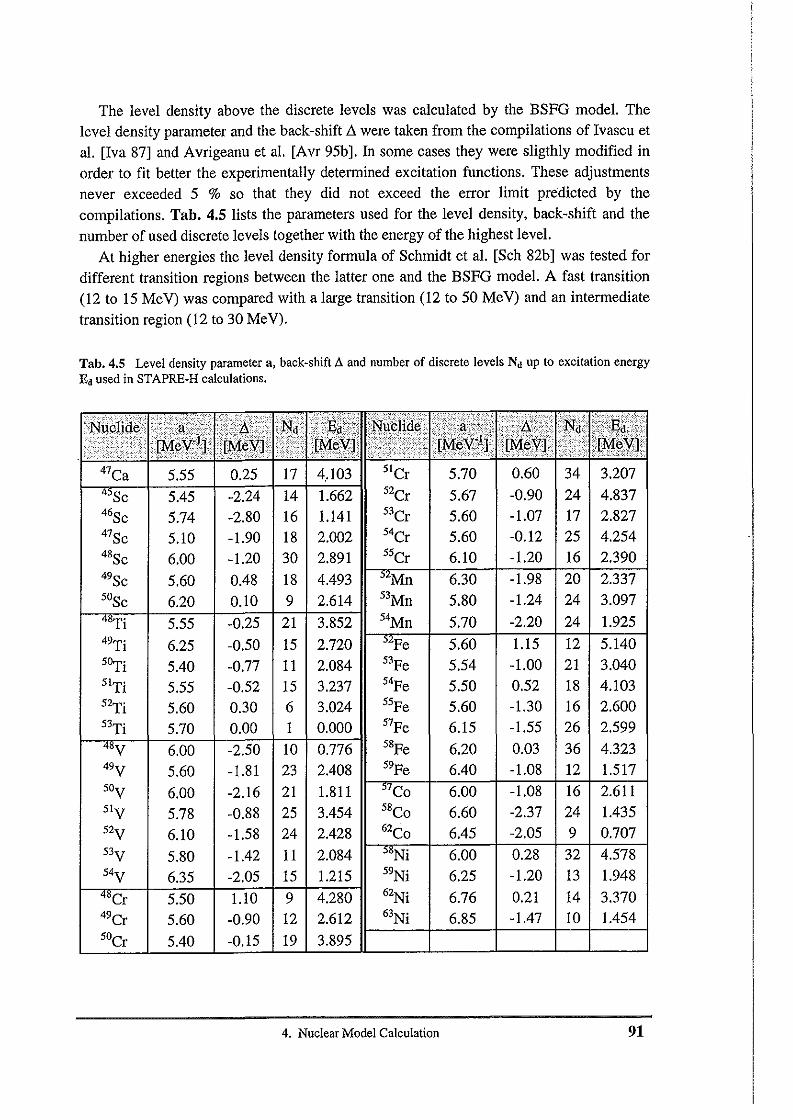
The level density above the discrete levels was calculated by the BSFG model. Thelevel density parameter and the back-shift 1l were taken from the compilations of Ivascu etal. [Iva 87] and Avrigeanu et al. [Avr 95b]. In some cases they were sligthly modified in
order to fit better the experimentally determined excitation functions. These adjustments
never exceeded 5 % so that they did not exceed the error limit predicted by thecompilations. Tab. 4.5 lists the parameters used for the level density, back-shift and the
number of used discrete levels together with the energy of the highest level.
At higher energies the level density formula of Schmidt et al. [Sch 82b] was tested for
different transition regions between the latter one and the BSFG model. A fast transition(12 to 15 MeY) was compared with a large transition (12 to 50 MeY) and an intermediate
transition region (12 to 30 MeV).
Tab. 4.5 Level density parameter a, back-shift 11 and number of discrete levels Nd up to excitation energyEdused in STAPRE-H calculations.
,,,:""Y~
.i1~~III:;:i~)II~llj;:Fe
~!!ffl! I~~;~~~I:~.: ...: :i.i!! .''.'.. H
47Ca 5.55 0.25 17 4.. 103 5tCr 5.70 0.60 34 3.207
"Sc 5.45 -2.24 14 1.662 52Cr 5.67 -0.90 24 4.83746Sc 5.74 -2.80 16 I.I41 53Cr 5.60 -1.07 17 2.82747SC 5.10 -1.90 18 2.002 54Cr 5.60 -0.12 25 4.25448SC 6.00 -1.20 30 2.891 55Cr 6.10 -1.20 16 2.39049SC 5.60 0.48 18 4.493 52Mn 6.30 -1.98 20 2.33750Sc 6.20 0.10 9 2.614 53Mn 5.80 -1.24 24 3.097
4"Ti 5.55 -0.25 21 3.852 54Mn 5.70 -2.20 24 1.92549Ti 6.25 -0.50 15 2.720 52Fe 5.60 1.15 12 5.1405ari 5.40 -0.77 11 2.084 53Fe 5.54 -1.00 21 3.0405lTi 5.55 -0.52 15 3.237 54Fe 5.50 0.52 18 4.1035~i 5.60 0.30 6 3.024 55Fe 5.60 -1.30 16 2.60053Ti 5.70 0.00 1 0.000 57Fe 6.15 -1.55 26 2.5994"y 6.00 -2.50 10 0.776 58Fe 6.20 0.03 36 4.32349y 5.60 -1.81 23 2.408 59Fe 6.40 -1.08 12 1.51750y 6.00 -2.16 21 1.811 57CO 6.00 -1.08 16 2.6115ly 5.78 -0.88 25 3.454 58CO 6.60 -2.37 24 1.43552y 6.10 -1.58 24 2.428 62CO 6.45 -2.05 9 0.70753y 5.80 -1.42 11 2.084 58Ni 6.00 0.28 32 4.57854y 6.35 -2.05 15 1.215 59Ni 6.25 -1.20 13 1.948
4"Cr 5.50 1.10 9 4.280 62Ni 6.76 0.21 14 3.37049Cr 5.60 -0.90 12 2.612 63Ni 6.85 -1.47 10 1.45450Cr 5.40 -0.15 19 3.895
4. Nuclear Model Calculation 91
92 Activation Cross Sectionsand IsomericCrossSection Ratios ...
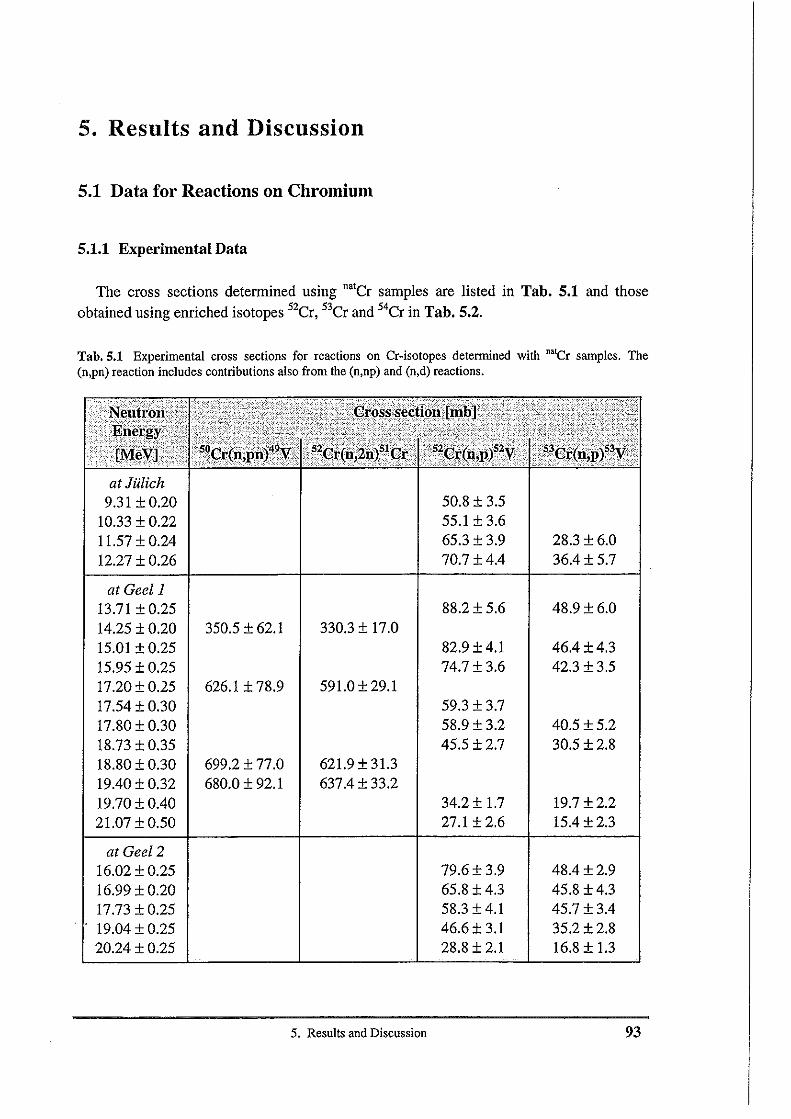
5. Results and Discussion
5.1 Data for Reactions on Chromium
5.1.1 Experimental Data
The cross sections determined using natCr samples are listed in Tab. 5.1 and thoseobtained using enriched isotopes 52Cr, 53Cr and 54Cr in Tab. 5.2.
Tab. 5.1 Experimental cross sections for reactions on Cr-isotopes determined with "atCr samples. The(n,pn) reaction includes contributions also from the (n.np) and (n.d) reactions.
! •.• :j;~.;.r~, ~.....,...
at Jillich.9.31 ± 0.20
10.33 ±0.2211.57 ± 0.2412.27 ± 0.26
50.8 ± 3.555.1 ± 3.665.3 ± 3.970.7 ± 4.4
28.3 ± 6.036.4± 5.7
at Geel l13.71 ± 0.2514.25 ± 0.2015.01 ± 0.2515.95 ± 0.2517.20±0.2517.54 ± 0.3017.80 ± 0.3018.73 ±0.3518.80 ± 0.3019.40 ± 0.3219.70 ± 0.4021.07 ± 0.50
at Geel216.02 ± 0.2516.99 ± 0.2017.73 ± 0.2519.04 ± 0.2520.24 ± 0.25
350.5 ± 62.1
626.1 ± 78.9
699.2 ± no680.0 ± 92.1
330.3 ± 17.0
591.0 ± 29.1
621.9 ± 31.3637.4 ± 33.2
5. Results and Discussion
88.2± 5.6
82.9 ± 4.174.7±3.6
59.3 ± 3.758.9 ± 3.245.5 ±2.7
34.2 ± 1.727.1 ± 2.6
79.6±3.965.8 ± 4.358.3 ± 4.146.6 ± 3.128.8 ± 2.1
48.9±6.0
46.4 ± 4.342.3 ± 3.5
40.5 ± 5.230.5 ± 2.8
19.7±2.215.4 ± 2.3
48.4 ±2.945.8 ± 4.345.7 ± 3.435.2±2.816.8 ± 1.3
93
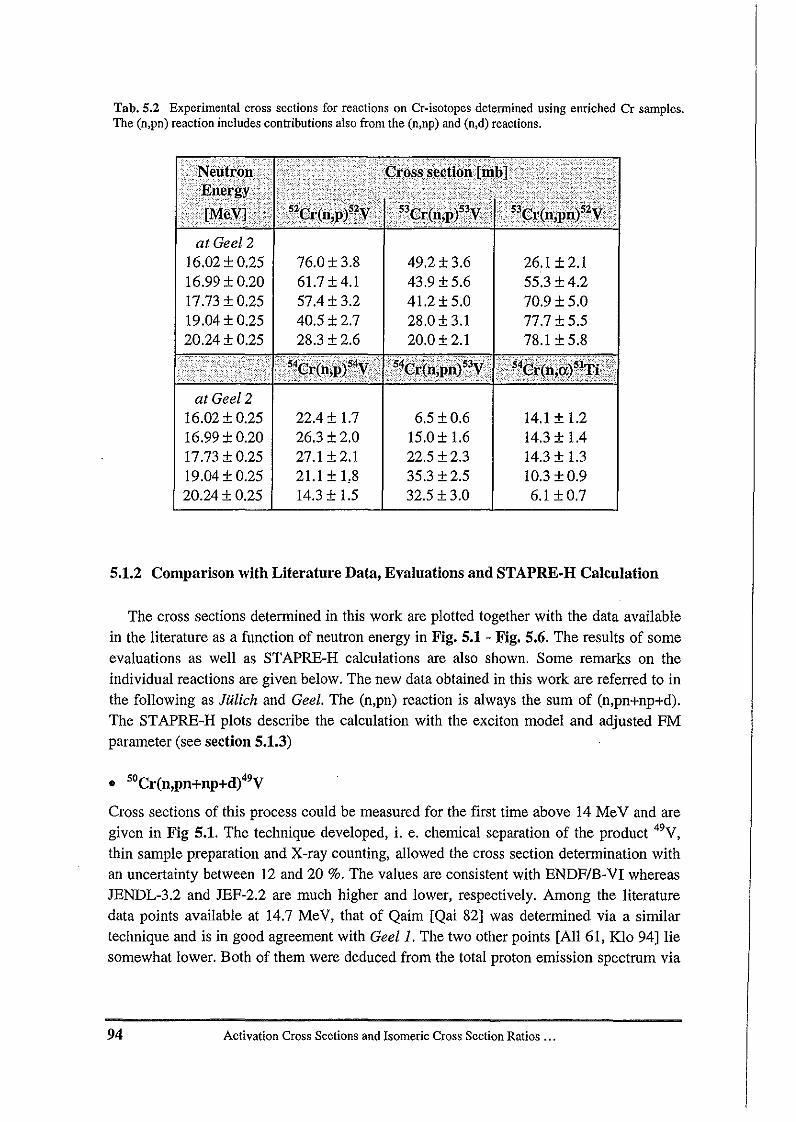
Tab. 5.2 Experimental cross sections for reactions on Cr-isotopes determined using enriched Cr samples.The (n.pn) reaction includes contributions also from the (n,np) and (n,d) reactions.
at Geel216.02 ±0.2516.99 ± 0.2017.73 ± 0.2519.04±0.2520,24±0.25
76.0±3.861.7 ± 4.157.4 ± 3.240.5±2.728.3 ± 2,6
49,2±3.643,9±5.641.2 ± 5.028.0 ± 3.120.0 ± 2.1
26.1 ± 2.155.3 ±4.270.9±5.077.7 ± 5.578.1 ± 5.8
at Geel216.02 ± 0.2516.99 ± 0.2017.73 ± 0.2519.04 ± 0.2520.24±0.25
22.4 ± 1.726.3 ±2.027.1 ±2.121.1 ± 1,814.3 ± 1.5
6.5 ±0.615.0 ± 1.622.5 ±2.335.3 ± 2.532,5 ±3.0
14.1 ± 1.214.3 ± 1.414.3 ± 1.310.3 ±0.96.1 ±0.7
5.1.2 Comparison with Literature Data, Evaluations and STAPRE·H Calculation
The cross sections determined in this work are plotted together with the data availablein the literature as a function of neutron energy in Fig. 5.1 - Fig. 5.6. The results of someevaluations as well as STAPRE-H calculations are also shown, Some remarks on theindividual reactions are given below. The new data obtained in this work are referred to inthe following as Jultcti and Geel. The (n,pn) reaction is always the sum of (n.pn-i-np--d).The STAPRE-H plots describe the calculation with the exciton model and adjusted FMparameter (see section 5.1.3)
• 50Cr(n,pn+np+d)49V
Cross sections of this process could be measured for the first time above 14 MeV and aregiven in Fig 5.1. The technique developed, i. e. chemical separation of the product 49V,thin sample preparation and X-ray counting, allowed the cross section determination withan uncertainty between 12 and 20 %. The values are consistent with ENDFIB-VI whereasJENDL-3.2 and JEF-2.2 are much higher and lower, respectively. Among the literaturedata points available at 14.7 MeV, that of Qaim [Qai 82] was determined via a similartechnique and is in good agreement with Geeli. The two other points [All 61, KIo 94] liesomewhat lower. Both of them were deduced from the total proton emission spectrum via
94 Activation Cross Sections and Isomeric Cross Section Ratios ...
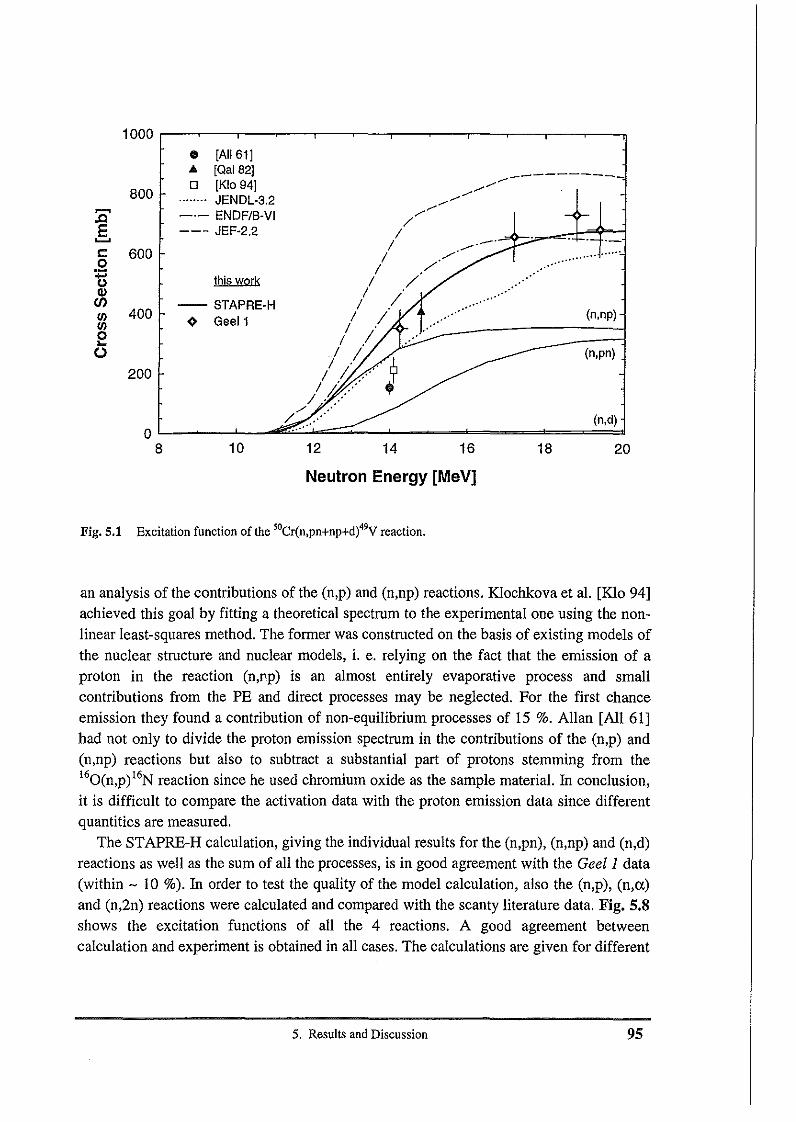
(n,d)
(n,np)
(n.pn)
.. '-
................... '.'
,",.'.. ,
.'.'
/.,.,.--------------------------//
// »>:
/ -:/ /
/ .// .I
/ // //;' .'/ i./
/ ..'/ ..-
/ .
1000
• [All 61]A [Qai 82J0 [Klo 94]
800 ........ JENDL-S.2
J:i" _.- ENDFIB-VIE --- JEF-2.2~
s::: 6000
~ this workQl
en -- STAPRE-HIII 400 ¢ GeellIII0...o
200
10 12 14 16 18 20
Neutron Energy [MeV]
Fig. 5.1 Excitation function of the sOCr(n,pn+np+d)49V reaction.
an analysis of the contributions of the (n,p) and (n,np) reactions. Klochkova et al. [Klo 94]achieved this goal by fitting a theoretical spectrum to the experimental one using the nonlinear least-squares method. The former was constructed on the basis of existing models ofthe nuclear structure and nuclear models, i. e. relying on the fact that the emission of aproton in the reaction (n.np) is an almost entirely evaporative process and smallcontributions from the PE and direct processes may be neglected. For the first chanceemission they found a contribution of non-equilibrium processes of 15 %. Allan [All 61]had not only to divide the proton emission spectrum in the contributions of the (n.p) and(n.np) reactions but also to subtract a substantial part of protons stemming from thet60(n,p)I6N reaction since he used chromium oxide as the sample material. In conclusion,it is difficult to compare the activation data with the proton emission data since differentquantities are measured.
The STAPRE-H calculation, giving the individual results for the (n,pn), (n,np) and (n,d)reactions as well as the sum of all the processes, is in good agreement with the Geell data(within - 10 %). In order to test the quality of the model calculation, also the (n,p), (n,«)and (n,2n) reactions were calculated and compared with the scanty literature data. Fig. 5.8shows the excitation functions of all the 4 reactions. A good agreement betweencalculation and experiment is obtained in all cases. The calculations are given for different
5. Results and Discussion 95
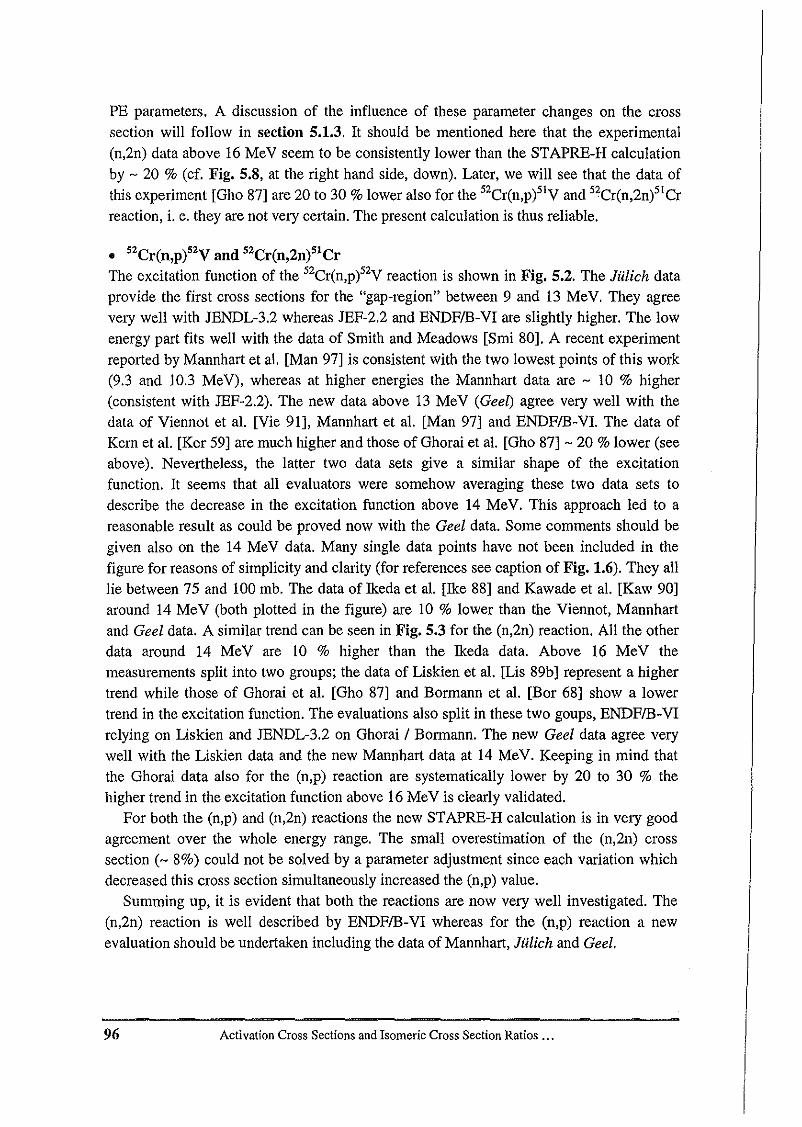
PE parameters. A discussion of the influence of these parameter changes on the crosssection will follow in section 5.1.3. It should be mentioned here that the experimental(n,2n) data above 16 MeV seem to be consistently lower than the STAPRE-H calculationby - 20 % (cf. Fig. 5.8, at the right hand side, down). Later, we will see that the data ofthis experiment [Gho 87] are 20 to 30 % lower also for the 52Cr(n,pi1v and 52Cr(n,2niICrreaction, i. e. they are not very certain. The present calculation is thus reliable.
• 52Cr(n,p)52V and 52Cr(n,2n)51CrThe excitation function of the 52Cr(n,pi 2v reaction is shown in Fig. 5.2. The Iulich dataprovide the first cross sections for the "gap-region" between 9 and 13 MeV. They agreevery well with JENDL-3.2 whereas JEF-2.2 and ENDFIB-VI are slightly higher. The lowenergy part fits well with the data of Smith and Meadows [Smi 80]. A recent experimentreported by Mannhart et aI. [Man 97] is consistent with the two lowest points of this work(9.3 and 10.3 MeV), whereas at higher energies the Mannhart data are - 10 % higher(consistent with JEF-2.2). The new data above 13 MeV (Ged) agree very well with thedata of Viennot et al. [Vie 91], Mannhart et al. [Man 97] and ENDFIB-VI. The data ofKern et al. [Ker 59] are much higher and those of Ghorai et al. [Gho 87] - 20 % lower (seeabove). Nevertheless, the latter two data sets give a similar shape of the excitationfunction. It seems that all evaluators were somehow averaging these two data sets todescribe the decrease in the excitation function above 14 MeV. This approach led to areasonable result as could be proved now with the Geel data. Some comments should begiven also on the 14 MeV data. Many single data points have not been included in thefigure for reasons of simplicity and clarity (for references see caption of Fig. 1.6). They alllie between 75 and 100 mb. The data of Ikeda et al. [Ike 88] and Kawade et al. [Kaw 90]around 14 MeV (both plotted in the figure) are 10 % lower than the Viennot, Mannhartand Geel data. A similar trend can be seen in Fig. 5.3 for the (n,2n) reaction. All the otherdata around 14 MeV are 10 % higher than the Ikeda data. Above 16 MeV themeasurements split into two groups; the data of Liskien et al. [Lis 89b] represent a highertrend while those of Ghorai et al. [Gho 87] and Bormann et al. [Bor 68] show a lowertrend in the excitation function. The evaluations also split in these two goups, ENDFIB-VIrelying on Liskien and JENDL-3.2 on Ghorai / Bormann. The new Geel data agree verywell with the Liskien data and the new Mannhart data at 14 MeV. Keeping in mind thatthe Ghorai data also for the (n,p) reaction are systematically lower by 20 to 30 % thehigher trend in the excitation function above 16 MeV is clearly validated.
For both the (n,p) and (n,2n) reactions the new STAPRE-H calculation is in very goodagreement over the whole energy range. The small overestimation of the (n,2n) crosssection (- 8%) could not be solved by a parameter adjustment since each variation whichdecreased this cross section simultaneously increased the (n.p) value.
Summing up, it is evident that both the reactions are now very well investigated. The(n,2n) reaction is well described by ENDFIB-VI whereas for the (n,p) reaction a newevaluation should be undertaken including the data of Mannhart, Ililich and Gee!.
96 Activation Cross Sections and Isomeric Cross Section Ratios ...
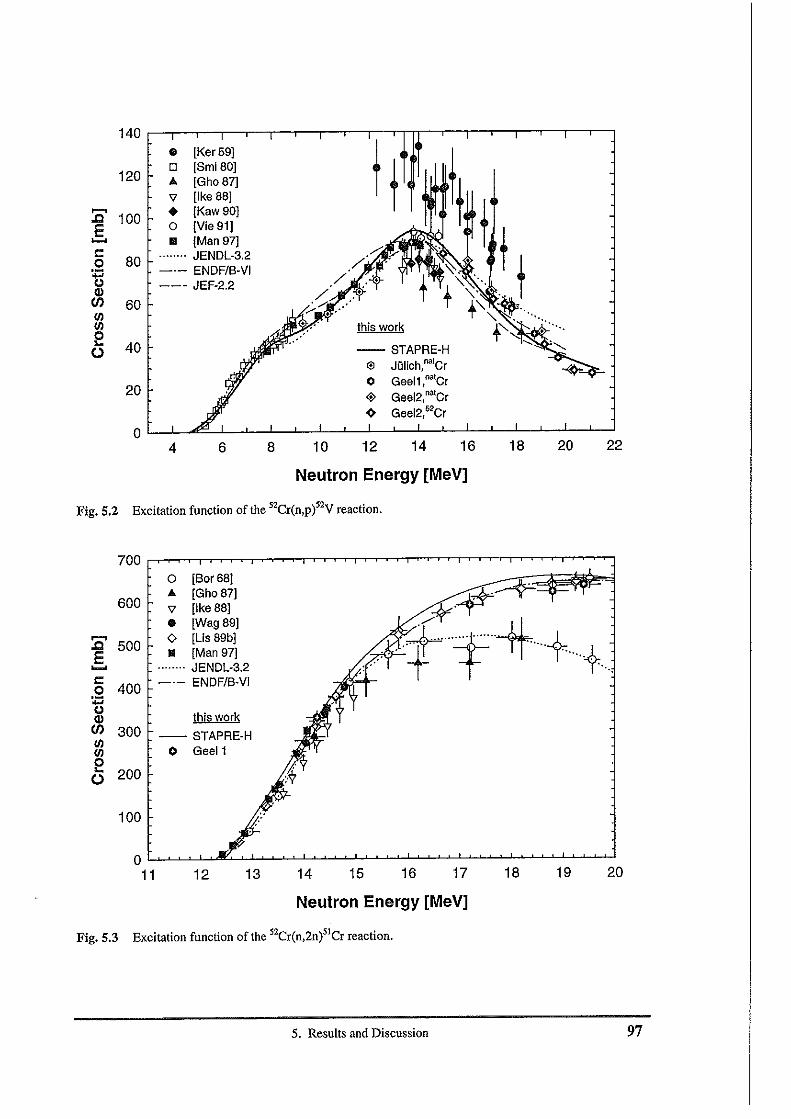
140
• [Ker 59J
1200 [Smi 80]A [Gho 87]'V [Ike 88J,..., • [Kaw90j.c 100
E 0 [Vie 91]...... II [Man 97Js::
80 ........ JENDL-3.20 _.- ENDF/B-VI~Ql
--- JEF-2.2
en 60IIIIII this work0.. 400 -- STAPRE-H
$ JOlich,""'Cr
200 Geel1,natCr
~ Geel2,""tCr~ GeeI2,'·Cr
04 6 8 10 12 14 16 18 20 22
Neutron Energy [MeV]
Fig, 5.2 Excitation function of the "Cr(n,p)"Y reaction.
201918171615141312OL.-~,--,-,","",'---'---''-'-'~---'---'~--.J~~--'--'-~--<--.1-~~-'--'-~-L-L~-'-'-'
11
7000 [Bor 68JA [Gh087]
600 'V [Ike 88J
• [Wag89J,...,
500 o [Lis 89bJ.cE II [Man 97J...... ........ JENDL-3.2s::
400 -'- ENDF/B-VI0:;:;e
this workQlen 300 -- STAPRE-HIIIIII 0 Geel1
e 200 fj0 ;-'7
100
Neutron Energy [MeV]
Fig. 5.3 Excitation function of the "Cr(n,2n)"Cr reaction.
5. Results and Discussion 97
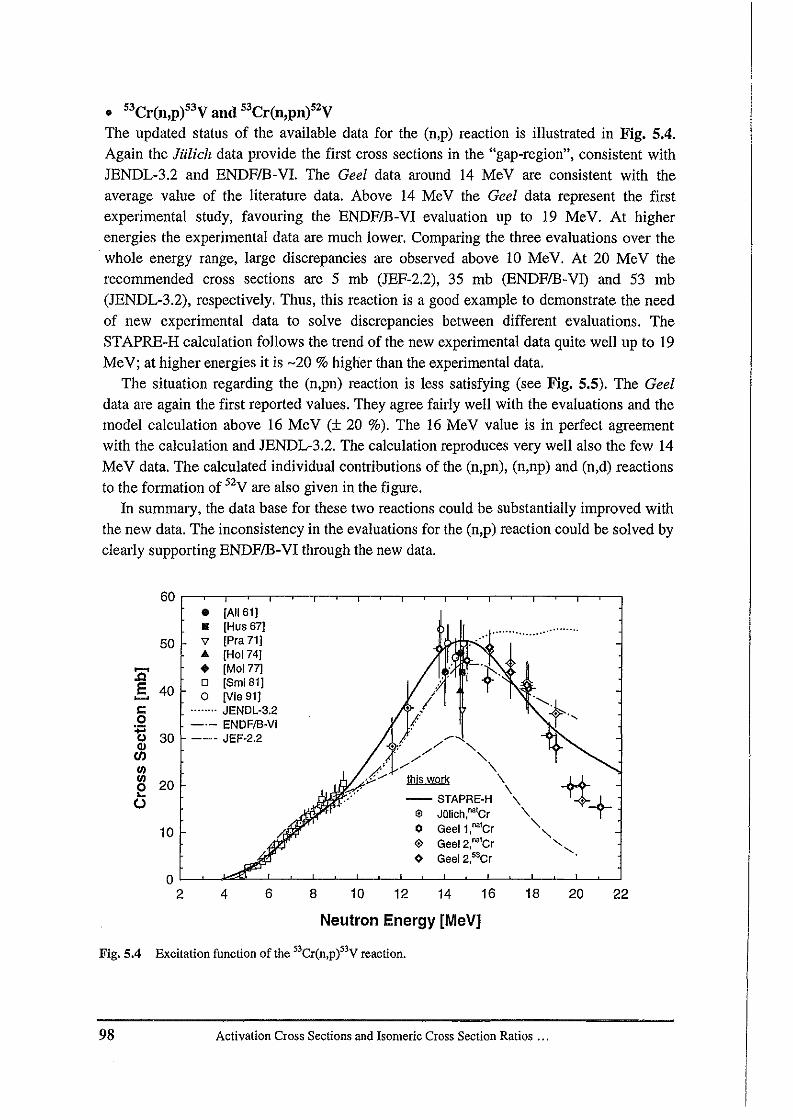
• 53Cr(n,p)53y and 53Cr(n,pn)52y
The updated status of the available data for the (n.p) reaction is illustrated in Fig. 5.4.Again the Julich. data provide the first cross sections in the "gap-region", consistent withJENDL-3.2 and ENDFIB-VI. The Gee! data around 14 MeV are consistent with theaverage value of the literature data. Above 14 MeV the Gee! data represent the firstexperimental study, favouring the ENDFIB-VI evaluation up to 19 MeV. At higherenergies the experimental data are much lower. Comparing the three evaluations over the
. whole energy range, large discrepancies are observed above 10 MeV. At 20 MeV therecommended cross sections are 5 mb (JEF-2.2), 35 mb (ENDFIB-VI) and 53 mb(JENDL-3.2), respectively, Thus, this reaction is a good example to demonstrate the needof new experimental data to solve discrepancies between different evaluations. TheSTAPRE-H calculation follows the trend of the new experimental data quite well up to 19MeV; at higher energies it is -20 % higher than the experimental data,
The situation regarding the (n,pn) reaction is less satisfying (see Fig. 5.5). The Gee!data are again the first reported values. They agree fairly well with the evaluations and themodel calculation above 16 MeV (± 20 %). The 16 MeV value is in perfect agreementwith the calculation and JENDL-3.2, The calculation reproduces very well also the few 14MeV data, The calculated individual contributions of the (n,pn), (n,np) and (n,d) reactionsto the formation of 52V are also given in the figure.
In summary, the data base for these two reactions could be substantially improved withthe new data, The inconsistency in the evaluations for the (n,p) reaction could be solved byclearly supporting ENDFIB-VI through the new data.
• [All 611• [Hus 671v [Pra 71]A [Hol74J• [MoI7?]o [8mi 81]o [Vie 91J
.....". JENDL-3.2_.- ENDFIB-Vi--- JEF-2.2
-- 8TAPRE-H$ JOlich,nalCro Geell,ro tCr
o GeeI2,na'Cr~ GeeI2,53Cr
60
50
~
.QE 40~
s::0
:;:::o 30OJen/II/II 200..c
10
02 4 6 8 10 12 14 16 18
..........
20 22
Neutron Energy [MeV]
Fig.5.4 Excitation function of the 53Cr(n,p)53V reaction.
98 Activation Cross Sections and Isomeric Cross Section Ratios ...
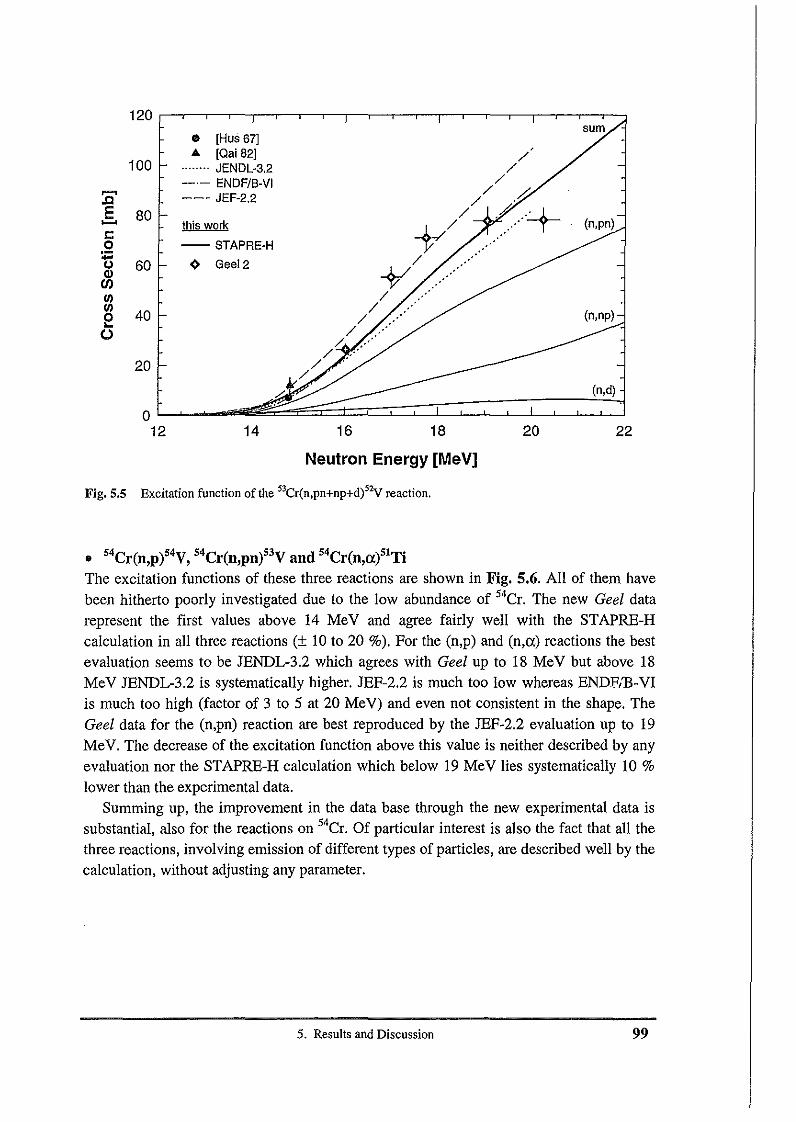
120sum
• [Hus 67JIi>. [Oai 821 /
,
100 ........ JENDL-3.2 /_.- ENDF/B-VI /
:c --- JEF-2.2/ ~/
E 80 / <....+........ this work +-/ (n,pn)C .'0 -- STAPRE·H:;::;
9 Geel2 /(J 60Ql -¥en(/) /(/)
40 / (n.np)e /0 /
/./
20 //
(n,d)
012 14 16 18 20 22
Neutron Energy [MeV]
Fig. 5.5 Excitation function of the "Cr(n,pn+np+d)52V reaction.
• 54Cr(n,p)54V, 54Cr(n,pn)53V and 54Cr(n,a)51Ti
The excitation functions of these three reactions are shown in Fig. 5.6. All of them havebeen hitherto poorly investigated due to the low abundance of 54Cr. The new Geel datarepresent the first values above 14 MeV and agree fairly well with the STAPRE-Hcalculation in all three reactions (± 10 to 20 %). For the (n,p) and (n,«) reactions the bestevaluation seems to be JENDL-3.2 which agrees with Geel up to 18 MeV but above 18MeV JENDL-3.2 is systematically higher. JEF-2.2 is much too low whereas ENDJ:l/B-VIis much too high (factor of 3 to 5 at 20 MeV) and even not consistent in the shape. TheGee! data for the (n,pn) reaction are best reproduced by the JEF-2.2 evaluation up to 19MeV. The decrease of the excitation function above this value is neither described by anyevaluation nor the STAPRE-H calculation which below 19 MeV lies systematically 10 %
lower than the experimental data.Summing up, the improvement in the data base through the new experimental data is
substantial, also for the reactions on 54Cr. Of particular interest is also the fact that all thethree reactions, involving emission of different types of particles, are described well by thecalculation, without adjusting any parameter.
5. Results and Discussion 99
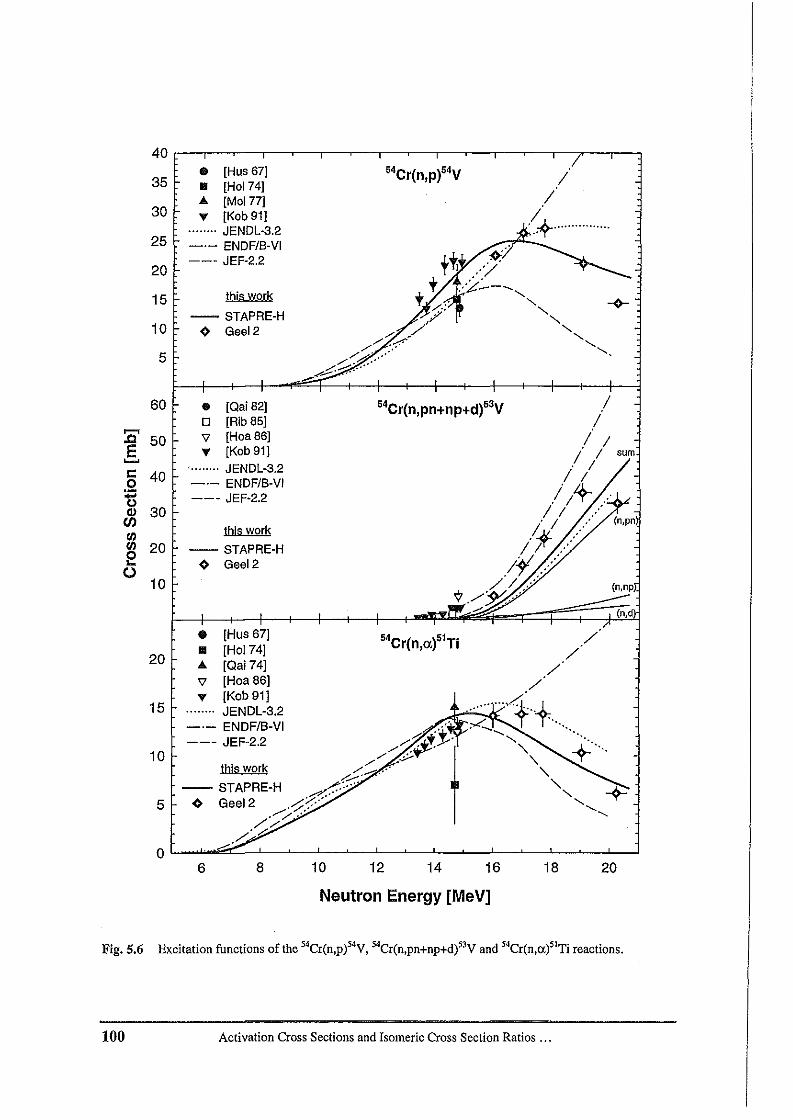
40
• [Hus 67J35 .. [Ho174J
A. [Mol??]30 ., [Kob 91J
........ JENDL-3.225 -.- ENDF/B-VI
--- JEF-2.220
15 this work
-- STAPRE-H10 Q Geel2
5
60 • [Oai 82]0 [Rib 85J........V [Hoa 86J.c 50
E ., [Kob 91).....C 40
' ........ JENDL-3.20 _.- ENDF/B-VI:g --- JEF-2.2Q) 30en
this workenen 20 -- STAPRE-H0... Q Geel2o10
20
15
10
5
• [Hus 67J.. [Hoi 74]A. [Oai 74JV [Hoa86J., [Kob 91J
JENDL-3.2_.- ENDFIB-VI--- JEF-2.2
//<t..·........·...._:7"'--
(n,d)
6 8 10 12 14 16 18 20
Neutron Energy [MeV]
Fig.5.6 Excitation functions of the 54Cr(n,p)54V, 54Cr(n,pn+np+d)"V and 54Cr(n,a)"Ti reactions.
100 Activation Cross Sections and isomeric Cross Section Ratios ...
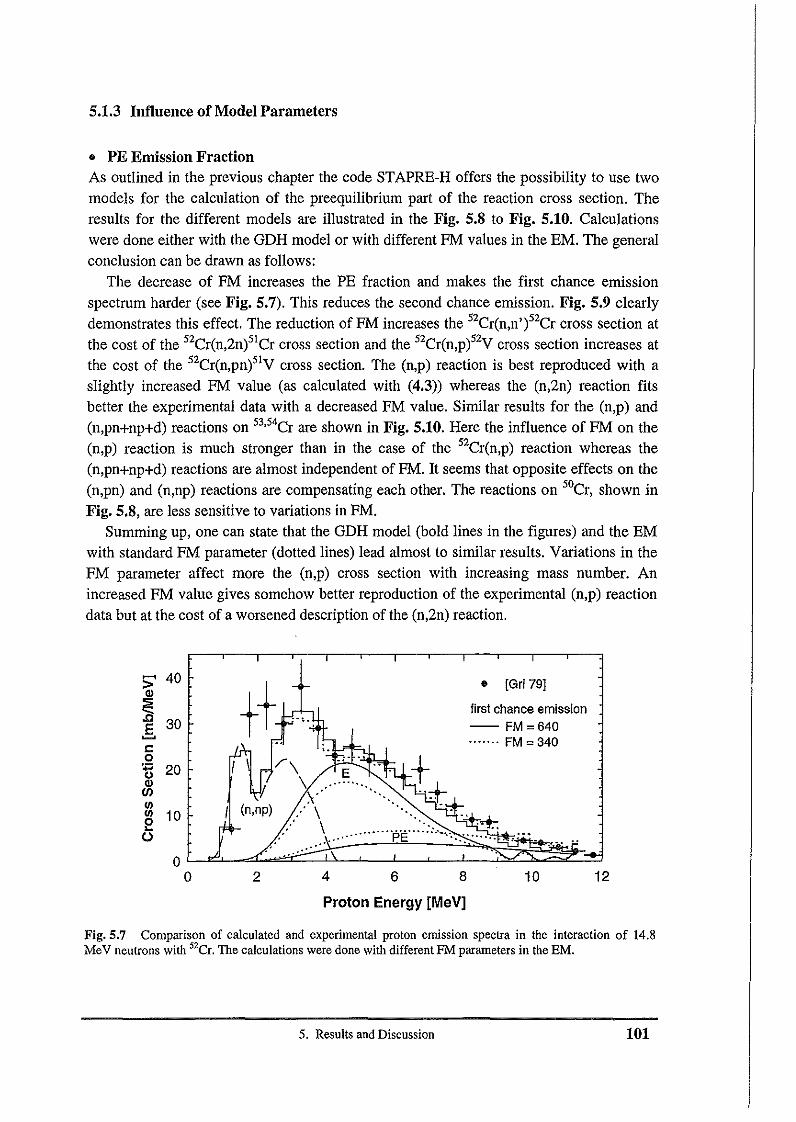
5.1.3 Influence of Model Parameters
• PE Emission FractionAs outlined in the previous chapter the code STAPRE-H offers the possibility to use twomodels for the calculation of the preequilibrium part of the reaction cross section. Theresults for the different models are illustrated in the Fig. 5.8 to Fig. 5.10. Calculationswere done either with the GDH model or with different PM values in the EM. The generalconclusion can be drawn as follows:
The decrease of FM increases the PE fraction and makes the first chance emissionspectrum harder (see Fig. 5.7). This reduces the second chance emission. Fig. 5.9 clearlydemonstrates this effect. The reduction of PM increases the 52Cr(n,n'i2Cr cross section atthe cost of the 52Cr(n,2n)51Cr cross section and the 52Cr(n,pi2y cross section increases atthe cost of the 52Cr(n,pn)51y cross section. The (n,p) reaction is best reproduced with aslightly increased PM value (as calculated with (4.3» whereas the (n,2n) reaction fitsbetter the experimental data with a decreased PM value. Similar results for the (n,p) and(n.pn--np-d) reactions on 53,54Cr are shown in Fig. 5.10. Here the influence of PM on the(n.p) reaction is much stronger than in the case of the 52Cr(n,p) reaction whereas the
(n.pn-np-d) reactions are almost independent of PM. It seems that opposite effects on the(n,pn) and (n.np) reactions are compensating each other. The reactions on 50Cr, shown inFig. 5.8, are less sensitive to variations in PM.
Summing up, one can state that the GDH model (bold lines in the figures) and the EMwith standard PM parameter (dotted lines) lead almost to similar results. Variations in theFM parameter affect more the (n,p) cross section with increasing mass number. Anincreased PM value gives somehow better reproduction of the experimental (n,p) reactiondata but at the cost of a worsened description of the (n,2n) reaction.
~ 40 [Gri 79]> tt •Q)s first chance emission30
;. e,-- FM =640E :
~ ....... FM=340l:0 ./\U 20Q)
V \en ~.(f) (n,np)(f) 10 ,'. \0 \ ...... ·"'E.... ::..-.......o .. , ...... ,
0..'
0 2 4 6 8 10 12
Proton Energy [MeV]
Fig. 5.7 Comparison of calculated and experimental proton emission spectra in the interaction of 14.8MeV neutrons with "Cr. The calculations were done with different FM parameters in the EM.
5. Results and Discussion 101
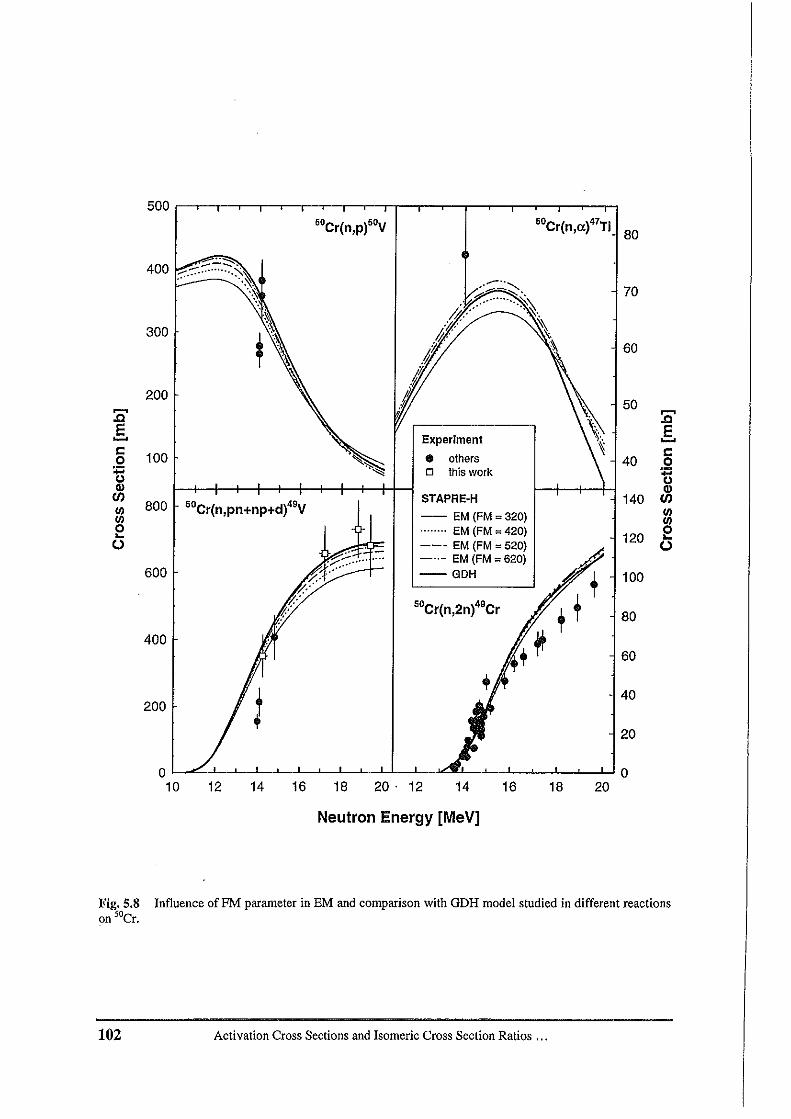
50050Cr(n,p)50V 5OCr(n,a)47Ti
80
400
70
30060
20050
~ ~
.0 .0E
Experiment E~ ~
s:: 100 • others s::0 40 0:;:; 0 this work :;:;0 0Q) Q)en
800 50Cr(n,pn+np+d)49VSTAPRE-H 140 en
til -- EM (FM =320) tiltil til0 ........ EM (FM =420) 0... 120 ...o --- EM (FM =520) ; o
.~~......... - .. - EM (FM =620)600 --GDH
+! +100
50Cr(n,2n)49Cr 80
40060
40200
20
0 010 12 14 16 18 20· 12 14 16 18 20
Neutron Energy [MeV]
Fig. 5.8 Influence of PM parameter in EM and comparison with GDH model studied in different reactionson sOer.
102 Activation Cross Sections and Isomeric Cross Section Ratios ...
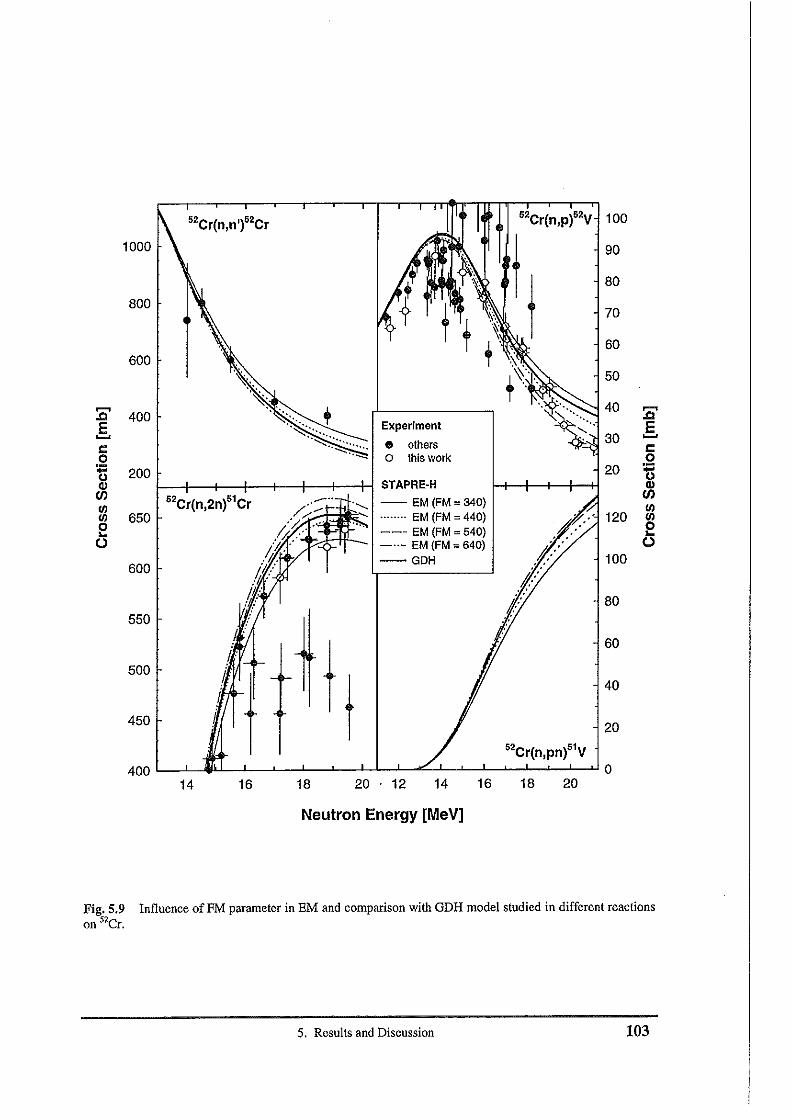
52Cr(n,n,)52Cr 52Cr(n,p)52V 100
1000 90
80
80070
60600
50
........~.... +
40 .......c 400 .cE Experiment E~
"~':::.;;::~ 30 ~
s:: • others s::0 0 thiswork 0:;:: 200 20 ~oC1l STAPRE·H C1len 52Cr(n,2n)51Cr -- EM (FM =340)
enI/) I/)I/) 650 ........ EM (FM =440) 120 I/)0 --" EM (FM =540)
0.. ..o - ..- EM (FM =640) o
600--GDH 100
80550
J:
tt60
500JL
40
450 j20
52Cr(n,pn)51 V400 a
14 16 18 20 . 12 14 16 18 20
Neutron Energy [MeV]
Fig. 5.9 Influence of PM parameter in EM and comparison with GDH model studied in different reactionson 52Cr.
5. Results and Discussion 103
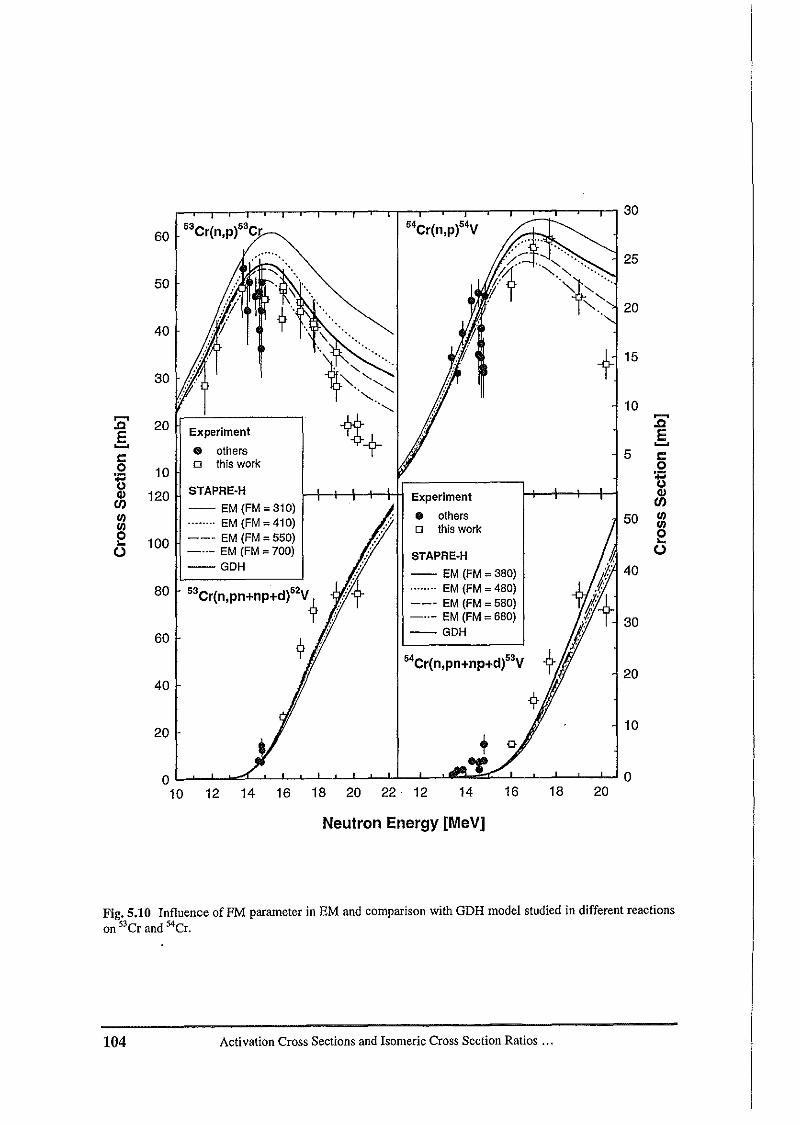
30
60 53Cr(n,p)53Cr 54Cr(n,p)54V
......25
50
20
40 -,'.
f, ". 15
.",-"<'"30-, '<,".'" 10
~
20 1+~
.c Experiment.c
E E~ • others
~
c:0 thtswork
5 c:0 10 0
U :;::;STAPRE·H
UQl 120 Experiment Qlen -- EM (FM = 310) enVI ........ EM (FM=410) • others 50 I/)I/) 0 thiswork I/)
0 --- EM (FM = 550) e.. 100c _ ..- EM (FM = 700) STAPRE·H()
--GDH-- EM (FM = 380) 40
80 53Cr(n,pn+np+d)52V* //~ ........ EM (FM = 480)--- EM (FM = 580)
: _ ..- EM (FM = 680) 3060 --GDH
54Cr(n,pn+np+d)53 V20
40
20 10
0 010 12 14 16 18 20 22· 12 14 16 18 20
Neutron Energy [MeV]
Fig. 5.10 Influence of FM parameter in EM and comparison with GDH model studied in different reactionson "Cr and 54Cr.
104 Activation Cross Sections and Isomeric Cross Section Ratios ...
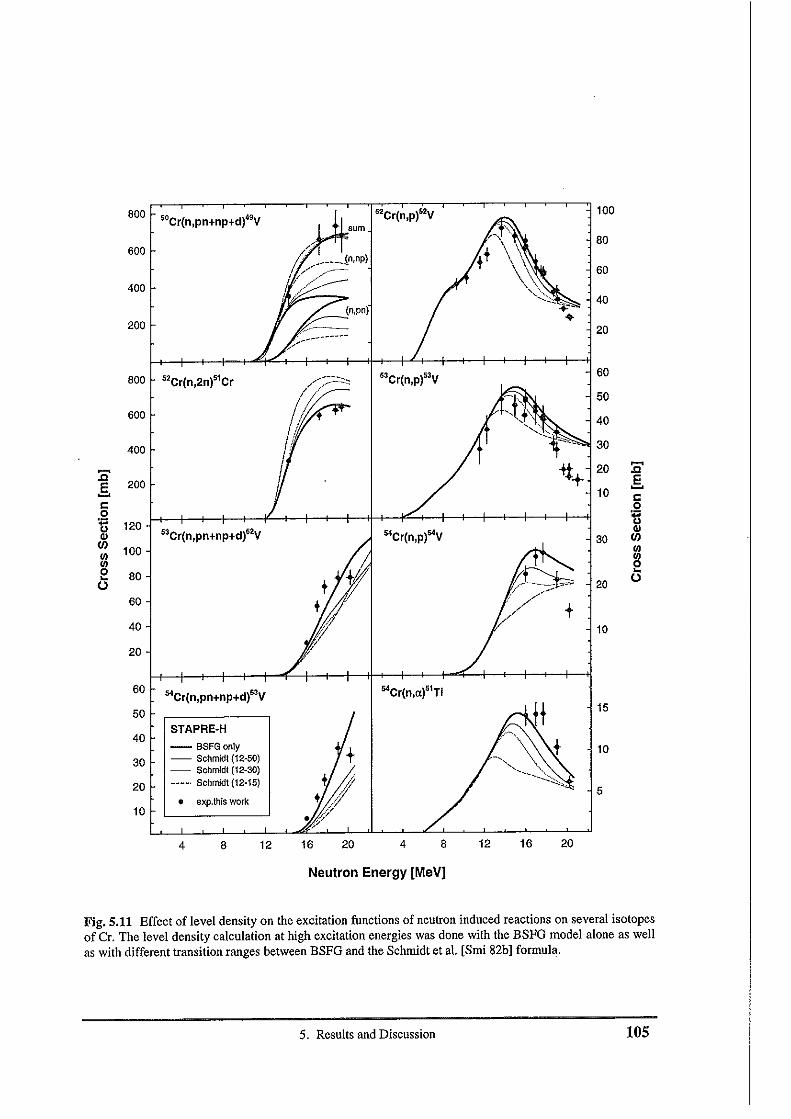
800"Cr{n,pn+np+d)"V "Cr{n,pl"V 100
60080
60
40040
(o,po)
200 20
800 "Cr{n,2n)51Cr
F"Cr{n,p)"V 60
50
600 U 40
400 30
I 20~
~ t .c.c200 E
E 10~
~ , cc
~0
~ 120"Cr{n,pn+np+d)"V
.... "Cr{n,p)"V 30 (J)(J)
100 '"'" '"'" 00 80
...... 00 20
60
40 10
20
60"Cr{n,pn+np+d)"V "Cr{n,a)51Ti
50 15
40STAPRE·H
-- BSFGonly 1030 - SchmJdl (12-50)
- SchmJdl (12-30)
20 SchmJdl (12·15)5
• exp.thls work10
4 8 12 16 20 4 8 12 16 20
Neutron Energy [MeV]
Fig. 5.11 Effect of level density on the excitation functions of neutron induced reactions on several isotopesof Cr. The level density calculation at high excitation energies was done with the BSPG model alone as wellas with different transition ranges between BSPG and the Schmidt et al, [Smi 82b] formula.
5. Results and Discussion 105
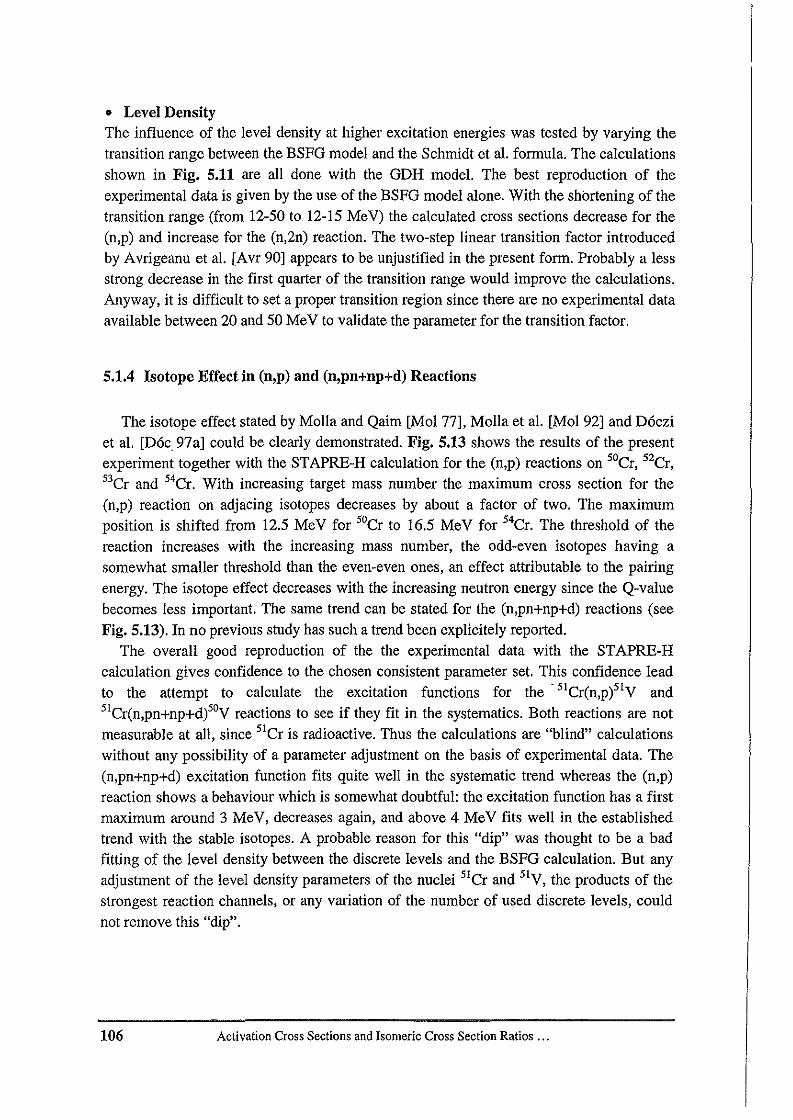
• Level DensityThe influence of the level density at higher excitation energies was tested by varying thetransition range between the BSPG model and the Schmidt et al. formula. The calculationsshown in Fig. 5.11 are all done with the GDH model. The best reproduction of theexperimental data is given by the use of the BSPG model alone. With the shortening of thetransition range (from 12-50 to 12-15 MeV) the calculated cross sections decrease for the(n,p) and increase for the (n,2n) reaction. The two-step linear transition factor introducedby Avrigeanu et al. [Avr 90] appears to be unjustified in the present form, Probably a lessstrong decrease in the first quarter of the transition range would improve the calculations.Anyway, it is difficult to set a proper transition region since there are no experimental dataavailable between 20 and 50 MeV to validate the parameter for the transition factor.
5.1.4 Isotope Effect in (n,p) and (n.pn-snp-sd) Reactions
The isotope effect stated by Molla and Qaim [Mol 77], Molla et al. [Mol 92] and Docziet al. [Doc 97a] could be clearly demonstrated. Fig. 5.13 shows the results of the presentexperiment together with the STAPRE-H calculation for the (n.p) reactions on 50Cr, 52Cr,53Cr and 54Cr. With increasing target mass number the maximum cross section for the
(n,p) reaction on adjacing isotopes decreases by about a factor of two. The maximumposition is shifted from 12.5 MeV for 50Cr to 16.5 MeV for 54Cr. The threshold of the
reaction increases with the increasing mass number, the odd-even isotopes having asomewhat smaller threshold than the even-even ones, an effect attributable to the pairingenergy. The isotope effect decreases with the increasing neutron energy since the Q-valuebecomes less important. The same trend can be stated for the (n,pn+np+d) reactions (seeFig. 5.13). In no previous study has such a trend been explicitely reported.
The overall good reproduction of the the experimental data with the STAPRE-Hcalculation gives confidence to the chosen consistent parameter set. This confidence leadto the attempt to calculate the excitation functions for the 51Cr(n,p)5IV and5ICr(n,pn+np+dioV reactions to see if they fit in the systematics. Both reactions are notmeasurable at all, since 5lCr is radioactive. Thus the calculations are "blind" calculationswithout any possibility of a parameter adjustment on the basis of experimental data. The(n.pn--np-i-d) excitation function fits quite well in the systematic trend whereas the (n,p)reaction shows a behaviour which is somewhat doubtful: the excitation function has a firstmaximum around 3 MeV, decreases again, and above 4 MeV fits well in the establishedtrend with the stable isotopes. A probable reason for this "dip" was thought to be a badfitting of the level density between the discrete levels and the BSPG calculation. But anyadjustment of the level density parameters of the nuclei 5lCr and 51V, the products of thestrongest reaction channels, or any variation of the number of used discrete levels, couldnot remove this "dip".
106 Activation CrossSectionsandIsomericCross SectionRatios ...
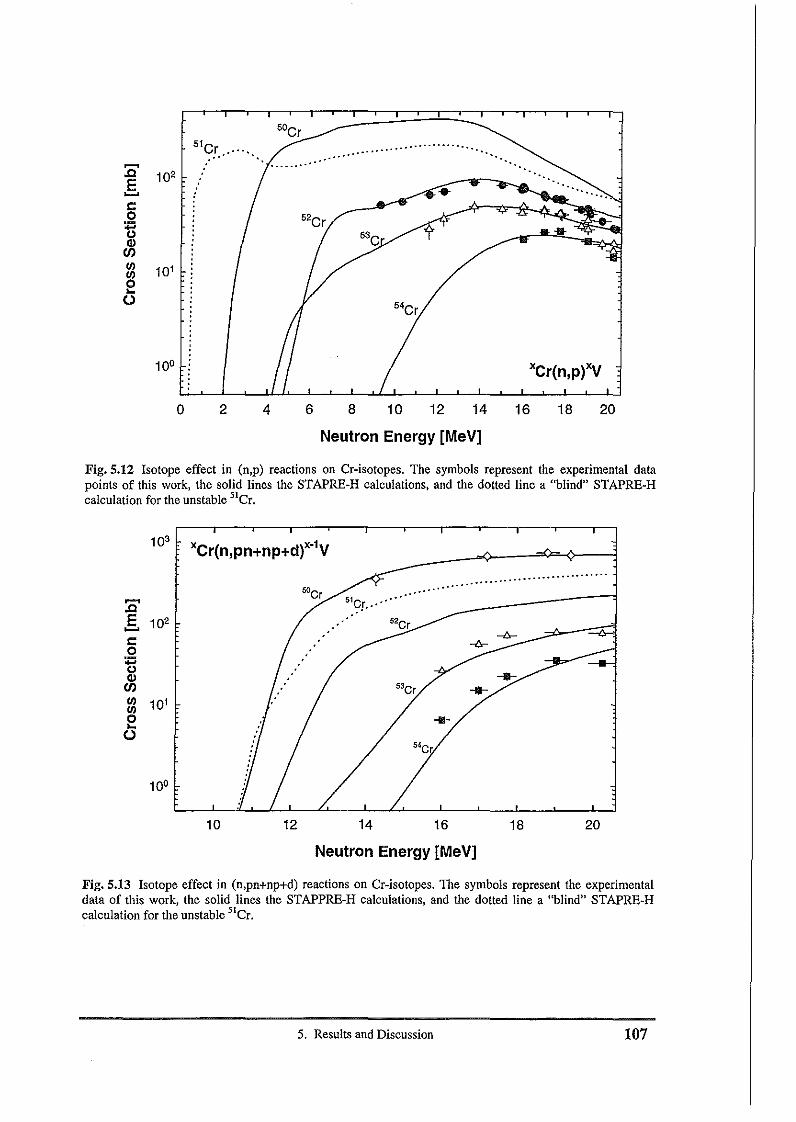
20181614121086
......................... ......... '.........
42o
51Cr .....~
.c 102E~
c0:;:;0QlenfIl 101fIl0...0
Neutron Energy [MeV]
Fig.5.12 Isotope effect in (n.p) reactions on Cr-isotopes. The symbols represent the experimental datapoints of this work, the solid lines the STAPRE-H calculations, and the dotted line a "blind" STAPRE-Hcalculation for the unstable "Cr.
103
......................................., ____--1
20181614
51 ."Cr.····52Cr
1210
co
~enfIl 101fIl
Eo
Neutron Energy [MeV]
Fig. 5.13 Isotope effect in (n.pn-np-d) reactions on Cr-isotopes. The symbols represent the experimentaldata of this work, the solid lines the STAPPRE-H calculations, and the dotted line a "blind" STAPRE-Hcalculation for the unstable "Cr.
5. Results and Discussion 107

5.2 Data for Reactions on Iron
5.2.1 Experimental Data
The cross sections for the 54pe(n,2n)53m+gPe and 54pe(n,Hdni2gMn reactions are listed
in Tab. 5.3. The Geel l cross sections were determined with natpe and the Geel2 data with
enriched 54Pe. The (n,2n) values are given as cumulative cross sections since the
metastable state (T112 = 2.58 min) decays 100 % via IT to the ground state.
Tab. 5.3 Measuredcross sectionsfor the 54pe(n,2n)53m+'Pe and 54pe(n,t+dn)52'Mn reactions.
Gee!]15.22±0.2215.64 ±0.2716.51 ± 0.3017.54 ± 0.2917.91 ± 0.3018.21 ±0.4018.30 ±0.32
Gee! 216.07 ±0.2017.06±0.2217.82 ±0.2519.15 ± 0.3020.36 ± 0.35
22.6±2.026.6±2.048.2 ± 3.763.1 ±5.269.4 ± 6.972.6 ±4.875.6 ± 4.9
39.1 ± 3.061.1 ±4.671.4 ± 6.281.4 ± 7.788.2±7.2
cesu16.05 ±0.2516.89 ±0.3017.82±0.3019.14 ± 0.3520.35 ± 0.40
0.02± 0.010.05 ± 0.010.19 ± 0.020.26 ± 0.030.34±0.03
5.2.2 Comparison with Literature Data, Evaluations and STAPRE-H Calculation
• 54Fe(n,2n)53m+gFe
The excitation function for the 54pe(n,2ni3m+gPe reaction is shown in Fig. 5.14. The new
data obtained with na'Pe and 54Pe as target materials are consistent. The older experimental
data scatter very much. The data of Andreev and Serov [And 68] seem to be much toohigh and the values of Bormann et al. [Bor 76] above 15 MeV are rather low. The bestagreement is given with the data of Ryves et al. [Ryv 78a] obtained with n"Pe; their datawith enriched 54Pe are somewhat higher [Ryv 78b]. Compared with the three given
evaluations, our measurements are in good agreement up to 18 MeV with the ENDPIB-VI
108 ActivationCross Sectionsand IsomericCross SectionRatios ...
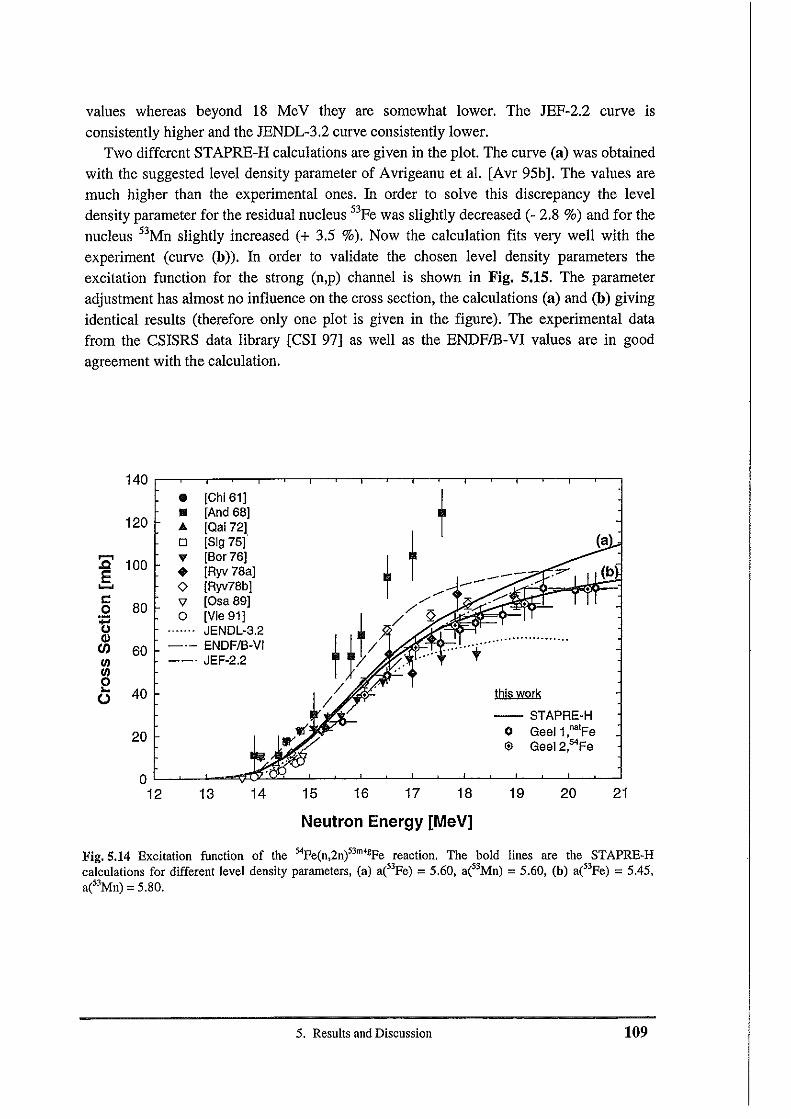
values whereas beyond 18 MeV they are somewhat lower. The JEF-2.2 curve isconsistently higher and the JENDL-3.2 curve consistently lower.
Two different STAPRE-H calculations are given in the plot. The curve (a) was obtainedwith the suggested level density parameter of Avrigeanu et al. [Avr 95b]. The values aremuch higher than the experimental ones. In order to solve this discrepancy the leveldensity parameter for the residual nucleus 53Fe was slightly decreased (- 2.8 %) and for thenucleus 53Mn slightly increased (+ 3.5 %). Now the calculation fits very well with theexperiment (curve (b)). In order to validate the chosen level density parameters theexcitation function for the strong (n.p) channel is shown in Fig. 5.15. The parameteradjustment has almost no influence on the cross section, the calculations (a) and (b) givingidentical results (therefore only one plot is given in the figure). The experimental datafrom the eSISRS data library [eSI 97] as well as the ENDFIB-VI values are in goodagreement with the calculation.
140II [Chi 61]
t.. [And 68)120 A [Oai 72]
0 [8ig 75]
f,.....,100 V [Bor 76]
f.c • [Ryv 78a]E..... o [Ryv78bJ
~c 'V [Osa 89] ./0 80
0 [Yie 91J // Qn JENDL-3.2 H!;Ql _.- ENDFIB-YI...................
en 60(f) --' JEF-2.2(f)0.. 40 / this work0 /
-- STAPRE-H
20 0 Geel 1,nalFe$ Geel2,54Fe
012 13 14 15 16 17 18 19 20 21
Neutron Energy [MeV]
Fig. 5.14 Excitation function of the 54pe(n,2n)"m+'Pe reaction. The bold lines are the STAPRE-Hcalculations for different level density parameters, (a) a("Fe) =5.60, a("Mn) =5.60, (b) a("Fe) =5.45,a("Mn) = 5.80.
5. Results andDiscussion 109
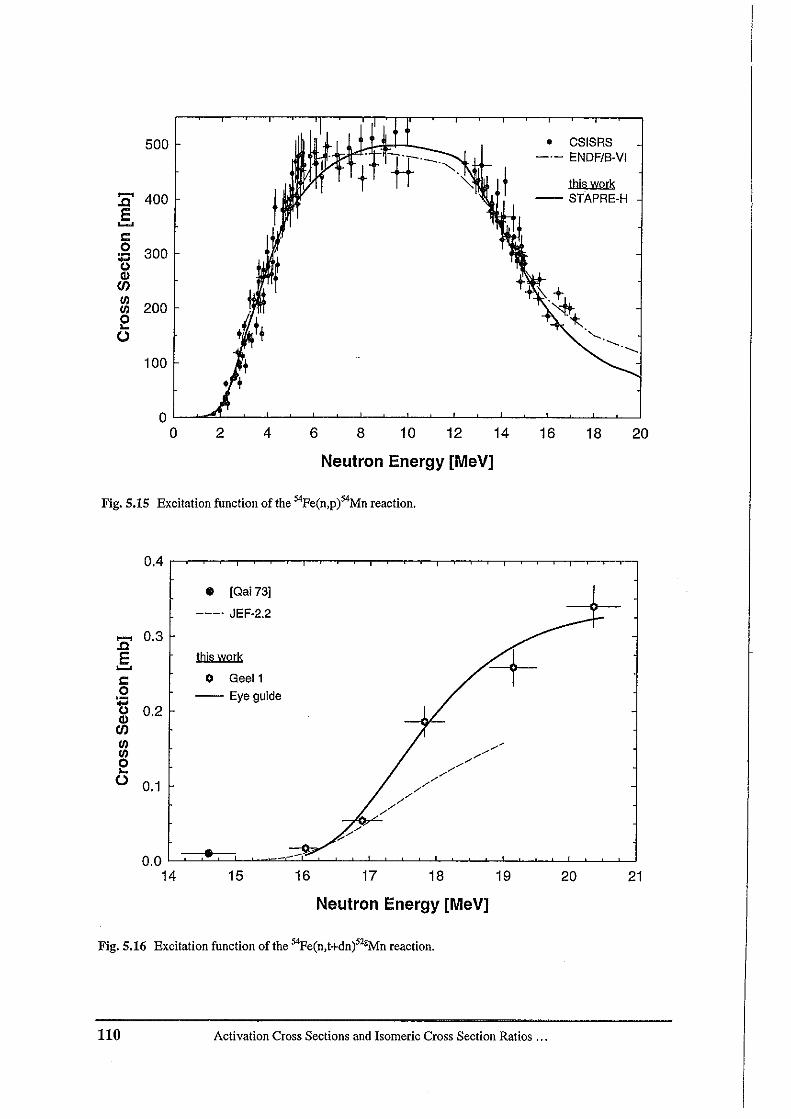
2018166 8 10 12 14
Neutron Energy [MeV]
42O'--..........l..-~-'--~--'--~---'-~-'-~---'-~---'~---''--~-'---'----'o
500 • CSISRS
fr~-,- ENDF/B-VI
t '''-.',-: this work
........ 400 -- STAPRE-H,Q
E.......c0 300:;:;oQl
f ~ +entil
200 '~*-til0..0 "-., ...... , ......
100
Fig. 5.15 Excitation function of the 54pe(n,p)54Mn reaction,
0.2
:c 0.3
E.......co~~tileo 0.1
• [Qai 73]
---. JEF-2.2
this work
o Geel1-- Eye guide
• ---15 16 17 18 19 20 21
Neutron Energy [MeV]
Fig. 5.16 Excitation function of the 54pe(n,t+dn)S2'Mn reaction.
110 Activation Cross Sections and Isomeric Cross SectionRatios ...
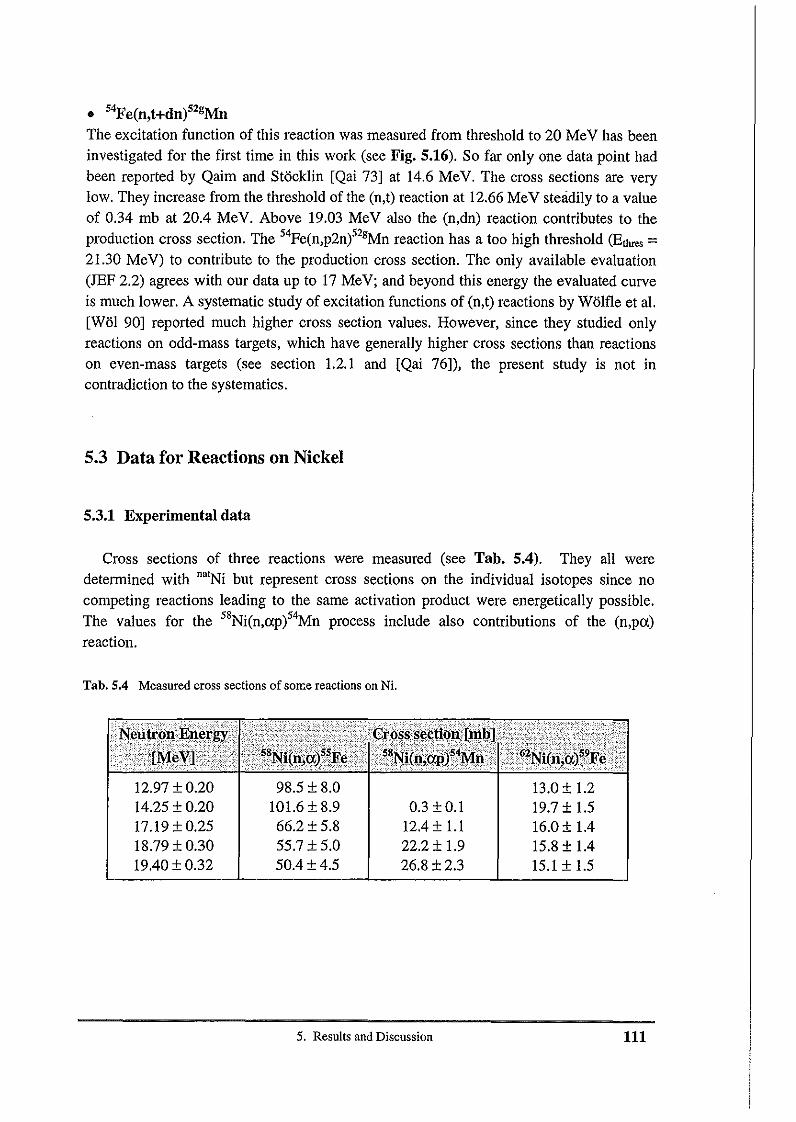
• 54Fe(n,t+dn)52gMn
The excitation function of this reaction was measured from threshold to 20 MeV has beeninvestigated for the first time in this work (see Fig. 5.16). So far only one data point hadbeen reported by Qaim and Stocklin [Qai 73] at 14.6 MeV. The cross sections are verylow. They increase from the threshold of the (n.t) reaction at 12.66 MeV steadily to a valueof 0.34 mb at 20.4 MeV. Above 19.03 MeV also the (n,dn) reaction contributes to theproduction cross section. The 54Fe(n,p2ni2gMn reaction has a too high threshold (Ethres =21.30 MeV) to contribute to the production cross section. The only available evaluation(JEF 2.2) agrees with our data up to 17 MeV; and beyond this energy the evaluated curveis much lower. A systematic study of excitation functions of (n,t) reactions by Wolfle et al.[WOl 90] reported much higher cross section values. However, since they studied onlyreactions on odd-mass targets, which have generally higher cross sections than reactionson even-mass targets (see section 1.2.1 and [Qai 76]), the present study is not incontradiction to the systematics.
5.3 Data for Reactions on Nickel
5.3.1 Experimental data
Cross sections of three reactions were measured (see Tab. 5.4). They all weredetermined with na'Ni but represent cross sections on the individual isotopes since nocompeting reactions leading to the same activation product were energetically possible.The values for the 58Ni(n,ap)54Mn process include also contributions of the (n.po)
reaction.
Tab. 5.4 Measured cross sections of some reactions on Ni.
12.97±0.2014.25 ± 0.2017.19 ± 0.2518.79 ± 0.3019.40 ± 0.32
98.5±8.0101.6 ± 8.966.2 ± 5.855.7±5.050.4 ± 4.5
0.3 ± 0.112.4 ± 1.122.2 ± 1.926.8 ±2.3
13.0 ± 1.219.7 ± 1.516.0 ± 1.415.8 ± 1.415.1 ± 1.5
5. Results and Discussion 111
5.3.2 Comparison with Literature Data, Evaluations and STAPRE·H Calculation
• 58Ni(n,a)55Fe and 58(n,api4Mn
The available data on the (n,«) reaction are illustrated in Fig. 5.17. As mentioned earlier,most of the literature data were obtained by measuring the total helium emission, i. e. theyrepresent the sum of the 58Ni(n,a), 58Ni(n,na), 58Ni(n,an), 58Ni(n,ap) and 58Ni(n,pa)
reactions. They are comparable with activation data up to a neutron energy of about 10MeV, the threshold of the (n.n«) reaction. The present experimental data (GeelI) are thefirst (n,«) cross sections above 10 MeV apart from the single data point of Qaim andMolla [Qai 77] at 14.8 MeV. This cross section is - 20 % higher than the GeelI value at14.3 MeV. None of the three given evaluations confirms all the Geel I data; at 13 MeVJENDL-3.2 and JEF-2.2 are in agreement, at 14.3 and 17.2 MeV ENDFfB-VI is matching,and the two highest points between 18 and 20 MeV are best reproduced by JEF-2.2.Considering also the low energy part of the excitation function the evaluations showsignificant disagreement. They were all done over a decade ago and had only theexperimental results near 14 MeV and the activation data of Qaim et al. [Qai 84]. TheJEF-2.2 evaluator (M. Uhl) did not even know of the Qaim data. The problem of bigdifferences in the evaluations between 6 and 12 MeV was attributed to the level densitiesused in the different calculations [Fu 96]. The JEF-2.2 evaluation was done using muchlarger level densities in all binary channels. In a calculation near 8 MeV, secondaryneutrons and protons can sense the large differences in level densities, but outgoing alphaparticles are emitted predominantly to the discrete levels, so the (n,o) cross sectionbecomes smaller. As incident energies go higher, the outgoing alpha-particles can reachthe larger level densities and the calculated cross sections increase again. This explains therise-flatten-rise shape of the JEF-2.2 evaluation.
Since 1987 many spectral measurements have been reported below 10 MeV but none ofthem could confirm the higher activation values. It seems that they lie - 20 to 40 % toohigh. A recent measurement of Haight et al. [Hai 97b] with neutrons from the pulsed, fastneutron spallation source at the Los Alamos Neutron Science Centre confirms the lowertrend up to 10 MeV as well as the 14 MeV data.
The STAPRE-H calculation is in excellent agreement with the Geel l data. Summingup the cross sections of the (n,o), (n.nce-on) and (n.prz--op) reactions leads to the (n.xn)cross section, which reproduces the Haight values very well. It seems that the parameterset for the calculation is well chosen. The only discrepancy lies in the threshold regionwhere the calculation is systematically higher. This seems to be a problem of the opticalmodel parameters but could not be solved by using another potential.
The 58Ni(n,api4Mn reaction was first observed by Iwasaki et al [Iwa 93]. Theexcitation function is shown in Fig. 5.18. It was natural to assume that such a two chargedparticle emission process would be hindered. Nevertheless, it was found that the crosssection at 20 MeV is appreciable high (- 20 mb). A later experiment reported almost thedouble of this value [Iwa 94]. The new Geel l data confirm the older data ofIwasaki et al.
112 Activation CrossSections and IsomericCross SectionRatios ...
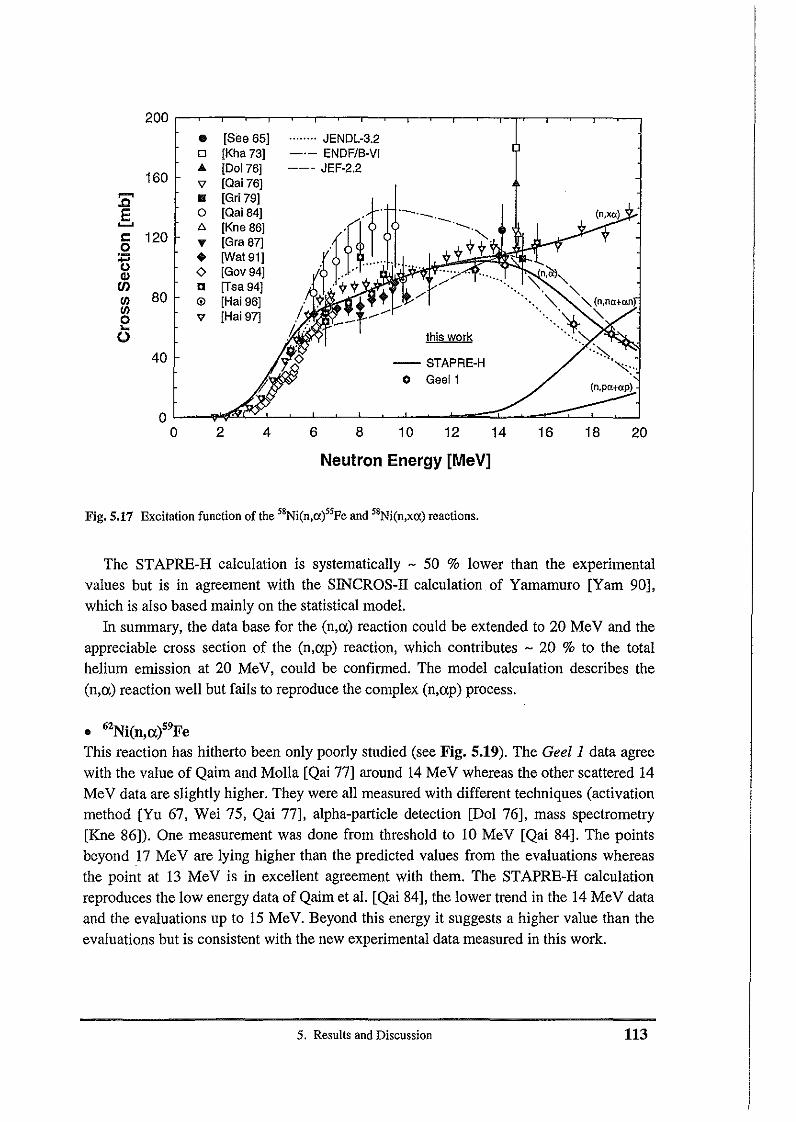
160
:cE.......c 120o~CllenC/I 80eo
40
• [See 65]o [Kha73]'" [00176]'V [Oa176J.. [Gr179)o [OaI84]A [Kne86)'I' [Gra87J• [Wat91)<> [Gov94JII [Tsa 94](j) [Ha196Jv [Ha197J
........ JENDL-3.2_.- ENDF/B-VI--- JEF-2.2
this work
-- STAPRE-Ho Geel1
(n,pa+ap)
2018161412108642oL.....-"'Il"'~~~-'-~--'--~'---'--'--=:::.:C:...-~::::;::::--'--~
o
Neutron Energy [MeV]
Fig. 5.17 Excitation function of the 58Ni(n,ex)55pe and 58Ni(n,xex) reactions.
The STAPRE-H calculation is systematically - 50 % lower than the experimentalvalues but is in agreement with the SINCROS-I1 calculation of Yamamuro [Yam 90],
which is also based mainly on the statistical model.
In summary, the data base for the (n,o) reaction could be extended to 20 MeV and theappreciable cross section of the (n.op) reaction, which contributes - 20 % to the total
helium emission at 20 MeV, could be confirmed, The model calculation describes the
(n.a) reaction well but fails to reproduce the complex (n.op) process.
• 62Ni(n,ui9Fe
This reaction has hitherto been only poorly studied (see Fig. 5.19). The Gee! 1 data agree
with the value of Qaim and Molla [Qai 77] around 14 MeV whereas the other scattered 14MeV data are slightly higher. They were all measured with different techniques (activationmethod [Yu 67, Wei 75, Qai 77], alpha-par1icIe detection [Dol 76], mass spectrometry[Kne 86]). One measurement was done from threshold to 10 MeV [Qai 84]. The points
beyond 17 MeV are lying higher than the predicted values from the evaluations whereasthe point at 13 MeV is in excellent agreement with them. The STAPRE-H calculation
reproduces the low energy data of Qaim et al. [Qai 84], the lower trend in the 14 MeV data
and the evaluations up to 15 MeV. Beyond this energy it suggests a higher value than theevaluations but is consistent with the new experimental data measured in this work.
5, Results and Discussion 113
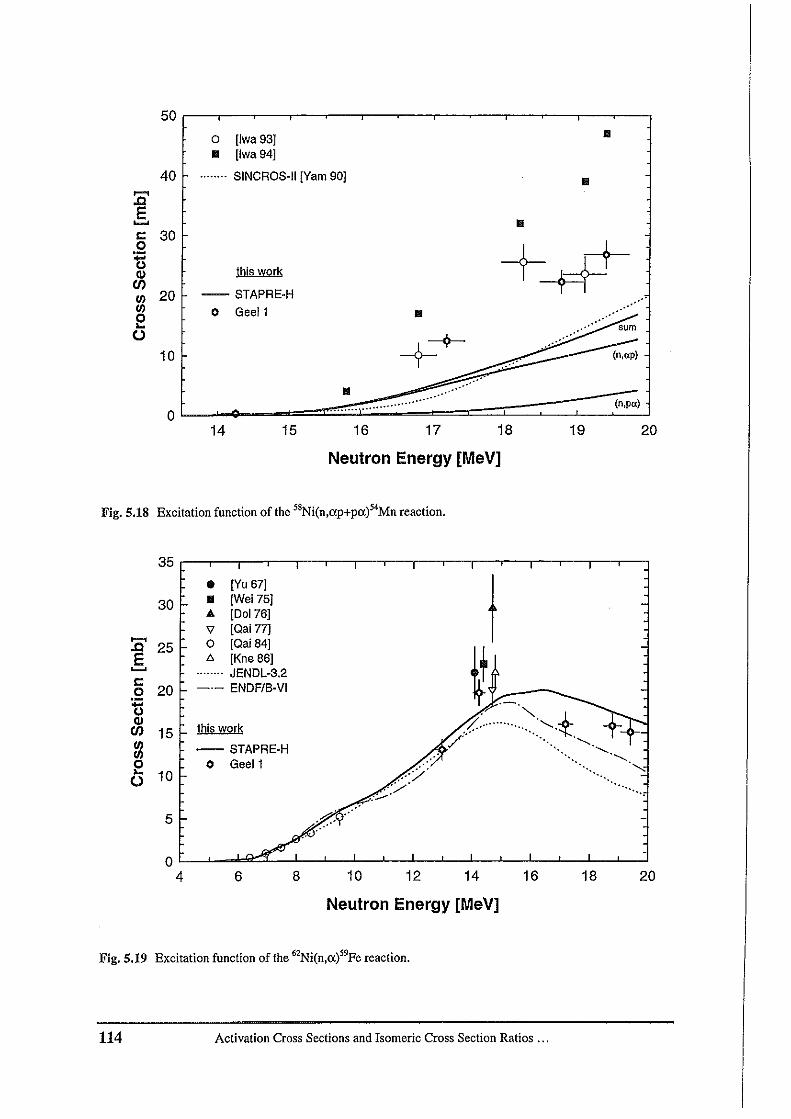
o [lwa93JII [Iwa 94]
40 SINCROS-II [Yam90J II
II
.......
.Q
E.....c 300
~ this workQ)
en-- STAPRE-Htil 20
til 0 Geelleo10
14 15
..16
II
17 18
II
19
.'
20
Neutron Energy [MeV]
Fig. 5.18 Excitation function of the "Ni(n,ap+pa)54Mn reaction.
20181614121086oL--,-..-I.~:L---L..---'_..l--'-_L--'---l_..1.--L_,--....L..--,--.J
4
35
• [Yu 67J
30 II [Wei75JA [00176]v [Oai 77J....... 0 [Oai 84J.Q 25
E l> [Kne86]....... ........ JENDL-3.2C
20 _.- ENDF/B·VI0
~Q)
this worken 15til -- STAPRE·Htil0 0 Geell -,.. 10o '" ".".
5
Neutron Energy [MeV]
Fig.5.19 Excitation function of the 62Ni(n,a )" Pe reaction.
114 Activation Cross Sections and Isomeric Cross Section Ratios ...
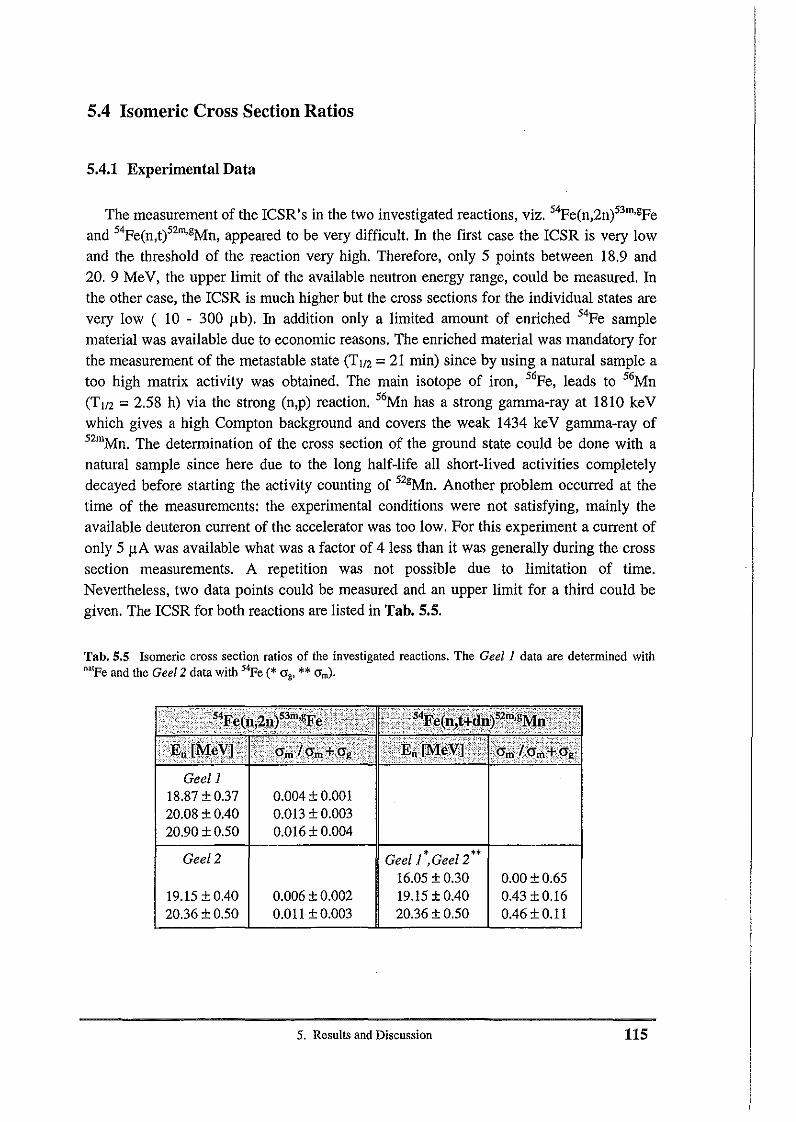
5.4 Isomeric Cross Section Ratios
5.4.1 Experimental Data
The measurement of the ICSR's in the two investigated reactions, viz. 54Pe(n,2n)53m,gpeand 54pe(n,ti2m,gMn, appeared to be very difficult. In the first case the ICSR is very lowand the threshold of the reaction very high. Therefore, only 5 points between 18.9 and20.9 MeV, the upper limit of the available neutron energy range, could be measured. Inthe other case, the ICSR is much higher but the cross sections for the individual states arevery low ( 10 - 300 ub). In addition only a limited amount of enriched 54Pe samplematerial was available due to economic reasons. The enriched material was mandatory forthe measurement of the metastable state (T1/2 = 21 min) since by using a natural sample atoo high matrix activity was obtained. The main isotope of iron, 56Pe, leads to 56Mn(T1I2 = 2.58 h) via the strong (n,p) reaction. 56Mn has a strong gamma-ray at 1810 keVwhich gives a high Compton background and covers the weak 1434 keV gamma-ray of52mMn. The determination of the cross section of the ground state could be done with anatural sample since here due to the long half-life all short-lived activities completelydecayed before starting the activity counting of 52gMn. Another problem occurred at thetime of the measurements: the experimental conditions were not satisfying, mainly theavailable deuteron current of the accelerator was too low. For this experiment a current ofonly 5 f.lA was available what was a factor of 4 less than it was generally during the crosssection measurements. A repetition was not possible due to limitation of time.Nevertheless, two data points could be measured and an upper limit for a third could begiven. The ICSR for both reactions are listed in Tab. 5.5.
Tab. 5,5 Isomeric cross section ratios of the investigated reactions. The Geel 1 data are determined with""Fe and the Geel2 data with "Fe (* 0'., ** O'm)'
Geel]18.87 ±0.3720.08 ± 004020.90 ±0.50
Geel2
19.15 ± 004020.36 ±0.50
0.004 ± 0.0010.013 ± 0.0030.016 ± 0.004
0.006 ± 0.0020.011 ± 0.003
* **Geell ,Geel 216.05 ± 0.3019.15 ± 004020.36 ± 0.50
0.00 ± 0.650043 ± 0.160046 ± 0.11
5. Results and Discussion 115
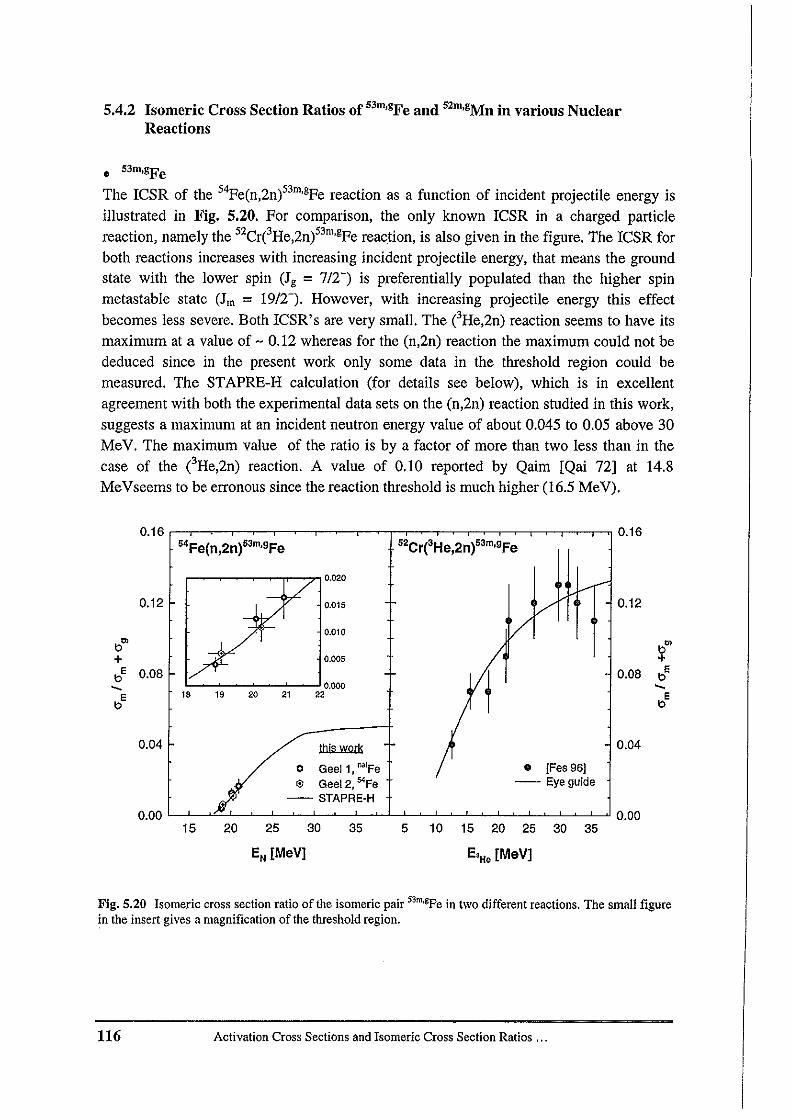
5.4.2 Isomeric Cross Section Ratios of 53m,gFe and 52m,gMn in various NuclearReactions
• S3m,gFe
The ICSR of the 54pe(n,2ni3m,gPe reaction as a function of incident projectile energy isillustrated in Fig. 5.20. For comparison, the only known ICSR in a charged particlereaction, namely the 52CreHe,2n)53rn·gPe reaction, is also given in the figure. The ICSR forboth reactions increases with increasing incident projectile energy, that means the groundstate with the lower spin (Jg = 7/2-) is preferentially populated than the higher spinmetastable state (Jrn = 19fT). However, with increasing projectile energy this effectbecomes less severe. Both ICSR' s are very small. The eHe,2n) reaction seems to have itsmaximum at a value of - 0.12 whereas for the (n,2n) reaction the maximum could not bededuced since in the present work only some data in the threshold region could bemeasured. The STAPRE-H calculation (for details see below), which is in excellentagreement with both the experimental data sets on the (n,2n) reaction studied in this work,suggests a maximum at an incident neutron energy value of about 0.045 to 0,05 above 30MeV. The maximum value of the ratio is by a factor of more than two less than in thecase of the eHe,2n) reaction. A value of 0.10 reported by Qaim [Qai 72] at 14,8MeVseems to be erronous since the reaction threshold is much higher (16.5 MeV).
0.16 0.1654Fe(n,2n)53m,9Fe 52CreHe,2n)53rn,9Fe
0.020
0.12 0.015 0.12
0.010
to'" to'"+ 0.005 +toE 0.08
t0.08 toE- 0.000 -E 18 1. 20 21 22 E
to to
0.04 this work 0.04
0 Geel1, ""Fe • [Fes 96J$ GeeI2, 54Fa -- Eyeguide-- STAPRE-H
0.00 0.0015 20 25 30 35 5 10 15 20 25 30 35
EN [MeV] E'H. [MeV]
Fig. 5.20 Isomeric cross section ratio of the isomeric pair S3m,gPe in two different reactions. The small figurein the insert gives a magnification of the threshold region.
116 Activation Cross Sections and Isomeric Cross Section Ratios",
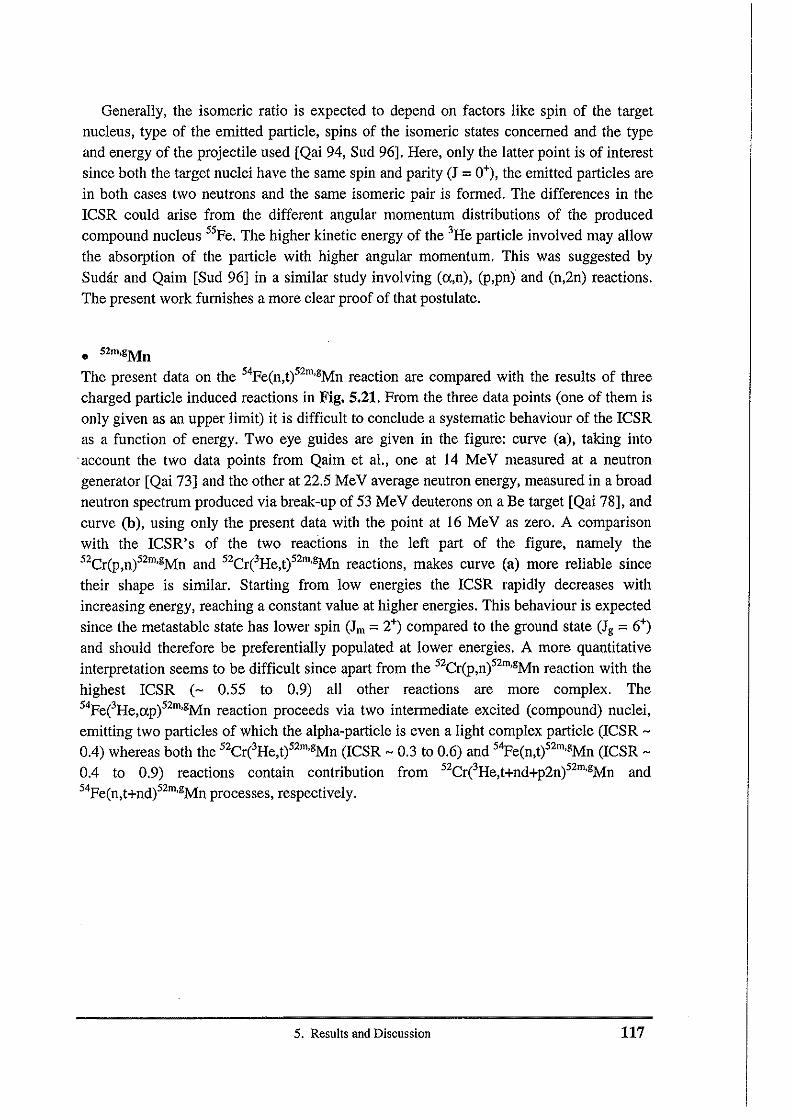
Generally, the isomeric ratio is expected to depend on factors like spin of the targetnucleus, type of the emitted particle, spins of the isomeric states concerned and the typeand energy of the projectile used [Qai 94, Sud 96]. Here, only the latter point is of interestsince both the target nuclei have the same spin and parity (J = 0+), the emitted particles arein both cases two neutrons and the same isomeric pair is formed. The differences in theICSR could arise from the different angular momentum distributions of the producedcompound nucleus 55Fe. The higher kinetic energy of the 3He particle involved may allowthe absorption of the particle with higher angular momentum. This was suggested bySudar and Qaim [Sud 96] in a similar study involving (o,n), (p,pn) and (n,2n) reactions.The present work furnishes a more clear proof of that postulate.
• 52m,gMn
The present data on the 54Fe(n,ti2m·gMn reaction are compared with the results of threecharged particle induced reactions in Fig. 5.21. From the three data points (one of them isonly given as an upper limit) it is difficult to conclude a systematic behaviour of the ICSRas a function of energy. Two eye guides are given in the figure: curve (a), taking into
'account the two data points from Qaim et al., one at 14 MeV measured at a neutrongenerator [Qai 73] and the other at 22.5 MeV average neutron energy, measured in a broadneutron spectrum produced via break-up of 53 MeV deuterons on a Be target [Qai 78], andcurve (b), using only the present data with the point at 16 MeV as zero, A comparisonwith the ICSR's of the two reactions in the left part of the figure, namely the52Cr(p,n)52m,gMn and 52CreHe,ti2m,gMn reactions, makes curve (a) more reliable since
their shape is similar. Starting from low energies the ICSR rapidly decreases withincreasing energy, reaching a constant value at higher energies. This behaviour is expectedsince the metastable state has lower spin (Jm =2+) compared to the ground state (Jg =6+)and should therefore be preferentially populated at lower energies. A more quantitativeinterpretation seems to be difficult since apart from the 52Cr(p,ni2m,gMn reaction with thehighest ICSR (- 0.55 to 0.9) all other reactions are more complex. The54FeeHe,ap)52m,gMn reaction proceeds via two intermediate excited (compound) nuclei,emitting two particles of which the alpha-particle is even a light complex particle (ICSR 0.4) whereas both the 52CreHe,t)52m,gMn (ICSR - 0.3 to 0.6) and 54Fe(n,ti2m,gMn (ICSR 0.4 to 0.9) reactions contain contribution from 52CreHe,t+nd+p2ni2m,gMn and54Fe(n,t+ndi2m,gMn processes, respectively.
5. Results and Discussion 117
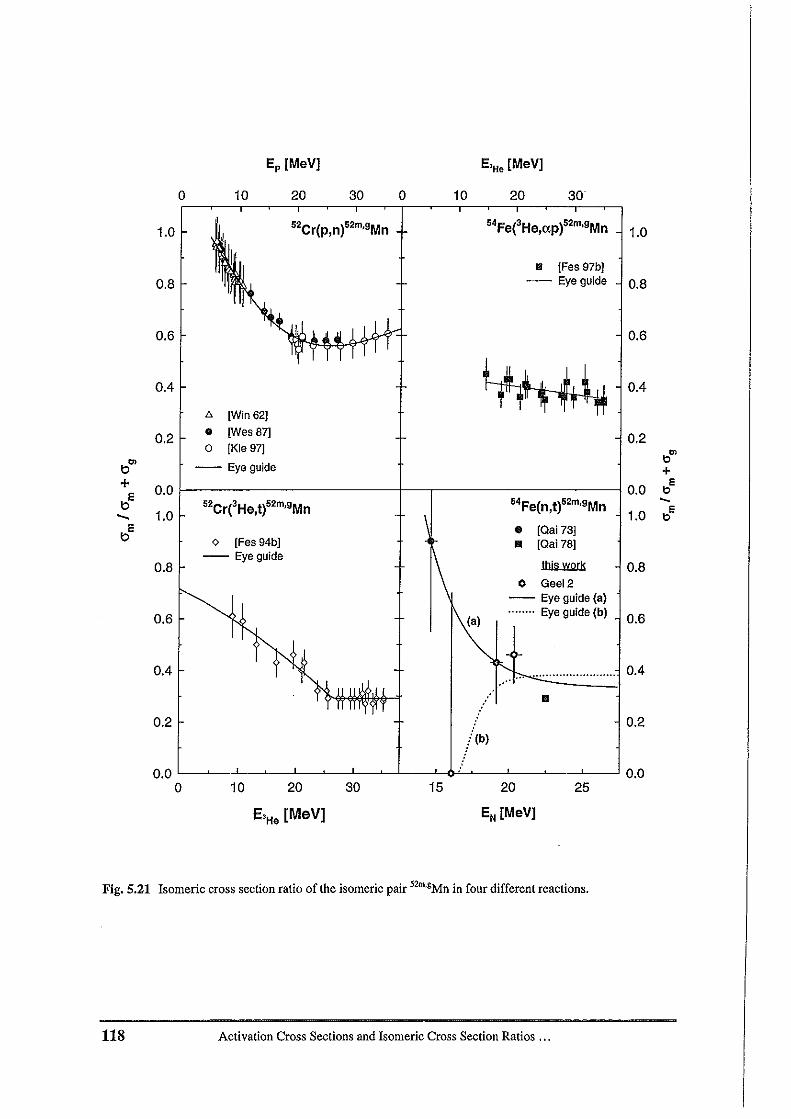
o 10
s, [MeV]
20 30 o 10 20 30
II IFes 97b]-- Eye guide 0.8
1.0
0.8
1.0
0.6 0.6
0.4 0.4
D. [WIn 62]
0.2 • [Wes 87] 0.20 {Kle 971 ..,"'
'0"' -- Eye guide ++ 0.0 0.0
E
'OE..,
52CreHe, tj52m,9Mn 54Fe(n,tj52m'9Mn ---- 1.0 1.0 ..,E
'Os • [Qa173]<> [Fes 94b] .. [Qai781
0.8-- Eyeguide
this work 0.80 Geel2-- Eye guide (a)
0.6 (a)........ Eye guide (b)
0.6
0.4 ......................... 0.4.. ,
II
0.2 0.2
0.0
.../(b)
0.00 10 20 30 15 20 25
E'He [MeV] EN [MeV]
Fig. 5.21 Isomeric cross sectionratio of the isomeric pair 52m,gMn in four differentreactions.
118 Activation Cross Sections and Isomeric Cross Section Ratios ...
5.4.3 Model Calculation
Since calculations of ICSR are strongly dependent on the input level scheme of theproduct nucleus [Qai 88], the parametershave to be chosen very carefully. In this work theisomer ratio was calculated only for the pair 53m,gFe, formed in a relatively simple (n,2n)reaction. The energies , spins, parities and branching ratios of the levels were selectedfrom the Table of Isotopes [Fir 96] and are given in Tab. 5.6. The level density in thecontinuum region was calculated with the BSFG model as explained earlier. The spindistribution of the level density was characterized by the ratio of the effective moment ofinertia eell to the rigid-body moment of inertia erig.(11 = eell I erig). The calculations wereperformed for 11 = 1.0 (see also section 4.2.4),
Since the calculation is in good agreement with the experimental data (cf. Fig. 5.20, atthe left hand side) it seems that the input parameters are well chosen. Nevertheless, tovalidate the input values of the discrete levels (energy, spin, parity, branching ratio),calculations should be done for other reactions leading to the same isomeric pair.
Tab.5.6 Energy levels of"Pe used in the STAPRE-H calculation.
741 3/T 0 (100)774 l/2- 741 (100)1328 9/2- 0 (100)1423 5/2- 741 (79),774 (21)1696 7/2 0 (5), 741 (95)1896 liT 741 (52),774 (48)2043 3/2- 0 (100)2315 liT 741 (52),774 (48)2339 lIlT 0 (13), 1328 (87)2405 51T 0 (70), 741 (23), 1423 (5), 1696 (3)2479 5/2- 741 (100)2680 3/T 741 (46),774 (43), 1423 (8), 1896 (1), 2043 (1) 2315 (1)2829 3/2- 0 (100)2845 7/2- 0 (100)2892 112- 741 (47),774 (45), 1328 (5),1423 (3)2915 7/2- 0 (73), 1328 (12), 1423 (10), 1696 (5)2926 112+ 741 (48),774 (45), 1896 (2), 2043 (1),2315 (3)2944 3/T 741 (40),774 (380),1423 (13), 1896 (4), 2043 (3), 2405 (1)2967 112+ 741 (100)3040 19/2- 2339 (99),1328 (1)
5. Results and Discussion 119
120 Activation Cross Sections and Isomeric Cross Section Ratios ...
14k
6. Summary and Conclusions¥riB@f1Mriftrw rw 'zap?5 ; rere?
The knowledge of cross sections of neutron induced reactions on the structuralmaterials Cr, Fe and Ni is important for practical applications in fusion reactor technologyas well as for testing nuclear models. The present study was performed using the activationmethod where the induced activity of a reaction product is measured off-line. In this workhigh-resolution gamma-ray spectrometry and X-ray spectrometry were used, the latter incombination with radiochemical separation and preparation of thin samples. Excitationfunctions of a total of 13 reactions were measured in the energy range between 9 and21 MeY. These included (n.p), (n.np), (n,2n), (n,o) and (n.t) reactions on the abovementioned elements. In the neutron energy range of 9.3 to 12.3 MeY irradiations wereperformed at the variable energy Compact Cyclotron CY28 at the ForschungszentrumJiilich using the D(d,n)3He reaction on a deuterium gas target, whereas in the energy rangeof 13.0 to 21.0 MeY irradiations were done at the 7 MY Van de Graaff accelerator at theCEC-JRC, JRMM at Geel using the 3H(d,ntHe reaction on a solid Ti/T target. All crosssections were determined relative to the JRDF-90.2 standard cross sections of the27AI(n,p)27Mg, 27Al(n,o:)24Na, 56Fe(n,pi6Mn and 93Nb(n,2n)92ffiNb reactions.
A pneumatic sample transport system was installed at Geel to enable measurements ofshort-lived reaction products. Compressed air was used to transport a sample container tothe target area through a plastic tube, and a vacuum pump was used to retrieve it to theremote counting room after the irradiation. This system was successfully applied to thedetermination of reaction products with half-lives ~ 10 seconds.
For the (n.p) and (n.np) reactions on the four stable Cr-isotopes, viz. 50Cr, 52Cr, 53Crand 54Cr, a systematic trend in the excitation functions could be observed. With theincreasing mass of the target nucleus, the threshold increases, the maximum of theexcitation function is shifted to higher energies and the cross section at the maximumtends to decrease for adjacent isotopes by about a factor of two. The effect is ascribed tothe Q-values of the reactions. The odd-even isotopes have a somewhat smaller thresholdthan the even-even ones, an effect attributed to pairing energy. Data were measured for thefirst time for the 52Cr(n,p)52y and 53Cr(n,pi 3y reactions in the "gap-region" between 10and 14 MeY. Beyond 14 MeY, substantial new information was obtained. In the case ofthe 52Cr(n,2n)51Crand 54Cr(n,o:iITi reactions the data base was strengthend. Thus, for allstudied reactions on the Cr-isotopes, especially for the 53Cr(n,p)53y, 54Cr(n,pi4y and54Cr(n,o:i1Ti reactions, where large discrepancies exist in the major evaiuations, thepresent data should contribute appreciably to solving those discrepancies.
The cross sections of the 50Cr(n,pn+np+p)49y reaction were measured for the first timebeyond 14 MeY using a special technique. The product 49y was separated from the Crtarget by precipitation with cupferron alongwith Fe(III) as collector from an acid solution.Iron was then separated from the vanadium by solvent extraction with diisopropyl ether
6. Summary and Conclusions 121
(DIPE) and a thin sample was prepared by precipitating the vanadium as vanadate. Theactivity measurement was then done by X-ray spectrometry,
A standard source for the efficiency calibration of the Si(Li) detector for the soft X-raysof 49y (4 and 4.5 keY) was prepared using 48y which emits X'rays of the same energiesbut also has some strong gamma-ray lines which can be used for standardization purposes.The 48y was produced in a proton irradiation on na'Cr, separated from the target by anionexchange, and a thin sample was made by adsorption of the "no carrier added" (n. c. a.)48y on a few crystals of DOWEX-IX8 and covering the sample with a thin mylar foil. Theabsolute activity of the sample was then determined via gamma-ray spectrometry.
Excitation functions were determined for two reactions on iron, namely54pe(n,2ni3m+gPe and 54pe(n,t+dni2gMn, The latter reaction was investigated for the firsttime; as expected the cross section was small (340 ub at 20.4 MeY). In the case of the(n,2n) reaction, the present measurement provided more consistent data,
As far as the reactions on Ni are concemed, the main interest was on 58Ni(n,ai5pe,
58Ni(n,api4Mn and 62Ni(n,ai9pe. The activation method allowed the measurement of thecross sections of these individual reactions whereas most of the literature data report totalhelium emission cross sections, i. e. the sum of (n,«), (n.nn) and (n.prz) reactions. In thiswork the three above mentioned reactions could be studied using na'Ni as target material.Whereas the 58Ni(n,ap)54Mn and 62Ni(n,ai9pe reactions could be studied nondestructively using gamma-ray spectrometry, the (n.o) reaction on 58Ni was measured viathe soft X-rays MnKa and MnKp emitted from the reaction product 55Pe. Therefore the55Pe was separated from the bulk of Ni using an anion-exchange column, and a thinsample was prepared by a electrodeposition. The plating of iron was carried out in a smallelectrolytic cell from an alkaline solution of Fe-citrate in an almost quantitative way.
In addition to excitation functions, isomeric cross section ratios were also measured forthe isomeric pairs formed in 54pe(n,2ni3m,gPe and 54pe(n,Hdni2m,gMn processes. Five
data points between 18.9 and 20.5 MeY could be measured for the former reaction andthree data points (one of them as upper limit) for the latter. In the first case the ratioincreases with increasing neutron energy but is generally very small. In the second case theratio decreases with increasing neutron energy. This effect is explained in terms of thehigher spin of the isomeric state as compared to that of the ground state in the first case,and the lower spin of the isomeric state in the second case. A comparison of the isomerratios in reactions induced by charged particles (p or 3He) leading to the same isomericpairs showed the same trend. The somewhat smaller isomeric cross section ratio of the54pe(n,2n)53m·gPe reaction compared to the 52CreHe,2ni3m,gPe reaction seems to be
associated with the different angular momentum distribution of the produced compoundnucleus. The higher kinetic energy of the 3He particle involved may allow the absorptionof the incident particle with higher angular momentum, resulting in somewhat enhancedpopulation of the high spin isomer.
On the basis of the experimentally determined cross sections and isomeric cross sectionratios nuclear model calculations were carried out with the code STAPRE-H in order totest the underlying models. STAPRE-H uses the Hauscr-Feshbach formula for the
122 Activation Cross Sections and Isomeric Cross Section Ratios v..
equilibrium and the Exciton or Geometry Dependent Hybrid (GDH) Model for the preequilibrium (PE) contribution. Starting from input parameters from the literature, aconsistent parameter set for all reactions was developed by small adjustments of the leveldensity parameters in order to obtain a better reproduction with the experimental values.The influence of the PE contribution to the cross section was investigated with the two PEmodels and by varying the FM parameter in the Exciton Model. GDH and Exciton Modelgave almost similar results. It was found that the decrease of FM increases the PE fractionand makes the first chance emission spectrum harder, which reduces the second chanceemission. The influence of the level density was tested by using different level densityformulas. The best results were obtained by using the semi-empirical Back Shifted FermiGas (BSFG) Model up to 20 MeV. Attempts to use a more realistic level density formulaat higher energies gave unsatisfactory results.
Most of the reactions could be described by the model calculation with deviations of± 10 % to the experiment. This shows that the underlying models can reproduce theexcitation functions satisfactorily, provided the input parameters are well chosen.
The author of this dissertation is convinced that the cross sections of the neutroninduced reactions on Cr, Fe and Ni, determined in this work, substantially improved theexisting data base. The present data were successfully used to determine a uniqueparameter set for testing nuclear model predictions in one particular mass range. In thefuture, the data should be useful for practical applications, like fusion reactor technology,since all these isotopes are important components of structural materials. The merits andproblems of the various alloys of these elements can be addressed more reliably by nuclearengineers.
6. Summary and Conclusions 123
124 Activation Cross Sections and Isomeric Cross Section Ratios ...
7. Zusammenfassung
Die Kenntnis von Wirkungsquerschnitten von neutroneninduzierten Kernreaktionen anden Struktunnaterialien Chrom, Eisen und Nickel ist wichtig fur die Entwicklung und dasDesign von Fusionsreaktoren sowie zum Test von Kernreaktionsmodellen. In dieser Arbeitwurden Wirkungsquerschnitte und isomere Wirkungsquerschnittsverhaltnisse mit derAktivierungstechnik bestimmt, eine Methode bei der die induzierte Aktivitat einesReaktionsprodukts "off-line" gemessen wird, d. h. die Bestrahlung der Aktivierungsprobeund ihre Messung erfolgen zeitlich und raurnlich getrennt. Die Aktivitatsmessung erfolgteentweder mit hochauflosender Gammaspektrometrie oder Rontgenspektrometrie. Imletzteren Fall wurden die Reaktionsprodukte radiochemisch von den bestrahlten Probenabgetrennt und dunne Messproben hergestellt. So wurden Anregungsfunktionen von (n,p),(n,np)-, (n,2n)-, (n.n)- und (n,t)-Kernreaktionen, insgesamt 13 verschiedene Reaktionen,an den oben bezeichneten Elementen im Neutronenenergiebereich zwischen 9 und 21MeV bestimmt. Zwischen 9.3 und 12.3 MeV wurden die Bestrahlungen amKompaktzyklotron CV 28 des Forschungszentrums Jiilich durchgefiihrt. Die Neutronenwurden tiber die D(d,n)3He Reaktion an einem Deuterium Gas-Target erzeugt. ImEnergiebereich zwischen 13.0 und 21.0 MeV erfolgten die Bestrahlungen am 7 MV Vande Graaff Beschleuniger des CEC-JRC, IRMM in Geel, Belgien. Hier wurden dieNeutronen tiber die T(d,n)4He Reaktion an einem Tiff Target erzeugt. Aile
Wirkungsquerschnitte wurden relativ zu den IRDF-90.2 Referenzwirkungsquerschnittender Kernreaktionen 27Al(n,pi7Mg, 27Al(n,a)24Na, 56Fe(n,p)56Mn und 93Nb(n,2n)92mNb
gemessen.Fur die Messung von kurzlebigen Reaktionsprodukten wurde in Geel eine
Rohrpostanlage installiert. Ein kleiner Probencontainer wurde in einer Plastikrohre mitPressluft zum Neutronentarget transportiert und nach der Bestrahlung mit einerVakuumpumpe zuruck zum Messraum gebracht. Dieses System wurde erfolgreich fur dieBestimmung von Reaktionsprodukten mit Halbwertszeiten ;::: lOs angewendet.
Eine Systematik wurde fur die Anregungsfunktionen der (n.p) und (n,np) Reaktionen anden vier stabilen Chrom-Isotopen (50Cr, 52Cr, 53Cr und 54Cr) beobachtet. Mit zunehmender
Masse des Targetnuklids nimmt die Schwellenenergie zu, das Maximum derAnregungsenergie verschiebt sich nach hoheren Neutronenenergien und derWirkungsquerschnitt am Maximum reduziert sich zwischen benachbarten Isotopenungefahr urn den Faktor zwei; ein Effekt, der den unterschiedlichen Q-Werten derReaktionen zugeschrieben wird. Die Isotope mit ungerader Massenzahl haben eine etwasniedrigere Reaktionsschwelle als die Isotope mit gerader Massenzahl aufgrund derfreiwerdenden Paarungsenergie.
Zum ersten Mal wurden in dieser Arbeit Wirkungsquerschnitte in der sogenannten"Gap-Region" zwischen 10 und 14 MeV fur die Reaktionen 52Cr(n,pi2V und 53Cr(n,pi3V
7. Zusanunenfassung 125
gemessen. Oberhalb 14 MeY wurden wertvolle neue Informationen fur den Verlauf derAnregungsfunktionen erhalten. Im Palle der 52Cr(n,2n/ICr und 54Cr(n,o:/ITi Reaktionenwurde die Datenbasis erweitert und bekannte Daten erhartet, Mit den neuen Daten wurdenfur aile untersuchten Kernreaktionen an Cr-Isotopen wichtige Kenntnisse erzielt, urnbestehende Diskrepanzen in den bedeutendsten Evaluierungen (ENDPIB-VI, JENDL-3.2und JEP-2.2), besonders fur die Reaktionen 53Cr(n,pi3y, 54Cr(n,p)54y und 54Cr(n,o:/ITi,aufzuklaren,
Die Wirkungsquerschnitte der Kernreaktion 50Cr(n,pn+np+d)49y konnten mittels einerspeziel entwickelten Technik erstmals oberhalb 14 MeY bestimmt werden. DasReaktionsprodukt 49y wurde vom Cr-Target durch Ausfallen mit Kupferron (zusammenmit Pe(I!I) als nichtisotopem Trager) aus einer sauren Losung radiochemisch abgetrennt.Anschliel3end wurde das Eisen durch Extraktion mit Diisopropylether (DIPE) vonVanadium abgetrennt, das Vanadium als Vanadat ausgefallt, zum Y205 gegltiht und einedunne Messprobe durch Sedimentation des Y205 aus einer Toluollosung hergestellt. DieAktivitat des 49y wurde dann rontgenspektrometrlsch bestimmt.
Pur die Bestimmung der Ansprechwahrscheinlichkeit des fur die Rontgenspektrometrieverwendeten Si(Li) Detektors wurde eine 48Y-Standardprobe hergestellt. 48y emittiertdieselben Rontgenstrahlen wie 49y, besitzt aber dartiberhinaus auch einige intensiveGammastrahlen die fur die Standardisierung der Probe geeignet sind. Das 48y wurde durchdie Bestrahlung von natCr mit Protonen produziert (Kernreaktion 52Cr(p,o:n)48y) und ubereine Anionenaustauschersaule abgetrennt, Anschliel3end wurde eine tragerfreie Probedurch Fixierung des 48y an einigen Kristallen DOWEX-1X8 hergestellt und zum Schutzmit einer dunnen Mylarfolie abgedeckt. Die absolute Aktivitat der Probe wurde danngammaspektrometrisch bestimmt.
Pur zwei Reaktionen an Eisen, 54pe(n,2n)53m+gPe und 54pe(n,t/2gMn, wurden
Anregungsfunktionen bestimmt. Die letztere wurde zum ersten Mal untersucht. Wieerwartet war der Wirkungsquerschnitt von 340 ub (bei 20.4 MeY) sehr klein. Im Palle der(n,2n)-Reaktion lieferten die Datenpunkte dieser Arbeit konsistentere Werte gegenuberden etwas streuenden Literaturdaten.
Im Palle von Nickel als Targetelement lag das Hauptinteresse der Untersuchung in denReaktionen 58Ni(n,o:i5pe, 58Ni(n,o:pi4Mn und 62Ni(n,o:i9pe. Die Aktivierungstechnikermoglichte die Messung von Wirkungsquerschnitten der einzelnen Reaktionen wogegendie meisten Literaturdaten sich auf die totale Heliumemission beziehen, d. h. die Summeder (n.n)«, (n.na)- und (n.po)- Reaktionen. In dieser Arbeit wurden die drei erwahntenReaktionen mit natNi als Targetmaterial untersucht. Im Palle der 58Ni(n,o:pi4Mn und62Ni(n,o:i9pe Reaktionen konnte die Aktivitat del' Reaktionsprodukte gammaspektrometrisch gemessen werden, wogegen die durch die (n,o:)-Reaktion an 58Niinduzierte 55Pe Aktivitat tiber die niederenergetischen Rontgenstrahlen (MnK" und MnKp)bestimmt wurde, Hierzu wurde unter Zugabe von etwas inaktivem Fe-Trager das 55Pe vornNi-Target uber eine Anionenaustauschersaule abgetrennt und elektrolytisch auf einerGoldfolie abgeschieden. Die Abscheidung erfolgte aus einer alkalischen Fe-Citratlosung ineiner kleinen Elektrolysezelle und war nahezu quantitativ.
126 Activation Cross Sections and Isomeric Cross Section Ratios ...
Zusatzlich zu den Anregungsfunktionen wurden fur die tiber die Kernreaktionen54Pe(n,2ni3m·gpe und 54Pe(n,t)52m,gMn gebiideten Isomerenpaare die isomeren
Wirkungsquerschnittsverhaltnisse bestimmt, Piinf Datenpunkte zwischen 18,9 und 20.5MeV konnten fur die (n,2n)- und drei Datenpunkte (einer davon als obere Grenze)zwischen 16 und 20 MeV fur die (n,t)-Reaktion bestimmt werden. Im ersteren Pall nimmtdas Verhaltnis mit zunehmender Neutronenenergie zu, ist aber generell sehr klein. Imzweiten Pall nimmt das Verhaltnis mit zunehmender Neutronenenergie ab, Dieser Trendkann mit den unterschiedlichen Spins der isomeren Zustande und Grundzustande erklartwerden; im ersten Pall hat der isomere Zustand den hoheren Spin wogegen im zweiten Pallder Grundzustand den hoheren Spin besitzt. Ein Vergleich der isomeren Wirkungsquerschnittsverhaltnisse mit Kernreaktionen mit geladenen Teilchen als Projektil zeigteden gleichen Trend. Das etwas geringere isomere Wirkungsquerschnittsverhaltnis der54pe(n,2n)53m,gpe Reaktion gegeniiber der 52CreHe,2ni3m,gpe Reaktion scheint mit dem
erzeugten Drehmoment des Compoundkerns zusammenzuhangen, Die etwas hoherekinetische Energie des 3He_Teilchens konnte die Aufnahme des Projektils mit einem etwas
hoheren Drehmoment ermoglichen, was zu einer etwas griiBeren Bevolkerung des Isomersmit dem hohercn Spin fiihren konnte,
Auf der Grundlage der experimentell bestimmten Wirkungsquerschnitte und isomerenWirkungsquerschnittsverhaltnisse wurden Kernmodellrechnungen mit dem ProgrammSTAPRE-H durchgefuhrt, urn die zugrundeliegenden Kernmodelle zu testen. STAPRE-Hverwendet die Hauser-Feshbach Pormel fur die Berechnung des Gleichgewichtsanteils unddas Excitonenmodell oder das "Geometry Dependent Hybrid Model" (GDH) fur dieBestimmung des Vorgleichgewichtsanteils, Ausgehend von aus Literaturwerkenausgewahlten Eingabeparametern wurde ein einheitlicher Parametersatz entwickelt mitdem aile Kernreaktionen berechnet wurden. Hierzu wurden einige Niveaudichteparametergeringfugig abgeandert, urn eine bessere Ubereinstimmung der experimentellen Daten mitden Rechnungen zu erzielen. Der EinfluB des Vorgieichgewichtsanteils wurde mit denbeiden Vorgleichgewichtsmodellen untersucht, wobei der PM Parameter imExcitonenmodell variiert wurde. Die erzielten Ergebnisse mit beiden Modellen sindnahezu identisch. Bei Abnahme des PM Parameters nimmt die Vorgleichgewichtsemissionzu; die "first chance" Emission verschiebt sich zu hoheren Energien wahrend die "secondchance" Emission verringert wird. Der EinfluB der Niveaudichte wurde durch die Wahlunterschiedlicher Niveaudichteformeln untersucht. Die besten Ergebnisse wurden mit demhalbempirischen "Back-Shifted Penni Gas Model" (BSPG) erzielt, Rechnungen mit einerrealistischeren Niveaudichteformel bei hoheren Energien gaben keine zufriedenstellendenErgebnisse,
Die Mehrzahl der Reaktionen konnte mit den Modellrechnungen gut beschriebenwerden. Die Abweichungen zwischen Experiment und Modellrechnung lagen meist bei± 10 %. Dies zeigt daB die zugrundeliegenden Modelle die Anregungsfunktionen gutreproduzieren konnen, vorausgesetzt die Eingabeparameter sind sorgfaltig ausgewahlt.
Der Verfasser dieser Dissertation ist davon uberzeugt, daB die-in dieser Arbeitbestimmten Wirkungsquerschnitte der neutroneninduzierten Kernreaktionen an den
7. Zusammenfassung 127
Struktunnaterialien Chrom, Eisen und Nickel die bestehende Datenbasis entscheidendverbessert haben. Die bestimmten Daten wurden erfolgreich fur die Entwicklung eineskonsistenten Parametersatzes zum Testen von Kernreaktionsmodellen in einem definiertenKernmassenbereich (A -50) eingesetzt. In der Zukunft sollten die Daten fur technischeAnwendungen nutzlich sein, wie z. B. fur die Entwicklung von Fusionsreaktoren, da aIleuntersuchten Isotope wichtige Komponenten von Struktunnaterialien sind. Die Vorzugeund Probleme der verschiedenen Legierungen dieser Elemente konnen von Ingenieurenund Reaktortechnikern besser eingeschatzt werden, wodurch die Wahl geigneterMaterialien erleichtert wird.
128 Activation Cross Sections and Isomeric Cross SectionRatios ...
, 'dff
References
[Ait 87][All 61]
[Alv 72][And 68]
[Ara 73]
[Art 80]
[Arn 92]
[Aud 95]
[Avr 87a]
[Avr 87b]
[Avr 88a][Avr 88b]
[Avr 88e]
[Avr 90][Avr 94a]
[Avr 94b][Avr 95a]
[Avr 95b]
[Bab 94a]
[Bab 94b]
S. Ait-Tahar, Nue!' Phys. 13, 121 (1987).D. Allan, Nue!. Phys. 24, 274 (1961).
K. R. Alvar, Nue!. Phys. A195, 289 (1972).M. F. Andreev and V. I. Serov, SOy. J. Nue!. Phys. 7, 454 (1968).
J. Araminowicz and J. Dresler, Progress Report INR 1464, lost. BadanJadrowyeh, Warsaw, Poland, 14 (1973).
E. D. Arthur and P. G. Young, Report LA-8626-MS (ENDF-304), Los Alamos
National Laboratory, U.S.A. (1980).R. Arndt and L. Workman, "The H(n,n)H Cross Section from 20 to 350 MeV",
in [Con 92], 10 (1992).G. Audi and A. H. Wapstra, Nuc!. Phys. A595, 409(1995).
M. Avrigeanu, M. Ivaseu and V. Avrigeanu, "STAPRE-H - A Computer Code
for Particle Induced Activation Cross Sections and Related Quantities",
Report NP-63-1987, IPNE Bucharest, P. O. Box MG-6, Romania (1987).
M. Avrigeanu, M. Ivaseu and V. Avrigeanu, Atomkemenergie - Kerntechnik,
49, 133 (1987).M. Avrigeanu, M. Ivaseu and V. Avrigeanu, Z. Phys. A329, 177 (1988).
M. Avrigeanu, M. Ivascu and V. Avrigeanu, STAPRE-H, as computer file, illIAEA 0971, NEA Data Bank, Paris, France (1988).
M. Avrigeanu, M. Ivascu and V. Avrigeanu, "Fast Neutron Reaction Data
Calculation with the Computer Code STAPRE-H", in [Met 88], 762 (1988).
M. Avrigeanu, M. Ivascu and V. Avrigeanu, Z. Phys. A335, 299 (1990).V. Avrigeanu, P. E. Hodgson and M. Avrigeanu, Phys. Rev. C49, 2136 (1994).M. Avrigeanu and V. Avrigeanu, J.l:'hys. G: Nuc!. Part. Phys. 20, 613 (1994).
M. Avrigeanu and V. Avrigeanu, "Recent Improvements of the STAPRE-H
Preequilibrium and Statistical Model Code", Report NP-86-1995, IPNE
Bucharest, P. O. Box MG-6, Romania (1995).M. Avrigeanu, A. Harangozo and V.Avrigeanu, "Surface effects in Feshbach
Kerman-Koonin analysis of(n,n') and (n,p) reactions at 7 to 26 MeV", ReportNP-85-1995, IPNE Bucharest, P. O. Box MG-6, Romania (1995).M. Baba, N. Ito, I. Matsuyama, S. Matsuyama, N. Hirakawa, S. Chiba, T.
Fukahori, M. Mizumoto, K. Hasegawa and S. Meigo, "Measurement of
Double-Differential (n.a) Cross Sections ofFe, Ni, Cu and 50Crfor 4.5 - 14.1
MeV Neutrons", in [Dic 94], 941 (1994).M. Baba, N. Ito, I. Matsuyama, S. Matsuyama, N. Hirakawa, S. Chiba, T.Fukahori, M. Mizumoto, K. Hasegawa and S. Meigo, J. Nue!. Sci Tee. 31,745
(1994).
References 129
[Bad 91]
[Bah 84]
[Bah 85]
[Bar 52][Ber 81]
[Ber 87]
[Bir 75]
[Bir 92]
[Bir 94a]
[Bir 94b][Bir 95]
[Ela 73]
[Bla 75]
[Ble 95]
[Boc 83]
[BOd 87]
[Bor 68]
[Bor 76]
[Bos 94]
[Bra 72]
[Bre 70]
[Bre 72]
130
S. A. Badikov and A. B. Pashenko, "Comparative Analysis of (n.p) ReactionCross Section Systematics for 14 - 15 meV Neutrons", Report INDC(CCP)325, IAEA, Vienna, Austria (1991).
B. M. Bahal and R. Pepelnik, Report GKSS 84/E, ForschungszentrumGeesthacht GmbH (1984).
B. M. Bahal and R. Pepelnik, Report GKSS 85/E/11, ForschungszentrumGeesthacht GmbH (1984).
H. H. Barschall, L. Rosen, R. F. Taschek, Rev. Mod. Phys. 24, 1 (1952).
O. Bersillon, Report CEA-N-2227, CE Bruyeres-le-Chatel, France (1981).M. J. Berger and J. H. Hubbel, "XCOM: Photon Cross Sections on a PersonalComputer", Internal Report National Bureau of Standards, NBSIR 87-3597,Gaithersburg, U.S.A. (1987).
T. Biro, S. Sudar, Z. Miligy, Z. Dezso and J. Csikai, J. Inorg. Nucl. Chern. 37,1583 (1975).
I. G. Birn, "NEUT - Ein Programm zur Berechnung von Neutronenspektrenerzeugt durch die D(d,nlHe-Reaktion in einem. Gastarget am Zyklotron",Internal Report KFA-INC-ffi-lI92, Forschungszentrum Jttlich GmbH (1992).
I.-G. Birn, "Calculation of the Mean Energy and the Energy Spread ofNeutrons produced by the D(d,nlHe reaction in a Gas Target", InternalReport GEIRNG/85/94, CEC-JRC IRMM Geel (1994).
I.-G. Bim and S. M. Qaim,Nuc!. Sci. Eng. 116, 125 (1994).I.-G. Birn, B. Strohmaier, H. Freiesleben and S. M. Qaim, Phys. Rev. C52,
2546 (1995).M. Blann, Report COO-3494-10, Rochester University, (1973).
M. Blann, Ann. Rev. Nuc!. Sci. 25, 123 (1975).
G. Blessing, W. Brautigam, H. G. Boge, N. Gad, B. Scholten and S. M. Qaim,Appl. Radiat. Isot. 46, 955 (1995).
K. H. Bockhoff (Editor), "Nuclear Data for Science and Technology",Proceedings of an International Conference, held in Antwerp, Belgium, 6 - 10
Sep. 1982, D. Reidel Publishing Company, Dordrecht, Holland (1983).Z. BOdy (Editor), "Handbook on Nuclear Activation Data", Technical Report
Series No. 273, IAEA, Vienna, 29 (1987).M. Bormann, A. Behrend, I. Riehle and O. Vogel, Nuc!. Phys. A115, 309
(1968).M. Bormann, H.-K. Feddersen, H.-H. Holscher ,W. Scobel and H. Wagener, Z.
Phys. A277, 203 (1976).M. Bostan and S. M. Qaim, Phys. Rev. C49, 266 (1994).
G. M. Braga-Marcazzan, E. Gadioli-Erba, L. Millazzo-Colli and P. G. Sona,Phys. Rev. C6, 1398 (1972).
M. Brendle, M. Morike, G. Staudt and G. Steidle, Nucl. Instr. Meth. 81, 141(1970).H. J. Brede, Z. Physik 254,364 (1972).
Activation Cross Sections and Isomeric Cross Section Ratios ...
[Byc 80]
[Cab 90]
[Cha 32a][Cha 32b][Chi 62]
[Chi 89]
[Cie 83]
[Cie 94]
[Cii 71][Can 92]
[Cor 78]
[Cri 71]
[Cse 94][Csi 87]
[CSI97]
[De 67]
[Deb 79][Deb 88]
[Den 95][Dic 94]
[Die 82]
[Dil 73]
V. M. Bychkov, V. N. Manokhin, A. B. Pashenko and V. 1. Plyashin, "CrossSections for the (n.p), (n,a) and (n,2n) Threshold Reactions", ReportINDC(CCP)-146, IAEA, Vienna, Austria (1980).S. Cabral, G. Borker, H. Klein and W. Mannhart, Nucl. Sci. Eng. 106, 308(1990).J. Chadwick, Nature 129, 312 (1932).J. Chadwick, Proc. Roy. Soc. (London) A136, 692 (1932).D. M. Chittenden, Il., D. G. Gardner and R. W. Fink, Phys. Rev. 122, 860(1962).S. Chiba, M. Mizumoto, K. Hasegawa, Y. Yamanouti, M. Sugimoto, Y.Watanabe and M. Drosg, Nucl. Instr. Meth, A281, 581 (1989).S. Cierjacks (Editor), "Neutron Sourcesfor Basic Physics and Applications",an OECDINEA Report, Pergamon Press (1983).S. Cierjacks and K. Shibata, "Blind Intercomparison of Nuclear Models forPredicting Charged Particle Emission", Report NEAlNSCfDOC(93)4, OECD(1994).C. K. Cline and M. Blann, Nucl. Phys. AI72, 225 (1971).H. Conde (Editor), "Nuclear Data Standards for Nuclear Measurements",Report NEANDC-31I, INDC(SEC)-101, NEA, France (1992).V. Coralciuc, B. Holmquist, B. Marcinkowski and A. Prokopets, Nucl. Phys.A307, 445 (1978).D. F. Crisler, J. J. Jarmer and H. B. Eldridge, Nucl. Instr, Meth. 94, 285(1971).F. Cserpak, S. Sudar, J. Csikai and S. M. Qaim, Phys. Rev. C49, 1525 (1994).J. Csikai, "Handbook of Fast Neutron Generators", Vol. I, CRC Press, Inc.,Boca Raton, Florida (1987).CSISRS, Experimental Nuclear Data from the Data Base at BNL, as computerfile from http://t2.lanl.gov/dataldata.html, (1997).A. K. De" S. M. Khopkar and R. A. Chalmers, "Solvent Extraction ofMetals", Van Nostrand Reinhold Company, London (1967).K. Debertin and U. Schotzig, Nucl. Instr. Meth, 158,471 (1979).K. Debertin and R. G. Helmer, "Gamma and X-Ray Spectrometry withSemiconductor Detectors", North-Holland, Amsterdam, Oxford, New York,
.Tokyo (1988).F. - O. Denzler, F. Rosch and S. M. Qaim, Radiochimica Acta 68, 13 (1995).J. K. Dickens (Editor), Proc. Int. Conf. Nucl. Data Sci. Tec., 9 - 13 May 1994,Gatlinburg, U.S.A. (1994).G. Dietze, H. Klein, "NRESP4 and NEFF4 - Monte Carlo codes for thecalculation of neutron response functions and detection efficiencies forNE 213 scintillation detectors", Report PTB-ND-22, PTB Braunschweig,Germany (1982).W. Dilg, W. Schantl, H. Vonach and M. Uhl, Nucl. Phys. A217, 269 (1973).
References 131
[Dit 90]
[D6c 97a]
[D6c 97b]
[Dol 76]
[Dra 77]
[Dra 89][Dro 90][Dun 80]
[Ede 72][Elm 87]
[Fas 94]
[Fas 96]
[Fer 77][Fes 80][pes 85]
[Fes 94a]
[Fes 94b]
[Fes 96][Fes 97a]
[Fes 97b][Few 68][Fir 96]
[Fis 72]
[For 86]
132
B. Dittrich, "Radiochemische Untersuchung protonen- und a-indurierterSpallations- und Fragmentationsreaktionen mit Hilfe der r- undBeschleunigennassen-Spektrometrie", Dissertation Universitat zu Koln(1990).
R. D6czi, V. Semkova, A. D. Majdeddin, Cs. M. Buczko and J. Csikai,
"Investigations on (n.p) Cross Sections in the 14 MeV Region", ReportINDC(HUN), IAEA, Vienna, Austria, in press.
R. D6czi, A. D. Majdeddin, M. Varnagy, Cs. M. Buczko and J. Csikai, "Statusof Systematics in (n,p) and (n.a) Cross Sections at around 14 MeV", in [Ref97], to be published.
G. P. Dolya, A. P. Klyuscharev, V. Bozhko, V. Y. Golovnya, A. S. Kachanand A. I. Tutubalin, Proc 3'd All-Union Conf. Neutron Physics, Kiev, 173
(1976).
D. M. Drake, G. F. Auchampaugh, E. D. Arthur, C. E. Ragan and P. G. Young,Nuc!. Sci. Eng. 63, 401 (1977).
L. Drapchinsky, Nuc!. Instr. Meth A282, 308 (1989).M. Drosg, Nuc!. Sci. Eng. 106, 279 (1990).V. E. Dunakov, Proc. Trieste Course on Nuclear Theory for Applications 1978, IAEA-SMR-43, 255 (1980).
G. Eder, G. Winkler and P. PhiIIe, Z. Physik 253,355 (1972).D. Elmore, and F. M. Philips, Science 236,543 (1987).
M. FaBbender, A. F. Novgorod, F. Rosch and S. M. Qaim, Radiochim. Acta65,215 (1994).
M.FaBbender, "Aktivierungsquerschnitte von (p.xt-Prozessen an biologischrelevanten Elementen im Energiebereich von 50 bis 350 MeVfur medizinischtherapeutischeAnwendungen", Dissertation Universitat zu Koln (1996).J. C. Ferrer, J. D. Carlson and J. Rapaport, Nuc!' Phys. A275, 325 (1977).
H. Feshbach, A. Kerman and S. Koonin, Ann. Phys. 125,429 (1980).H. Feshbach, Ann. Phys. 159, 150 (1985).
A. Fessler, Z. B. Alfassi and S. M. Qaim, Radiochimica Acta 65, 207 (1994).A. Fessler, Diploma Thesis, Universitat zu Koln (1994).
A. Fessler and S. M. Qaim, Radiochimica Acta 72, 121 (1996).A. Fessler, unpublished.
A. Fessler et a!' , to be published.T. R. Fewell, Nuc!. Instr, Meth. 61, 61 (1968).
R. B. Firestone, "Table of Isotopes", Vo!. 1 and 2, V. S. Shirley (Editor),Wiley & Sons, Inc., New York, U.S.A. (1996).
A. Fischer and L. Turi, "The RFSP Program for Unfolding Neutron Spectrafrom Activation Data", Report INDC(HUN)-8/u, IAEA, Vienna (1972).R. A. Forrest, "Systematics of Neutron -Induced Threshold Reactions withCharged Products at about 14.5 MeV", Report AERE-RI2419, UKAEAAtomic Energy Research Establishment, Harwell (1986).
ActivationCrossSections and IsomericCross SectionRatios ...
[Fre 59]
[Fre 80]
[Fow 80]
[Fu 80]
[Fu 96]
[Gad 76]
[Gar 62]
[Gar 64]
[Gar 79]
[Gar 81]
[Gho 87]
[Gmn 82]
[God 95]
[Gov 94]
[Gra 85]
[Gra 87]
[Gra 93]
[Gra 94]
[Gri 66]
[Gri 77]
[Gri 78]
[Gri 79]
H. Preiser and G. H. Morrison, Ann. Rev. Nne!. Sci. 9,221 (1959).
W. Frehaut, A. Bertin, R. Bois and J. Jary, "Neutron Cross Sections at 10 to50 MeV", BNL, Brookhaven, 399 (1980).
J. 1. Fowler, J. A. Cookson, M. Hussain, R. B. Schwartz, M. T. Swinhoe, C.
Wise and C. A. Uttley, Nnel. Instr. Meth. 175, 449 (1980).
C. Y. Fu, "TNG: A two Step Hauser-Feshbach Code with PrecompoundDecays and Gamma-Ray Cascades", Technical Memorandum, Oak RidgeNational Laboratory, (1980).
C. Y. Fu and D. C. Larson (Eds.), "Comparison of Evaluated Data forChromium-52, Iron-56 and Nickel-58", Report NEAlWPEC-I, NEAlOECD,Paris, France (1996).
E. Gadioli, E. Gadioli-Erba, 1. Sajo-Bohus and G. Tagliaferri, Rev. Nouvo
Cim. 6, 1 (1976).
D. G. Gardner, Nucl, Phys. 29, 373 (1962).
D. G. Gardner and Yn-Wen Yn, Nue!. Phys. 60,49 (1964).
D. G. Gardner and F. S. Dietrich, Report UCRL-82998, LLNL, Livermore,
U.S.A. (1979).
M. A. Gardner and D. G. Gardner, Report UCRL-86265, LLNL, Livermore,
U.S.A. (1979).
S. K. Ghorai, J. R. Williams and W. 1. Aford, J. Phys. G: Nne!. Phys. 13,405(1987).
S. Gmuca and I. Ribansky, Nne!. Instr. Meth. 20, 435 (1982).
C. Goddio, E. Watteeamps and I.-G. Birn, "Comparison of two independentbackground determinations for flueence measurements by the Bonner spheretechnique applied at 2.5 and 16.0 MeV", Internal Report GENG/87/95, CEC
JRC, IRMM Geel (1995).
A. A. Goverdovski, V. A. Khryaehkov, V. V. Ketlerov, V. F. Mitrofanov, H.
Vonaeh and R. C. Haight, "(n.a) Reaction Studies Using a Gridded IonisationChamber", in [Dic 94] 117 (1994).
P. W. Gray and A. Ahmad, Nucl, Insr. Meth. A237, 577 (1985).
S.1. Graham, M. Ahmad, S. M. Grimes, H. Satyanarayana and S. K. Saraf,
Nne!. Sci. Eng. 95, 60 (1987).
A. Grallert, J. Csikai, S. M. Qaim and J. Knieper, Nnel. Instr. Meth. A334, 154
(1993).
A. Grallert, J. Csikai and S. M. Qaim, Nnel. Instr. Meth. (Letters) A337, 615
(1994).
1. J. Griffin, Phys. Lett. 17,478 (1966).
S. M. Grimes, R. C. Haight and J. D. Anderson, Nne!. Sci. Eng. 62, 187
(1977).
S. M. Grimes, R. C. Haight and J. D. Anderson, Phys. Rev. C17, 508 (1978).
S. M. Grimes, R. C. Haight, K. R. Alvar, H. H. Barsehall and R. R. Borchers,
Phys. Rev. C19, 2127 (1979).
References 133
[Gri 96]
[Gru 85]
[Gru 88]
[GuI95]
[Hah 21]
[Hah 45][Hai 81]
[Hai 89]
[Hai 90]
[Hai 96]
[Hai 97a]
[Hai 97b]
[Haln]
[Han 73]
[Hal' 68][Hal' 71]
[Hal' 71][Hau 52]
[Hay 51]
[HeI80][HeI83][Her 82]
134
S. M. Grimes, C. E. Brient, F. C. Goecker, F. B. Bateman, M. B. Chadwick, R.C. Haight, T. M. Lee, S. M. Sterbentz, P. G. Young, D. A. Wasson and H.Vonach, Nucl. Sci. Eng. 124, 271 (1996).
H. Gruppelar and J. M. Akkermans, "The GRAPE Code System for theCalculation of Precompound and Compound Nuclear Reactions - GRYPHONCode Description and Manual", Report ECN-164 (1985).
H. Gruppelar et al. "The REAC-ECN-3 Data Library with Neutron Activationand Transmutation Cross Sections for Use in Fusion Reactor Technology",Report ECN-207, Petten, Netherlands (1988).
K. Gul, "Systematics of(n,p) and (n,a) Cross Sections for 14 MeV Neutrons onthe Basis of Statistical Model", Report INDC(pAK)-009, IAEA, Vienna(1995).
O. Hahn, Chern. Berichte 54, 1131 (1921).P. F. Hahn, Ind. Eng. Chern. 17, 45 (1945).
R. C. Haight, S. M. Grimes, R. G. Johnson and H. H. Barschall, Phys. Rev.C23, 700 (1981).
R. C. Haight, "Activation with an Intense Source of Monoenergetic Neutronsin the Range 8 - 14 MeV", Proc. NEANDC Specialists' Meeting for Neutron
Activation Cross Sections for Fission and Fusion Applications, ArgonneNational Laboratory, 13. -15. Sept. 1989, Report NEANDC-259U, 95 (1989).R. C. Haight and J. Garibaldi, Nucl. Sci. Eng. 106, 296 (1990).
R. C. Haight, D. W. Kneff, B. M. Oliver, L. R. Greenwood and H. Vonach,
Nucl. Sci. Eng. 124,219 (1996).R. C. Haight, "Charged Particles Produced in Neutron Reactions on Nucleifrom Beryllium to Gold", in [Ref 97], to be published.R. C. Haight, F. B. Bateman, S. M. Sterbenz, M. B. Chadwick, P. G. Young, S.M. Grimes, O. A. Wasson, P. Maier-Komor and H. Vonach, "The 58,6oNi(n,a)Reactions from Threshold to 50 MeV", in [Ref 97], to be published.G. M. Hale and P. G. Young, "The H(n,n)H Cross Section below 20 MeV", in
[Con 92], 10 (1992).L. F. Hansen, J. D. Anderson, P. S. Browne, R. J. Howerton, J. L.Kammerdiener, C. M. Logan E. F. Plechaty and C. Wong, Nucl. Sci. Eng. 51,278 (1973).G. D. Harp, J. M. Miller and B. J. Berne, Phys, Rev. 165, 1166 (1968).G. D. Harp and J. M. Miller, Phys. Rev. C3, 1847 (1971).M. Haring, H. Vonach and E. J. Feicht, Z. Physik 244,352 (1971).
W. Hauser and H. Feshbach, Phys. Rev. 87, 336 (1952).H. R. Haymond, W. M. Garrison, J. G. Hamilton, J. Chern. Phys. 17, 382
(1951).R. G. Helmer and M. A. Lee, Nucl. Instr. Meth 178, 499 (1980).
R. G. Helmer, Int. J. Appl. Radiat, Isot. 34,1105 (1983),G. Herrmann and N. Trautmann, Ann. Rev. Nucl. Part. Sci. 32, 117 (1982).
ActivationCrossSectionsand IsomericCross SectionRatios ...
[Hoa 86]
[Hod 88]
[HoI 74]
[Hua 97][Hus 67][Hus 68][IAE 86]
[Iga 88]
[Ign 75]
[Ike 88]
[Ike 92]
[Ito 94]
[Iva 87]
[Iwa 93]
[Iwa 94]
[Jac 87][Ka173][KaI75][KaI90]
[KaI91]
[Kam 74]
Hoang Dac Luc, Inst. of Physics, Acad. of Science, Hanoi, in [MeL 88],(1986).P. E. Hodgson, "Pre-Equilibrium Processes in Nuclear Reactions;Intercomparison ofTheories and Codes", in [Iga 88], 655 (1988).P. Holmberg, R. Rieppo, J. K. Keinanen and M. Valkonen, J. Inorg. Nucl.Chern. 36, 715 (1974).X. Huang and D. Cai, Nucl. Sci. Eng. 125, 371 (1997).L. Husain and P. K. Kuroda, J. Inorg. Nucl. Chern. 29, 2665 (1967).L. Husain, A. Bad and P. K. Kuroda, J. Inorg. Nucl. Chern. 30, 3145 (1968)."Nuclear Data for Fusion Reactor Technology", Proceedings of an AdvisoryGroup Meeting organized by the IAEA and held in Gaussig, GDR, 1.-5. Dec.1986, IAEA-TECDOC-457, WIEN (1988].S. Igarasi (Editor), "Nuclear Data for Science and Technology", Proceedingsof an International Conference, held at Mito, Japan, 30 May - 3 June 1988,Saikon, Tokio (1988).A. V. Ignatyuk, G. N. Smirenkin and A. S. Tiskin, SOy. J. Nucl. Phys. 21, 255(1975).Y. Ikeda, C. Konno, K. Oishi, T. Nakamura, H. Miyade, K. Kawade, H.Yamamoto and T. Katoh; Report JAERI 1312, (Editor T. Fuketa), JAERITokai-mura, Japan (1988).Y. Ikeda, C. Konno, M. Mizumoto, H. Hasegawa, C. Chiba, Y. Yamanouchiand M. Sugimoto, in [Qai 92a], 294 (1992).N. Ito, M. Baba, S. Matsuyama, 1. Matsuyama and N. Hirakawa, Nucl. Instr.Meth. A337, 474 (1994).M. Ivascu, V. Avrigeanu and M. Avrigeanu, Rev. Roum. Phys. 3217, 697(1987).S. Iwasaki, M. Sakuma, K. Sugiyama and N. Odano, Report JAERI-M 93-046,257 (1993).S. Iwasaki, S. Matsuyama, T. Ohkubo, H. Fukuda, M. Sakuma and M.Kitamura, "Measurement of Activation Cross-Sections for Several Elementsbetween 12 and 20 MeV", in [Die 94], 305 (1994).B. Jackel, W. Westmaier and P. Patzelt, Nucl. Instr. Meth, A261, 543 (1987).C. Kalbach-Cline, Nucl. Phys. A210, 590 (1973).C. Kalbach, Acta Phys. Slov. 25, 100 (1975).H. Kalka, M. Torjman, H. N. Lien, R. Lopez and D. Seliger, Z. Phys. A335,163 (1990).H. Kalka, "EXIFON-A Statistical Multistep Reaction Code", NEA Data Bank,Saclay, France (1991).F. B. K. Kam, F. W. Stallmann, "A Computer Program Automated forDetermining Neutron Spectra from Activation Measurements", Report ORNLTM-4601, Oak Ridge National Laboratory (1974).
References 135
[Kan 92]
[Kas 96]
[Kaw 81]
[Kaw 90]
[Ker 59][Kha 73][Kir 83]
[Kle 97]
[Klo 94]
[Klo 97]
[Kne 86]
[Kob 91]
[Koc 93]
[Ko157]
[Kop 87]
[Kor 89]
[Kor 93][Koz 78]
[Kra 57][Lan 63]
136
Y. Kanda and Y. Nakajima, "The 238U Fission Cross Section", in [Con 92], 70(1992).
Y. Kasugai, Y. Ikeda, Y. Yamamoto and K. Kawade, Ann. Nucl. Energy 23,1429 (1996).
K. Kawade, M. Ezuka, H. Yamamoto, K. Sugioka and T. Katob, Nucl. Instr.
Meth. 190, 101 (1981).
K. Kawade, H. Yamamoto, T. Yamada, T. Katoh, T. Iida and A. Takahashi,
"Measurement ofFormation Cross Sections of Short-Lived Nuclei by 14 MeVNeutrons", Report JAERl-M 90-171, NEANDC(J)-154/U, lNDC (JPN)-1401L,
JAERl, Japan (1990).B. D. Kern, W. E. Thompson and J. Ferguson, Nucl. Phys. 10, 226 (1959).N. A. Khan, S. Mubarakmand and M. Ahmad, Nucl. Phys. A202, 123 (1973).T. Kiriyama and R. Kuroda, Talanta 30, No.4, 261 (1983).
A. Klein et al., to be published.
L. 1. Klochkova, B. S. Kovrigin and V. N. Kuritsin, "Investigation of theReactions (n,p) and (n,np) on 27AI, 28Si, 50Cr, 54Fe, 56Fe, 58Ni and Ni at 14.1
MeV Neutron Energy", Report lNDC(CCP)-376, lAEA, Vienna (1994).R. M. Klopries, R. D6czi, S. Sudar, J. Csikai and S. M. Qaim, RadiochirnicaActa 76,3 (1997).
D. W. Kneff, B. M. Oliver,H. Farrar IV and L. R. Greenwood, Nucl. Sci. Eng.92,491 (1986).T. Kobayashi, A. Taniguchi, T. Ikuta, K. Kawade, H. Yamamoto, T. Katoh, T.
Iida and A. Takahashi, "Measurement of Formation Cross Sections of Short
Lived Nuclei Production by 14 MeV Neutrons (IV)", in Proc. of the 1990
Symposium on Nucl. Data, M. Igashira and T. Nakagawa (Eds.), ReportJAERl-M 91-032, NEANDC(J)-160/U, lNDC(JPN)-148/L, JAERl, Japan
(1991).
N. P. Kocherova and P. K. McLaughlin , "The International ReactorDosimetry File", Report IAEA-NDS-141, IAEA, Vienna (1993); as computer
file from http://iaeand.iaea.or.at/ndspubllibraries/irdfIIRDF90V2.TXT.G. J. Ko1meschate, "Elemente der filnften Nebengruppe", in W. Fresenius und
G. Jander, "Handbuch der Analytischen Chemie", Vol. 5b, 24 (1957).J. Kopecky and H. Gruppe1ar, "Systematics of Neutron-Induced Isomeric
Cross Section Ratios at 14.5 MeV", Report ECN-200, Petten, Netherlands(1987).J. Korkisch, "Handbook of Ion Exchange Resins", CRC Press, Inc., BocaRaton, Florida (1989).
Z. Kormany, Nucl. Instr. Meth. A337, 258 (1993).1. E. Kozyr, V. A. P1juiko and G. A. Prokopets, Proc of the 4th All Union Conf.on Neutron Physics, Kiev, 256 (1978).
K. A. Kraus and F. Nelson, Ann. Rev. Nucl. Sci. 7, 31 (1957).D. W. Lang, Nucl. Phys. 77, 545 (1966).
ActivationCross Sections and IsomericCrossSection Ratios ...
[Ler 70]
[Lev 69]
[Lev 73]
[Lis 69]
[Lis 73]
[Lis 75]
[Lis 88]
[Lis 89a]
[Lis 89b]
[Lis 90a]
[Lis 90b]
[Lu 89]
[Maj 84]
[Maj 90]
[Maj 97]
[Man 88]
[Man 94]
[Man 97]
[Mas 72]
[Mat 94]
[MeC75]
[MeL 88]
[MeN 73]
J. L. Leroy, J. L. Huet and J. Gentil, Nue!. Instr. Meth. 88, 1 (1970).
V. N. Levkovskii, g. e, Kovel'skaya, G. P. Vinitskaya, V. M. Stepanov and V.
V. Sokol'skii, SOy. J. Nue!. Phys, 8, 4 (1969).
V. N. Levkovskii, Yad. Phys. 18,705 (1973).
H. Liskien and A. Paulsen, Nue!. Instr. Meth. 69,70 (1969).
H. Liskien, A. Paulsen, Nue!. Data Tables 11, 569 (1973).
H. Liskien, "Techniques for the Determination of Neutron Induced Charged
Particle Reactions", in [Seh 75], 156 (1975).
H. Liskien, R. Widera, R. WOlfle and S. M. Qaim, Nue!. Sci. Eng. 98, 266
(1988).
H. Liskien, "Improved Neutron Fluence Accuracies in ActivationExperiments", NEANDC Specialists Meeting on Neutron Activation Cross
Sections for Fission and Fusion, 13 - 15 Sept. 1989, Argonne, U.S.A. (1989).
H. Liskien, M. Uhl, M. Wagner and G. Winkler, Ann. Nue!. Energy 16, 563
(1989).
H. Liskien, R. Wolfle, R. Widera and S. M. Qaim, App!. Radiat. Isot. 41, 83
(1990).
P. W. Lisowski, C. D. Bowman, G. J. Russell and S. A. Wender, Nue!. Sci.
Eng. 104,208 (1990).
Lu Hanlin, Yu Weixiang, Zhao Wenrong and Zhao Yiwi, Report INDC(CPR)
16/L, IAEA, Vienna (1989).
M. Ibn Majah and H. A. Ait, Report INDC(MOR)-003/GI, (1984).
M. Ibn Majah and S. M. Qaim, Nue!. Sci. Eng. 104,271 (1990).
A. D. Majdeddin, V. Semkova, R. Doczi, Cs. M. Buezko and J. Csikai,"Investigations on (n,a) Cross Sections in the 14 MeV Region", Report
INDC(HUN)-031/L, IAEA, Vienna, Austria, (1997).
A. Mannan and S. M. Qaim, Phys. Rev. C38, 630 (1988).
W. Mannhart, D. Schmidt and X. Haihong, "Measurement of the59Co(n,al6Mn, 59Co(n,pl9Fe and 59Co(n,2ni8m+8Co Cross Sections between 8
and 14 MeV", in [Die 94], 285 (1994).W. Mannhart, D. Schmidt and D. L. Smith, "Measurement of the 52Cr(n,py52v,52Cr(n,2ni1Cr, 51V(n,pil Ti and 51V(n,a/8Sc Cross Sections between 7.9 and
14.4 MeV", in [Ref 97], to be published.
G. N. Maslov, F. Nasyrov and N. F. Pashkin, Report YK-9, Obninsk Reports,
U.S.S.R. (1972).
1. Matsuyama, M. Baba, S. Matsuyama, T. Kiyosumi, T. Sanami, N. Hirakawa,
N. Ito, S. Chiba, T. Fukahori, M. Mizumoto, K. Hasegawa and S. Meigo,
Report JAERI-M 94-019,191 (1994).
G. J. McCallum and G. E. Coote, Nue!. Instr. Meth. 130, 189 (1975).
V. McLane, C. L. Dunford and P. F. Rose, "Neutron Cross Sections. Volume 2- Neutron Cross Section Curves", Academic Press (1988).
L. A. MeNelles and J. L. Campbell, Nue!. Instr. Meth. 109,241 (1973).
References 137
[Mea 80]
[Mea 97][Mei 95]
[Met 88]
[Mia 94]
[Mil 70]
[Mit 66][Mol 64]
[Moln][Mol 83]
[Mol 91]
[Mol 92]
[Muln][Mus 90][Nei 60]
[NeI64]
[Neu 94]
[Not 71]
[Oka 80]
[Oka 87]
lOki 92]
[Osa 89]
138
J. W. Meadows, D. L. Smith and G. Winkler, Nuc!. Instr. Meth. 176, 439(1980).
J. W. Meadows, private communication.
A. Meister, "Counting efficiency calculatedfor a neutron detector with a 4 em* 5 em NE 213 scintillator", Internal Report GEIRIND/03/95, CEC-JRCIRMM Geel (1995).M. K. Metha and J. J. Schmidt (Editors), Workshop on "Applied NuclearTheory and Nuclear Model Calculations for Nuclear TechnologyApplications", held at Trieste, Italy, 15 Feb - 19 Mar 1988, World Scientific(1988).
M. M. H. Miah, H. Voach, W. Mannhart and D. Schmidt, "Measurement ofthe Cross Sectionfor I03Rh(n,n')103mRh in the Energy Range 6 - 12 MeV",in [Die 94], 278 (1994).
D. Miljanic, V. Valkovic, D. Rendie and M. Furic, Nuc!. Phys. A156, 193(1970).
B. Mitra and A. M. Ghose, Nuc!. Phys. 83, 157 (1966).P. A. Moldauer, Revs. Mod. Phys. 36, 1079 (1964).N. 1. Molla and S. M. Qaim, Nuc!. Phys. A283, 269 (1977).
N. I. Molla, I. M. Mizanul, R. M. Mizanur and S. Khatun, Progress ReportINDC(BAN)-002, IAEA, 2 (1983).
N. I. Molla, S. M. Qaim, H. Liskien and R. Widera, App!. Radiat. Isot. 42, 337
(1991).N. I. MolIa, S. M. Qaim and H. Kalka, Phys. Rev. C45, 3002 (1992).
R. A. Muller, Science 196, 439 (1977).A. Mushtaq and S. M. Qaim, Radiochimica Acta 50,27 (1990).
J. M. Neilson, "The radiochemistry of iron", Nuclear Science Series, NASNS3017, 14 (1960).
F. Nelson, T. Murase and K. A. Kraus, J. Chromatography 13, 503 (1964).B. Neumaier, F. Rosch, S. M. Qaim and G. Stocklin, Radiochimica Acta 65, 1
(1994).
A. Notea, Nuc!. Instr. Meth. 91, 513 (1971).K. Okamoto (Editor), Proceedings of the !ABA Consultants' Meeting on
Neutron Source Properties, Debrecen, Hungary, 17 - 21 March 1980, ReportINDC(NDS)-114/GT, Wien (1980).K. Okamoto (Editor), "Properties of Neutron Sources", Proceedings of an
Advisory Group Meeting on Properties of Neutron Sources organized by theIAEA and held in Leningrad, USSR, 9.-13. June 1986, Report IAEATECDOC-410 (1987).
Y. Oki, M. Numajiri, T. Suzuki, T.Miura and K. Kondo, App!. Radiat. Isot. 43,1355 (1992).
A. Osa, H. Yoshida, M. Miyachi, K. Kato, A. Hosoya, M. Shibata, H.Yamamoto, K .Kawade, T. Katoh, T. Iida and A. Takahashi, "Measurement of
Activation Cross Sections and Isomeric Cross Section Ratios ...
[Pau 71]
[Pau 81]
[Pav 82]
[Per 63][Per 74][Pra 71][Pro 57]
[Qai 72][Qai 73][Qai 74a][Qai 74b][Qai 74e][Qai 76][Qai 77]
[Qai 78][Qai 79][Qai 81]
[Qai 82][Qai 84]
[Qai 85][Qai 86a][Qai 86b]
[Qai 88][Qai 90]
[Qai 92a]
Formation Cross Sections ofShort-Lived Nuclei Produced by 14 MeV Neutron(Il)", Proc, of the 1988 Seminar on Nuclear Data (eds. T. Nakagawa and A .Zukerau), Report JABRI-M89-026, NEANDC(J)-133"U", INDC(JPN)-120IL,JABRI, Japan, 293 (1989).A. Paulsen, R. Widera, A. Berlin and A. Trapani, Nue!. Instr. Meth. 91, 589(1971).A. Paulsen, H. Liskien, F. Amotte and R. Widera, Nue!. Sci. Eng. 78, 377(1981).A. Pavlik, G. Winkler, H. Vonaeh, A. Paulsen and H. Liskien, J. Phys. G:NucI. Phys. 8, 1283 (1982).C. M. Perey and F. G. Perey, Phys. Rev. 132,755 (1963).J. P. Perroud, C. SeIIem and J. F. Loude, Nue!. Instr. Meth. 115, 357 (1974).R. Prasad and D. C. Sarkar, II Nuovo Cimento 3, 467 (1971).W. Prodinger, "Organische Fdllungsmittel in der quantitativen Analyse", inG. Jander, "Die chemischeAnalyse", Vo!. 37, 60 (1957).S. M. Qaim, Nue!. Phys. A185, 614 (1972).S. M. Qaim and G. Stocklin, J. Inorg. Nue!. Chern. 35, 19 (1973).S. M. Qaim, R. Wolfle and G. Stocklin, J. Radioanalyt. Chern. 21, 395 (1974).S. M. Qaim, J. Inorg. Nuel. Chern. 36, 239 (1974).S. M. Qaim, R. wem« and G. Stocklin, J. Inorg. Nue!. Chern. 36, 3639 (1974).S. M. Qaim and G. Stocklin, NucI. Phys. A257, 233 (1976).S. M. Qaim and N. 1. MolIa, Proc, of the 9th Symp. On Fusion Teehn.,Garrniseh-Partenkirehen, June 14-18, 1976, EUR-5602, Pergamon Press,Oxford, 589 (1977).S. M. Qaim and R. WOlfle, Nue!. Phys. A295, 150 (1978).S. M. Qaim, H. OIlig and G. Blessing, Radiochimica Acta 26,59 (1979).S. M. Qaim (Editor), "14 MeV Activation Cross Sections", Handbook ofSpectroscopy, Vo!. III, 141 (1981).S. M. Qaim, Nuc!. Phys. A382, 255 (1982).S. M. Qaim, R. wem-, M. M. Rahman and H. OIlig, Nue!. Sci. Eng. 88, 143(1984).S. M. Qaim, Nue!. Phys. A438, 384 (1985).S. M. Qairn, G. Blessing and H. OIIig, Rad. Acta 39,57 (1986).S. M. Qaim, "Systematics of 14 MeV Neutron Induced Reaction CrossSections", in [lAB 86], 89 (1986).S. M. Qaim , A. Mushtaq and M. Uhl, Phys. Rev. C38, 645 (1988).S. M. Qaim, M. Ibn Majah, R. WOlfie and B. Strohmaier, Phys. Rev. C42, 363(1990).S. M. Qaim (Editor), "Nuclear Data for Science and Technology",Proceedings of an International Conference, held at the ForsehungszentrumJulich GmbH, Germany, 13 - 17 May 1991, Springer Verlag Heidelberg(1992).
References 139
[Qai 92b][Qai 94]
[Qai 96]
[Ref 97]
[Rib 85]
[Ric 81][Ryv 78a]
[Ryv 78b]
[Sai 77]
[Sa171]
[San 87]
[Sch 75]
[Sch 82a]
[Sch 82b]
[Sch 93][Sch 95]
[See 65]
[Sig 75][Smi 77]
[Smi 80]
[Smi 81][Smi 97]
[Str 80]
140
S. M. Qaim, F. Cserpak and J. Csikai, App!. Radial. Isol. 43,1065 (1992).S. M. Qaim, "Recent Developments in the Study ofIsomeric Cross Setions", in[Die 94], 186 (1994).
S. M. Qaim, S. Spellerberg, F. Cserpak and J. Csikai, Radiochimica Acta 73,111 (1996).
G. Reffo (Editor), Proceedings of the International Conference on NuclearData for Science and Technology, held at the ICTP, Trieste, Italy, 19 - 23 May
1997, to be published.
1. Ribansky, T. Pantaleev and L. Stoeva, Ann. Nuc!' Energy 12, 577 (1985).N. M. Rice, Hydrometallurgy 7,177 (1981).
T. B. Ryves, P. Kolkowski and K. J. Zieba, Metrologia 14, 127 (1978).T. B. Ryves, P. Ko1kowski and K. J. Zieba, J. Phys. G: Nuc!. Phys. 4, 1783
(1978).K. Sailer, S. Daroczi, P. Raics and S. Nagy, Proc, Conf. On Neutron Physics,Kiev, U.S.S.R., Report INDC(CCP)-118/G, 246 (1977).
O. A. Salnikov, G. N. Lovchikova, G. V. Kotelnikova, V. S. Nesterenko, N. 1.Fetisov and A. M. Trufanov, SOy. J. Nuc!' Phys. 12, 620 (1971).A. F. Sanchez-Reyes, M. I. Febrian, J. Bar6 and J. Tejada, Nuc!. Instr. Meth.
B28, 123 (1987).R. A. Schrack and C. D. Bowman (Editors), Proc. Conf. Nuclear Cross
Sections and Technology, Washington D. c., 3 - 7 March, 1975, NBS SP 425(1975).
G. Schwedt, "Chromatographische Praxis in der anorganischen Analyse",Georg Thieme Verlag, Stuttgart, New York (1982).
K. H. Schmidt, H. Delagrange, J. P. Dufour, N. Carjan and A. Fleury, Z. Phys.
A308, 215 (1982).
B. Scholten, S. M. Qaim and G. Stocklin, Radiochimica Acta 62,107 (1993).
T. Schiekel, "Radiochemische Untersuchungen zur Produktion kosmogenerRadionuklide: Wirkungsquerschnitte, Modelle und Modellrechnungen",Dissertation Universitat zu Koln (1995).U. Seebeck and M. Bormann, Nuc!. Phys. 68, 387 (1965).
R. A. Sigg and P. K. Kuroda, J. Inorg. Nuc!. Chern. 37, 631 (1975).D. L. Smith and J. W. Meadows, Report ANIJNDM-37, Argonne National
Laboratory, U.S.A. (1977).D. L. Smith and J. W. Meadows, Nuc!' Sci. Eng. 76,43 (1980).
D. L. Smith, J. W. Meadows and F. F. Porta, Nuc!. Sci. Eng. 78,420 (1981).D. L. Smith and A. Fessler, Radiochimica Acta, in press.
B. Strohmaier and M. Uhl, STAPRE - A Statistical Model code withConsideration of Pre-Equilibrium Decay", Proc. Trieste Course on NuclearTheory for Applications - 1978, IAEA-SMR-43, 313 (1980).
Activation Cross Sections and Isomeric Cross Section Ratios ...
[Str 82]
[Sud 79][Sud 89]
[Sud 93][Sud 96][Sud 97][Suh 88a]
[Suh 88b]
[Sut 90][Tak 96]
[Tam 77][Tam 82][Tok 81][Tsa 94]
[Tsa 97]
[UhI70][UhI76][UhI81]
[Uhl92]
[Uno 96]
[Ura 78]
[Uwa 88]
[Uwa92]
[Uwa 94]
B. Strohmaier, "Report on a Training Course on Nuclear Data Evaluation andProcessing Techniques", Report INDCCAUS)-7/G, IAEA, Vienna, Austria(1982).S. Sudar and J. Csikai, Nucl. Phys. A319, 157 (1979).S. Sudar, "A Solution for the Neutron Spectrum Unfolding Problem withoutusing Input Spectrum", Report INDCCHUN)-26/L, IAEA, Vienna, Austria(1989).S. Sudar, F. Szelecsenyi and S. M. Qaim, Phys. Rev. C48, 3115 (1993).S. Sudar and S. M. Qaim, Phys. Rev. C53, 2885 (1996).S. Sudar, private communication.A. Suhaimi, "Studies of (n,t) Reactions on Light Nuclei", Report Jiil-2196,KFA Julich, Germany (1988).A. Suhaimi, R. Wolfle, S. M. Qaim, P. Warwick and G. Stocklin,Radiochimica Acta 43, 133 (1988).M. Suter, Nucl. Instr. Meth. Phys. Res. B52, 146 (1990).M. Takada, T. Nakamura, M. Baba, T. Iwasaki, T. Kiyosumi, Nucl, Instr,.Meth. A372, 253 (1996).T. Tamamura, T. Udagawa, D. Feng and K. Kan, Phys. Lett. 66B, 109 (1977).T. Tamamura, T. Udagawa and H. Lenske, Phys. Rev. C26, 379 (1982).J. Toke, J. Swiatecki, Nucl. Phys. A372, 141 (1981).C. Tsabaris, E. Wattecamps and G. Rollin, "Double Differential (n.xp) and(n.xa) Cross Section Measurements of 27Al, 58Ni and 63CU in the NeutronEnergy Range from 2.0 to 15.5 MeV", in [Die 94], 282 (1994).C. Tsabaris, E. Wattecamps, G. Rollin and C. T. Papadopoulos, Nucl. Sci.Eng., submitted.M. Uhl, Acta Phys. Austriaca 31, 245 (1970).M. Uhl and B. Strohmaier, ReportIRK-76/01, IRK Vienna, Austria (1976).M. Uhl and B. Strohmaier, Program Manual for STAPRE Code, NEA DataBank, Paris, France (1981).M. Uhl, H. Gruppelaar, H. A. J. van der Kamp, J. Kopecki and D. Nierob,"The EFF-2 Evaluation for the Reaction Systems n + 52Cr, 56Fe, 58Ni and6oNi", in [Qai 92a], 924 (1992).
Y. Uno, Y. Uwamino, T. S. Soewarsono and T. Nakamura, Nucl. Sci. Eng.122, 247 (1996).1. Uray, 1. Torok, P. Bornernisza-Pauspertl and L. Vegh, Z. Phys. A287, 51(1978).Y. Uwamino, T. Ohkubo, A. Torii and T. Nakamura, Nucl. Instr. Meth. A271,546 (1988).Y. Uwamino, H. Sugita, Y. Kondo and T. Nakamura, Nucl. Sci. Eng. 111,391(1992).Y. Uwamino, H. Sugita, Y. Kondo and T. Nakamura, J. Nucl. Sci. Tec. 31, 1(1994).
References 141
[W0l 84]
[WaI85]
[W0l88]
[Wi153][Wi170]
[Wi171]
[Win 62][Win 80]
[Win 89][Win 91]
[Wei 36][Wei 75]
[Wei 91][Wen 62]
[Wes 81]
[Wes 86][Wes 87]
[Wes 90][Wes 95]
[Uwa 97] Y. Uwamino, T. S. Soewarsono and T, Nakamura, Nucl. Instr. Meth, A389,463 (1997).
[Van 81] R. Vanska and R. Rippo, Nucl. Instr. Meth. 179, 525 (1981).
[Vie 91] M. Viennot, M. Berrada, G. Paic and S. Joly, Nucl. Sci. Eng. 108, 289 (1991).[Von 69] H. Vonach and M. Hille, NucI. Phys, A127, 289 (1969).
[Wag 88a] M. Wagner, G. Winkler, H. Vonach and H. Liskien, "Measurement of the
93Nb(n,n,/3mNb Cross Section at 7.9 MeV", in [Iga 88],1049 (1988).[Wag 88b] M. Wagner, G, Winkler, H. Vonach, and G, PeW, Ann, Nucl. Energy 15, 363
(1988).
[Wag 89] M. Wagner, G. Winkler, H. Vonach, Cs. M. Buczko and J. Csikai, Ann. NucI.Energy 16, 623 (1989),
[Wat 83] E. Wattecamps, H. Liskien and F. Arnotte, "Measurement for (n,a) Cross
Sections for Cr, Fe and Ni at 14 MeV Neutron Energy", in [Boc 83], 156(1983).
[Wat 91] E. Wattecamps, "Measurement ofDouble Differential (n.xa) Cross Sections ofanINi, 58Ni, 60Ni, "t'Cu, 63Cu,and 65Cu in the 5 to 14 MeV Neutron Energy
Range", in [Qai 92a], 310 (1992).C. F. von Weizsacker, Naturwissenschaften 24,813 (1936).
H. Weigel, R. Michel and W. Herr, Radiochimica Acta 22, 11 (1975).J. WeiB, "Ionenchromatographie", Verlag Chemie, Weinheim (1991).
R. Wenusch and H. Vonach, Anz, Ost, Akad. Wiss. 99, 1 (1962).W. Westmaier, Nucl. Instr. Meth, 180, 205 (1981).
W. Westmaier, NucI. Instr. Meth. A242, 437 (1986).
H. 1. West, Jr., R. G, Lanier and M. G. Mustafa, Phys. Rev. C35, 2067 (1987).W, Westmaier and J. van Arle, Nucl. Instr. Meth. A286, 439 (1990).
W. Westmaier, "X-Ray", Program Manual, Dr. Westmaier GmbH,Ebersdorfergrund - Molln, Germany, (1995).
H. H, Willard, E. L. Martin and R. Feltham, Z. Anal. Chern. 25, 1963 (1953).J. B. Willet, Nucl. Instr. Meth. 84, 157 (1970).F. C. Williams, Nucl. Phys. A166, 231 (1971).
J. Wing and J. R. Huizenga, Phys. Rev. 128,280 (1962).
G. Winkler, D. L. Smith and J. M. Meadows, NucI. Sci. Eng. 76, 30 (1980).G. Winkler, Nucl. Instr. Meth. A282, 317 (1989).G. Winkler, V, E. Lewis, T. B. Ryves and M. Wagner, "The 238U(n,f) CrossSection and its Ratio to the 27Al(n,a)24Na and 56Fe(n,py56Mn Cross Section in
the 14 MeV Region", in [Qai 92a], 401 (1991).
R. WOlfle, S. Khatun and S. M. Qaim, NucI. Phys. A423, 130 (1984).R, weine, S. Sudar and S. M, Qaim, Nucl. Sci. Eng. 91, 162 (1985).
R. Wolfle, A. Mannan, S. M. Qaim, H. Liskien and R. Widera, Appl. Radiat,Isot, 39,407 (1988).
[W0l 90] R. Wolfle, S. M. Qaim, H. Liskien and R. Widera, Rad. Acta 50,5 (1990).[WaI93] R. WOlfle, A. Suhaimi and S. M. Qaim, NucI. Sci. Eng. 115, 71 (1993).
142 ActivationCross Sectionsand Isomeric CrossSectionRatios ;..
[Yaf 62][Yam 90][You 77]
[Yu 67][Zha 86a]
[Zha 86b]
[Zwe 88]
L. Yaffe, Ann. Rev. Nucl. Sci. 12, 153 (1962).N. Yamamuro, Report JAERl-M 90-006, JAERl, Japan (1990).P. G. Young and E. D. Arthur, "GNASH: A Pre-equilibrium StatisticalNuclear Model Codefor Calculation ofCross Sections and Emission Spectra",LA-6947, Los Alamos Scientific Lab. Report (1977).y. W. Yu and D. Gardner, Nucl. Phys. A98. 451 (1967).Z. Zhao and D. Zhou, "Systematics of (n,charged particle) Reactions", in[lAE 86], 151 (1988).J. Zhang, D. Zhou and D. Cai, "Systematics of (n,2n) and (n,3n) CrossSections", in [lAE 86], 159 (1988).J. Zweit, S. Downey and H. Sharma, Appl. Radial. Isot. 39, 1197 (1988).
References 143
144 Activation Cross Sections and Isomeric Cross Section Ratios ...
Acknowledgements
I had the privilege to work with Prof. Dr. S. M. Qaim who suggested the problem andwas my supervisor for the last three years. He was a real "Doktorvater", giving me notonly scientific advice but also established the contacts to Geel and helped me in receivinga fellowship. The work with him was based on trust, a prior condition for an independenteffort.
I would like to thank the directors of the Institute in Jiilich , Prof. Dr. G. Stocklin andProf. Dr. H. H. Coenen, and in Geel, Prof. Dr. W. MUller, Prof. Dr. A. J. Deruytter andProf. Dr. M. Grasserbauer, for supporting this work.
I stayed with pleasure at the Van de Graaff lab at Geel where most of this work wasdone. I would like to thank Dr. H. Weigmann as leader of the Nuclear Data Group, Dr. E.Wattecamps for his help with the experiments, and Dr. A. J. M. Plompen who joined thegroup towards the end of the work but directly showed interest and gave several usefuladvices. I am also grateful for the help of Dr. F. J. Hambsch, H. Bax, W. Schubert and Dr.G. Giorginis, who placed a HPGe detector at my disposal.
The help of Stefan Spellerberg with the irradiations at Jiilich is gratefullyacknowledged. Dipl. Chern. Andreas Klein is thanked for his advice on the chemicalseparations and the introduction to the UV-VIS spectrometry.
I am very grateful to Dr. Donald L. Smith from Argonne National Laboratory (ANL)who had the idea of the pneumatic transport system and helped to make the "rabbits" run.The experiment together with him in September 1996 was one of the most pleasantmoments during this thesis work. His large experience in activation measurements andmany discussions stimulated me a lot. Also I would like to show my gratitude to Dr. J. W.Meadows for the calculation of the multiple scattering corrections.
One other person I am specially obliged to is Dr. Immo Bim. He was part of theNuclear Data group at the Van de Graaff on my arrival and guided me along through the"activation business" during the first year. It has been nice to work with him and I amgrateful for all the help, valuable suggestions and discussions.
I am grateful to Prof. Dr. J. Csikai and Dr. S. Sudar from the Institute of ExperimentalPhysics of the Kossuth University at Debrecen, Hungary, for the hospitality I receivedduring my stay at their Institute in April 1997. Dr. S. Sudar gave me many useful adviceson the nuclear model calculations with the STAPRE code.
I would like to thank also Dr. A. Crametz in his function as Head of the Van de Graaffaccelerator. He always took care to give me the best "beam", even in cases where thegeneral conditions were not so good due to lack of manpower or antiquitated machineparts.
Of the many persons who helped to realize this thesis project I would like to thank theoperators of the Compact Cyclotron at Jiilich and the Van de Graaff at Geel, the staff of
Acknowledgements 145
the drawing office, the sample preparation and the workshop at Gee!' Especially I want tothank M. Conti, P. Falque, J. Leonard and Dr. C. Ingelbrecht.
The support from the European Community through the award of a three years'fellowship is gratefully acknowledged.
146 Activation Cross Sections and Isomeric Cross Section Ratios ...


Forschunqszentrum Julich
J "I :>1-()2. U -""L) """
January "1998ISSI\] 0944..29'52