Embed Size (px)
Citation preview
Activities Report and Selected Science Highlights
Professor Dr. Pavel KabatIIASA Director General and
Chief Executive Officer
89th IIASA Council 7-8 November 2016

PROFESSOR HOWARD RAIFFA1924-2016

PROFESSOR RALPH J. CICERONE1943-2016

CONTENTS1. Scientific Output & Some Research Highlights
2. International Collaborations
3. Science to Policy
4. Capacity Building and Academic Training
5. Management News and Resources
6. Outreach and Communication
4

SCIENTIFIC OUTPUT
& SOME RESEARCH
HIGHLIGHTS 5

6
NEW IIASA RESEARCH FRAMEWORK

RESEARCH HIGHLIGHTS1. Between 1.5°C and 2.0°C—analyzing the global
warming waters
2. Science-based knowledge on migration
3. Achieving the sustainable development goals
4. Tackling air pollution hotspots
7

1.5°C VS 2°C: WHY HALF A DEGREE MATTERS
Science and policy characteristics of the Paris Agreement temperature goal Carl-Friedrich Schleussner, Joeri Rogelj, Michiel Schaeffer, Tabea Lissner, Rachel Licker, Erich M. Fischer, Reto Knutti, Anders Levermann, Katja Frieler, & William Hare, Nature Climate Change, 6, 827–835, (2016).
1.5°C VS 2°C

WHERE ARE WE NOW: COUNTRY PLEDGES OVERSHOOT PARIS TEMPERATURE LIMIT
J Rogelj et al. Nature 534, 631–639 (2016) doi:10.1038/nature18307
1.5°C VS 2°C

WHAT ARE THE KEY ELEMENTS TO ACHIEVING THE 1.5°C GOAL?
Rogelj J, Luderer G, Pietzcker RC, Kriegler E, Schaeffer M, Krey V, Riahi K. (2015). Energy system transformations for limiting end-of-century warming to below 1.5°C. Nature Climate Change
1.5°C VS 2°C

A NEW PARTNERSHIP FOR MIGRATION RESEARCHTO PROVIDE SCIENCE-BASED KNOWLEDGE ON
MIGRATION AND DEMOGRAPHY TO SUPPORT EU POLICY
LAUNCHED IN JUNE 2016 BY
MIGRATION

ASSESSING HUMAN CAPITAL OF ASYLUM SEEKERS
MIGRATION
Isabella Buber-Ennser, Judith Kohlenberger, Bernhard Rengs, Zakarya Al Zalak, Anne Goujon, Erich Striessnig, Michaela Potančoková, Richard Gisser, Maria Rita Testa, Wolfgang Lutz. Human Capital, Values, and Attitudes of Persons Seeking Refuge in Austria in 2015. PLOS ONE, September 2016.

RELATIVE POPULATION CHANGE 2015-2050DUE TO MIGRATION ZERO MIGRATION
MIGRATION

GLOBAL COMMONS IN THE ANTHROPOCENE
SDGS

Adapted from WBGU 2011
SUSTAINABILITY TRANSFORMATIONTHE WORLD IN 2050
SDGS

SDGS
Adapted from WBGU 2011
SUSTAINABILITY TRANSFORMATIONTHE WORLD IN 2050

SUSTAINABILITY TRANSFORMATIONTHE WORLD IN 2050
Adapted from WBGU 2011
SDGS

● AIMES● Brazilian Federal Agency for the Support and Evaluation of Graduate Education (CAPES)● Centre for Integrated Studies on Climate Change and the Environment (CIRED)● Commonwealth Scientific and Industrial Research Organization (CSIRO)● Earth League, whole Earth system modelling initiative● Earth Institute, Columbia University ● Energy Planning Program, COPPE, Federal University of Rio de Janeiro● Fondazione Eni Enrico Mattei (FEEM)● Future Earth● German Development Institute (DIE)● Global Ocean Ecosystem Dynamics (GLOBEC)● Indian Institute International Futures● Indian Institute of Technology (IIT)● International Energy Agency (IEA)● International Food Policy Research Institute (IFPRI)● International Monetary Fund (IMF)● International Institute for Applied System Analysis (IIASA) ● Intergovernmental Panel on Climate Change (IPCC)● Joint Global Change Research Institute at Pacific Northwest National Laboratory (JGCRI/PNNL)● Mercator Research Institute on Global Commons and Climate Change● National Center for Atmospheric Research (NCAR)● National Institute for Environmental Studies (NIES)● National Renewable Energy Laboratory (NREL) ● Organisation for Economic Co-operation and Development (OECD)● Potsdam Institute for Climate Impact Change (PIK)● PBL - Netherlands Environmental Assessment Agency● Research Institute of Innovative Technology for the Earth (RITE)● Stanford University ● Stockholm Resilience Centre ● Sustainable Development Solutions Network (SDSN)● The City University of New York (CUNY)● Tsinghua University● UN Population Division● UN DESA● UNEP- World Conservation Monitoring Centre (UNEP-WCMC)● University of Hamburg● World Bank
THE WORLD IN 2050 NETWORK SDGS

TRADEOFFSConservation policies can’t be pursued in a vacuum…but we can anticipate tradeoffs
More ambitious actions on planetary boundaries
can lead to higher food prices.
SDGS
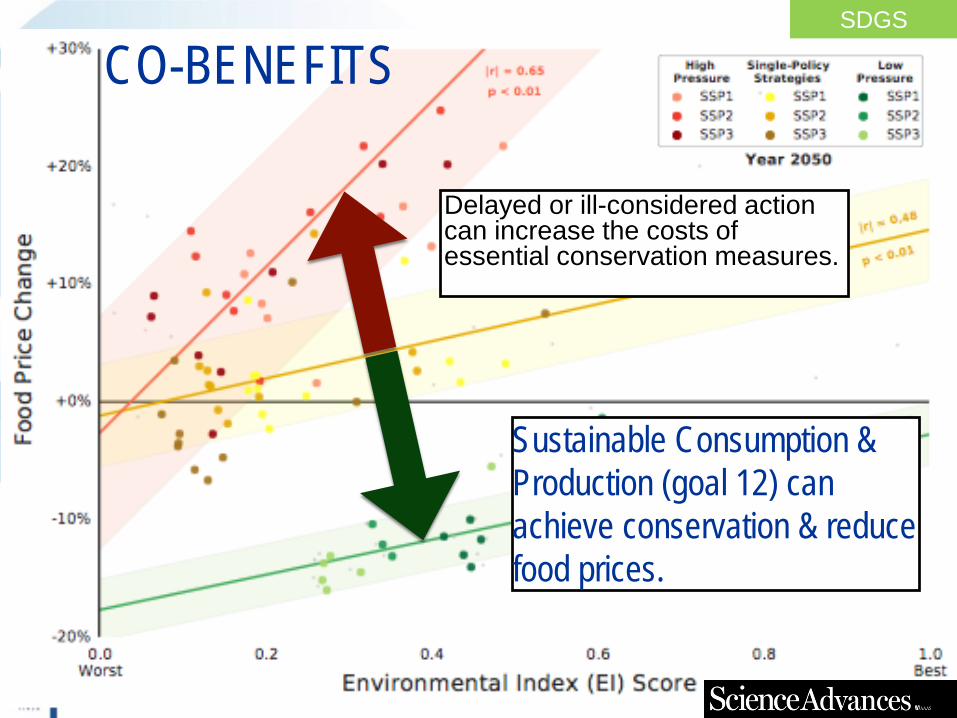
CO-BENEFITS
Sustainable Consumption & Production (goal 12) can achieve conservation & reduce food prices.
Delayed or ill-considered action can increase the costs of essential conservation measures.
SDGS

PARTNERING WITH WORLD BANK TO TACKLE AIR POLLUTION HOTSPOTS
• Integrated approach to air quality management that brings together all relevant parties (business, government, public health, science) and GAINS as core tool
• Prototype being developed for Vietnam• Scoping and feasibility study for such a project for China,
Egypt, India, Nigeria, South Africa & Vietnam
CLEAN AIR

IMPROVING AIR QUALITY IN DELHIToday’s situation
0
20
40
60
80
100
120
140
µg/m
3PM
2.5
Diesel soot
Road dust, tyre wear, brakes
Fireworks, cremation, etc.
Trash burning, BBQ, smoking
Cookstoves
Small industries
High stacks power & industry
Secondary inorganic PM:Agricultural NH3 with SO2/NOx
Agricultural waste burning
Soils and vegetation
0
20
40
60
80
100
120
140
µg/m
3PM
2.5
Origin
CLEAN AIR

IMPROVING AIR QUALITY IN DELHI2030 with current legislation
0
20
40
60
80
100
120
140
µg/m
3PM
2.5
Origin
0
20
40
60
80
100
120
140
µg/m
3PM
2.5
Diesel soot
Road dust, tyre wear, brakes
Fireworks, cremation, etc.
Trash burning, BBQ, smoking
Cookstoves
Small industries
High stacks power & industry
Secondary inorganic PM:Agricultural NH3 with SO2/NOx
Agricultural waste burning
Soils and vegetation
Emission controls:• Effective Bharat VI from 2020• CNG for buses and three-wheelers• Enhanced penetration of natural gas• FGD for large power and industries
CLEAN AIR

IMPROVING AIR QUALITY IN DELHIAdvanced technologies for Delhi
0
20
40
60
80
100
120
140
µg/m
3PM
2.5
Origin
0
20
40
60
80
100
120
140
µg/m
3PM
2.5
Diesel soot
Road dust, tyre wear, brakes
Fireworks, cremation, etc.
Trash burning, BBQ, smoking
Cookstoves
Small industries
High stacks power & industry
Secondary inorganic PM:Agricultural NH3 with SO2/NOx
Agricultural waste burning
Soils and vegetation
Additional emission controls:• FGD + DeNOx in power sector• Improved cook stoves• Electric cremation
CLEAN AIR

IMPROVING AIR QUALITY IN DELHIThe ‘Clean Air’ strategy for Delhi
0
20
40
60
80
100
120
140
µg/m
3PM
2.5
Diesel soot
Road dust, tyre wear, brakes
Fireworks, cremation, etc.
Trash burning, BBQ, smoking
Cookstoves
Small industries
High stacks power & industry
Secondary inorganic PM:Agricultural NH3 with SO2/NOx
Agricultural waste burning
Soils and vegetation
Additional emission controls:• Paved roads• Improved public transport• Improved energy efficiency• Natural gas for power and industry• Biomass cook stoves replaced
by electricity/natural gas• 50% of BBQs electric/gas• Ban of trash burning• Fewer fireworks
CLEAN AIR

IMPROVING AIR QUALITY IN DELHIAdvanced Technologies for DL+HR+UP
0
20
40
60
80
100
120
140
µg/m
3PM
2.5
Origin
Additional emission controls:• FGD + DeNOx in power sector• Improved cook stoves• Electric cremation
0
20
40
60
80
100
120
140
µg/m
3PM
2.5
Diesel soot
Road dust, tyre wear, brakes
Fireworks, cremation, etc.
Trash burning, BBQ, smoking
Cookstoves
Small industries
High stacks power & industry
Secondary inorganic PM:Agricultural NH3 with SO2/NOx
Agricultural waste burning
Soils and vegetation
CLEAN AIR

0
20
40
60
80
100
120
140
µg/m
3PM
2.5
Diesel soot
Road dust, tyre wear, brakes
Fireworks, cremation, etc.
Trash burning, BBQ, smoking
Cookstoves
Small industries
High stacks power & industry
Secondary inorganic PM:Agricultural NH3 with SO2/NOx
Agricultural waste burning
Soils and vegetation
IMPROVING AIR QUALITY IN DELHIThe ‘Clean Air’ strategy for DL+HR+UP
Additional emission controls:• Paved roads• Improved public transport• Improved energy efficiency• Natural gas for power and industry• Biomass cook stoves replaced
by electricity/natural gas• 50% of BBQs electric/gas• Ban of trash burning• Fewer fireworks
CLEAN AIR

JOURNAL ARTICLES & CITATIONS
28
* As at Oct 2016
H-index
SCOPUS 118
Web ofScience 115
2010 2011 2012 2013 2014 2015 2016
IIASA Publications in PURE 332 360 537 487 515 562 443Number of peer-reviewed articles in PURE 153 180 209 274 292 315 314Peer-reviewed journal articles according to SCOPUS 146 166 202 233 256 258 213Citations of IIASA publications according to SCOPUS 4425 5805 6976 9670 11740 13402 10659
0
100
200
300
400
500
600
2010 2011 2012 2013 2014 2015 2016
IIASA Publications (PURE) Number of peer-reviewed articles (PURE)Peer-reviewed journal articles (SCOPUS) Citations of IIASA publications (SCOPUS)
IIASA Pubs (PURE)
Peer-reviewed (PURE)
Peer-reviewed (SCOPUS)
Citations (SCOPUS)

OPEN ACCESS PUBLICATIONS POLICY• Mandatory green open access: make journal article text
freely available within 12 months of publication:• Optional gold open access: central IIASA fund for article
processing charges (€50,000 a year)Total peer-reviewed articles in IIASA Publication Repository
Green & Gold Open Access
Gold Open Access
2014 292 42 412015 315 58 492016 (to 12 Oct) 316 237 101
Original IIASA Publication Database (2015)
New IIASA Publication Repository (22 Mar-11 Oct 2016)
Page views 101,437 178,631Average Time per page 2:06 2:44

TOWARD AN OPEN ACCESS DATA POLICY
• Established a task force at IIASA made up of representatives of programs and relevant departments (ERCL & ICT) with aim to:1. Take stock of current status of open access data and research
tools (e.g. models) at IIASA2. Analyze options to make data generated in IIASA’s research
openly available3. Develop a research data management policy4. Develop a longer-term vision for comprehensively making tools
developed at IIASA openly available• Report to IIASA Director General and subsequently to Council in
June 2017

INTERNATIONAL COLLABORATIONS
31

32
PUBLICATION COLLABORATIONS (2015)
1014 authorsfrom 462 institutions
in 50 countries
562 publicationsincluding 315 peer-reviewed articles

DEVELOPING NEW AND EXISTING PARTNERSHIPS
33

24 MEMBER COUNTRIES
Representing:71% of the world’s economy
US$55,213,490 million from World GDP of US$77,302,000 million(including 8 of the world’s 10 largest economies)
65% of the world’s population4,677.5 million people from World population of 7,247.9 million
Sources: GDP figures from IMF (2014); population figures from IIASA (2015)

IIASA MEMBERSHIP STRATEGY

A NEW STRATEGIC FRAMEWORK FOR STRENGTHENING NMO ENGAGEMENT
First Stage: Understand opportunities and barriers; research and science policy goals and priorities; and detail potential IIASA-NMO shared goals and activities.
Second Stage: Develop a five-year strategic plan. An official visit to the country to have IIASA Director General and CEO and NMO Chair formally sign the plan.
Third Stage: After two and a half years, communicate on progress, any changes, and agree on a modified plan, if necessary. Staff level visit to the country to discuss the plan and potentially host a joint IIASA-NMO event.
Fourth Stage: Review strategic plan, including progress, achievements, and uncompleted items. Begin process to formalize the next five-year strategic plan.
Five-year Engagement
Strategy
Completion &Review
Global and Regional
Diagnostic
Mid-term Review

SCIENCE TO POLICY & SCIENCE DIPLOMACY
37

IIASA AS THE EXPERT ADVISORIIASA researchers take part in 113 advisory boards and steering committees, including:
– Leadership Council of the Sustainable Development Solutions Network (SDSN) – input to the Sustainable Development Goals (SDGs)
– UN Secretary General Technical Group on Sustainable Energy for All
– Advisory Council of the German Government on Global Change (WBGU)
– Arctic Council– Belmont Forum
38

UN CLIMATE CHANGE CONFERENCE - COP22IIASA researchers contribute to a number of reports, side events, and meetings.
– Perspectives and options on Loss and Damage: providing clarification of the challenges to inform policy decisions.
– Climate Change and Health in Indian Cities: In collaboration with the Indian Ministry of Environment, Forestry, and Climate Change
39
– Consistent national roadmaps towards the global objective of 1.5C and 2C: Based on collaborations with 18 institutes, viable strategies for ratcheting up the NDCs and their implications for the SDGs.

GLOBAL NETWORK OF FOREIGN MINISTRY SCIENCE AND TECHNOLOGY ADVISERS
• Science diplomacy short course at IIASA, 18-19 October 2016• Coorganized with Fletcher School of Law and Diplomacy at Tufts
University, and the International Network of Government Science Advice
• Teaching from science advisors from foreign ministries in Japan, New Zealand, UK and USA
• Participants from foreign ministries in Argentina, Chile, Ghana, Kazakhstan, Kenya, Malaysia, Oman, Panama, Poland, Senegal, South Africa, Ukraine, and Vietnam among others.

CAPACITY BUILDING AND
ACADEMIC TRAINING
41

YOUNG SCIENTISTS SUMMER PROGRAM
• 51 young scientists from 26 countries for 2016 program plus one science communication intern
• Applications open for 2017 program!
42
0
50
100
150
200
250
300
350
400
Applicants
2012 2013 2014 2015 2016

POSTDOCTORAL FELLOWS (2016)
Henrik Sjӧdin (Sweden), EEP
43
Artem Baklanov(Russia), ASA
Daniel Jessie(USA), ASA
Luzma Nava Jiménez (Mexico, Canada), WAT
Fulvio di Fulvio(Italy, Sweden), ESM
Matthias Wildemeersch(Belgium, Singapore),
ASA, ESM
Adam French(USA), RISK, ASA
Gergely Boza(Hungary), EEP
Peter Bednarik (Austria), EEP, RISK
Christina Kaiser(Austria), EEP
Pietro Landi(Italy), EEP
Luciano Mendes (Brazil), AIR, EMS
Sam Hyun Yoo(South Korea), POP
Edward Byers(USA), ENE, TNT, WAT
Fei Guo(China), ENE, AIR
Asjad Naqvi (Pakistan, Austria)
RPV, ASA
Mia Landauer(Finland), RISK, AFI

GROWTH OF POSTDOCS AT IIASA
5 11 8 7 11 14 1520 20 2035
67 59
276
0
50
100
150
200
250
300
2010 2011 2012 2013 2014 2015 2015
PostdocsApplications

BILATERAL POSTDOC SCHEMES AT IIASA
Country Funder Start Year
Sweden Kempe Foundation 2008
Finland Academy of Finland 2015
Brazil CAPES 2016
Mexico CONACYT 2016
Republic of Korea NRF 2016

46
INTERNATIONAL SCHOOL OF EXCELLENCE IN SYSTEMS ANALYSIS
• PILOT to begin late 2017• Partnership with Belmont Forum with NSF as lead agency• Next scoping meeting to be held at IIASA in early 2017• Up to 20 Funding agencies support participants in pilot phase• IIASA organizes and administers, in addition to participation in research• Focus on “food-water-energy-climate nexus” issue possibly intersecting
with The World in 2050 project • Supporting agencies identify funding options through available channels:
e.g. existing grants or new calls• Each agency nominates 1-2 early-to-mid career researchers to join the
ISE• Advisory panel selects group of ~20 scholars• Scholars assemble at IIASA for 1 month

SOUTHERN AFRICAN SYSTEMS ANALYSIS CENTRE (SASAC)
• A dedicated bursary programme for South African PhD students based at South African universities to complete their studies with a supervisor experienced in systems analysis. For the 2016 intake, a total of 19 PhD students have enrolled;
• A two-month Systems Analysis Capacity Development Programme for these early stage PhD students hosted at the University of the Western Cape and Stellenbosch University;
• A high-level capacity strengthening programme for emerging researchers including for NMO countries; and
• An Early Postgraduate Education Programme aimed at developing a systems analysis component or module into selected Honour’s-level programmes at selected institutions in South Africa.

MANAGEMENT NEWS & RESOURCES
48

INSTITUTIONAL EVALUATIONPANEL MEMBERS
Michael Clegg, USA (Chair)
Tyseer Aboulnasr, Canada/Egypt
Heide Hackman, Germany/South
Africa
Erkki Leppävuori, Finland
Dirk Messner, Germany
Linxiu Zhang, China
Abdul Hamid Zakri, Malaysia

INSTITUTIONAL EVALUATIONTIMELINE
January 2017: Review
documents sent to panel
27 Feb – 1 March 2017:Panel to visit
IIASA
End April 2017:Interim report
to Council
June 2017:Final report to
Council

STREAMLINING IIASA REPORTING• Review of content provided in the Annual Report• Proposal for new Annual Report to contain
additional information requested by NMOs, relevant to their governance and assurance processes
• Merger of annual reporting publications: Annual Report and Scientific Update

RESEARCHER MOBILITY
209
272 278300
323 333 336
200
250
300
350
2010 2011 2012 2013 2014 2015 2016 (toOctober)
Number of Researchers Employed by IIASA (2010-16)
201
135
Full versus Part Time Researchers Employed by IIASA in 2015
Full timePart time
Research Staff 2016 2015 2014Leavers 120 119 97Newcomers 136 125 115Returning researchers
33 30 26
Nationalities 56 49 45

RESEARCH NETWORK
53
24 21
70
7
51
9 9
71
36
7
17
91
1710
75
31
63
22
99
20
10
20
30
40
50
60
70
80
90
100Visitors and Conference Participants from NMO countries
2015 2016 (to 1 October)

RESEARCHER DIVERSITY (GENDER & AGE)
27
55
125 5
0 0
22
84
59
23 25
14
4
0
10
20
30
40
50
60
70
80
90
20-29 30-39 40-49 50-59 60-69 70-79 80-89
Num
ber o
f res
earc
hers
Age
Researchers by age and gender in 2016
FemaleMale

STAFF DIVERSITY (GENDER & AGE)
1
4
27
22
18
8
0 02
4
11
6
11
31 1
0
5
10
15
20
25
30
10-19 20-29 30-39 40-49 50-59 60-69 70-79 80-89
Num
ber o
f sta
ff
Age
Support Staff by age and gender in 2016
FemaleMale

PROJECTED REALISATION OF THE 2016 BUDGET

BUDGET PROPOSAL 2017: SUMMARYINCOME SOURCES: 2017 Budget
Proposal2016 approved
Budget NMO Contributions 13.150 12.400
External Contracts & Grants 11.000 11.000
Other Income 0.200 0.100
Movement on Reserves (in 2017 transfer of unused draw of reserves from 2016) 0.350 1.000
SUBTOTAL: 24.700 24.500
ALLOCATIONS: 2017 Budget Proposal
2016 approved Budget
Direct allocations to Research Programs and related scientific activities 14.160 14.082
Other Scientific Initiatives 3.420 3.649
Scientific Services, Computer Hardware and other Capital 3.310 3.112
Scientific Activities, SUBTOTAL: 20.890 20.843
Infrastructure & Administration Support 3.380 3.242
Maintenance and Utilities 0.430 0.415
TOTAL ALLOCATIONS: 24.700 24.500

OUTREACH & COMMUNICATION
58

RECENT PUBLICATIONS
59

NEWSLETTER
60
0500
10001500200025003000350040004500
Janu
ary
March Ma
yJu
lySe
ptemb
erNo
vemb
erJa
nuar
yMa
rch May
July
Septe
mber
Nove
mber
Janu
ary
March Ma
yJu
lySe
ptemb
erNo
vemb
erJa
nuar
yMa
rch May
July
Septe
mber
Nove
mber
2013 2014 2015 2016
Analyst subscribers

0
500
1000
1500
2000
2500
3000
3500
4000Ju
lyAu
gust
Septe
mber
Octob
erNo
vemb
erDe
cemb
erJa
nuar
yFe
brua
ryMa
rch April
May
June July
Augu
stSe
ptemb
erOc
tober
Nove
mber
Dece
mber
Janu
ary
Febr
uary
March Ap
rilMa
yJu
ne July
Augu
stSe
ptemb
erOc
tober
Nove
mber
Dece
mber
Janu
ary
Febr
uary
March Ap
rilMa
yJu
ne July
Augu
stSe
ptemb
erOc
tober
Nove
mber
Dece
mber
Janu
ary
Febr
uary
March Ap
rilMa
yJu
ne July
Augu
stSe
ptemb
erOc
tober
Nove
mber
Dece
mber
2012 2013 2014 2015 2016
Social Media followers/likes
Twitter Followers Facebook Likes LinkedIn Followers
SOCIAL MEDIA
61
twitter.com/iiasavienna
facebook.com/iiasa
linkedin.com/company/iiasa-vienna
youtube/.com/iiasalive

BLOG / FLICKR
0
500
1000
1500
2000
2500
3000
Janu
ary
Febr
uary
March Ap
rilMa
yJu
ne July
Augu
stSe
ptemb
erOc
tober
Nove
mber
Dece
mber
Janu
ary
Febr
uary
March Ap
rilMa
yJu
ne July
Augu
stSe
ptemb
erOc
tober
Nove
mber
Dece
mber
Janu
ary
Febr
uary
March Ap
rilMa
yJu
ne July
Augu
stSe
ptemb
erOc
tober
Nove
mber
Dece
mber
2014 2015 2016
Blog Stats
Views Visitors 62
blog.iiasa.ac.at
flickr.com/iiasa

IIASA IN THE MEDIA
63
* 2015 numbers higher than average due to several highly syndicated articles from COP21
1838
28653096
4048
2418
2012 2013 2014 2015 2016
Media Hits per Year
229.75 238.75258
337.33
268.67
2012 2013 2014 2015 2016
Media Hits: monthly average

IIASA ALUMNI NETWORK
Channel to publicize IIASA news and NMO news
22
216
28
173
16
107
171
75
6
131
249 16
126
3623
96
23
128
30
90
80
100
200
300