Embed Size (px)
Citation preview
Active nuclear import and cytoplasmic retention of Activation Induced Deaminase
Anne-Marie Patenaude1, Alexandre Orthwein
1,2, Yi Hu
1,3, Vanina A Campo
1, Bodil Kavli
3,
Alejandro Buschiazzo4,5
and Javier M Di Noia1,2,6
1Institut de Recherches Cliniques de Montréal, 110 Av des Pins Ouest, Montréal, H2W 1R7,
Canada.
2Department of Microbiology and Immunology, University of Montreal, Montreal, QC, Canada.
3Department of Cancer Research and Molecular Medicine, Norwegian University of Science and
Technology, Erling Skjalgssons gt. 1, DMF, 7006 Trondheim, Norway.
4Institut Pasteur de Montevideo, Unidad de Cristalografia de Proteinas, Montevideo, Uruguay.
Mataojo 2020, Montevideo 11400, Uruguay.
5Institut Pasteur, Département de Biologie Structurale & Chimie, Paris, France.
6Department of Medicine, University of Montreal, Montreal, QC, Canada.
α1
α2
α3
α4
α5
α6
α7
Supplementary Figure 1(Di Noia)
AID APOBEC2
b
a

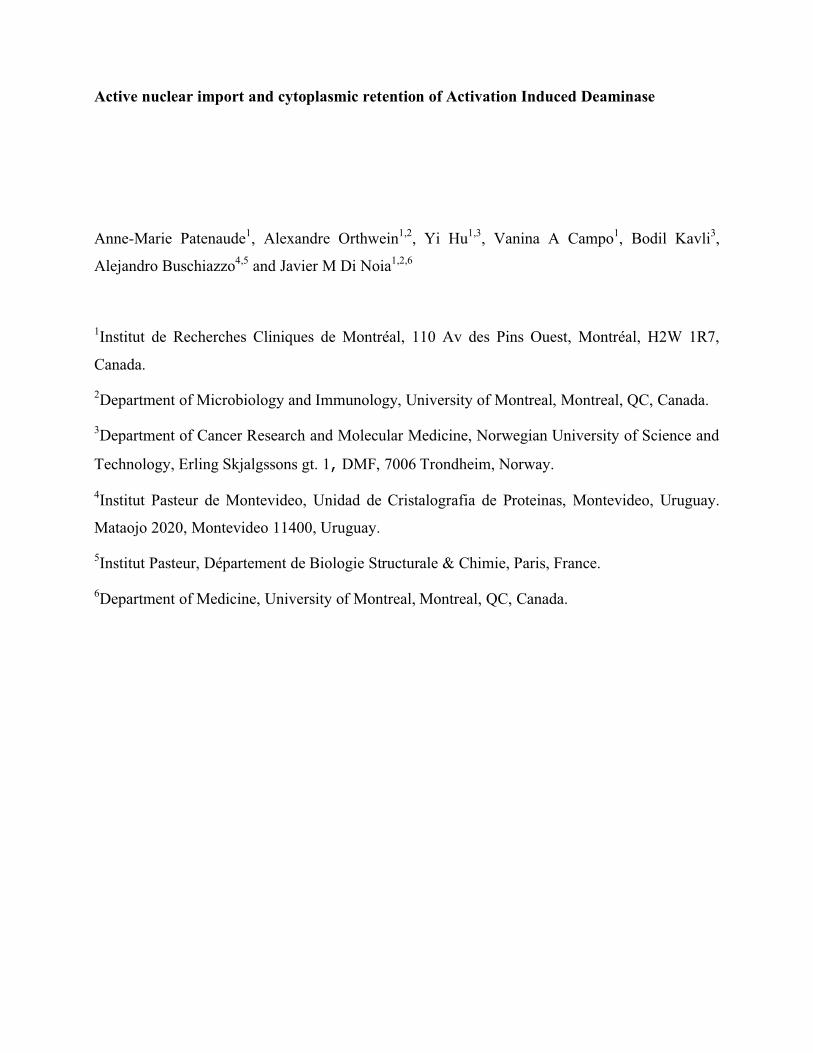
Supplementary figure 1 Three dimensional model of AID. (a) Cartoon representation of a
homology 3D model of AID, using structurally aligned 2NYT (APOBEC2), 3E1U and 2JYW
(APOBEC3G C-terminal domain) as templates. APOBEC2 and AID share 31% identity and 50%
similarity over the aligned regions. AID and APOBEC3G C-terminal domain share 45% identity
and 61% similarity. The colors follow a blue-to-red ramp indicating N- to-C-terminal direction.
Secondary structure elements are labeled in order from N- to C-terminus. The dotted ellipse
encircles a predicted C-terminal �-helix (�7), which is not present in any experimental 3D model
and distinguishes AID from its paralogs. The expected mobility of �7 is highlighted, poised to
fold against the globular core of AID and/or other protein partners. The Zn++
atom (not shown) is
predicted to be bound by residues at the converging N-termini of �-helices �2 and �3. (b)
Comparison of the three-dimensional structure of APOBEC2 with the homology model of AID.
A blue-to-red ramp indicates N-to-C-terminal direction. The Zn++
atom in the active site of
APOBEC2 is depicted (purple sphere). The C-terminal 17 amino acids of AID are not
represented.

NLSSV40-APOBEC2−GFP
Supplementary Figure 2(Di Noia)
GFP-β-Lac-GFP (~75 kDa)
β-Gal-GFP (~150 kDa)
APOBEC2-β-Lac-GFP (~75 kDa)
+ L
ept B
APOBEC2−β-Gal-GFP
+ L
ept B
NLSSV40-APOBEC2−β-Gal-GFP
+ L
ept B
+ L
ept B
APOBEC2-GFP (~50 kDa) GFP-APOBEC2
β-Lac-GFP (50 kDa)b c
aGFP PI
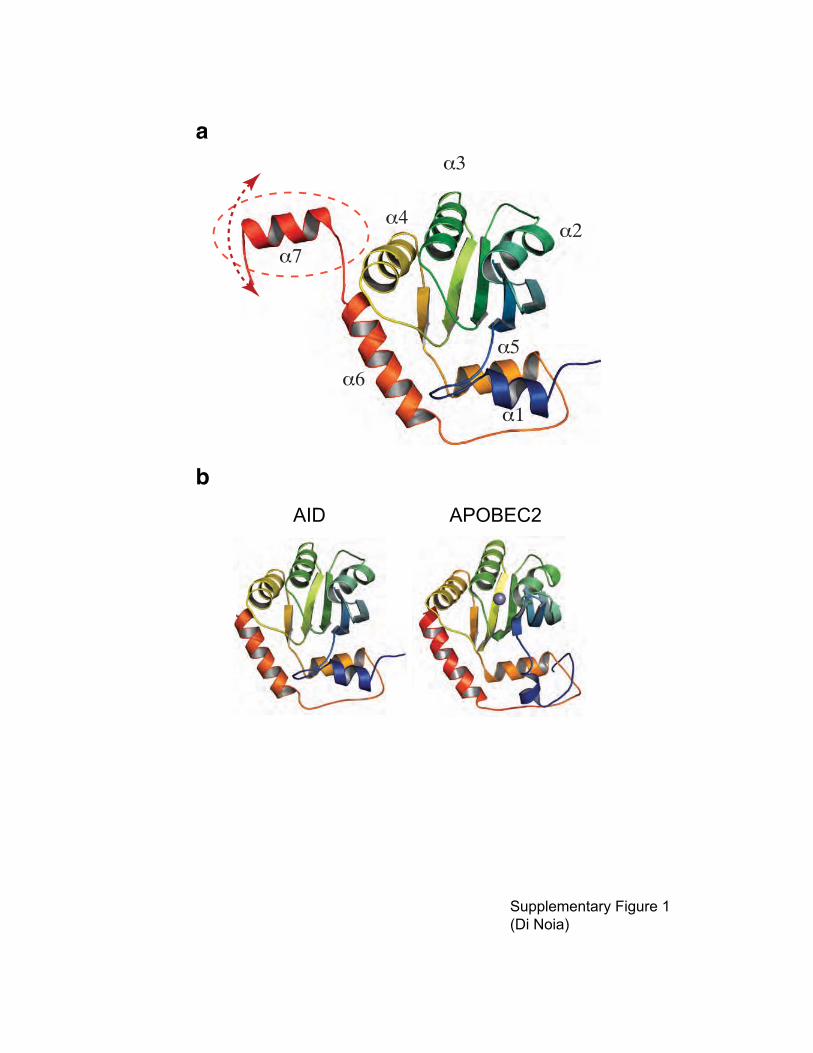
Supplementary figure 2 APOBEC2 has no nuclear import or export information. Representative
images of the indicated A2-GFP constructs transiently transfected in 293T cells. The labels
indicate the actual order of the fragments in the fusion proteins. Where indicated the cells were
treated with 50 ng ml-1
leptomycin B (+ Lept B) for 4 h before fixation and processing for
confocal microscopy. Nuclei stained with propidium iodide (PI) are shown in red. Magnification,
630X. Bars, 10 �m. (a) A2-GFP localization is insensitive to leptomycin B treatment or the
position of the GFP tag, but can be sent to the nucleus by NLSSV40
. (b) A2 is unable to mediate
nuclear import as part of a 75 kDa protein. �-Lac (�-Lactamase)-GFP (~50 kDa) can diffuse
across the nuclear membrane unless the size of the protein is increased to ~75 kDa by fusing
another GFP molecule or A2, as a further indication that this size is still below the nuclear pore
cut-off in these cells. (c) A2 is unable to mediate nuclear import as part of a 175 kDa protein.
Similar experiments to those in b were done using �-Gal (�-Galactosidase)-GFP (~150 kDa).
Fusing A2 did not cause any nuclear localization of this exclusively cytoplasmic protein. Further
fusion of NLSSV40
fully transported the ~175 kDa protein into the nucleus.
These experiments show that A2 does not seem to have any detectable information for nuclear
import or export, nor any retention mechanisms. Most of these constructs were assayed also in
HeLa cells with identical results (data not shown).

Supplementay Figure 3(Di Noia)
AID 30-GFP
GFP AID-GFP + Lept B
AID 40-GFP
AID 54-GFP
AID 85-GFP
AID 103-GFP
AID 142-GFP
AID 160-GFP
AID 181-GFP
AID 187-GFP
AID L198S-GFP
Supplementary figure 3 Mapping of the minimal import-proficient fragment of AID in 293T
cells. Representative confocal images showing the subcellular localization of GFP control, AID-
GFP after leptomycin B treatment and AID-GFP variants bearing C-terminal truncations in
transiently transfected 293T cells. Constructs are named according to the last residue of AID
included. Nuclei are shown in red stained with propidium iodide. Magnification, 630X. Bars, 10
�m.

Supplementary Figure 4(Di Noia)
+ L
ept B
#5#2AID Ctrl#3 #4
a
b
c AID-A2 #5-GFP AID-A2 #5-β-Gal-GFP
Col
onie
s/10
9 vi
able
cel
ls
2373
91 195 262
6418
1270
2000
4000
6000
8000
10000
C N+C N
Proportion of cells (%)
AID (n=74)
AID-A2
AID-A2
#1 (n=114)#2 (n=91)#3 (n=50)#4 (n=43)#5 (n=99)
AID (n=99)#1 (n=132)#2 (n=61)#3 (n=84)#4 (n=53)#5 (n=73)
+ Lept B
0 20 40 60 80 100
#1
AID-A2-GFP
AID-A2
#2 #3 #4 #5AID-GFP
Supplementary figure 4 Mapping of AID subcellular localization determinants using AID-
APOBEC2 chimeras in 293T cells. (a) Representative confocal images of 293T cells transiently
expressing AID or AID-A2 #1 to #5 fused to the N-terminus of GFP in the steady state and after
4 h incubation with 50 ng ml-1
of leptomycin B. Magdnification, 630X. Bars, 10 �m. The stacked
bars plot below summarizes the scoring of the subcellular localization of AID-GFP control and
AID-A2 #1 to #5-GFP in steady state and after leptomycin B treatment. Cells from 5-10
randomly picked fields from two independent experiments were counted and classified according
to whether the GFP signal was cytoplasmic (black), homogeneous throughout the cell (grey) or
largely nuclear (white). The total number of cells scored for each condition is indicated (n). (b)
Mutation assay in E coli BW310 [�ung] showing that AID-A2 #5 is catalytically active. Data
from two independent experiments are pooled and median values for all independent cultures are
indicated. AID-A2 #1-GFP could not be expressed in E coli. (c) AID-A2 #5 cannot be actively
imported into the nucleus. Representative confocal images of 293T cells transiently transfected
with plasmids encoding AID-A2 #5-GFP or the larger variant #5-�Gal-GFP. Magnification,
630X. Bars, 10 �m.
a b c
g
d e f0t(h)
α-GFP
α-Actin
α-GFP
α-Actin
FYRN
wt
1 2 4 6 8
α-GFP
α-Actin
F46A/Y48A
Supplementary Figure 5(Di Noia)
AID F46A/Y48A-GFP
AID F46A-GFP AID FYRN-GFPAID-GFP
AID-GFP
AID FYRN-GFP
Col
onie
s/10
9 via
ble
cells
AID E58A-GFP
Vector
4512
2513952980
1000
2000
3000
4000
5000
6000
7000
AIDAID FYRN
Cel
ls (
%)
20
40
60
80
100
0
CN+CN
CN+CN
+Lept B
20
40
60
80
100
0
+ Lept B + Lept B
+ Lept B
+ Lept B
+ Lept B+ Lept B
NLSSV40-AID-GFP
NLSSV40-AID FYRN-GFP
+ Lept B
+ Lept B
GFP wt R19A
AID-GFP
R24W R112D
HeL
a
+ Lept B
Y114A/F115A E117A/D118A
293T
+ Lept B
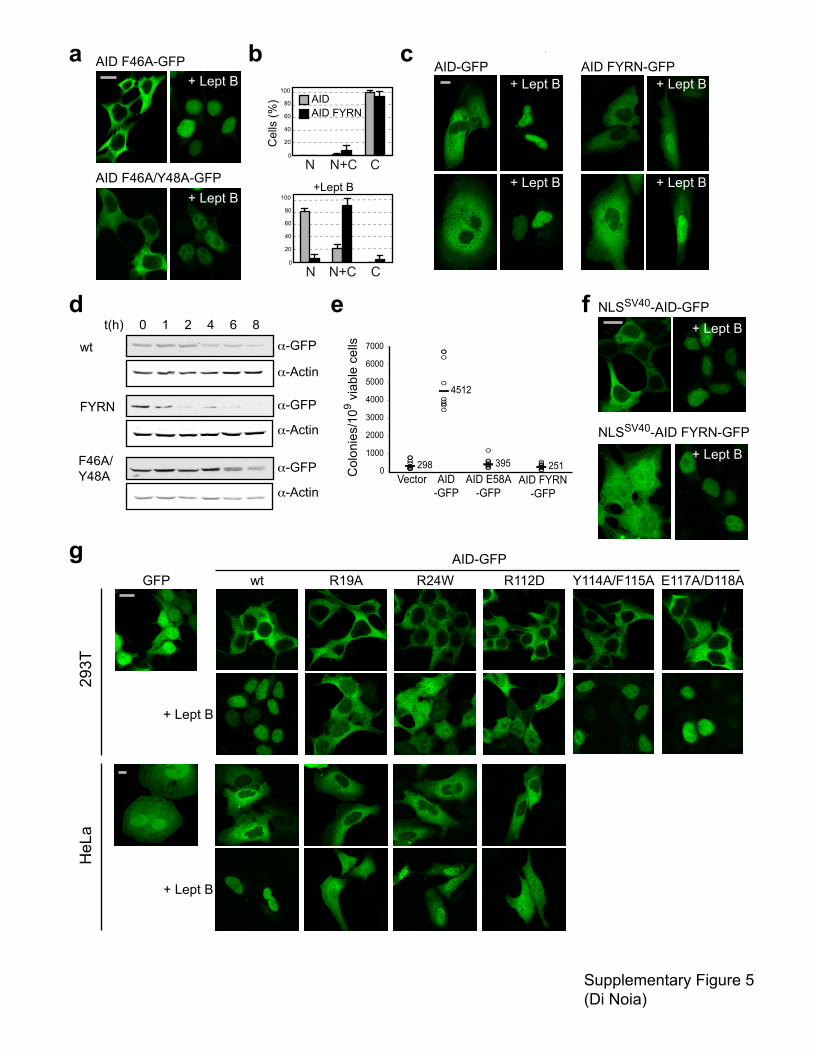
Supplementary figure 5 Subcellular localization of AID mutants in predicted oligomerization
surfaces suggest multiple and scattered nuclear import determinants. (a) Oligomerization
proficient AID variants bearing mutations in �2 retain nuclear accumulation. Representative
confocal images of 293T cells transiently transfected with plasmids encoding AID-GFP carrying
the indicated mutations in the steady state or after leptomycin B treatment. (b) Bar plot
summarizing the scoring of the subcellular localization for AID FYRN-GFP and AID-GFP in
293T cells in steady state and after leptomycin B treatment. Cells from randomly picked fields
were counted and classified according to their predominant subcellular localization as largely
cytoplasmic (C), homogeneous throughout the cell (N+C) or nuclear (N). Average + s.d. from
multiple fields from three transfections are plotted. The total number of cells scored was AID
n=87, AID FYRN n=99, AID + Lept B n=206, AID FYRN + Lept B n=160. (c) AID FYRN is
also mislocalized in Hela cells. Representative confocal images of HeLa cells transiently
transfected in parallel with plasmids encoding AID-GFP or the mutants AID FYRN
(F46A/Y48A/R50G/N51A) in the steady state or after treatment with leptomycin B. (d) AID
FYRN is unstable. Aliquots of 293T cells transiently transfected with plasmids encoding each of
the indicated AID-GFP proteins were harvested at the indicated times after addition of
cycloheximide, lyzed and analyzed by western blot with anti-GFP antibodies. Actin was used as
loading controls. (e). Mutation assay in E coli BW310 [�ung] shows that AID FYRN is
catalytically inactive. Data from two independent experiments are pooled, median values for all
the independent cultures are indicated. (f) AID FYRN can be sent to the nucleus by an
heterologous NLS. Representative confocal images of 293T cells transiently transfected with
plasmids encoding AID-GFP and AID FYRN-GFP with an N-terminally fused NLS (from SV40
large T antigen) in steady state and after leptomycin B treatment. (g) Scattered basic residues
influence AID nuclear import. Representative images of 293T and HeLa cells transiently
transfected with plasmids encoding AID-GFP bearing the indicated mutations in the steady state
or after treatment with leptomycin B. All pictures magnification, 630X. Bars, 10 �m.
a
b
c
Supplementary Figure 6(Di Noia)
Flag-AID
+ L
eptB
(4
h)
AID-Flag GFP-UNG2
UNG2-GFP
AID-GFP
1 2 4 60t (h)
AID-A2 #1-GFP
GFP-AID
GFPAID
-GFP
GFP-AID
AID 1
81-G
FP
AID D
D-GFP
A2-GFP
WB GFP
(AID-Flag)
IP F
lag
Lysa
tes
WB Flag
WB GFP
47.5
32.5
25
25
47.5
32.5
25
AID-GFP + Flag-AID
GFP α-FLAG
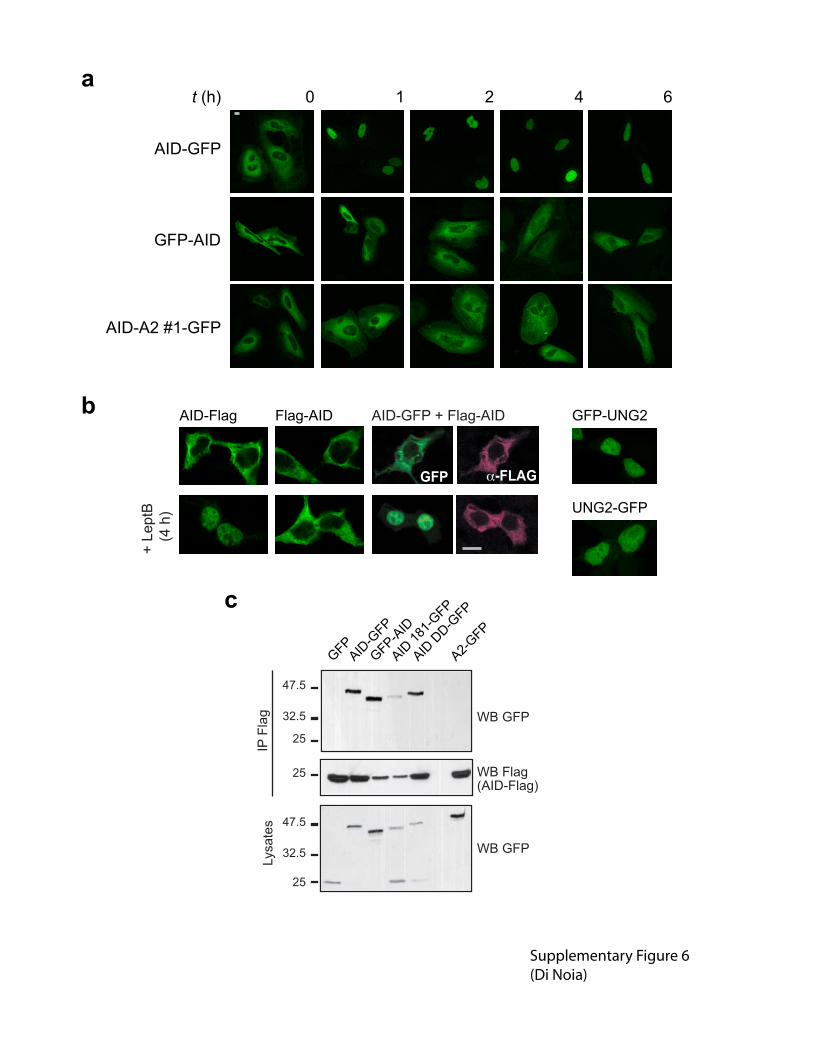
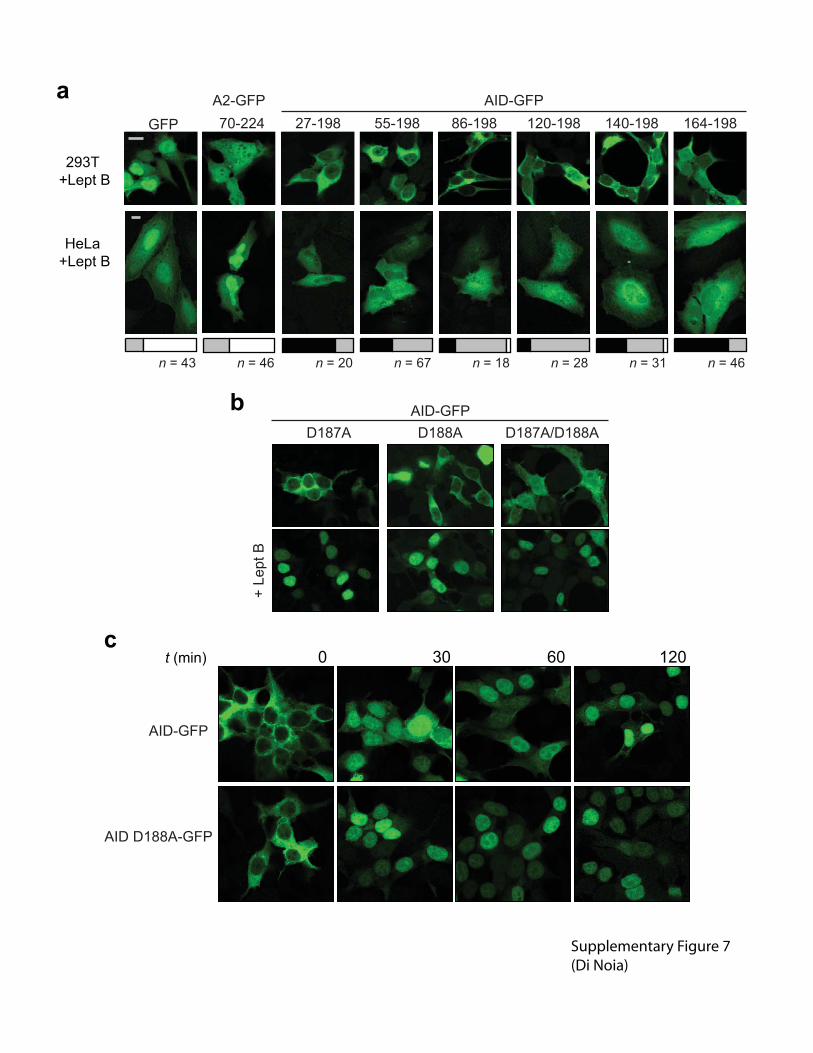
Supplementary figure 6 N-terminal fusions of AID fail to diffuse into the nucleus but still
oligemerize. (a) Representative confocal pictures of HeLa cells transiently expressing AID-GFP,
GFP-AID or AID-A2 #1-GFP at different times after the addition of leptomycin B. (b)
Representative confocal images of 293T cells transiently transfected with plasmids encoding
Flag-AID, AID-Flag or cotransfected with Flag-AID and AID-GFP in the steady state or after
leptomycin B treatment. Flag was detected using anti-Flag followed by anti-mouse
AlexaFluor546 (pseudocolored). Representative confocal images of 293T cells transiently
transfected with plasmids encoding UNG2-GFP and GFP-UNG2 are shown as controls that
nuclear import is usually insensitive to the tagged protein end. UNG2, nuclear isoform of mouse
uracil-DNA glycosylase. Magnification, 630X. Bars, 10 �m. (c) Oligomerization assay for the
indicated AID variants. The fusion proteins indicated on the top were transiently coexpressed
with AID-Flag. The ability of these proteins to coimmunoprecipitate with AID-Flag after anti-
Flag pull-down was assessed by western blot.
The observation that AID-GFP does not bring Flag-AID into the nucleus when these proteins are
able to oligomerize in coIP assays may at first glance suggest that oligomerization is not
necessary for import. Alternatively, this observation may just reflect dynamic oligomerization
between AID-GFP and Flag-AID with heterodimers being less efficiently imported. Since AID-
GFP homodimers would be removed from the equation once they enter the nucleus in the
presence of leptomycin B, it could lead to the observed phenotype. In addition, we discuss the
possibility that C-terminal tags may affect retention, just as N-terminal tags affect import. This is
suggested by slower nuclear accumulation of untagged AID as compared to AID-GFP in
response to leptomycin B. In cotransfected cells, AID-GFP would be preferentially imported and
Flag-AID preferentially retained, contributing to the observed phenotype.
GFP
b
a
c
AID-GFPA2-GFP
293T +Lept B
HeLa +Lept B
+ L
ept B
AID-GFP
D188AD187A D187A/D188A
12060300t (min)
AID-GFP
AID D188A-GFP
Supplementary Figure 7(Di Noia)
70-224 27-198 55-198 86-198 120-198 140-198 164-198
n = 43 n = 46 n = 67 n = 18 n = 28 n = 31 n = 46n = 20
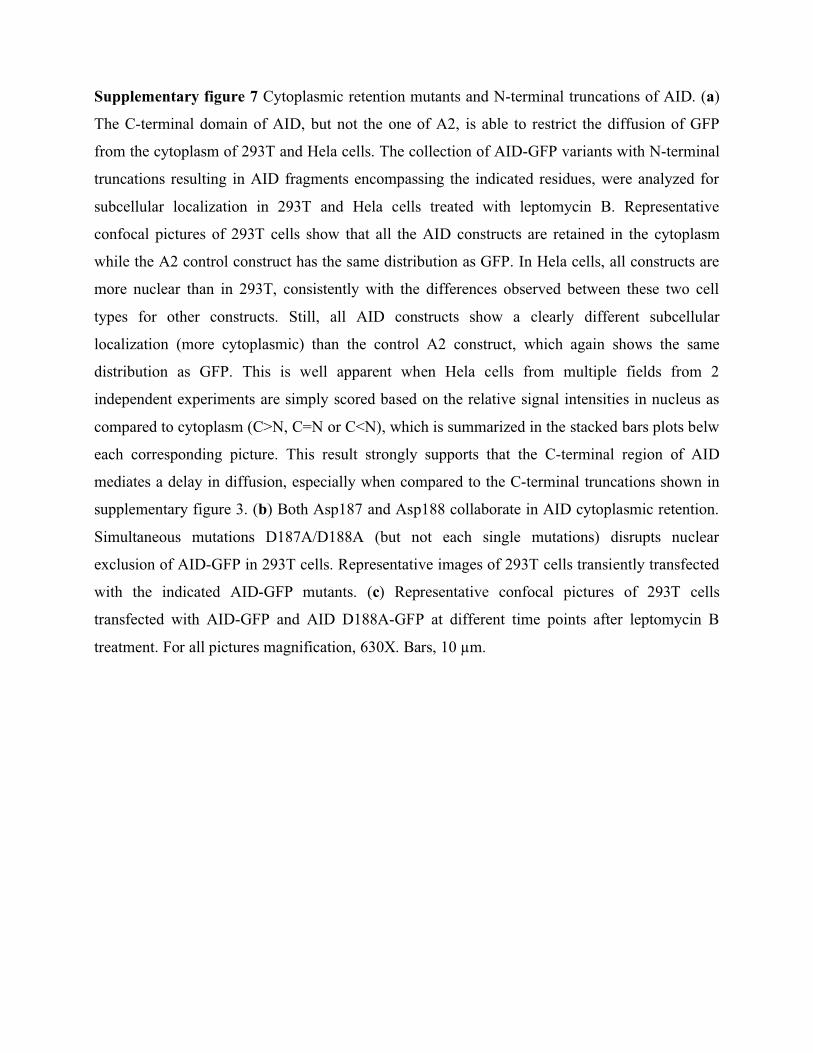
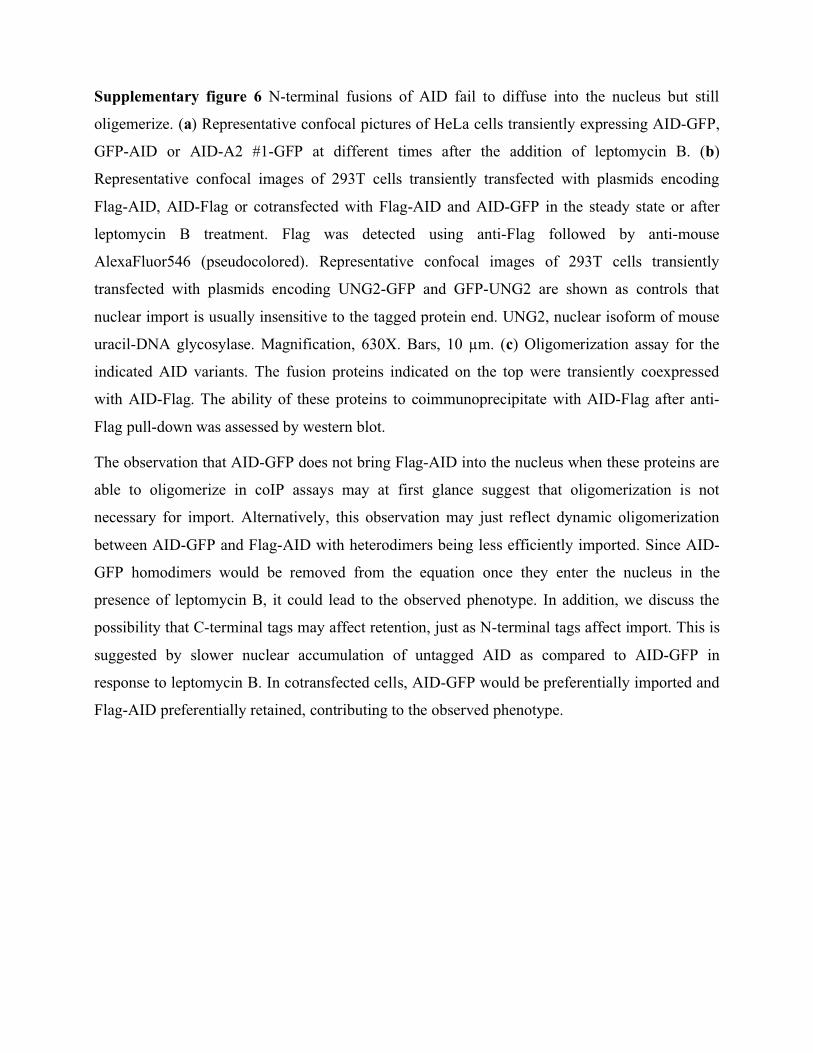
Supplementary figure 7 Cytoplasmic retention mutants and N-terminal truncations of AID. (a)
The C-terminal domain of AID, but not the one of A2, is able to restrict the diffusion of GFP
from the cytoplasm of 293T and Hela cells. The collection of AID-GFP variants with N-terminal
truncations resulting in AID fragments encompassing the indicated residues, were analyzed for
subcellular localization in 293T and Hela cells treated with leptomycin B. Representative
confocal pictures of 293T cells show that all the AID constructs are retained in the cytoplasm
while the A2 control construct has the same distribution as GFP. In Hela cells, all constructs are
more nuclear than in 293T, consistently with the differences observed between these two cell
types for other constructs. Still, all AID constructs show a clearly different subcellular
localization (more cytoplasmic) than the control A2 construct, which again shows the same
distribution as GFP. This is well apparent when Hela cells from multiple fields from 2
independent experiments are simply scored based on the relative signal intensities in nucleus as
compared to cytoplasm (C>N, C=N or C<N), which is summarized in the stacked bars plots belw
each corresponding picture. This result strongly supports that the C-terminal region of AID
mediates a delay in diffusion, especially when compared to the C-terminal truncations shown in
supplementary figure 3. (b) Both Asp187 and Asp188 collaborate in AID cytoplasmic retention.
Simultaneous mutations D187A/D188A (but not each single mutations) disrupts nuclear
exclusion of AID-GFP in 293T cells. Representative images of 293T cells transiently transfected
with the indicated AID-GFP mutants. (c) Representative confocal pictures of 293T cells
transfected with AID-GFP and AID D188A-GFP at different time points after leptomycin B
treatment. For all pictures magnification, 630X. Bars, 10 �m.
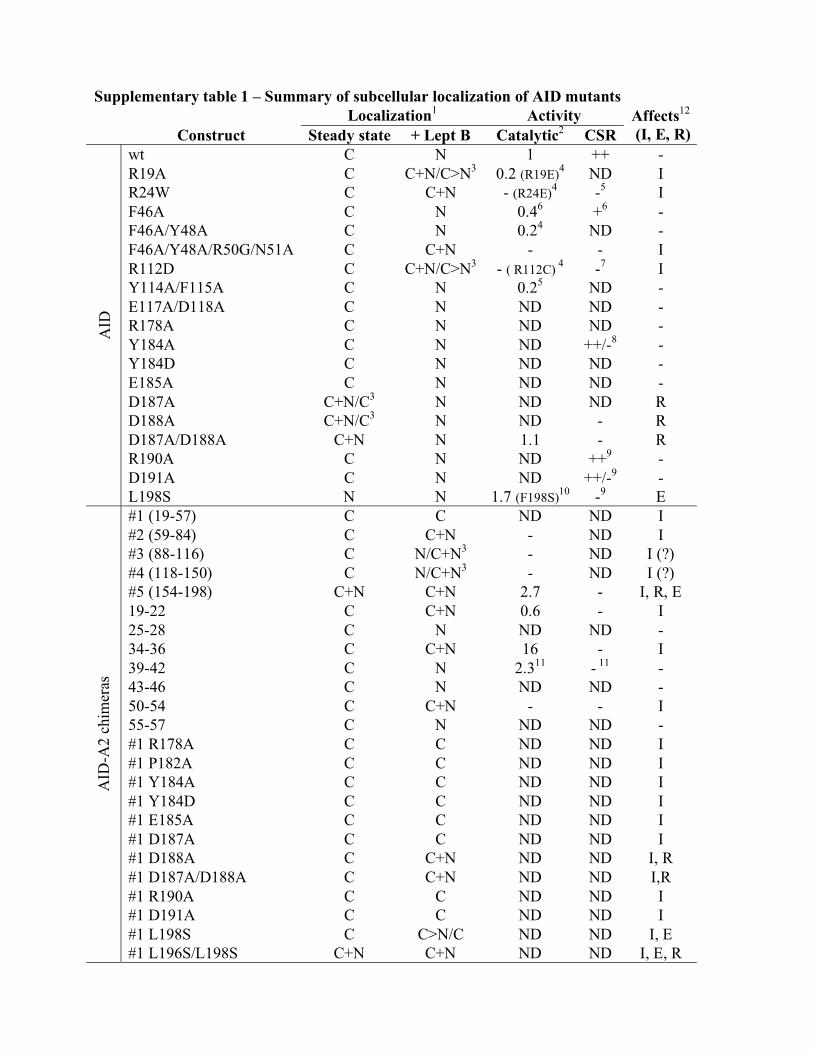
Supplementary table 1 – Summary of subcellular localization of AID mutants
Localization1 Activity
Construct Steady state + Lept B Catalytic2 CSR
Affects12
(I, E, R)
wt C N 1 ++ -
R19A C C+N/C>N3 0.2 (R19E)
4 ND I
R24W C C+N - (R24E)4 -
5 I
F46A C N 0.46 +
6 -
F46A/Y48A C N 0.24 ND -
F46A/Y48A/R50G/N51A C C+N - - I
R112D C C+N/C>N3 - ( R112C)
4 -
7 I
Y114A/F115A C N 0.25 ND -
E117A/D118A C N ND ND -
R178A C N ND ND -
Y184A C N ND ++/-8 -
Y184D C N ND ND -
E185A C N ND ND -
D187A C+N/C3 N ND ND R
D188A C+N/C3 N ND - R
D187A/D188A C+N N 1.1 - R
R190A C N ND ++9 -
D191A C N ND ++/-9 -
AID
L198S N N 1.7 (F198S)10
-9 E
#1 (19-57) C C ND ND I
#2 (59-84) C C+N - ND I
#3 (88-116) C N/C+N3 - ND I (?)
#4 (118-150) C N/C+N3 - ND I (?)
#5 (154-198) C+N C+N 2.7 - I, R, E
19-22 C C+N 0.6 - I
25-28 C N ND ND -
34-36 C C+N 16 - I
39-42 C N 2.311
- 11
-
43-46 C N ND ND -
50-54 C C+N - - I
55-57 C N ND ND -
#1 R178A C C ND ND I
#1 P182A C C ND ND I
#1 Y184A C C ND ND I
#1 Y184D C C ND ND I
#1 E185A C C ND ND I
#1 D187A C C ND ND I
#1 D188A C C+N ND ND I, R
#1 D187A/D188A C C+N ND ND I,R
#1 R190A C C ND ND I
#1 D191A C C ND ND I
#1 L198S C C>N/C ND ND I, E
AID
-A2 c
him
eras
#1 L196S/L198S C+N C+N ND ND I, E, R
1The predominant phenotype (>80% of the cells) is indicated as C, mainly cytoplasmic; N,
nuclear and C+N (when homogeneously distributed) or C>N (when still predominantly
cytoplasmic but nuclear signal was clear).
2 Determined by E coli assays except where specified. Normalized to wt AID = 1 in the same
assay. ND, not determined.
3 Phenotype in HeLa/293T cells for those constructs for which it was different.
4 The activity determined by oligonucleotide cleavage assay of AID mutated at these positions
but to different amino acids in ref 1 is shown for comparison.
5 Hyper IgM patient mutation
2.
6 Ref
3.
7 Ref
4
8 Ref
5
9 Ref
6
10 The corresponding mutation in mouse AID was tested
7
11 Ref
8
12 Proposed subcellular localization mechanism affected in each construct, nuclear import (I),
nuclear export (E) or cytoplasmic retention (R).
Supplementary Methods
AID modeling. To generate three-dimensional models of AID we used a homology modeling
approach as implemented in the program MODELLER version 9v3 (ref 9). We performed a
structural alignment, using the models of APOBEC-2 (2NYT chains A and B, displaying
alternative conformations in the �1/�1 turn; AID Arg19, structurally equivalent to A2 Glu60,
might be critical in mediating a similar switch, but lacking experimental structural evidence we
did not include any restraint with the predicted position of Zn2+
in the reaction center) and
APOBEC3G (determined by X ray diffraction 3E1U, and by NMR 2JYW). We then generated a
multiple sequence alignment of these three sequences with CLUSTAL W 2.0 (ref 10
) and
manually corrected it according to the structural superposition. We then added the AID sequence
to perform a final profile alignment on top of the first consensus, using structure-based penalties.
We used this alignment in MODELLER 9v3 to build 20 AID models, from which the best
scoring were selected (lowest final minimization energies and best fitting in terms of
stereochemical quality criteria). JPRED prediction of secondary structure11
, results in good match
of known A2 and APOBEC3G models; for AID, this prediction suggests the presence of alpha
helices at the N- and C-termini (�1 residues 10-14 and �7 187-193, respectively). We added
corresponding parameters in MODELLER to restrain these two alpha helical structures. �7
adopts a range of alternative positions relative to the globular core, since no homologous
structure can be used as template; as spatial reference, one of these positions is shown in Figure 4
and Supplementary Figure 1 only with illustrative purposes. The dimer was generated by
performing a structural superposition of the chosen monomeric model of AID, onto the dimer
portion of A2 (2NYT). Including explicit hydrogen atoms in the riding positions, this initial
dimer of AID was subjected to energy minimization protocols as implemented in the program
CNS v1.2 (ref 12
) until convergence of energy values. The final model displays no clashes and
good stereochemistry. Although the dimerization architecture needs definitive experimental
support, it is used to spatially locate the areas corresponding to relevant residues in nuclear
import, highlighting that their accessible surfaces join in a single continuous patch, juxtaposed in
the dimer. Figures were prepared with PyMol v0.99 (http://www.pymol.org).
Cell transfections. We transiently transfected HeLa and 293T cells by using either the calcium
phosphate precipitation or Lipofectamine 2000 (Invitrogen) according to the manufacturer
instructions. Ramos cells were transiently transfected using Cell line nucleofector Kit V (Amaxa
Inc) and Amaxa electroporator as indicated by the manufacturer. Cells were used for assays
and/or processed for imaging 24-36 h post transfection. We obtained stable transfectants of the
Ramos B cell line by electroporation with pEGFP-N3 AID (250 V, 950 �F in 0.4 cm cuvettes)
and selection in 2.5 mg ml-1
G418 (Wisent Inc, St-Bruno, Quebec).
Confocal microscopy and cell counting. Images were acquired using a Zeiss LSM 510 confocal
microscope with excitation lasers Argon 488 nm (for EGFP and Alexa488) and HeNe 543 nm
(for propidium iodide Alexa546) equipped with either 40X or 63X/1.4 oil immersion objectives.
Saturation and background settings were adjusted before each session in the acquisition software
provided by the manufacturer and all images acquired with the same settings. All experiments
were repeated at least 2 times. Images were analyzed in ImageJ (Rasband, W.S., ImageJ, U. S.
National Institutes of Health, Bethesda, Maryland, USA, http://rsb.info.nih.gov/ij/) and then
transferred to Photoshop CS2 (Adobe Systems Inc) for cropping. Contrast was adjusted for the
whole image in Photoshop when required to enhance visibility in the final figure without
affecting the information registered in the original picture. Final figures were assembled in
Illustrator CS2 (Adobe Systems Inc). To score subcellular localization we counted all cells,
except those having mitotic figures or with saturated signal, in each of several randomly acquired
fields from at least 2 independent experiments. Panels for which no quantitation is shown are
representative of at least 85% of the transfected cells.
GST pull downs. GST fusion proteins were induced in E coli BL21 DE3 for 3 h at 37˚C with 0.5
mM IPTG. Cells were lyzed in PBS-KM (PBS 1mM MgCl2 3 mM KCl) 0.1% (v/v) Tween 20 by
sonication. Lysates were clarified by centrifuging at 16,100 x g for 45 min at 4˚C and incubated
for 2 h at 4˚C with 40 �l Glutathione-agarose resin (Sigma-Aldrich) pre-washed in PBS-KM
0.5% (w/v) BSA. Ramos B cells expressing AID-Flag or transiently transfected 293T cells were
washed in PBS and extracted in Lysis Buffer for 30 min on ice. Cell extracts were clarified by
centrifugation for 20 min at 15,000 x g at 4˚C and 3 x 10⁶ 293T or 2 x 10
7 Ramos cell equivalents
mixed with 40 �l of GSH-sepharose beads loaded with ~5 �g of recombinant GST-fusion
protein. Beads and extracts were incubated for 3 h at 4˚C with agitation, washed three times in
PBS-KM and eluted for 20 min on ice in 50 �l of 20 mM reduced GSH 50 mM TrisHCl pH 8.0.
The eluates and post-clearing lysates were separated in 10% SDS-PAGE, transferred to
nitrocellulose, stained with Ponceau-S and probed with 1:3000 anti-EGFP-HRP (Miltenyi Biotec)
or 1:1000 anti-AID followed by 1:5000 goat anti-Rat-HRP (Chemicon International).
Protein stability measurement. Transiently transfected 293T cells growing in 10 cm plates were
harvested 36-48 h after transfection, resuspended in complete DMEM medium containing 100 �g
ml-1
cycloheximide (Sigma-Aldrich) and replated in 6-well plates. One well was collected at 0, 1,
2, 4, 6 and 8 h after cycloheximide addition, washed with PBS and resuspended in Lysis Buffer
for 30 min on ice. Cell extracts were clarified by centrifugation for 10 min at 4˚C, and the
supernatants collected. Protein concentration of each sample was measured using the BCA
Protein Assay Kit (Thermo Scientific). Volumes of lysate corresponding to 10 �g of protein for
each time point were separated by SDS-PAGE and analyzed by western blot using anti-eGFP-
HRP. Loading controls were probed by using anti-PCNA (1:2000 Abcam) or anti-Actin (1:5000
Sigma-Aldrich) followed by anti-mouse-HRP (Dako cytomation) or anti-rabbit-HRP (Dako
cytomation), respectively.
AID decay in DT40 B cells was monitored by preincubating populations transduced with pMXs
retroviral vectors encoding AID-GFP or AID D187A/D188A-GFP with cycloheximide for 1 h
and then monitoring GFP signal by flow cytometry over time in the presence or absence of 10 ng
ml-1
leptomycin B. Mean fluorescent intensity (MFI) of GFP was recorded and normalized to t =
0 to construct the decay curves.
Oligonucleotides. OJ 60, AAGGATCCCAAATGGACAGCCTCTTGATGAA, 5' AID, chimeras
#1-5, BamHI; OJ 166, CGAATTCCCAAGTCCCAAAGTACGAAATGC, 3' AID, chimeras #1-4
EcoRI; OJ 196, NNGGATCCCAAATGGCCCAGAAGGAAGAGGCT, 5' APOBEC2 BamHI;
OJ 197, NGAATTCCCCTTCAGGATGTCTGCCAACTTCT, 3’ AID-A2 #5 EcoRI; OJ 213,
NNGAATTCTATGATGAGCACTTTTAAAGTTCT, 5' �-lactamase pUC18, EcoRI; OJ 214,
NNGGATCCCCAATGCTTAATCAGTGAGG, 3' �-lactamase pUC18, BamHI; OJ 172,
NNGAATTCTATGGGGGGTTCTCATCATCA, 5' lacZ pIND/lac, EcoRI; OJ 174,
NNGGATCCTGATTTTTGACACCAGACCAACTG, 3' lacZ pIND/lac, BamHI. For C-terminal
Flag tagging OJ 215, AATTCTGGAGACTACAAAGACGATGACGACAAGTCGGCCG-
CTGGAGGATACCCCTACGACGTGCCCGACTACGCCTAGGC was annealed to OJ 216,
GGCCGCCTAGGCGTAGTCGGGCACGTCGTAGGGGTATCCTCCAGCGGCCGACTTGTC
GTCATCGTCTTTGTAGTCTCCAG; OJ 61, AAAAGCTTATCAAAGTCCCAAAGTA-
CGAAA, 3’ AID for pTrc99a. To construct the Met-SV40 NLS OJ 190, CTAGCATGGGGG-
CCCCCAAGAAGAAACGTAAAGTCA was annealed to OJ 191, GATCTGACTTTAC-
GTTTCTTCTTGGGGGCCCCCATG. For Met-nucleoplasmin NLS OJ 192, CTAGCATG-
GCCAAGCGCCCTGCCGCCACTAAGAAGGCCGGTCAGGCCAAGAAGAAGAAGA was
annealed to OJ 193, GATCTCTTCTTCTTCTTGGCCTGACCGGCCTTCTTAGTGGCGG-
CAGGGCGCTTGGCCATG.
AID antisense to produce C-terminal truncations or mutations used in combination with OJ60: OJ
180, NNGAATTCCCGCACAGGTAGGTCTCACGCCGA, AID30; OJ 182, NNGAATTCCCT-
GTAGCACTGTCACGCCTCTT, AID40; OJ 177, NNGAATTCCCGTTCTTATTGCGA-
AGATAA, AID54; OJ 233, NGAATTCCCGCTCCAGGAGGTGAACCAGGT, AID85; OJ 234,
NGAATTCCCGTTGGGGTTCCCTCGCAGA, AID103; OJ 235, NGAATTCCCTTTGAAGG-
TCATGATGGCTAT, AID142; OJ 236, NGAATTCCCTTTGAAAGTTCTTTCATGGTT,
AID160; OJ 181, NNGAATTCCCCAAAAGGATGCGCCGAAGCT, AID181; OJ 211,
NNCGAATTCCCATCAACCTCATACAGGGGCA, AID187; OJ 204, NNGAATTCCCAGA-
TCCCGAAGTACGAAATGCGT, L196S + L198S. AID sense used to produce N-terminal
truncations in combination with OJ166, OJ 250, AAGGATCCCAAATGACCTACCTGTGC-
TACGTAGT, AID 27-198; OJ 208, NNGGATCCATGGGCTGCCACGTGGAATTGCTCT,
AID 55-198; OJ 306, AAGGATCCCAAATGCCCTGCTACGACTGTGCCCGA, AID 86�-198;
OJ 307, AAGGATCCCAAATGAAGGCTGAGCCCGAGGGGCT, AID 120-198; OJ 308,
AAGGATCCCAAATGACCTTCAAAGATTATTTTTACT, AI AID 140-198; OJ 309, AAGG-
ATCCCAAATGGGGCTGCATGAAAATTCAGT, AID 164-198.
Oligonucleotides used together with their complementary for quickchange mutagenesis. OJ 241,
CTGGGCTAAGGGTTGGCGTGAGACCTAC, R24W; OJ 246, GGATCTTCACCGCGGAC-
CTCTACTTCTGTGAG, R112D; OJ 255, CAATTCAAAAATGTCGCCTGGGCTAAG-
GGTCGGCG, R19A; OJ 268, CACCGCGCGCCTCGCCGCCTGTGAGGACCGCAAGGCTG,
Y114A + F115A; OJ 270, CGCCTCTACTTCTGTTCCTCCCGCAAGGCTGAGCCCGAG,
E117S + D118S; OJ 266, CCTTTTCACTGGACGCTGGTTATCTTCGCAATAAG, F46A; OJ
264, CCTTTTCACTGGACGCTGGTGCTCTTCGCAATAAGAACG, F46A + Y48A; OJ 194,
CCTTTTCACTGGACGCTGGTGCTCTTGGCGCTAAGAACGGCTGCC, F46A + Y48A +
R50G + N51A; OJ 276, CCTGTATGAGGTTGCTGCCTTACGAGACGCATTTCG, D187A-
D188A; OJ 296, CTGTGCTACGTAGTGGAGGCGCAAGACAGTGCTACATCC,
K34E/R35A/R36Q; OJ 290, GTATGAGGTTGATGCCTTACGAGACGCATTTC, D188A; OJ
304, CCTGTATGAGGTTGCTGACTTACGAGACGC, D187A; OJ 286, GCCCCTGTAT-
GCGGTTGATGACTTACGAG, E185A; OJ 288, GACAGCTTCGGGCCATCCTTTTG-
CCCCTG, R178A; OJ 292, GAGGTTGATGACTTAGCAGACGCATTTCGTAC, R190A; OJ

294, GTTGATGACTTACGAGCCGCATTTCGTACTTTG, D191A; OJ 184, CCTTTTGCCCC-
TGGATGAGGTTGATGACTTACG, Y184D; OJ 278, CCTTTTGCCCCTGGCTGAGGTTGA-
TGACTTACG, Y184A.

Supplementary References
1. Prochnow, C., Bransteitter, R., Klein, M.G., Goodman, M.F. & Chen X.S. The APOBEC-
2 crystal structure and functional implications for the deaminase AID. Nature 445, 447-51
(2006).
2. Revy, P. et al. Activation-induced cytidine deaminase (AID) deficiency causes the
autosomal recessive form of the Hyper-IgM syndrome (HIGM2). Cell 102, 565-75
(2000).
3. Shivarov, V., Shinkura, R. & Honjo, T. Dissociation of in vitro DNA deamination activity
and physiological functions of AID mutants. Proc Natl Acad Sci USA 105, 15866-71
(2008).
4. Ta, V. et al. AID mutant analyses indicate requirement for class-switch-specific cofactors.
Nat Immunol 4, 843-8 (2003).
5. Basu, U. et al. The AID antibody diversification enzyme is regulated by protein kinase A
phosphorylation. Nature 438, 508-11 (2005).
6. Doi, T. et al. The C-terminal region of activation-induced cytidine deaminase is
responsible for a recombination function other than DNA cleavage in class switch
recombination. Proc Natl Acad Sci USA (2009).
7. McBride, K.M., Barreto, V.M., Ramiro, A.R., Stavropoulos, P. & Nussenzweig, M.C.
Somatic hypermutation is limited by CRM1-dependent nuclear export of activation-
induced deaminase. J Exp Med 199, 1235-44 (2004).
8. Conticello, S.G. et al. Interaction between antibody-diversification enzyme AID and
spliceosome-associated factor CTNNBL1. Mol Cell 31, 474-84 (2008).
9. Fiser, A. & Sali, A. Modeller: generation and refinement of homology-based protein
structure models. Methods Enzymol 374, 461-91 (2003).
10. Larkin, M.A. et al. Clustal W and Clustal X version 2.0. Bioinformatics 23, 2947-8
(2007).
11. Cole, C., Barber, J.D. & Barton, G.J. The Jpred 3 secondary structure prediction server.
Nucleic Acids Res 36, W197-201 (2008).
12. Brunger, A.T. Version 1.2 of the Crystallography and NMR system. Nat Protoc 2, 2728-
33 (2007).