Embed Size (px)
Citation preview
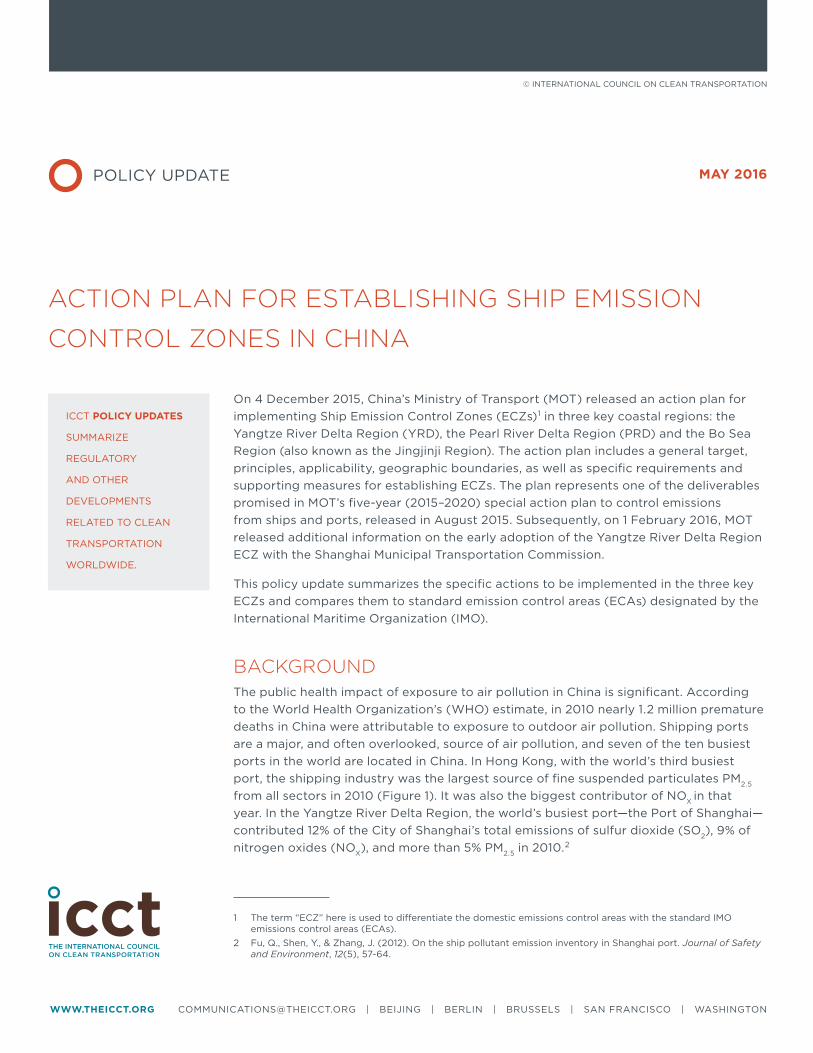
POLICY UPDATE MAY 2016
© INTERNATIONAL COUNCIL ON CLEAN TRANSPORTATION
On 4 December 2015, China’s Ministry of Transport (MOT) released an action plan for implementing Ship Emission Control Zones (ECZs)1 in three key coastal regions: the Yangtze River Delta Region (YRD), the Pearl River Delta Region (PRD) and the Bo Sea Region (also known as the Jingjinji Region). The action plan includes a general target, principles, applicability, geographic boundaries, as well as specific requirements and supporting measures for establishing ECZs. The plan represents one of the deliverables promised in MOT’s five-year (2015–2020) special action plan to control emissions from ships and ports, released in August 2015. Subsequently, on 1 February 2016, MOT released additional information on the early adoption of the Yangtze River Delta Region ECZ with the Shanghai Municipal Transportation Commission.
This policy update summarizes the specific actions to be implemented in the three key ECZs and compares them to standard emission control areas (ECAs) designated by the International Maritime Organization (IMO).
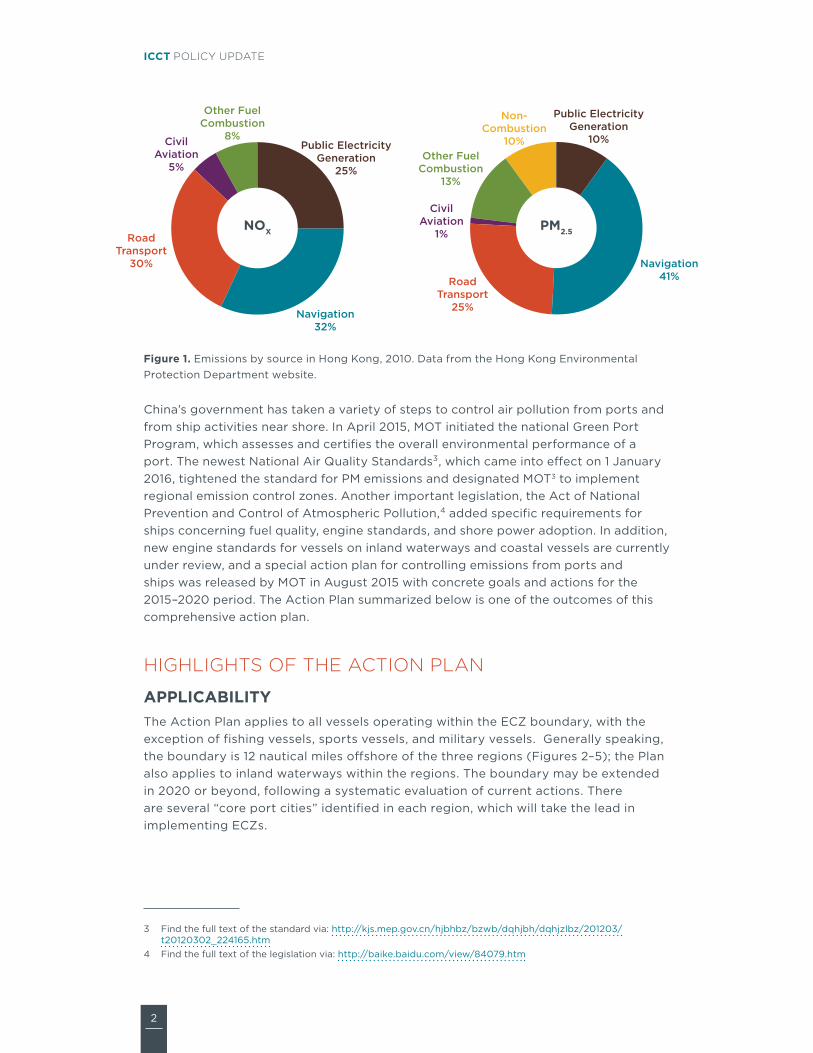
BACKGROUNDThe public health impact of exposure to air pollution in China is significant. According to the World Health Organization’s (WHO) estimate, in 2010 nearly 1.2 million premature deaths in China were attributable to exposure to outdoor air pollution. Shipping ports are a major, and often overlooked, source of air pollution, and seven of the ten busiest ports in the world are located in China. In Hong Kong, with the world’s third busiest port, the shipping industry was the largest source of fine suspended particulates PM2.5 from all sectors in 2010 (Figure 1). It was also the biggest contributor of NOX in that year. In the Yangtze River Delta Region, the world’s busiest port—the Port of Shanghai—contributed 12% of the City of Shanghai’s total emissions of sulfur dioxide (SO2), 9% of nitrogen oxides (NOX), and more than 5% PM2.5 in 2010.2
1 The term “ECZ” here is used to differentiate the domestic emissions control areas with the standard IMO emissions control areas (ECAs).
2 Fu, Q., Shen, Y., & Zhang, J. (2012). On the ship pollutant emission inventory in Shanghai port. Journal of Safety and Environment, 12(5), 57-64.
ACTION PLAN FOR ESTABLISHING SHIP EMISSION
CONTROL ZONES IN CHINA
ICCT POLICY UPDATES
SUMMARIZE
REGULATORY
AND OTHER
DEVELOPMENTS
RELATED TO CLEAN
TRANSPORTATION
WORLDWIDE.
WWW.THEICCT.ORG [email protected] | BEIJING | BERLIN | BRUSSELS | SAN FRANCISCO | WASHINGTON
2
ICCT POLICY UPDATE
Other FuelCombustion
8%Public Electricity
Generation25%
Navigation32%
RoadTransport
30%
CivilAviation
5%
Non-Combustion
10%Other Fuel
Combustion13%
Public ElectricityGeneration
10%
Navigation41%Road
Transport25%
CivilAviation
1%NOX PM2.5
Figure 1. Emissions by source in Hong Kong, 2010. Data from the Hong Kong Environmental Protection Department website.
China’s government has taken a variety of steps to control air pollution from ports and from ship activities near shore. In April 2015, MOT initiated the national Green Port Program, which assesses and certifies the overall environmental performance of a port. The newest National Air Quality Standards3, which came into effect on 1 January 2016, tightened the standard for PM emissions and designated MOT3 to implement regional emission control zones. Another important legislation, the Act of National Prevention and Control of Atmospheric Pollution,4 added specific requirements for ships concerning fuel quality, engine standards, and shore power adoption. In addition, new engine standards for vessels on inland waterways and coastal vessels are currently under review, and a special action plan for controlling emissions from ports and ships was released by MOT in August 2015 with concrete goals and actions for the 2015–2020 period. The Action Plan summarized below is one of the outcomes of this comprehensive action plan.
HIGHLIGHTS OF THE ACTION PLAN
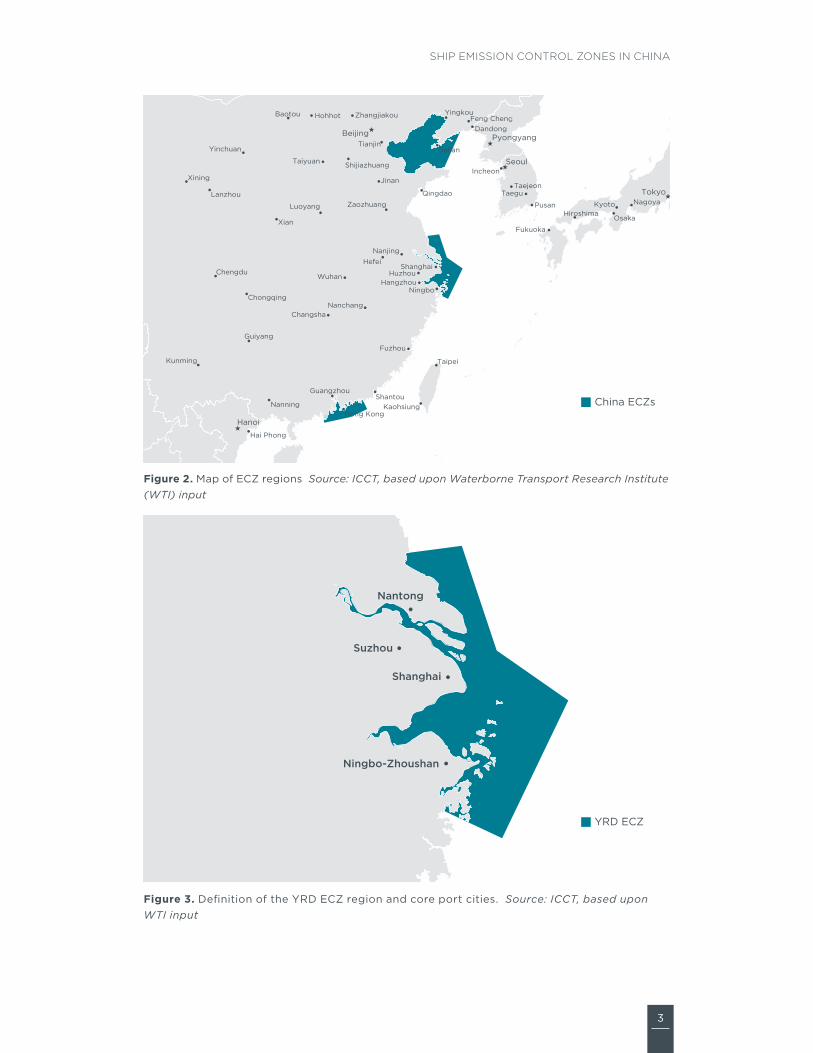
APPLICABILITYThe Action Plan applies to all vessels operating within the ECZ boundary, with the exception of fishing vessels, sports vessels, and military vessels. Generally speaking, the boundary is 12 nautical miles offshore of the three regions (Figures 2–5); the Plan also applies to inland waterways within the regions. The boundary may be extended in 2020 or beyond, following a systematic evaluation of current actions. There are several “core port cities” identified in each region, which will take the lead in implementing ECZs.
3 Find the full text of the standard via: http://kjs.mep.gov.cn/hjbhbz/bzwb/dqhjbh/dqhjzlbz/201203/t20120302_224165.htm
4 Find the full text of the legislation via: http://baike.baidu.com/view/84079.htm
3
SHIP EMISSION CONTROL ZONES IN CHINA
Baotou
Changsha
Chengdu
Chongqing
Dalian
DandongFeng Cheng
Fuzhou
Guangzhou
Guiyang
Kunming
Lanzhou
Nanjing
Nanning
Ningbo
Qingdao
Shanghai
Shantou
Shijiazhuang
Xian
Xining
Yinchuan
Yingkou
Zaozhuang
Zhangjiakou
Fukuoka
Hiroshima
Nagoya
Osaka
Pusan
TaeguTaejeon
Kaohsiung
Taipei
Hai Phong
Hangzhou
Hefei
Hohhot
Huzhou
Jinan
Luoyang
Nanchang
Taiyuan
Tianjin
Wuhan
Kyoto
Incheon
Hong Kong
Pyongyang
Seoul
Beijing
Tokyo
Hanoi
I N A
R
VIETNAM
LAOS
SOUTHKOREA
NORTHKOREA
JAPAN
China ECZs
Figure 2. Map of ECZ regions Source: ICCT, based upon Waterborne Transport Research Institute (WTI) input
Ningbo-Zhoushan
Shanghai
Suzhou
Nantong
YRD ECZ
Figure 3. Definition of the YRD ECZ region and core port cities. Source: ICCT, based upon WTI input
4
ICCT POLICY UPDATE
Guangzhou
Shenzhen
Zhuhai
PRD ECZ
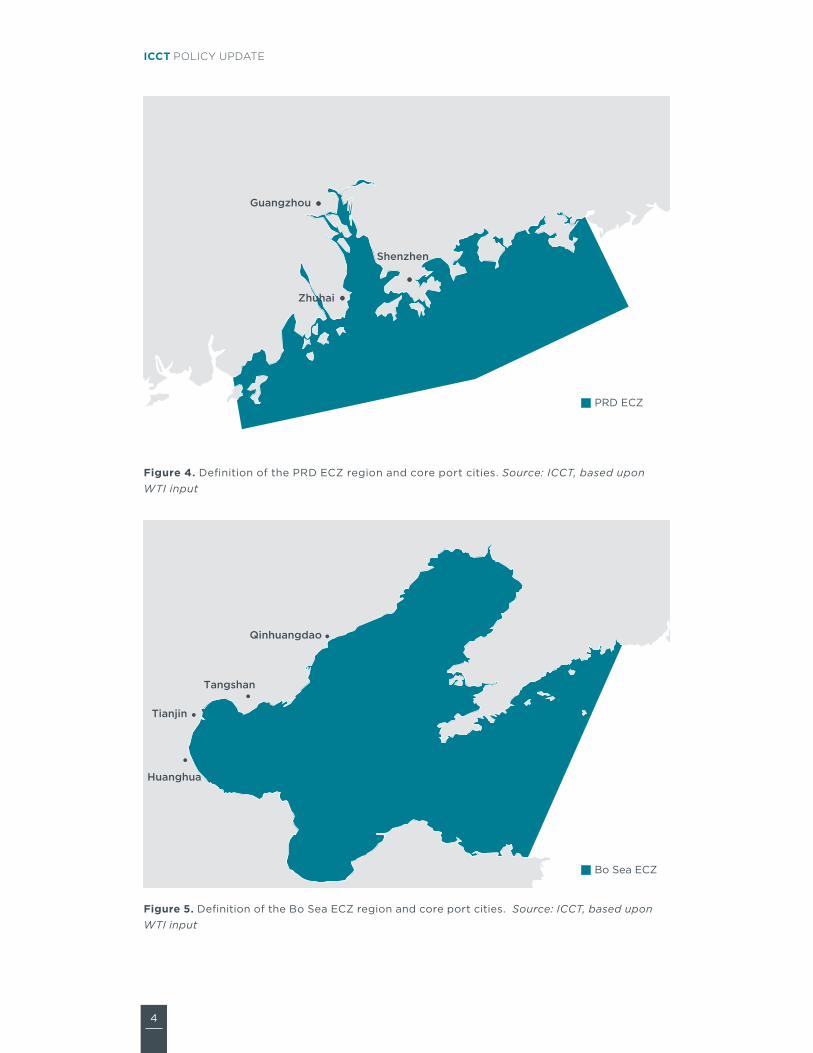
Figure 4. Definition of the PRD ECZ region and core port cities. Source: ICCT, based upon WTI input
Qinhuangdao
Tianjin
Huanghua
Tangshan
Bo Sea ECZ
Figure 5. Definition of the Bo Sea ECZ region and core port cities. Source: ICCT, based upon WTI input
5
SHIP EMISSION CONTROL ZONES IN CHINA
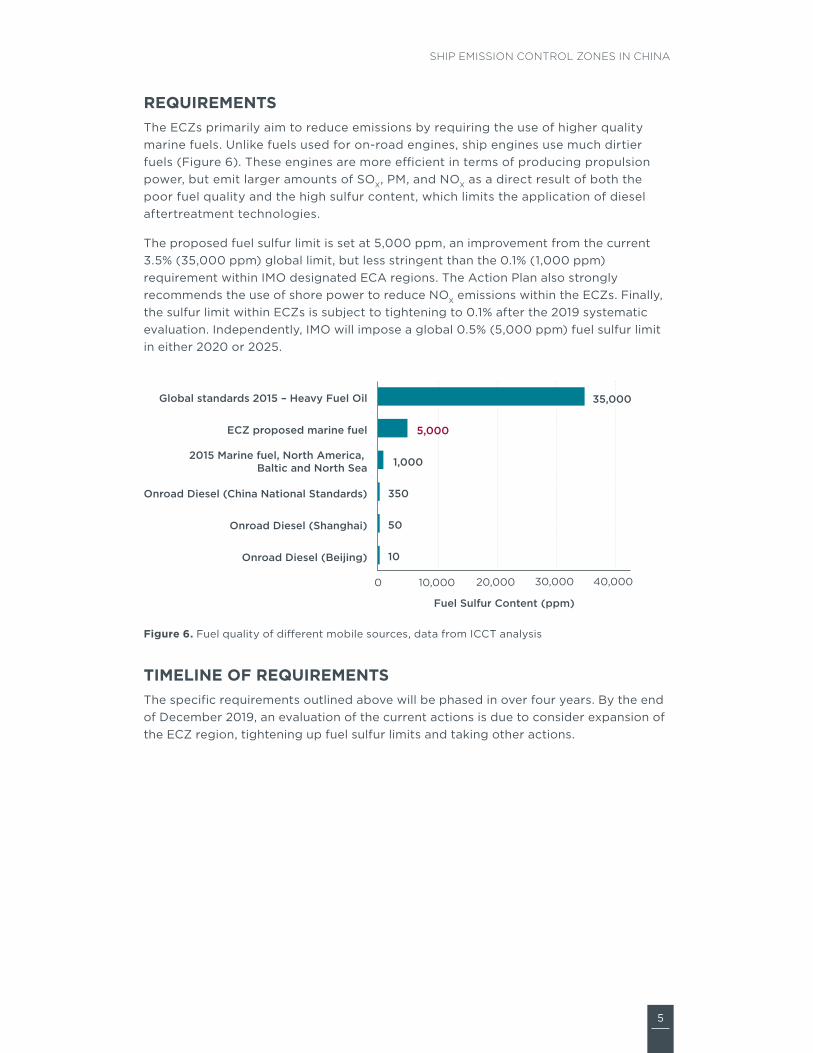
REQUIREMENTSThe ECZs primarily aim to reduce emissions by requiring the use of higher quality marine fuels. Unlike fuels used for on-road engines, ship engines use much dirtier fuels (Figure 6). These engines are more efficient in terms of producing propulsion power, but emit larger amounts of SOX, PM, and NOX as a direct result of both the poor fuel quality and the high sulfur content, which limits the application of diesel aftertreatment technologies.
The proposed fuel sulfur limit is set at 5,000 ppm, an improvement from the current 3.5% (35,000 ppm) global limit, but less stringent than the 0.1% (1,000 ppm) requirement within IMO designated ECA regions. The Action Plan also strongly recommends the use of shore power to reduce NOX emissions within the ECZs. Finally, the sulfur limit within ECZs is subject to tightening to 0.1% after the 2019 systematic evaluation. Independently, IMO will impose a global 0.5% (5,000 ppm) fuel sulfur limit in either 2020 or 2025.
Global standards 2015 – Heavy Fuel Oil
Onroad Diesel (Shanghai)
Onroad Diesel (Beijing)
35,000
5,000
1,000
350
50
10
0 10,000
Fuel Sulfur Content (ppm)
20,000 30,000 40,000
ECZ proposed marine fuel
2015 Marine fuel, North America, Baltic and North Sea
Onroad Diesel (China National Standards)
Figure 6. Fuel quality of different mobile sources, data from ICCT analysis
TIMELINE OF REQUIREMENTSThe specific requirements outlined above will be phased in over four years. By the end of December 2019, an evaluation of the current actions is due to consider expansion of the ECZ region, tightening up fuel sulfur limits and taking other actions.
6
ICCT POLICY UPDATE
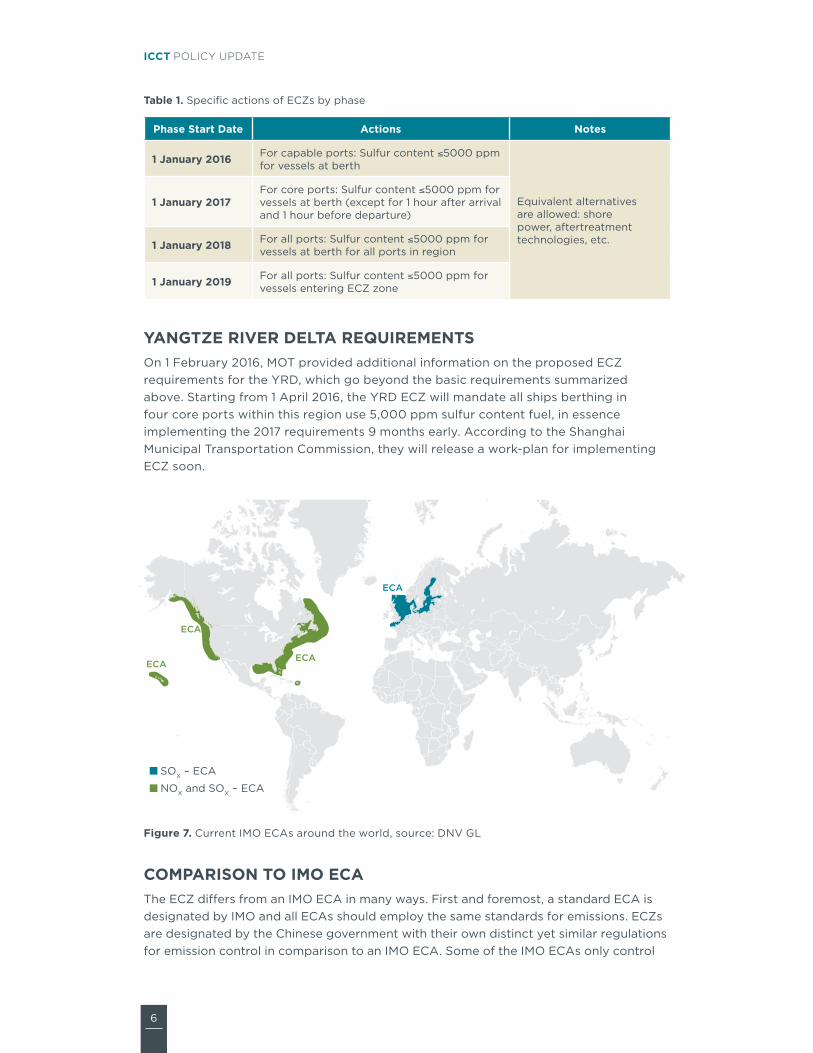
Table 1. Specific actions of ECZs by phase
Phase Start Date Actions Notes
1 January 2016 For capable ports: Sulfur content ≤5000 ppm for vessels at berth
Equivalent alternatives are allowed: shore power, aftertreatment technologies, etc.
1 January 2017For core ports: Sulfur content ≤5000 ppm for vessels at berth (except for 1 hour after arrival and 1 hour before departure)
1 January 2018 For all ports: Sulfur content ≤5000 ppm for vessels at berth for all ports in region
1 January 2019 For all ports: Sulfur content ≤5000 ppm for vessels entering ECZ zone
YANGTZE RIVER DELTA REQUIREMENTS On 1 February 2016, MOT provided additional information on the proposed ECZ requirements for the YRD, which go beyond the basic requirements summarized above. Starting from 1 April 2016, the YRD ECZ will mandate all ships berthing in four core ports within this region use 5,000 ppm sulfur content fuel, in essence implementing the 2017 requirements 9 months early. According to the Shanghai Municipal Transportation Commission, they will release a work-plan for implementing ECZ soon.
ECA
ECA
ECA
ECA
SOX – ECA
NOX and SOX – ECA
Figure 7. Current IMO ECAs around the world, source: DNV GL
COMPARISON TO IMO ECAThe ECZ differs from an IMO ECA in many ways. First and foremost, a standard ECA is designated by IMO and all ECAs should employ the same standards for emissions. ECZs are designated by the Chinese government with their own distinct yet similar regulations for emission control in comparison to an IMO ECA. Some of the IMO ECAs only control
7
SHIP EMISSION CONTROL ZONES IN CHINA
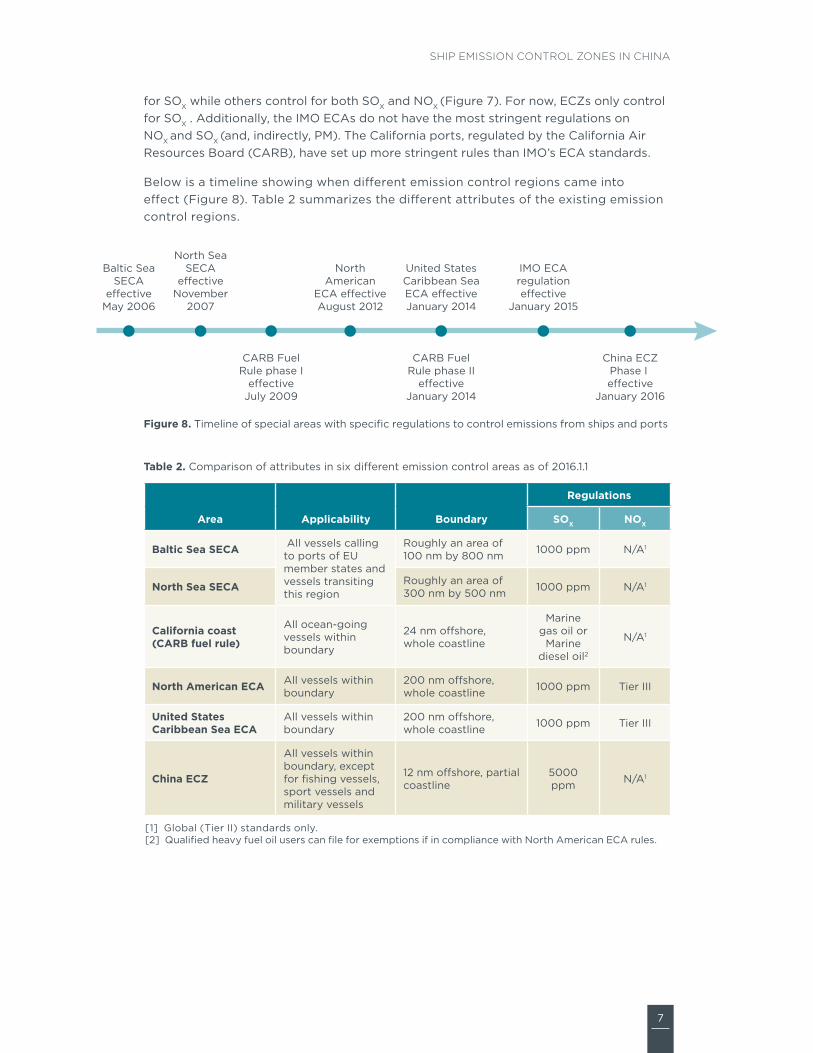
for SOX while others control for both SOX and NOX (Figure 7). For now, ECZs only control for SOX . Additionally, the IMO ECAs do not have the most stringent regulations on NOX and SOX (and, indirectly, PM). The California ports, regulated by the California Air Resources Board (CARB), have set up more stringent rules than IMO’s ECA standards.
Below is a timeline showing when different emission control regions came into effect (Figure 8). Table 2 summarizes the different attributes of the existing emission control regions.
Baltic SeaSECA
e�ectiveMay 2006
North SeaSECA
e�ectiveNovember
2007
CARB FuelRule phase I
e�ectiveJuly 2009
CARB FuelRule phase II
e�ectiveJanuary 2014
NorthAmerican
ECA e�ectiveAugust 2012
United StatesCaribbean SeaECA e�ectiveJanuary 2014
IMO ECAregulatione�ective
January 2015
China ECZPhase I e�ective
January 2016
Figure 8. Timeline of special areas with specific regulations to control emissions from ships and ports
Table 2. Comparison of attributes in six different emission control areas as of 2016.1.1
Area Applicability Boundary
Regulations
SOX NOX
Baltic Sea SECA All vessels calling to ports of EU member states and vessels transiting this region
Roughly an area of 100 nm by 800 nm 1000 ppm N/A1
North Sea SECA Roughly an area of 300 nm by 500 nm 1000 ppm N/A1
California coast (CARB fuel rule)
All ocean-going vessels within boundary
24 nm offshore, whole coastline
Marine gas oil or
Marine diesel oil2
N/A1
North American ECA All vessels within boundary
200 nm offshore, whole coastline 1000 ppm Tier III
United States Caribbean Sea ECA
All vessels within boundary
200 nm offshore, whole coastline 1000 ppm Tier III
China ECZ
All vessels within boundary, except for fishing vessels, sport vessels and military vessels
12 nm offshore, partial coastline
5000 ppm N/A1
[1] Global (Tier II) standards only.[2] Qualified heavy fuel oil users can file for exemptions if in compliance with North American ECA rules.
8
ICCT POLICY UPDATE
POTENTIAL IMPACTSAccording to the Shanghai Municipal Transportation Commission, Phase I fuel regulation in ECZs (5,000 ppm sulfur content fuel for ships at berth) will contribute to a 10% reduction in primary PM2.5 and an 18% reduction in SOX from marine vessels. Phase II fuel regulation in ECZs (5,000 ppm sulfur content fuel for ships entering ECZ regions) will reduce PM2.5 emissions from oceangoing vessels by about 60% and 80% respectively for SOX.
According to the MOT, by 2020, SOX and PM emissions from ships in three ECZ regions would be reduced by 65% and 30% respectively in comparison to 2015.