Embed Size (px)
Citation preview

Action PlanFall 2017
Draft 2- Nov 2017Source: m01229
ii
AcknowledgmentsCity of Alexandria Staff
Hillary Orr Special Assistant to the City Manager
Christopher ZiemannTransportation Planning Division Chief,
Transportation & Environmental Services(T&ES)
David SoaresTraffic Engineer V, T&ES
Raymond Hayhurst Complete Streets Program Manager,
T&ESYon LambertDirector, T&ESEmily Molfino
Performance Analyst, Office of Performance and Accountability
Consultant Team
Prime Consultant: Nspiregreen LLC
Sub-Consultant: Toole Design Group

1
Table of ContentsAn All-Hands-on-Deck Commitment
Executive Summary1 - Efforts Toward Vision Zero
2 - Building the Action Plan3 - The Path to Zero
Strategies and Action ItemsNeeds to Achieve Zero
Measuring SuccessResident Commitment
4 - Call to ActionAppendices
29131939
6169

2

3
Vision Zero is a traffic safety policy that takes an ethics-based approach to achieving safety for all modes of transportation on a jurisdiction’s roads with the understanding that transportation systems affect human life and that no traffic-related loss of life is acceptable. The goal of all Vision Zero initiatives is to design strategies based on data, engineering, enforcement, and education ultimately to get to zero traffic deaths and serious injuries.
Vision Zero is an ambitious goal for any city or jurisdiction to undertake. It involves a commitment to an approach to safety that is based on data collection. This action plan and its contents serve as The City of Alexandria’s (the City or Alexandria) commitment to building a safer city where human life and safety is valued above all else. With this plan, we acknowledge that we all have a role in the safety of our transportation system as the government, policy and decision-makers, residents, visitors, and employees traveling within the City both through our individual actions and in looking out for one another on the roads. The goal of zero deaths and serious injuries by 2028 has been set and, with this plan, the City can achieve it.
A L E X A N D R I A ’ SC O M M I T M E N T

4
This document is the plan for the City of Alexandria to achieve zero traffic-related fatalities and serious injuries by 2028. As your elected leaders, we take this commitment very seriously. We are proud to represent the Alexandria community as we undertake this shift in our thinking about transportation safety and achieving Vision Zero. However, this commitment is not ours alone to make; we encourage you ALL to take the pledge with us. Together, we can get to zero.
CITY COUNCIL PLEDGE

5
MESSAGE FROM THE CITY MANAGERThis document is the plan for the City of Alexandria to achieve zero traffic related fatalities and serious injuries by 2028. You will see that our departmental leadership has all signed onto this initiative and are committed to doing their part to achieve this goal. As your government, we take this commitment very seriously. I am proud to help lead the City of Alexandria as we undertake this shift in our thinking about how we behave on our streets and get to zero. This commitment to traffic safety, however, is not ours alone to make.
We need you, our residents, employees, visitors, business owners, and community groups to do your part to make the roadways safer. At the end of this action plan, there is an individual pledge that outlines what each of us can do in our daily lives to make our streets safer. I encourage all of you to join me in taking the Vision Zero pledge and live by it as we make traffic safety a top priority. Together, we can get to zero.
Mark Jinks, City Manager

6
DEPARTMENTAL COMMITMENTMultiple City departments collaborated to build this Action Plan, devoting staff time, policies, and program focus to achieve the important Vision Zero initiative.
Yon LambertDirector,
Department of Transportation &
Environmental Services
Dr. Steven HaeringMD MPH, Director, Alexandria Health
Department
Greg UseemChief Performance
Officer,Office of Performance
and Accountability
James L. Banks Jr. Alexandria City
Attorney
Vanetta Pledger Chief Information Officer
Department of Information and
Technology Services
Michael L. BrownChief,
Alexandria Police Department

7
Josh BakerGeneral Manager and
CEO, ATC DASH Bus System
Karl W. MoritzDirector,
Department of Planning and Zoning
Robert Dubé Chief,
Alexandria Fire Department
Jean KelleherDirector,
Office of Human Rights
Dr. Lois BerlinSuperintendent
Alexandria City Public Schools
Jeremy McPikePMP, LEED AP
DirectorDepartment of
General Services
Jim SpenglerDirector
Department of Recreation, Parks, and
Cultural Activities
Mitchell BernsteinDirector
Department of Project Implementation

8Source: Evan Michio Cantwell

Executive Summary

10
VISION ZERO
IWG
Commonwealth Attorney’s
OfficeOffice ofHuman Rights
Planning and Zoning
DASH (Alexandria
Transit Company)
Office of
Communications and Public Information
Geographical Information
Services
Office of Performance
and Accountability Health
Department
Recreation, Parks and Cultural
Activities
Alexandria City Public Schools
Alexandria Fire
Department
General Services
Transportation and
Environmental Services
Alexandria Police
Department
CityManager’s
Office
EXECUTIVE SUMMARY
InterdepartmentalWork Group
Data Analysis
Best Practices
Public Input
Alexandria’s
Vision ZeroStrategies
THE PROCESS
The City used a four-part process to build the action plan: data analysis, public involvement, evaluating best practices, and an interdepartmental working group.
THE WORK GROUP
PUBLIC INPUTOver 1,000 residents, visitors, employees, and business owners participated in the Vision Zero Action Plan process.
TOP 3 CONCERNS REPORTED
Distracted Driving
People running red lights or stop signsSpeeding
THE PUBLIC GAVE NEARLY
700 COMMENTS ON AN INTERACTIVE SAFETY MAP.
THE GOAL
Vision Zero is a data driven, all-hands-on-deck approach to eliminate ALL traffic deaths and serious injuries. The City of Alexandria's goal is to achieve Vision Zero by 2028 through better data, education, enforcement, and engineering.
TRAFFIC DEATHS AND SERIOUS INJURIES BY 2028
The City created an interdepartmental working group (IWG) to best coordinate planning efforts, identify current programs, assess the feasibility of best practices, and to determine action items. This group met multiple times throughout the process. In order to implement the action items outlined in this plan, the IWG will continue working in groups: Data, Enforcement, Engineering, Education and Communications, Legislation & Policy.
TRAFFIC DEATHS AND SERIOUS INJURIES BY 2028

KING
DUKE
QU
AKER
EISENHOWER
VAN
DO
RN
HEN
RY
BEAUREGARD
MO
UN
T VERN
ON
EDSALL
PATR
ICK
SEMINARY
TELE
GRAP
H
WAS
HIN
GTO
N
MENOKIN
BRADDOCK
RICHMOND
KING
PATR
ICK
RO
UTE 1
HEN
RY
CAPITAL BELTWAY
CAPITAL BELTWAY
HENRY G SHIR
LEY M
EMORIAL
GLEBE
KING
MILL
PICKETT
POTO
MAC
BRADDOCK
WES
T
JANNEY'S
MONROE
WYTHE
WHEELER
MADISON
PENDLETON
FAIR
FAX
JOR
DAN
HO
WA
RD
STEVENSON
MONTGOMERY
HAM
PTO
N
KENMORE
CALLAHAN
RU
SSEL
L
DAINGERFIELD
LINCOLNIA THIRD
DUKE
CLERMONT
QUA
KER
METRO
BRENMAN PARK
TELEGRAPH
DUKE
CLERMONT
KING
RU
SSELL
VALLEY
FAIR
FAXPRINCE
REED
DAWES
DUKE
PEG
RAM
SANGER
JOR
DA
N
WINDSORMORGAN
HOW
ARD
CH
AMBL
ISS
KEN
WO
OD
HIGH
SUMMIT
ORONOCO
WHITING
RAYMOND
HOLMES RUN
FORD
TAYLOR
RU
N
REYNOLDS
FOR
T WILLIAM
S
FRANKLIN
TANEY
FILLMOREPRESTON
GUNSTON
POW
HATAN
LAN
DO
VER
CR
EST
CAM
ERO
N M
ILLS
KENNED
Y
OLD DOMINION
COLUMBUS
PICKETT
FERN
WINDSOR
PICKETT
CO
LUM
BUS
OLD D
OMINIO
N
HOLMES RUN
TANEY
GEO
RG
E W
ASH
ING
TON
MEM
OR
IAL
THE DATA
THE PATH FORWARD
THE STRATEGIESTo support the Vision Zero planning effort, the Alexandria Office of Performance and Accountability conducted an analysis of crash data provided by the Alexandria Police Department.
ONLY 6% OF CRASHES INVOLVE BICYCLISTS OR PEDESTRIANS
BUT 34% OF ALL SERIOUS CRASHES INVOLVE BICYCLISTS
OR PEDESTRIANS
BICYCLE VEHICLE ONLYPEDESTRIAN
TOTAL CRASHES
SERIOUS INJURY OR FATAL CRASHES
8%
SERIOUS INJURY OR DEATH IN A CRASH INVOLVING A...
under 20 MPH
VULNERABLE ROAD USERS
SPEED MATTERS
HIGHER RATE OF
14%
13% 2%
1%94%
5%
66%29%
5%
20-29 MPH
18%30-39 MPH
35%40 or more MPH
100%...pedestrians were seriously injured or did not survive the crash.
When vehicles hit pedestrians while traveling at speeds of...
Note: Total KSI crashes for each mode are: Pedestrian (64), Bicycle (10), and Vehicle Only (146).
The interdepartmental group worked to develop the following guiding principles and strategies:
PROMOTE A CULTURE OF SAFETY• Craft a successful public education campaign to inform the public of Vision Zero
and Topic Areas• Strengthen traffic safety enforcement policies and practices• Create a network of Vision Zero partnerships • Encourage city staff to incorporate Vision Zero into everyday practices• Inform the public of Vision Zero efforts
BUILD SAFE STREETS FOR EVERYONE • Develop and implement infrastructure policies to reduce KSIs• Improve prioritization of safety treatments to inform implementation
IMPROVE DATA COLLECTION AND EVALUATION• Enhance data collection and coordination efforts• Make information easily available to the public• Evaluate success of existing and planned programs to determine best way to
allocate resources for change
ENHANCE CITY PROCESSES AND COLLABORATION• Evaluate City policy and administrative guidelines to improve safety outcomes• Support and encourage statewide legislative efforts to implement stricter traffic
safety laws
FUNDINGCOMMUNITY SUPPORT
REGIONAL SUPPORT
STATESUPPORT
The City needs everyone to take part in achieving Vision Zero through individual pledges and looking out for each other on the road.
Funding for Vision Zero needs to come from existing budgets, grants, as well as regional, state, and federal sources.
A regional commitment to Vision Zero will be crucial to our individual jurisdictional successes.
We need state support to amend our plans, policies, and laws to align with Vision Zero principles.
11
HIGH INJURY NETWORKThe City
identified six high-injury
corridors for serious or fatal
crashes.
PEDESTRIAN CRASHES ARE ON THE RISE...People walking or biking have a higher chance of serious injury or fatalities when involved in crashes as shown in the graphic below. These and other vulnerable users are a safety priority in Vision Zero.
CHANCE OF SERIOUS INJURY OR FATALITY BY
MODE DURING A CRASH


1Efforts Toward Vision
Zero

14
EFFORTS TOWARD VISION ZEROFor the City of Alexandria, Vision Zero is not a new concept– its underlying intent has long been part of the way the City thinks about and designs roadways to improve safety. In the past, the City departments have focused on safety efforts individually or through partnerships. The City Council's adoption of the Vision Zero Policy, however, presented the opportunity to work collaboratively across departments to consider traffic safety through different lenses that will ultimately improve livability, walkability, and public health. Vision Zero in Alexandria prioritizes safety and uses a people-first approach to eliminate deaths and serious injuries for people using the City’s transportation network.
WHAT IS VISION ZERO?The concept of Vision Zero started in the late 1990s in Sweden. It is a traffic safety policy that takes an ethics-based approach to achieving safety for all modes of transport on a jurisdiction’s roads with the understanding that transportation systems affect human life and that no traffic-related loss of life is acceptable. Through its effort toward Vision Zero, Sweden has cut its traffic deaths in half and is one of the safest countries in the world when it comes to transportation safety. The goal of all Vision Zero initiatives is to design strategies based on data, engineering, enforcement, and education ultimately to get to zero traffic deaths and serious injuries.
Vision Zero carries with it five fundamental beliefs:
• Traffic deaths and severe injuries are acknowledged to be preventable.
• Human life and health are prioritized within all aspects of transportation systems.
• Acknowledgment that human error is inevitable, and transportation systems should be forgiving.
• Safety work should focus on systems-level changes above influencing individual behavior.
• Speed is recognized and prioritized as the fundamental factor in crash severity.1
In 2015, 35,092 people lost their lives in the U.S. due to traffic related crashes.2 That is a 7.2 percent increase from 2014, the largest percent increase in nearly 50 years.1 Vision Zero Network. Moving from Vision to Action: Fundamental Principles, Policies & Practices to Ad-vance Vision Zero in the US (Feb 2017)
2 National Highway Transportation Safety Adminis-tration, 2015 Motor Vehicle Crashes: Overview, August 2016
1Source: Boys and Girls Club
15
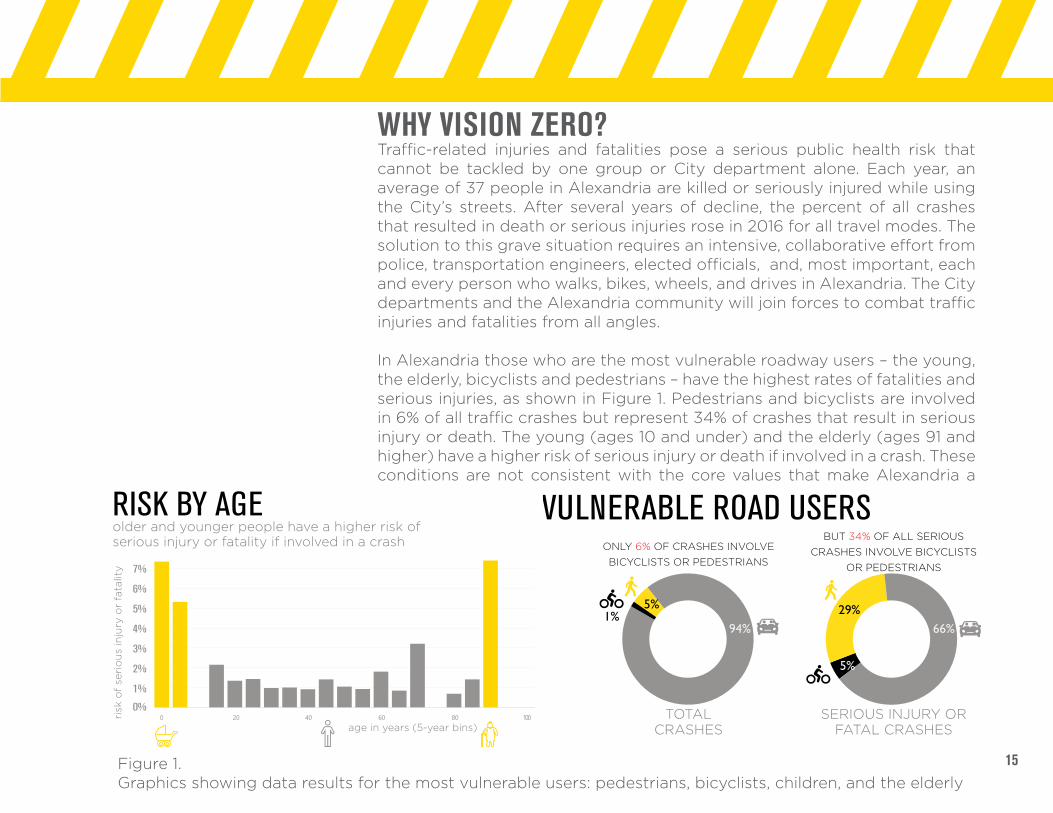
WHY VISION ZERO? Traffic-related injuries and fatalities pose a serious public health risk that cannot be tackled by one group or City department alone. Each year, an average of 37 people in Alexandria are killed or seriously injured while using the City’s streets. After several years of decline, the percent of all crashes that resulted in death or serious injuries rose in 2016 for all travel modes. The solution to this grave situation requires an intensive, collaborative effort from police, transportation engineers, elected officials, and, most important, each and every person who walks, bikes, wheels, and drives in Alexandria. The City departments and the Alexandria community will join forces to combat traffic injuries and fatalities from all angles.
In Alexandria those who are the most vulnerable roadway users – the young, the elderly, bicyclists and pedestrians – have the highest rates of fatalities and serious injuries, as shown in Figure 1. Pedestrians and bicyclists are involved in 6% of all traffic crashes but represent 34% of crashes that result in serious injury or death. The young (ages 10 and under) and the elderly (ages 91 and higher) have a higher risk of serious injury or death if involved in a crash. These conditions are not consistent with the core values that make Alexandria a
ONLY 6% OF CRASHES INVOLVE BICYCLISTS OR PEDESTRIANS
BUT 34% OF ALL SERIOUS CRASHES INVOLVE BICYCLISTS
OR PEDESTRIANS
BICYCLE VEHICLE ONLYPEDESTRIAN
TOTAL CRASHES
SERIOUS INJURY OR FATAL CRASHES
8%
SERIOUS INJURY OR DEATH IN A CRASH INVOLVING A...
under 20 MPH
VULNERABLE ROAD USERS
SPEED MATTERS
HIGHER RATE OF
14%
13% 2%
1%94%
5%
66%29%
5%
20-29 MPH
18%30-39 MPH
35%40 or more MPH
100%...pedestrians were seriously injured or did not survive the crash.
When vehicles hit pedestrians while traveling at speeds of...
Note: Total KSI crashes for each mode are: Pedestrian (64), Bicycle (10), and Vehicle Only (146).
WEATHER
HIGH RISK CONDITIONS
older and younger people have a higher risk of serious injury or fatality if involved in a crash
SPEEDING
19%of fatal or serious injury pedestrian crashes and 14% of all pedestrian crashes
13%of fatal or serious injury vehicle only crashes
6%of fatal or serious injury vehicle only crashes
13%of fatal or serious injury vehicle only crashes
POOR LIGHTING
MOTORCYCLEINVOLVED
NOT WEARING A SEATBELT
8%of fatal or serious injury vehicle only crashes
15%of fatal or serious injury pedestrian crashes
DRINKING
16%of fatal or serious injury vehicle only crashes
4%of fatal or serious injury pedestrian crashes
11%of fatal or serious injury bicycle crashes
17%of all fatal or serious injury crashes
1%
0%
2%
3%
4%
5%
6%
7%
RISK BY AGE
age in years (5-year bins)
risk
of
seri
ou
s in
jury
or
fata
lity
Note: Conditions that have high rates of KSI crashes were selected as High Risk Conditions
Figure 1. Graphics showing data results for the most vulnerable users: pedestrians, bicyclists, children, and the elderly

16
great city where people of all ages and backgrounds can safely live, work, and visit.
Traffic crash data reveals a critical finding in Alexandria and around the world: speed matters. As seen in the Figure 2, below, vehicle speed plays a significant role in the severity of crashes, particularly for vulnerable road uses like pedestrians. The City will re-evaluate how we design roadways, increase education and communication efforts, and target equitable enforcement efforts that focus on dangerous behaviors to help make Alexandria a safer place to drive, walk, wheel, bike, and live.
Motivated by these trends and alongside cities around the world that have adopted Vision Zero, Alexandria has set an ambitious goal to achieve zero deaths and serious injuries from traffic related crashes by 2028. Increasing the safety of our streets will not only save lives and prevent life-long injuries, but it will make the streets more appealing places to engage in physical activity, walk or ride a bike, and contribute to a dynamic and inviting environment for everyone to share. As a community, we must come together to recognize that the routine loss of life and serious injuries due to traffic related crashes are not acceptable in Alexandria.
ONLY 6% OF CRASHES INVOLVE BICYCLISTS OR PEDESTRIANS
BUT 34% OF ALL SERIOUS CRASHES INVOLVE BICYCLISTS
OR PEDESTRIANS
BICYCLE VEHICLE ONLYPEDESTRIAN
TOTAL CRASHES
SERIOUS INJURY OR FATAL CRASHES
8%
SERIOUS INJURY OR DEATH IN A CRASH INVOLVING A...
under 20 MPH
VULNERABLE ROAD USERS
SPEED MATTERS
HIGHER RATE OF
14%
13% 2%
1%94%
5%
66%29%
5%
20-29 MPH
18%30-39 MPH
35%40 or more MPH
100%...pedestrians were seriously injured or did not survive the crash.
When vehicles hit pedestrians while traveling at speeds of...
Note: Total KSI crashes for each mode are: Pedestrian (64), Bicycle (10), and Vehicle Only (146).
1Figure 2. Graphic showing the rate of survival of pedestrians based on crashes in Alexandria at different speed levels.

17
This plan presents the City’s strategy for reaching its goal of zero traffic fatalities and serious injuries by 2028. Many City departments are joining forces to coordinate existing and new programs focused on safety. At the same time, this plan represents a Call to Action for everyone who travels in and through Alexandria. By recognizing that crashes are preventable and cannot be viewed as a price to pay for mobility, we can work together to create a safer and better Alexandria for current and future generations.
FOCUS ON TRAFFIC SAFETYAn intensive focus on traffic safe-ty is not a new concept in Alexandria. The City has prioritized traf-fic safety in many of its planning, engineering, and police-led pro-grams for decades. Traffic safety is a paramount consideration in all roadway design decisions and is at the heart of the everyday work of the Alexandria Po-lice Department. A few recent City-led initiatives related to traffic safety are shown in the graphic below.
Figure 3. Timeline of key traffic safety policies, programs, and plans that have increased the focus on traffic safety
2008 2011 20142013 2015 2016 2017
The City adopts its Transportation Master Plan, which emphasizes safety in each of
the chapters on Transit, Pedestrian, Bicycle, Streets and Parking.
Alexandria adopts a Complete Streets Policy, which states that every street project
shall incorporate, to the extent possible, Complete Streets infrastructure to enable
reasonably safe travel along and across the right-of-way for each category of user.
Alexandria hires its first Complete StreetsCoordinator and develops the Complete
Streets Program.
City hosts kickoff event for Street Smart initiative, a regional public education, awareness, and behavioral change
campaign to improve safety for pedestrians and bicyclists.
Alexandria City Council adopts a Vision Zero resolution and, soon after, an
Interdepartmental Working Group began developing this Action Plan.
The Alexandria Police Departmentdevelops a new Traffic Safety Plan.
The Complete Streets Policy was reenacted and Complete Streets program was established to implement the policy.
The City updates its Pedestrian and Bicycle Master Plan, which includes a strategy to launch
a Vision Zero program.

18
CRASHES A R E N O TACCIDENTS
CRASHES A R E N O TACCIDENTS
An average of 37 people in Alexandria are killed or seriously injured each year using the City’s streets. These people are friends and neighbors, husbands, wives, coworkers, children, and grandparents.
The Vision Zero initiative calls collisions “crashes” rather than “accidents” because traffic deaths and serious injuries are preventable.
18

2Building
an Action
Plan
2020
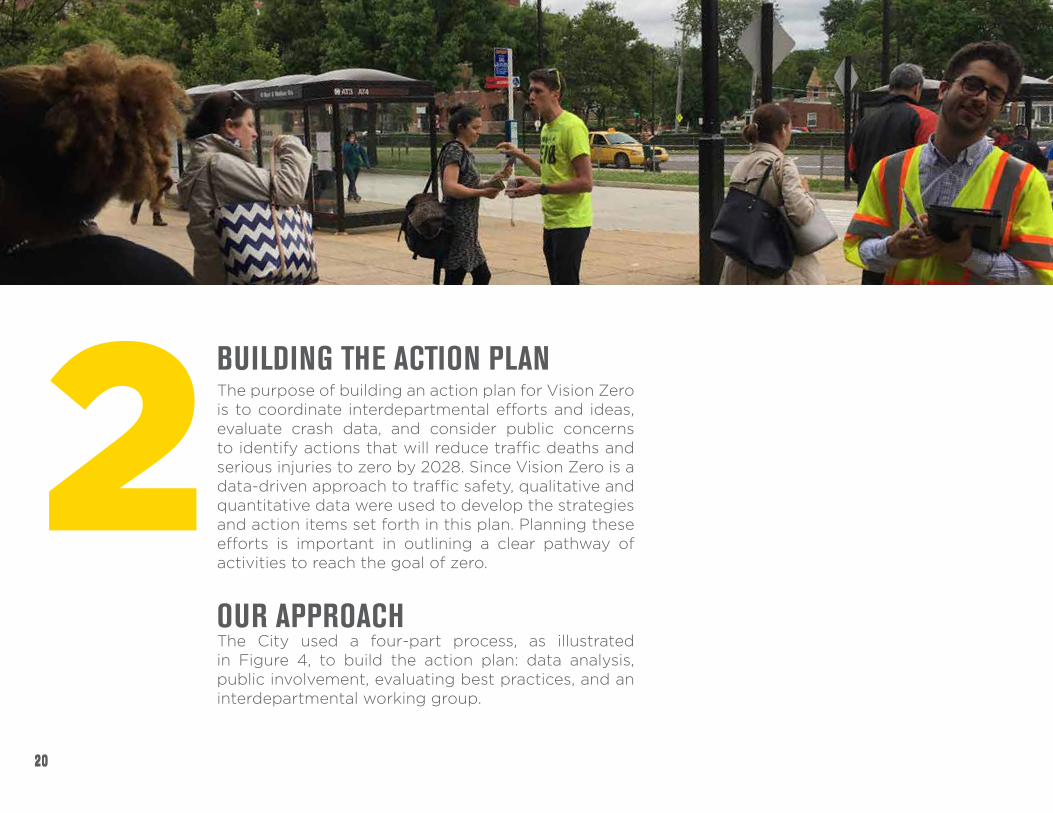
BUILDING THE ACTION PLANThe purpose of building an action plan for Vision Zero is to coordinate interdepartmental efforts and ideas, evaluate crash data, and consider public concerns to identify actions that will reduce traffic deaths and serious injuries to zero by 2028. Since Vision Zero is a data-driven approach to traffic safety, qualitative and quantitative data were used to develop the strategies and action items set forth in this plan. Planning these efforts is important in outlining a clear pathway of activities to reach the goal of zero.
OUR APPROACHThe City used a four-part process, as illustrated in Figure 4, to build the action plan: data analysis, public involvement, evaluating best practices, and an interdepartmental working group.
2

21
Vision Zero is a data-driven process and to be true to this, the Office of Performance and Accountability (OPA) used state crash data to evaluate crashes. These crashes were analyzed for crash types, severity, locations, modes, and environmental conditions that may have influenced the incident and severity. To engage the public, the City held in-person events on the streets of Alexandria to gather feedback on residents' top safety concerns and experience with crashes in the City. In addition, the City hosted an interactive map on Alexandria’s Vision Zero website to gather location-specific concerns from the public. Best practices were gleaned from many U.S cities that have been implementing Vision Zero initiatives over the last two decades. The Vision Zero team evaluated other jurisdictions' action plans and implementation reports to determine which strategies had been successful and were applicable to the City of Alexandria. The City created an interdepartmental working group to coordinate planning efforts, identify active programs, develop new strategies, and determine the feasibility of best practices.
InterdepartmentalWork Group
Data Analysis
Best Practices
Public Input
Alexandria’s
Vision ZeroStrategies
Figure 4. Process to develop Alexandria's Vision Zero Action Plan

22
PLANNING OUR ACTIONSThe data analysis, public involvement, evaluation of best practices, and interdepartmental working group were all key parts of building the action plan. Each element contributed valuable information to the development of the action plan and the final strategies.
INTERDEPARTMENTAL WORK GROUPFifteen departments in the City joined forces to chart a strategy for reaching Vision Zero. The Interdepartmental Work Group (IWG) includes the City departments shown on the right. Each of these departments oversee a diverse portfolio of programs and initiatives that serve the public in some form, and many of these programs relate to traffic safety, transportation, or public awareness about health and safety topics. The IWG was formed to create unilateral alignment and coordination across all facets of City government in support of Vision Zero.
2VISION ZERO
IWG
Commonwealth Attorney’s
OfficeOffice ofHuman Rights
Planning and Zoning
DASH (Alexandria
Transit Company)
Office of
Communications and Public Information
Geographical Information
Services
Office of Performance
and Accountability Health
Department
Recreation, Parks and Cultural
Activities
Alexandria City Public Schools
Alexandria Fire
Department
General Services
Transportation and
Environmental Services
Alexandria Police
Department
CityManager’s
Office
Figure 5. List of Departments
involved in the IWG

23
From April to November 2017, the IWG met to review national best practices, discuss existing traffic safety programs in Alexandria, review trends from crash data, and develop the strategies presented in this plan. Each of these departments, alongside additional community partners, have made a commitment to do their part to achieve Vision Zero. Upon adoption of the plan and during implementation, the IWG will continue to work in smaller, focused groups: Data, Enforcement, Engineering, Education and Communications, Legislation & Policy.
DATA ANALYSISTo support the Vision Zero planning effort, the Alexandria Office of Performance Accountability (OPA) conducted an analysis of traffic data provided by the Alexandria Police Department (APD) from the Traffic Records Electronic Data System (TREDS)1. The analysis only includes crash reports from the APD, meaning that crashes where State agencies responded (such as on an interstates) or minor collisions that did not involve a police report were not recorded. The collision data provided were for crashes occurring from 2011 to 2016 with a reported injury, or a minimum of $1,500 in damage. OPA staff mapped the locations of crashes to provide further context regarding traffic infrastructure and traffic volume. To support the Vision Zero planning effort, OPA conducted an in depth analysis into the high-risk conditions and situations leading to serious crashes in
1 www.treds.virginia.gov/Mapping/Map/CrashesByJurisdiction
To view the full OPA data analysis
CLICK HERE
Figure 6. IWG Meeting

24
Alexandria. The consultant team highlighted the data trends that are presented in this Action Plan about the state of the problem regarding serious crashes.
Key variables were reviewed and analyzed to determine factors that contribute to serious injury and fatal crashes.
VARIABLES NOTESNumber of crashes over time Total number of crashes
Geographic location of crashes
Data includes latitudinal and longitudinal coordinates that can be used to identify corridors or roads that have higher rates of crashes
Environmental location of crashes
This variable includes conditions such as weather, lighting, and roadway con-ditions
Speeding Whether the speed of the vehicle involved in the crash was reported exceed-ing the posted speed limit (This variable includes the posted speed limit and estimated speed the vehicle was traveling at the time of the crash)
Infrastructure conditions This variable relates to traffic control devices, including traffic signals, marked lanes, no traffic control, stop or yield signs
Pedestrian and vehicle action
Crashes involving pedestrian had associated actions such as crossing with signal, crossing within a crosswalk, and crossing intersections without a traf-fic signal Recorded vehicle movements such as motorists making a left turn, a right turn, or going straight at the time of the crash
Primary event This variable describes the primary type of crash (Crash events include angle, rear end, sideswipe, and pedestrian- or motorcycle-involved)
Vehicle maneuvers Vehicle maneuvers such as making a left turn, going straight, making right turns, and stopping in a traffic lane were recorded for vehicle involved in a crash
Age The age of people involved in the reported crash
Personal choices This variable includes whether a person was wearing a seat belt and if a per-son was under the influence of alcohol
2

25
The variables listed above were analyzed using the following definitions:
• PEDESTRIAN INVOLVED CRASHES: Crashes that involved at least one pedestrian.
• BICYCLE INVOLVED CRASHES: Although the police crash report form doesn’t include a specific box for whether a bicyclist was involvement in a crash, APD reviewed additional crash narratives to identify all crashes during this period involving a bicycle.
• VEHICLE ONLY CRASHES: Crashes that are not classified as either pedestrian involved or bicycle-involved crashes.
The analysis was limited due to data availability and quality. Data quality depends on how uniformly crash reports are completed by the responding officer. Inconsistent spelling of street names, misspellings, or fields that are not filled out can lead to diminished quality or missing data. Also, some information included in crash records can be subjective and may contribute to data inconsistencies. For example, for environmental conditions the officer can only enter one condition; if there are compounding conditions, such as poor lighting, poor road conditions, and rain, only one of those conditions may be noted, leading to the other factors not being recorded. Missing data and errors may also occur during the data entry
26
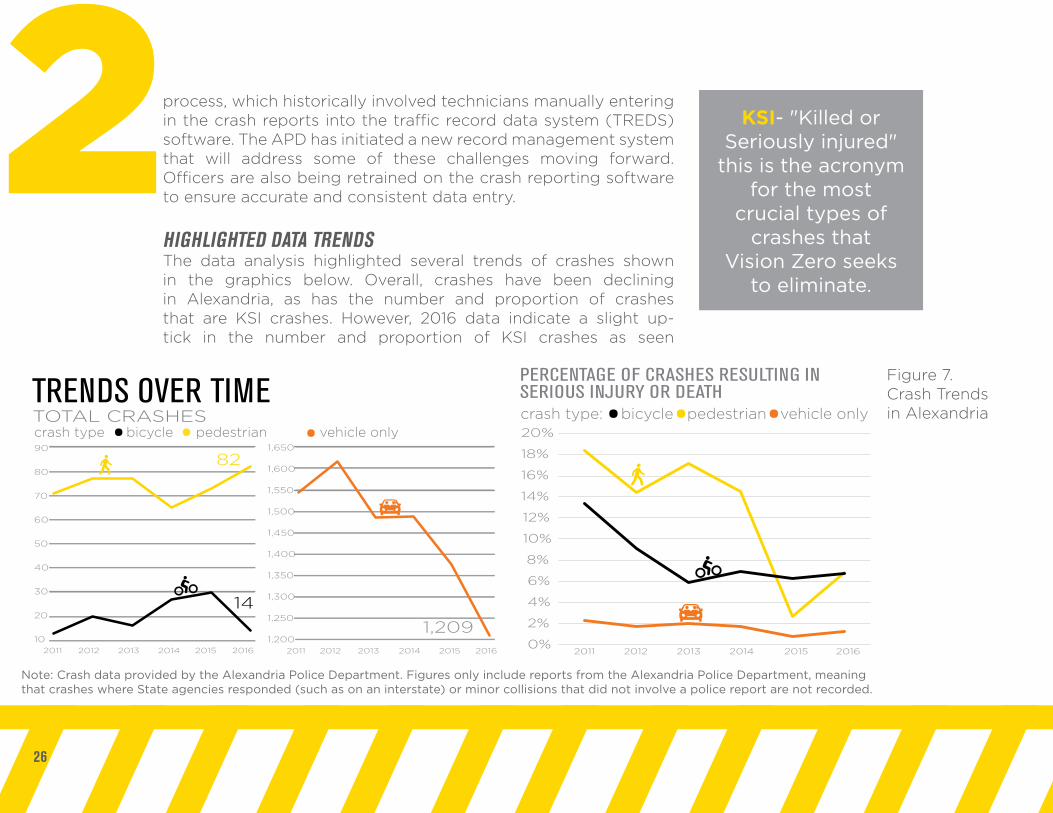
2process, which historically involved technicians manually entering in the crash reports into the traffic record data system (TREDS) software. The APD has initiated a new record management system that will address some of these challenges moving forward. Officers are also being retrained on the crash reporting software to ensure accurate and consistent data entry.
HIGHLIGHTED DATA TRENDSThe data analysis highlighted several trends of crashes shown in the graphics below. Overall, crashes have been declining in Alexandria, as has the number and proportion of crashes that are KSI crashes. However, 2016 data indicate a slight up-tick in the number and proportion of KSI crashes as seen
crash type bicycle pedestrian vehicle only
crash type: bicycle pedestrian vehicle only
2011 2012 2013 2014 2015 2016
90
80
70
60
50
40
30
20
10
1,650
1,600
1,550
1,500
1,450
1,400
1,350
1,300
1,250
1,200
20110%
2%
4%
6%
8%
10%
12%
18%
20%
16%
14%
2012 2013 2014 2015 2016
TOTAL CRASHES
82
1,20914
PERCENTAGE OF CRASHES RESULTING IN SERIOUS INJURY OR DEATH
TRENDS OVER TIME
2011 2012 2013 2014 2015 2016
Note: Crash data provided by the Alexandria Police Department. Figures only includes reports from the Alexandria Police Department, meaning that crashes where State agencies responded (such as on an interstate) or minor collisions that did not involve a police report are not recorded.
Note: Crash data provided by the Alexandria Police Department. Figures only includes reports from the Alexandria Police Department, meaning that crashes where State agencies responded (such as on an interstate) or minor collisions that did not involve a police report are not recorded.
Note: Crash data provided by the Alexandria Police Department. Figures only includes reports from the Alexandria Police Department, meaning that crashes where State agencies responded (such as on an interstate) or minor collisions that did not involve a police report are not recorded.
KSI- "Killed or Seriously injured"
this is the acronym for the most
crucial types of crashes that
Vision Zero seeks to eliminate.
crash type bicycle pedestrian vehicle only
crash type: bicycle pedestrian vehicle only
2011 2012 2013 2014 2015 2016
90
80
70
60
50
40
30
20
10
1,650
1,600
1,550
1,500
1,450
1,400
1,350
1,300
1,250
1,200
20110%
2%
4%
6%
8%
10%
12%
18%
20%
16%
14%
2012 2013 2014 2015 2016
TOTAL CRASHES
82
1,20914
PERCENTAGE OF CRASHES RESULTING IN SERIOUS INJURY OR DEATH
TRENDS OVER TIME
2011 2012 2013 2014 2015 2016
Note: Crash data provided by the Alexandria Police Department. Figures only includes reports from the Alexandria Police Department, meaning that crashes where State agencies responded (such as on an interstate) or minor collisions that did not involve a police report are not recorded.
Note: Crash data provided by the Alexandria Police Department. Figures only includes reports from the Alexandria Police Department, meaning that crashes where State agencies responded (such as on an interstate) or minor collisions that did not involve a police report are not recorded.
Note: Crash data provided by the Alexandria Police Department. Figures only includes reports from the Alexandria Police Department, meaning that crashes where State agencies responded (such as on an interstate) or minor collisions that did not involve a police report are not recorded.
Note: Crash data provided by the Alexandria Police Department. Figures only include reports from the Alexandria Police Department, meaning that crashes where State agencies responded (such as on an interstate) or minor collisions that did not involve a police report are not recorded.
Figure 7. Crash Trends in Alexandria
27
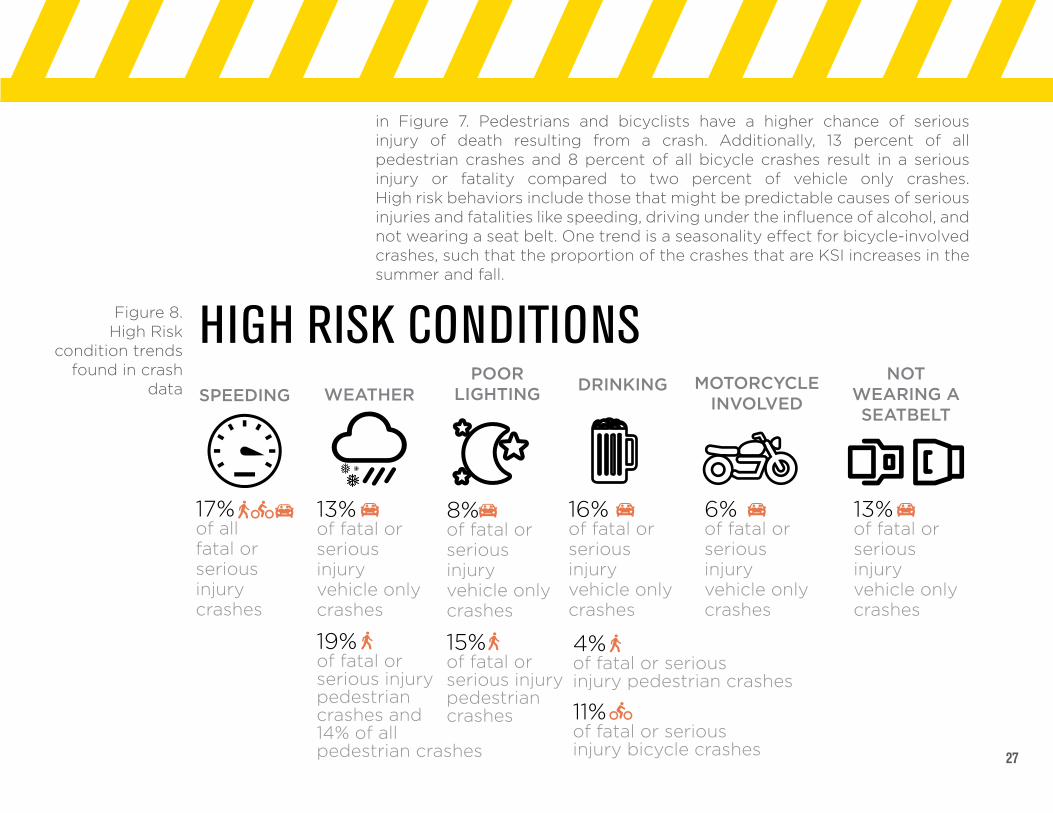
in Figure 7. Pedestrians and bicyclists have a higher chance of serious injury of death resulting from a crash. Additionally, 13 percent of all pedestrian crashes and 8 percent of all bicycle crashes result in a serious injury or fatality compared to two percent of vehicle only crashes. High risk behaviors include those that might be predictable causes of serious injuries and fatalities like speeding, driving under the influence of alcohol, and not wearing a seat belt. One trend is a seasonality effect for bicycle-involved crashes, such that the proportion of the crashes that are KSI increases in the summer and fall.
WEATHER
HIGH RISK CONDITIONS
older and younger people have a higher risk of serious injury or fatality if involved in a crash
SPEEDING
19%of fatal or serious injury pedestrian crashes and 14% of all pedestrian crashes
13%of fatal or serious injury vehicle only crashes
6%of fatal or serious injury vehicle only crashes
13%of fatal or serious injury vehicle only crashes
POOR LIGHTING
MOTORCYCLEINVOLVED
NOT WEARING A SEATBELT
8%of fatal or serious injury vehicle only crashes
15%of fatal or serious injury pedestrian crashes
DRINKING
16%of fatal or serious injury vehicle only crashes
4%of fatal or serious injury pedestrian crashes
11%of fatal or serious injury bicycle crashes
17%of all fatal or serious injury crashes
1%
0%
2%
3%
4%
5%
6%
7%
RISK BY AGE
age in years (5-year bins)
risk
of
seri
ou
s in
jury
or
fata
lity
Note: Conditions that have high rates of KSI crashes were selected as High Risk Conditions
Figure 8. High Risk
condition trends found in crash
data

28
2 HIGH INJURY NETWORKThe data showed the most damaging crashes were geographically distributed throughout the whole of Alexandria. However, Old Town, the West End, and Fairlington have a high density of KSI crashes compared to other areas. At the street level, traffic corridors that have higher numbers of KSI crashes include Duke Street, George Washington Parkway, West Glebe Road, and Jefferson Davis Highway. Higher speed crashes occur throughout the City, though the West End has a higher rate of speed-involved crashes that resulted in a death or serious injury. This geographic distribution has resulted in the High Injury Network (HIN) seen below.
KING
DUKE
QU
AKER
EISENHOWER
VAN
DO
RN
HEN
RY
BEAUREGARD
MO
UN
T VERN
ON
EDSALL
PATR
ICK
SEMINARY
TELE
GRAP
H
WAS
HIN
GTO
N
MENOKIN
BRADDOCK
RICHMOND
KING
PATR
ICK
RO
UTE 1
HEN
RY
CAPITAL BELTWAY
CAPITAL BELTWAY
HENRY G SHIR
LEY M
EMORIAL
GLEBE
KING
MILL
PICKETT
POTO
MAC
BRADDOCK
WES
T
JANNEY'S
MONROE
WYTHE
WHEELER
MADISON
PENDLETON
FAIR
FAX
JOR
DAN
HO
WA
RD
STEVENSON
MONTGOMERY
HAM
PTO
N
KENMORE
CALLAHAN
RU
SSEL
L
DAINGERFIELD
LINCOLNIA THIRD
DUKE
CLERMONT
QUA
KER
METRO
BRENMAN PARK
TELEGRAPH
DUKE
CLERMONT
KING
RU
SSELL
VALLEY
FAIR
FAXPRINCE
REED
DAWES
DUKE
PEG
RAM
SANGER
JOR
DA
N
WINDSORMORGAN
HOW
ARD
CH
AMBL
ISS
KEN
WO
OD
HIGH
SUMMIT
ORONOCO
WHITING
RAYMOND
HOLMES RUN
FORD
TAYLOR
RU
N
REYNOLDS
FOR
T WILLIAM
S
FRANKLIN
TANEY
FILLMOREPRESTON
GUNSTON
POW
HATAN
LAN
DO
VER
CR
EST
CAM
ERO
N M
ILLS
KENNED
Y
OLD DOMINION
COLUMBUS
PICKETT
FERN
WINDSOR
PICKETT
CO
LUM
BUS
OLD D
OMINIO
N
HOLMES RUN
TANEY
GEO
RG
E W
ASH
ING
TON
MEM
OR
IAL
Figure 9. High Injury Network (HIN)

29
STABLER
KING
DUKE
QU
AKER
EISENHOWER
VAN
DO
RN
HEN
RY
BEAUREGARD MO
UN
T VERN
ON
EDSALL
PATR
ICK
SEMINARY
TELE
GRAP
H
WAS
HIN
GTO
N
MENOKINBRADDOCK
RICHMOND
KING
PATR
ICK
RO
UTE 1
HEN
RY
CAPITAL BELTWAY
GE
OR
GE
WA
SH
ING
TON
ME
MO
RIA
L
CAPITAL BELTWAY
HENRY G SHIR
LEY M
EMORIAL
GLEBE
KING
MILL
PICKETT
POTO
MAC
BRADDOCK
WES
T
JANNEY'S
MONROE
WYTHE
WHEELER
MADISON
PENDLETON
FAIR
FAX
JOR
DAN
HO
WA
RD
STEVENSON
MONTGOMERY
HAM
PTO
NKENMORE
CALLAHAN
RU
SSEL
L
DAINGERFIELD
LINCOLNIA THIRD
DUKE
CLERMONT
QUA
KER
METRO
BRENMAN PARK
TELEGRAPH
DUKE
CLERMONT
KING
RU
SSELL
VALLEY
FAIR
FAXPRINCE
REED
DAWES
DUKE
PEG
RAM
SANGER
JOR
DA
N
WINDSORMORGANHO
WAR
D
CH
AMBL
ISS
KEN
WO
OD
HIGH
SUMMIT
ORONOCO
WHITING
RAYMOND
HOLMES RUN
FORD
TAYLOR
RU
N
REYNOLDS
FOR
T WILLIAM
S
FRANKLIN
TANEY
FILLMOREPRESTON
GUNSTON
POW
HATAN
LAN
DO
VER
CR
EST
CAM
ERO
N M
ILLS
KENNED
Y
OLD DOMINION
COLUMBUS
PICKETT
FERN
WINDSOR
PICKETT
CO
LUM
BUS
OLD D
OMINIO
N
HOLMES RUN
TANEY
Mark Center
West End
TC Williams High School
Arlandria
Metro Station
Bike to Work Day
Old Town Farmers Market
Figure 10. Street Meeting Outreach Event Locations
PUBLIC INVOLVEMENT The purpose and goal of public involvement was to structure the engagement efforts to reach a wider sample of Alexandria’s population than traditionally seen at established public meetings. The team created a digital survey and online interactive map to gather feedback.
STREET MEETINGSThe city held seven on-site events, or street meetings, across Alexandria to talk to residents, visitors, and youth and to encourage participation and engagement through the interactive map and survey. The map below shows the event locations.
GATHERING INPUTAt each street meeting and online, the City asked about participants' top three traffic safety concerns, if the person or someone they know had experienced a crash, details about that crash, and to identify where in the city they had experienced traffic safety issues through an online interactive map.
USING THE INFORMATIONWith the survey results, comments, and interactive map information, the Vision Zero team built strategies aimed at addressing and prioritizing these concerns.
30
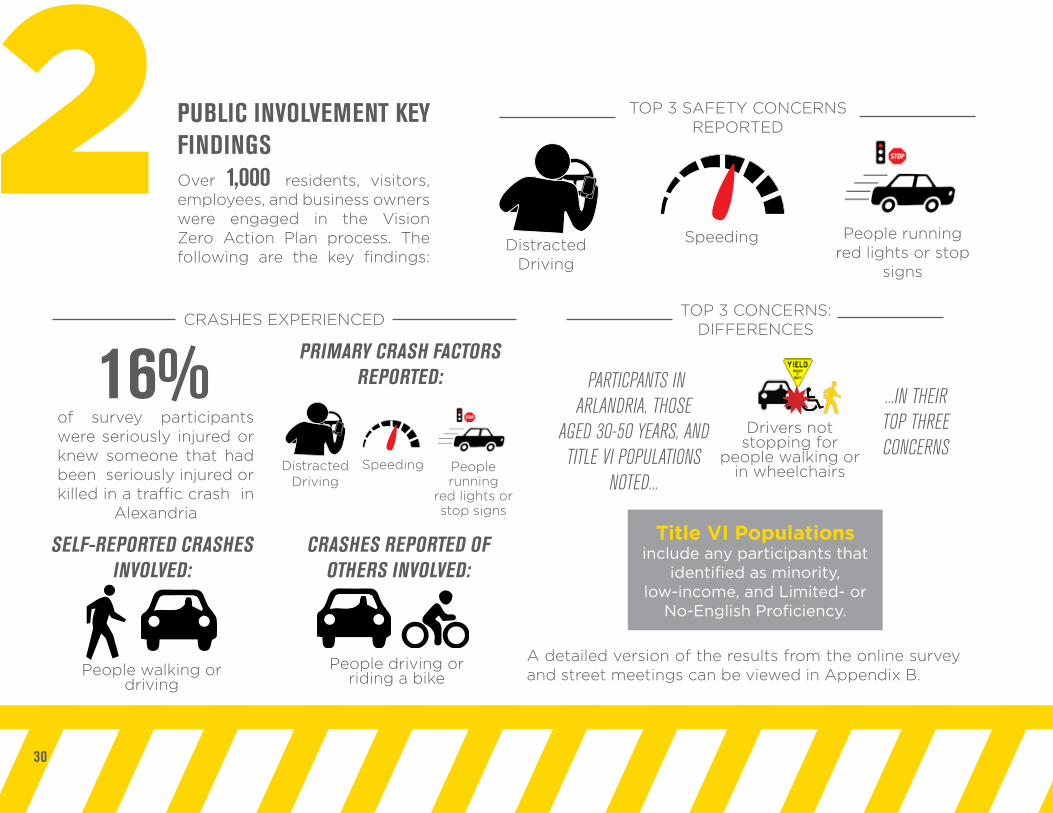
PUBLIC INVOLVEMENT KEY FINDINGSOver 1,000 residents, visitors, employees, and business owners were engaged in the Vision Zero Action Plan process. The following are the key findings:
TOP 3 SAFETY CONCERNS REPORTED
Distracted Driving
People running red lights or stop
signs
Speeding
CRASHES EXPERIENCED
16%of survey participants were seriously injured or knew someone that had been seriously injured or killed in a traffic crash in
Alexandria
PRIMARY CRASH FACTORS REPORTED:
Distracted Driving
People running
red lights or stop signs
Speeding
SELF-REPORTED CRASHES INVOLVED:
CRASHES REPORTED OF OTHERS INVOLVED:
TOP 3 CONCERNS:DIFFERENCES
Drivers not stopping for
people walking or in wheelchairs
PARTICPANTS IN ARLANDRIA, THOSE
AGED 30-50 YEARS, AND TITLE VI POPULATIONS
NOTED...
2Title VI Populations
include any participants that identified as minority,
low-income, and Limited- or No-English Proficiency.
People walking or driving
People driving or riding a bike
...IN THEIR TOP THREE CONCERNS
A detailed version of the results from the online survey and street meetings can be viewed in Appendix B.

31
INTERACTIVE MAP
Most frequent comments noted: • Speeding • Drivers not stopping for people
walking or in wheelchairs across the street
• People running red lights or stop signs
• Needs for improved pedestrian infrastructure
• Poor accessibility due to sidewalk and other infrastructure
• Confusing traffic patterns
THE PUBLIC NOTED NEARLY
700 SAFETY CONCERNS
ON THE INTERACTIVE MAP.
Figure 11. The team featured the interactive map at the street
meetings using a printed map and sticky notes
3232
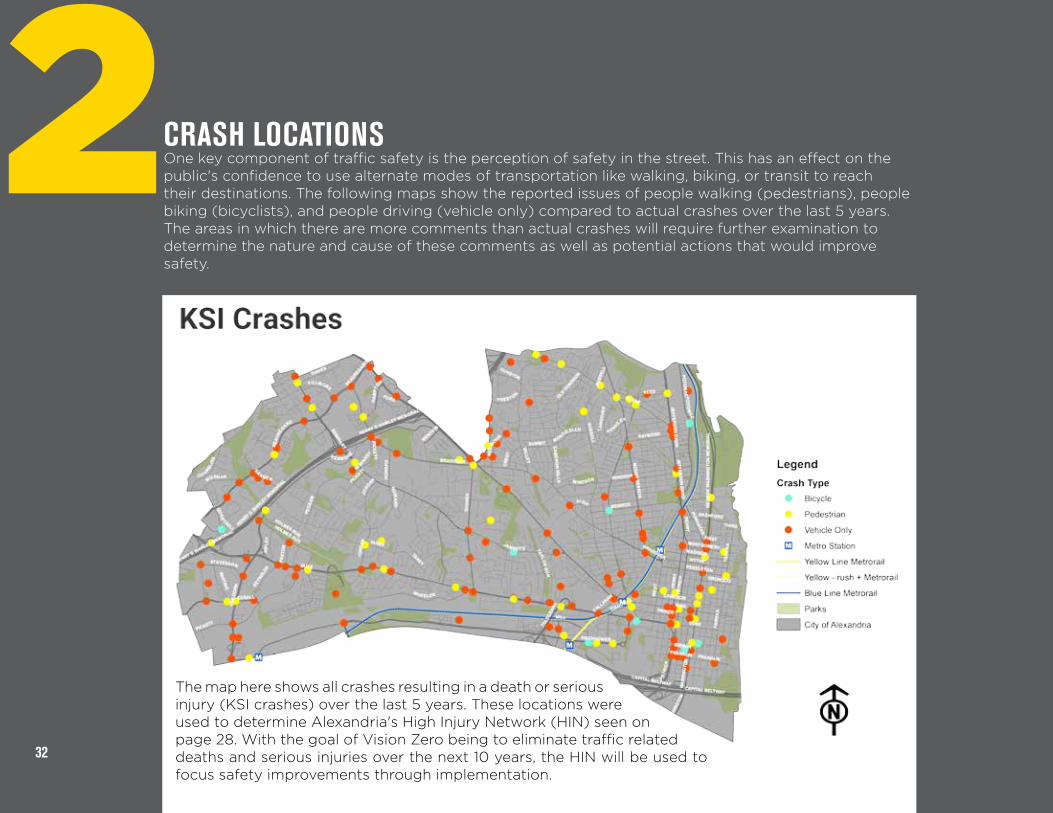
2CRASH LOCATIONS One key component of traffic safety is the perception of safety in the street. This has an effect on the public's confidence to use alternate modes of transportation like walking, biking, or transit to reach their destinations. The following maps show the reported issues of people walking (pedestrians), people biking (bicyclists), and people driving (vehicle only) compared to actual crashes over the last 5 years. The areas in which there are more comments than actual crashes will require further examination to determine the nature and cause of these comments as well as potential actions that would improve safety.
The map here shows all crashes resulting in a death or serious injury (KSI crashes) over the last 5 years. These locations were used to determine Alexandria's High Injury Network (HIN) seen on page 28. With the goal of Vision Zero being to eliminate traffic related deaths and serious injuries over the next 10 years, the HIN will be used to focus safety improvements through implementation.

33
The maps here show a comparison of the feeling of safety for people walking in Alexandria versus actual pedestrian crash locations. The feeling of safety, primarily for people walking and biking can be a barrier to taking these alternate means of transportation. Key areas that do not have as many crashes, but people reported feeling unsafe walking are: • Quaker Lane and
Janneys Lane/Seminary Road
• Fort Williams Parkway and Seminary Road
• Cameron Station Neighborhood
• Potomac Yard near the intersetion of Route 1 and East Glebe Road
Further investigation into the nature of these comments and field observation is needed to determine if these are near-misses or other potential conditions.
PUBLIC COMMENTS VS. CRASHES FOR PEOPLE WALKING
COMM
ENT ISSUES MAPPED
ACTUAL CRASHES (ALL CRASHES)

34 ACTU
AL C
RASH
ES (A
LL C
RASH
ES)
COM
MEN
T IS
SUES
MAP
PED
The maps here show a comparison of the feeling of safety for people biking versus actual bicycle crash locations. The feeling of safety, primarily for people walking and biking, can be a barrier for people considering these alternate means of transportation. Key areas that have a disproportionate number of comments to actual crashes for people biking are: • Braddock and Russell
Road• Mount Vernon Ave and
Braddock Road• Old Town North
neighborhood along the Mount Vernon Trail
• The area around TC Williams High School
More examination will be conducted to determine the issues and needs of these areas.
2 PUBLIC COMMENTS VS. CRASHES FOR PEOPLE BIKING

35
PUBLIC COMMENTS VS. CRASHES FOR PEOPLE DRIVING
COMM
ENT ISSUES MAPPED
ACTUAL CRASHES (ALL CRASHES)
The maps here show a comparison of the feeling of safety for people driving versus actual vehicle crash locations. Key areas that have a disproportionate number of comments to actual crashes for people driving are: • Del Ray Neighborhood• Potomac and Potomac
West Neighborhoods• Cameron Station
Neighborhood• Potomac Yard near the
intersetion of Route 1 and East Glebe Road
These are areas that can be examined and studied for traffic calming installations, road and/or intersection redesign, and other traffic safety interventions. Interventions that keep drivers focused on the roads should be prioritized to deter distracted driving.

36
BEST PRACTICESA rich network of existing U.S. Vision Zero cities, as seen in Figure 12, provided a long list of strategies and practices that have been effective in these communities. A Vision Zero City must meet the folowing minimum standards:• Sets clear goal of eliminating traffic fatalities and severe injuries• Mayor has publically, officially committed to Vision
Zero• Vision Zero plan or strategy is in place, or Mayor has
committed to doing so in clear time frame• Key city departments (including Police, Transportation
and Public Health) are engaged.The Vision Zero team combed the Action Plan strategy lists and used them as a benchmark to gain insight into creative and effective actions that could be implemented.
CITIES USED AS PRECEDENTSThe cities used as precedents were chosen either for their regional proximity, similar size and character to Alexandria, or innovative strategies. Each city is listed below.
DISTRICT OF COLUMBIAAs one of the most recent cities to adopt Vision Zero, Washington, DC is a precedent for regional comparison and context. Reviewing and including some of their strategies in this Action Plan can create regional cohesion and coordination as residents of Virginia, the District, and Maryland flow daily between borders.
Figure 12.
Vision Zero Network Map of Vision Zero Cities
2

37
CITIES SIMILAR IN CHARACTEREugene, Oregon; Austin, Texas; Fort Lauderdale, Florida; and Portland Oregon are similar in character or urban form to Alexandria. These cities are smaller in population than that of New York or Los Angeles and often have a historic downtown core.
INNOVATIVE PRACTICES FROM LARGE CITIESLos Angeles, San Francisco, Boston, Denver, and Seattle were used as precedents for innovative practices and programs that could be applied to Alexandria.
OVERVIEW OF BEST PRACTICES1. ADMINISTRATIVE ACTIONSStrategies often focused on administrative activities like forming task forces, conducting an internal review of city fleet crashes, updating existing plans and ensuring the inclusion of Vision Zero principles for safety in future plans. There was a focus on empowering existing groups or organizations to have a stake in the creation of the plan as well as taking on a strategy to help the City achieve
Vision Zero. Safety becomes more of a focus for new developments to both manage multimodal traffic during construction and at completion.
2. EDUCATIONAL ACTIONSIn many cases, the best educational practice was to have an ongoing conversation about traffic safety and Vision Zero to ensure effective implementation and to update the public on progress. Capitalizing on captive audiences and using existing resources to show educational videos or place materials has been proven to be effective at raising awareness of Vision Zero and traffic safety campaigns. Public art has also proven to be a key component of communicating more complex messaging.
3. ENFORCEMENT ACTIONS One of the key elements to more effective enforcement is to collect better, more specific data. Giving officers traffic safety 'cheat sheets' and educational materials to use during traffic stops is effective at spreading the Vision Zero message or specific
Source: Vision Zero Network

38
campaign. Increased automated enforcement has been used to enforce speeds or traffic signals in areas with high numbers of children or people walking, biking, or traveling in wheelchairs. Another important factor is making enforcement data more readily available to the public to ensure a transparent process.
4. ENGINEERING ACTIONSMost engineering actions focused on environmental conditions that lead to hazardous conditions. These include focuses on better lighting, sidewalks, Americans with Diabilities Act (ADA) facilities, and signage. Slow zones (Figure 13) that are implemented around schools, recreation centers, libraries, or areas of high residential land uses.
5. LEGISLATIVE ACTIONSAll legislative actions focus on changing policies to enhance education and increase fines for
the most dangerous infractions. Policies around driver education are also updated to ensure more frequent and adequate information on new policies. Using various policies to deter dangerous driving like enabling the use of speed and/or red light cameras and reducing the citywide speed limit has shown to be effective at improving safety in the streets.
6. EVALUATION ACTIONSCollecting more data and linking data is often the focus of evaluation best practices. More data collected and linked through the hospital system, police department, and crash data can show the effectiveness of Vision Zero measures and also allow the city to better evaluate hazardous conditions. Engaging the public in data analysis (Figure 14) is also effective in ensuring transparency in the process, crowdsourcing information, and analyzing the data available for information city staff may not be able to analyze.
Figure 13. An Engineering Action like the Slow Zones, seen above, can help manage speeds in neighborhoods or areas with schools, senior centers, or other uses that draw vulnerable users. (Source: NYC Streetsblog)
2
Figure 14. DC Vision Zero Hackathon hosted by the District Department of Transportation (Source: DDOT)

3Path
to Zero

PATH TO ZEROThis plan's subtopics and action items were formed through a mix of all four components of the Vision Zero Process: data analysis, public input, the interdepartmental work group, and analysis of best practices. All of the strategies in this chapter have been assessed by the interdepartmental group for their effectiveness, applicability, and ability to be implemented. In Appendix C, you will find the full list of strategies, action items, corresponding agencies and time frames for these actions.
DEVELOPING STRATEGIES During the Vision Zero process,
four overarching goals emerged for Alexandria. These are to:
• Promote a Culture of Safety• Build Safer Streets for Everyone • Improve Data Collection and
Evaluation• Enhance City Processes and
CollaborationWithin each goal, related subtopics and subsequent action items have been developed. Action items are the specific implementation strategies that each department will undertake to enhance traffic safety and help achieve Vision Zero.
3Source: Dan Reed

Strategiesand
Action Items

42
PROMOTE A CULTURE OF SAFETYVision Zero is not just a one-time initiative - it's a community mindset. Traffic safety should become intuitive and ingrained in the daily lives of Alexandria community members and visitors. Alexandria should be known for its culture of safety and protection of all roadway users, regardless of travel mode. By the end of the first five years of our effort, safety will become second-nature for everyone traveling on Alexandria streets.
Source: Evan Michio Cantwell
Source: Smilla4 (Flickr)

43
• Display safety "campaign" messages at
additional government facilities and on
City fleet.
• Use signs and electronic messaging for
PSAs such as related to "campaign"
messages.
• Provide handouts for APD to distribute
at traffic stops educating the public on
safety.
• Develop a program to foster and teach
safe driving habits to teen drivers.
• Work with other local governments
to develop regional and City-based
"campaigns" with messaging that
• Increase fines for infractions that result
in crash with a pedestrian in a marked
crosswalk.
• Require all Alexandria Police officers to
participate in the NHTSA’s pedestrian
training for law enforcement.
• Reduce driving under the influence
through a collaboration with transit,
taxi companies, transportation network
companies, bar owners and other
STRENGTHEN TRAFFIC SAFETY ENFORCEMENT POLICIES AND PRACTICES
focuses on topic area(s) of importance
(e.g. Speeding, Distracted Driving, and
Driving Under the Influence).
• Increase distribution of safety
equipment including bike lights,
helmets, bells, and reflectors at City
CRAFT A SUCCESSFUL EDUCATION CAMPAIGN TO INFORM THE PUBLIC OF VISION ZERO AND TOPIC AREAS

44
• Develop a network of "civic partners"
who pledge to support Vision Zero
through the dissemination of safety
and educational information to their
networks.
• Develop a network of "Coalition
partners" who pledge to support Vision
Zero through implementation of one or
more action items.
• Form interdepartmental subgroups of
Vision Zero Stakeholders as necessary,
to ensure successful implementation of
the plan.
• Initiate a regional Vision Zero Task force
to identify path toward regional Vision
Zero Policy.
CREATE A NETWORK OF VISION ZERO PARTNERSHIPS
retail outlets, especially targeting hot spot
locations.
• Develop data-driven process to determine
high crash intersections where red light
violations are frequent, and install and rotate
maximum allowed automated red light
enforcement cameras.
• Increase enforcement on roadways with
higher speeds and target education
campaigns about speeding in these areas (i.e.
- message boards).
• Regularly deploy high-visibility DUI
enforcement in high-priority areas on nights
with higher concentrations of severe and fatal
crashes and major community events.
• Increase the number of crossing guards at
schools through a volunteer training program.

45
ENCOURAGE CITY STAFF TO INCORPORATE VISION ZERO INTO EVERYDAY PRACTICES
INFORM THE PUBLIC OF VISION ZERO EFFORTS
• Continue and enhance recognition
programs for safe driving of school
buses, transit, and City fleet vehicles.
• Add Vision Zero education to defensive
driving courses to training for all City
employees receiving fleet driving
permissions. Require employees to
update this training certifications every
2 years.
• Develop walking and biking curriculum
for elementary school students (ACPS
SRTS Coordinator).
• Maintain a comprehensive website to
provide information on the projects,
programs, and progress of Vision Zero to
include dashboard and annual reports.
• Utilize social media to share information
and promote dialog.
• Provide Vision Zero logo, goal and
message on back of parking receipts and
City email signatures.
• Work with media partners to more
accurately report traffic crashes to avoid
victim-blaming, and report crashes in the
context of Vision Zero.

46
BUILD SAFE STREETS FOR EVERYONEStreet design has an impact on both perception of safety when driving, biking, walking, or wheeling as well as the actual rate of crashes. Street design focuses largely on the engineering, streetscaping, and urban planning that determine traffic behaviors. It's been proven that reconfiguring roadways for lower speeds and designing intersections for pedestrian safety reduces both the number and severity of crashes for all modes.
The graphics on these two pages show the common types of motor vehicle and pedestrian crashes that occur in Alexandria. The data showed that vehicles involved in KSI crashes in the City were on average traveling faster
than the posted speed. A crash involving a speeding vehicle significantly increased risk of KSI in vehicle-only crashes and pedestrian-involved crashes (especially when there is adverse weather for vehicle only crashes). Most of these can be addressed through road design and engineering practices.
Designing roads that have narrower lanes, alert drivers to traffic changes or intersections, or provide horizontal or vertical shifts force drivers to slow down and become more aware of their surroundings. These also deter distracted driving. Roadway design that focuses on the safety of people walking makes it safer for all other modes as well.
FROM 2011-2016, there were CRASHES INVOLVING ONLY MOTOR VEHICLES
COMMON MOTOR VEHICLE CRASH TYPES*
CRASHES RESULTED IN A FATALITY OR SERIOUS INJURY
9,3281 in 50
REAR END
11% of all reported crashes were rear end crashes. 1% of all rear end crashes resulted in serious injury or loss of life.
MOTORCYCLIST
27% of crashes involving a motorcyclist resulted in a serious injury or fatality and accounted for less than 1% of all crashes.
SIDESWIPE, SAME DIRECTION
26% of all reported crashes were sideswipe, same direction crashes. 1% of all these crashes resulted in serious injury or loss of life.
ANGLE
46% of all reported crashes were angle crashes. 2% of all angle crashes resulted in serious injury or loss of life.
*No other crash types comprised more than 3% of the dataset. Crash types listed have the highest percent share of total crashes.

47
FROM 2011-2016, there were CRASHES INVOLVING ONLY MOTOR VEHICLES
COMMON MOTOR VEHICLE CRASH TYPES*
CRASHES RESULTED IN A FATALITY OR SERIOUS INJURY
9,3281 in 50
REAR END
11% of all reported crashes were rear end crashes. 1% of all rear end crashes resulted in serious injury or loss of life.
MOTORCYCLIST
27% of crashes involving a motorcyclist resulted in a serious injury or fatality and accounted for less than 1% of all crashes.
SIDESWIPE, SAME DIRECTION
26% of all reported crashes were sideswipe, same direction crashes. 1% of all these crashes resulted in serious injury or loss of life.
ANGLE
46% of all reported crashes were angle crashes. 2% of all angle crashes resulted in serious injury or loss of life.
*No other crash types comprised more than 3% of the dataset. Crash types listed have the highest percent share of total crashes.
LEFT-TURN CRASH AT SIGNALIZED INTERSECTION
RIGHT-TURN CRASH AT SIGNALIZED INTERSECTION
PEDESTRIAN CROSSING AGAINST SIGNAL
PEDESTRIAN CROSSING FROM BEHIND PARKED CARS
PEDESTRIAN CROSSING MID-BLOCK
LEFT-TURN CRASH AT UNSIGNALIZED INTERSECTION
FROM 2011-2016,
PEDESTRIANS WERE INVOLVED IN CRASHES
COMMON PEDESTRIAN CRASH TYPES
CRASHES RESULTED IN A FATALITY OR SERIOUS INJURY
4451 in 7
10people su�ered serious injuries or fatalities
6people su�ered serious injuries or fatalities
4people su�ered serious injuries or fatalities
4people su�ered serious injuries or fatalities
3people su�ered serious injuries or fatalities
12people su�ered serious injuries or fatalities
Note: Crash data provided by the Alexandria Police Department does not include information on why the pedestrian chose to cross the street. or if there were factors that forced the pedestrians to cross the street.

48
• Incorporate Vision
Zero data and
recommendations into
Transportation elements
of future Small Area
Plans.
• Use the data that
identifies high KSI
crash corridors and
intersections to help
prioritize engineering
and education
efforts, and require
comprehensive
safety improvements
when designing
these corridors and
intersections.
• Update the Streets and
Transit Chapters of the
Transportation Master
Plan to prioritize the
reduction of KSI crashes
and elevate crash data
as a priority in decision-
making.
• Develop neighborhood
slow zone program
with selection criteria,
a request process, and
launch an application-
based program, through
engineering and design
improvements to reduce
vehicle speeds.
• When new public school
facilities open or relocate
to a new site, ensure
appropriate agencies
continue to work
together to develop a
transportation plan that
prioritized safey for the
new school facility.
• Explore a Citywide
25mph speed limit.
DEVELOP AND IMPLEMENT INFRASTRUCTURE POLICIES TO REDUCE KSIs
Source: FHWA
49
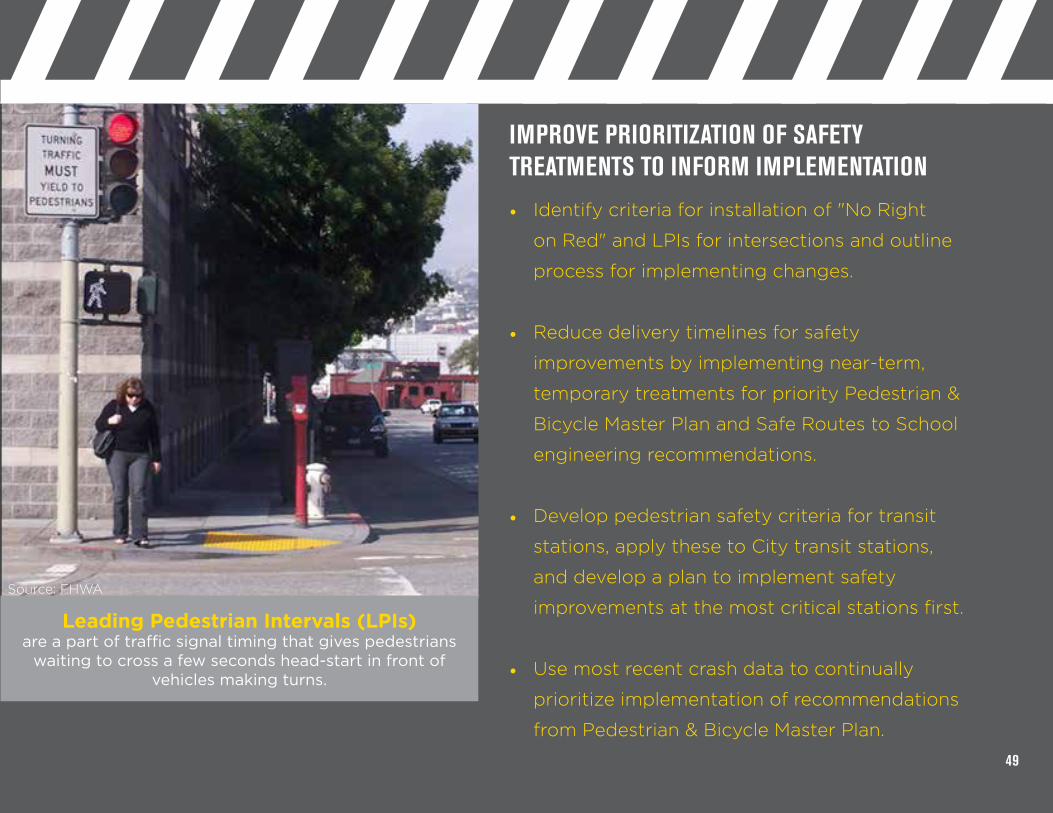
• Identify criteria for installation of "No Right
on Red" and LPIs for intersections and outline
process for implementing changes.
• Reduce delivery timelines for safety
improvements by implementing near-term,
temporary treatments for priority Pedestrian &
Bicycle Master Plan and Safe Routes to School
engineering recommendations.
• Develop pedestrian safety criteria for transit
stations, apply these to City transit stations,
and develop a plan to implement safety
improvements at the most critical stations first.
• Use most recent crash data to continually
prioritize implementation of recommendations
from Pedestrian & Bicycle Master Plan.
IMPROVE PRIORITIZATION OF SAFETY TREATMENTS TO INFORM IMPLEMENTATION
Leading Pedestrian Intervals (LPIs) are a part of traffic signal timing that gives pedestrians
waiting to cross a few seconds head-start in front of vehicles making turns.
Source: FHWA
50
IMPROVE DATA COLLECTION AND EVALUATIONEvaluating the impacts of Vision Zero efforts and keeping ourselves accountable is critical to ensuring that the initiative is successful. To this end, the City will improve data collection, evaluation and dissemination regarding all projects, including enforcement efforts and education campaigns. All information must be easily accessible not only to the City, but the public as well. The City will be creative in finding the resources needed to make this process efficient and effective.
Source: NHTSA

51
• Continue building and expanding
electronic citation database
pending funding and resources.
• Work with VDOT and State
Pedestrian Task Force to revise
crash reporting standards and
information captured to better
inform data analysis leading to
projects and programs.
• Investigate extent of pedestrians
crashes not reconciled with Fire &
EMS data and AHD report.
• Standardize and establish
definitions and training on crash
reporting methods.
• Improve existing Multi-department
Response Team for all KSI
crashes and develop T&ES crash
form to document contributing
crash factors related to street
design.
• Work with the State to update
crash reporting methods to
differentiate between alcohol and
drug related crashes.
• Continue existing and inverstigate
new opportunities for partnerships
with universities, technology
companies, and researchers to
develop a comprehensive traffic
crash prediction and traffic
exposure model.
ENHANCE DATA COLLECTION AND COORDINATION EFFORTS

52
• Publish an annual report
card on the progress of
Vision Zero, present it
to the Transportation
Commission, and publish
it on the Vision Zero
website.
• Provide annual citation
data for infractions that
potentially lead to serious
injuries and deaths.
• Establish dashboard for all
crash and safety data on
the Vision Zero website.
MAKE INFORMATION EASILY AVAILABLE TO THE PUBLIC

53
ENHANCE CITY PROCESSES AND COLLABORATIONVision Zero is an all-hands-on-deck initiative that will take more than just one department to get to the goal of zero traffic related fatalities or serious injuries. Multiple agencies and departments will need to help with education, encourage legislative intervention, lead enforcement, and improve data collection and management. Moreover, all departments will be responsible for evaluating and improving efforts together as the City moves into implementation.
Source: OZinOH (Flickr)

54
• Develop system to track, manage, respond to, and prioritize
resident and customer requests for safety improvements.
• Support work with courts to create graduated penalties for
repeat offenders.
• Evaluate Traffic & Parking Board charter and consider
revisions to make traffic safety a primary focus of the Board.
• Encourage and promote national and regional senior driving
education programs, such as the "We Need to Talk" program.
• Evaluate Maintenance of Traffic (MOT) Plan requirements and
revise to prioritize safe, accessible, and convenient routes for
bicyclists and pedestrians. Enforce MOT plans in work zones.
EVALUATE CITY POLICY AND ADMINISTRATIVE GUIDELINES TO IMPROVE SAFETY OUTCOMES

55
• Support statewide efforts to reform Driving
Under the Influence (DUI) standards related
to Blood Alcohol Content, arrest and
adjudication process, and repeat offenders.
• Pursue and support state legislation
to allow the use of fixed automated
enforcement cameras for speed violations.
• Support statewide efforts to revise
distracted driving laws, including increase
of fines.
• Pursue and support state legislation to
require drivers to stop, rather than yield, for
pedestrians in the crosswalk.
SUPPORT AND ENCOURAGE STATEWIDE LEGISLATIVE EFFORTS TO IMPLEMENT STRICTER TRAFFIC SAFETY LAWS
Source: Virginia.gov

56
The City has taken on the challenge of accomplishing the goal of Vision Zero within ten years of the adoption of this Action Plan. Each of the strategies and action items have been prioritized and assigned to departments that will lead and support each item, which can be found in Appendix C. However, City Staff cannot accomplish these goals alone.
COMMUNITY SUPPORTPart of the success of this plan is having our residents, visitors, businesses, and workers take responsibility for their individual actions, look out for one another on the roads, and embrace the culture of safety Alexandria is trying to build. Many Coalition Partners, highlighted later in this plan, have signed on to do their part to achieve Vision Zero. What can you do?
• Take the pledge to make safe choices when moving through the city streets and make these actions a part of your daily life
• Help the City spread the word about Vision Zero by talking to your friends, neighbors and community groups
• Attend and help promote Vision Zero and other city events in the future
• Join or become active in a civic group focused on your neighborhood
WHAT WILL IT TAKE TO ACHIEVE ZERO?3 Figure 15. Vision Zero Funding Table (in Thousands)
Vision Zero Funding Current Short Term Mid-Term Long Term
FY 2018Year 1 FY 19
Year 2 Year 3 Year 4 Year 5 FY 23
Year 6+
Capital
East Glebe & Route 1 $3,200 $1,400
King & Beauregard Intersection Improvements $1,900
Citywide Transportation Mang't Technologies $250 $250 $250 $250
Fixed Transportation Equipment $1,150 $850 $850 $850 $850 $2,350 $2,675
Holmes Run Trail Connector $800
Complete Streets $730 $830 $830 $830 $830 $830
Ped/Bike Study $340
King Street Ped/Bike Safety Improvements $1,000
Seminary & Howard $400
Old Cameron Run Trail $2,845 $102 $1,409 $1,360
Shared Use Paths $150 $0 $300 $0 $300 $0 $600
Sidewalk Maintenance $300 $600 $300 $600 $300 $600 $1,800
Transportation Master Plan $340 $500
Van Dorn/Beauregard Bike $250 $1,171
Backlick Run Paths $118 $2,000 $4,382
Duke Street Corridor $2,000 $3,000 $14,000

57
FUNDINGThe strategies outlined in this plan provide the roadmap to reach the goal of zero traffic-related fatalities and serious injuries. To achieve this goal by 2028, the City and each de-partment has committed staff resources and departmental focus for the action items they are assigned.
Implementation of the strategies outlined in this plan will require dedicated staff time, support from community and partner agencies, and the alignment of a variety of exist-ing and new funding sources. The City’s Approved Capital Improvement Plan (FY 2018 – FY 2027) already includes a number of projects that are aligned with this plan, includ-ing, but not limited to the projects seen in Figure 15 to the left.
In addition to reallocating internal resources and shifting priorities to incorporate Vision Zero into existing work, additional funding will be needed to accomplish the goals of this plan. Annual funding will be determined through the budget process and will be guided by the annual work plan for implementing Vision Zero. The estimated addi-tional funding needed to implement this plan includes up to $200,000 per year in operating funds and up to $1,300,000 per year in capital funding. These figures do not include Alexandria Police Department (APD) staff time or costs for the implementation of the APD traffic safety plan, which will be estimated through a separate effort. It is likely that a combination of City funds and outside funding (i.e. grants) will be needed to achieve these funding lev-els. Also, coordination with other City efforts, such as the Pedestrian and Bicycle Master Plan, will allow the City to
Figure 15. Vision Zero Funding Table (in Thousands)
Vision Zero Funding Current Short Term Mid-Term Long Term
FY 2018Year 1 FY 19
Year 2 Year 3 Year 4 Year 5 FY 23
Year 6+
Capital
East Glebe & Route 1 $3,200 $1,400
King & Beauregard Intersection Improvements $1,900
Citywide Transportation Mang't Technologies $250 $250 $250 $250
Fixed Transportation Equipment $1,150 $850 $850 $850 $850 $2,350 $2,675
Holmes Run Trail Connector $800
Complete Streets $730 $830 $830 $830 $830 $830
Ped/Bike Study $340
King Street Ped/Bike Safety Improvements $1,000
Seminary & Howard $400
Old Cameron Run Trail $2,845 $102 $1,409 $1,360
Shared Use Paths $150 $0 $300 $0 $300 $0 $600
Sidewalk Maintenance $300 $600 $300 $600 $300 $600 $1,800
Transportation Master Plan $340 $500
Van Dorn/Beauregard Bike $250 $1,171
Backlick Run Paths $118 $2,000 $4,382
Duke Street Corridor $2,000 $3,000 $14,000

58
3target resources toward projects that support cross-cutting goals.
INTERNAL COORDINATIONIn order to accomplish the action items outlined in this plan as well keep the goal of Vision Zero in mind, city staff will develop a 3-year work plan that will help break the implementation of these items into measurable milestones. The work plan will include an outline for each action item that details the timeframe, budget, staff resource allocation and leading department.
REGIONAL SUPPORTThe City of Alexandria is part of the larger Washington metropolitan region and many residents cross state and local borders on a daily basis for school, work, and leisure activities. Through public campaigns and other communication channels, the City will educate residents of other jurisdictions who use Alexandria streets to promote our culture of safety. However, because of our regional draw of visitors and workers, it will take more than the City's efforts alone to achieve Vision Zero. It is for this reason that the City will initiate and take part in discussions with the other jurisdictions in Virginia, DC, and Maryland about creating a regional Vision Zero plan. A multi-jurisdiction strategy would help align transportation priorities across borders, building a regional culture of safety.
STATE SUPPORTPart of the success of this plan depends on State support

59
for amending policies, procedures, and laws. City staff will work with state partners and advocates to explore a state-wide Vision Zero program, in conjunction with the State's Strategic Highway Safety Plan.
MEASURING SUCCESSThe Vision Zero movement is focused on one central performance metric: reducing serious traffic injuries and deaths to zero. On the one hand, that makes the success of Vision Zero fairly easy to measure. However, it is critically important for the City to continually evaluate the impact of various Vision Zero strategies over time, so that they can be refined, revised and targeted for better outcomes. The City will develop and publish an annual report to summarize progress on Vision Zero activities and report trends in traffic-related fatalities and serious injuries. As the Alexandria Police Department implements a new data management system, it will become increasingly easier to analyze traffic crash data with greater frequency, which could lead to the development of additional programs in response to new trends. While this Action Plan targets the next five years, the City will assess the progress toward Vision Zero after their third annual report has been published so they can assess the status of the 3-year work plan and adjust the plan to address new data and emerging trends in crashes.

60

4Call
to Action

62
CALL TO ACTION4Vision Zero is an ethics-based approach to traffic safety, meaning that human life is prioritized above all else in our transportation system and that no loss of life is acceptable. We are all residents, visitors, employees, or employers that move around Alexandria. Our individual actions contribute to the whole of traffic safety on our streets, sidewalks and trails. Therefore, it is the responsibility of all users of these spaces to follow the rules of the road and look out for one another.
In this section you will see more pledges and commitments made by City leaders and Coalition Partners with the promise to do their part in to accomplish Vision Zero. This plan serves as the City's commitment and pledge to help prevent traffic deaths and serious injuries with the goal of reaching zero in the coming decade, but we cannot do it alone.
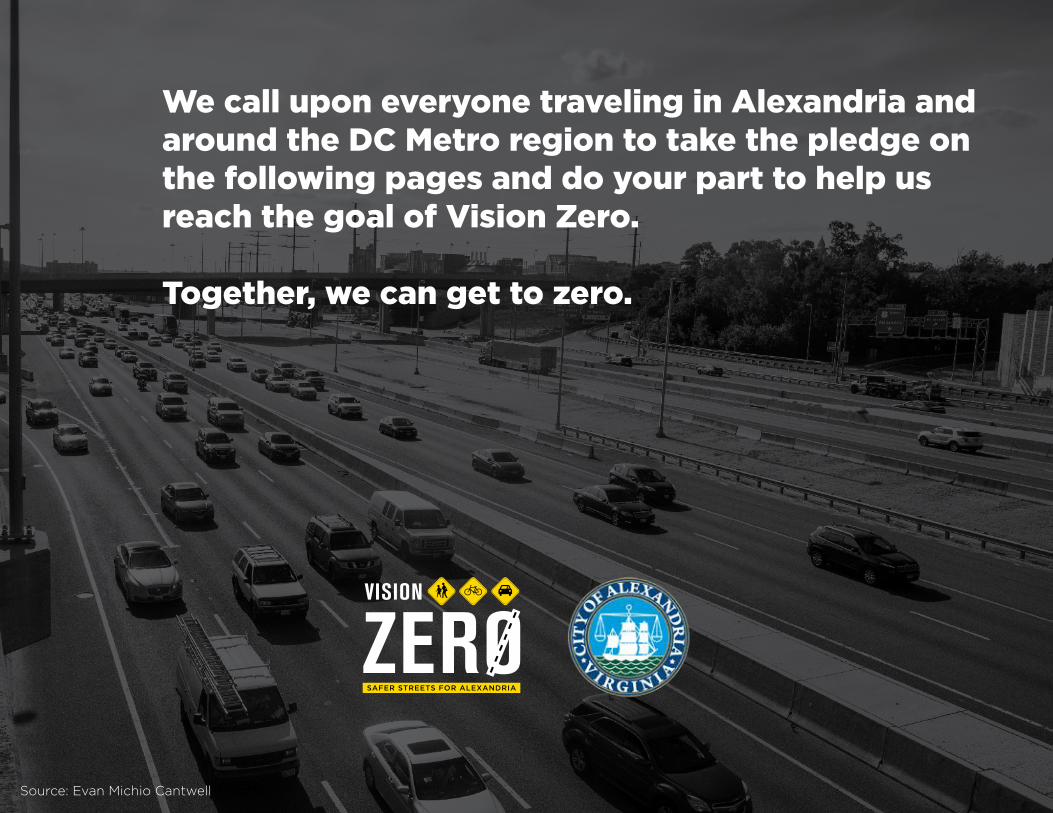
63
We call upon everyone traveling in Alexandria and around the DC Metro region to take the pledge on the following pages and do your part to help us reach the goal of Vision Zero.
Together, we can get to zero.
Source: Evan Michio Cantwell

64
ORGANIZATION:
DATE:
SIGNATURE:
To sign your organization up
to support Vision Zero
CLICK HERE
COALITION PARTNER PLEDGE
The Vision Zero Action Plan lays the foundation for upcoming years and solidifies the City of Alexandria’s long term commitment to achieve zero traffic fatalities by 2028. Alexandria continually strives to provide a traffic system that prioritizes safe and excellent transportation choices for all of our residents, employees and visitors. Along with our community stakeholders, we commit to work together in partnership with City departments to be of assistance with the implement these action items where we can and incorporate the concepts of Vision Zero into the work we do related to mobility. We will be a resource to the City staff and a bridge to the community we represent to reach our goal of zero traffic fatalities and severe injuries.

65
Alexandria Bicycle and Pedestrian Advisory Committee
Partnership for a Healthier Alexandria
Boys and Girls Club of Alexandria
Washington Area Bicyclist Association
Alexandria Commission on Aging
These Coalition Partners have already taken the pledge:

66
4I WILL DO MY PART TO GET TO ZERO...
These residents, visitors, business owners, and employees have taken the pledge to help the City get to zero traffic deaths and serious injuries by 2028. Will you take the pledge?
Take the Pledge to add your photo
here!
This could be you! Follow these 3 easy
steps...
Step 2: Print and sign your pledge and snap a selfie
Step 1: Read the plan and commit to moving safely
around Alexandria
Step 3: Send your photo to

67
Vision Zero is a data-driven, all-hands-on-deck approach to eliminate ALL traffic deaths and serious injuries. Alexandria's goal is to achieve Vision Zero by 2028 through better data, education, enforcement, and engineering.
Safer streets for Alexandria starts with you. Take the PLEDGE to become a safer driver, bicyclist, and pedestrian and help us achieve Vision Zero.
• I pledge to slow down and observe posted speed limits.
• I pledge to give pedestrians the right of way at all times.
• I pledge to keep my hands on the wheel and my eyes on the road, not my phone.
• I pledge to be aware of people walking and riding their bikes.
• I pledge to never drink and drive.
• I pledge to stop at all red lights and stop signs.
• I pledge to obey the rules of the road when driving, walking, and biking.
• I pledge I will always be responsible for acting safely.
I WILL DO MY PART
TO GET TO
ZEROYOUR NAME

Source: Bob Simmons

Appendices

EXTERNAL REFERENCESA City of Alexandria Guiding Documents
Pedestrian & Bicycle Master Plan – Vision Zero Strategy
Complete Streets Policy Resolution
Vision Zero Policy Resolution
City Strategic Plan
Transportation Master Plan
Complete Streets Design Guidelines
Ped Bike Crash Response Report
APD Traffic Enforcement Plan
Regional ResourcesDC Vision Zero Action Plan
VDOT Strategic Highway Safety Plan
External Resources
Vision Zero Network
NHSTA Resources
FHWA Resources
Source: Evan Michio Cantwell
70

BThe following is a summary of the questions posed to the public during street meetings and in the online survey period.
SUMMARY OF PUBLIC INPUT
1. What is your Zip Code?
71

2. How do you most frequently get around? (Choose up to three)
3. Did you know that Alexandria has adopted a Vision Zero Policy before today?)
BSUMMARY OF PUBLIC INPUT
72
How do you most frequently get around? (Choose up to 3)
0100200300400500600700800 782
712
489
326
146
5824 14 4 3
Walk Personal Car
Metro/Bus
Bicycle Carpool Other Partran-sit
Wheel-chair
Carshare(i.e. zip car, car2go)
Paid Ride (i.e. taxi,
uber, lyft)
Page 20
Did you know that Alexandria had adopted a Vision Zero policy before today? What do you think are the top 3 challenges to
safely moving arpund Alexandria? (Choose 3)Yes No
34%
66%
0 100 200 300 400 500 600 700 800
Distracted drivers
People driving too fast
People running red lights or stop sign
Distracted pedestrians
Drivers not yielding or stopping for people
Poor or blocked views at intersection
Not enough bike lanes or trails
Di�culty crossing the street
Other
Right or left turning vehicles
Confusing street network
Street or sidewalk conditions (potholes,
638
476
284
272
254
230
184
165
159
130
107
95
Page 21
Page 21

4. What do you think are the top three challenges to moving safely around Alexandria?
5. Have you ever been seriously injured in a traffic crash in Alexandria?
73
Did you know that Alexandria had adopted a Vision Zero policy before today? What do you think are the top 3 challenges to
safely moving arpund Alexandria? (Choose 3)Yes No
34%
66%
0 100 200 300 400 500 600 700 800
Distracted drivers
People driving too fast
People running red lights or stop sign
Distracted pedestrians
Drivers not yielding or stopping for people
Poor or blocked views at intersection
Not enough bike lanes or trails
Di�culty crossing the street
Other
Right or left turning vehicles
Confusing street network
Street or sidewalk conditions (potholes,
638
476
284
272
254
230
184
165
159
130
107
95
Page 21
Page 21
How were you getting around when the crash happened?
12
Driving Biking Walking Passenger In a wheelchair
Other
11
8
21 1
What primary factor contributed to the crash
14
7
7
4
4
3
2
1
1
1
1
1
0 3 6 9 12 15
Distracted drivers
People driving too fast
People running red lights or stop sign
Distracted pedestrians
Drivers not yielding or stopping for
Poor or blocked views at intersection
Not enough bike lanes or trails
Driving under the in�uence of alcohol
Someone trying to cross the street
Other
Right or left turning vehicles
Confusing street network
Street or sidewalk conditions (potholes,
Have you ever been seriously injured in a tra�c crash in Alexandria?
Yes No
3%
97%
0
2
4
6
8
10
12
Page 23
Page 23

a. If yes, how were you getting around when the crash happened?
b. What primary factor contributed to the crash?
BSUMMARY OF PUBLIC INPUT
74
How were you getting around when the crash happened?
12
Driving Biking Walking Passenger In a wheelchair
Other
11
8
21 1
What primary factor contributed to the crash
14
7
7
4
4
3
2
1
1
1
1
1
0 3 6 9 12 15
Distracted drivers
People driving too fast
People running red lights or stop sign
Distracted pedestrians
Drivers not yielding or stopping for
Poor or blocked views at intersection
Not enough bike lanes or trails
Driving under the in�uence of alcohol
Someone trying to cross the street
Other
Right or left turning vehicles
Confusing street network
Street or sidewalk conditions (potholes,
Have you ever been seriously injured in a tra�c crash in Alexandria?
Yes No
3%
97%
0
2
4
6
8
10
12
Page 23
Page 23

6. Do you know someone who has been killed or seriously injured in a traffic crash in Alexandria?
a. If yes, how were they getting around when the crash happened?
How were they getting around when the crash happened? What primary factor contributed to the crush?
782
Walking Biking Driving Passenger Other In a wheelchair
7266
885554
2220
19
139
8
76
64
126 0
Do you know someone who has been killed or seriously injured in a tra�c crash in Alexandria?
Yes No
26%
74%
0
20
40
60
80
100
120
0 20 40 60 80 100
Distracted drivers
People driving too fast
People running red lights or stop sign
Distracted pedestrians
Drivers not yielding or stopping for people
Poor or blocked views at intersection
Not enough bike lanes or trails
Driving under the in�uence of alcohol or...
Someone trying to cross the street
Other
Right or left turning vehicles
Confusing street network
Street or sidewalk conditions (potholes, uneven...)
Page 24
Page 24Page 24
75
How were they getting around when the crash happened? What primary factor contributed to the crush?
782
Walking Biking Driving Passenger Other In a wheelchair
7266
885554
2220
19
139
8
76
64
126 0
Do you know someone who has been killed or seriously injured in a tra�c crash in Alexandria?
Yes No
26%
74%
0
20
40
60
80
100
120
0 20 40 60 80 100
Distracted drivers
People driving too fast
People running red lights or stop sign
Distracted pedestrians
Drivers not yielding or stopping for people
Poor or blocked views at intersection
Not enough bike lanes or trails
Driving under the in�uence of alcohol or...
Someone trying to cross the street
Other
Right or left turning vehicles
Confusing street network
Street or sidewalk conditions (potholes, uneven...)
Page 24
Page 24Page 24

b. What primary factor contributed to the crash?BSUMMARY OF PUBLIC INPUT
76
How were they getting around when the crash happened? What primary factor contributed to the crush?
782
Walking Biking Driving Passenger Other In a wheelchair
7266
885554
2220
19
139
8
76
64
126 0
Do you know someone who has been killed or seriously injured in a tra�c crash in Alexandria?
Yes No
26%
74%
0
20
40
60
80
100
120
0 20 40 60 80 100
Distracted drivers
People driving too fast
People running red lights or stop sign
Distracted pedestrians
Drivers not yielding or stopping for people
Poor or blocked views at intersection
Not enough bike lanes or trails
Driving under the in�uence of alcohol or...
Someone trying to cross the street
Other
Right or left turning vehicles
Confusing street network
Street or sidewalk conditions (potholes, uneven...)
Page 24
Page 24Page 24

Income Primary Language Spoken at Home
Gender Identity Age
Demographic Questions
Age
Below 21 21-3030-5050-65Above 65No Answer
43%
12%
11%9%2%
23%
Less than $25k $25-50k$50-75k$75-100k$100-200k$200k+
17%
13%
15%
10%15%
30%
48%
Annual Household Inacome
33%
7%
11%
5% 7%22%
15%
Under 19 20-2425-3435-4950-6465-7475+
Less than $25k $25-50k$50-75k$75-100k$100-200k$200k+No Answer
25%
5%
20%
13%
4%7%
26%
Page 26
77
Race/Ethnicity
African American/Black American Indian/Alaskan NativeAsian/Pacific IslanderCaucasian/WhiteHispanic/LatinoNo Answer
White
Black or African American
American Indian and Alaska NativeAsian
Native Hawaiian orOther Pacific IslanderHispanic or Latino
Other
63%
5%
13%8% 2%9%
68%
6%
4%9%2%
2%
13%
Primary Language
91%
0%
5%EnglishSpanishFrenchAmharicChineseVietnameseKoreanOtherNo Answer
English
Spanish
Other Indo-European Languages
Asian and Pacific Island Languages
Other Languages
56%
7%
14%
3%
1%
19%
2%
Page 27
Age
Below 21 21-3030-5050-65Above 65No Answer
43%
12%
11%9%2%
23%
Less than $25k $25-50k$50-75k$75-100k$100-200k$200k+
17%
13%
15%
10%15%
30%
48%
Annual Household Inacome
33%
7%
11%
5% 7%22%
15%
Under 19 20-2425-3435-4950-6465-7475+
Less than $25k $25-50k$50-75k$75-100k$100-200k$200k+No Answer
25%
5%
20%
13%
4%7%
26%
Page 26
Action Plan 2015 ACSFemale MaleOther Prefer Not to Answer
Female Male
52%
45%
52%
48%
Page 25
2%1%

Race/EthnicityBSUMMARY OF PUBLIC INPUT
78
Race/Ethnicity
African American/Black American Indian/Alaskan NativeAsian/Pacific IslanderCaucasian/WhiteHispanic/LatinoNo Answer
White
Black or African American
American Indian and Alaska NativeAsian
Native Hawaiian orOther Pacific IslanderHispanic or Latino
Other
63%
5%
13%8% 2%9%
68%
6%
4%9%2%
2%
13%
Primary Language
91%
0%
5%EnglishSpanishFrenchAmharicChineseVietnameseKoreanOtherNo Answer
English
Spanish
Other Indo-European Languages
Asian and Pacific Island Languages
Other Languages
56%
7%
14%
3%
1%
19%
2%
Page 27

79
Page intentionally left blank

C GOAL: PROMOTE A CULTURE OF SAFETY
STRATEGIES
80
ACTION ITEMSCOMPLETION TIME FRAME
COSTLEAD
AGENCIESSUPPORT AGENCIES
EXPECTED OUTCOME(S)
Display the safety campaign messages at additional government facilities and on City fleet.
Short-Term (<2 Years) $ DGS ALL Creates safe habits through practice of safe behaviors
Use signs and electronic messaging for PSAs such as related to "campaign" messages.
Short-Term (<2 Years) $ T&ES OCPI Creates safe habits through practice of safe behaviors
Provide handouts for APD to distribute at traffic stops educating the public on safety.
Short-Term (<2 Years) $ T&ES, APD OCPI Creates safe habits through practice of safe behaviors
Develop a program to foster and teach safe driving habits to teen drivers.
Short-Term (<2 Years) $ APDT&ES, APD, OCPI,
ACPSCreates safe habits through practice of safe behaviors - reduce crashes involving
teen drivers
Work with other local governments to develop regional and City-based "campaigns" with messaging that focuses on topic area(s) of importance (e.g. Speeding, Distracted Driving, and Driving Un-der the Influence).
Short-Term (<2 Years) $$ T&ES OCPI Creates safe driving habits through practice of safe behaviors
Increase distribution of safety equipment including bike lights, hel-mets, bells, and reflectors at City events.
Short-Term (<2 Years) $$ T&ES ALL Decreases [severity of] crashes through appropriate use of safety equipment
Increase fines for infractions that result in crash with a pedestrian in a marked crosswalk
Short-Term (<2 Years)
$ CAO APD, T&ES, CMO Reduce pedestrian crashes
Require all Alexandria Police officers to participate in the NHTSA’s pedestrian training for law enforcement
Mid-Term (2-3 Years)
$$ APD T&ES Reduce pedestrian crashes
Reduce driving under the influence through a collaboration with transit, taxi companies, transportation network companies, bar owners and retail outlets, especially targeting hot spot locations.
Mid-Term (2-3 Years)
$$ T&ES APD, OCPI Reduce impaired driving related crashes
Develop data-driven process to determine high crash intersections where red light violations are frequent, and install and rotate maxi-mum allowed automated red light enforcement cameras
Mid-Term (2-3 Years)
$$ T&ES APD Reduce red lighting running crashes
Increase enforcement on roadways with higher speeds and target education campaigns about speeding in these areas (i.e. - mes-sage boards)
Mid-Term (2-3 Years)
$$$ APD T&ES, OCPI Reduce speed related crashes
Regularly deploy high-visibility DUI enforcement in high-priori-ty areas on nights with higher concentrations of severe and fatal crashes and major community events
Mid-Term (2-3 Years)
$$$ APD T&ES, OCPI Reduce impaired driving related crashes
Increase the number of crossing guards at schools through a vol-unteer training program
Mid-Term (2-3 Years)
SS APD ACPS, T&ES Reduce pedestrian crashes near schools

81
ACTION ITEMSCOMPLETION TIME FRAME
COSTLEAD
AGENCIESSUPPORT AGENCIES
EXPECTED OUTCOME(S)
Display the safety campaign messages at additional government facilities and on City fleet.
Short-Term (<2 Years) $ DGS ALL Creates safe habits through practice of safe behaviors
Use signs and electronic messaging for PSAs such as related to "campaign" messages.
Short-Term (<2 Years) $ T&ES OCPI Creates safe habits through practice of safe behaviors
Provide handouts for APD to distribute at traffic stops educating the public on safety.
Short-Term (<2 Years) $ T&ES, APD OCPI Creates safe habits through practice of safe behaviors
Develop a program to foster and teach safe driving habits to teen drivers.
Short-Term (<2 Years) $ APDT&ES, APD, OCPI,
ACPSCreates safe habits through practice of safe behaviors - reduce crashes involving
teen drivers
Work with other local governments to develop regional and City-based "campaigns" with messaging that focuses on topic area(s) of importance (e.g. Speeding, Distracted Driving, and Driving Un-der the Influence).
Short-Term (<2 Years) $$ T&ES OCPI Creates safe driving habits through practice of safe behaviors
Increase distribution of safety equipment including bike lights, hel-mets, bells, and reflectors at City events.
Short-Term (<2 Years) $$ T&ES ALL Decreases [severity of] crashes through appropriate use of safety equipment
Increase fines for infractions that result in crash with a pedestrian in a marked crosswalk
Short-Term (<2 Years)
$ CAO APD, T&ES, CMO Reduce pedestrian crashes
Require all Alexandria Police officers to participate in the NHTSA’s pedestrian training for law enforcement
Mid-Term (2-3 Years)
$$ APD T&ES Reduce pedestrian crashes
Reduce driving under the influence through a collaboration with transit, taxi companies, transportation network companies, bar owners and retail outlets, especially targeting hot spot locations.
Mid-Term (2-3 Years)
$$ T&ES APD, OCPI Reduce impaired driving related crashes
Develop data-driven process to determine high crash intersections where red light violations are frequent, and install and rotate maxi-mum allowed automated red light enforcement cameras
Mid-Term (2-3 Years)
$$ T&ES APD Reduce red lighting running crashes
Increase enforcement on roadways with higher speeds and target education campaigns about speeding in these areas (i.e. - mes-sage boards)
Mid-Term (2-3 Years)
$$$ APD T&ES, OCPI Reduce speed related crashes
Regularly deploy high-visibility DUI enforcement in high-priori-ty areas on nights with higher concentrations of severe and fatal crashes and major community events
Mid-Term (2-3 Years)
$$$ APD T&ES, OCPI Reduce impaired driving related crashes
Increase the number of crossing guards at schools through a vol-unteer training program
Mid-Term (2-3 Years)
SS APD ACPS, T&ES Reduce pedestrian crashes near schools

CSTRATEGIES
82
ACTION ITEMSCOMPLETION TIME FRAME
COSTLEAD
AGENCIESSUPPORT AGENCIES
EXPECTED OUTCOME(S)
Develop a network of "civic partners" who pledge to support Vision Zero through the dissemination of safety and educational information to their networks.
Short-Term (<2 Years)
$ T&ES ALLA strong network of partners who can convey Vision Zero messag-es to the public. More people are aware of and interested in Vision
Zero.
Develop a network of "Coalition Partners" who pledge to support Vision Zero through implementation of one or more action items.
Short-Term (<2 Years)
$ T&ES ALLCity agencies are supported by a strong network of partners to im-
plement action items.
Form interdepartmental subgroups of Vision Zero Stakeholders as necessary, to ensure successful implementation of the plan.
Short-Term (<2 Years)
$ T&ES ALL Regular meetings are established for VZ subgroups.
Initiate a regional Vision Zero Task force to identify path toward regional Vision Zero Policy.
Mid-Term (2-3 Years)
$ T&ES ALLUse regional strategies and data to help move toward ZERO with
future efforts
Continue and enhance recognition programs for safe driving of school buses, transit, and City fleet vehicles.
Short-Term (<2 Years)
$ACPS, DASH,
DGST&ES, RPCA,
OCPIHeighten importance of safety for fleet drivers and improve driver
habits through practice of safe behaviors
Add Vision Zero education to defensive driving courses to training for all City employees receiving fleet driving permissions. Require employees to update this training certifications every 2 years.
Mid-Term (2-3 Years)
$ DGST&ES, RPCA,
OCPIReduce crashes for City employees and improve driver habits
through practice of safe behaviors
Develop walking and biking curriculum for elementary school stu-dents (ACPS SRTS Coordinator).
Mid-Term (2-3 Years)
$ ACPS T&ES Reduce pedestrian and bicycling crashes involving youth
Use City fleet to communicate safety messages to the public.Short-Term (<2 Years)
$ DGST&ES, RPCA, APD, AFD,
OCPI, DASHMore people are aware of and interested in Vision Zero
Maintain a comprehensive website to provide information on the projects, programs, and progress of Vision Zero to include dash-board and annual reports.
Short-Term (<2 Years)
$ T&ES OCPI, OPA More people are aware of and interested in Vision Zero
Utilize social media to share information and promote dialog.Short-Term (<2 Years)
$ OCPI T&ES More people are aware of and interested in Vision Zero
Provide Vision Zero logo, goal, and message on back of parking receipts and City email signatures.
Short-Term (<2 Years)
$ T&ES OCPI More people are aware of and interested in Vision Zero
Work with media partners to more accurately report traffic crash-es to avoid victim-blaming, and report crashes in the context of Vision Zero.
Short-Term (<2 Years)
$ OCPI T&ESMedia reports accurately report traffic crashes and avoid vic-
tim-blaming and use of "accident". More people are aware of and interested in Vision Zero.

83
ACTION ITEMSCOMPLETION TIME FRAME
COSTLEAD
AGENCIESSUPPORT AGENCIES
EXPECTED OUTCOME(S)
Develop a network of "civic partners" who pledge to support Vision Zero through the dissemination of safety and educational information to their networks.
Short-Term (<2 Years)
$ T&ES ALLA strong network of partners who can convey Vision Zero messag-es to the public. More people are aware of and interested in Vision
Zero.
Develop a network of "Coalition Partners" who pledge to support Vision Zero through implementation of one or more action items.
Short-Term (<2 Years)
$ T&ES ALLCity agencies are supported by a strong network of partners to im-
plement action items.
Form interdepartmental subgroups of Vision Zero Stakeholders as necessary, to ensure successful implementation of the plan.
Short-Term (<2 Years)
$ T&ES ALL Regular meetings are established for VZ subgroups.
Initiate a regional Vision Zero Task force to identify path toward regional Vision Zero Policy.
Mid-Term (2-3 Years)
$ T&ES ALLUse regional strategies and data to help move toward ZERO with
future efforts
Continue and enhance recognition programs for safe driving of school buses, transit, and City fleet vehicles.
Short-Term (<2 Years)
$ACPS, DASH,
DGST&ES, RPCA,
OCPIHeighten importance of safety for fleet drivers and improve driver
habits through practice of safe behaviors
Add Vision Zero education to defensive driving courses to training for all City employees receiving fleet driving permissions. Require employees to update this training certifications every 2 years.
Mid-Term (2-3 Years)
$ DGST&ES, RPCA,
OCPIReduce crashes for City employees and improve driver habits
through practice of safe behaviors
Develop walking and biking curriculum for elementary school stu-dents (ACPS SRTS Coordinator).
Mid-Term (2-3 Years)
$ ACPS T&ES Reduce pedestrian and bicycling crashes involving youth
Use City fleet to communicate safety messages to the public.Short-Term (<2 Years)
$ DGST&ES, RPCA, APD, AFD,
OCPI, DASHMore people are aware of and interested in Vision Zero
Maintain a comprehensive website to provide information on the projects, programs, and progress of Vision Zero to include dash-board and annual reports.
Short-Term (<2 Years)
$ T&ES OCPI, OPA More people are aware of and interested in Vision Zero
Utilize social media to share information and promote dialog.Short-Term (<2 Years)
$ OCPI T&ES More people are aware of and interested in Vision Zero
Provide Vision Zero logo, goal, and message on back of parking receipts and City email signatures.
Short-Term (<2 Years)
$ T&ES OCPI More people are aware of and interested in Vision Zero
Work with media partners to more accurately report traffic crash-es to avoid victim-blaming, and report crashes in the context of Vision Zero.
Short-Term (<2 Years)
$ OCPI T&ESMedia reports accurately report traffic crashes and avoid vic-
tim-blaming and use of "accident". More people are aware of and interested in Vision Zero.

C GOAL: BUILD SAFE STREETS FOR EVERYONE
STRATEGIES
84
ACTION ITEMSCOMPLETION TIME FRAME
COSTLEAD
AGENCIESSUPPORT AGENCIES
EXPECTED OUTCOME(S)
Incorporate Vision Zero data and recommendations into Transpor-tation elements of future Small Area Plans.
Short-Term (<2 Years)
$ P&Z T&ES Reduce crashes
Use the data that identifies high KSI crash corridors and inter-sections to help prioritize engineering and education efforts, and require comprehensive safety improvements when designing these corridors and intersections.
Short-Term (<2 Years)
$ T&ES Reduce crashes
Update the Streets and Transit Chapters of the Transportation Master Plan to prioritize the reduction of KSI crashes and elevate crash data as a priority in decision-making.
Mid-Term (2-3 Years)
$ T&ES Reduce crashes
Develop neighborhood slow zone program with selection crite-ria, a request process, and launch an application-based program, through engineering and design improvements to reduce vehicle speeds.
Mid-Term (2-3 Years)
$$$ T&ES APD Reduce speed related crashes
When new public school facilities open or relocate to a new site, ensure appropriate agencies continue to work together to devel-op a transportation plan that prioritized safey for the new school facility.
Long-Term (4-5 Years)
$$$ T&ES P&Z, ACPS Reduce crashes with Youth
Explore a Citywide 25mph speed limit.Short-Term (<2 Years)
$$ T&ES APD Reduce crashes
Identify criteria for installation of "No Right on Red" and LPIs for intersections and outline process for implementing changes.
Short-Term (<2 Years)
$ T&ES Reduce crashes
Reduce delivery timelines for safety improvements by implement-ing near-term, temporary treatments for priority Pedestrian & Bicycle Master Plan and Safe Routes to School engineering recom-mendations.
Short-Term (<2 Years)
$$ T&ES ACPS Reduce crashes with Youth / Education of Engineering Improve-
ments / Expedited Project Delivery
Develop pedestrian safety criteria for transit stations, apply these to City transit stations, and develop a plan to implement safety improvements at the most critical stations first.
Long-Term (4-5 Years)
$$$ T&ES DASH, OHR, GIS Reduce crashes for transit riders
Use most recent crash data to continually prioritize implementa-tion of recommendations from Pedestrian & Bicycle Master Plan.
Long-Term (4-5 Years)
$$$ T&ES Reduce crashes

85
ACTION ITEMSCOMPLETION TIME FRAME
COSTLEAD
AGENCIESSUPPORT AGENCIES
EXPECTED OUTCOME(S)
Incorporate Vision Zero data and recommendations into Transpor-tation elements of future Small Area Plans.
Short-Term (<2 Years)
$ P&Z T&ES Reduce crashes
Use the data that identifies high KSI crash corridors and inter-sections to help prioritize engineering and education efforts, and require comprehensive safety improvements when designing these corridors and intersections.
Short-Term (<2 Years)
$ T&ES Reduce crashes
Update the Streets and Transit Chapters of the Transportation Master Plan to prioritize the reduction of KSI crashes and elevate crash data as a priority in decision-making.
Mid-Term (2-3 Years)
$ T&ES Reduce crashes
Develop neighborhood slow zone program with selection crite-ria, a request process, and launch an application-based program, through engineering and design improvements to reduce vehicle speeds.
Mid-Term (2-3 Years)
$$$ T&ES APD Reduce speed related crashes
When new public school facilities open or relocate to a new site, ensure appropriate agencies continue to work together to devel-op a transportation plan that prioritized safey for the new school facility.
Long-Term (4-5 Years)
$$$ T&ES P&Z, ACPS Reduce crashes with Youth
Explore a Citywide 25mph speed limit.Short-Term (<2 Years)
$$ T&ES APD Reduce crashes
Identify criteria for installation of "No Right on Red" and LPIs for intersections and outline process for implementing changes.
Short-Term (<2 Years)
$ T&ES Reduce crashes
Reduce delivery timelines for safety improvements by implement-ing near-term, temporary treatments for priority Pedestrian & Bicycle Master Plan and Safe Routes to School engineering recom-mendations.
Short-Term (<2 Years)
$$ T&ES ACPS Reduce crashes with Youth / Education of Engineering Improve-
ments / Expedited Project Delivery
Develop pedestrian safety criteria for transit stations, apply these to City transit stations, and develop a plan to implement safety improvements at the most critical stations first.
Long-Term (4-5 Years)
$$$ T&ES DASH, OHR, GIS Reduce crashes for transit riders
Use most recent crash data to continually prioritize implementa-tion of recommendations from Pedestrian & Bicycle Master Plan.
Long-Term (4-5 Years)
$$$ T&ES Reduce crashes

C GOAL: IMPROVE DATA COLLECTION AND EVALUATION
STRATEGIES
86
ACTION ITEMSCOMPLETION TIME FRAME
COSTLEAD
AGENCIESSUPPORT AGENCIES
EXPECTED OUTCOME(S)
Continue building and expanding and electronic citation da-tabase pending funding and resources.
Short-Term (<2 Years)
$ APD T&ES, OPAEnsure continued progress toward goals. Allow the public to hold the
City accountable.
Work with VDOT and State Pedestrian Task Force to revise crash reporting standards and information captured to bet-ter inform data analysis leading to projects and programs.
Short-Term (<2 Years)
$ T&ES APD, OPA Better data will inform future strategies
Investigate extent of pedestrians crashes not reconciled with Fire & EMS data and AHD report.
Short-Term (<2 Years)
$T&ES, AFD,
AHDAPD, OPA Better data will inform future strategies
Standardize and establish definitions and training on crash reporting methods.
Short-Term (<2 Years)
$ APD T&ES Better data will inform future strategies
Improve existing Multi-department Response Team for all KSI crashes and develop T&ES crash form to document con-tributing crash factors related to street design.
Short-Term (<2 Years)
$ APD, T&ES Improve data on street design's effect on a crash
Investigate extent of drug related KSIs.Short-Term (<2 Years)
$$ APD T&ES Better data will inform future strategies
Continue existing and inverstigate new opportunities for partnerships with universities, technology companies, and researchers to develop a comprehensive traffic crash predic-tion and traffic exposure model.
Long-Term (4-5 Years)
$ T&ES APD, GISBetter data will inform future strategies. Traffic crash prediction mod-els and traffic exposure models will allow City to safer better streets.
Identify gaps in data in order to identify on-call data collec-tion contracts that will help us more efficiently obtain data.
Short-Term (<2 Years)
$ T&ES Better data will inform future strategies
Increase opportunities for interns and students to conduct research, compile data and assist city with evaluation of pro-grams.
Short-Term (<2 Years)
$ T&ES Better data will inform future strategies
Create standard data evaluation template to track before and after studies of all Complete Streets projects.
Short-Term (<2 Years)
$$ T&ES Reduce crashes through proven design
Publish an annual report card on the progress of Vision Zero each fall, present it to the Transportation Commission, and publish it on the Vision Zero website.
Short-Term (<2 Years)
$ T&ES ALL Ensure continued progress toward goals

GOAL: IMPROVE DATA COLLECTION AND EVALUATION
87
ACTION ITEMSCOMPLETION TIME FRAME
COSTLEAD
AGENCIESSUPPORT AGENCIES
EXPECTED OUTCOME(S)
Continue building and expanding and electronic citation da-tabase pending funding and resources.
Short-Term (<2 Years)
$ APD T&ES, OPAEnsure continued progress toward goals. Allow the public to hold the
City accountable.
Work with VDOT and State Pedestrian Task Force to revise crash reporting standards and information captured to bet-ter inform data analysis leading to projects and programs.
Short-Term (<2 Years)
$ T&ES APD, OPA Better data will inform future strategies
Investigate extent of pedestrians crashes not reconciled with Fire & EMS data and AHD report.
Short-Term (<2 Years)
$T&ES, AFD,
AHDAPD, OPA Better data will inform future strategies
Standardize and establish definitions and training on crash reporting methods.
Short-Term (<2 Years)
$ APD T&ES Better data will inform future strategies
Improve existing Multi-department Response Team for all KSI crashes and develop T&ES crash form to document con-tributing crash factors related to street design.
Short-Term (<2 Years)
$ APD, T&ES Improve data on street design's effect on a crash
Investigate extent of drug related KSIs.Short-Term (<2 Years)
$$ APD T&ES Better data will inform future strategies
Continue existing and inverstigate new opportunities for partnerships with universities, technology companies, and researchers to develop a comprehensive traffic crash predic-tion and traffic exposure model.
Long-Term (4-5 Years)
$ T&ES APD, GISBetter data will inform future strategies. Traffic crash prediction mod-els and traffic exposure models will allow City to safer better streets.
Identify gaps in data in order to identify on-call data collec-tion contracts that will help us more efficiently obtain data.
Short-Term (<2 Years)
$ T&ES Better data will inform future strategies
Increase opportunities for interns and students to conduct research, compile data and assist city with evaluation of pro-grams.
Short-Term (<2 Years)
$ T&ES Better data will inform future strategies
Create standard data evaluation template to track before and after studies of all Complete Streets projects.
Short-Term (<2 Years)
$$ T&ES Reduce crashes through proven design
Publish an annual report card on the progress of Vision Zero each fall, present it to the Transportation Commission, and publish it on the Vision Zero website.
Short-Term (<2 Years)
$ T&ES ALL Ensure continued progress toward goals

CSTRATEGIES
88
ACTION ITEMSCOMPLETION TIME FRAME
COSTLEAD
AGENCIESSUPPORT AGENCIES
EXPECTED OUTCOME(S)
Provide annual citation data for infractions that potentially lead to serious injuries and deaths.
Short-Term (<2 Years)
$ APD T&ES, OPAContinued data monitoring to inform future strategies Data will allow for tracking the impact of certain strategies while providing data on
root cause for some crashes
Establish dashboard for all crash and safety data on the Vi-sion Zero website.
Short-Term (<2 Years)
$$ OPAT&ES, APD, OCPI, GIS
Ensure continued progress toward goals. Allow the public to hold the City accountable.
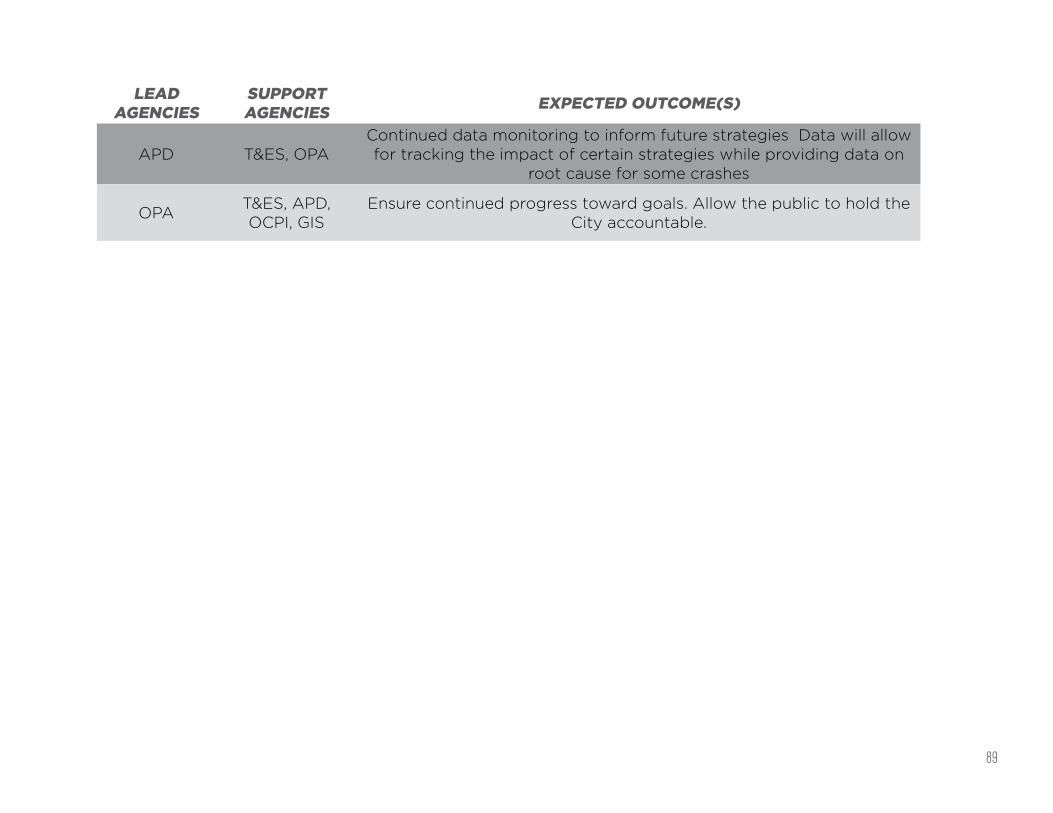
89
ACTION ITEMSCOMPLETION TIME FRAME
COSTLEAD
AGENCIESSUPPORT AGENCIES
EXPECTED OUTCOME(S)
Provide annual citation data for infractions that potentially lead to serious injuries and deaths.
Short-Term (<2 Years)
$ APD T&ES, OPAContinued data monitoring to inform future strategies Data will allow for tracking the impact of certain strategies while providing data on
root cause for some crashes
Establish dashboard for all crash and safety data on the Vi-sion Zero website.
Short-Term (<2 Years)
$$ OPAT&ES, APD, OCPI, GIS
Ensure continued progress toward goals. Allow the public to hold the City accountable.

CSTRATEGIES
90
GOAL: ENHANCE CITY PROCESSES AND COLLABORATION
ACTION ITEMSCOMPLETION TIME FRAME
COSTLEAD
AGENCIESSUPPORT AGENCIES
EXPECTED OUTCOME(S)
Develop system to track, manage, respond to, and prioritize resident and customer requests for safety improvements.
Short-Term (<2 Years)
$ T&ES OCPI Reduce crashes
Support work with courts to create graduated penalties for repeat offenders
Short-Term (<2 Years)
$ CAO T&ES, APD, CMO Reduce crashes amongst repeat offenders
Evaluate Traffic & Parking Board charter and recommend re-visions to make traffic safety a primary focus of the Board.
Short-Term (<2 Years)
$ T&ES CMO, CAO, APD Expedite approval and implementation of traffic safety projects
Encourage and promote national and regional senior driving education programs, such as the "We Need to Talk" pro-gram
Short-Term (<2 Years)
$ T&ES OCPI Reduce crashes with seniors
Evaluate Maintenance of Traffic (MOT) Plan requirements and revise to prioritize safe, accessible, and convenient routes for bicyclists and pedestrians. Enforce MOT plans in work zones.
Short-Term (<2 Years)
$ T&ES P&Z Reduce crashes for pedestrians, bicyclists, and disabled
Evaluate City laws and ordinances to identify revisions to improve safety for all modes
Short-Term (<2 Years)
$$ T&ES CMO, CAO, APD Reduce crashes
Support statewide efforts to reform Driving Under the In-fluence (DUI) standards related to Blood Alcohol Content, arrest and adjudication process, and repeat offenders.
Mid-Term (2-3 Years)
$ CMO CAO, APD, T&ES Reduce impaired driving related crashes
Pursue and support state legislation to allow the use of fixed automated enforcement cameras for speed violations
Mid-Term (2-3 Years)
$ CMO CAO, APD, T&ES Reduce speed related crashes
Support statewide efforts to revise distracted driving laws, including increase of fines.
Mid-Term (2-3 Years)
$ CMO CAO, APD, T&ES Reduce crashes due to distracted driving
Pursue and support state legislation to require drivers to stop, rather than yield, for pedestrians in the crosswalk
Mid-Term (2-3 Years)
$ CMO CAO, APD, T&ES Reduce pedestrian crashes

91
GOAL: ENHANCE CITY PROCESSES AND COLLABORATION
ACTION ITEMSCOMPLETION TIME FRAME
COSTLEAD
AGENCIESSUPPORT AGENCIES
EXPECTED OUTCOME(S)
Develop system to track, manage, respond to, and prioritize resident and customer requests for safety improvements.
Short-Term (<2 Years)
$ T&ES OCPI Reduce crashes
Support work with courts to create graduated penalties for repeat offenders
Short-Term (<2 Years)
$ CAO T&ES, APD, CMO Reduce crashes amongst repeat offenders
Evaluate Traffic & Parking Board charter and recommend re-visions to make traffic safety a primary focus of the Board.
Short-Term (<2 Years)
$ T&ES CMO, CAO, APD Expedite approval and implementation of traffic safety projects
Encourage and promote national and regional senior driving education programs, such as the "We Need to Talk" pro-gram
Short-Term (<2 Years)
$ T&ES OCPI Reduce crashes with seniors
Evaluate Maintenance of Traffic (MOT) Plan requirements and revise to prioritize safe, accessible, and convenient routes for bicyclists and pedestrians. Enforce MOT plans in work zones.
Short-Term (<2 Years)
$ T&ES P&Z Reduce crashes for pedestrians, bicyclists, and disabled
Evaluate City laws and ordinances to identify revisions to improve safety for all modes
Short-Term (<2 Years)
$$ T&ES CMO, CAO, APD Reduce crashes
Support statewide efforts to reform Driving Under the In-fluence (DUI) standards related to Blood Alcohol Content, arrest and adjudication process, and repeat offenders.
Mid-Term (2-3 Years)
$ CMO CAO, APD, T&ES Reduce impaired driving related crashes
Pursue and support state legislation to allow the use of fixed automated enforcement cameras for speed violations
Mid-Term (2-3 Years)
$ CMO CAO, APD, T&ES Reduce speed related crashes
Support statewide efforts to revise distracted driving laws, including increase of fines.
Mid-Term (2-3 Years)
$ CMO CAO, APD, T&ES Reduce crashes due to distracted driving
Pursue and support state legislation to require drivers to stop, rather than yield, for pedestrians in the crosswalk
Mid-Term (2-3 Years)
$ CMO CAO, APD, T&ES Reduce pedestrian crashes
VISION ZEROCOVER


![[Michio kaku] parallel_worlds_a_journey_through_c(bookos.org)](https://img.pdfslide.us/doc/110x75/55494a83b4c905144d8b5a63/michio-kaku-parallelworldsajourneythroughcbookosorg.jpg)