Embed Size (px)
Citation preview
ACT Profile Report - State
Graduating Class 2014
Oklahoma
ACT, INC. -- CONFIDENTIAL*070071110*

ACT PROFILE REPORT - State PAGE 1
Graduating Class 2014 Code 379999
Oklahoma
Total Students in Report: 28,682
Table of Contents
Section I: Executive Summary Page 5Percent of Your Students Ready for College-Level Coursework
Five Year Trends—Percent of Students Who Met College Readiness Benchmarks
Five Year Trends—Average ACT Scores
Five Year Trends—Average ACT Scores by Level of Preparation
Five Year Trends—Percent and Average Composite Score by Race/Ethnicity
Percent of Students in College Readiness Standards Score Ranges
Average ACT College Reportable Scores by Test Session Duration
Percent of Students Who Met College Readiness Benchmark Scores by Test Session Duration
Section II: Academic Achievement Page 11ACT Score Distributions, Cumulative Percentages, Averages, and Quartile Values
Average ACT Composite Scores for Race/Ethnicity by Level of Preparation
Average ACT Scores by Race/Ethnicity
Percent of Students in College Readiness Standards Score Ranges
Average ACT Scores by Gender
Percent of Students Who Met College Readiness Benchmark Scores by Gender
College Readiness Benchmark Percent and Average ACT Scores by Overall High School Curriculum
College Readiness Benchmark Percent and Average ACT Scores by Content-Specific Curriculum
Section III: College Readiness & Impact of Course Rigor Page 17Percent of Students Who Met ACT College Readiness Benchmark Scores by Race/Ethnicity
Average ACT Scores and Average ACT Score Changes by Common Course Patterns
College Readiness Percents by Common Course Patterns
Section IV: Career and Educational Aspirations Page 25Distribution of Planned Educational Majors for All Students by College Plans
Average ACT Composite Scores for Racial/Ethnic Groups by Post-Secondary Educational Aspirations
Students' Score Report Preferences at Time of Testing
Section V: Optional Writing Test Results Page 29Average ACT English and Writing Scores by Race/Ethnicity and Gender for students who took ACT Writing
ACT PROFILE REPORT - State PAGE 2
Graduating Class 2014 Code 379999
Oklahoma
Total Students in Report: 28,682
This report focuses on:
Performance - student test performance in the context of college readiness
Access - number of your graduates exposed to college entrance testing and the percent of race/ethnicity participation
Course Selection - percent of students pursuing a core curriculum
Course Rigor - impact of rigorous coursework on achievement
College Readiness - percent of students meeting ACT College Readiness Benchmark Scores in each content area
Awareness - extent to which student aspirations match performance
Articulation - colleges and universities to which your students send test results
This report provides information about the performance of your 2014 graduating seniors who took the ACT as sophomores,
juniors, or seniors; and self-reported at the time of testing that they were scheduled to graduate in 2014. Beginning with the
Graduating Class of 2013, all students whose scores are college reportable, both standard and extended time tests, are now
included in the report.
Each year, test data for a school, district, and the state represents a different cohort of students. ACT encourages educators
to focus on trends (3, 5, 10 years), not year-to-year changes. Such changes can represent normal – even expected –
fluctuations. On the other hand, trend lines offer more insight into what is happening in a school, district, or the state.
Furthermore, ACT encourages educators to measure student performance in the context of college readiness measures. The
focus should be on the number and percentage of students who met or exceeded ACT’s College Readiness Benchmark
Scores, a measure that is much more meaningful and understandable than an average composite score for a group of
students.
ACT PROFILE REPORT - State PAGE 3
Graduating Class 2014 Code 379999
Oklahoma
Total Students in Report: 28,682
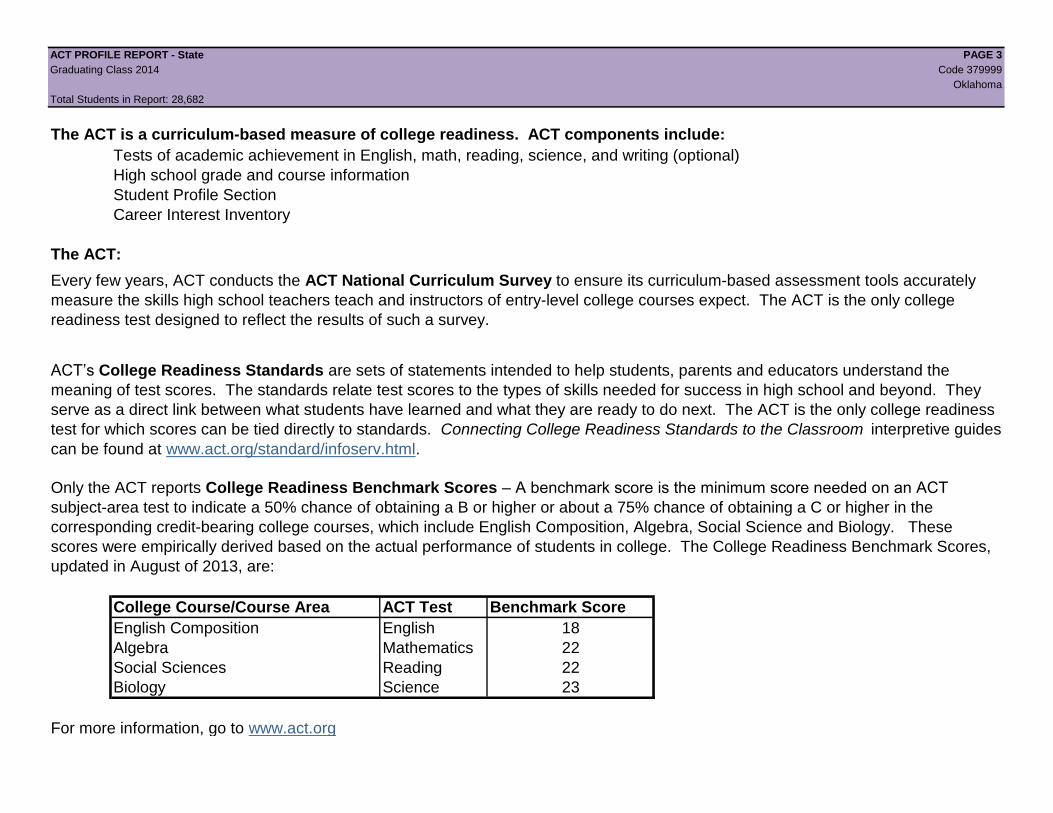
The ACT is a curriculum-based measure of college readiness. ACT components include:
Tests of academic achievement in English, math, reading, science, and writing (optional)
High school grade and course information
Student Profile Section
Career Interest Inventory
The ACT:
College Course/Course Area ACT Test Benchmark Score
English Composition English 18
Algebra Mathematics 22
Social Sciences Reading 22
Biology Science 23
For more information, go to www.act.org
Every few years, ACT conducts the ACT National Curriculum Survey to ensure its curriculum-based assessment tools accurately
measure the skills high school teachers teach and instructors of entry-level college courses expect. The ACT is the only college
readiness test designed to reflect the results of such a survey.
Only the ACT reports College Readiness Benchmark Scores – A benchmark score is the minimum score needed on an ACT
subject-area test to indicate a 50% chance of obtaining a B or higher or about a 75% chance of obtaining a C or higher in the
corresponding credit-bearing college courses, which include English Composition, Algebra, Social Science and Biology. These
scores were empirically derived based on the actual performance of students in college. The College Readiness Benchmark Scores,
updated in August of 2013, are:
ACT’s College Readiness Standards are sets of statements intended to help students, parents and educators understand the
meaning of test scores. The standards relate test scores to the types of skills needed for success in high school and beyond. They
serve as a direct link between what students have learned and what they are ready to do next. The ACT is the only college readiness
test for which scores can be tied directly to standards. Connecting College Readiness Standards to the Classroom interpretive guides
can be found at www.act.org/standard/infoserv.html.
ACT PROFILE REPORT - State PAGE 4
Graduating Class 2014 Code 379999
Oklahoma
Total Students in Report: 28,682
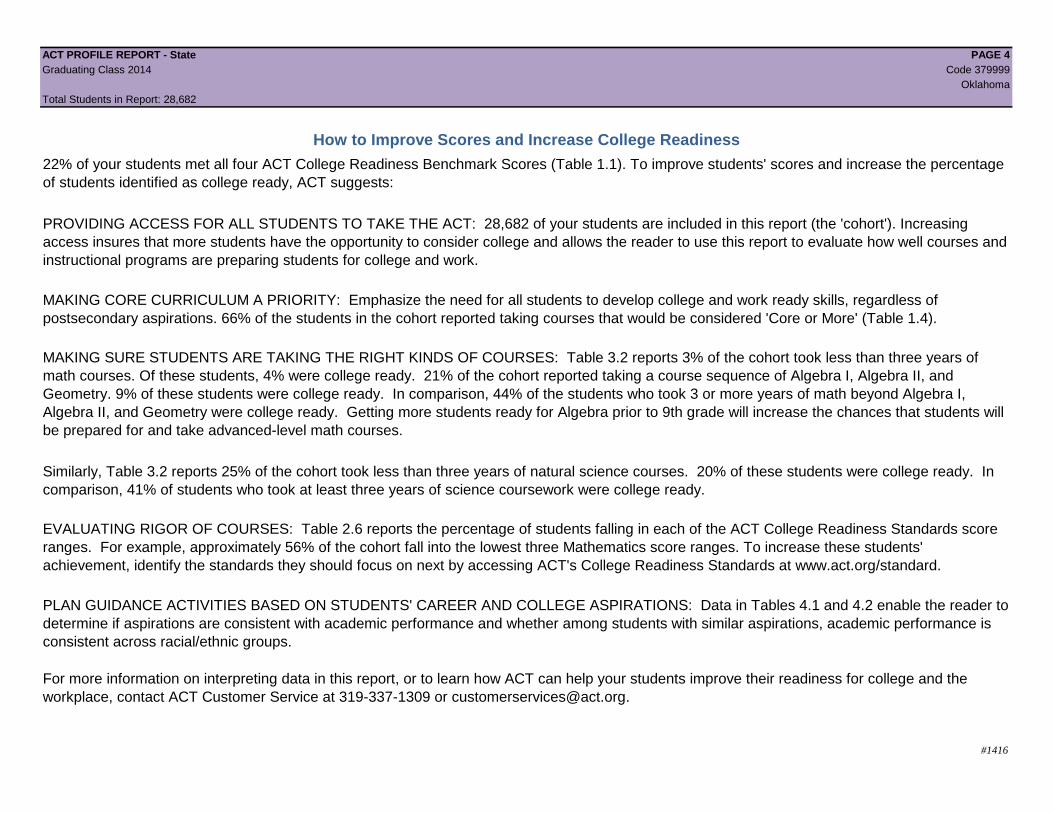
How to Improve Scores and Increase College Readiness
#1416
For more information on interpreting data in this report, or to learn how ACT can help your students improve their readiness for college and the
workplace, contact ACT Customer Service at 319-337-1309 or [email protected].
PLAN GUIDANCE ACTIVITIES BASED ON STUDENTS' CAREER AND COLLEGE ASPIRATIONS: Data in Tables 4.1 and 4.2 enable the reader to
determine if aspirations are consistent with academic performance and whether among students with similar aspirations, academic performance is
consistent across racial/ethnic groups.
EVALUATING RIGOR OF COURSES: Table 2.6 reports the percentage of students falling in each of the ACT College Readiness Standards score
ranges. For example, approximately 56% of the cohort fall into the lowest three Mathematics score ranges. To increase these students'
achievement, identify the standards they should focus on next by accessing ACT's College Readiness Standards at www.act.org/standard.
22% of your students met all four ACT College Readiness Benchmark Scores (Table 1.1). To improve students' scores and increase the percentage
of students identified as college ready, ACT suggests:
PROVIDING ACCESS FOR ALL STUDENTS TO TAKE THE ACT: 28,682 of your students are included in this report (the 'cohort'). Increasing
access insures that more students have the opportunity to consider college and allows the reader to use this report to evaluate how well courses and
instructional programs are preparing students for college and work.
MAKING CORE CURRICULUM A PRIORITY: Emphasize the need for all students to develop college and work ready skills, regardless of
postsecondary aspirations. 66% of the students in the cohort reported taking courses that would be considered 'Core or More' (Table 1.4).
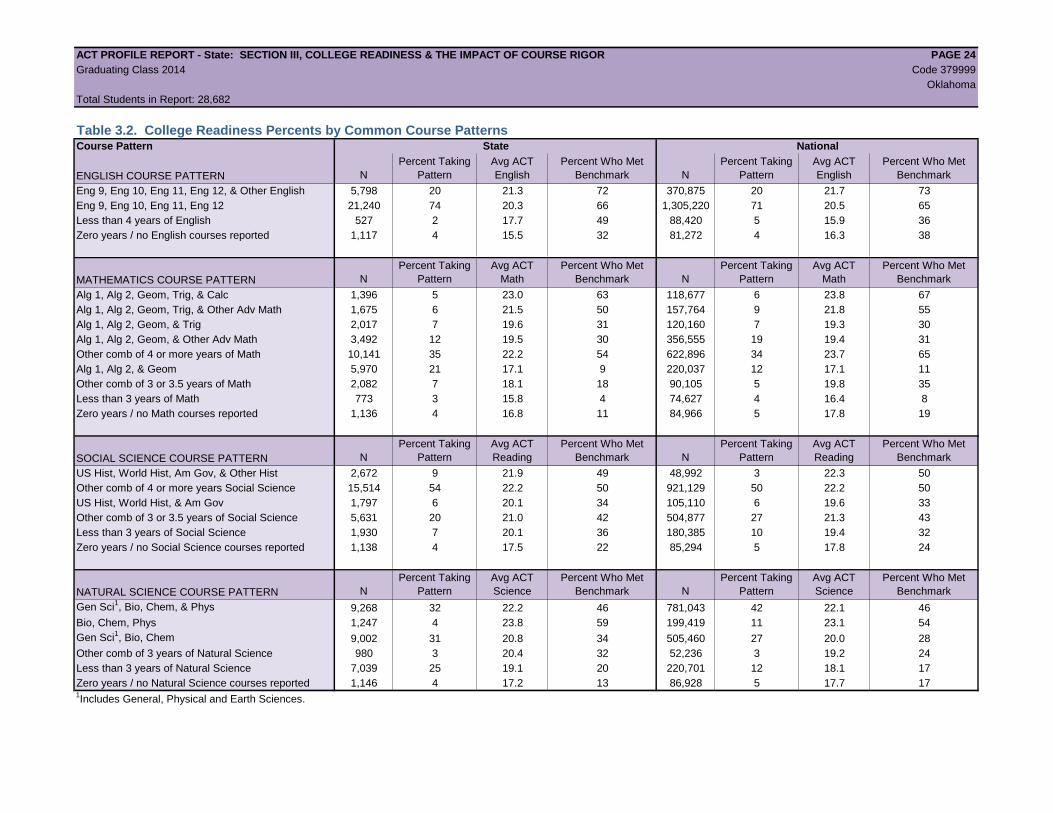
MAKING SURE STUDENTS ARE TAKING THE RIGHT KINDS OF COURSES: Table 3.2 reports 3% of the cohort took less than three years of
math courses. Of these students, 4% were college ready. 21% of the cohort reported taking a course sequence of Algebra I, Algebra II, and
Geometry. 9% of these students were college ready. In comparison, 44% of the students who took 3 or more years of math beyond Algebra I,
Algebra II, and Geometry were college ready. Getting more students ready for Algebra prior to 9th grade will increase the chances that students will
be prepared for and take advanced-level math courses.
Similarly, Table 3.2 reports 25% of the cohort took less than three years of natural science courses. 20% of these students were college ready. In
comparison, 41% of students who took at least three years of science coursework were college ready.
ACT PROFILE REPORT - State: SECTION I, EXECUTIVE SUMMARY PAGE 5
Graduating Class 2014 Code 379999
Oklahoma
Total Students in Report: 28,682
Section I
Executive Summary
To find the results of only standard time or extended time test takers, refer to Tables 1.7 and 1.8 on page 10.
Beginning in August of 2013, all students whose scores are college reportable, both standard and extended time tests, are now included.
Also beginning in August 2013 Graduating Class data, College Readiness Benchmarks for Reading and Science were updated to reflect the most recent
college coursework research.
ACT PROFILE REPORT - State: SECTION I, EXECUTIVE SUMMARY PAGE 6
Graduating Class 2014 Code 379999
Oklahoma
Total Students in Report: 28,682
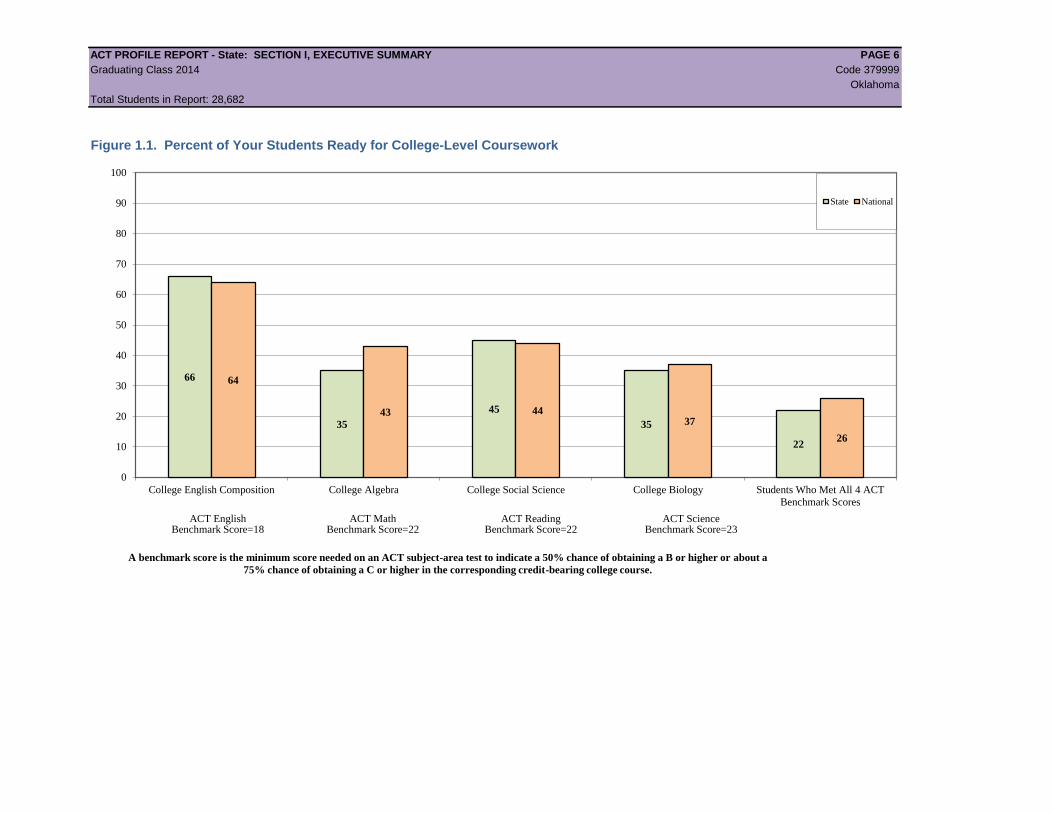
Figure 1.1. Percent of Your Students Ready for College-Level Coursework
66
35
45
35
22
64
43 44 37
26
0
10
20
30
40
50
60
70
80
90
100
College English Composition College Algebra College Social Science College Biology Students Who Met All 4 ACT
Benchmark Scores
A benchmark score is the minimum score needed on an ACT subject-area test to indicate a 50% chance of obtaining a B or higher or about a
75% chance of obtaining a C or higher in the corresponding credit-bearing college course.
State National
ACT English Benchmark Score=18
ACT Math Benchmark Score=22
ACT Reading Benchmark Score=22
ACT Science Benchmark Score=23
ACT PROFILE REPORT - State: SECTION I, EXECUTIVE SUMMARY PAGE 7
Graduating Class 2014 Code 379999
Oklahoma
Total Students in Report: 28,682
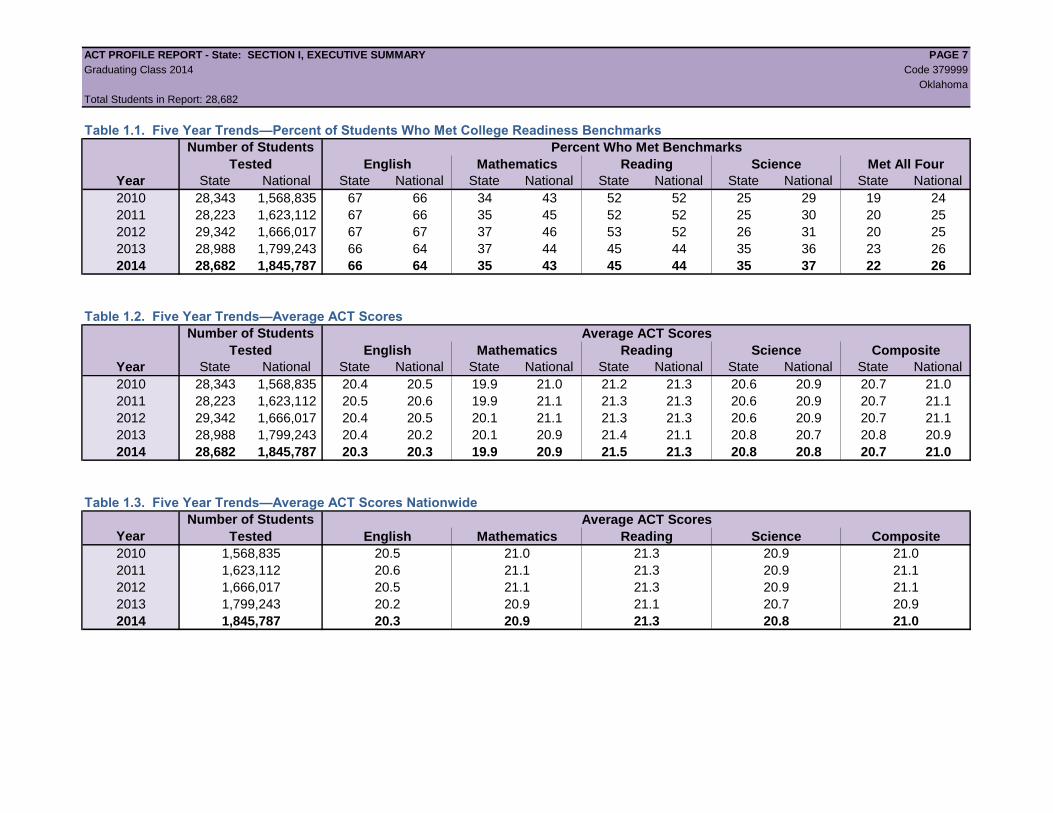
Table 1.1. Five Year Trends—Percent of Students Who Met College Readiness Benchmarks
Percent Who Met Benchmarks
English Mathematics Reading Science Met All Four
Year State National State National State National State National State National State National
2010 28,343 1,568,835 67 66 34 43 52 52 25 29 19 24
2011 28,223 1,623,112 67 66 35 45 52 52 25 30 20 25
2012 29,342 1,666,017 67 67 37 46 53 52 26 31 20 25
2013 28,988 1,799,243 66 64 37 44 45 44 35 36 23 26
2014 28,682 1,845,787 66 64 35 43 45 44 35 37 22 26
Table 1.2. Five Year Trends—Average ACT Scores
Average ACT Scores
English Mathematics Reading Science Composite
Year State National State National State National State National State National State National
2010 28,343 1,568,835 20.4 20.5 19.9 21.0 21.2 21.3 20.6 20.9 20.7 21.0
2011 28,223 1,623,112 20.5 20.6 19.9 21.1 21.3 21.3 20.6 20.9 20.7 21.1
2012 29,342 1,666,017 20.4 20.5 20.1 21.1 21.3 21.3 20.6 20.9 20.7 21.1
2013 28,988 1,799,243 20.4 20.2 20.1 20.9 21.4 21.1 20.8 20.7 20.8 20.9
2014 28,682 1,845,787 20.3 20.3 19.9 20.9 21.5 21.3 20.8 20.8 20.7 21.0
Table 1.3. Five Year Trends—Average ACT Scores Nationwide
Average ACT Scores
Year English Mathematics Reading Science Composite
2010 1,568,835 20.5 21.0 21.3 20.9 21.0
2011 1,623,112 20.6 21.1 21.3 20.9 21.1
2012 1,666,017 20.5 21.1 21.3 20.9 21.1
2013 1,799,243 20.2 20.9 21.1 20.7 20.9
2014 1,845,787 20.3 20.9 21.3 20.8 21.0
Number of Students
Tested
Number of Students
Tested
Number of Students
Tested
ACT PROFILE REPORT - State: SECTION I, EXECUTIVE SUMMARY PAGE 8
Graduating Class 2014 Code 379999
Oklahoma
Total Students in Report: 28,682
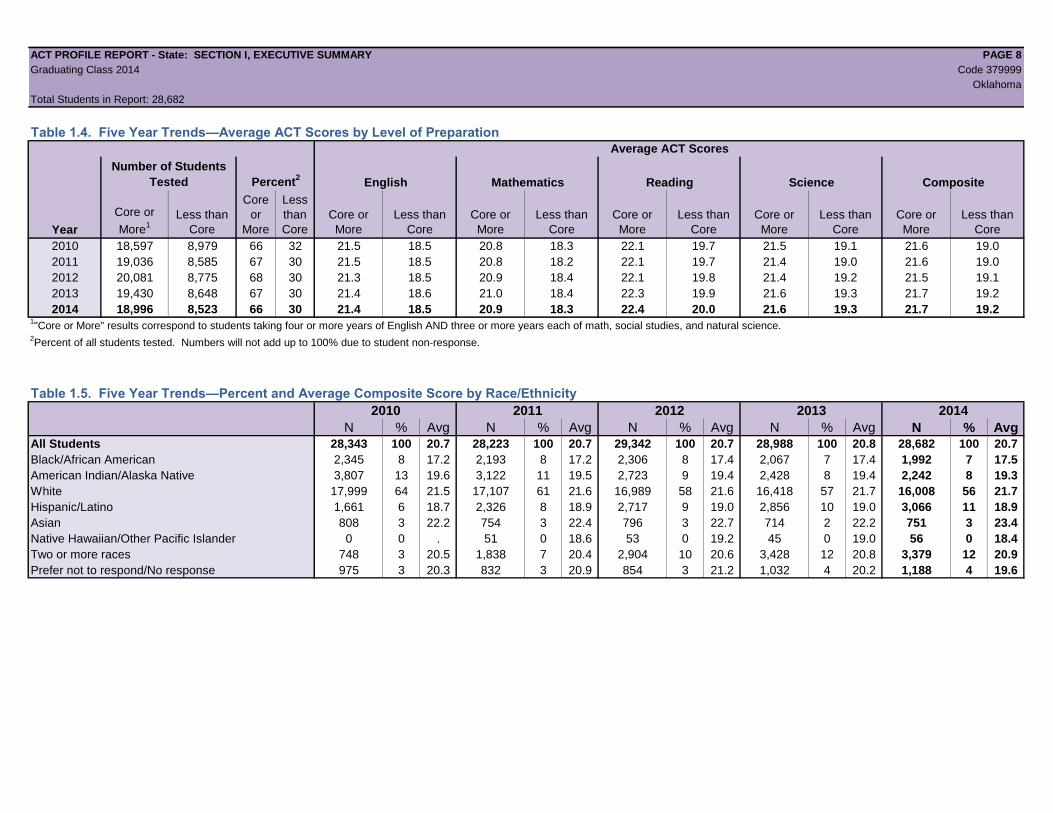
Table 1.4. Five Year Trends—Average ACT Scores by Level of Preparation
Average ACT Scores
Number of Students
Tested Percent2
English Mathematics Reading Science Composite
Year
Core or
More1
Less than
Core
Core
or
More
Less
than
Core
Core or
More
Less than
Core
Core or
More
Less than
Core
Core or
More
Less than
Core
Core or
More
Less than
Core
Core or
More
Less than
Core
2010 18,597 8,979 66 32 21.5 18.5 20.8 18.3 22.1 19.7 21.5 19.1 21.6 19.0
2011 19,036 8,585 67 30 21.5 18.5 20.8 18.2 22.1 19.7 21.4 19.0 21.6 19.0
2012 20,081 8,775 68 30 21.3 18.5 20.9 18.4 22.1 19.8 21.4 19.2 21.5 19.1
2013 19,430 8,648 67 30 21.4 18.6 21.0 18.4 22.3 19.9 21.6 19.3 21.7 19.2
2014 18,996 8,523 66 30 21.4 18.5 20.9 18.3 22.4 20.0 21.6 19.3 21.7 19.21"Core or More" results correspond to students taking four or more years of English AND three or more years each of math, social studies, and natural science.
2Percent of all students tested. Numbers will not add up to 100% due to student non-response.
Table 1.5. Five Year Trends—Percent and Average Composite Score by Race/Ethnicity
2010 2011 2012 2013 2014
N % Avg N % Avg N % Avg N % Avg N % Avg
All Students 28,343 100 20.7 28,223 100 20.7 29,342 100 20.7 28,988 100 20.8 28,682 100 20.7
Black/African American 2,345 8 17.2 2,193 8 17.2 2,306 8 17.4 2,067 7 17.4 1,992 7 17.5
American Indian/Alaska Native 3,807 13 19.6 3,122 11 19.5 2,723 9 19.4 2,428 8 19.4 2,242 8 19.3
White 17,999 64 21.5 17,107 61 21.6 16,989 58 21.6 16,418 57 21.7 16,008 56 21.7
Hispanic/Latino 1,661 6 18.7 2,326 8 18.9 2,717 9 19.0 2,856 10 19.0 3,066 11 18.9
Asian 808 3 22.2 754 3 22.4 796 3 22.7 714 2 22.2 751 3 23.4
Native Hawaiian/Other Pacific Islander 0 0 . 51 0 18.6 53 0 19.2 45 0 19.0 56 0 18.4
Two or more races 748 3 20.5 1,838 7 20.4 2,904 10 20.6 3,428 12 20.8 3,379 12 20.9
Prefer not to respond/No response 975 3 20.3 832 3 20.9 854 3 21.2 1,032 4 20.2 1,188 4 19.6
ACT PROFILE REPORT - State: SECTION I, EXECUTIVE SUMMARY PAGE 9
Graduating Class 2014 Code 379999
Oklahoma
Total Students in Report: 28,682
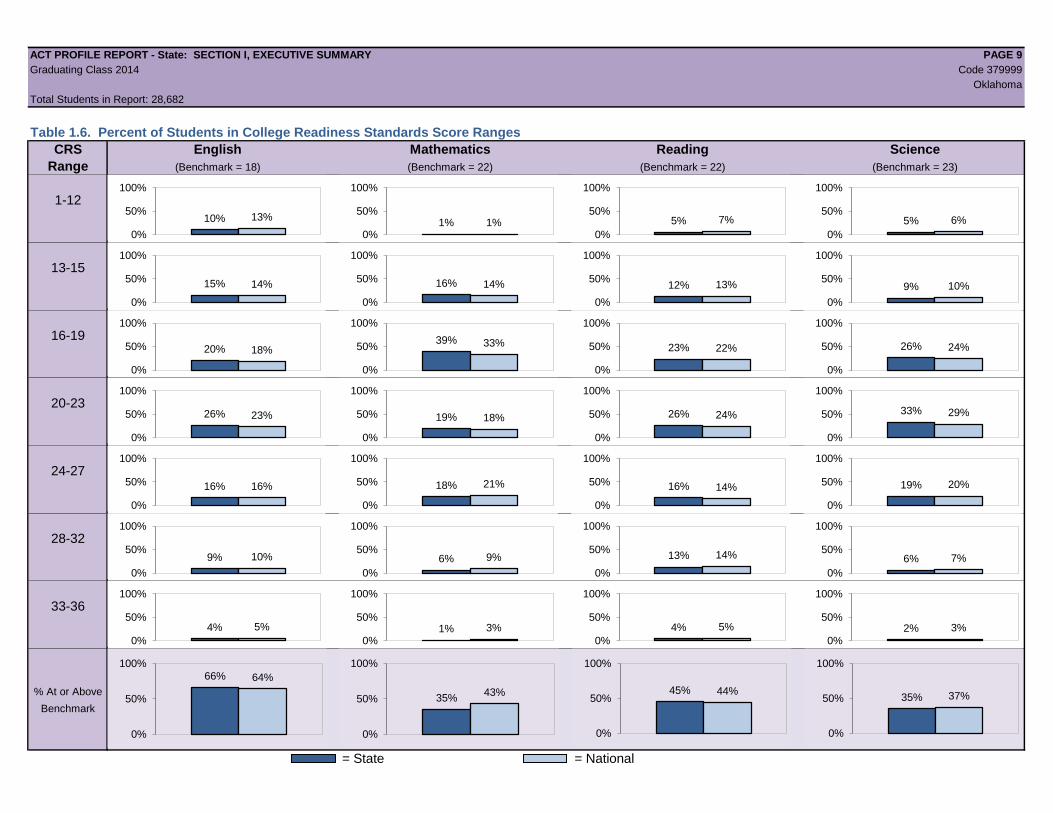
Table 1.6. Percent of Students in College Readiness Standards Score Ranges
CRS English Mathematics Reading Science
Range (Benchmark = 18) (Benchmark = 22) (Benchmark = 22) (Benchmark = 23)
1-12
13-15
16-19
20-23
24-27
28-32
33-36
% At or Above
Benchmark
= State = National
10% 13%
0%
50%
100%
1% 1% 0%
50%
100%
5% 7%
0%
50%
100%
5% 6%
0%
50%
100%
66% 64%
0%
50%
100%
15% 14%
0%
50%
100%
16% 14%
0%
50%
100%
12% 13%
0%
50%
100%
9% 10%
0%
50%
100%
20% 18%
0%
50%
100%
39% 33%
0%
50%
100%
23% 22%
0%
50%
100%
26% 24%
0%
50%
100%
26% 23%
0%
50%
100%
19% 18%
0%
50%
100%
26% 24%
0%
50%
100%
33% 29%
0%
50%
100%
16% 16%
0%
50%
100%
18% 21%
0%
50%
100%
16% 14%
0%
50%
100%
19% 20%
0%
50%
100%
9% 10%
0%
50%
100%
6% 9%
0%
50%
100%
13% 14%
0%
50%
100%
6% 7%
0%
50%
100%
35% 43%
0%
50%
100%
45% 44%
0%
50%
100%
35% 37%
0%
50%
100%
4% 5%
0%
50%
100%
1% 3%
0%
50%
100%
4% 5%
0%
50%
100%
2% 3%
0%
50%
100%
ACT PROFILE REPORT- State: SECTION II, ACADEMIC ACHIEVEMENT PAGE 10
Graduating Class 2014 Code 379999
Oklahoma
Total Students in Report: 28,682
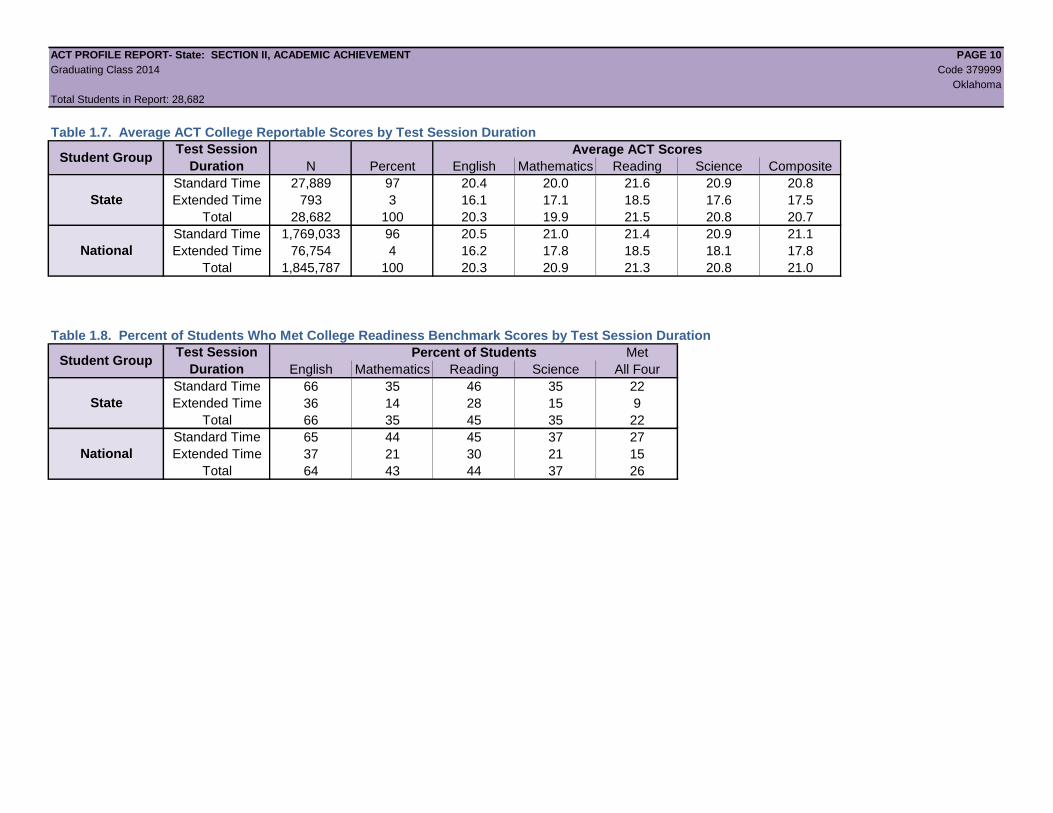
Table 1.7. Average ACT College Reportable Scores by Test Session Duration
Average ACT Scores
N Percent English Mathematics Reading Science Composite
Standard Time 27,889 97 20.4 20.0 21.6 20.9 20.8
Extended Time 793 3 16.1 17.1 18.5 17.6 17.5
Total 28,682 100 20.3 19.9 21.5 20.8 20.7
Standard Time 1,769,033 96 20.5 21.0 21.4 20.9 21.1
Extended Time 76,754 4 16.2 17.8 18.5 18.1 17.8
Total 1,845,787 100 20.3 20.9 21.3 20.8 21.0
Table 1.8. Percent of Students Who Met College Readiness Benchmark Scores by Test Session Duration
Percent of Students Met
English Mathematics Reading Science All Four
Standard Time 66 35 46 35 22
Extended Time 36 14 28 15 9
Total 66 35 45 35 22
Standard Time 65 44 45 37 27
Extended Time 37 21 30 21 15
Total 64 43 44 37 26
State
National
Student GroupTest Session
Duration
State
National
Student GroupTest Session
Duration
ACT PROFILE REPORT- State: SECTION II, ACADEMIC ACHIEVEMENT PAGE 11
Graduating Class 2014 Code 379999
Oklahoma
Total Students in Report: 28,682
Section II
Academic Achievement
Beginning with the Graduating Class of 2013, all students whose scores are college reportable, both standard and extended time tests, are now included.
Also beginning with the 2013 Graduating Class data, College Readiness Benchmarks for Reading and Science were updated to reflect the most recent
college coursework research.
ACT PROFILE REPORT- State: SECTION II, ACADEMIC ACHIEVEMENT PAGE 12
Graduating Class 2014 Code 379999
Oklahoma
Total Students in Report: 28,682
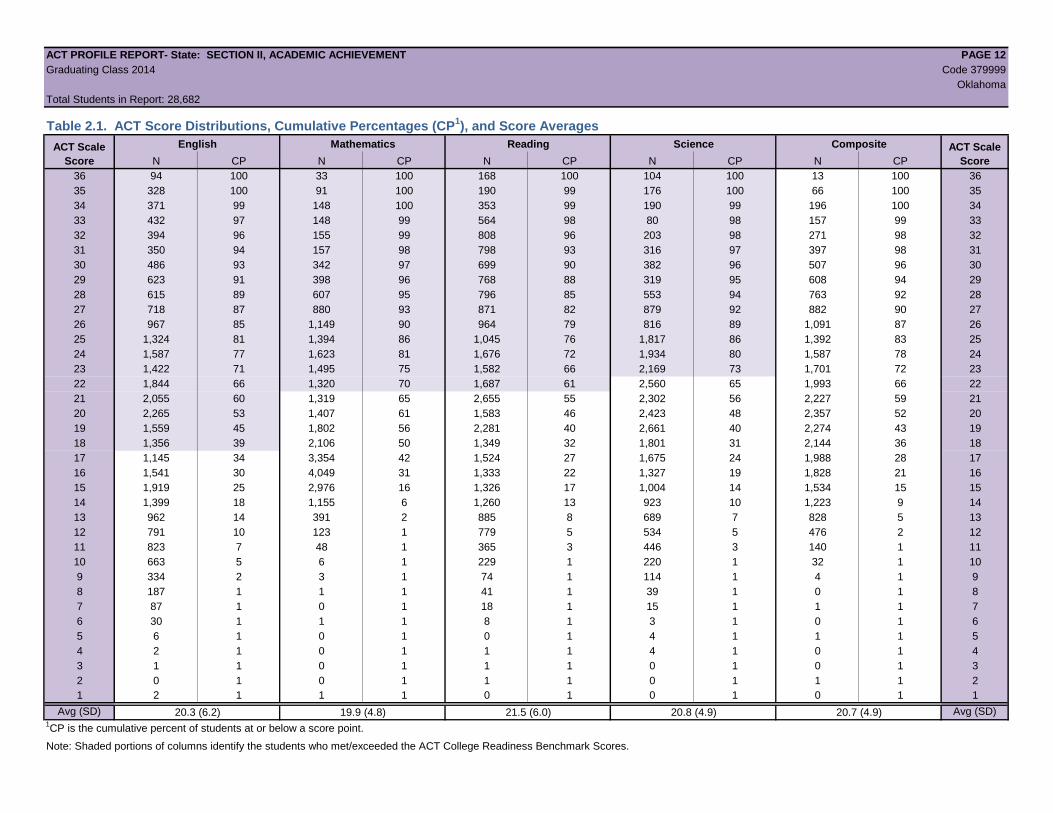
Table 2.1. ACT Score Distributions, Cumulative Percentages (CP1), and Score Averages
English Mathematics Reading Science Composite
N CP N CP N CP N CP N CP
36 94 100 33 100 168 100 104 100 13 100 36
35 328 100 91 100 190 99 176 100 66 100 35
34 371 99 148 100 353 99 190 99 196 100 34
33 432 97 148 99 564 98 80 98 157 99 33
32 394 96 155 99 808 96 203 98 271 98 32
31 350 94 157 98 798 93 316 97 397 98 31
30 486 93 342 97 699 90 382 96 507 96 30
29 623 91 398 96 768 88 319 95 608 94 29
28 615 89 607 95 796 85 553 94 763 92 28
27 718 87 880 93 871 82 879 92 882 90 27
26 967 85 1,149 90 964 79 816 89 1,091 87 26
25 1,324 81 1,394 86 1,045 76 1,817 86 1,392 83 25
24 1,587 77 1,623 81 1,676 72 1,934 80 1,587 78 24
23 1,422 71 1,495 75 1,582 66 2,169 73 1,701 72 23
22 1,844 66 1,320 70 1,687 61 2,560 65 1,993 66 22
21 2,055 60 1,319 65 2,655 55 2,302 56 2,227 59 21
20 2,265 53 1,407 61 1,583 46 2,423 48 2,357 52 20
19 1,559 45 1,802 56 2,281 40 2,661 40 2,274 43 19
18 1,356 39 2,106 50 1,349 32 1,801 31 2,144 36 18
17 1,145 34 3,354 42 1,524 27 1,675 24 1,988 28 17
16 1,541 30 4,049 31 1,333 22 1,327 19 1,828 21 16
15 1,919 25 2,976 16 1,326 17 1,004 14 1,534 15 15
14 1,399 18 1,155 6 1,260 13 923 10 1,223 9 14
13 962 14 391 2 885 8 689 7 828 5 13
12 791 10 123 1 779 5 534 5 476 2 12
11 823 7 48 1 365 3 446 3 140 1 11
10 663 5 6 1 229 1 220 1 32 1 10
9 334 2 3 1 74 1 114 1 4 1 9
8 187 1 1 1 41 1 39 1 0 1 8
7 87 1 0 1 18 1 15 1 1 1 7
6 30 1 1 1 8 1 3 1 0 1 6
5 6 1 0 1 0 1 4 1 1 1 5
4 2 1 0 1 1 1 4 1 0 1 4
3 1 1 0 1 1 1 0 1 0 1 3
2 0 1 0 1 1 1 0 1 1 1 2
1 2 1 1 1 0 1 0 1 0 1 1
Avg (SD) 20.3 (6.2) 19.9 (4.8) 21.5 (6.0) 20.8 (4.9) 20.7 (4.9) Avg (SD)1CP is the cumulative percent of students at or below a score point.
Note: Shaded portions of columns identify the students who met/exceeded the ACT College Readiness Benchmark Scores.
ACT Scale
Score
ACT Scale
Score
ACT PROFILE REPORT- State: SECTION II, ACADEMIC ACHIEVEMENT PAGE 13
Graduating Class 2014 Code 379999
Oklahoma
Total Students in Report: 28,682
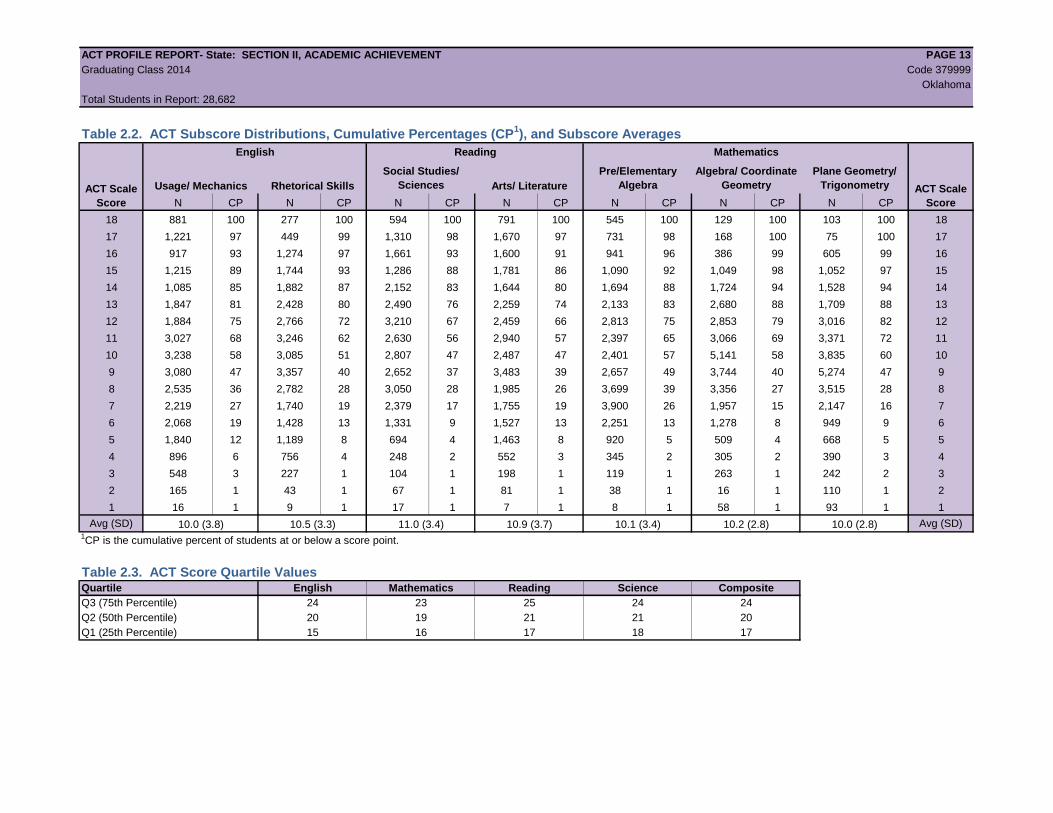
Table 2.2. ACT Subscore Distributions, Cumulative Percentages (CP1), and Subscore Averages
English Reading Mathematics
Usage/ Mechanics Rhetorical Skills
Social Studies/
Sciences Arts/ Literature
Pre/Elementary
Algebra
Algebra/ Coordinate
Geometry
Plane Geometry/
Trigonometry
N CP N CP N CP N CP N CP N CP N CP
18 881 100 277 100 594 100 791 100 545 100 129 100 103 100 18
17 1,221 97 449 99 1,310 98 1,670 97 731 98 168 100 75 100 17
16 917 93 1,274 97 1,661 93 1,600 91 941 96 386 99 605 99 16
15 1,215 89 1,744 93 1,286 88 1,781 86 1,090 92 1,049 98 1,052 97 15
14 1,085 85 1,882 87 2,152 83 1,644 80 1,694 88 1,724 94 1,528 94 14
13 1,847 81 2,428 80 2,490 76 2,259 74 2,133 83 2,680 88 1,709 88 13
12 1,884 75 2,766 72 3,210 67 2,459 66 2,813 75 2,853 79 3,016 82 12
11 3,027 68 3,246 62 2,630 56 2,940 57 2,397 65 3,066 69 3,371 72 11
10 3,238 58 3,085 51 2,807 47 2,487 47 2,401 57 5,141 58 3,835 60 10
9 3,080 47 3,357 40 2,652 37 3,483 39 2,657 49 3,744 40 5,274 47 9
8 2,535 36 2,782 28 3,050 28 1,985 26 3,699 39 3,356 27 3,515 28 8
7 2,219 27 1,740 19 2,379 17 1,755 19 3,900 26 1,957 15 2,147 16 7
6 2,068 19 1,428 13 1,331 9 1,527 13 2,251 13 1,278 8 949 9 6
5 1,840 12 1,189 8 694 4 1,463 8 920 5 509 4 668 5 5
4 896 6 756 4 248 2 552 3 345 2 305 2 390 3 4
3 548 3 227 1 104 1 198 1 119 1 263 1 242 2 3
2 165 1 43 1 67 1 81 1 38 1 16 1 110 1 2
1 16 1 9 1 17 1 7 1 8 1 58 1 93 1 1
Avg (SD) 10.0 (3.8) 10.5 (3.3) 11.0 (3.4) 10.9 (3.7) 10.1 (3.4) 10.2 (2.8) 10.0 (2.8) Avg (SD)1CP is the cumulative percent of students at or below a score point.
Table 2.3. ACT Score Quartile ValuesQuartile English Mathematics Reading Science Composite
Q3 (75th Percentile) 24 23 25 24 24
Q2 (50th Percentile) 20 19 21 21 20
Q1 (25th Percentile) 15 16 17 18 17
ACT Scale
Score
ACT Scale
Score
ACT PROFILE REPORT- State: SECTION II, ACADEMIC ACHIEVEMENT PAGE 14
Graduating Class 2014 Code 379999
Oklahoma
Total Students in Report: 28,682
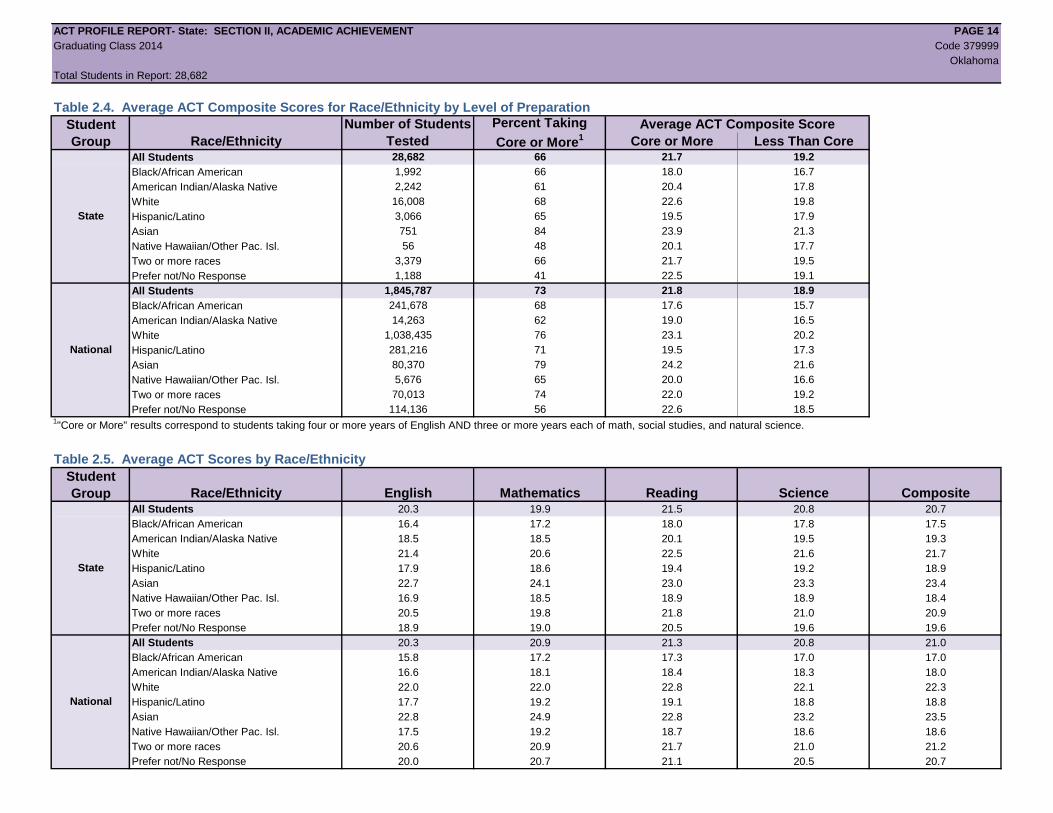
Table 2.4. Average ACT Composite Scores for Race/Ethnicity by Level of Preparation
Student
Group Race/Ethnicity Core or More Less Than CoreAll Students 28,682 66 21.7 19.2
Black/African American 1,992 66 18.0 16.7
American Indian/Alaska Native 2,242 61 20.4 17.8
White 16,008 68 22.6 19.8
Hispanic/Latino 3,066 65 19.5 17.9
Asian 751 84 23.9 21.3
Native Hawaiian/Other Pac. Isl. 56 48 20.1 17.7
Two or more races 3,379 66 21.7 19.5
Prefer not/No Response 1,188 41 22.5 19.1
All Students 1,845,787 73 21.8 18.9
Black/African American 241,678 68 17.6 15.7
American Indian/Alaska Native 14,263 62 19.0 16.5
White 1,038,435 76 23.1 20.2
Hispanic/Latino 281,216 71 19.5 17.3
Asian 80,370 79 24.2 21.6
Native Hawaiian/Other Pac. Isl. 5,676 65 20.0 16.6
Two or more races 70,013 74 22.0 19.2
Prefer not/No Response 114,136 56 22.6 18.51"Core or More" results correspond to students taking four or more years of English AND three or more years each of math, social studies, and natural science.
Table 2.5. Average ACT Scores by Race/Ethnicity
Student
Group Race/Ethnicity English Mathematics Reading Science CompositeAll Students 20.3 19.9 21.5 20.8 20.7
Black/African American 16.4 17.2 18.0 17.8 17.5
American Indian/Alaska Native 18.5 18.5 20.1 19.5 19.3
White 21.4 20.6 22.5 21.6 21.7
Hispanic/Latino 17.9 18.6 19.4 19.2 18.9
Asian 22.7 24.1 23.0 23.3 23.4
Native Hawaiian/Other Pac. Isl. 16.9 18.5 18.9 18.9 18.4
Two or more races 20.5 19.8 21.8 21.0 20.9
Prefer not/No Response 18.9 19.0 20.5 19.6 19.6
All Students 20.3 20.9 21.3 20.8 21.0
Black/African American 15.8 17.2 17.3 17.0 17.0
American Indian/Alaska Native 16.6 18.1 18.4 18.3 18.0
White 22.0 22.0 22.8 22.1 22.3
Hispanic/Latino 17.7 19.2 19.1 18.8 18.8
Asian 22.8 24.9 22.8 23.2 23.5
Native Hawaiian/Other Pac. Isl. 17.5 19.2 18.7 18.6 18.6
Two or more races 20.6 20.9 21.7 21.0 21.2
Prefer not/No Response 20.0 20.7 21.1 20.5 20.7
National
State
National
Average ACT Composite Score
State
Number of Students
Tested
Percent Taking
Core or More1
ACT PROFILE REPORT- State: SECTION II, ACADEMIC ACHIEVEMENT PAGE 15
Graduating Class 2014 Code 379999
Oklahoma
Total Students in Report: 28,682
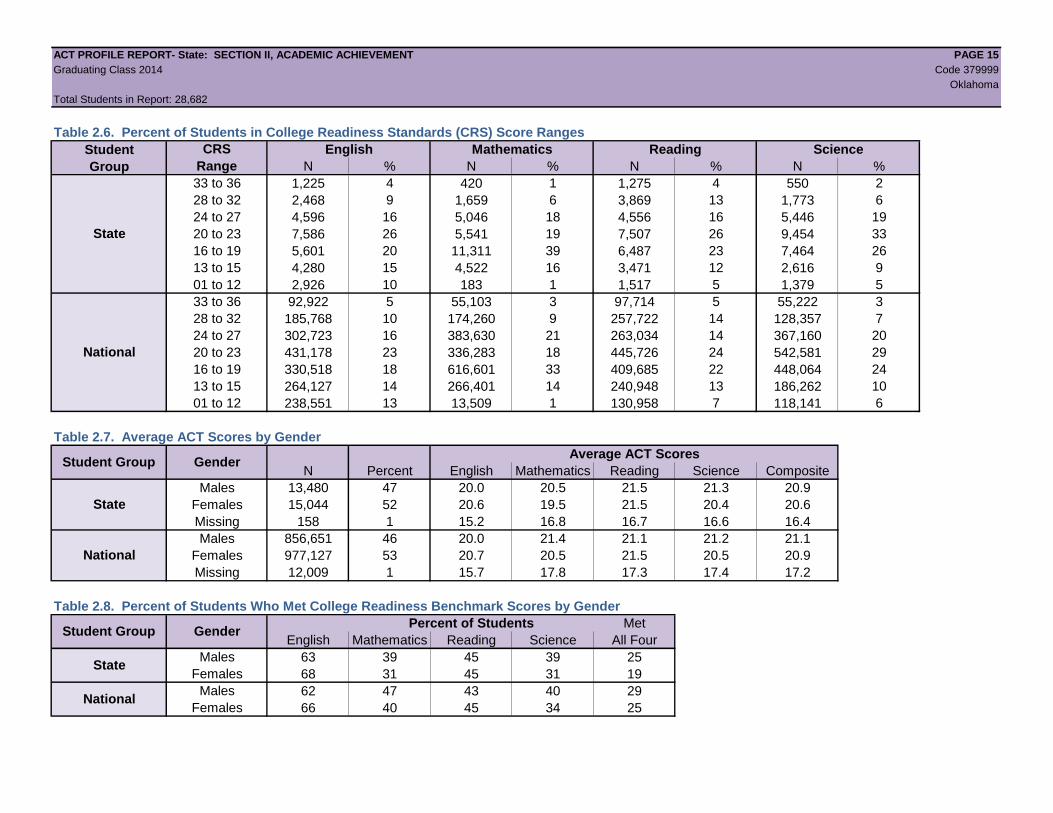
Table 2.6. Percent of Students in College Readiness Standards (CRS) Score Ranges
Student English Mathematics Reading Science
Group N % N % N % N %
33 to 36 1,225 4 420 1 1,275 4 550 2
28 to 32 2,468 9 1,659 6 3,869 13 1,773 6
24 to 27 4,596 16 5,046 18 4,556 16 5,446 19
20 to 23 7,586 26 5,541 19 7,507 26 9,454 33
16 to 19 5,601 20 11,311 39 6,487 23 7,464 26
13 to 15 4,280 15 4,522 16 3,471 12 2,616 9
01 to 12 2,926 10 183 1 1,517 5 1,379 5
33 to 36 92,922 5 55,103 3 97,714 5 55,222 3
28 to 32 185,768 10 174,260 9 257,722 14 128,357 7
24 to 27 302,723 16 383,630 21 263,034 14 367,160 20
20 to 23 431,178 23 336,283 18 445,726 24 542,581 29
16 to 19 330,518 18 616,601 33 409,685 22 448,064 24
13 to 15 264,127 14 266,401 14 240,948 13 186,262 10
01 to 12 238,551 13 13,509 1 130,958 7 118,141 6
Table 2.7. Average ACT Scores by Gender
Average ACT Scores
N Percent English Mathematics Reading Science Composite
Males 13,480 47 20.0 20.5 21.5 21.3 20.9
Females 15,044 52 20.6 19.5 21.5 20.4 20.6
Missing 158 1 15.2 16.8 16.7 16.6 16.4
Males 856,651 46 20.0 21.4 21.1 21.2 21.1
Females 977,127 53 20.7 20.5 21.5 20.5 20.9
Missing 12,009 1 15.7 17.8 17.3 17.4 17.2
Table 2.8. Percent of Students Who Met College Readiness Benchmark Scores by Gender
Percent of Students Met
English Mathematics Reading Science All Four
Males 63 39 45 39 25
Females 68 31 45 31 19
Males 62 47 43 40 29
Females 66 40 45 34 25
CRS
Range
State
National
Gender
Gender
State
National
Student Group
Student Group
State
National
ACT PROFILE REPORT- State: SECTION II, ACADEMIC ACHIEVEMENT PAGE 16
Graduating Class 2014 Code 379999
Oklahoma
Total Students in Report: 28,682
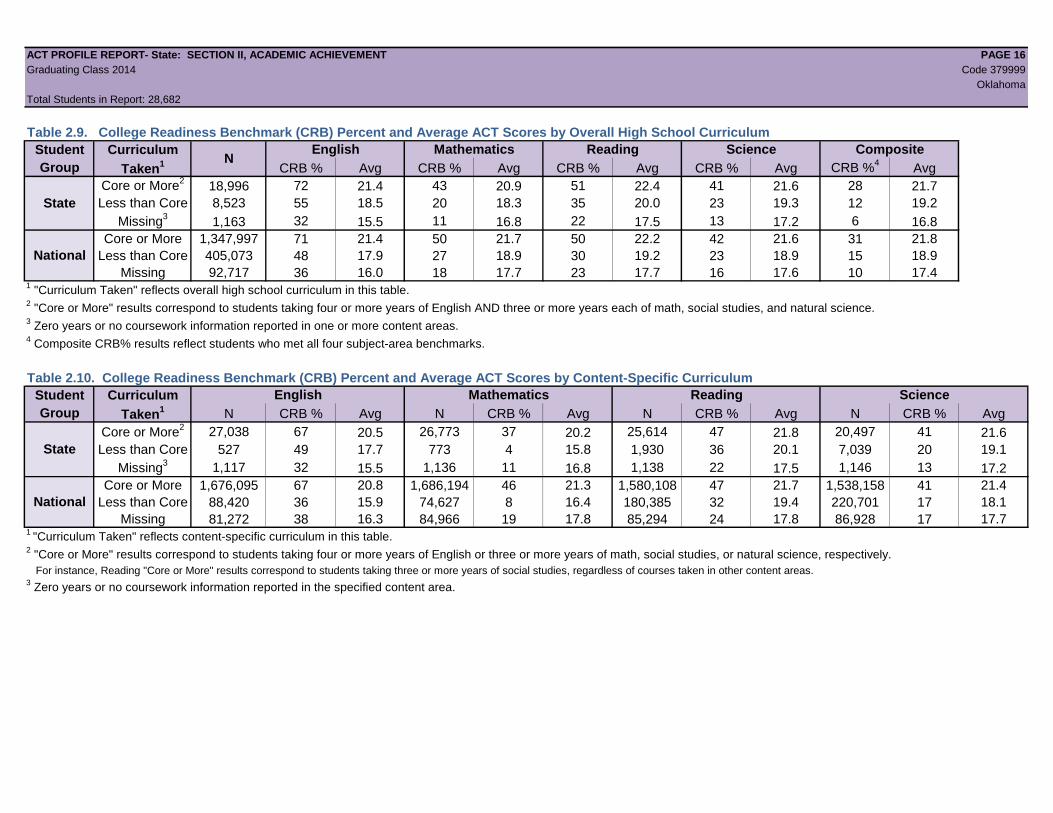
Table 2.9. College Readiness Benchmark (CRB) Percent and Average ACT Scores by Overall High School Curriculum
Student Curriculum English Mathematics Reading Science Composite
Group Taken1 CRB % Avg CRB % Avg CRB % Avg CRB % Avg CRB %
4Avg
Core or More2
18,996 72 21.4 43 20.9 51 22.4 41 21.6 28 21.7
Less than Core 8,523 55 18.5 20 18.3 35 20.0 23 19.3 12 19.2
Missing3
1,163 32 15.5 11 16.8 22 17.5 13 17.2 6 16.8
Core or More 1,347,997 71 21.4 50 21.7 50 22.2 42 21.6 31 21.8
Less than Core 405,073 48 17.9 27 18.9 30 19.2 23 18.9 15 18.9
Missing 92,717 36 16.0 18 17.7 23 17.7 16 17.6 10 17.41 "Curriculum Taken" reflects overall high school curriculum in this table.
2 "Core or More" results correspond to students taking four or more years of English AND three or more years each of math, social studies, and natural science.
3 Zero years or no coursework information reported in one or more content areas.
4 Composite CRB% results reflect students who met all four subject-area benchmarks.
Table 2.10. College Readiness Benchmark (CRB) Percent and Average ACT Scores by Content-Specific Curriculum
Student Curriculum English Mathematics Reading Science
Group Taken1 N CRB % Avg N CRB % Avg N CRB % Avg N CRB % Avg
Core or More2
27,038 67 20.5 26,773 37 20.2 25,614 47 21.8 20,497 41 21.6
Less than Core 527 49 17.7 773 4 15.8 1,930 36 20.1 7,039 20 19.1
Missing3
1,117 32 15.5 1,136 11 16.8 1,138 22 17.5 1,146 13 17.2
Core or More 1,676,095 67 20.8 1,686,194 46 21.3 1,580,108 47 21.7 1,538,158 41 21.4
Less than Core 88,420 36 15.9 74,627 8 16.4 180,385 32 19.4 220,701 17 18.1
Missing 81,272 38 16.3 84,966 19 17.8 85,294 24 17.8 86,928 17 17.71
"Curriculum Taken" reflects content-specific curriculum in this table.2 "Core or More" results correspond to students taking four or more years of English or three or more years of math, social studies, or natural science, respectively.
For instance, Reading "Core or More" results correspond to students taking three or more years of social studies, regardless of courses taken in other content areas.3 Zero years or no coursework information reported in the specified content area.
National
N
State
National
State
ACT PROFILE REPORT - State: SECTION III, COLLEGE READINESS & THE IMPACT OF COURSE RIGOR PAGE 17
Graduating Class 2014 Code 379999
Oklahoma
Total Students in Report: 28,682
Section III
College Readiness and the
Impact of Course Rigor
Beginning with the Graduating Class of 2013, all students whose scores are college reportable, both standard and extended time tests, are now included.
Also beginning with the 2013 Graduating Class data, College Readiness Benchmarks for Reading and Science were updated to reflect the most recent
college coursework research.
ACT PROFILE REPORT - State: SECTION III, COLLEGE READINESS & THE IMPACT OF COURSE RIGOR PAGE 18
Graduating Class 2014 Code 379999
Oklahoma
Total Students in Report: 28,682
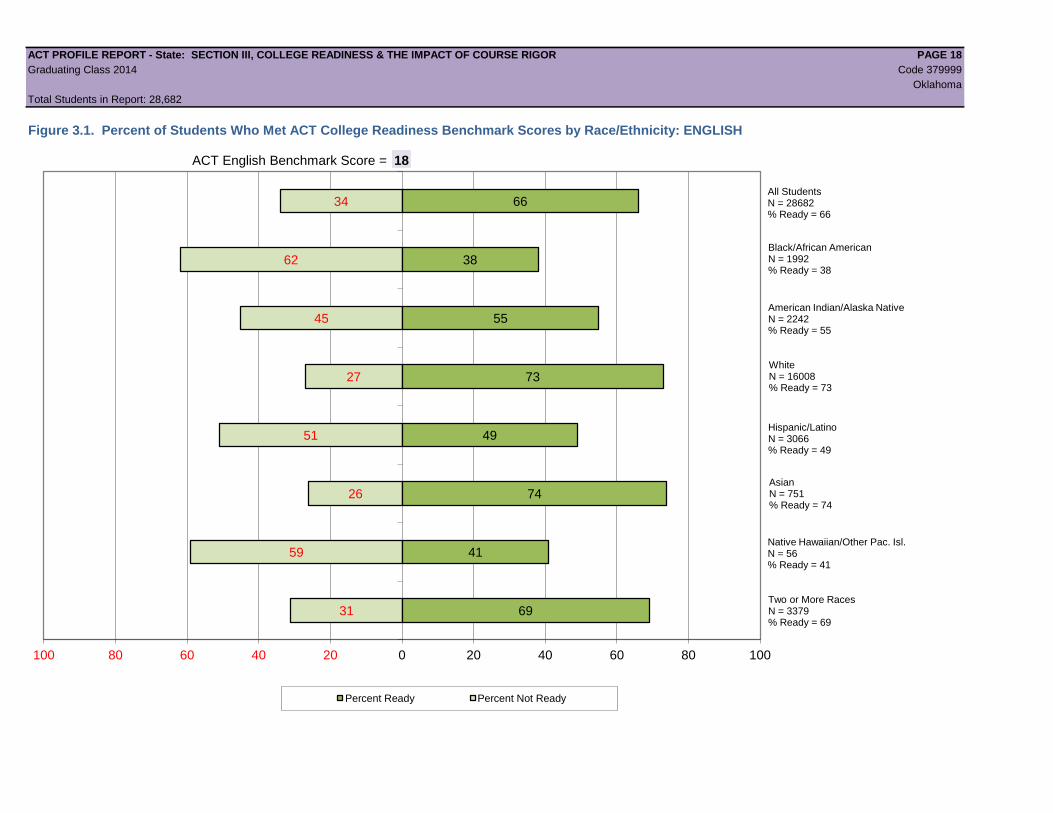
Figure 3.1. Percent of Students Who Met ACT College Readiness Benchmark Scores by Race/Ethnicity: ENGLISH
31
59
26
51
27
45
62
34
69
41
74
49
73
55
38
66
100 80 60 40 20 0 20 40 60 80 100
Percent Ready Percent Not Ready
Asian N = 751 % Ready = 74
Two or More Races N = 3379 % Ready = 69
Hispanic/Latino N = 3066 % Ready = 49
White N = 16008 % Ready = 73
American Indian/Alaska Native N = 2242 % Ready = 55
Black/African American N = 1992 % Ready = 38
All Students N = 28682 % Ready = 66
Native Hawaiian/Other Pac. Isl. N = 56 % Ready = 41
ACT English Benchmark Score = 18
ACT PROFILE REPORT - State: SECTION III, COLLEGE READINESS & THE IMPACT OF COURSE RIGOR PAGE 19
Graduating Class 2014 Code 379999
Oklahoma
Total Students in Report: 28,682
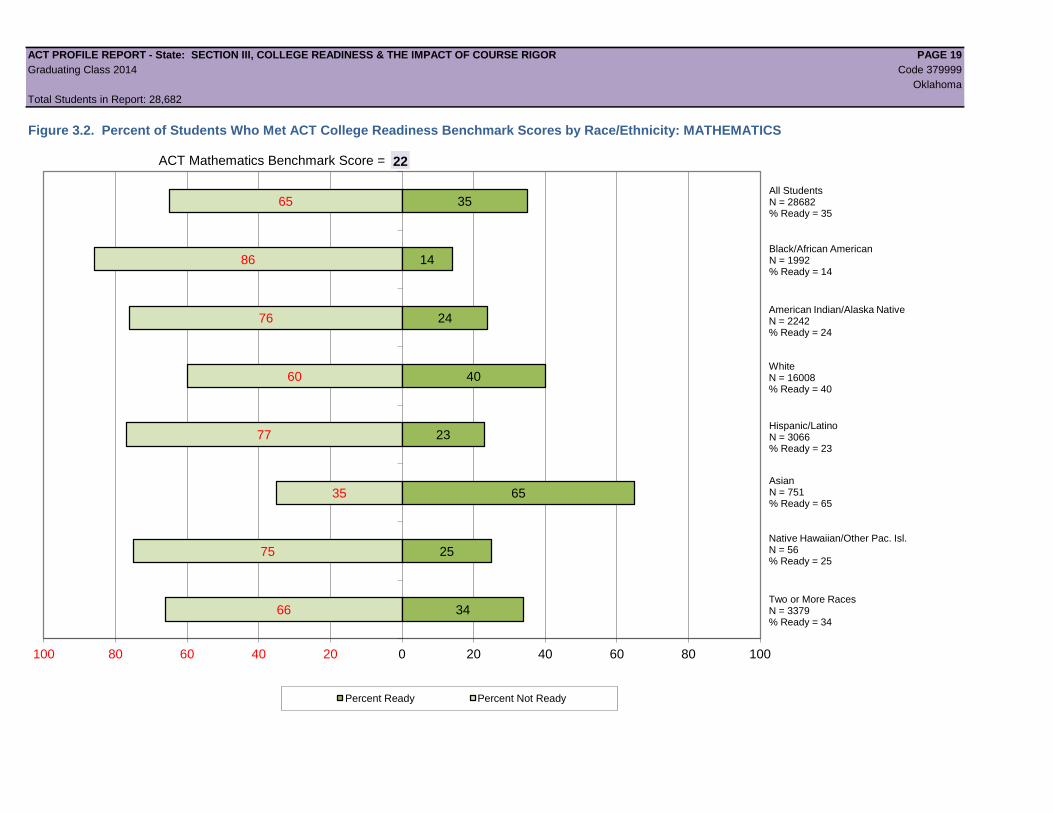
Figure 3.2. Percent of Students Who Met ACT College Readiness Benchmark Scores by Race/Ethnicity: MATHEMATICS
66
75
35
77
60
76
86
65
34
25
65
23
40
24
14
35
100 80 60 40 20 0 20 40 60 80 100
Percent Ready Percent Not Ready
Asian N = 751 % Ready = 65
Two or More Races N = 3379 % Ready = 34
All Students N = 28682 % Ready = 35
Black/African American N = 1992 % Ready = 14
American Indian/Alaska Native N = 2242 % Ready = 24
White N = 16008 % Ready = 40
Hispanic/Latino N = 3066 % Ready = 23
Native Hawaiian/Other Pac. Isl. N = 56 % Ready = 25
ACT Mathematics Benchmark Score = 22
ACT PROFILE REPORT - State: SECTION III, COLLEGE READINESS & THE IMPACT OF COURSE RIGOR PAGE 20
Graduating Class 2014 Code 379999
Oklahoma
Total Students in Report: 28,682
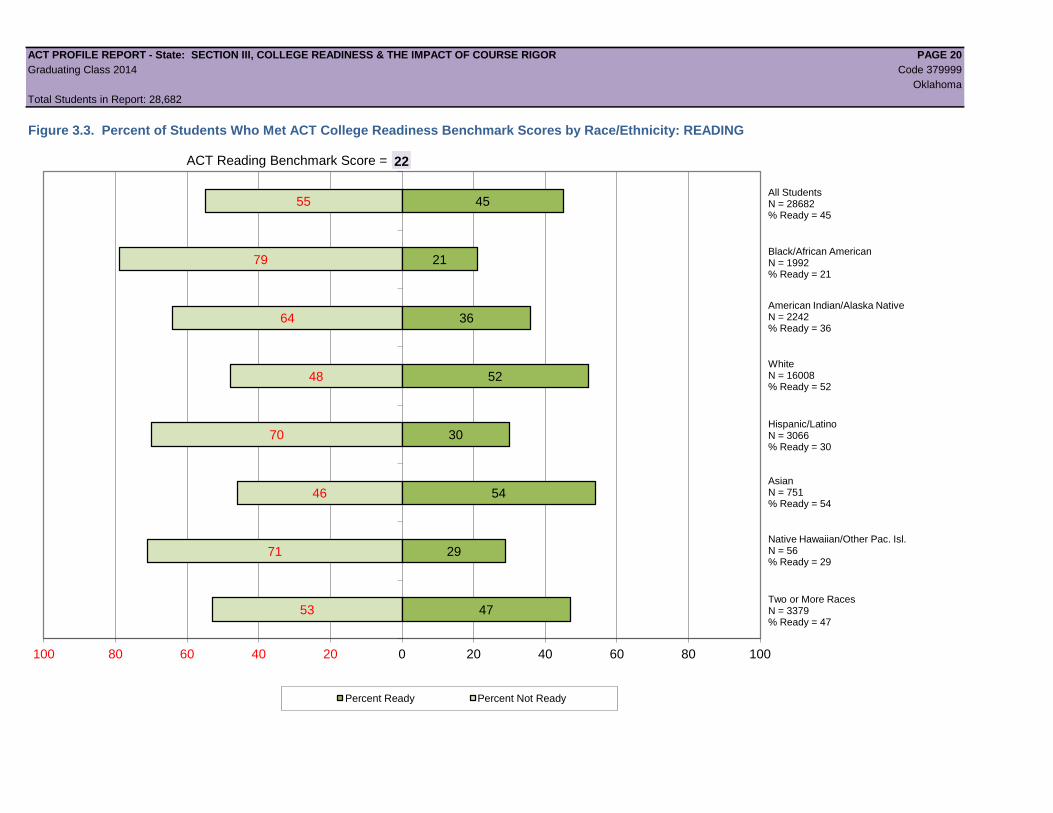
Figure 3.3. Percent of Students Who Met ACT College Readiness Benchmark Scores by Race/Ethnicity: READING
53
71
46
70
48
64
79
55
47
29
54
30
52
36
21
45
100 80 60 40 20 0 20 40 60 80 100
Percent Ready Percent Not Ready
All Students N = 28682 % Ready = 45
Black/African American N = 1992 % Ready = 21
American Indian/Alaska Native N = 2242 % Ready = 36
White N = 16008 % Ready = 52
Hispanic/Latino N = 3066 % Ready = 30
Asian N = 751 % Ready = 54
Two or More Races N = 3379 % Ready = 47
Native Hawaiian/Other Pac. Isl. N = 56 % Ready = 29
ACT Reading Benchmark Score = 22
ACT PROFILE REPORT - State: SECTION III, COLLEGE READINESS & THE IMPACT OF COURSE RIGOR PAGE 21
Graduating Class 2014 Code 379999
Oklahoma
Total Students in Report: 28,682
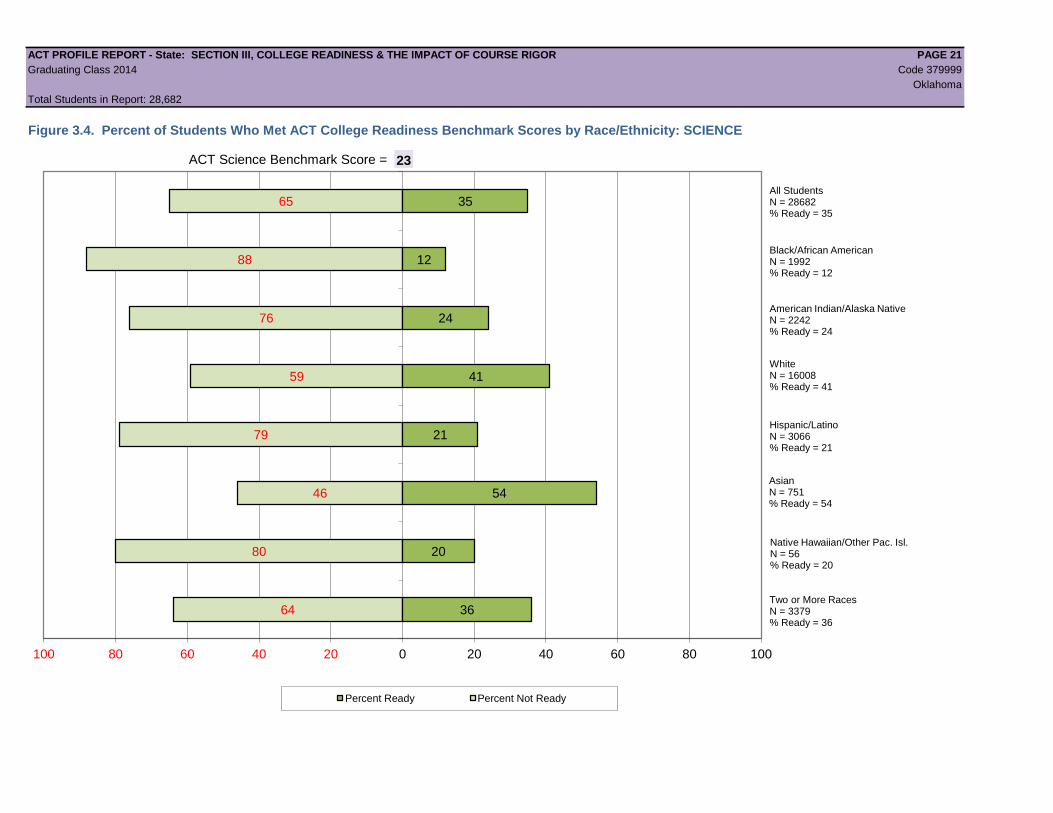
Figure 3.4. Percent of Students Who Met ACT College Readiness Benchmark Scores by Race/Ethnicity: SCIENCE
64
80
46
79
59
76
88
65
36
20
54
21
41
24
12
35
100 80 60 40 20 0 20 40 60 80 100
Percent Ready Percent Not Ready
All Students N = 28682 % Ready = 35
Black/African American N = 1992 % Ready = 12
American Indian/Alaska Native N = 2242 % Ready = 24
White N = 16008 % Ready = 41
Hispanic/Latino N = 3066 % Ready = 21
Asian N = 751 % Ready = 54
Two or More Races N = 3379 % Ready = 36
Native Hawaiian/Other Pac. Isl. N = 56 % Ready = 20
ACT Science Benchmark Score = 23
ACT PROFILE REPORT - State: SECTION III, COLLEGE READINESS & THE IMPACT OF COURSE RIGOR PAGE 22
Graduating Class 2014 Code 379999
Oklahoma
Total Students in Report: 28,682
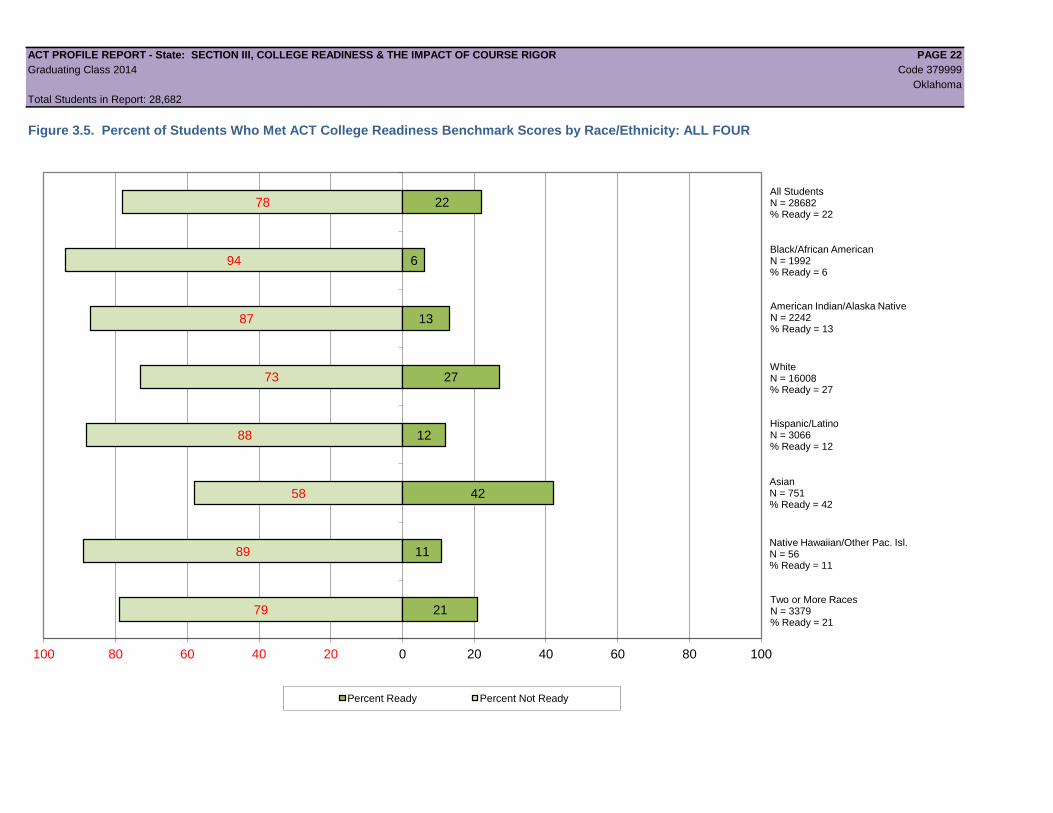
Figure 3.5. Percent of Students Who Met ACT College Readiness Benchmark Scores by Race/Ethnicity: ALL FOUR
79
89
58
88
73
87
94
78
21
11
42
12
27
13
6
22
100 80 60 40 20 0 20 40 60 80 100
Percent Ready Percent Not Ready
All Students N = 28682 % Ready = 22
Black/African American N = 1992 % Ready = 6
American Indian/Alaska Native N = 2242 % Ready = 13
White N = 16008 % Ready = 27
Hispanic/Latino N = 3066 % Ready = 12
Asian N = 751 % Ready = 42
Two or More Races N = 3379 % Ready = 21
Native Hawaiian/Other Pac. Isl. N = 56 % Ready = 11
ACT PROFILE REPORT - State: SECTION III, COLLEGE READINESS & THE IMPACT OF COURSE RIGOR PAGE 23
Graduating Class 2014 Code 379999
Oklahoma
Total Students in Report: 28,682
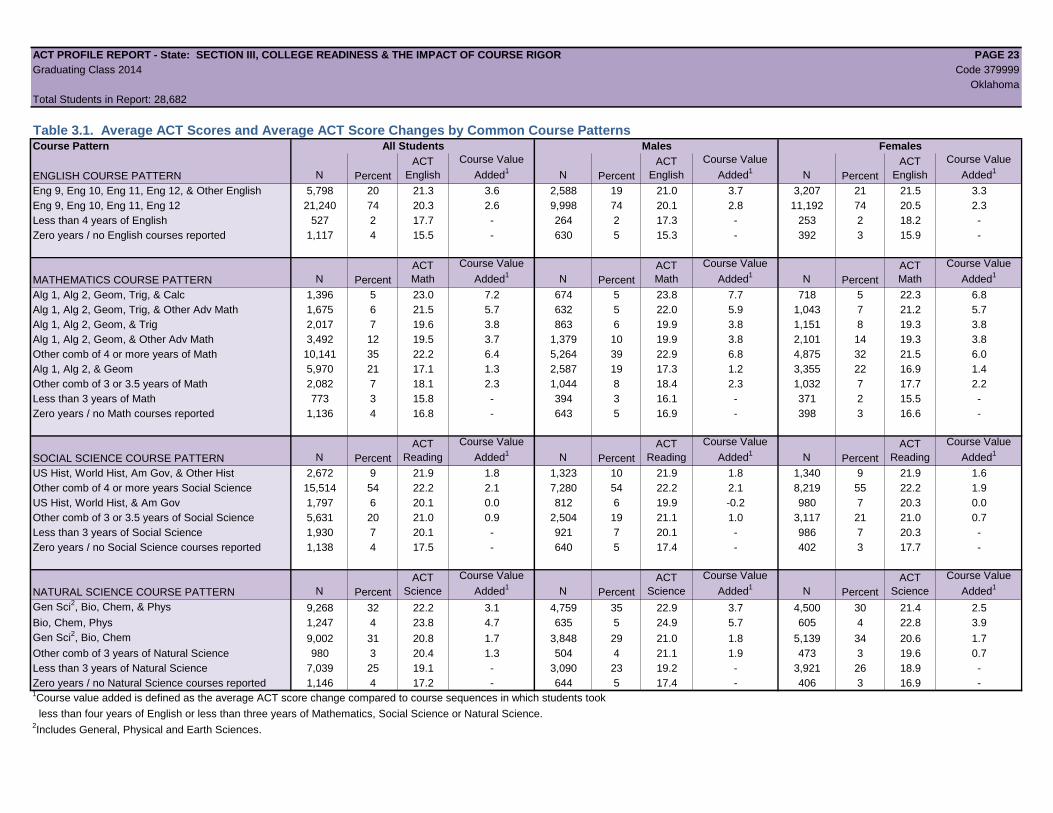
Table 3.1. Average ACT Scores and Average ACT Score Changes by Common Course PatternsCourse Pattern All Students Males Females
ENGLISH COURSE PATTERN N Percent
ACT
English
Course Value
Added1
N Percent
ACT
English
Course Value
Added1
N Percent
ACT
English
Course Value
Added1
Eng 9, Eng 10, Eng 11, Eng 12, & Other English 5,798 20 21.3 3.6 2,588 19 21.0 3.7 3,207 21 21.5 3.3
Eng 9, Eng 10, Eng 11, Eng 12 21,240 74 20.3 2.6 9,998 74 20.1 2.8 11,192 74 20.5 2.3
Less than 4 years of English 527 2 17.7 - 264 2 17.3 - 253 2 18.2 -
Zero years / no English courses reported 1,117 4 15.5 - 630 5 15.3 - 392 3 15.9 -
MATHEMATICS COURSE PATTERN N Percent
ACT
Math
Course Value
Added1
N Percent
ACT
Math
Course Value
Added1
N Percent
ACT
Math
Course Value
Added1
Alg 1, Alg 2, Geom, Trig, & Calc 1,396 5 23.0 7.2 674 5 23.8 7.7 718 5 22.3 6.8
Alg 1, Alg 2, Geom, Trig, & Other Adv Math 1,675 6 21.5 5.7 632 5 22.0 5.9 1,043 7 21.2 5.7
Alg 1, Alg 2, Geom, & Trig 2,017 7 19.6 3.8 863 6 19.9 3.8 1,151 8 19.3 3.8
Alg 1, Alg 2, Geom, & Other Adv Math 3,492 12 19.5 3.7 1,379 10 19.9 3.8 2,101 14 19.3 3.8
Other comb of 4 or more years of Math 10,141 35 22.2 6.4 5,264 39 22.9 6.8 4,875 32 21.5 6.0
Alg 1, Alg 2, & Geom 5,970 21 17.1 1.3 2,587 19 17.3 1.2 3,355 22 16.9 1.4
Other comb of 3 or 3.5 years of Math 2,082 7 18.1 2.3 1,044 8 18.4 2.3 1,032 7 17.7 2.2
Less than 3 years of Math 773 3 15.8 - 394 3 16.1 - 371 2 15.5 -
Zero years / no Math courses reported 1,136 4 16.8 - 643 5 16.9 - 398 3 16.6 -
SOCIAL SCIENCE COURSE PATTERN N Percent
ACT
Reading
Course Value
Added1
N Percent
ACT
Reading
Course Value
Added1
N Percent
ACT
Reading
Course Value
Added1
US Hist, World Hist, Am Gov, & Other Hist 2,672 9 21.9 1.8 1,323 10 21.9 1.8 1,340 9 21.9 1.6
Other comb of 4 or more years Social Science 15,514 54 22.2 2.1 7,280 54 22.2 2.1 8,219 55 22.2 1.9
US Hist, World Hist, & Am Gov 1,797 6 20.1 0.0 812 6 19.9 -0.2 980 7 20.3 0.0
Other comb of 3 or 3.5 years of Social Science 5,631 20 21.0 0.9 2,504 19 21.1 1.0 3,117 21 21.0 0.7
Less than 3 years of Social Science 1,930 7 20.1 - 921 7 20.1 - 986 7 20.3 -
Zero years / no Social Science courses reported 1,138 4 17.5 - 640 5 17.4 - 402 3 17.7 -
NATURAL SCIENCE COURSE PATTERN N Percent
ACT
Science
Course Value
Added1
N Percent
ACT
Science
Course Value
Added1
N Percent
ACT
Science
Course Value
Added1
Gen Sci2, Bio, Chem, & Phys 9,268 32 22.2 3.1 4,759 35 22.9 3.7 4,500 30 21.4 2.5
Bio, Chem, Phys 1,247 4 23.8 4.7 635 5 24.9 5.7 605 4 22.8 3.9
Gen Sci2, Bio, Chem 9,002 31 20.8 1.7 3,848 29 21.0 1.8 5,139 34 20.6 1.7
Other comb of 3 years of Natural Science 980 3 20.4 1.3 504 4 21.1 1.9 473 3 19.6 0.7
Less than 3 years of Natural Science 7,039 25 19.1 - 3,090 23 19.2 - 3,921 26 18.9 -
Zero years / no Natural Science courses reported 1,146 4 17.2 - 644 5 17.4 - 406 3 16.9 -1Course value added is defined as the average ACT score change compared to course sequences in which students took
less than four years of English or less than three years of Mathematics, Social Science or Natural Science.2Includes General, Physical and Earth Sciences.
ACT PROFILE REPORT - State: SECTION III, COLLEGE READINESS & THE IMPACT OF COURSE RIGOR PAGE 24
Graduating Class 2014 Code 379999
Oklahoma
Total Students in Report: 28,682
Table 3.2. College Readiness Percents by Common Course PatternsCourse Pattern State National
ENGLISH COURSE PATTERN N
Percent Taking
Pattern
Avg ACT
English
Percent Who Met
Benchmark N
Percent Taking
Pattern
Avg ACT
English
Percent Who Met
Benchmark
Eng 9, Eng 10, Eng 11, Eng 12, & Other English 5,798 20 21.3 72 370,875 20 21.7 73
Eng 9, Eng 10, Eng 11, Eng 12 21,240 74 20.3 66 1,305,220 71 20.5 65
Less than 4 years of English 527 2 17.7 49 88,420 5 15.9 36
Zero years / no English courses reported 1,117 4 15.5 32 81,272 4 16.3 38
MATHEMATICS COURSE PATTERN N
Percent Taking
Pattern
Avg ACT
Math
Percent Who Met
Benchmark N
Percent Taking
Pattern
Avg ACT
Math
Percent Who Met
Benchmark
Alg 1, Alg 2, Geom, Trig, & Calc 1,396 5 23.0 63 118,677 6 23.8 67
Alg 1, Alg 2, Geom, Trig, & Other Adv Math 1,675 6 21.5 50 157,764 9 21.8 55
Alg 1, Alg 2, Geom, & Trig 2,017 7 19.6 31 120,160 7 19.3 30
Alg 1, Alg 2, Geom, & Other Adv Math 3,492 12 19.5 30 356,555 19 19.4 31
Other comb of 4 or more years of Math 10,141 35 22.2 54 622,896 34 23.7 65
Alg 1, Alg 2, & Geom 5,970 21 17.1 9 220,037 12 17.1 11
Other comb of 3 or 3.5 years of Math 2,082 7 18.1 18 90,105 5 19.8 35
Less than 3 years of Math 773 3 15.8 4 74,627 4 16.4 8
Zero years / no Math courses reported 1,136 4 16.8 11 84,966 5 17.8 19
SOCIAL SCIENCE COURSE PATTERN N
Percent Taking
Pattern
Avg ACT
Reading
Percent Who Met
Benchmark N
Percent Taking
Pattern
Avg ACT
Reading
Percent Who Met
Benchmark
US Hist, World Hist, Am Gov, & Other Hist 2,672 9 21.9 49 48,992 3 22.3 50
Other comb of 4 or more years Social Science 15,514 54 22.2 50 921,129 50 22.2 50
US Hist, World Hist, & Am Gov 1,797 6 20.1 34 105,110 6 19.6 33
Other comb of 3 or 3.5 years of Social Science 5,631 20 21.0 42 504,877 27 21.3 43
Less than 3 years of Social Science 1,930 7 20.1 36 180,385 10 19.4 32
Zero years / no Social Science courses reported 1,138 4 17.5 22 85,294 5 17.8 24
NATURAL SCIENCE COURSE PATTERN N
Percent Taking
Pattern
Avg ACT
Science
Percent Who Met
Benchmark N
Percent Taking
Pattern
Avg ACT
Science
Percent Who Met
Benchmark
Gen Sci1, Bio, Chem, & Phys 9,268 32 22.2 46 781,043 42 22.1 46
Bio, Chem, Phys 1,247 4 23.8 59 199,419 11 23.1 54
Gen Sci1, Bio, Chem 9,002 31 20.8 34 505,460 27 20.0 28
Other comb of 3 years of Natural Science 980 3 20.4 32 52,236 3 19.2 24
Less than 3 years of Natural Science 7,039 25 19.1 20 220,701 12 18.1 17
Zero years / no Natural Science courses reported 1,146 4 17.2 13 86,928 5 17.7 171Includes General, Physical and Earth Sciences.
ACT PROFILE REPORT - State: SECTION IV, CAREER AND EDUCATIONAL ASPIRATIONS PAGE 25
Graduating Class 2014 Code 379999
Oklahoma
Total Students in Report: 28,682
Section IV
Career and Educational Aspirations
Beginning with the Graduating Class of 2013, all students whose scores are college reportable, both standard and extended time tests, are now included.
Also beginning with the 2013 Graduating Class data, College Readiness Benchmarks for Reading and Science were updated to reflect the most recent
college coursework research.
ACT PROFILE REPORT - State: SECTION IV, CAREER AND EDUCATIONAL ASPIRATIONS PAGE 26
Graduating Class 2014 Code 379999
Oklahoma
Total Students in Report: 28,682
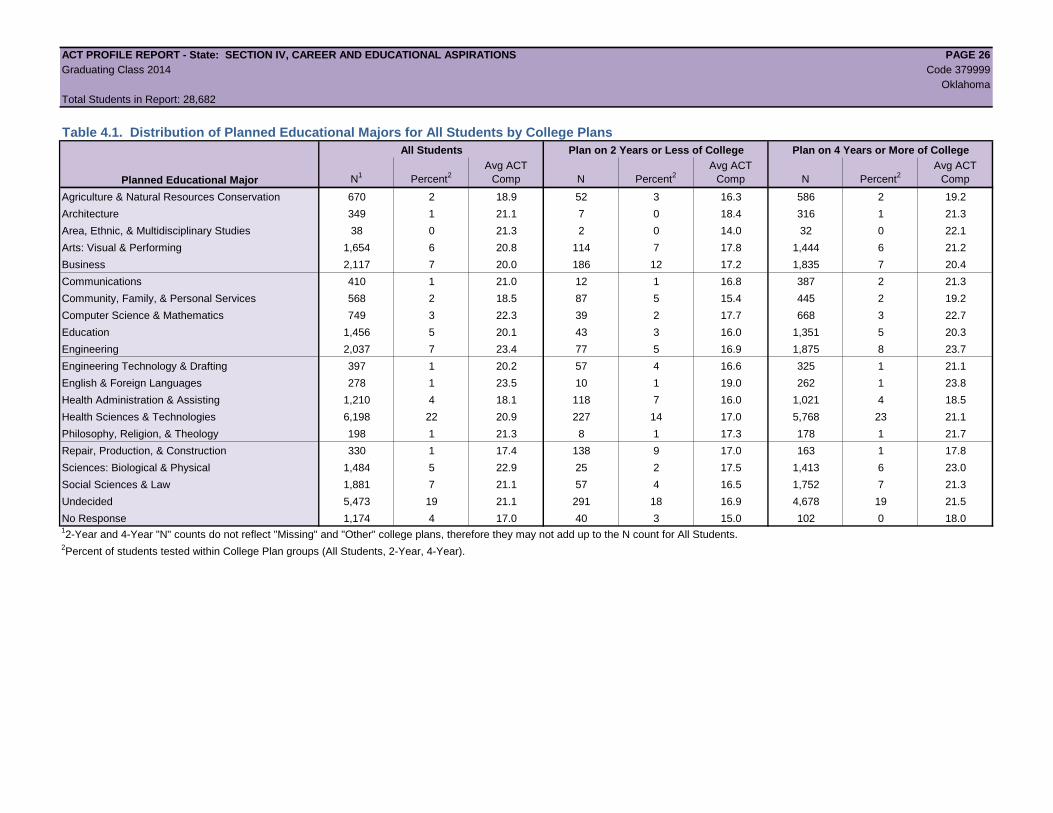
Table 4.1. Distribution of Planned Educational Majors for All Students by College Plans
All Students Plan on 2 Years or Less of College Plan on 4 Years or More of College
Planned Educational Major N1
Percent2
Avg ACT
Comp N Percent2
Avg ACT
Comp N Percent2
Avg ACT
Comp
Agriculture & Natural Resources Conservation 670 2 18.9 52 3 16.3 586 2 19.2
Architecture 349 1 21.1 7 0 18.4 316 1 21.3
Area, Ethnic, & Multidisciplinary Studies 38 0 21.3 2 0 14.0 32 0 22.1
Arts: Visual & Performing 1,654 6 20.8 114 7 17.8 1,444 6 21.2
Business 2,117 7 20.0 186 12 17.2 1,835 7 20.4
Communications 410 1 21.0 12 1 16.8 387 2 21.3
Community, Family, & Personal Services 568 2 18.5 87 5 15.4 445 2 19.2
Computer Science & Mathematics 749 3 22.3 39 2 17.7 668 3 22.7
Education 1,456 5 20.1 43 3 16.0 1,351 5 20.3
Engineering 2,037 7 23.4 77 5 16.9 1,875 8 23.7
Engineering Technology & Drafting 397 1 20.2 57 4 16.6 325 1 21.1
English & Foreign Languages 278 1 23.5 10 1 19.0 262 1 23.8
Health Administration & Assisting 1,210 4 18.1 118 7 16.0 1,021 4 18.5
Health Sciences & Technologies 6,198 22 20.9 227 14 17.0 5,768 23 21.1
Philosophy, Religion, & Theology 198 1 21.3 8 1 17.3 178 1 21.7
Repair, Production, & Construction 330 1 17.4 138 9 17.0 163 1 17.8
Sciences: Biological & Physical 1,484 5 22.9 25 2 17.5 1,413 6 23.0
Social Sciences & Law 1,881 7 21.1 57 4 16.5 1,752 7 21.3
Undecided 5,473 19 21.1 291 18 16.9 4,678 19 21.5
No Response 1,174 4 17.0 40 3 15.0 102 0 18.012-Year and 4-Year "N" counts do not reflect "Missing" and "Other" college plans, therefore they may not add up to the N count for All Students.
2Percent of students tested within College Plan groups (All Students, 2-Year, 4-Year).
ACT PROFILE REPORT - State: SECTION IV, CAREER AND EDUCATIONAL ASPIRATIONS PAGE 27
Graduating Class 2014 Code 379999
Oklahoma
Total Students in Report: 28,682
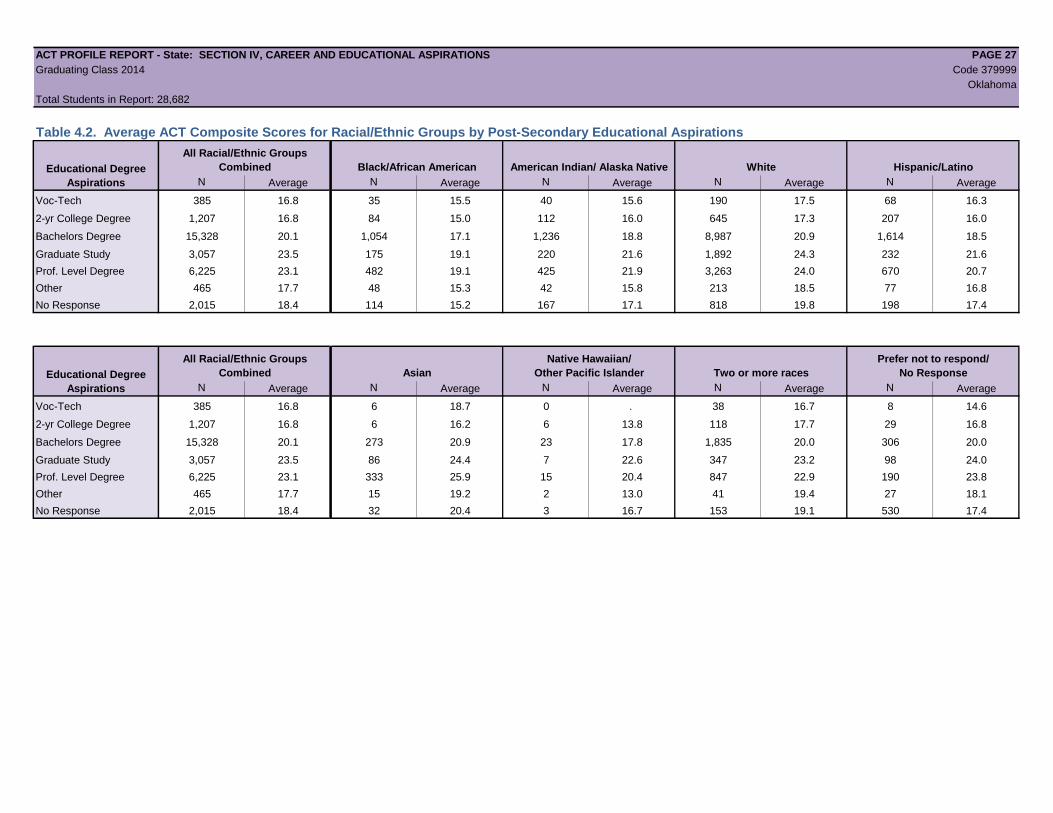
Table 4.2. Average ACT Composite Scores for Racial/Ethnic Groups by Post-Secondary Educational Aspirations
All Racial/Ethnic Groups
Combined Black/African American American Indian/ Alaska Native White Hispanic/Latino
N Average N Average N Average N Average N Average
Voc-Tech 385 16.8 35 15.5 40 15.6 190 17.5 68 16.3
2-yr College Degree 1,207 16.8 84 15.0 112 16.0 645 17.3 207 16.0
Bachelors Degree 15,328 20.1 1,054 17.1 1,236 18.8 8,987 20.9 1,614 18.5
Graduate Study 3,057 23.5 175 19.1 220 21.6 1,892 24.3 232 21.6
Prof. Level Degree 6,225 23.1 482 19.1 425 21.9 3,263 24.0 670 20.7
Other 465 17.7 48 15.3 42 15.8 213 18.5 77 16.8
No Response 2,015 18.4 114 15.2 167 17.1 818 19.8 198 17.4
All Racial/Ethnic Groups
Combined Asian
Native Hawaiian/
Other Pacific Islander Two or more races
Prefer not to respond/
No Response
N Average N Average N Average N Average N Average
Voc-Tech 385 16.8 6 18.7 0 . 38 16.7 8 14.6
2-yr College Degree 1,207 16.8 6 16.2 6 13.8 118 17.7 29 16.8
Bachelors Degree 15,328 20.1 273 20.9 23 17.8 1,835 20.0 306 20.0
Graduate Study 3,057 23.5 86 24.4 7 22.6 347 23.2 98 24.0
Prof. Level Degree 6,225 23.1 333 25.9 15 20.4 847 22.9 190 23.8
Other 465 17.7 15 19.2 2 13.0 41 19.4 27 18.1
No Response 2,015 18.4 32 20.4 3 16.7 153 19.1 530 17.4
Educational Degree
Aspirations
Educational Degree
Aspirations
ACT PROFILE REPORT - State: SECTION IV, CAREER AND EDUCATIONAL ASPIRATIONS PAGE 28
Graduating Class 2014 Code 379999
Oklahoma
Total Students in Report: 28,682
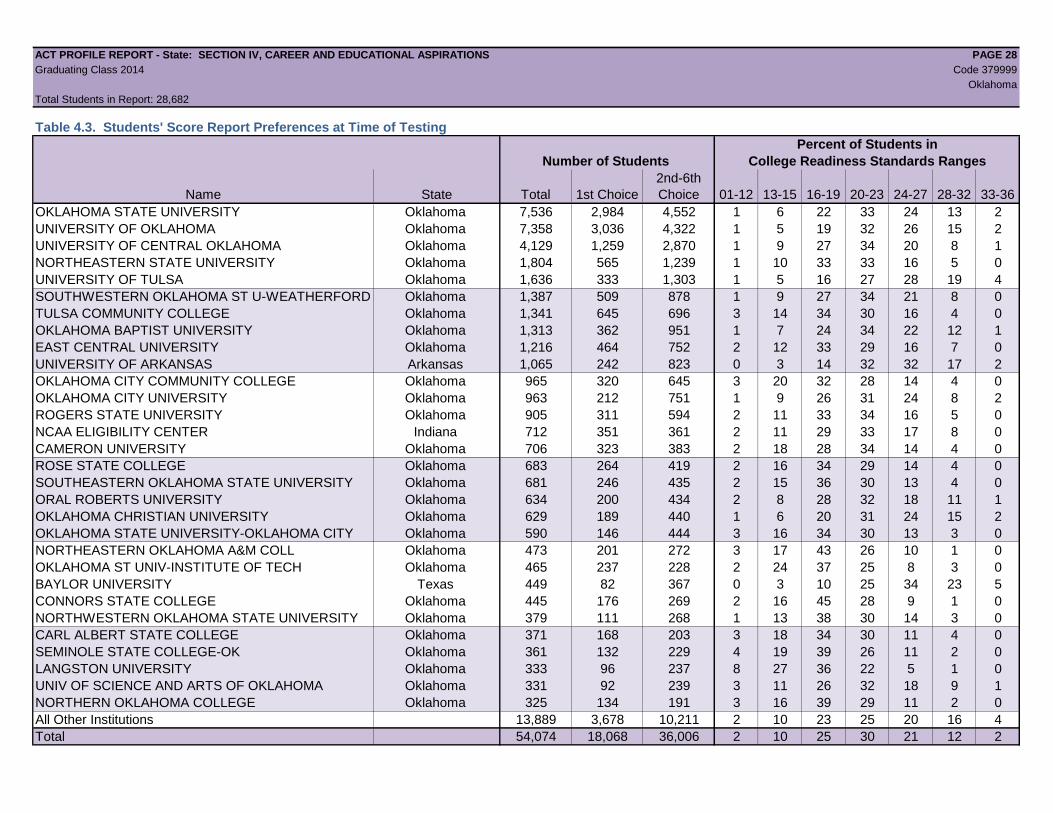
Table 4.3. Students' Score Report Preferences at Time of Testing
Percent of Students in
Number of Students College Readiness Standards Ranges
Name State Total 1st Choice
2nd-6th
Choice 01-12 13-15 16-19 20-23 24-27 28-32 33-36
OKLAHOMA STATE UNIVERSITY Oklahoma 7,536 2,984 4,552 1 6 22 33 24 13 2
UNIVERSITY OF OKLAHOMA Oklahoma 7,358 3,036 4,322 1 5 19 32 26 15 2
UNIVERSITY OF CENTRAL OKLAHOMA Oklahoma 4,129 1,259 2,870 1 9 27 34 20 8 1
NORTHEASTERN STATE UNIVERSITY Oklahoma 1,804 565 1,239 1 10 33 33 16 5 0
UNIVERSITY OF TULSA Oklahoma 1,636 333 1,303 1 5 16 27 28 19 4
SOUTHWESTERN OKLAHOMA ST U-WEATHERFORD Oklahoma 1,387 509 878 1 9 27 34 21 8 0
TULSA COMMUNITY COLLEGE Oklahoma 1,341 645 696 3 14 34 30 16 4 0
OKLAHOMA BAPTIST UNIVERSITY Oklahoma 1,313 362 951 1 7 24 34 22 12 1
EAST CENTRAL UNIVERSITY Oklahoma 1,216 464 752 2 12 33 29 16 7 0
UNIVERSITY OF ARKANSAS Arkansas 1,065 242 823 0 3 14 32 32 17 2
OKLAHOMA CITY COMMUNITY COLLEGE Oklahoma 965 320 645 3 20 32 28 14 4 0
OKLAHOMA CITY UNIVERSITY Oklahoma 963 212 751 1 9 26 31 24 8 2
ROGERS STATE UNIVERSITY Oklahoma 905 311 594 2 11 33 34 16 5 0
NCAA ELIGIBILITY CENTER Indiana 712 351 361 2 11 29 33 17 8 0
CAMERON UNIVERSITY Oklahoma 706 323 383 2 18 28 34 14 4 0
ROSE STATE COLLEGE Oklahoma 683 264 419 2 16 34 29 14 4 0
SOUTHEASTERN OKLAHOMA STATE UNIVERSITY Oklahoma 681 246 435 2 15 36 30 13 4 0
ORAL ROBERTS UNIVERSITY Oklahoma 634 200 434 2 8 28 32 18 11 1
OKLAHOMA CHRISTIAN UNIVERSITY Oklahoma 629 189 440 1 6 20 31 24 15 2
OKLAHOMA STATE UNIVERSITY-OKLAHOMA CITY Oklahoma 590 146 444 3 16 34 30 13 3 0
NORTHEASTERN OKLAHOMA A&M COLL Oklahoma 473 201 272 3 17 43 26 10 1 0
OKLAHOMA ST UNIV-INSTITUTE OF TECH Oklahoma 465 237 228 2 24 37 25 8 3 0
BAYLOR UNIVERSITY Texas 449 82 367 0 3 10 25 34 23 5
CONNORS STATE COLLEGE Oklahoma 445 176 269 2 16 45 28 9 1 0
NORTHWESTERN OKLAHOMA STATE UNIVERSITY Oklahoma 379 111 268 1 13 38 30 14 3 0
CARL ALBERT STATE COLLEGE Oklahoma 371 168 203 3 18 34 30 11 4 0
SEMINOLE STATE COLLEGE-OK Oklahoma 361 132 229 4 19 39 26 11 2 0
LANGSTON UNIVERSITY Oklahoma 333 96 237 8 27 36 22 5 1 0
UNIV OF SCIENCE AND ARTS OF OKLAHOMA Oklahoma 331 92 239 3 11 26 32 18 9 1
NORTHERN OKLAHOMA COLLEGE Oklahoma 325 134 191 3 16 39 29 11 2 0
All Other Institutions 13,889 3,678 10,211 2 10 23 25 20 16 4
Total 54,074 18,068 36,006 2 10 25 30 21 12 2
ACT PROFILE REPORT - State: SECTION V, OPTIONAL WRITING TEST RESULTS PAGE 29
Graduating Class 2014 Code 379999
Oklahoma
Total Students in Report: 28,682
Section V
Optional Writing Test Results
Beginning with the Graduating Class of 2013, all students whose scores are college reportable, both standard and extended time tests, are now included.
Also beginning with the 2013 Graduating Class data, College Readiness Benchmarks for Reading and Science were updated to reflect the most recent
college coursework research.
ACT PROFILE REPORT - State: SECTION V, OPTIONAL WRITING TEST RESULTS PAGE 30
Graduating Class 2014 Code 379999
Oklahoma
Total Students in Report: 28,682
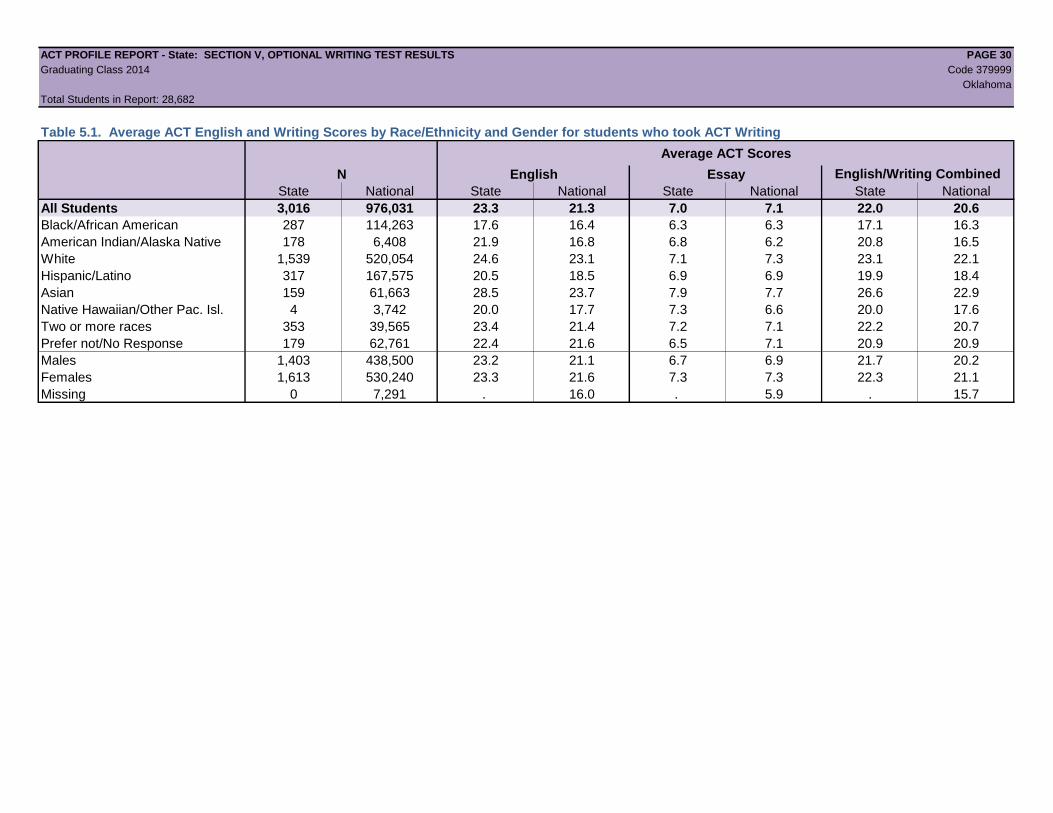
Table 5.1. Average ACT English and Writing Scores by Race/Ethnicity and Gender for students who took ACT Writing
Average ACT Scores
N English Essay
State National State National State National State National
All Students 3,016 976,031 23.3 21.3 7.0 7.1 22.0 20.6
Black/African American 287 114,263 17.6 16.4 6.3 6.3 17.1 16.3
American Indian/Alaska Native 178 6,408 21.9 16.8 6.8 6.2 20.8 16.5
White 1,539 520,054 24.6 23.1 7.1 7.3 23.1 22.1
Hispanic/Latino 317 167,575 20.5 18.5 6.9 6.9 19.9 18.4
Asian 159 61,663 28.5 23.7 7.9 7.7 26.6 22.9
Native Hawaiian/Other Pac. Isl. 4 3,742 20.0 17.7 7.3 6.6 20.0 17.6
Two or more races 353 39,565 23.4 21.4 7.2 7.1 22.2 20.7
Prefer not/No Response 179 62,761 22.4 21.6 6.5 7.1 20.9 20.9
Males 1,403 438,500 23.2 21.1 6.7 6.9 21.7 20.2
Females 1,613 530,240 23.3 21.6 7.3 7.3 22.3 21.1
Missing 0 7,291 . 16.0 . 5.9 . 15.7
English/Writing Combined