Embed Size (px)
Citation preview
Profile Report - State
Graduating Class 2016
New Mexico
ACT, INC. -- CONFIDENTIAL*070066110*
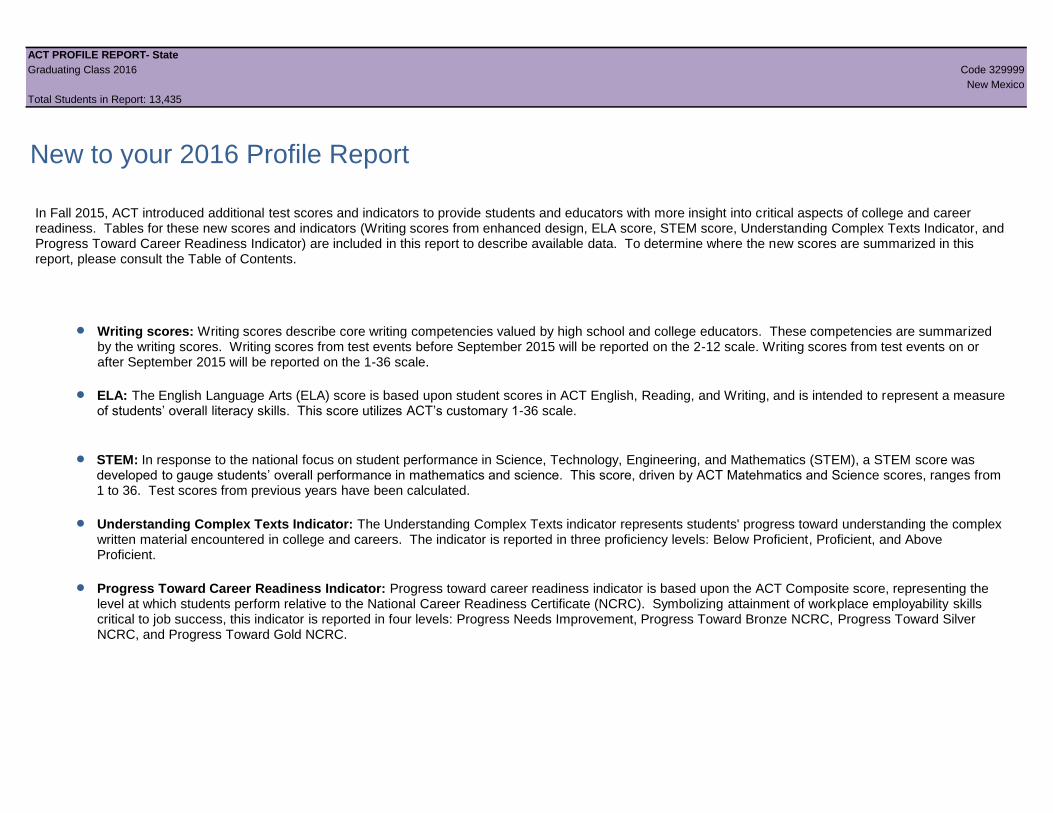
ACT PROFILE REPORT- State
Graduating Class 2016 Code 329999
New Mexico
Total Students in Report: 13,435
New to your 2016 Profile Report
●
●
●
●
●
In Fall 2015, ACT introduced additional test scores and indicators to provide students and educators with more insight into critical aspects of college and career readiness. Tables for these new scores and indicators (Writing scores from enhanced design, ELA score, STEM score, Understanding Complex Texts Indicator, and Progress Toward Career Readiness Indicator) are included in this report to describe available data. To determine where the new scores are summarized in this report, please consult the Table of Contents.
Writing scores: Writing scores describe core writing competencies valued by high school and college educators. These competencies are summarized by the writing scores. Writing scores from test events before September 2015 will be reported on the 2-12 scale. Writing scores from test events on or after September 2015 will be reported on the 1-36 scale.
ELA: The English Language Arts (ELA) score is based upon student scores in ACT English, Reading, and Writing, and is intended to represent a measure of students’ overall literacy skills. This score utilizes ACT’s customary 1-36 scale.
STEM: In response to the national focus on student performance in Science, Technology, Engineering, and Mathematics (STEM), a STEM score was developed to gauge students’ overall performance in mathematics and science. This score, driven by ACT Matehmatics and Science scores, ranges from 1 to 36. Test scores from previous years have been calculated.
Understanding Complex Texts Indicator: The Understanding Complex Texts indicator represents students' progress toward understanding the complex written material encountered in college and careers. The indicator is reported in three proficiency levels: Below Proficient, Proficient, and Above Proficient.
Progress Toward Career Readiness Indicator: Progress toward career readiness indicator is based upon the ACT Composite score, representing the level at which students perform relative to the National Career Readiness Certificate (NCRC). Symbolizing attainment of workplace employability skills critical to job success, this indicator is reported in four levels: Progress Needs Improvement, Progress Toward Bronze NCRC, Progress Toward Silver NCRC, and Progress Toward Gold NCRC.
ACT PROFILE REPORT - State PAGE 1
Graduating Class 2016 Code 329999
New Mexico
Total Students in Report: 13,435
Table of Contents
Section I: Executive Summary Page 5Percent of Your Students Ready for College-Level Coursework
Five Year Trends—Percent of Students Who Met College Readiness Benchmarks
Five Year Trends—Average ACT Scores
Five Year Trends—Average ACT Scores by Level of Preparation
Five Year Trends—Percent and Average Composite Score by Race/Ethnicity
Five Year Trends—Achievement in STEM
Proficiency Toward Understanding Complex Text
Average ACT College Reportable Scores by Test Session Duration
Percent of Students Who Met College Readiness Benchmark Scores by Test Session Duration
Section II: Academic Achievement Page 11ACT Score Distributions, Cumulative Percentages, Averages, and Quartile Values
Average ACT Composite Scores for Race/Ethnicity by Level of Preparation
Average ACT Scores by Race/Ethnicity
Average ACT Composite Scores for Gender by Level of Preparation
Average ACT Scores by Gender
Section III: College Readiness & Impact of Course Rigor Page 17Percent of Students in College and Career Readiness Standards (CCRS) Score Ranges
Percent of Students Who Met ACT College Readiness Benchmark Scores by Gender and Race/Ethnicity
Progress Toward National Career Readiness Certificates
College Readiness Benchmark Percent and Average ACT Scores by Overall High School Curriculum
College Readiness Benchmark Percent and Average ACT Scores by Content-Specific Curriculum
College Readiness Benchmark Percent and Average ACT Scores by Common Course Patterns
Section IV: Career and Educational Aspirations Page 23Distribution of Planned Educational Majors for All Students by College Plans
Average ACT Composite Scores for Racial/Ethnic Groups by Post-Secondary Educational Aspirations
Students' Score Report Preferences at Time of Testing
Section V: Optional Writing Test Results Page 27Average ACT Total Writing and English/Language Arts Scores by Race/Ethnicity and Gender
ACT PROFILE REPORT - State PAGE 2
Graduating Class 2016 Code 329999
New Mexico
Total Students in Report: 13,435
This report focuses on:
Performance - student test performance in the context of college readiness
Access - number of your graduates exposed to college entrance testing and the percent of race/ethnicity participation
Course Selection - percent of students pursuing a core curriculum
Course Rigor - impact of rigorous coursework on achievement
College Readiness - percent of students meeting ACT College Readiness Benchmark Scores in each content area
Awareness - extent to which student aspirations match performance
Articulation - colleges and universities to which your students send test results
This report provides information about the performance of your 2016 graduating seniors who took the ACT as
sophomores, juniors, or seniors; and self-reported at the time of testing that they were scheduled to graduate in 2016.
Beginning with the Graduating Class of 2013, all students whose scores are college reportable, both standard and
extended time tests, are now included in the report.
Each year, test data for a school, district, and the state represents a different cohort of students. ACT encourages
educators to focus on trends (3, 5, 10 years), not year-to-year changes. Such changes can represent normal – even
expected – fluctuations. On the other hand, trend lines offer more insight into what is happening in a school, district, or
the state.
Furthermore, ACT encourages educators to measure student performance in the context of college readiness measures.
The focus should be on the number and percentage of students who met or exceeded ACT’s College Readiness
Benchmark Scores, a measure that is much more meaningful and understandable than an average composite score for a
group of students.
ACT PROFILE REPORT - State PAGE 3
Graduating Class 2016 Code 329999
New Mexico
Total Students in Report: 13,435
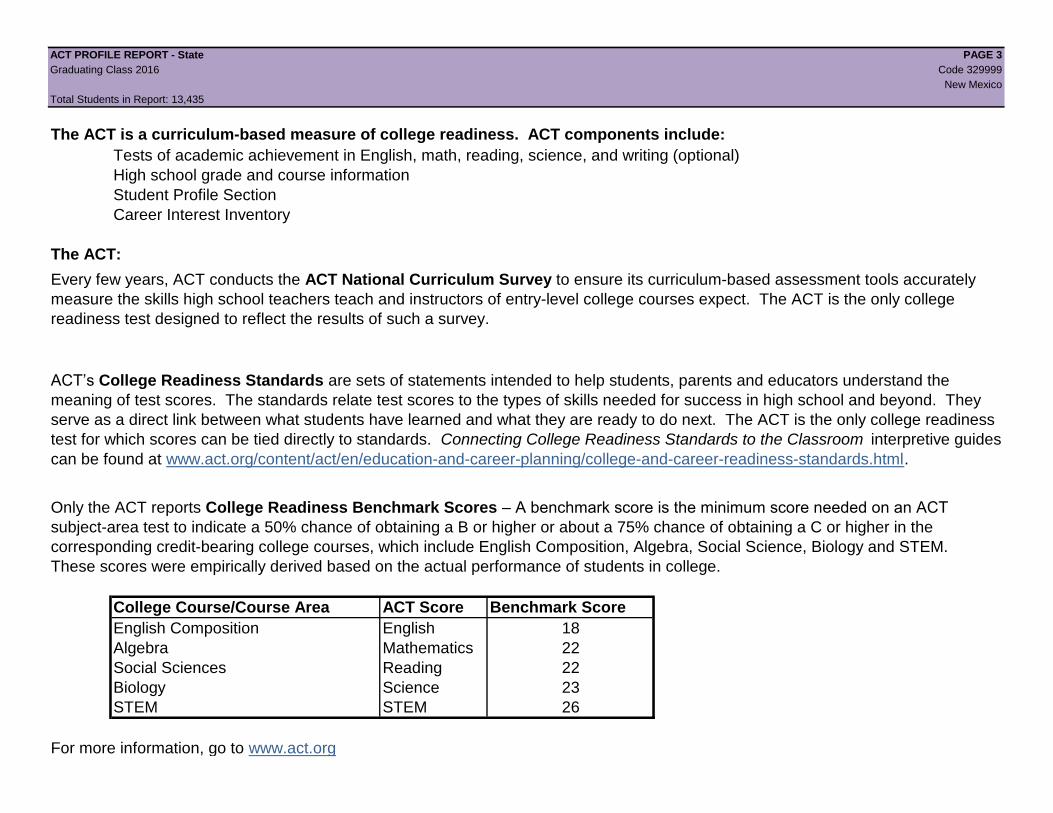
The ACT is a curriculum-based measure of college readiness. ACT components include:
Tests of academic achievement in English, math, reading, science, and writing (optional)
High school grade and course information
Student Profile Section
Career Interest Inventory
The ACT:
College Course/Course Area ACT Score Benchmark Score
English Composition English 18
Algebra Mathematics 22
Social Sciences Reading 22
Biology Science 23
STEM STEM 26
For more information, go to www.act.org
Every few years, ACT conducts the ACT National Curriculum Survey to ensure its curriculum-based assessment tools accurately
measure the skills high school teachers teach and instructors of entry-level college courses expect. The ACT is the only college
readiness test designed to reflect the results of such a survey.
Only the ACT reports College Readiness Benchmark Scores – A benchmark score is the minimum score needed on an ACT
subject-area test to indicate a 50% chance of obtaining a B or higher or about a 75% chance of obtaining a C or higher in the
corresponding credit-bearing college courses, which include English Composition, Algebra, Social Science, Biology and STEM.
These scores were empirically derived based on the actual performance of students in college.
ACT’s College Readiness Standards are sets of statements intended to help students, parents and educators understand the
meaning of test scores. The standards relate test scores to the types of skills needed for success in high school and beyond. They
serve as a direct link between what students have learned and what they are ready to do next. The ACT is the only college readiness
test for which scores can be tied directly to standards. Connecting College Readiness Standards to the Classroom interpretive guides
can be found at www.act.org/content/act/en/education-and-career-planning/college-and-career-readiness-standards.html.
ACT PROFILE REPORT - State PAGE 4
Graduating Class 2016 Code 329999
New Mexico
Total Students in Report: 13,435
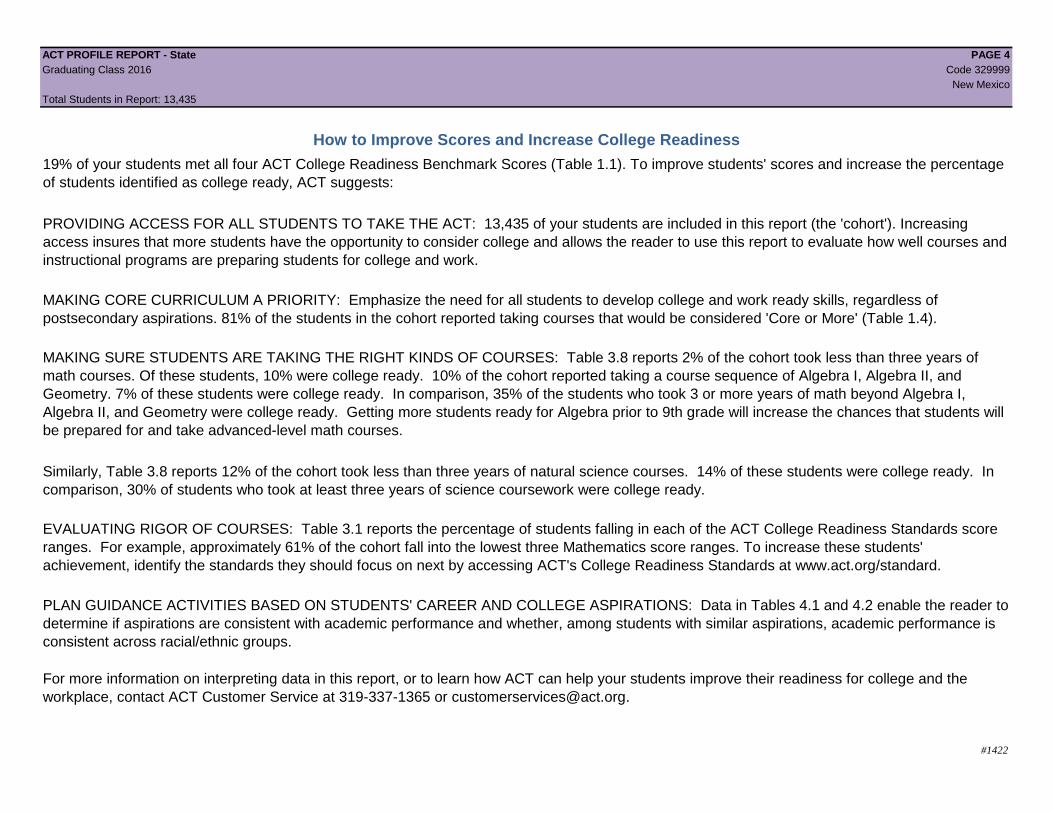
How to Improve Scores and Increase College Readiness
#1422
For more information on interpreting data in this report, or to learn how ACT can help your students improve their readiness for college and the
workplace, contact ACT Customer Service at 319-337-1365 or [email protected].
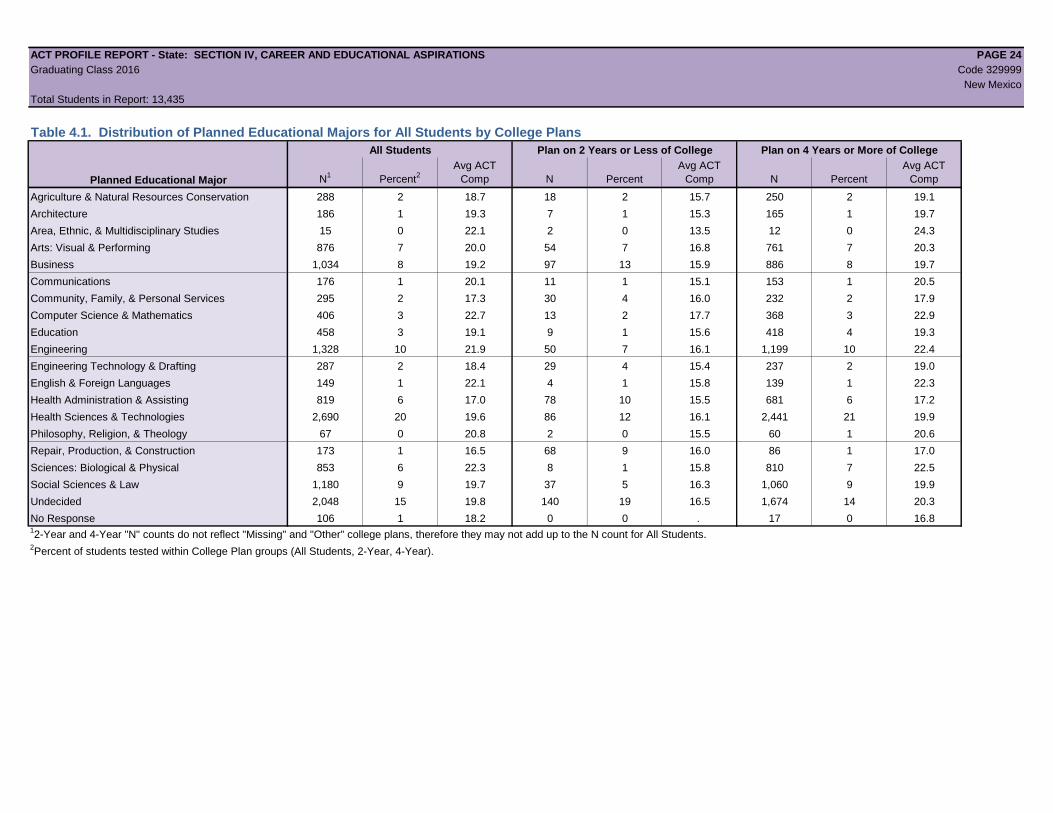
PLAN GUIDANCE ACTIVITIES BASED ON STUDENTS' CAREER AND COLLEGE ASPIRATIONS: Data in Tables 4.1 and 4.2 enable the reader to
determine if aspirations are consistent with academic performance and whether, among students with similar aspirations, academic performance is
consistent across racial/ethnic groups.
EVALUATING RIGOR OF COURSES: Table 3.1 reports the percentage of students falling in each of the ACT College Readiness Standards score
ranges. For example, approximately 61% of the cohort fall into the lowest three Mathematics score ranges. To increase these students'
achievement, identify the standards they should focus on next by accessing ACT's College Readiness Standards at www.act.org/standard.
19% of your students met all four ACT College Readiness Benchmark Scores (Table 1.1). To improve students' scores and increase the percentage
of students identified as college ready, ACT suggests:
PROVIDING ACCESS FOR ALL STUDENTS TO TAKE THE ACT: 13,435 of your students are included in this report (the 'cohort'). Increasing
access insures that more students have the opportunity to consider college and allows the reader to use this report to evaluate how well courses and
instructional programs are preparing students for college and work.
MAKING CORE CURRICULUM A PRIORITY: Emphasize the need for all students to develop college and work ready skills, regardless of
postsecondary aspirations. 81% of the students in the cohort reported taking courses that would be considered 'Core or More' (Table 1.4).
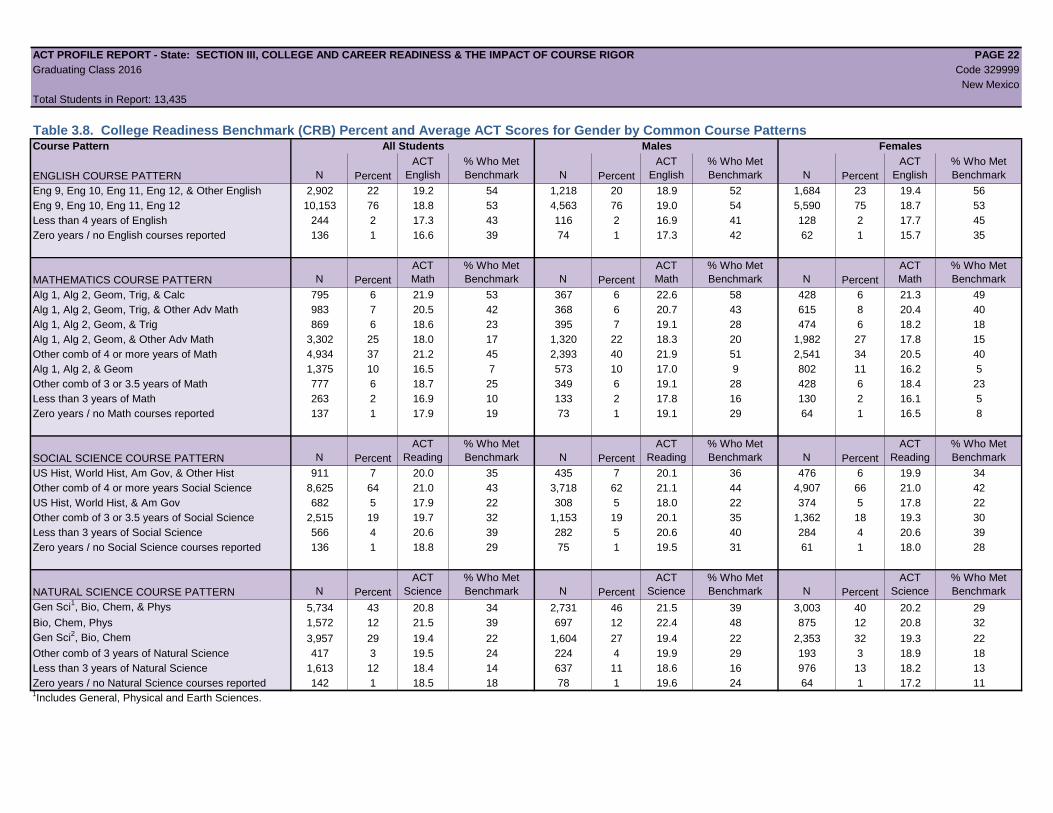
MAKING SURE STUDENTS ARE TAKING THE RIGHT KINDS OF COURSES: Table 3.8 reports 2% of the cohort took less than three years of
math courses. Of these students, 10% were college ready. 10% of the cohort reported taking a course sequence of Algebra I, Algebra II, and
Geometry. 7% of these students were college ready. In comparison, 35% of the students who took 3 or more years of math beyond Algebra I,
Algebra II, and Geometry were college ready. Getting more students ready for Algebra prior to 9th grade will increase the chances that students will
be prepared for and take advanced-level math courses.
Similarly, Table 3.8 reports 12% of the cohort took less than three years of natural science courses. 14% of these students were college ready. In
comparison, 30% of students who took at least three years of science coursework were college ready.
ACT PROFILE REPORT - State: SECTION I, EXECUTIVE SUMMARY PAGE 5
Graduating Class 2016 Code 329999
New Mexico
Total Students in Report: 13,435
Section I
Executive Summary
To find the results of only standard time or extended time test takers, refer to Tables 1.7 and 1.8 on page 9.
Beginning in August of 2013, all students whose scores are college reportable, both standard and extended time tests, are now included.
Also beginning in August 2013 Graduating Class data, College Readiness Benchmarks for Reading and Science were updated to reflect the most recent
college coursework research.
ACT PROFILE REPORT - State: SECTION I, EXECUTIVE SUMMARY PAGE 6
Graduating Class 2016 Code 329999
New Mexico
Total Students in Report: 13,435
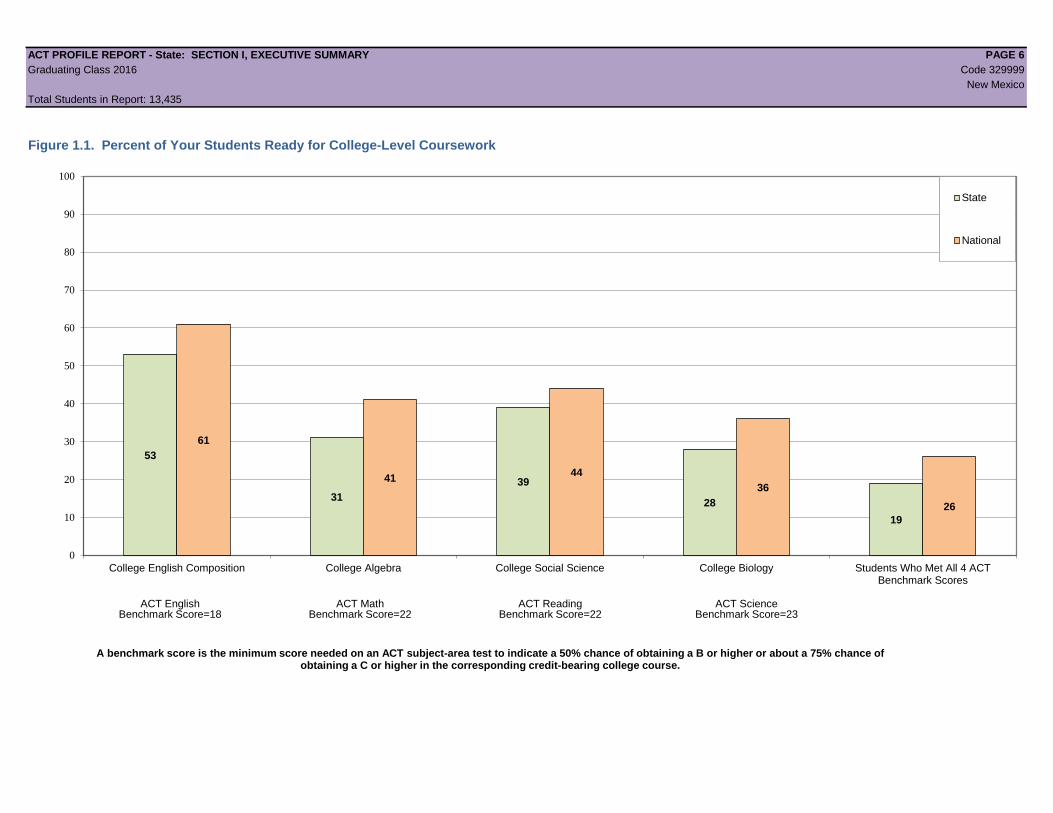
Figure 1.1. Percent of Your Students Ready for College-Level Coursework
53
31
39
28
19
61
4144
36
26
0
10
20
30
40
50
60
70
80
90
100
College English Composition College Algebra College Social Science College Biology Students Who Met All 4 ACTBenchmark Scores
A benchmark score is the minimum score needed on an ACT subject-area test to indicate a 50% chance of obtaining a B or higher or about a 75% chance of obtaining a C or higher in the corresponding credit-bearing college course.
State
National
ACT EnglishBenchmark Score=18
ACT MathBenchmark Score=22
ACT ReadingBenchmark Score=22
ACT ScienceBenchmark Score=23
ACT PROFILE REPORT - State: SECTION I, EXECUTIVE SUMMARY PAGE 7
Graduating Class 2016 Code 329999
New Mexico
Total Students in Report: 13,435
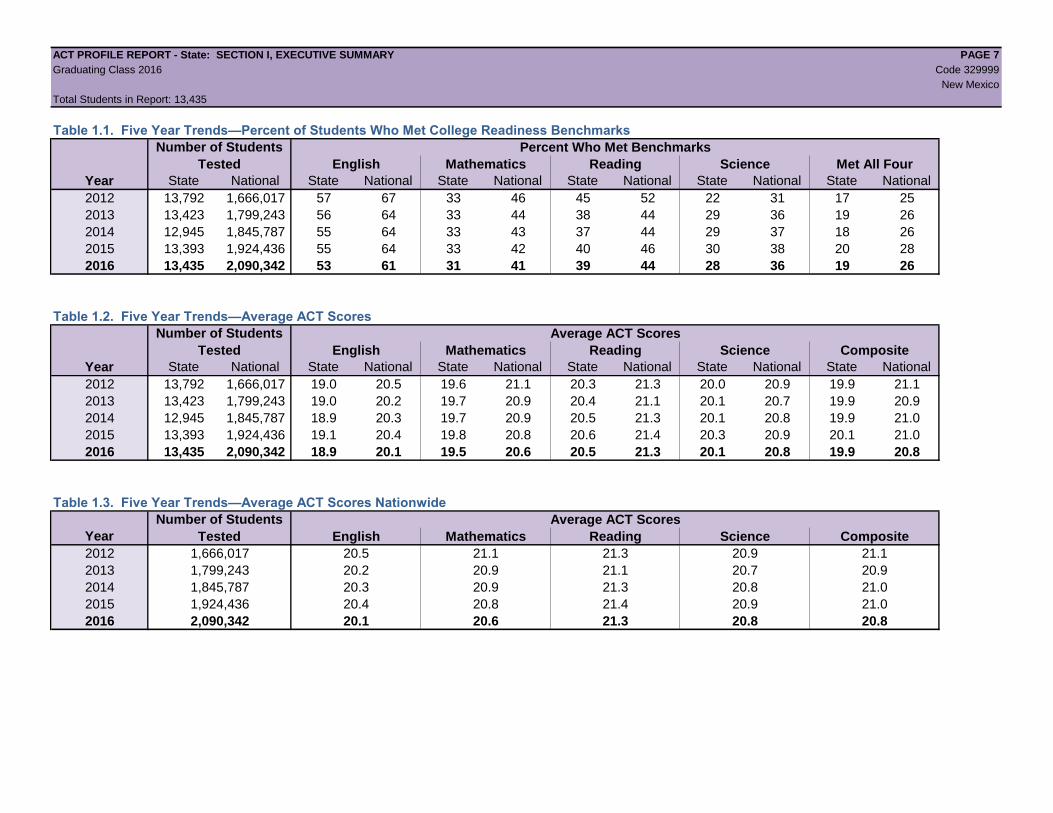
Table 1.1. Five Year Trends—Percent of Students Who Met College Readiness Benchmarks
Percent Who Met Benchmarks
English Mathematics Reading Science Met All Four
Year State National State National State National State National State National State National
2012 13,792 1,666,017 57 67 33 46 45 52 22 31 17 25
2013 13,423 1,799,243 56 64 33 44 38 44 29 36 19 26
2014 12,945 1,845,787 55 64 33 43 37 44 29 37 18 26
2015 13,393 1,924,436 55 64 33 42 40 46 30 38 20 28
2016 13,435 2,090,342 53 61 31 41 39 44 28 36 19 26
Table 1.2. Five Year Trends—Average ACT Scores
Average ACT Scores
English Mathematics Reading Science Composite
Year State National State National State National State National State National State National
2012 13,792 1,666,017 19.0 20.5 19.6 21.1 20.3 21.3 20.0 20.9 19.9 21.1
2013 13,423 1,799,243 19.0 20.2 19.7 20.9 20.4 21.1 20.1 20.7 19.9 20.9
2014 12,945 1,845,787 18.9 20.3 19.7 20.9 20.5 21.3 20.1 20.8 19.9 21.0
2015 13,393 1,924,436 19.1 20.4 19.8 20.8 20.6 21.4 20.3 20.9 20.1 21.0
2016 13,435 2,090,342 18.9 20.1 19.5 20.6 20.5 21.3 20.1 20.8 19.9 20.8
Table 1.3. Five Year Trends—Average ACT Scores Nationwide
Average ACT Scores
Year English Mathematics Reading Science Composite
2012 1,666,017 20.5 21.1 21.3 20.9 21.1
2013 1,799,243 20.2 20.9 21.1 20.7 20.9
2014 1,845,787 20.3 20.9 21.3 20.8 21.0
2015 1,924,436 20.4 20.8 21.4 20.9 21.0
2016 2,090,342 20.1 20.6 21.3 20.8 20.8
Number of Students
Tested
Number of Students
Tested
Number of Students
Tested
ACT PROFILE REPORT - State: SECTION I, EXECUTIVE SUMMARY PAGE 8
Graduating Class 2016 Code 329999
New Mexico
Total Students in Report: 13,435
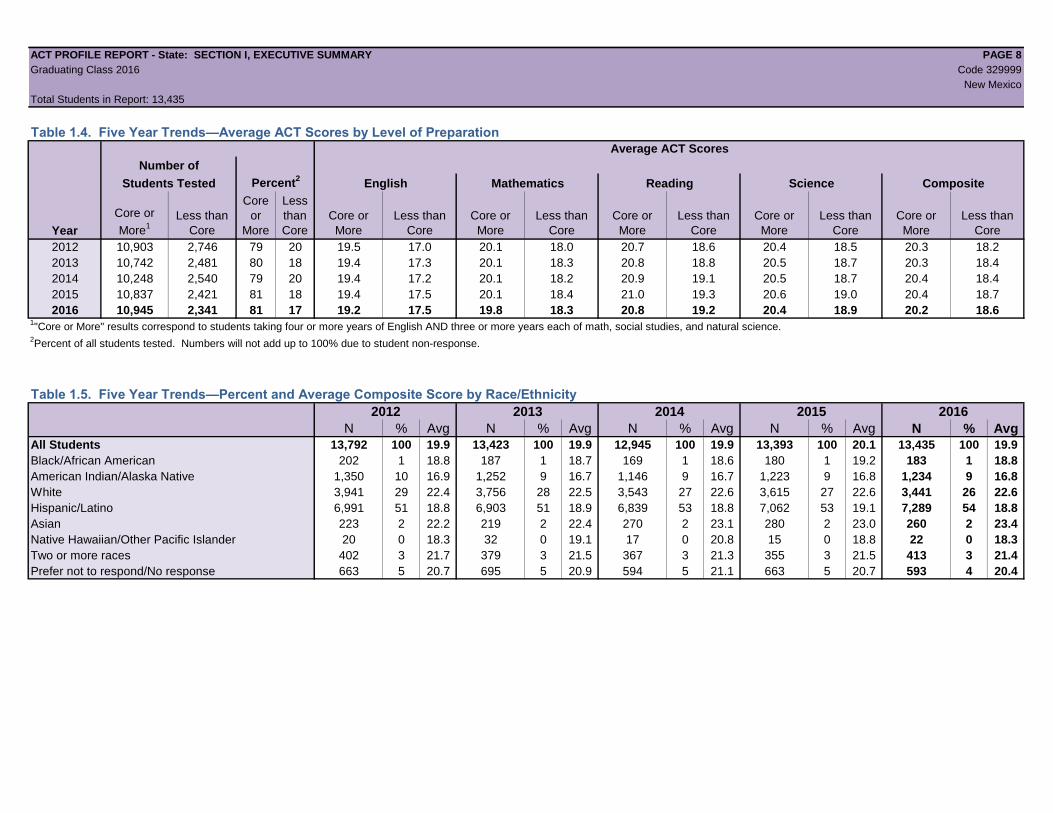
Table 1.4. Five Year Trends—Average ACT Scores by Level of Preparation
Average ACT Scores
Number of
Students Tested Percent2
English Mathematics Reading Science Composite
Year
Core or
More1
Less than
Core
Core
or
More
Less
than
Core
Core or
More
Less than
Core
Core or
More
Less than
Core
Core or
More
Less than
Core
Core or
More
Less than
Core
Core or
More
Less than
Core
2012 10,903 2,746 79 20 19.5 17.0 20.1 18.0 20.7 18.6 20.4 18.5 20.3 18.2
2013 10,742 2,481 80 18 19.4 17.3 20.1 18.3 20.8 18.8 20.5 18.7 20.3 18.4
2014 10,248 2,540 79 20 19.4 17.2 20.1 18.2 20.9 19.1 20.5 18.7 20.4 18.4
2015 10,837 2,421 81 18 19.4 17.5 20.1 18.4 21.0 19.3 20.6 19.0 20.4 18.7
2016 10,945 2,341 81 17 19.2 17.5 19.8 18.3 20.8 19.2 20.4 18.9 20.2 18.61"Core or More" results correspond to students taking four or more years of English AND three or more years each of math, social studies, and natural science.
2Percent of all students tested. Numbers will not add up to 100% due to student non-response.
Table 1.5. Five Year Trends—Percent and Average Composite Score by Race/Ethnicity
2012 2013 2014 2015 2016
N % Avg N % Avg N % Avg N % Avg N % Avg
All Students 13,792 100 19.9 13,423 100 19.9 12,945 100 19.9 13,393 100 20.1 13,435 100 19.9
Black/African American 202 1 18.8 187 1 18.7 169 1 18.6 180 1 19.2 183 1 18.8
American Indian/Alaska Native 1,350 10 16.9 1,252 9 16.7 1,146 9 16.7 1,223 9 16.8 1,234 9 16.8
White 3,941 29 22.4 3,756 28 22.5 3,543 27 22.6 3,615 27 22.6 3,441 26 22.6
Hispanic/Latino 6,991 51 18.8 6,903 51 18.9 6,839 53 18.8 7,062 53 19.1 7,289 54 18.8
Asian 223 2 22.2 219 2 22.4 270 2 23.1 280 2 23.0 260 2 23.4
Native Hawaiian/Other Pacific Islander 20 0 18.3 32 0 19.1 17 0 20.8 15 0 18.8 22 0 18.3
Two or more races 402 3 21.7 379 3 21.5 367 3 21.3 355 3 21.5 413 3 21.4
Prefer not to respond/No response 663 5 20.7 695 5 20.9 594 5 21.1 663 5 20.7 593 4 20.4
ACT PROFILE REPORT - State: SECTION I, EXECUTIVE SUMMARY PAGE 9
Graduating Class 2016 Code 329999
New Mexico
Total Students in Report: 13,435
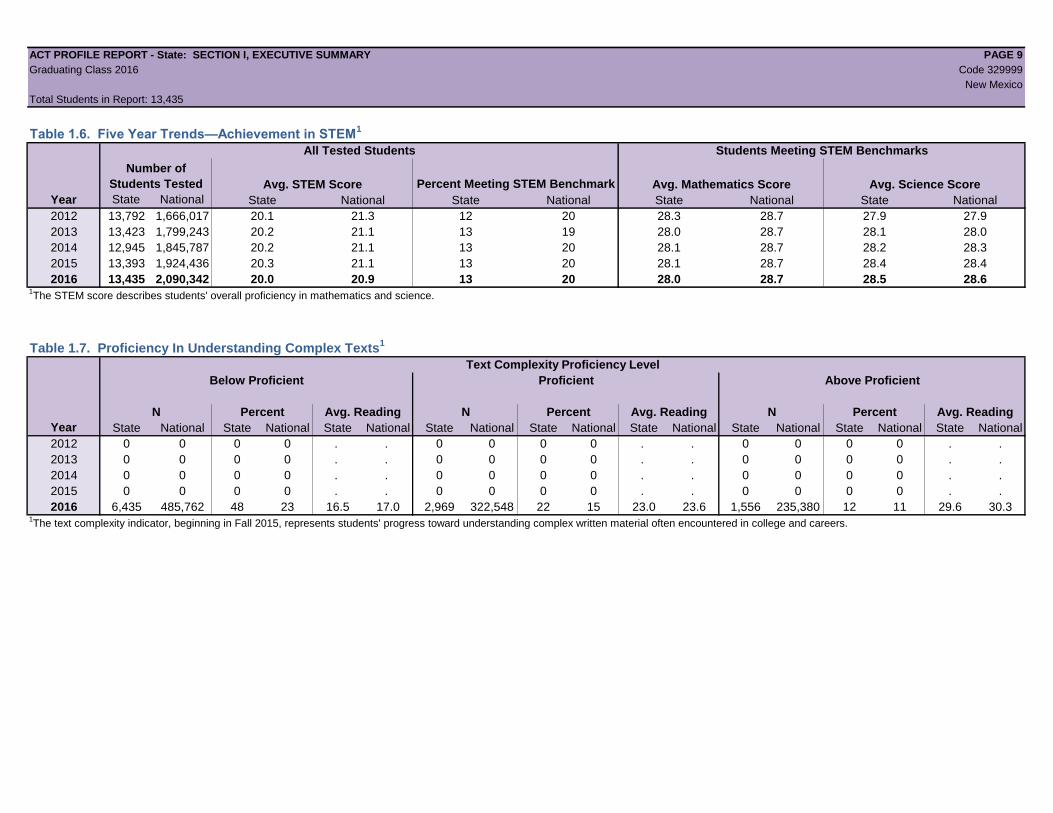
Table 1.6. Five Year Trends—Achievement in STEM1
All Tested Students Students Meeting STEM Benchmarks
Number of
Students Tested Avg. STEM Score Percent Meeting STEM Benchmark Avg. Mathematics Score Avg. Science Score
Year State National State National State National State National State National
2012 13,792 1,666,017 20.1 21.3 12 20 28.3 28.7 27.9 27.9
2013 13,423 1,799,243 20.2 21.1 13 19 28.0 28.7 28.1 28.0
2014 12,945 1,845,787 20.2 21.1 13 20 28.1 28.7 28.2 28.3
2015 13,393 1,924,436 20.3 21.1 13 20 28.1 28.7 28.4 28.4
2016 13,435 2,090,342 20.0 20.9 13 20 28.0 28.7 28.5 28.61The STEM score describes students' overall proficiency in mathematics and science.
Table 1.7. Proficiency In Understanding Complex Texts1
Text Complexity Proficiency Level
Below Proficient Proficient Above Proficient
N Percent Avg. Reading N Percent Avg. Reading N Percent Avg. Reading
Year State National State National State National State National State National State National State National State National State National
2012 0 0 0 0 . . 0 0 0 0 . . 0 0 0 0 . .
2013 0 0 0 0 . . 0 0 0 0 . . 0 0 0 0 . .
2014 0 0 0 0 . . 0 0 0 0 . . 0 0 0 0 . .
2015 0 0 0 0 . . 0 0 0 0 . . 0 0 0 0 . .
2016 6,435 485,762 48 23 16.5 17.0 2,969 322,548 22 15 23.0 23.6 1,556 235,380 12 11 29.6 30.31The text complexity indicator, beginning in Fall 2015, represents students' progress toward understanding complex written material often encountered in college and careers.
ACT PROFILE REPORT - State: SECTION I, EXECUTIVE SUMMARY PAGE 10
Graduating Class 2016 Code 329999
New Mexico
Total Students in Report: 13,435
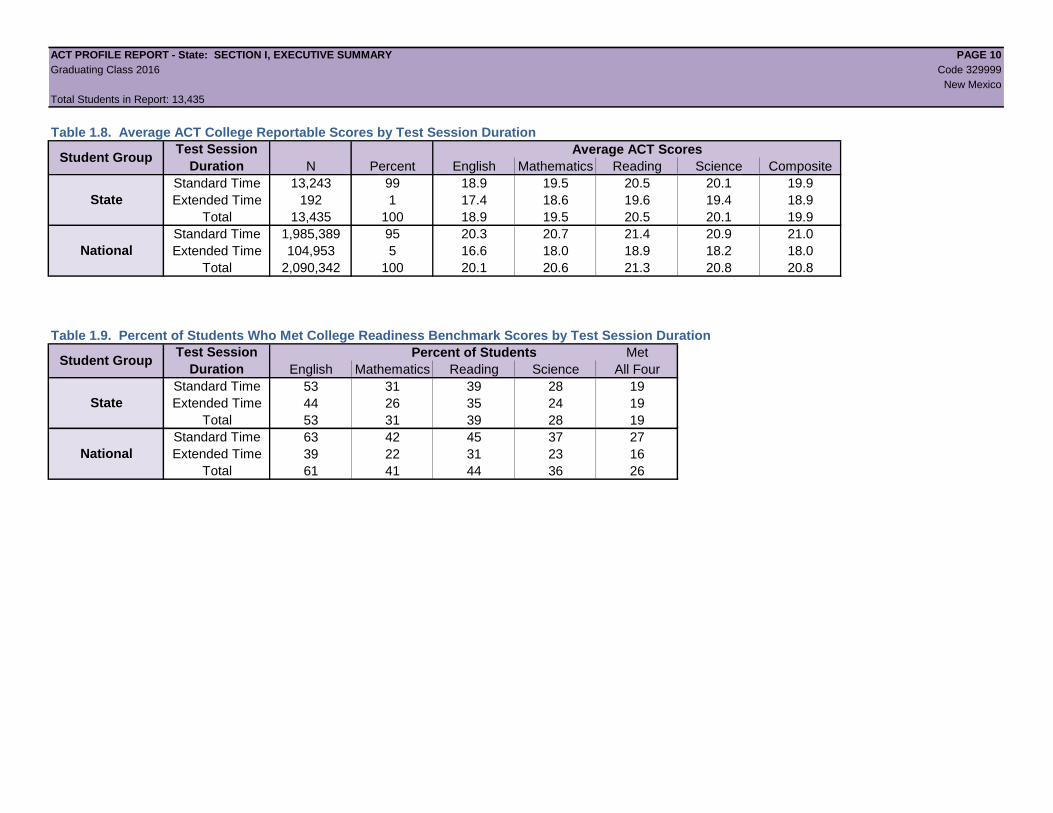
Table 1.8. Average ACT College Reportable Scores by Test Session Duration
Average ACT Scores
N Percent English Mathematics Reading Science Composite
Standard Time 13,243 99 18.9 19.5 20.5 20.1 19.9
Extended Time 192 1 17.4 18.6 19.6 19.4 18.9
Total 13,435 100 18.9 19.5 20.5 20.1 19.9
Standard Time 1,985,389 95 20.3 20.7 21.4 20.9 21.0
Extended Time 104,953 5 16.6 18.0 18.9 18.2 18.0
Total 2,090,342 100 20.1 20.6 21.3 20.8 20.8
Table 1.9. Percent of Students Who Met College Readiness Benchmark Scores by Test Session Duration
Percent of Students Met
English Mathematics Reading Science All Four
Standard Time 53 31 39 28 19
Extended Time 44 26 35 24 19
Total 53 31 39 28 19
Standard Time 63 42 45 37 27
Extended Time 39 22 31 23 16
Total 61 41 44 36 26
State
National
Student GroupTest Session
Duration
State
National
Student GroupTest Session
Duration
ACT PROFILE REPORT- State: SECTION II, ACADEMIC ACHIEVEMENT PAGE 11
Graduating Class 2016 Code 329999
New Mexico
Total Students in Report: 13,435
Section II
Academic Achievement
Beginning with the Graduating Class of 2013, all students whose scores are college reportable, both standard and extended time tests, are now included.
Also beginning with the 2013 Graduating Class data, College Readiness Benchmarks for Reading and Science were updated to reflect the most recent
college coursework research.
ACT PROFILE REPORT- State: SECTION II, ACADEMIC ACHIEVEMENT PAGE 12
Graduating Class 2016 Code 329999
New Mexico
Total Students in Report: 13,435
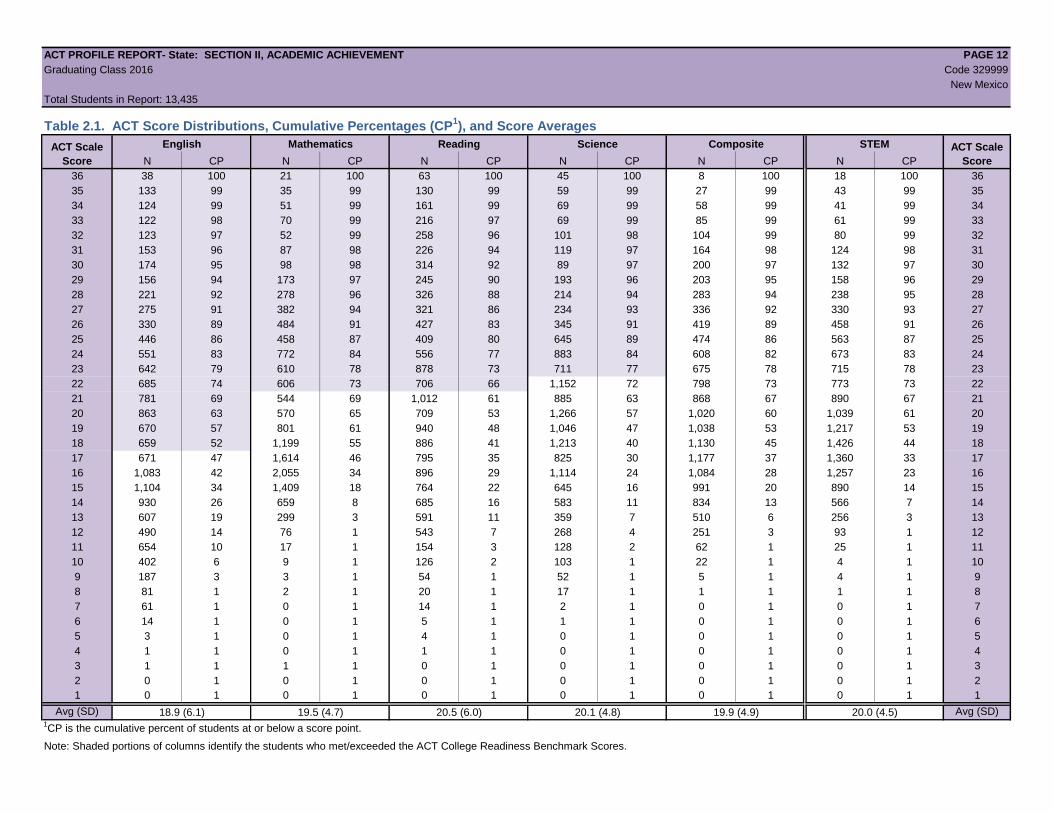
Table 2.1. ACT Score Distributions, Cumulative Percentages (CP1), and Score Averages
English Mathematics Reading Science Composite STEM
N CP N CP N CP N CP N CP N CP
36 38 100 21 100 63 100 45 100 8 100 18 100 36
35 133 99 35 99 130 99 59 99 27 99 43 99 35
34 124 99 51 99 161 99 69 99 58 99 41 99 34
33 122 98 70 99 216 97 69 99 85 99 61 99 33
32 123 97 52 99 258 96 101 98 104 99 80 99 32
31 153 96 87 98 226 94 119 97 164 98 124 98 31
30 174 95 98 98 314 92 89 97 200 97 132 97 30
29 156 94 173 97 245 90 193 96 203 95 158 96 29
28 221 92 278 96 326 88 214 94 283 94 238 95 28
27 275 91 382 94 321 86 234 93 336 92 330 93 27
26 330 89 484 91 427 83 345 91 419 89 458 91 26
25 446 86 458 87 409 80 645 89 474 86 563 87 25
24 551 83 772 84 556 77 883 84 608 82 673 83 24
23 642 79 610 78 878 73 711 77 675 78 715 78 23
22 685 74 606 73 706 66 1,152 72 798 73 773 73 22
21 781 69 544 69 1,012 61 885 63 868 67 890 67 21
20 863 63 570 65 709 53 1,266 57 1,020 60 1,039 61 20
19 670 57 801 61 940 48 1,046 47 1,038 53 1,217 53 19
18 659 52 1,199 55 886 41 1,213 40 1,130 45 1,426 44 18
17 671 47 1,614 46 795 35 825 30 1,177 37 1,360 33 17
16 1,083 42 2,055 34 896 29 1,114 24 1,084 28 1,257 23 16
15 1,104 34 1,409 18 764 22 645 16 991 20 890 14 15
14 930 26 659 8 685 16 583 11 834 13 566 7 14
13 607 19 299 3 591 11 359 7 510 6 256 3 13
12 490 14 76 1 543 7 268 4 251 3 93 1 12
11 654 10 17 1 154 3 128 2 62 1 25 1 11
10 402 6 9 1 126 2 103 1 22 1 4 1 10
9 187 3 3 1 54 1 52 1 5 1 4 1 9
8 81 1 2 1 20 1 17 1 1 1 1 1 8
7 61 1 0 1 14 1 2 1 0 1 0 1 7
6 14 1 0 1 5 1 1 1 0 1 0 1 6
5 3 1 0 1 4 1 0 1 0 1 0 1 5
4 1 1 0 1 1 1 0 1 0 1 0 1 4
3 1 1 1 1 0 1 0 1 0 1 0 1 3
2 0 1 0 1 0 1 0 1 0 1 0 1 2
1 0 1 0 1 0 1 0 1 0 1 0 1 1
Avg (SD) 18.9 (6.1) 19.5 (4.7) 20.5 (6.0) 20.1 (4.8) 19.9 (4.9) 20.0 (4.5) Avg (SD)1CP is the cumulative percent of students at or below a score point.
Note: Shaded portions of columns identify the students who met/exceeded the ACT College Readiness Benchmark Scores.
ACT Scale
Score
ACT Scale
Score
ACT PROFILE REPORT- State: SECTION II, ACADEMIC ACHIEVEMENT PAGE 13
Graduating Class 2016 Code 329999
New Mexico
Total Students in Report: 13,435
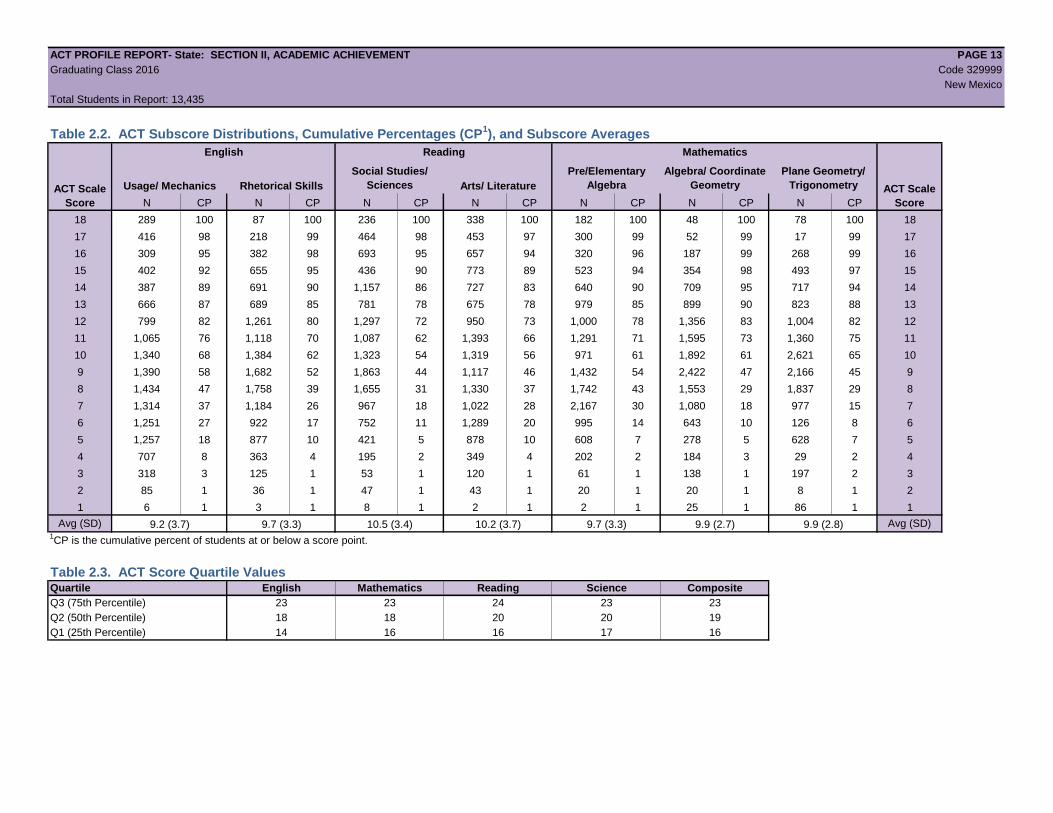
Table 2.2. ACT Subscore Distributions, Cumulative Percentages (CP1), and Subscore Averages
English Reading Mathematics
Usage/ Mechanics Rhetorical Skills
Social Studies/
Sciences Arts/ Literature
Pre/Elementary
Algebra
Algebra/ Coordinate
Geometry
Plane Geometry/
Trigonometry
N CP N CP N CP N CP N CP N CP N CP
18 289 100 87 100 236 100 338 100 182 100 48 100 78 100 18
17 416 98 218 99 464 98 453 97 300 99 52 99 17 99 17
16 309 95 382 98 693 95 657 94 320 96 187 99 268 99 16
15 402 92 655 95 436 90 773 89 523 94 354 98 493 97 15
14 387 89 691 90 1,157 86 727 83 640 90 709 95 717 94 14
13 666 87 689 85 781 78 675 78 979 85 899 90 823 88 13
12 799 82 1,261 80 1,297 72 950 73 1,000 78 1,356 83 1,004 82 12
11 1,065 76 1,118 70 1,087 62 1,393 66 1,291 71 1,595 73 1,360 75 11
10 1,340 68 1,384 62 1,323 54 1,319 56 971 61 1,892 61 2,621 65 10
9 1,390 58 1,682 52 1,863 44 1,117 46 1,432 54 2,422 47 2,166 45 9
8 1,434 47 1,758 39 1,655 31 1,330 37 1,742 43 1,553 29 1,837 29 8
7 1,314 37 1,184 26 967 18 1,022 28 2,167 30 1,080 18 977 15 7
6 1,251 27 922 17 752 11 1,289 20 995 14 643 10 126 8 6
5 1,257 18 877 10 421 5 878 10 608 7 278 5 628 7 5
4 707 8 363 4 195 2 349 4 202 2 184 3 29 2 4
3 318 3 125 1 53 1 120 1 61 1 138 1 197 2 3
2 85 1 36 1 47 1 43 1 20 1 20 1 8 1 2
1 6 1 3 1 8 1 2 1 2 1 25 1 86 1 1
Avg (SD) 9.2 (3.7) 9.7 (3.3) 10.5 (3.4) 10.2 (3.7) 9.7 (3.3) 9.9 (2.7) 9.9 (2.8) Avg (SD)1CP is the cumulative percent of students at or below a score point.
Table 2.3. ACT Score Quartile ValuesQuartile English Mathematics Reading Science Composite
Q3 (75th Percentile) 23 23 24 23 23
Q2 (50th Percentile) 18 18 20 20 19
Q1 (25th Percentile) 14 16 16 17 16
ACT Scale
Score
ACT Scale
Score
ACT PROFILE REPORT- State: SECTION II, ACADEMIC ACHIEVEMENT PAGE 14
Graduating Class 2016 Code 329999
New Mexico
Total Students in Report: 13,435
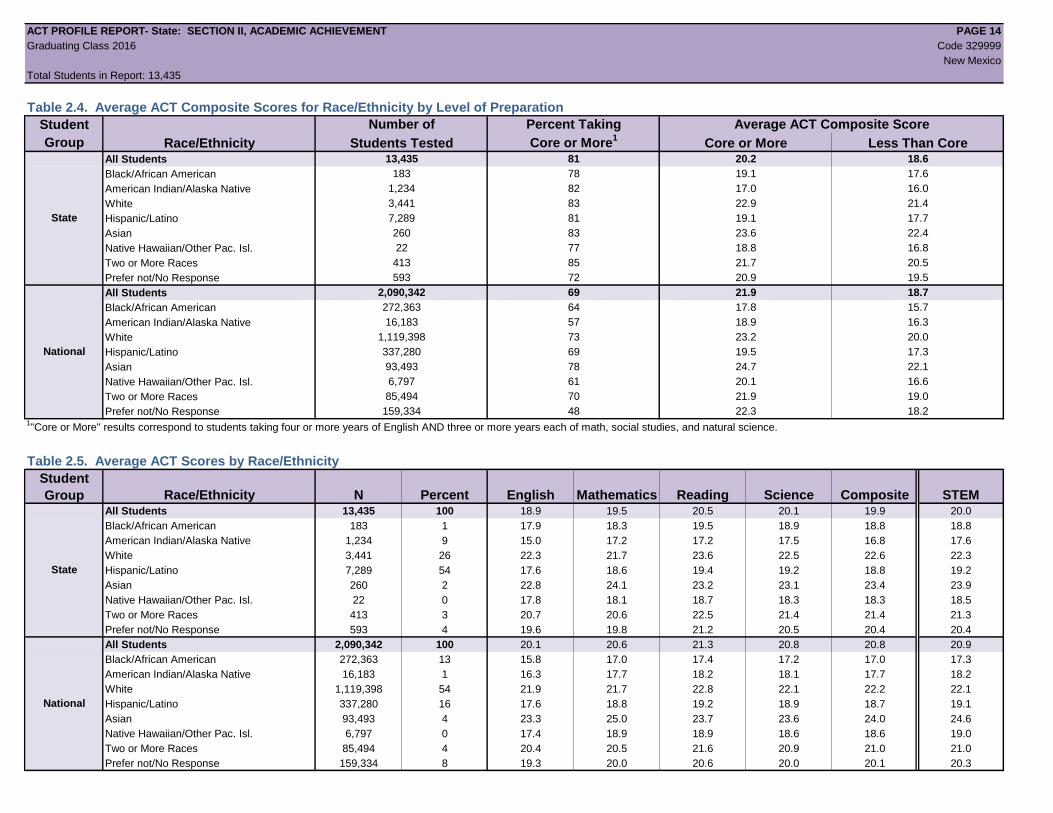
Table 2.4. Average ACT Composite Scores for Race/Ethnicity by Level of Preparation
Student Number of Percent Taking Average ACT Composite Score
Group Race/Ethnicity Students Tested Core or More1
Core or More Less Than CoreAll Students 13,435 81 20.2 18.6
Black/African American 183 78 19.1 17.6
American Indian/Alaska Native 1,234 82 17.0 16.0
White 3,441 83 22.9 21.4
Hispanic/Latino 7,289 81 19.1 17.7
Asian 260 83 23.6 22.4
Native Hawaiian/Other Pac. Isl. 22 77 18.8 16.8
Two or More Races 413 85 21.7 20.5
Prefer not/No Response 593 72 20.9 19.5
All Students 2,090,342 69 21.9 18.7
Black/African American 272,363 64 17.8 15.7
American Indian/Alaska Native 16,183 57 18.9 16.3
White 1,119,398 73 23.2 20.0
Hispanic/Latino 337,280 69 19.5 17.3
Asian 93,493 78 24.7 22.1
Native Hawaiian/Other Pac. Isl. 6,797 61 20.1 16.6
Two or More Races 85,494 70 21.9 19.0
Prefer not/No Response 159,334 48 22.3 18.21"Core or More" results correspond to students taking four or more years of English AND three or more years each of math, social studies, and natural science.
Table 2.5. Average ACT Scores by Race/Ethnicity
Student
Group Race/Ethnicity N Percent English Mathematics Reading Science Composite STEMAll Students 13,435 100 18.9 19.5 20.5 20.1 19.9 20.0
Black/African American 183 1 17.9 18.3 19.5 18.9 18.8 18.8
American Indian/Alaska Native 1,234 9 15.0 17.2 17.2 17.5 16.8 17.6
White 3,441 26 22.3 21.7 23.6 22.5 22.6 22.3
Hispanic/Latino 7,289 54 17.6 18.6 19.4 19.2 18.8 19.2
Asian 260 2 22.8 24.1 23.2 23.1 23.4 23.9
Native Hawaiian/Other Pac. Isl. 22 0 17.8 18.1 18.7 18.3 18.3 18.5
Two or More Races 413 3 20.7 20.6 22.5 21.4 21.4 21.3
Prefer not/No Response 593 4 19.6 19.8 21.2 20.5 20.4 20.4
All Students 2,090,342 100 20.1 20.6 21.3 20.8 20.8 20.9
Black/African American 272,363 13 15.8 17.0 17.4 17.2 17.0 17.3
American Indian/Alaska Native 16,183 1 16.3 17.7 18.2 18.1 17.7 18.2
White 1,119,398 54 21.9 21.7 22.8 22.1 22.2 22.1
Hispanic/Latino 337,280 16 17.6 18.8 19.2 18.9 18.7 19.1
Asian 93,493 4 23.3 25.0 23.7 23.6 24.0 24.6
Native Hawaiian/Other Pac. Isl. 6,797 0 17.4 18.9 18.9 18.6 18.6 19.0
Two or More Races 85,494 4 20.4 20.5 21.6 20.9 21.0 21.0
Prefer not/No Response 159,334 8 19.3 20.0 20.6 20.0 20.1 20.3
National
State
National
State
ACT PROFILE REPORT- State: SECTION II, ACADEMIC ACHIEVEMENT PAGE 15
Graduating Class 2016 Code 329999
New Mexico
Total Students in Report: 13,435
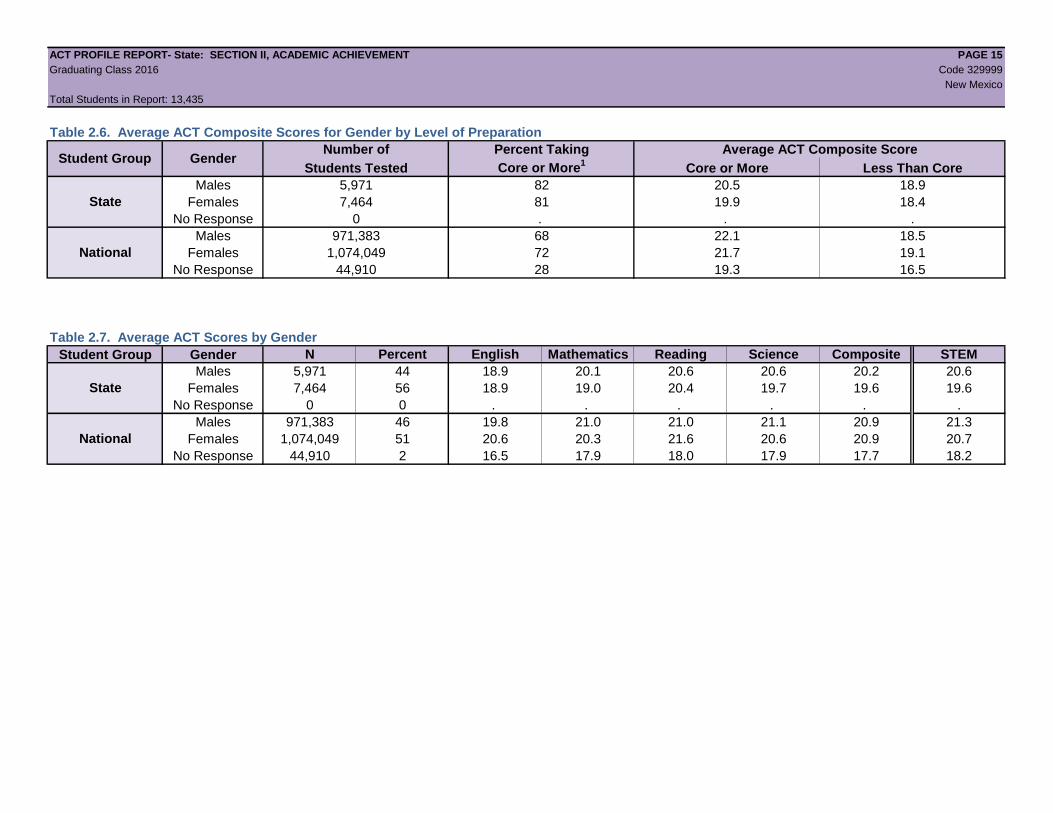
Table 2.6. Average ACT Composite Scores for Gender by Level of Preparation
Number of Percent Taking Average ACT Composite Score
Students Tested Core or More1
Core or More Less Than Core
Males 5,971 82 20.5 18.9
Females 7,464 81 19.9 18.4
No Response 0 . . .
Males 971,383 68 22.1 18.5
Females 1,074,049 72 21.7 19.1
No Response 44,910 28 19.3 16.5
Table 2.7. Average ACT Scores by Gender
Student Group Gender N Percent English Mathematics Reading Science Composite STEM
Males 5,971 44 18.9 20.1 20.6 20.6 20.2 20.6
Females 7,464 56 18.9 19.0 20.4 19.7 19.6 19.6
No Response 0 0 . . . . . .
Males 971,383 46 19.8 21.0 21.0 21.1 20.9 21.3
Females 1,074,049 51 20.6 20.3 21.6 20.6 20.9 20.7
No Response 44,910 2 16.5 17.9 18.0 17.9 17.7 18.2
National
Student Group
State
National
Gender
State
ACT PROFILE REPORT- State: SECTION II, ACADEMIC ACHIEVEMENT PAGE 16
Graduating Class 2016 Code 329999
New Mexico
Total Students in Report: 13,435
This page intentionally left blank.
ACT PROFILE REPORT - State: SECTION III, COLLEGE AND CAREER READINESS & THE IMPACT OF COURSE RIGOR PAGE 17
Graduating Class 2016 Code 329999
New Mexico
Total Students in Report: 13,435
Section III
College and Career Readiness
and the Impact of Course Rigor
Beginning with the Graduating Class of 2013, all students whose scores are college reportable, both standard and extended time tests, are now included.
Also beginning with the 2013 Graduating Class data, College Readiness Benchmarks for Reading and Science were updated to reflect the most recent
college coursework research.
ACT PROFILE REPORT - State: SECTION III, COLLEGE AND CAREER READINESS & THE IMPACT OF COURSE RIGOR PAGE 18
Graduating Class 2016 Code 329999
New Mexico
Total Students in Report: 13,435
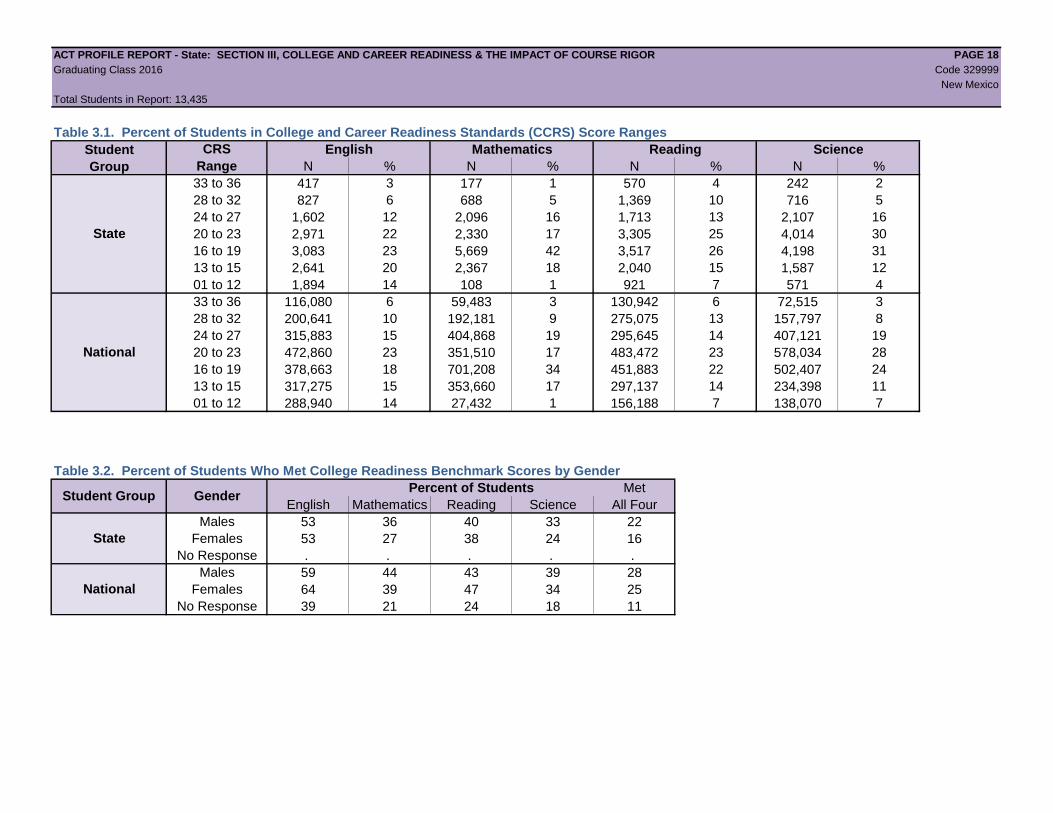
Table 3.1. Percent of Students in College and Career Readiness Standards (CCRS) Score Ranges
Student English Mathematics Reading Science
Group N % N % N % N %
33 to 36 417 3 177 1 570 4 242 2
28 to 32 827 6 688 5 1,369 10 716 5
24 to 27 1,602 12 2,096 16 1,713 13 2,107 16
20 to 23 2,971 22 2,330 17 3,305 25 4,014 30
16 to 19 3,083 23 5,669 42 3,517 26 4,198 31
13 to 15 2,641 20 2,367 18 2,040 15 1,587 12
01 to 12 1,894 14 108 1 921 7 571 4
33 to 36 116,080 6 59,483 3 130,942 6 72,515 3
28 to 32 200,641 10 192,181 9 275,075 13 157,797 8
24 to 27 315,883 15 404,868 19 295,645 14 407,121 19
20 to 23 472,860 23 351,510 17 483,472 23 578,034 28
16 to 19 378,663 18 701,208 34 451,883 22 502,407 24
13 to 15 317,275 15 353,660 17 297,137 14 234,398 11
01 to 12 288,940 14 27,432 1 156,188 7 138,070 7
Table 3.2. Percent of Students Who Met College Readiness Benchmark Scores by Gender
Percent of Students Met
English Mathematics Reading Science All Four
Males 53 36 40 33 22
Females 53 27 38 24 16
No Response . . . . .
Males 59 44 43 39 28
Females 64 39 47 34 25
No Response 39 21 24 18 11
National
Student Group
CRS
Range
State
National
Gender
State
ACT PROFILE REPORT - State: SECTION III, COLLEGE AND CAREER READINESS & THE IMPACT OF COURSE RIGOR PAGE 19
Graduating Class 2016 Code 329999
New Mexico
Total Students in Report: 13,435
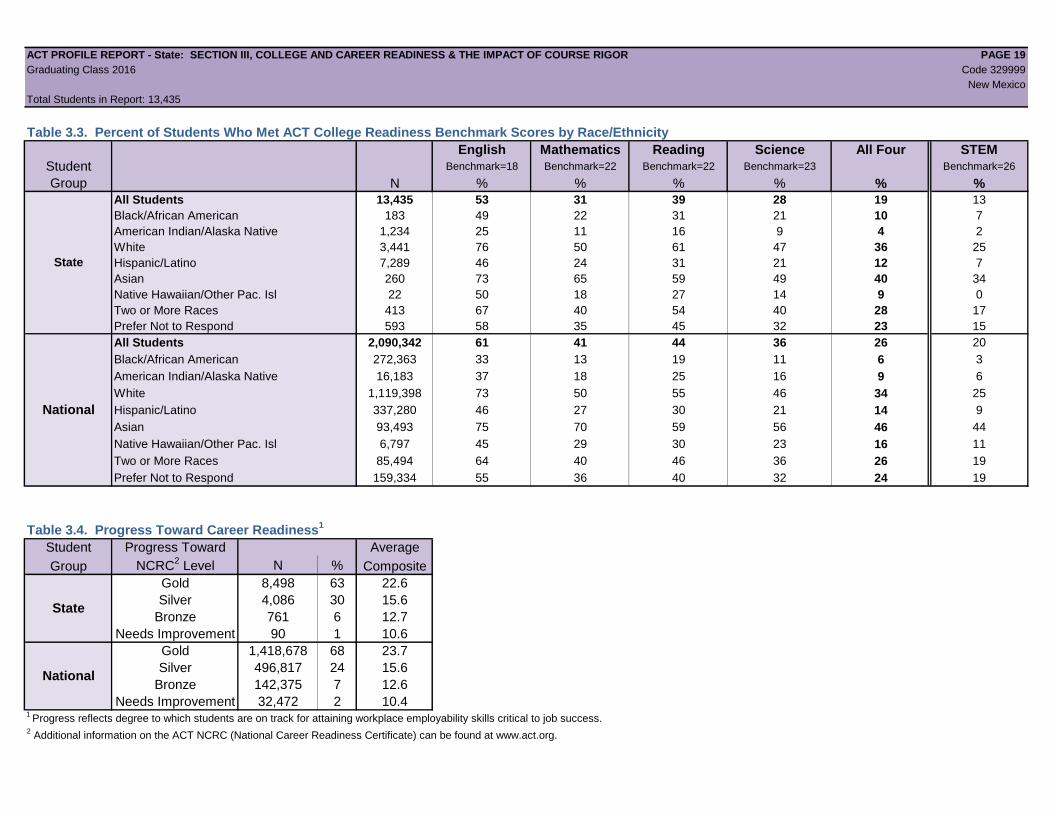
Table 3.3. Percent of Students Who Met ACT College Readiness Benchmark Scores by Race/Ethnicity
English Mathematics Reading Science All Four STEM
Student Benchmark=18 Benchmark=22 Benchmark=22 Benchmark=23 Benchmark=26
Group N % % % % % %
All Students 13,435 53 31 39 28 19 13
Black/African American 183 49 22 31 21 10 7
American Indian/Alaska Native 1,234 25 11 16 9 4 2
White 3,441 76 50 61 47 36 25
Hispanic/Latino 7,289 46 24 31 21 12 7
Asian 260 73 65 59 49 40 34
Native Hawaiian/Other Pac. Isl 22 50 18 27 14 9 0
Two or More Races 413 67 40 54 40 28 17
Prefer Not to Respond 593 58 35 45 32 23 15
All Students 2,090,342 61 41 44 36 26 20
Black/African American 272,363 33 13 19 11 6 3
American Indian/Alaska Native 16,183 37 18 25 16 9 6
White 1,119,398 73 50 55 46 34 25
Hispanic/Latino 337,280 46 27 30 21 14 9
Asian 93,493 75 70 59 56 46 44
Native Hawaiian/Other Pac. Isl 6,797 45 29 30 23 16 11
Two or More Races 85,494 64 40 46 36 26 19
Prefer Not to Respond 159,334 55 36 40 32 24 19
Table 3.4. Progress Toward Career Readiness1
Student Progress Toward Average
Group NCRC2 Level N % Composite
Gold 8,498 63 22.6
Silver 4,086 30 15.6
Bronze 761 6 12.7
Needs Improvement 90 1 10.6
Gold 1,418,678 68 23.7
Silver 496,817 24 15.6
Bronze 142,375 7 12.6
Needs Improvement 32,472 2 10.41
Progress reflects degree to which students are on track for attaining workplace employability skills critical to job success.2 Additional information on the ACT NCRC (National Career Readiness Certificate) can be found at www.act.org.
State
National
State
National
ACT PROFILE REPORT - State: SECTION III, COLLEGE AND CAREER READINESS & THE IMPACT OF COURSE RIGOR PAGE 20
Graduating Class 2016 Code 329999
New Mexico
Total Students in Report: 13,435
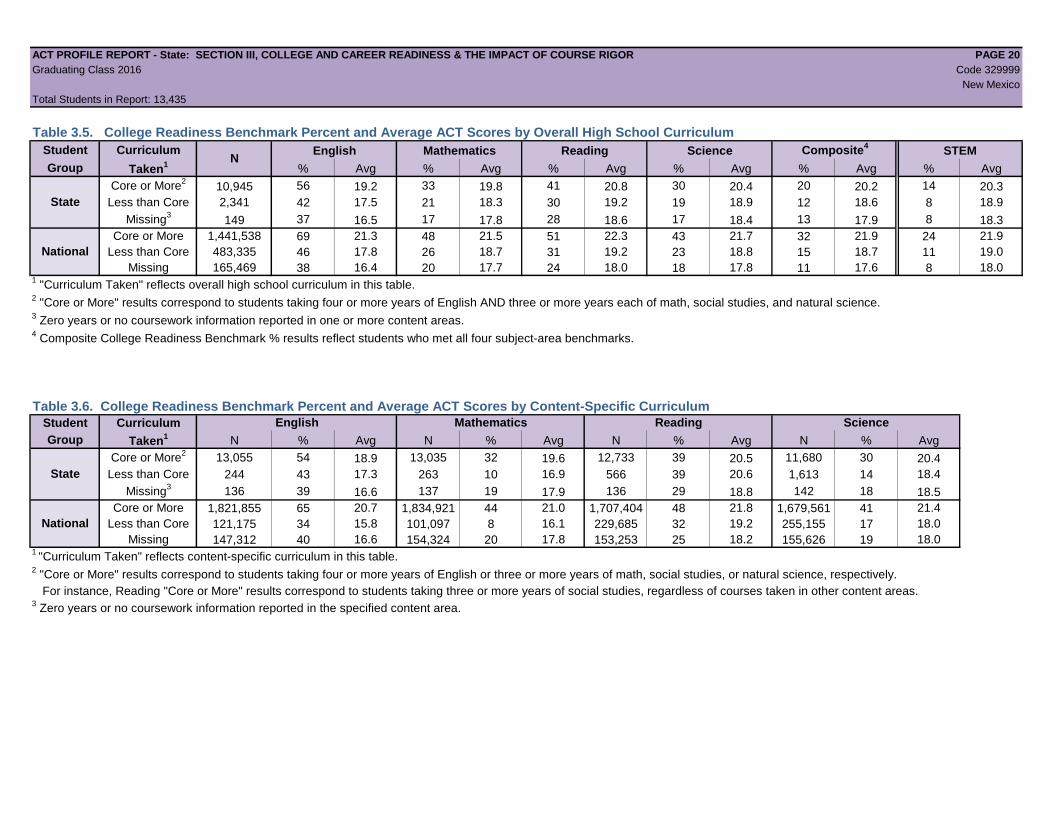
Table 3.5. College Readiness Benchmark Percent and Average ACT Scores by Overall High School Curriculum
Student Curriculum English Mathematics Reading Science Composite4
STEM
Group Taken1 % Avg % Avg % Avg % Avg % Avg % Avg
Core or More2
10,945 56 19.2 33 19.8 41 20.8 30 20.4 20 20.2 14 20.3
Less than Core 2,341 42 17.5 21 18.3 30 19.2 19 18.9 12 18.6 8 18.9
Missing3
149 37 16.5 17 17.8 28 18.6 17 18.4 13 17.9 8 18.3
Core or More 1,441,538 69 21.3 48 21.5 51 22.3 43 21.7 32 21.9 24 21.9
Less than Core 483,335 46 17.8 26 18.7 31 19.2 23 18.8 15 18.7 11 19.0
Missing 165,469 38 16.4 20 17.7 24 18.0 18 17.8 11 17.6 8 18.01 "Curriculum Taken" reflects overall high school curriculum in this table.
2 "Core or More" results correspond to students taking four or more years of English AND three or more years each of math, social studies, and natural science.
3 Zero years or no coursework information reported in one or more content areas.
4 Composite College Readiness Benchmark % results reflect students who met all four subject-area benchmarks.
Table 3.6. College Readiness Benchmark Percent and Average ACT Scores by Content-Specific Curriculum
Student Curriculum English Mathematics Reading Science
Group Taken1 N % Avg N % Avg N % Avg N % Avg
Core or More2
13,055 54 18.9 13,035 32 19.6 12,733 39 20.5 11,680 30 20.4
Less than Core 244 43 17.3 263 10 16.9 566 39 20.6 1,613 14 18.4
Missing3
136 39 16.6 137 19 17.9 136 29 18.8 142 18 18.5
Core or More 1,821,855 65 20.7 1,834,921 44 21.0 1,707,404 48 21.8 1,679,561 41 21.4
Less than Core 121,175 34 15.8 101,097 8 16.1 229,685 32 19.2 255,155 17 18.0
Missing 147,312 40 16.6 154,324 20 17.8 153,253 25 18.2 155,626 19 18.01
"Curriculum Taken" reflects content-specific curriculum in this table.2 "Core or More" results correspond to students taking four or more years of English or three or more years of math, social studies, or natural science, respectively.
For instance, Reading "Core or More" results correspond to students taking three or more years of social studies, regardless of courses taken in other content areas.3 Zero years or no coursework information reported in the specified content area.
National
N
State
National
State
ACT PROFILE REPORT - State: SECTION III, COLLEGE AND CAREER READINESS & THE IMPACT OF COURSE RIGOR PAGE 21
Graduating Class 2016 Code 329999
New Mexico
Total Students in Report: 13,435
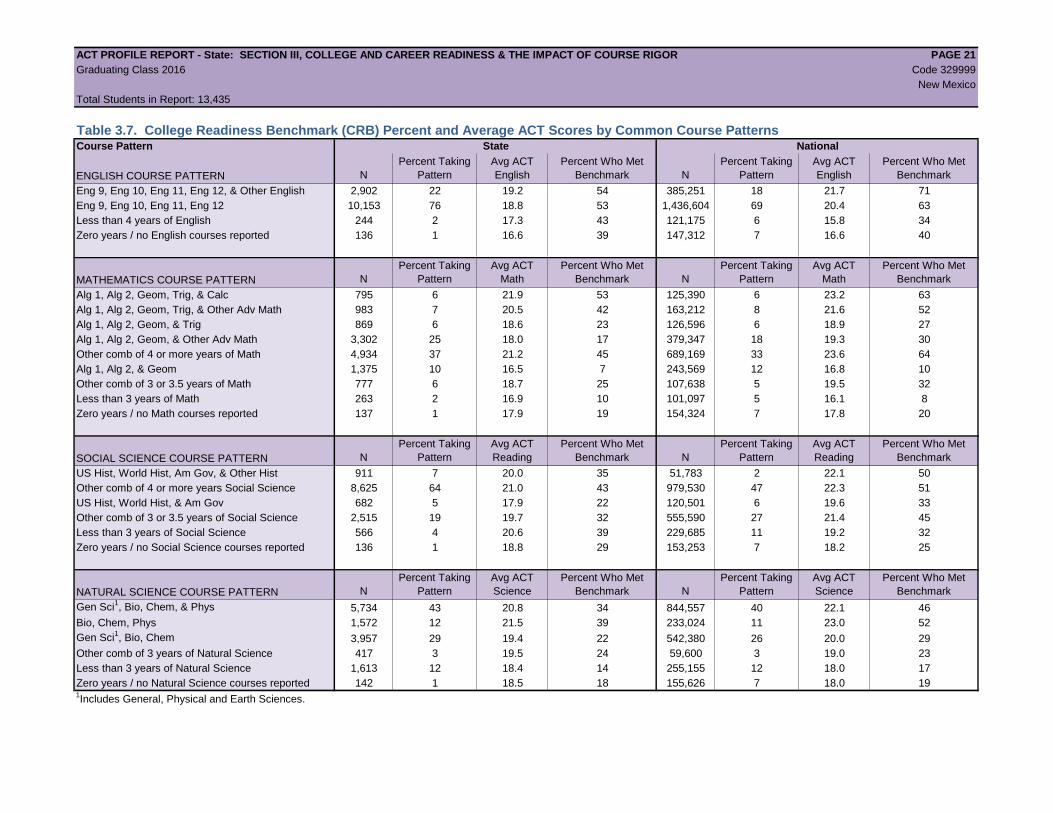
Table 3.7. College Readiness Benchmark (CRB) Percent and Average ACT Scores by Common Course PatternsCourse Pattern State National
ENGLISH COURSE PATTERN N
Percent Taking
Pattern
Avg ACT
English
Percent Who Met
Benchmark N
Percent Taking
Pattern
Avg ACT
English
Percent Who Met
Benchmark
Eng 9, Eng 10, Eng 11, Eng 12, & Other English 2,902 22 19.2 54 385,251 18 21.7 71
Eng 9, Eng 10, Eng 11, Eng 12 10,153 76 18.8 53 1,436,604 69 20.4 63
Less than 4 years of English 244 2 17.3 43 121,175 6 15.8 34
Zero years / no English courses reported 136 1 16.6 39 147,312 7 16.6 40
MATHEMATICS COURSE PATTERN N
Percent Taking
Pattern
Avg ACT
Math
Percent Who Met
Benchmark N
Percent Taking
Pattern
Avg ACT
Math
Percent Who Met
Benchmark
Alg 1, Alg 2, Geom, Trig, & Calc 795 6 21.9 53 125,390 6 23.2 63
Alg 1, Alg 2, Geom, Trig, & Other Adv Math 983 7 20.5 42 163,212 8 21.6 52
Alg 1, Alg 2, Geom, & Trig 869 6 18.6 23 126,596 6 18.9 27
Alg 1, Alg 2, Geom, & Other Adv Math 3,302 25 18.0 17 379,347 18 19.3 30
Other comb of 4 or more years of Math 4,934 37 21.2 45 689,169 33 23.6 64
Alg 1, Alg 2, & Geom 1,375 10 16.5 7 243,569 12 16.8 10
Other comb of 3 or 3.5 years of Math 777 6 18.7 25 107,638 5 19.5 32
Less than 3 years of Math 263 2 16.9 10 101,097 5 16.1 8
Zero years / no Math courses reported 137 1 17.9 19 154,324 7 17.8 20
SOCIAL SCIENCE COURSE PATTERN N
Percent Taking
Pattern
Avg ACT
Reading
Percent Who Met
Benchmark N
Percent Taking
Pattern
Avg ACT
Reading
Percent Who Met
Benchmark
US Hist, World Hist, Am Gov, & Other Hist 911 7 20.0 35 51,783 2 22.1 50
Other comb of 4 or more years Social Science 8,625 64 21.0 43 979,530 47 22.3 51
US Hist, World Hist, & Am Gov 682 5 17.9 22 120,501 6 19.6 33
Other comb of 3 or 3.5 years of Social Science 2,515 19 19.7 32 555,590 27 21.4 45
Less than 3 years of Social Science 566 4 20.6 39 229,685 11 19.2 32
Zero years / no Social Science courses reported 136 1 18.8 29 153,253 7 18.2 25
NATURAL SCIENCE COURSE PATTERN N
Percent Taking
Pattern
Avg ACT
Science
Percent Who Met
Benchmark N
Percent Taking
Pattern
Avg ACT
Science
Percent Who Met
Benchmark
Gen Sci1, Bio, Chem, & Phys 5,734 43 20.8 34 844,557 40 22.1 46
Bio, Chem, Phys 1,572 12 21.5 39 233,024 11 23.0 52
Gen Sci1, Bio, Chem 3,957 29 19.4 22 542,380 26 20.0 29
Other comb of 3 years of Natural Science 417 3 19.5 24 59,600 3 19.0 23
Less than 3 years of Natural Science 1,613 12 18.4 14 255,155 12 18.0 17
Zero years / no Natural Science courses reported 142 1 18.5 18 155,626 7 18.0 191Includes General, Physical and Earth Sciences.
ACT PROFILE REPORT - State: SECTION III, COLLEGE AND CAREER READINESS & THE IMPACT OF COURSE RIGOR PAGE 22
Graduating Class 2016 Code 329999
New Mexico
Total Students in Report: 13,435
Table 3.8. College Readiness Benchmark (CRB) Percent and Average ACT Scores for Gender by Common Course PatternsCourse Pattern All Students Males Females
ENGLISH COURSE PATTERN N Percent
ACT
English
% Who Met
Benchmark N Percent
ACT
English
% Who Met
Benchmark N Percent
ACT
English
% Who Met
Benchmark
Eng 9, Eng 10, Eng 11, Eng 12, & Other English 2,902 22 19.2 54 1,218 20 18.9 52 1,684 23 19.4 56
Eng 9, Eng 10, Eng 11, Eng 12 10,153 76 18.8 53 4,563 76 19.0 54 5,590 75 18.7 53
Less than 4 years of English 244 2 17.3 43 116 2 16.9 41 128 2 17.7 45
Zero years / no English courses reported 136 1 16.6 39 74 1 17.3 42 62 1 15.7 35
MATHEMATICS COURSE PATTERN N Percent
ACT
Math
% Who Met
Benchmark N Percent
ACT
Math
% Who Met
Benchmark N Percent
ACT
Math
% Who Met
Benchmark
Alg 1, Alg 2, Geom, Trig, & Calc 795 6 21.9 53 367 6 22.6 58 428 6 21.3 49
Alg 1, Alg 2, Geom, Trig, & Other Adv Math 983 7 20.5 42 368 6 20.7 43 615 8 20.4 40
Alg 1, Alg 2, Geom, & Trig 869 6 18.6 23 395 7 19.1 28 474 6 18.2 18
Alg 1, Alg 2, Geom, & Other Adv Math 3,302 25 18.0 17 1,320 22 18.3 20 1,982 27 17.8 15
Other comb of 4 or more years of Math 4,934 37 21.2 45 2,393 40 21.9 51 2,541 34 20.5 40
Alg 1, Alg 2, & Geom 1,375 10 16.5 7 573 10 17.0 9 802 11 16.2 5
Other comb of 3 or 3.5 years of Math 777 6 18.7 25 349 6 19.1 28 428 6 18.4 23
Less than 3 years of Math 263 2 16.9 10 133 2 17.8 16 130 2 16.1 5
Zero years / no Math courses reported 137 1 17.9 19 73 1 19.1 29 64 1 16.5 8
SOCIAL SCIENCE COURSE PATTERN N Percent
ACT
Reading
% Who Met
Benchmark N Percent
ACT
Reading
% Who Met
Benchmark N Percent
ACT
Reading
% Who Met
Benchmark
US Hist, World Hist, Am Gov, & Other Hist 911 7 20.0 35 435 7 20.1 36 476 6 19.9 34
Other comb of 4 or more years Social Science 8,625 64 21.0 43 3,718 62 21.1 44 4,907 66 21.0 42
US Hist, World Hist, & Am Gov 682 5 17.9 22 308 5 18.0 22 374 5 17.8 22
Other comb of 3 or 3.5 years of Social Science 2,515 19 19.7 32 1,153 19 20.1 35 1,362 18 19.3 30
Less than 3 years of Social Science 566 4 20.6 39 282 5 20.6 40 284 4 20.6 39
Zero years / no Social Science courses reported 136 1 18.8 29 75 1 19.5 31 61 1 18.0 28
NATURAL SCIENCE COURSE PATTERN N Percent
ACT
Science
% Who Met
Benchmark N Percent
ACT
Science
% Who Met
Benchmark N Percent
ACT
Science
% Who Met
Benchmark
Gen Sci1, Bio, Chem, & Phys 5,734 43 20.8 34 2,731 46 21.5 39 3,003 40 20.2 29
Bio, Chem, Phys 1,572 12 21.5 39 697 12 22.4 48 875 12 20.8 32
Gen Sci2, Bio, Chem 3,957 29 19.4 22 1,604 27 19.4 22 2,353 32 19.3 22
Other comb of 3 years of Natural Science 417 3 19.5 24 224 4 19.9 29 193 3 18.9 18
Less than 3 years of Natural Science 1,613 12 18.4 14 637 11 18.6 16 976 13 18.2 13
Zero years / no Natural Science courses reported 142 1 18.5 18 78 1 19.6 24 64 1 17.2 111Includes General, Physical and Earth Sciences.
ACT PROFILE REPORT - State: SECTION IV, CAREER AND EDUCATIONAL ASPIRATIONS PAGE 23
Graduating Class 2016 Code 329999
New Mexico
Total Students in Report: 13,435
Section IV
Career and Educational Aspirations
Beginning with the Graduating Class of 2013, all students whose scores are college reportable, both standard and extended time tests, are now included.
Also beginning with the 2013 Graduating Class data, College Readiness Benchmarks for Reading and Science were updated to reflect the most recent
college coursework research.
ACT PROFILE REPORT - State: SECTION IV, CAREER AND EDUCATIONAL ASPIRATIONS PAGE 24
Graduating Class 2016 Code 329999
New Mexico
Total Students in Report: 13,435
Table 4.1. Distribution of Planned Educational Majors for All Students by College Plans
All Students Plan on 2 Years or Less of College Plan on 4 Years or More of College
Planned Educational Major N1
Percent2
Avg ACT
Comp N Percent
Avg ACT
Comp N Percent
Avg ACT
Comp
Agriculture & Natural Resources Conservation 288 2 18.7 18 2 15.7 250 2 19.1
Architecture 186 1 19.3 7 1 15.3 165 1 19.7
Area, Ethnic, & Multidisciplinary Studies 15 0 22.1 2 0 13.5 12 0 24.3
Arts: Visual & Performing 876 7 20.0 54 7 16.8 761 7 20.3
Business 1,034 8 19.2 97 13 15.9 886 8 19.7
Communications 176 1 20.1 11 1 15.1 153 1 20.5
Community, Family, & Personal Services 295 2 17.3 30 4 16.0 232 2 17.9
Computer Science & Mathematics 406 3 22.7 13 2 17.7 368 3 22.9
Education 458 3 19.1 9 1 15.6 418 4 19.3
Engineering 1,328 10 21.9 50 7 16.1 1,199 10 22.4
Engineering Technology & Drafting 287 2 18.4 29 4 15.4 237 2 19.0
English & Foreign Languages 149 1 22.1 4 1 15.8 139 1 22.3
Health Administration & Assisting 819 6 17.0 78 10 15.5 681 6 17.2
Health Sciences & Technologies 2,690 20 19.6 86 12 16.1 2,441 21 19.9
Philosophy, Religion, & Theology 67 0 20.8 2 0 15.5 60 1 20.6
Repair, Production, & Construction 173 1 16.5 68 9 16.0 86 1 17.0
Sciences: Biological & Physical 853 6 22.3 8 1 15.8 810 7 22.5
Social Sciences & Law 1,180 9 19.7 37 5 16.3 1,060 9 19.9
Undecided 2,048 15 19.8 140 19 16.5 1,674 14 20.3
No Response 106 1 18.2 0 0 . 17 0 16.812-Year and 4-Year "N" counts do not reflect "Missing" and "Other" college plans, therefore they may not add up to the N count for All Students.
2Percent of students tested within College Plan groups (All Students, 2-Year, 4-Year).
ACT PROFILE REPORT - State: SECTION IV, CAREER AND EDUCATIONAL ASPIRATIONS PAGE 25
Graduating Class 2016 Code 329999
New Mexico
Total Students in Report: 13,435
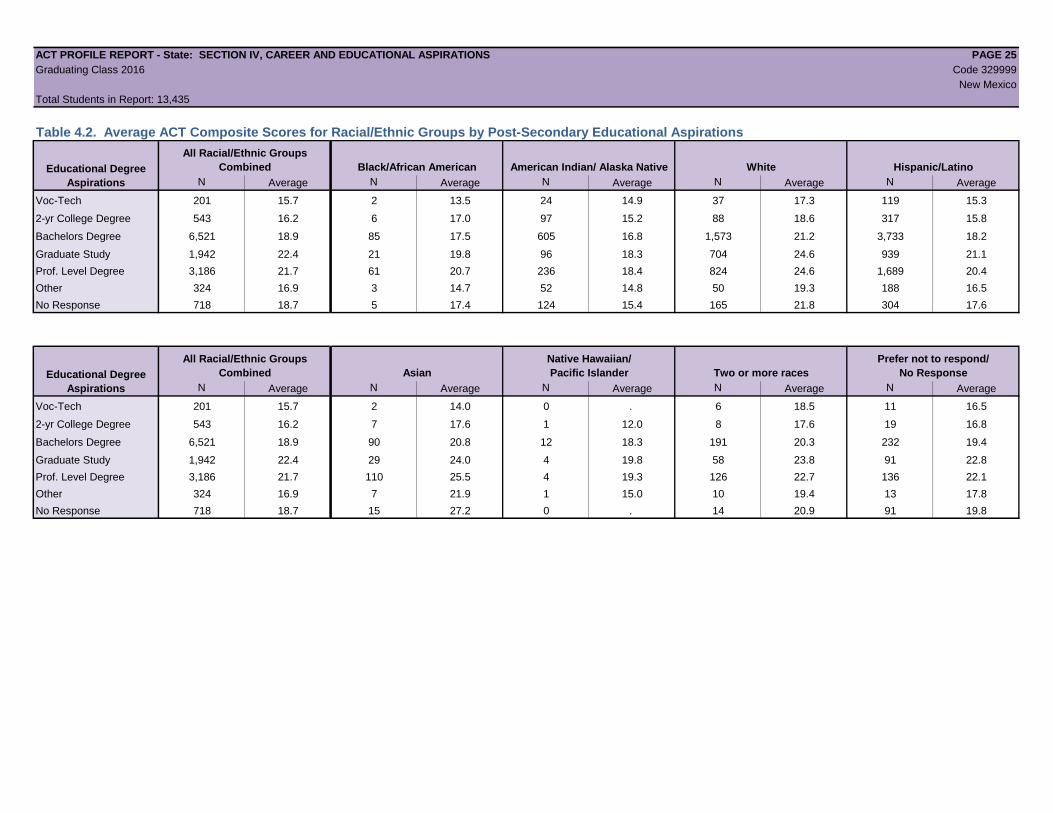
Table 4.2. Average ACT Composite Scores for Racial/Ethnic Groups by Post-Secondary Educational Aspirations
All Racial/Ethnic Groups
Combined Black/African American American Indian/ Alaska Native White Hispanic/Latino
N Average N Average N Average N Average N Average
Voc-Tech 201 15.7 2 13.5 24 14.9 37 17.3 119 15.3
2-yr College Degree 543 16.2 6 17.0 97 15.2 88 18.6 317 15.8
Bachelors Degree 6,521 18.9 85 17.5 605 16.8 1,573 21.2 3,733 18.2
Graduate Study 1,942 22.4 21 19.8 96 18.3 704 24.6 939 21.1
Prof. Level Degree 3,186 21.7 61 20.7 236 18.4 824 24.6 1,689 20.4
Other 324 16.9 3 14.7 52 14.8 50 19.3 188 16.5
No Response 718 18.7 5 17.4 124 15.4 165 21.8 304 17.6
All Racial/Ethnic Groups
Combined Asian
Native Hawaiian/
Pacific Islander Two or more races
Prefer not to respond/
No Response
N Average N Average N Average N Average N Average
Voc-Tech 201 15.7 2 14.0 0 . 6 18.5 11 16.5
2-yr College Degree 543 16.2 7 17.6 1 12.0 8 17.6 19 16.8
Bachelors Degree 6,521 18.9 90 20.8 12 18.3 191 20.3 232 19.4
Graduate Study 1,942 22.4 29 24.0 4 19.8 58 23.8 91 22.8
Prof. Level Degree 3,186 21.7 110 25.5 4 19.3 126 22.7 136 22.1
Other 324 16.9 7 21.9 1 15.0 10 19.4 13 17.8
No Response 718 18.7 15 27.2 0 . 14 20.9 91 19.8
Educational Degree
Aspirations
Educational Degree
Aspirations
ACT PROFILE REPORT - State: SECTION IV, CAREER AND EDUCATIONAL ASPIRATIONS PAGE 26
Graduating Class 2016 Code 329999
New Mexico
Total Students in Report: 13,435
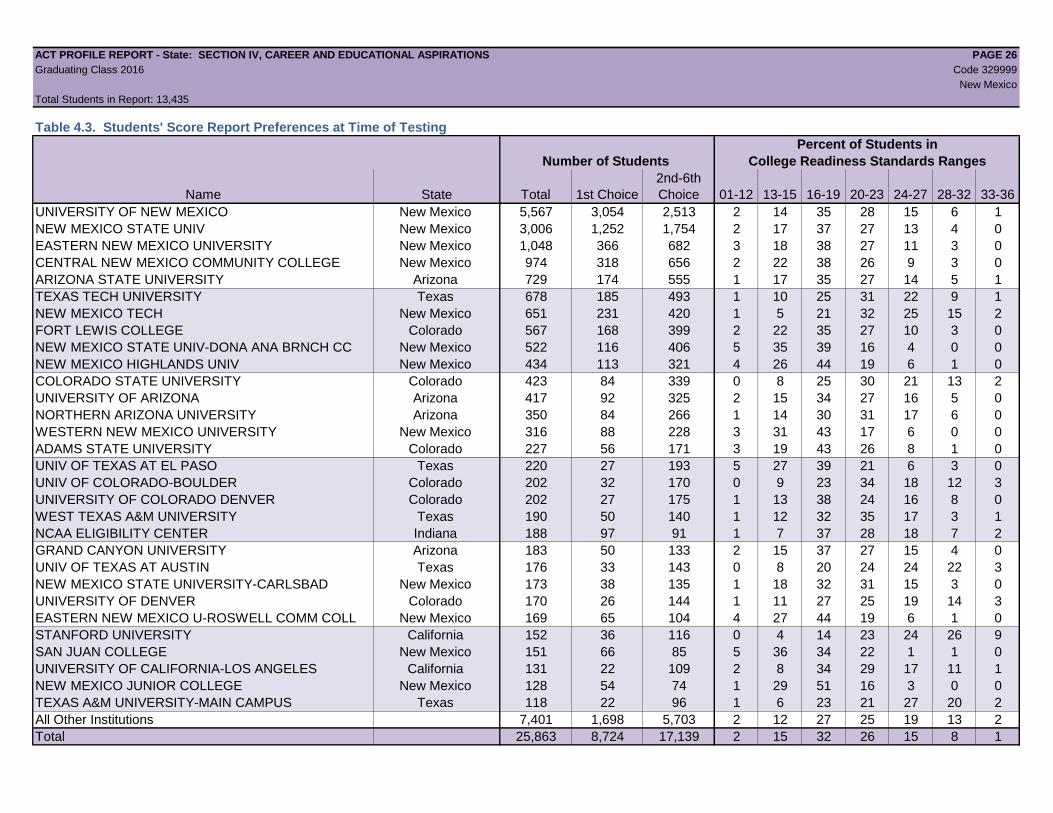
Table 4.3. Students' Score Report Preferences at Time of Testing
Percent of Students in
Number of Students College Readiness Standards Ranges
Name State Total 1st Choice
2nd-6th
Choice 01-12 13-15 16-19 20-23 24-27 28-32 33-36
UNIVERSITY OF NEW MEXICO New Mexico 5,567 3,054 2,513 2 14 35 28 15 6 1
NEW MEXICO STATE UNIV New Mexico 3,006 1,252 1,754 2 17 37 27 13 4 0
EASTERN NEW MEXICO UNIVERSITY New Mexico 1,048 366 682 3 18 38 27 11 3 0
CENTRAL NEW MEXICO COMMUNITY COLLEGE New Mexico 974 318 656 2 22 38 26 9 3 0
ARIZONA STATE UNIVERSITY Arizona 729 174 555 1 17 35 27 14 5 1
TEXAS TECH UNIVERSITY Texas 678 185 493 1 10 25 31 22 9 1
NEW MEXICO TECH New Mexico 651 231 420 1 5 21 32 25 15 2
FORT LEWIS COLLEGE Colorado 567 168 399 2 22 35 27 10 3 0
NEW MEXICO STATE UNIV-DONA ANA BRNCH CC New Mexico 522 116 406 5 35 39 16 4 0 0
NEW MEXICO HIGHLANDS UNIV New Mexico 434 113 321 4 26 44 19 6 1 0
COLORADO STATE UNIVERSITY Colorado 423 84 339 0 8 25 30 21 13 2
UNIVERSITY OF ARIZONA Arizona 417 92 325 2 15 34 27 16 5 0
NORTHERN ARIZONA UNIVERSITY Arizona 350 84 266 1 14 30 31 17 6 0
WESTERN NEW MEXICO UNIVERSITY New Mexico 316 88 228 3 31 43 17 6 0 0
ADAMS STATE UNIVERSITY Colorado 227 56 171 3 19 43 26 8 1 0
UNIV OF TEXAS AT EL PASO Texas 220 27 193 5 27 39 21 6 3 0
UNIV OF COLORADO-BOULDER Colorado 202 32 170 0 9 23 34 18 12 3
UNIVERSITY OF COLORADO DENVER Colorado 202 27 175 1 13 38 24 16 8 0
WEST TEXAS A&M UNIVERSITY Texas 190 50 140 1 12 32 35 17 3 1
NCAA ELIGIBILITY CENTER Indiana 188 97 91 1 7 37 28 18 7 2
GRAND CANYON UNIVERSITY Arizona 183 50 133 2 15 37 27 15 4 0
UNIV OF TEXAS AT AUSTIN Texas 176 33 143 0 8 20 24 24 22 3
NEW MEXICO STATE UNIVERSITY-CARLSBAD New Mexico 173 38 135 1 18 32 31 15 3 0
UNIVERSITY OF DENVER Colorado 170 26 144 1 11 27 25 19 14 3
EASTERN NEW MEXICO U-ROSWELL COMM COLL New Mexico 169 65 104 4 27 44 19 6 1 0
STANFORD UNIVERSITY California 152 36 116 0 4 14 23 24 26 9
SAN JUAN COLLEGE New Mexico 151 66 85 5 36 34 22 1 1 0
UNIVERSITY OF CALIFORNIA-LOS ANGELES California 131 22 109 2 8 34 29 17 11 1
NEW MEXICO JUNIOR COLLEGE New Mexico 128 54 74 1 29 51 16 3 0 0
TEXAS A&M UNIVERSITY-MAIN CAMPUS Texas 118 22 96 1 6 23 21 27 20 2
All Other Institutions 7,401 1,698 5,703 2 12 27 25 19 13 2
Total 25,863 8,724 17,139 2 15 32 26 15 8 1
ACT PROFILE REPORT - State: SECTION V, OPTIONAL WRITING TEST RESULTS PAGE 27
Graduating Class 2016 Code 329999
New Mexico
Total Students in Report: 13,435
Section V
Optional Writing Test Results
Beginning with the Graduating Class of 2013, all students whose scores are college reportable, both standard and extended time tests, are now included.
Also beginning with the 2013 Graduating Class data, College Readiness Benchmarks for Reading and Science were updated to reflect the most recent
college coursework research.
ACT PROFILE REPORT - State: SECTION V, OPTIONAL WRITING TEST RESULTS PAGE 28
Graduating Class 2016 Code 329999
New Mexico
Total Students in Report: 13,435
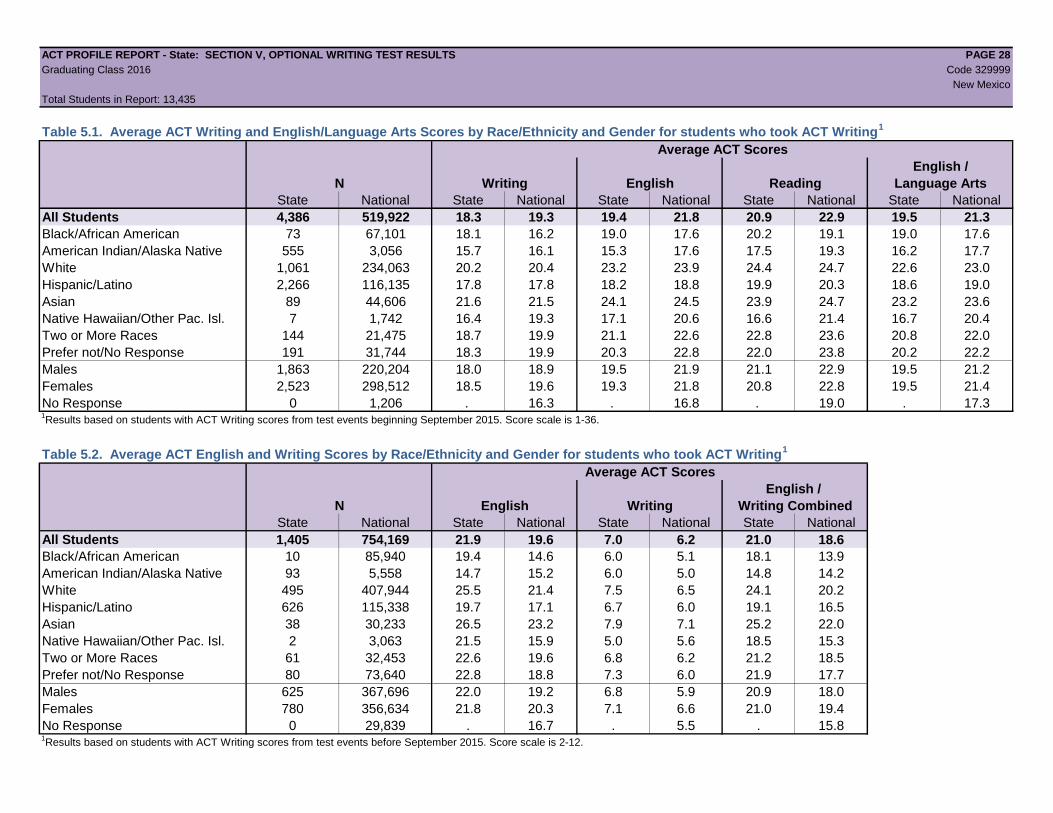
Table 5.1. Average ACT Writing and English/Language Arts Scores by Race/Ethnicity and Gender for students who took ACT Writing1
Average ACT Scores
English /
N Writing English Reading Language Arts
State National State National State National State National State National
All Students 4,386 519,922 18.3 19.3 19.4 21.8 20.9 22.9 19.5 21.3
Black/African American 73 67,101 18.1 16.2 19.0 17.6 20.2 19.1 19.0 17.6
American Indian/Alaska Native 555 3,056 15.7 16.1 15.3 17.6 17.5 19.3 16.2 17.7
White 1,061 234,063 20.2 20.4 23.2 23.9 24.4 24.7 22.6 23.0
Hispanic/Latino 2,266 116,135 17.8 17.8 18.2 18.8 19.9 20.3 18.6 19.0
Asian 89 44,606 21.6 21.5 24.1 24.5 23.9 24.7 23.2 23.6
Native Hawaiian/Other Pac. Isl. 7 1,742 16.4 19.3 17.1 20.6 16.6 21.4 16.7 20.4
Two or More Races 144 21,475 18.7 19.9 21.1 22.6 22.8 23.6 20.8 22.0
Prefer not/No Response 191 31,744 18.3 19.9 20.3 22.8 22.0 23.8 20.2 22.2
Males 1,863 220,204 18.0 18.9 19.5 21.9 21.1 22.9 19.5 21.2
Females 2,523 298,512 18.5 19.6 19.3 21.8 20.8 22.8 19.5 21.4
No Response 0 1,206 . 16.3 . 16.8 . 19.0 . 17.31Results based on students with ACT Writing scores from test events beginning September 2015. Score scale is 1-36.
Table 5.2. Average ACT English and Writing Scores by Race/Ethnicity and Gender for students who took ACT Writing1
Average ACT Scores
English /
N English Writing Writing Combined
State National State National State National State National
All Students 1,405 754,169 21.9 19.6 7.0 6.2 21.0 18.6
Black/African American 10 85,940 19.4 14.6 6.0 5.1 18.1 13.9
American Indian/Alaska Native 93 5,558 14.7 15.2 6.0 5.0 14.8 14.2
White 495 407,944 25.5 21.4 7.5 6.5 24.1 20.2
Hispanic/Latino 626 115,338 19.7 17.1 6.7 6.0 19.1 16.5
Asian 38 30,233 26.5 23.2 7.9 7.1 25.2 22.0
Native Hawaiian/Other Pac. Isl. 2 3,063 21.5 15.9 5.0 5.6 18.5 15.3
Two or More Races 61 32,453 22.6 19.6 6.8 6.2 21.2 18.5
Prefer not/No Response 80 73,640 22.8 18.8 7.3 6.0 21.9 17.7
Males 625 367,696 22.0 19.2 6.8 5.9 20.9 18.0
Females 780 356,634 21.8 20.3 7.1 6.6 21.0 19.4
No Response 0 29,839 . 16.7 . 5.5 . 15.81Results based on students with ACT Writing scores from test events before September 2015. Score scale is 2-12.