Embed Size (px)
Citation preview

2009EIGHTH EdITIon
Across THE sTATEsProfiles of long-Term Care
anD inDePenDenT liVing
FLORIDA
by ari Houser Wendy fox-grage
mary Jo gibsonPublic Policy Institute
©1994-2009 AArP

2
IntRoduCtIon
Across the States 2009: Profiles of Long-Term Care and Independent Living is the eighth edition of the AARP Public Policy Institute’s state long-term care reference report.
This short report provides key long-term care information for a single state. Readers may refer to the Overview section of the full report, which highlights national trends, state differences, and key indicators.
Published approximately every two years, the Across the States series helps to inform policy discussions among public and private sector leaders in long-term care throughout the United States. Across the States 2009 presents comparable state-level and national data for more than 140 indicators, drawn together from a wide variety of sources into a single convenient reference. This publication presents the most up-to-date data available at the time of production, and is displayed in easy-to-use maps, graphics, tables, and state profiles.
Across the States 2009 comes in two volumes:
• A full report with an overview of key findings and trends, maps and graphs, and individual profiles for each state, the District of Columbia, Puerto Rico, the Virgin Islands, and the nation as a whole. It provides a complete picture of long-term services and supports in each state.
• An executive summary with an overview of key findings and trends, and ranking tables for each indicator, which permit readers to easily see variation among states.
Some of the indicators in Across the States 2009 may be found in prior editions. Please exercise caution when making comparisons with information in earlier editions because of possible changes in the source or definition. Complete descriptions of all indicators, and how they may differ from previous editions, can be found in the Data Documentation section in the back of the full report. Data sources and descriptions of indicators are only found in the full report, not in the executive summary or this state-specific report.
Copies of Across the States 2009 are available free of charge. To order, please call the AARP Public Policy Institute at (202) 434-3890 or email [email protected].
The full report and executive summary are also available on the web. The most recent edition of Across the States can always be found at http://www.aarp.org/acrossthestates.

3
Note: The highest data value within each ranking is indicated by a rank of 1. For indicators in which both a total number and a ratio are given for the state value (percent of population, per person in the state, etc), the rank and U.S. values correspond to the ratio column.
u.S.State Rank
All ages 2007 2030 % change
Age 50-64 2007 2030 % change
Age 65+ 2007 2030 % change
Age 65-74 2007 2030 % change
Age 75-84 2007 2030 % change
Age 85+ 2007 2030 % change
Year
18,25128,686+57%
3,3315,120+54%
3,0987,769
+151%
1,4794,306
+191%
1,1262,519
+124%
494944
+91%
18.3%17.8%
17.0%27.1%
8.1%15.0%
6.2%8.8%
2.7%3.3%
433
26113
114
112
166
11015
301,621363,584
+21%
17.8%16.5%+12%
12.6%19.7%+89%
6.4%10.4%+96%
4.3%6.6%
+84%
1.8%2.6%
+74%
Population (thousands)% of totalPopulation
Projected Growth in the older Population in Florida as a Percentage of
2000 Census, by Age Group, 2000-2030
AARP Public Policy Institute
FloRIdA
Race & Ethnicity, Age 65+
Older People of Color (%), 2007
Asian/Pacific Islander
Black
Hispanic
u.S.State Rank21.4% 19.3%15
u.S.State Rank1.4% 3.6%21
u.S.State Rank7.6% 8.7%19
u.S.State Rank12.6% 6.6%4
0.8
1.2
1.6
2.0
2.4
2.8
3.2
2000 2005 2010 2015 2020 2025 203080%
120%
160%
200%
240%
280%
320%
Po
pul
atio
n (%
of
2000
Cen
sus)
85+
50-64
65-74
Blue line = 50-64Purple line = 65-74Yellow line = 75-84Red line = 85+
75-84

4
Fl
oR
IdA
Population Characteristics
Men per 100 women age 85+, 2007
Persons age 75+ living alone, 2007
Non-metropolitan population age 65+, 2007/2008
Bachelor level education or higher age 65+, 2007
Persons age 60+ raising grandchildren, 2007
State Rank u.S.
61
30%
6%
21%
1.3%
4
44
40
17
31
48
33%
20%
19%
1.6%
Income & Poverty
Median household income age 65+, 2007
At/below poverty level age 65+, 2007
At/below 200% of poverty level age 65+, 2007
At/below 300% of poverty level age 65+, 2007
Women age 75+ at/below poverty level, 2007
State Rank u.S.
17
19
29
32
28
$32,158
9.5%
32%
51%
13%
$33,469
9.4%
31%
50%
12%
disability Rates
Persons age 65+ with disabilities, 2007
Sensory disability
Physical disability
Mobility disability
Self-care disability
Cognitive/mental disability
Any disability (one or more of the five listed above)
Cognitive/mental disability + any other disability
Persons age 18-64 with disabilities, 2007
Any disability
Cognitive/mental disability + any other disability
Persons age 65+ with Alzheimer’s disease, 2010 (projected)
Percentnumber(1,000s) Rank u.S.
15%
29%
16%
9%
12%
38%
10%
11%
3.0%
13%
460
873
473
269
348
1,157
312
1,183
329
450
34
30
27
30
21
34
27
27
31
31
16%
31%
18%
10%
12%
41%
11%
11%
3.2%
13%
Family Caregivers
Family caregivers (thousands), 2007
Economic value of family caregiving (millions), 2007
Economic value per hour, 2007
Ratio of the economic value of family caregiving to Medicaid long-term care spending, 2007
State Rank u.S.
29
13
34,000
$375,000
$10.10
3.7
1,800
$19,200
$9.89
4.6
PoPulation & CharaCteristiCs
5
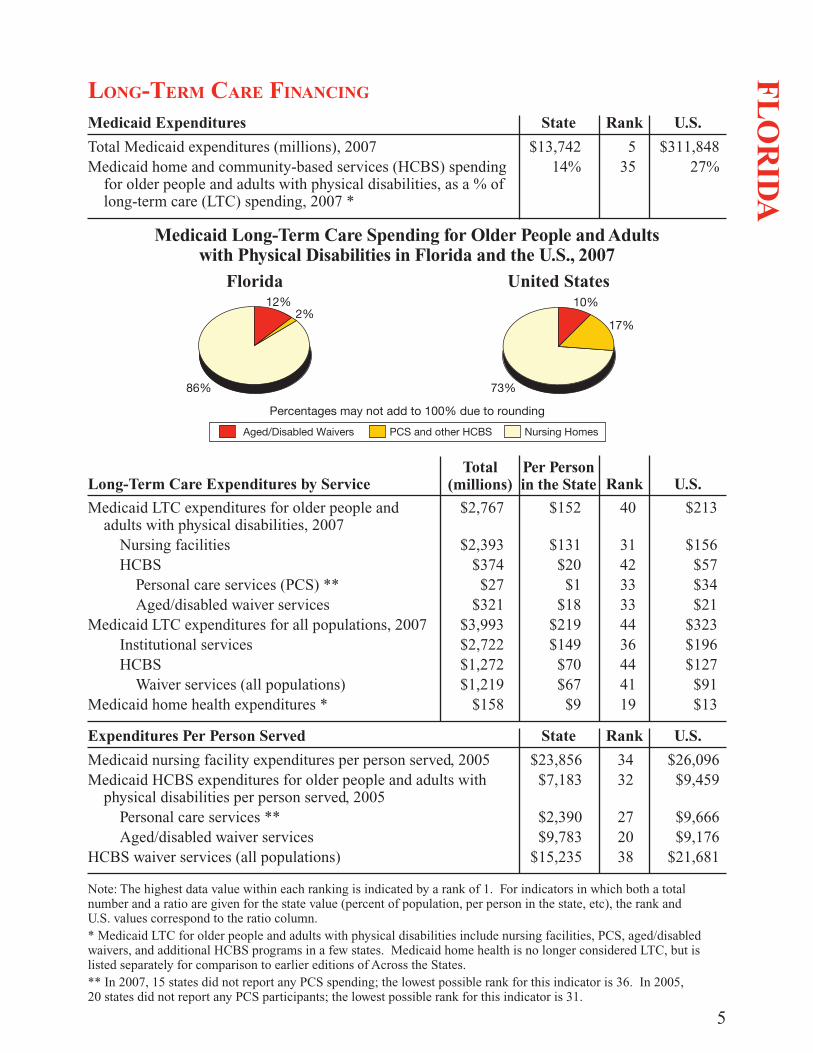
long-term Care FinanCing
Medicaid Expenditures
Total Medicaid expenditures (millions), 2007Medicaid home and community-based services (HCBS) spending
for older people and adults with physical disabilities, as a % of long-term care (LTC) spending, 2007 *
State Rank u.S.
$13,74214%
$311,84827%
535
Medicaid long-term Care Spending for older People and Adultswith Physical disabilities in Florida and the u.S., 2007
Aged/Disabled Waivers PCS and other HCBS Nursing Homes
Percentages may not add to 100% due to rounding
12% 10%
17%2%
86% 73%
Florida united States
long-term Care Expenditures by Service
Medicaid LTC expenditures for older people and adults with physical disabilities, 2007
Nursing facilitiesHCBS
Personal care services (PCS) **Aged/disabled waiver services
Medicaid LTC expenditures for all populations, 2007Institutional servicesHCBS
Waiver services (all populations)Medicaid home health expenditures *
Per Person in the State
total (millions) Rank u.S.
$152
$131$20$1
$18$219$149$70$67$9
$2,767
$2,393$374$27
$321$3,993$2,722$1,272$1,219
$158
$213
$156$57$34$21
$323$196$127$91$13
40
314233334436444119
Note: The highest data value within each ranking is indicated by a rank of 1. For indicators in which both a total number and a ratio are given for the state value (percent of population, per person in the state, etc), the rank and U.S. values correspond to the ratio column.* Medicaid LTC for older people and adults with physical disabilities include nursing facilities, PCS, aged/disabled waivers, and additional HCBS programs in a few states. Medicaid home health is no longer considered LTC, but is listed separately for comparison to earlier editions of Across the States.** In 2007, 15 states did not report any PCS spending; the lowest possible rank for this indicator is 36. In 2005, 20 states did not report any PCS participants; the lowest possible rank for this indicator is 31.
Expenditures Per Person Served
Medicaid nursing facility expenditures per person served, 2005Medicaid HCBS expenditures for older people and adults with
physical disabilities per person served, 2005Personal care services **Aged/disabled waiver services
HCBS waiver services (all populations)
State Rank u.S.
$23,856$7,183
$2,390$9,783
$15,235
$26,096$9,459
$9,666$9,176
$21,681
3432
272038
Fl
oR
IdA

6
Federal/State/Personal Contributions
Federal Medical Assistance Percentage (FMAP), 2007Medicaid personal needs allowance (per month), 2007 ***State-funded HCBS for older people (millions), 2007
State Rank u.S.
58.2%$35
$67.2$50
$1,192.4
29435
long-term Care utilization
u.S.Medicare HCBS utilization
Medicare beneficiaries receiving home health services, 2006Medicare home health visits per user, 2006
State Rank
11.7%50
8.4%35
35
Medicaid HCBS utilization
Medicaid HCBS participants, 2005Personal care services **HCBS waiver services
Aged/disabled waiver servicesMedicaid aged/disabled waiver participants per
100 beneficiaries using nursing facilities, 2005Persons in assisted living/residential care covered by
Medicaid or state funding, 2007Medicaid home health participants, 2005 *
Per 1,000 PopulationState Rank u.S.
4.10.83.31.5
0.62
1.2
73,13113,98059,15125,773
27
11,389
21,192
3727313434
18
30
6.32.73.62.034
0.39
3.1
u.S.nursing Facility utilization
Total nursing facility residents, 2007Nursing facility residents per 100 age 65+, 2007Nursing facility residents per 100 age 75+, 2007 Total nursing facility stays, 2006Residents with Medicaid as primary payer, 2007Residents with Medicare as primary payer, 2007Residents with “other” as primary payer, 2007Residents with dementia, 2007
State Rank
72,4472.34.5
203,90358%20%23%45%
1,440,3583.87.8
3,176,11964%14%22%46%
746463
401
2330
long-term Care Costs
u.S.Public & Private Payment Rates
Medicaid payment per day for nursing facility care, 2007Medicare payment per day for nursing facility care, 2006Average private pay rate per day in nursing facility, 2008Average private pay rate per month in assisted living, 2008
Medicare reimbursement per home health visit, 2006Average private pay hourly rate for home health aide, 2008
Medicare-certified home health aide, 2008Average private pay daily rate for adult day care, 2008
State Rank
$173$319$213
$2,642
$106$18$22$52
$158$305$209
$3,008
$134$19$38$59
13221635
50334731
*** 6 states used the minimum allowed PNA of $30 per month; the lowest rank for this indicator is 46.
Fl
oR
IdA

7
long-term Care resourCes
Per 1,000 Age 65+HCBS Resources State Rank u.S.
Medicare-certified home health agencies, 2006Adult day facilities, 2001-02Assisted living and residential care facilities, 2007Assisted living and residential care units, 2007Personal and home care aides, 2007
Median hourly wage, 2007Home health aides, 2007
Median hourly wage, 2007Medicaid aged/disabled waiver waiting list, 2007
0.240.050.8243
10
735165
2,40075,4509,820$8.98
29,720$9.547,410
23382328492946304
0.220.091.02616
$8.8922
$9.6289,938
Per 1,000 Age 65+nursing Facility Resources State Rank u.S.
Total nursing facilities, 2007Nursing facility beds, 2007Nursing facility occupancy rate, 2007
0.2226
68481,966
88%
494620
0.4345
85%
Direct care nursing hours per patient day, 2007Nursing facilities with deficiency for actual harm or jeopardy of
residents, 2007Residents with physical restraints (%), 2007Long-term care facility beds per FTE ombudsman, 2006Nursing facilities visited by ombudsman at least quarterly, 2006
Quality & oversight of nursing Facilities State Rank u.S.
4.68%
7%
7,31926%
3.718%
6%
2,19279%
244
72
49
Note: The highest data value within each ranking is indicated by a rank of 1. For indicators in which both a total number and a ratio are given for the state value (percent of population, per person in the state, etc), the rank and U.S. values correspond to the ratio column.
Change in Medicaid ltC Spending, 2002–2007, by Service
Percent Change in Medicaid ltC Spending, 2002–2007, by Service
$0
$100
$200
$300
$400
$500
$600
0
100
200
300
400
500
600
ICF-MR MR/DD Waivers
Nursing Facilities
Aged/Disabled Waivers
PCS and otherHCBS
$403
$518
$194
Mill
ions
of
Do
llars
Scale 80% Vertically
$18 $34
0
50
100
150
200
0%
50%
100%
150%
200%
ICF-MR MR/DD Waivers
Nursing Facilities
Aged/Disabled Waivers
PCS and otherHCBS
Scale 80% Vertically
6%
83%
187%
28%
152%
Fl
oR
IdA
8
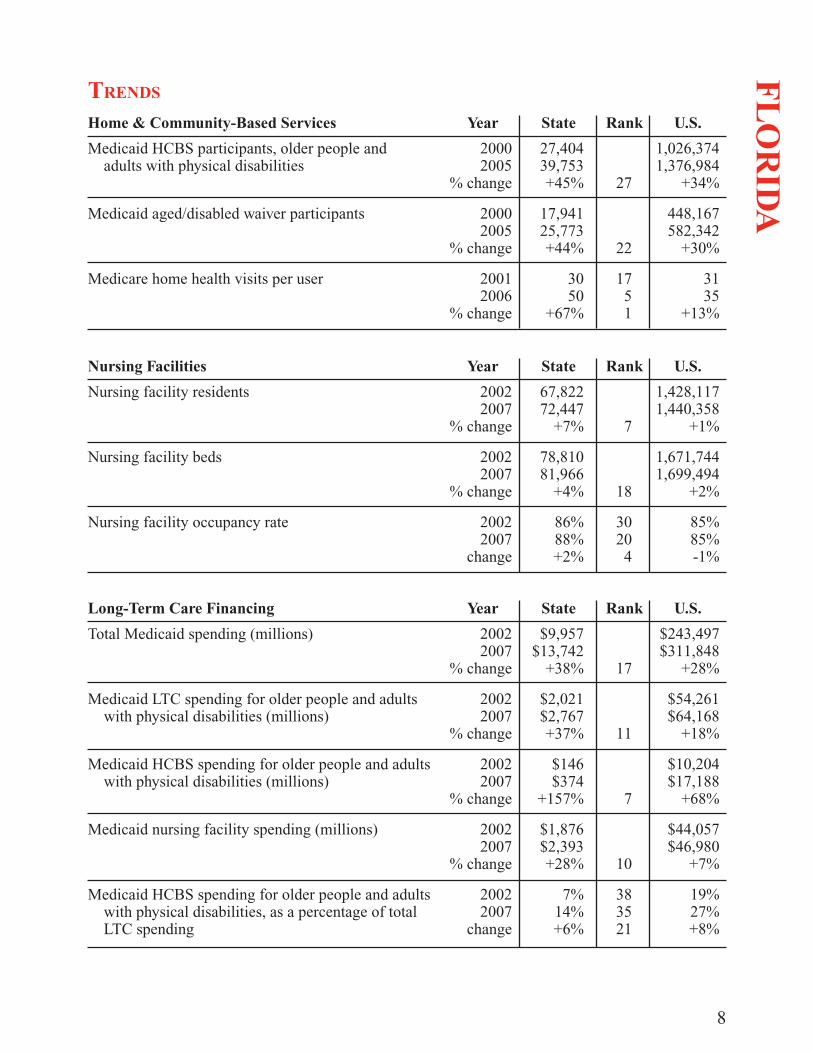
trends
Fl
oR
IdA
Home & Community-Based Services
Medicaid HCBS participants, older people and adults with physical disabilities
Medicaid aged/disabled waiver participants
Medicare home health visits per user
StateYear Rank u.S.
27,40439,753+45%
17,94125,773+44%
3050
+67%
20002005
% change
20002005
% change
20012006
% change
27
22
1751
1,026,3741,376,984
+34%
448,167582,342
+30%
3135
+13%
nursing Facilities
Nursing facility residents
Nursing facility beds
Nursing facility occupancy rate
StateYear Rank u.S.
67,82272,447
+7%
78,81081,966
+4%
86%88%+2%
20022007
% change
20022007
% change
20022007
change
7
18
30204
1,428,1171,440,358
+1%
1,671,7441,699,494
+2%
85%85%-1%
long-term Care Financing
Total Medicaid spending (millions)
Medicaid LTC spending for older people and adults with physical disabilities (millions)
Medicaid HCBS spending for older people and adults with physical disabilities (millions)
Medicaid nursing facility spending (millions)
Medicaid HCBS spending for older people and adults with physical disabilities, as a percentage of total LTC spending
StateYear Rank u.S.
$9,957$13,742
+38%
$2,021$2,767+37%
$146$374
+157%
$1,876$2,393+28%
7%14%+6%
20022007
% change
20022007
% change
20022007
% change
20022007
% change
20022007
change
17
11
7
10
383521
$243,497$311,848
+28%
$54,261$64,168
+18%
$10,204$17,188
+68%
$44,057$46,980
+7%
19%27%+8%