Embed Size (px)
Citation preview

ACRE in the U.S. Farm Bill and the WTO
Carl Zulauf David Orden
May 2009 IATRC
Working Paper #09-2
Working Paper

1
International Agricultural Trade Research Consortium
ACRE in the U.S. Farm Bill and the WTO
By Carl Zulauf and David Orden*
Working Paper #09-2
The International Agricultural Trade Research Consortium is an informal association of University and Government economists interested in agricultural trade. Its purpose is to foster interaction, improve research capacity and to focus on relevant trade policy issues. It is financed by United States Department of Agriculture (ERS, and FAS), Agriculture and Agri-Food Canada and the participating institutions. The IATRC Working Paper series provides members an opportunity to circulate their work at the advanced draft stage through limited distribution within the research and analysis community. The IATRC takes no political positions or responsibility for the accuracy of the data or validity of the conclusions presented by working paper authors. Further, policy recommendations and opinions expressed by the authors do not necessarily reflect those of the IATRC or its funding agencies. For a copy of this paper and a complete list of IATRC Working Papers, books, and other publications, see the IATRC Web Site http://www.iatrcweb.org A copy of this paper can be viewed/printed from the IATRC Web Site indicated above. * Carl Zulauf is Professor, Department of Agricultural, Environmental, and Development
Economics, Ohio State University. Room 235, Ag Admin Bldg., 2120 Fyffe Road, Columbus, OH 43210
Tel: 614-292-6285 FAX: 614-292-7710 [email protected] * David Orden is senior research fellow at the International Food Policy Research Institute
(IFPRI), Washington D.C., and professor at Virginia Tech. Tel: 202 862-8160 [email protected]
Correspondence regarding this paper should be addressed to the authors.
May 2009 ISSN 1098-9210
Working Paper #09-2
2
ACRE IN THE U.S. FARM BILL AND THE WTO Carl Zulauf and David Orden*,**
ABSTRACT Two counterfactual analyses investigate the new ACRE program. Had ACRE existed instead of the programs authorized during 1996-2006 for corn, soybeans, and wheat, farm program spending would have totaled less. Estimated ACRE revenue payments increase 78 percent when calculated by applying the annual 1996-2006 percentage variations to USDA forecast average 2009-2012 acres, prices, and yields. Traditional marketing loan and counter-cyclical payments are estimated near zero. Policy design issues concern the merit of revenue versus price protection, fixed support targets versus support adjusting with lagged market revenue, and the economic dislocation and WTO compliance from alternative policy instruments. KEY WORDS: Farm Policy, Food Conservation and Energy Act of 2008, Average Crop Revenue Election Program (ACRE), WTO Domestic Support Commitments * Carl Zulauf is Professor, Department of Agricultural, Environmental, and Development
Economics, Ohio State University. Room 235, Ag Admin Bldg., 2120 Fyffe Road, Columbus, OH 43210
Tel: 614-292-6285 FAX: 614-292-7710 [email protected] * David Orden is senior research fellow at the International Food Policy Research Institute
(IFPRI), Washington D.C., and professor at Virginia Tech. Tel: 202 862-8160 [email protected]
** This research is a component of the project “Improving WTO Transparency: Shadow
Domestic Support Notifications” at the International Food Policy Research Institute (IFPRI).
1
ACRE IN THE U.S. FARM BILL AND THE WTO
The Food, Conservation, and Energy Act of 2008 (2008 Farm Bill) provides farm
commodity program participants with the choice of a traditional suite of direct payment,
marketing loan, and price counter-cyclical programs or a new Average Crop Revenue Election
(ACRE) program suite. The ACRE suite, which was authorized for the 2009-2012 crop years,
consists of 80 percent of direct payments, marketing loans at 70 percent of the loan rate, and a
new state revenue program. Thus, the revenue program replaces the counter-cyclical program
and substitutes for lower direct payments and loan rates.
Revenue programs have been discussed for decades (Harrington and Doering) but ACRE
is the first such program authorized by a farm bill. Proponents argue that a revenue program
addresses the gap in the farm safety net that arises because the marketing loan program provides
little protection when individual farm yields are low. They also argue that revenue programs
address the inconsistency that marketing loan and counter-cyclical payments can occur when
revenue is above average because high yields more than offset low prices.
ACRE contains another policy innovation. Its revenue guarantee adjusts to changes in
market revenue over time. ACRE’s policy objective is to provide assistance when market
revenue declines over a few years but not to preclude producer adjustments by creating a floor.
Thus, ACRE provides less assistance than traditional programs during periods of chronically low
prices that persist more than a few years. However, the high prices and resulting high market
revenues of 2007 and 2008 will translate into a higher ACRE revenue guarantee, meaning that
ACRE could make payments if market revenue declines from these levels. In contrast,
marketing loan and counter-cyclical payments will occur only if prices fall more precipitously.

2
U.S. farm programs must meet not only domestic needs but also World Trade
Organization (WTO) rules on agricultural trade and domestic support policies. While the Doha
Round of negotiations has not produced a replacement for the existing Uruguay Round rules, a
potential framework has been drafted in substantial detail (WTO). A guiding principle in the
draft framework is to constrain expenditures on policies tied to current production and prices,
while encouraging movement to policies decoupled from production decisions and market
conditions. The draft Doha text lowers permitted U.S. annual expenditures on coupled programs
in its total Aggregate Measure of Support (AMS) from $19.1 to $7.6 billion. Because ACRE’s
revenue payments are tied to current planted acres and market revenue, they are likely to fall into
the AMS category.
Given the preceding discussion, the objective of this article is to compare the ACRE and
traditional farm program suites in terms of providing domestic support and in terms of U.S.
WTO commitments. Specifically, two counterfactual analyses are conducted. One calculates
payments that the ACRE suite of programs would have made had it existed during the 1996-
2006 crops years and assuming all corn, soybean, and wheat acreage were enrolled. These
counterfactual ACRE payments are compared with actual payments made to farmers during the
1996-2006 crop years, providing insights into differences in the levels and temporal flow of
payments from the two program suites. The second counterfactual analysis uses the annual
percentage variations in acres, prices, and yields in the temporal order they occurred over the
1996-2006 crop years but applies them to the U.S. Department of Agriculture (USDA) forecast
of average U.S. acres, prices, and yields for the 2009-2012 crop years. This approach provides a
possible eleven-year path of ACRE expenditures grounded in historical experience but adjusted
to reflect a contemporary expectation of higher revenues in the future.

3
The next two sections of this paper contain a discussion of the policy foundations of the
ACRE program and the ACRE provisions in the 2008 Farm Bill. Parameters and procedures of
the two counterfactual analyses are then presented, followed by a discussion of the results and
implications for U.S. support payments and existing and potential U.S. WTO commitments.
Comparison: Current Programs versus ACRE State Revenue Program
Current farm programs provide three types of support: fixed direct payments, marketing
loan and counter-cyclical. The direct payment program pays farmers a specific dollar amount
per historical base acre. The dollar amount does not change with market prices or with the level
of production. Direct payments are decoupled from current production and prices under WTO
rules, although some challenges have been raised regarding their classification.
The policy objectives of the marketing loan and counter-cyclical programs are to assist
farmers with managing the systemic (e.g., market) risk of chronically low prices that extend over
a period of years. This objective is implemented by establishing fixed marketing loan and
counter-cyclical support rates that provide a floor on the per unit value of the crop. Payments
occur if market price drops below the support rates. Marketing loan payments are based on
current production and prices, and thus are considered coupled under WTO rules. Counter–
cyclical payments are based on current prices but historical production. They are considered
partially decoupled, with negotiations continuing over how to classify them in the WTO.
ACRE’s policy objective is to assist farmers with managing the systemic risk of a decline
in a crop’s revenue over a short period of years, but to avoid creating a floor (Zulauf, Dicks, and
Vitale). Revenue is defined as U.S. price times state yield per planted acre. A floor is avoided
by using moving averages of U.S. prices and state yields to calculate ACRE’s revenue guarantee.

4
Thus, the guarantee increases (decreases) as market revenue increases (decreases). A state
revenue payment occurs for a crop when actual state revenue is less than the state’s guarantee.
Tying the ACRE guarantee to market revenue allows changes in supply and demand
factors, including the cost of production, to be incorporated into the guarantee. For example, if
costs increase faster than production efficiency, supply will decline ceteris paribus. Given that
the short-run demand for crops is inelastic, price and revenue should increase, resulting in an
increase in ACRE’s revenue guarantee. But, if production efficiency increases faster than costs,
ACRE’s revenue guarantee should decline as the resulting increase in production leads to lower
prices and revenue ceteris paribus.
Unlike the marketing loan and counter-cyclical programs, ACRE’s revenue program will
not provide extended protection against chronically low prices. On the other hand, ACRE can
provide assistance when prices and cost of production increase above the fixed marketing loan
and counter-cyclical support rates.
ACRE Provisions in the Food, Conservation, and Energy Act of 2008
The decision to elect ACRE begins with covered crops harvested in 2009 (U.S.
Congress). Covered crops are barley, corn, cotton, oats, peanuts, sorghum, soybeans, and wheat.
ACRE must be elected—if no choice is made, a farmer remains in the traditional farm programs.
As long as a farmer is not in ACRE, the election of ACRE remains open. Once ACRE is elected,
a farmer is enrolled through the 2012 crop. ACRE must be elected for all covered crops grown
on the farm; however, ACRE payments are crop specific.
An ACRE revenue payment is triggered for a crop if a state’s actual revenue per planted
acre is less than the state’s revenue guarantee per planted acre for the crop for the crop year.
5
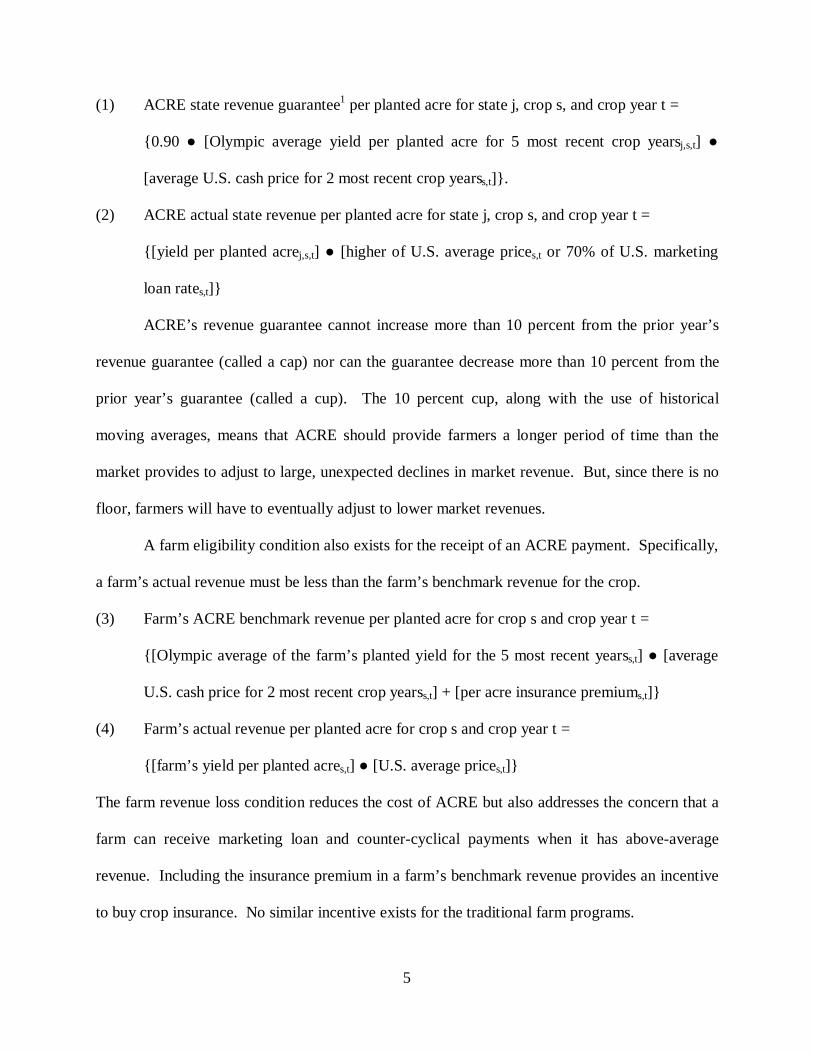
(1) ACRE state revenue guarantee1 per planted acre for state j, crop s, and crop year t =
{0.90 ● [Olympic average yield per planted acre for 5 most recent crop yearsj,s,t] ●
[average U.S. cash price for 2 most recent crop yearss,t]}.
(2) ACRE actual state revenue per planted acre for state j, crop s, and crop year t =
{[yield per planted acrej,s,t] ● [higher of U.S. average prices,t or 70% of U.S. marketing
loan rates,t]}
ACRE’s revenue guarantee cannot increase more than 10 percent from the prior year’s
revenue guarantee (called a cap) nor can the guarantee decrease more than 10 percent from the
prior year’s guarantee (called a cup). The 10 percent cup, along with the use of historical
moving averages, means that ACRE should provide farmers a longer period of time than the
market provides to adjust to large, unexpected declines in market revenue. But, since there is no
floor, farmers will have to eventually adjust to lower market revenues.
A farm eligibility condition also exists for the receipt of an ACRE payment. Specifically,
a farm’s actual revenue must be less than the farm’s benchmark revenue for the crop.
(3) Farm’s ACRE benchmark revenue per planted acre for crop s and crop year t =
{[Olympic average of the farm’s planted yield for the 5 most recent yearss,t] ● [average
U.S. cash price for 2 most recent crop yearss,t] + [per acre insurance premiums,t]}
(4) Farm’s actual revenue per planted acre for crop s and crop year t =
{[farm’s yield per planted acres,t] ● [U.S. average prices,t]}
The farm revenue loss condition reduces the cost of ACRE but also addresses the concern that a
farm can receive marketing loan and counter-cyclical payments when it has above-average
revenue. Including the insurance premium in a farm’s benchmark revenue provides an incentive
to buy crop insurance. No similar incentive exists for the traditional farm programs.

6
If a farm’s revenue loss condition is met, its ACRE revenue payment is determined as
follows.
(5) An eligible farm’s ACRE revenue payment for crop s and crop year t =
{[83.3% of the farm’s planted acress,t (becomes 85% for 2012 crop)] ● [lesser of (ACRE
state revenue guarantee minus state actual revenue per planted acres,t) or (25% of ACRE
state revenue guarantee per planted acres,t)] ● [(farm’s Olympic average yield for 5 most
recent crop yearss,t) / (state’s Olympic average yield for 5 most recent crop yearss,t)]}
While ACRE revenue payments depend on the acres planted to each crop, a farm cannot receive
ACRE revenue payments on more acres planted to eligible crops than the farm’s total base acres.
Capping the state revenue payment at 25 percent of the state guarantee reduces program costs. It
also reduces potential double payments from crop insurance and ACRE because farmers
commonly buy insurance with coverage of 75 percent or lower.
For a person or legal entity, ACRE’s direct payments are limited to $40,000, the limit for
traditional direct income payments, minus the amount equal to the 20 percent reduction in direct
payments. ACRE’s revenue payments can not exceed $65,000, the limit on counter-cyclical
payments, plus the amount equal to the 20 percent reduction in direct payments. The 2008 Farm
Bill removed limits on marketing loan payments.
Analytical Parameters
Counterfactual analyses were conducted for the three largest acreage U.S. program crops:
corn, soybeans, and wheat. The historical period used for these analyses began with 1996. The
Federal Agriculture Improvement and Reform Act of 1996 eliminated annual land set asides;
gave farmers the freedom to make planting decisions, except for limits on planting fruits and

7
vegetables; eliminated most public stocks programs; and instituted fixed income payments
(USDA, Economic Research Service, 1996). These changes substantively reduced the impact of
farm programs on production and market prices (Orden, Paarlberg and Roe; Schertz and
Doering). Thus, the 1996 and latter crops years are more representative of current conditions
than years prior to 1996.
The counterfactual analytical period ended with the 2006 crop year. By the end of this
crop year, prices of corn, soybeans, and wheat had increased enough to not only eliminate
marketing loan and counter-cyclical payments but also to raise questions about whether the
stationary range of prices that began in 1974 (Kenyon, Jones and McGuirk) remained valid, or
whether a new range of prices existed.
Payments to corn, soybeans, and wheat from the direct income, marketing loan2, counter-
cyclical, and market loss programs for the 1996-2006 crop years were collected from USDA,
Farm Service Agency. The market loss and associated oilseed payment program were instituted
by Congress on an ad hoc basis once farm prices and income faltered in 1998. These payments,
which began with the 1998 crop year for corn and wheat and with the 1999 crop year for
soybeans, were incorporated into the Farm Security and Rural Investment Act of 2002 as the
counter-cyclical program (USDA, Economic Research Service, January 2008).
For the first counterfactual analysis, ACRE state revenue payments were calculated
assuming that the ACRE suite of programs had existed for the 1996-2006 crop years. State yield
per planted acre could be calculated for 42 states, accounting for over 99 percent of U.S. acres
planted to corn, soybean, and wheat from 1996 through 2006 (USDA, National Agricultural
Statistics Service). Observed state planted acres, state production, and U.S. crop year cash
prices3 were used. All acres planted to corn4, soybeans, and wheat were assumed to be enrolled

8
in the ACRE program. Data started with the 1991 crop year in order to have enough
observations to construct the 5-year Olympic moving averages of state yields for 1996.
The second counterfactual analysis used the percent deviations from average values
observed for acres, prices, and yield for the 1996-2006 crop years, but it applied the percent
deviations to the average acres, prices, and yields5 forecast by USDA, Office of the Chief
Economist in February 2008 for the 2009-2012 crop years. The prices and yields forecast for
2009-2012 are higher than the average prices and yields observed during the 1996-2006 crop
years (Table 1). Thus, the second counterfactual analysis has a higher level of revenue per
planted acre. The dollar value of ACRE payments for a given percent decline in revenue will be
higher when revenue is higher.
The average forecast U.S. planted acres was turned into a forecast for individual states by
using the ratio of (average state planted acres for 1996-2006) / (average U.S. planted acres for
1996-2006). A similar calculation was used to derive individual state forecasts for average
yields over the 2009-2012 crop years. The average forecast state planted acres, state yield per
planted acre, and U.S. price were converted into annual observations by using the observed
percent deviation of the variable for a crop year between 1996 and 2006 from the variable’s
average value for the 1996-2006 crop years. To illustrate these calculations, the individual
observation on state j’s acres planted to crop s based on the observed percent deviation for crop
year t was calculated as: {[2009-2012 forecast average planted acresj,s] ● [acres plantedj,s,t /
1996-2006 average planted acresj,s]}. ACRE state revenue payments were calculated using these
hypothetical state planted acres, state planted yields, and U.S. prices derived for the 11 annual
observations. For the second counterfactual analysis, payments also were estimated for the
traditional price based farm programs.
9
The approach utilized for the second counterfactual analysis of applying 1996-2006
percentage deviations of acres, prices and yields to forecast average levels for 2009-2012 was
chosen because the time paths of acres, prices, and yields result from a complex interplay of
economic parameters and random shocks. The economic parameters include supply and demand
elasticities, correlations between U.S. price and state yields, correlations between state yields
across crop years, and correlations between U.S. prices across crop years. Little is known with
statistical accuracy about the mean value and other distributional attributes of these economic
parameters in the market environment that has existed since the major policy changes of the
1996 Farm Bill. The use of time-ordered, historical percent deviations from average values
provides a measure of variation that has been observed and thus could occur again.
Neither analysis included three constraints that limit ACRE revenue payments: (1) the
limit on ACRE revenue payments per legal entity, (2) the restriction that ACRE revenue
payments cannot be received on more planted acres than the total base acres on the farm6, and (3)
the payment eligibility condition that a farm’s actual revenue for the crop must be less than the
farm’s benchmark revenue for the crop. These constraints were not implemented because of the
lack of farm level data needed to parameterize them. As a result, the two analyses provide an
upper bound estimate on ACRE state revenue payments for corn, soybeans and wheat.
Results 1 – Historical Acres, Prices, and Yields Analysis
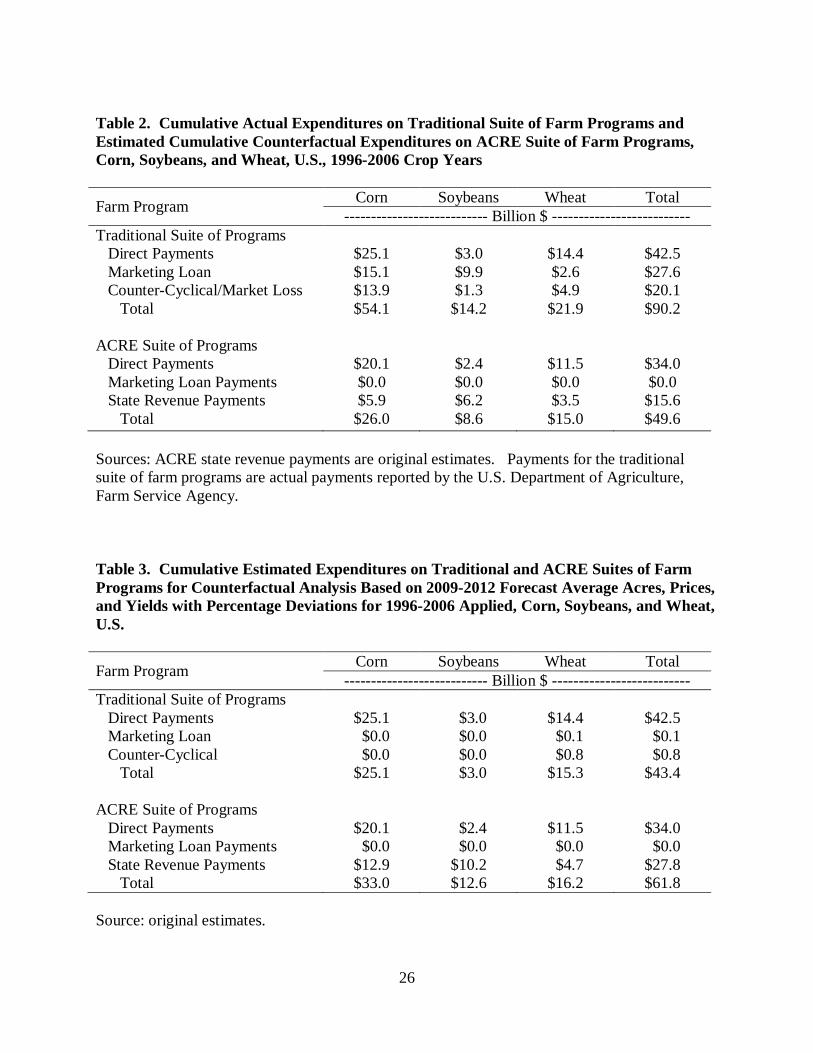
ACRE state revenue payments for corn, soybeans, and wheat over the 1996-2006 crop
years were estimated to be 22 percent smaller, or $4.5 billion less, than the actual payments
made by the counter-cyclical program and its predecessor, the market loss program (Table 2).
No payments were estimated for the ACRE marketing loan program. Its 30 percent lower loan

10
rates were less than the market prices observed for all crops, years, and states. In contrast, the
authorized marketing loan programs made $27.6 billion in payments to corn, soybeans, and
wheat. Direct payments to these crops totaled $42.5 billion over the 1996-2006 crop years.
Thus, the 20 percent reduction contained in the ACRE suite of programs would have resulted in
$8.5 billion less in direct payments. In total, estimated counterfactual payments if the ACRE
suite of programs had existed for the 1996-2006 crop years were $40.6 billion, or 45 percent, less
than payments made by the farm programs authorized by Congress. Payments by the ACRE
program suite for corn, soybeans, and wheat were estimated to be 52 percent, 39 percent, and 32
percent less, respectively.
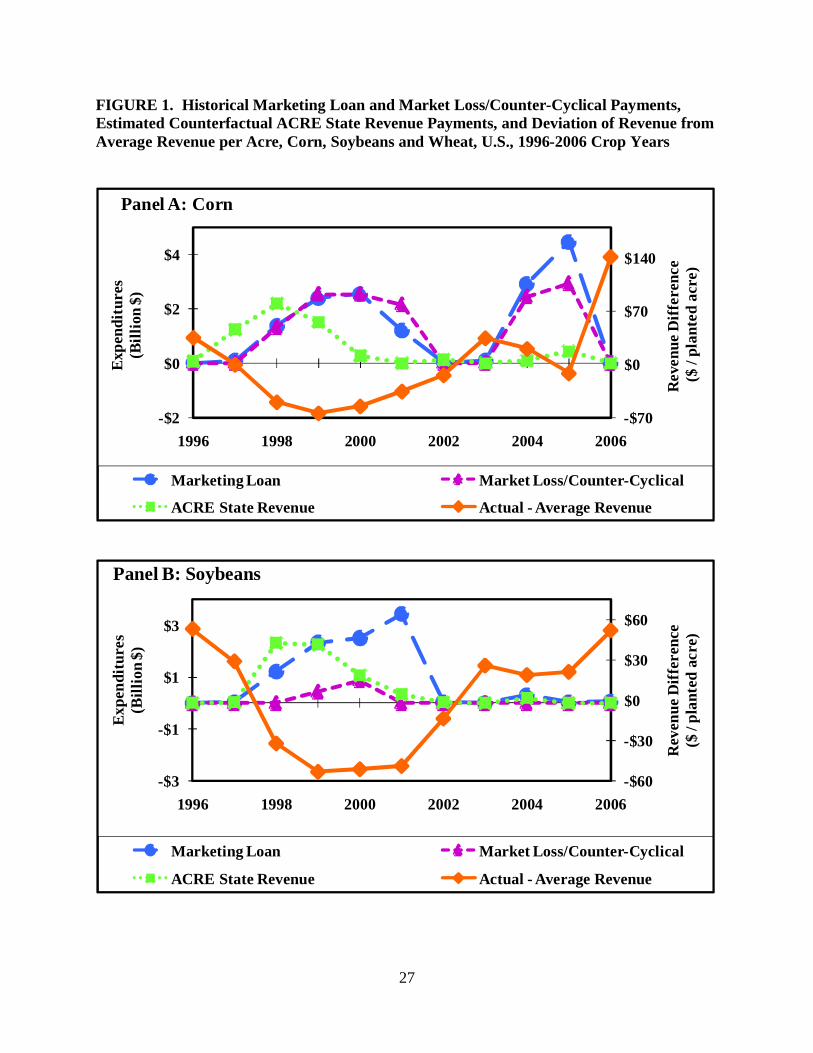
Over the 1996-2006 crop years, the dominant negative market event for crop producers
was the sharp decline from the high prices during 1995-1996. This decline reflected increased
production, due in part to the elimination of annual acreage set asides, and the adverse demand
effects of the Asian financial crisis that emerged during the fall of 1997. To examine program
performance in response to this market event, Figure 1 presents the estimated ACRE revenue
payments as well as marketing loan and counter-cyclical/market loss payments by year for corn,
soybeans, and wheat.
ACRE state revenue payments occurred for the 1997 crop year for corn ($1.2 billion) and
wheat ($0.7 billion). In contrast, marketing loan payments for the 1997 crop year were only $0.1
million for corn and nothing for wheat. For soybeans, neither program began making payments
until the 1998 crop year. ACRE revenue payments totaled $2.3 billion versus $1.2 billion for
marketing loan payments. Thus, in general the counterfactual ACRE revenue program was
estimated to make larger payments earlier. The reason is that the two-year moving average of
prices in ACRE’s revenue guarantee contained the high prices of the 1995 and 1996 crop years.

11
These prices were higher than the loan rates fixed in the 1996 Farm Bill. Hence, prices had to
decline further to trigger marketing loan payments than ACRE state revenue payments7.
ACRE revenue payments began to decline by the 1999 or 2000 crop year (Figure 1).
This decline occurred because ACRE’s revenue guarantee is not fixed, but moves with market
revenue, which in this case declined. In examining payments by individual years, only five
percent of $5.2 billion in ACRE revenue payments to corn over the 1997-2001 crop years
occurred for the 2000 and 2001 crop years. In contrast, 52 percent of the $16.2 billion in
marketing loan and market loss payments to corn over the 1997-2001 crop years occurred for the
2000 and 2001 crop years. For soybeans, 63 percent of the $10.8 billion in marketing loan and
oilseed payments, but only 23 percent of the $6 billion in ACRE revenue payments, over the
1997-2001 crop years occurred in 2000 and 2001. The same comparison for wheat is 50 percent
of $7.3 billion in marketing loan and market loss payments versus 18 percent of the $2.7 billion
in ACRE revenue payments. Thus, total marketing loan and market loss payments were higher
than total ACRE state revenue payments. However, half or more of the marketing loan and
market loss payments occurred four to five years after the decline in prices and revenue began.
One other noticeable policy event over these 11 crop years was that $12.8 billion in
marketing loan and counter-cyclical payments were made to corn during the 2004 and 2005 crop
years. These payments accounted for 44 percent of all marketing loan, counter-cyclical, and
market loss payments to corn over the 1996-2006 crop years. However, because corn yield was
a record 158 bushels per planted acre in 2004 and a relatively high 147 bushels in 2005, U.S.
revenue per planted acre was $20 higher in 2004 and only $12 lower in 2005 than the average
revenue for the 1996-2006 crop years8 (Figure 1). In contrast, ACRE state revenue payments

12
were estimated to total only $0.5 billion for the 2004 and 2005 crop years because the high yields
in these years would have been taken into account.
An analysis of the results by individual state and crop found that for 38 percent of the
years in which an ACRE state payment occurred for corn, the state’s yield was 10 percent lower
than the state’s five-year Olympic moving average yield. The comparable shares were 50
percent for soybean and 48 percent for wheat. The importance of declines in state yields was
greater for states that produced a smaller share of U.S. output. This finding is consistent with the
expectation that deviations in state yields as well as the correlation between changes in state
yield and changes in U.S. price are a determinant of ACRE state revenue payments.
Results 2 – Average 2009-2012 Acres, Prices, and Yields Analysis
Consistent with the expectation noted above, estimated ACRE revenue payments for
corn, soybeans, and wheat were $12.2 billion, or 78 percent, higher at the higher prices and
yields forecast by USDA for the 2009-2012 crop years (Table 3). ACRE revenue payments
increased 119 percent for corn, 65 percent for soybeans, and 34 percent for wheat. Due to the
higher prices forecast for 2009-2012, marketing loan and counter-cyclical payments were
estimated to occur only for wheat and only at the support levels set for the traditional programs
in the 2008 Farm Bill9. Adding in direct payments, total payments by the ACRE suite of
programs were estimated to be $61.8 billion when based on 2009-2012 average acres, prices, and
yields. In contrast, total payments by the traditional suite of farm programs were estimated to be
$43.4 billion, with almost all being direct income payments. Thus, ACRE is the more costly
farm program suite when acres, prices, and yields are assumed to be average forecasted 2009-
2012 levels rather than observed 1996-2006 levels.

13
Because the percent deviations of state acres, U.S. prices, and state yields are the same
for both analyses, the temporal patterns of ACRE revenue payments are also similar (Figure 2).
In both counterfactual analyses, these payments were highest for the 1998 observation. ACRE
revenue payments for the 1998 observation were estimated to be $9.8 billion—$4.8 billion for
corn, $3.8 billion for soybeans, and $1.2 billion for wheat—at the 2009-2012 forecast average
acres, prices, and yields. Total ACRE revenue payments were slightly smaller at $7.8 billion for
the 1999 observation, then declined to $2.7 billion for the 2000 observation and $0.8 billion for
the 2001 observation. The decline in payments reflects the downward adjustment in ACRE’s
revenue guarantee over these observations due to declining revenues from the market even with
the higher average revenues that are assumed to occur.
ACRE in World Trade Organization (WTO) Context
The ACRE state revenue program is prima facie coupled to current planting decisions
and prices of specific crops. Thus, ACRE revenue payments likely will be notified to WTO as
product-specific payments under the AMS. The U.S. has notified WTO that it has been under its
Uruguay Round AMS cap for the 1996-2005 crop (marketing) years. No official notification has
been submitted for the 2006 crop year, but it can be anticipated that the U.S. will be within its
AMS cap because prices were relatively high for most U.S. crops (Blandford and Orden).
The implications of ACRE for U.S. WTO compliance hinges on two determinants10. One
is the level of payments made by the ACRE revenue program. The second is whether the
existing Uruguay Round WTO compliance rules remain in effect or are replaced by a new Doha
Round agreement.

14
The two counter-factual analyses illustrate that key factors affecting the level of ACRE
revenue payments are the levels of prices and yields. At prices, and yields that occurred from
1996-2006, the estimated payments of $15.6 billion from the ACRE state revenue program were
less than the $27.6 billion in payments from the traditional marketing loan program for this
period. Moreover, the peak total payment from the ACRE state revenue program for corn,
soybeans, and wheat of $5.4 billion for the 1998 crop year was less than the peak payment of
$5.9 billion for the 2000 crop year from the traditional marketing loan program (Figure 1) or the
notified AMS for 2000 for corn, soybeans, and wheat of $7.2 billion11. Thus, the U.S. likely
would have remained compliant with its Uruguay Round AMS commitment if the ACRE
program suite had existed over the 1996-2006 crop years. However, its reported annual AMS
levels would have shifted due to the different time pattern of ACRE revenue payments.
At the average acres, prices, and yields forecast for 2009-2012 and applying the
deviations from averages observed for the 1996-2006 crop years, ACRE revenue payments for
corn, soybeans, and wheat were estimated to have increased to $27.8 billion, or $0.2 billion
higher than actual 1996-2006 marketing loan payments. Peak annual ACRE revenue payments
of $9.7 billion exceeded the notified AMS for corn, soybeans, and wheat in 2000 by $2.5 billion.
The highest annual total AMS notified by the U.S. was $16.8 billion for 1999 and 2000. This
notified amount is $2.3 billion less than the U.S. AMS cap of $19.1 billion. Combining these
various considerations, the possibility exists that the ACRE revenue program could cause the
U.S. to exceed its Uruguay Round AMS cap in a peak payment year. However, changes to the
U.S. dairy support program enacted in the 2008 Farm Bill may reduce the notified support in the
AMS for dairy products. Blandford and Orden estimate this reduction could be as much as $3.6

15
billion by 2014. Thus, changes to the dairy program in the 2008 Farm Bill would seem to make
the probability of the U.S. exceeding its current WTO AMS cap small.
Blandford and Josling and Blandford and Orden also found that ACRE revenue payments
for corn, soybeans, and wheat at price levels forecast for coming years are unlikely to exceed the
U.S. Uruguay Round AMS cap. Their studies used time-paths of price deviations drawn from
the 1970s, 1980s and 1990s in combination with forecast levels of U.S. national production12.
The draft Doha rules would, if agreed upon, impose tighter constraints on U.S. support
programs. Total U.S. AMS commitment would decline to $14.3 billion from $19.1 billion upon
implementation, then linearly to $7.6 billion in the fifth year (WTO). A new cap on Overall
Trade Distorting Support (OTDS) would also constrain the sum of total AMS, product-specific
and non product-specific de minimis support, and a redefined “blue box” support which would
include counter-cyclical payments. The OTDS cap initially would be $32.3 billion, declining to
$14.4 billion over five years. In addition, new product-specific AMS caps would be set for U.S.
corn, soybeans and wheat at $1.4, $1.12, and $0.23 billion, respectively, upon implementation.
The cap for corn would decline further over three years to $1.11 billion.
Using actual 1996-2006 acres, prices, and yields, estimated ACRE revenue payments
would have exceeded the Doha draft product-specific caps for corn and soybeans in the 1998 and
1999 crop years and for wheat in the 1996-2000 crop years. Moreover, total ACRE revenue
payments to corn, soybeans, and wheat equaled $5.4 and $4.4 billion in 1998 and 1999,
respectively. The other support included in the notified AMS totaled $7.1 billion in 1998 and
$10.1 billion in 1999 (excluding marketing loan program payments for corn, soybeans, and
wheat, and also soybean oilseed payments in 1999 included as product-specific AMS that the
counterfactual ACRE programs would have replaced). Thus, the U.S. notifications with these

16
ACRE payments would substantially have exceeded the draft U.S. total AMS cap set at $7.6
billion for the end of the transition period. The Doha draft OTDS cap also would be exceeded in
these years if de minimis support for other crops (excluding the crop market loss payments for
corn and wheat replaced by the counterfactual ACRE revenue payments) were added to the
AMS.
At the higher average prices and yields forecast for 2009-2012, WTO Doha draft
compliance considerations are exacerbated for ACRE when percentage deviations from 1996-
2006 are applied. The Doha draft product-specific AMS caps are exceeded for corn when using
the 1997-1999 deviations, for soybeans when using the 1998-2000 deviations, and for wheat
when using the 1996-2001 deviations. In addition, ACRE revenue payments for corn, soybeans,
and wheat of $9.7 billion when using the 1998 deviations and of $7.8 billion when using the
1999 deviations would have exceeded the draft total AMS cap. Thus, it appears likely that the
U.S. could exceed the draft Doha constraints, especially if prices and yields are higher in the
future than over the 1996-2006 crop years.
The higher prices forecast for 2009-2012 would ease WTO compliance considerations for
the traditional suite of farm programs at the loan rates and target prices enacted in the 2008 Farm
Bill. Under this scenario, total marketing loan and counter-cyclical payments are estimated to be
zero for corn and soybeans, and less than $1 billion for wheat. However, if prices return to their
1996-2006 crop year levels, then payments from these programs likely would violate the Doha
draft WTO constraints. Marketing loan payments exceeded the Doha draft product-specific
limits in crop years 1998-2000 and 2004-2005 for corn, 1998-2001 for soybeans, and 1998-2000
for wheat. Moreover, U.S. notified AMS exceeded the Doha draft total AMS cap for the U.S. in
all years between 1998 and 2005, excluding 2003 (Blandford and Orden).

17
Summary, Conclusions, and Implications
The Food, Conservation, and Energy Act of 2008 provides farm commodity program
participants with the choice of a traditional suite of direct payment, marketing loan, and price
counter-cyclical programs or a new Average Crop Revenue Election (ACRE) suite of programs.
The ACRE suite consists of 80 percent of direct payments, marketing loans at 70 percent of the
loan rate, and a new state revenue program. ACRE is the first revenue program authorized by a
farm bill. Unlike traditional commodity programs, ACRE’s revenue guarantee is not a floor but
adjusts over time to changes in market revenue.
Two counterfactual analyses were conducted to investigate ACRE. One calculated
payments that the ACRE suite of programs would have made had it existed during the 1996-
2006 crops years and assuming all acres planted to corn, soybeans, and wheat were enrolled.
The second assessment applied the percent variations in acres, prices, and yields that occurred
over the 1996-2006 crop years to USDA forecasts of average U.S. acres, prices, and yields for
the 2009-2012 crop years.
These analyses provide insights into several policy trade-offs raised by the ACRE
revenue program. One is the trade-off between revenue and price protection. Price programs
provide no payments if yields are low and prices are high; however, ACRE revenue payments
can occur when state yields are low and the percent decline in state yield is relatively greater
than the percent increase in U.S. price. Price programs provide payments, potentially large
payments, if yields are high and prices are low even when revenue is average or above average.
Such a situation occurred during the 2004 and 2005 crop years when marketing loan and
counter-cyclical payments made to corn totaled $12.8 billion. In contrast, counterfactual ACRE
revenue payments were estimated to total only $0.5 billion for 2004 and 2005 because record or

18
high yields offset most of the impact of low prices. In short, revenue programs provide a
different flow of government payments than price programs and thus provide a different match
with the incidence of risk.
A second policy trade-off stems from the moving-average, market-based determination of
the ACRE revenue guarantee. This feature eliminates the existence of a floor that can provide
continuing payments when prices are chronically low. However, it allows support levels to
increase when price increases. It is therefore not surprising that, had the ACRE program suite
existed over the 1996-2006 crop years, its payments were estimated to be smaller than payments
from the traditional fixed price programs. The reverse was found at the higher prices and yields
forecast by USDA for the 2009-2012 crop years.
The different time paths and levels of payments occur because fixed price programs and
the ACRE revenue program address different risks. Policy objective of the marketing loan and
counter-cyclical programs are to assist farmers with managing the systemic risk of chronically
low prices that extend over a period of years. In contrast, policy objective of the ACRE revenue
program is to assist farmers with managing the state systemic risk of a decline in a crop’s
revenue over a short period of years, but to avoid creating a floor. The relative importance of
these risks will depend in large part on whether chronic “surplus” production capacity exists that
will keep prices below legislated fixed support levels. An important, related political economy
question is whether Congress would step in to thwart the built-in decline in ACRE revenue
payments if prices remain low, as it did when the market loss program was created in the late
1990s.
The third policy trade-off relates to the distortion of market incentives and international
trade. Depending on the level and path that prices take, both traditional price programs and the

19
ACRE revenue program have the potential for large payments. However, ACRE payments will
decline as its guarantee adjusts to lower prices and revenues. No adjustment occurs with the
traditional marketing loan and counter-cyclical programs. ACRE therefore raises a policy
question that has received little attention: Is the economic dislocation caused by policy that
establishes a floor more or less than the economic dislocation caused by a policy whose level of
support is determined by the market and thus has no floor? The answer to this question has
implications both for the design of domestic policy instruments as well as for the development of
compliance rules within WTO.
Both the rules of the Uruguay Round and potential Doha Round will continue to allow
expenditures on programs that are tied to current production and/or prices. It thus behooves
policy makers to create policy instruments that provide the best mix of policy performance
attributes. The ACRE program is in essence asking what policy performance attributes are
desired given the market conditions that exist in the early 21st century. The answers are not
obvious but provide a rich opportunity for economists to contribute to this debate, ranging from
more robust estimates of core economic parameters, such as elasticities and inter-temporal and
spatial price and revenue correlations, to the development of new theoretical constructs to frame
the discussion.

20
Endnotes 1. Separate revenue guarantees are created for irrigated and non-irrigated land if at least 25
percent of a state’s planted acres are irrigated and at least 25 percent are non-irrigated.
2. Loan deficiency and market loan loss payments compose marketing loan payments.
3. Substantial debate has occurred over how to calculate the 2-year moving average of U.S.
price. This study employs the two most recent crop years for which any information
exists on prices. This method is used in the interim final regulations by USDA,
Commodity Credit Corporation. To illustrate, the ACRE state revenue target for the
2006 crop year was calculated using the U.S. price for the 2004 and 2005 crop years.
4. Acres planted to corn included both acres planted for grain and silage. Acres harvested
for silage in a state were assigned the yield for acres harvested for grain in the state.
5. USDA forecasts yield per harvested acre. It was converted into a forecast yield per
planted acre as follows: {[forecast U.S. harvest yield] ● [(average U.S. planted yield for
1996-2006 crop years) / (average U.S. harvest yield for 1996-2006 crop years)]}.
6. The constraint that planted acres on which an ACRE revenue payment is received cannot
exceed base acres applies to individual farms. However, some perspective on this
constraint can be gained by examining national data. In 2003, base acres of corn,
soybeans, and wheat were 87.8, 53.5, and 76.2 million, respectively (USDA, Economic
Research Service, November 2008). These base acres sum to 217.5 million. Planted
acres for the 1996-2006 crop years (with forecast planted acres for 2009-2012 in
parenthesis) were 79.1 (91.8) million for corn, 72.6 (68.9) million for soybeans, 63.0
(58.1) million for wheat, and 214.7 (218.8) million in total (Table 1). For these crops,

21
total base acres and total planted acres do not differ by much. Hence, while the constraint
on ACRE payment acres can have significance for individual farms, this comparison
suggests its national impact is muted.
7. The counter-cyclical program did not exist until the 2002 crop year. To provide
perspective on what counter-cyclical payments might have been during the 1996-2001
crop years, a counterfactual analysis was conducted. It was assumed that the counter-
cyclical program parameters for 2002 (base acres, base yield, target prices, and loan
rates) existed during the earlier crop years. Counter-cyclical payments of $2.9, $0.6, and
$1.3 billion for corn, soybeans, and wheat, respectively, were estimated to have occurred
for each crop year from 1998 through 2001. In each of these years, average U.S. cash
price was below the U.S. loan rate, resulting in maximum counter-cyclical payment. For
each crop, total counter-cyclical payments exceeded total market loss payments: $11.6
versus $8.6 billion for corn, $2.2 versus $1.3 billion for soybeans, and $5.1 versus $4.9
billion for wheat. Even though $0.1 billion of loan deficiency payments were made to
corn during the 1997 crop year, no counter-cyclical payments were estimated for corn for
this crop year. The reason is that the 1997 season average U.S. price for corn was $2.43.
It exceeded the counter-cyclical payment price of $2.32, which was the target price of
$2.60 minus the direct payment rate of $0.28. The small marketing loan payments
occurred because corn prices were below the loan rate for a brief period in a few states.
8. If the high revenue year of 2006 is eliminated from this calculation, U.S. revenue per
planted corn acre was $35 higher in 2004 and $2 higher in 2005 than the average revenue
for the 1996-2005 crop years.

22
9. The $0.1 billion in estimated wheat marketing loan payments for 2009-2012 forecast
acres, prices, and yields occurred in 14 states scattered across observation years 1998
through 2001. The $0.8 billion in estimated wheat counter-cyclical payments for 2009-
2012 forecast acres, prices, and yields occurred in observation years 1998 through 2000.
10. U.S. notifications are under several challenges in the WTO. Outcomes of these
challenges could alter this assessment of compliance, both for ACRE and traditional farm
programs, but is not addressed herein. See Blandford and Orden for discussion.
11. Besides marketing loans, the U.S. AMS notification for 2000 included loan forfeiture,
certificate gains, storages and interest costs, and soybean oilseed payments. These items
totaled $1.3 billion in notified product-specific AMS for corn, soybeans and wheat.
12. To explore the effect of aggregation on estimated payments, ACRE revenue payments
were estimated using 2009-2012 U.S. forecast acres, prices, and yields and percent
deviations of U.S. acres, prices, and yields from their average values during 1996-2006.
They totaled $20.4 billion, compared with $27.8 billion in total payments estimated using
state level data (Table 3). The comparison by crop (with the state based estimate in
parenthesis) was $7.1 ($12.9) billion for corn, $10.2 billion in both analyses for soybeans,
and $3.1 ($4.7) billion for wheat. ACRE payments were expected to be higher for state
than national data because yield variability is greater at the state level. However, the
same estimate for soybeans in both counterfactual analyses indicates that other factors are
also affecting the outcomes. A likely factor is the relative importance of declines in U.S.
price and of declines in state yield to triggering ACRE revenue payments. The greater is
the relative importance of declines in U.S. price, the closer should be the state and
national estimates.

23
References
Blandford, D. and T. Josling (2008). “The WTO July 10th agricultural modalities proposals and
their impact on domestic support in the EU and the US.” Paper prepared for the World
Bank, Washington, D.C.
Blandford, D. and D. Orden (2008). “United States: Shadow Domestic Agricultural Support
Notifications.” Discussion Paper 821, International Food Policy Research Institute
(IFPRI), Washington D.C. http://www.ifpri.org/events/conferences/2008/20080314.asp
Harrington, D. H. and O. Doering (1993). “Agricultural Policy Reform: A Proposal.” Choices:
The Magazine of Food, Farm & Resource Issues. 8 (1st Quarter, Issue 1): 14-19.
Kenyon, D., E. Jones, and A. McGuirk (1993). “Forecasting Performance of Corn and Soybean
Harvest Futures Contracts.” American Journal of Agricultural Economics. 75 (May):
399-407.
Orden, D., R. Paarlberg, and T. Roe (1999). Policy Reform in American Agriculture. Chicago:
University of Chicago Press.
Schertz, L. and O. Doering (1999). The Making of the 1996 Farm Act. Ames: Iowa State
University Press.
U.S. Congress (2008). Food, Conservation, and Energy Act of 2008. H.R. 2419. [Accessed
December 30, 2008]
http://frwebgate.access.gpo.gov/cgi-bin/getdoc.cgi?dbname=110_cong_bills&docid=f:h2419enr.txt.pdf
U.S. Department of Agriculture (USDA), Commodity Credit Corporation (December 29, 2008).
“Direct and Counter-Cyclical Program and Average Crop Revenue Election Program”.
Federal Register. 73 (No. 249): 79284-79306. [Accessed December 30, 2008]
http://www.fsa.usda.gov/Internet/FSA_Federal_Notices/directandcounter.pdf
24
U.S. Department of Agriculture (USDA), Economic Research Service (September 1996).
Provisions of the Federal Agriculture Improvement and Reform Act of 1996. Edited by
F. Nelson and L. Schertz. Agriculture Information Bulletin No. 729.
U.S. Department of Agriculture (USDA), Economic Research Service (January 2008). The 2002
Farm Bill: Provisions and Economic Implications. Edwin Young, Coordinator.
Administrative Publication No. (AP-022) [Accessed December 3, 2008]
http://www.ers.usda.gov/Publications/AP/AP022/
U.S. Department of Agriculture (USDA), Economic Research Service (November 2008).
“Agricultural Outlook: Statistical Indicators.” [Accessed December 29, 2008]
http://www.ers.usda.gov/Publications/AgOutlook/AOTables/
U.S. Department of Agriculture (USDA), Farm Service Agency (December 2008). CCC Budget
Essentials. [Accessed December 3, 2008]
http://www.fsa.usda.gov/FSA/webapp?area=about&subject=landing&topic=bap-bu-cc
U.S. Department of Agriculture (USDA), Office of the Chief Economist (February 2008).
USDA Agricultural Projections to 2017. Long-term Projections Report OCE 2008-1.
U.S. Department of Agriculture (USDA), National Agricultural Statistics Service (2008). Data
and Statistics: Quick Stats (agricultural statistics database). [Accessed December 3,
2008] http://www.nass.usda.gov/Data_and_Statistics/Quick_Stats/index.asp
World Trade Organization (WTO) (July 10, 2008). “Revised draft modalities for agriculture.”
TN/AG/W/4/Rev. 3. Geneva.
Zulauf, C., M.R. Dicks, and J. D. Vitale (2008). “ACRE (Average Crop Revenue Election) Farm
Program: Provisions, Policy Background, and Farm Decision Analysis.” Choices: The
Magazine of Food, Farm & Resource Issues. 23 (3st Quarter): 29-35.

25
Table 1. Average Annual Price, Yield, Revenue, and Planted Acres, Corn, Soybeans, and Wheat, U.S., 1996-2006 Crop Years and Forecast 2009-2012 Crop Years Period by Crop
Cash Price per Bushel
Yield per Planted Acre
Revenue per Planted Acre
Planted Acres (million)
Corn 1996-2006 2009-2012
$2.23 $3.60
136.7 158.0
$305 $569
79.1 91.8
Soybeans 1996-2006 2009-2012
$5.73 $8.81
38.4 42.6
$220 $375
72.6 68.9
Wheat 1996-2006 2009-2012
$3.30 $4.66
34.4 36.6
$113 $171
63.0 58.1
Note: Yield per planted acre is estimated by applying the average ratio of planted to harvest yield for the U.S. over the 1996-2006 crop years to the yield per harvested acre forecast by the U.S. Department of Agriculture. U.S. yield per harvested acre is forecast to average 160.30 bushels for corn, 43.25 bushels for soybeans, and 43.25 bushels for wheat. Sources: U.S. Department of Agriculture, National Agricultural Statistics Service (December 2008) and U.S. Department of Agriculture, Office of the Chief Economist (February 2008).
26
Table 2. Cumulative Actual Expenditures on Traditional Suite of Farm Programs and Estimated Cumulative Counterfactual Expenditures on ACRE Suite of Farm Programs, Corn, Soybeans, and Wheat, U.S., 1996-2006 Crop Years
Farm Program Corn Soybeans Wheat Total --------------------------- Billion $ --------------------------
Traditional Suite of Programs Direct Payments Marketing Loan Counter-Cyclical/Market Loss Total
$25.1 $15.1 $13.9 $54.1
$3.0 $9.9 $1.3
$14.2
$14.4 $2.6 $4.9
$21.9
$42.5 $27.6 $20.1 $90.2
ACRE Suite of Programs Direct Payments Marketing Loan Payments State Revenue Payments Total
$20.1 $0.0 $5.9
$26.0
$2.4 $0.0 $6.2 $8.6
$11.5 $0.0 $3.5
$15.0
$34.0 $0.0
$15.6 $49.6
Sources: ACRE state revenue payments are original estimates. Payments for the traditional suite of farm programs are actual payments reported by the U.S. Department of Agriculture, Farm Service Agency. Table 3. Cumulative Estimated Expenditures on Traditional and ACRE Suites of Farm Programs for Counterfactual Analysis Based on 2009-2012 Forecast Average Acres, Prices, and Yields with Percentage Deviations for 1996-2006 Applied, Corn, Soybeans, and Wheat, U.S.
Farm Program Corn Soybeans Wheat Total --------------------------- Billion $ --------------------------
Traditional Suite of Programs Direct Payments Marketing Loan Counter-Cyclical Total
$25.1 $0.0 $0.0 $25.1
$3.0 $0.0 $0.0 $3.0
$14.4 $0.1 $0.8 $15.3
$42.5 $0.1 $0.8 $43.4
ACRE Suite of Programs Direct Payments Marketing Loan Payments State Revenue Payments Total
$20.1 $0.0 $12.9 $33.0
$2.4 $0.0 $10.2 $12.6
$11.5 $0.0 $4.7 $16.2
$34.0 $0.0 $27.8 $61.8
Source: original estimates.
27
FIGURE 1. Historical Marketing Loan and Market Loss/Counter-Cyclical Payments, Estimated Counterfactual ACRE State Revenue Payments, and Deviation of Revenue from Average Revenue per Acre, Corn, Soybeans and Wheat, U.S., 1996-2006 Crop Years
-$70
$0
$70
$140
-$2
$0
$2
$4
1996 1998 2000 2002 2004 2006
Rev
enue
Diff
eren
ce($
/ pl
ante
d ac
re)
Expe
ndit
ures
(Bill
ion
$)
Panel A: Corn
Marketing Loan Market Loss/Counter-Cyclical
ACRE State Revenue Actual - Average Revenue
-$60
-$30
$0
$30
$60
-$3
-$1
$1
$3
1996 1998 2000 2002 2004 2006
Rev
enue
Diff
eren
ce
($ /
plan
ted
acre
)
Expe
nditu
res
(Bill
ion
$)
Panel B: Soybeans
Marketing Loan Market Loss/Counter-Cyclical
ACRE State Revenue Actual - Average Revenue

28
FIGURE 1 (continue)
-$25
$0
$25
$50
-$1
$0
$1
$2
1996 1998 2000 2002 2004 2006
Rev
enue
Diff
eren
ce
($ /
plan
ted
acre
)
Expe
nditu
res
(Bill
ion
$)
Panel C: Wheat
Marketing Loan Market Loss/Counter-Cyclical
ACRE State Revenue Actual - Average Revenue Note: Actual revenue for a crop year is [(average U.S. crop year price) ● (average U.S. yield per planted acre)]. Average revenue is for the 1996-2006 crop years. Sources: ACRE revenue guarantee payments are original estimates. Payments for the other two programs are actual payments reported by U.S. Department of Agriculture, Farm Service Agency.

29
FIGURE 2. Counterfactual ACRE State Revenue Payments for 1996-2006 Observed Acres, Prices, and Yields and for 2009-2012 Forecast Average Acres, Prices, and Yields with Percent Deviations for 1996-2006 Applied, Corn, Soybeans and Wheat, U.S.
$0$1$2$3$4$5
1996 1998 2000 2002 2004 2006
Billi
on $
Panel A: Corn
Forecast Acre, Price, Yield Historical Acre, Price, Yield
$0
$1
$2
$3
$4
1996 1998 2000 2002 2004 2006
Billi
on $
Panel B: Soybeans
Forecast Acre, Price, Yield Historical Acre, Price, Yield
$0
$1
$2
$3
1996 1998 2000 2002 2004 2006
Billi
on $
Panel C: Wheat
Forecast Price and Yield Historical Price and Yield
Note: Forecast values are from U.S. Department of Agriculture, Office of the Chief Economist.

30
Source: original estimates.