Embed Size (px)
Citation preview
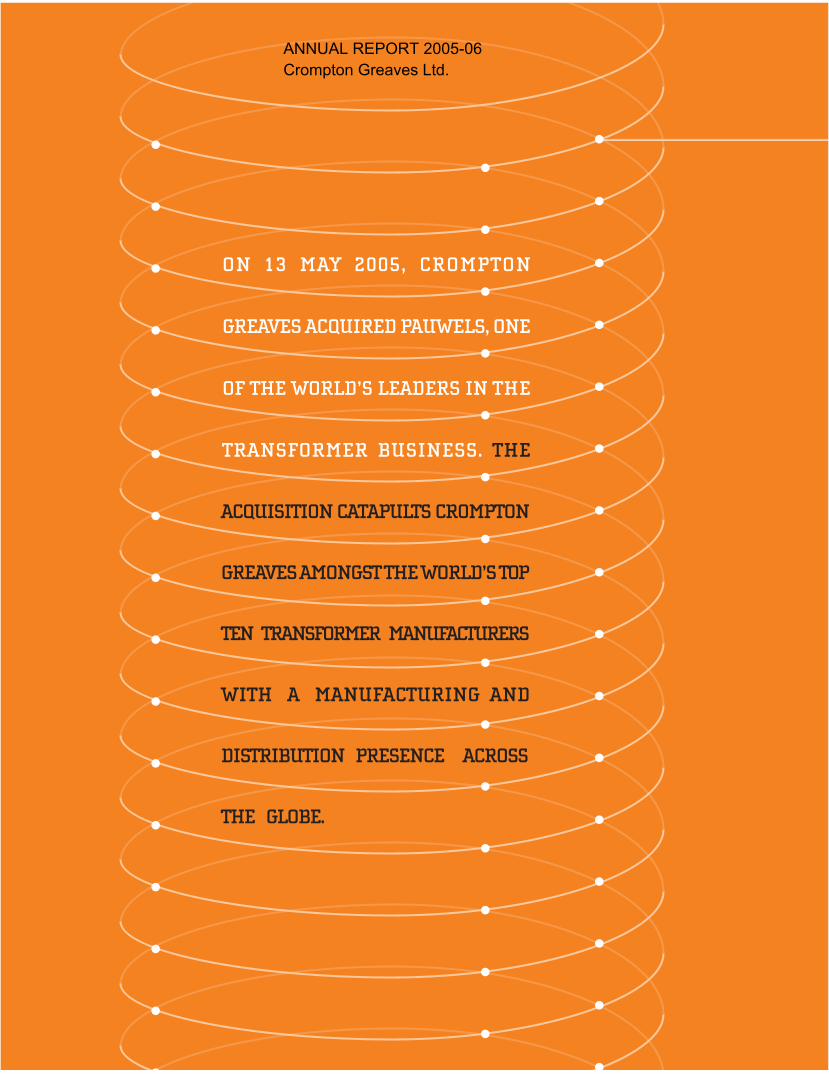
ACQUISITION CATAPULTS CROMPTON
GREAVES AMONGST THE WORLD’S TOP
TEN TRANSFORMER MANUFACTURERS
WITH A MANUFACTURING AND
DISTRIBUTION PRESENCE ACROSS
THE GLOBE.
ANNUAL REPORT 2005-06Crompton Greaves Ltd.
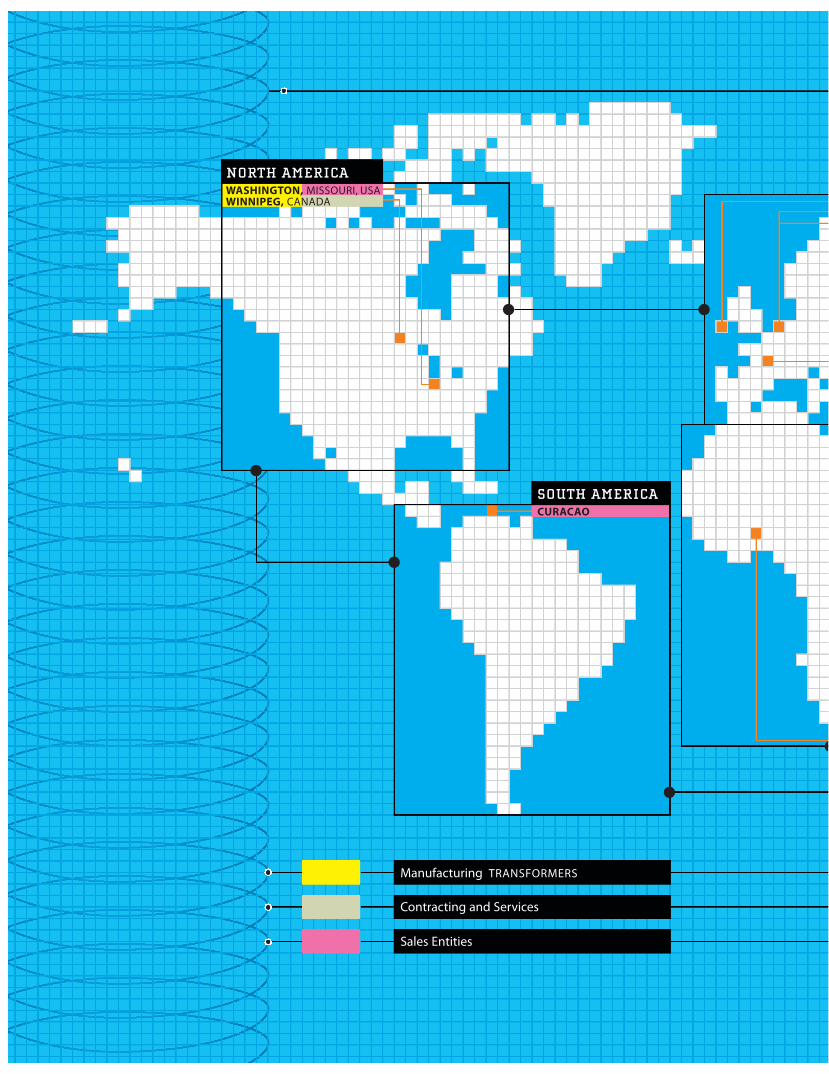
Manufacturing TRANSFORMERS
NORTH AMERICAWASHINGTON, MISSOURI, USAWINNIPEG, CANADA
SOUTH AMERICACURACAO
Contracting and Services
Sales Entities
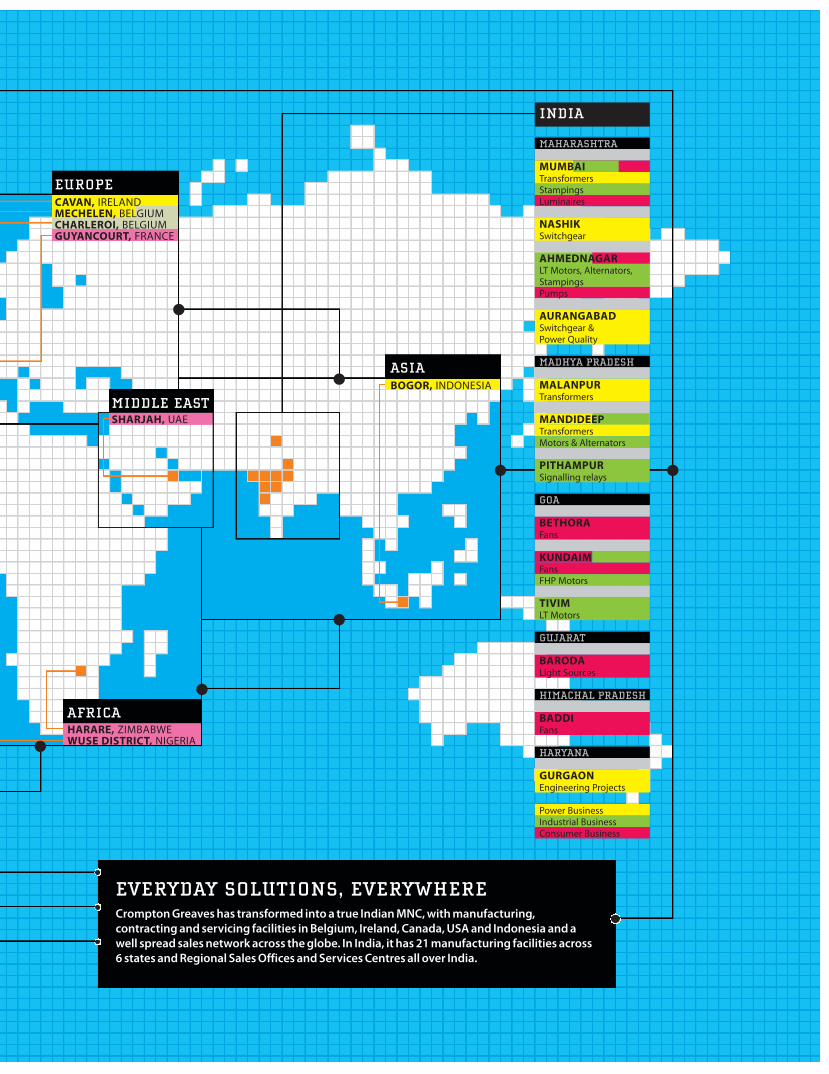
EUROPECAVAN, IRELANDMECHELEN, BELGIUMCHARLEROI, BELGIUMGUYANCOURT, FRANCE
AFRICAHARARE, ZIMBABWEWUSE DISTRICT, NIGERIA
MIDDLE EASTSHARJAH, UAE
ASIABOGOR, INDONESIA
EVERYDAY SOLUTIONS, EVERYWHERECrompton Greaves has transformed into a true Indian MNC, with manufacturing,contracting and servicing facilities in Belgium, Ireland, Canada, USA and Indonesia and awell spread sales network across the globe. In India, it has 21 manufacturing facilities across6 states and Regional Sales Offices and Services Centres all over India.
INDIA
MAHARASHTRA
MUMBAITransformersStampingsLuminaires
NASHIKSwitchgear
AHMEDNAGARLT Motors, Alternators,StampingsPumps
AURANGABADSwitchgear & Power Quality
MADHYA PRADESH
MALANPURTransformers
MANDIDEEPTransformersMotors & Alternators
PITHAMPURSignalling relays
GOA
BETHORAFans
KUNDAIMFansFHP Motors
TIVIMLT Motors
GUJARAT
BARODALight Sources
HIMACHAL PRADESH
BADDIFans
HARYANA
GURGAONEngineering Projects
Power BusinessIndustrial BusinessConsumer Business
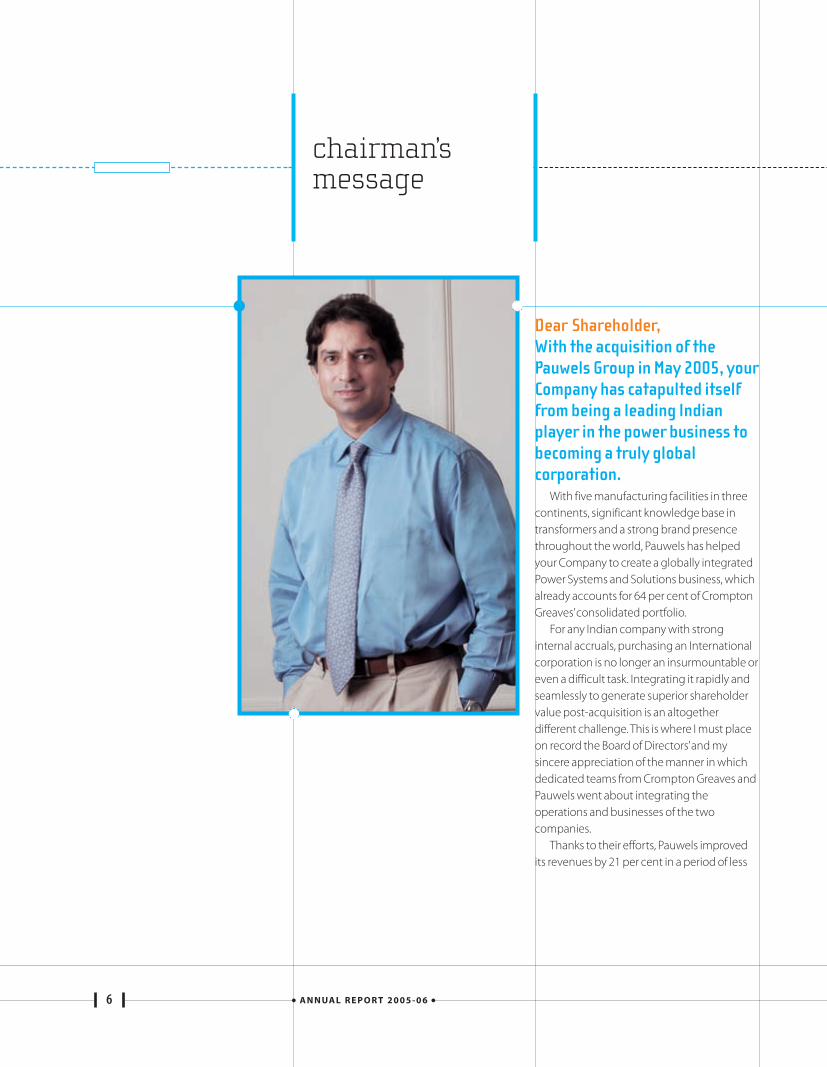
Dear Shareholder,With the acquisition of thePauwels Group in May 2005, yourCompany has catapulted itselffrom being a leading Indianplayer in the power business tobecoming a truly globalcorporation.
With five manufacturing facilities in threecontinents, significant knowledge base intransformers and a strong brand presencethroughout the world, Pauwels has helpedyour Company to create a globally integratedPower Systems and Solutions business, whichalready accounts for 64 per cent of CromptonGreaves’consolidated portfolio.
For any Indian company with stronginternal accruals, purchasing an Internationalcorporation is no longer an insurmountable oreven a difficult task. Integrating it rapidly andseamlessly to generate superior shareholdervalue post-acquisition is an altogetherdifferent challenge. This is where I must placeon record the Board of Directors’and mysincere appreciation of the manner in whichdedicated teams from Crompton Greaves andPauwels went about integrating theoperations and businesses of the twocompanies.
Thanks to their efforts, Pauwels improvedits revenues by 21 per cent in a period of less
A N N UA L R E P O R T 2 0 0 5 - 0 66
chairman’smessage
than 11 months from the date of acquisition.Its earnings before interest and taxes morethan tripled. Its return on capital employedgrew from 4 per cent to over 20 per cent. Andfrom earning a negative return on net worth,Pauwels has achieved an RONW of over 25per cent.
Because of this significant turnaround inPauwels’performance, coupled with a 27 percent growth in your Company’s stand-alonerevenues in FY2006, I am delighted to sharewith you the excellent consolidated results forCrompton Greaves.
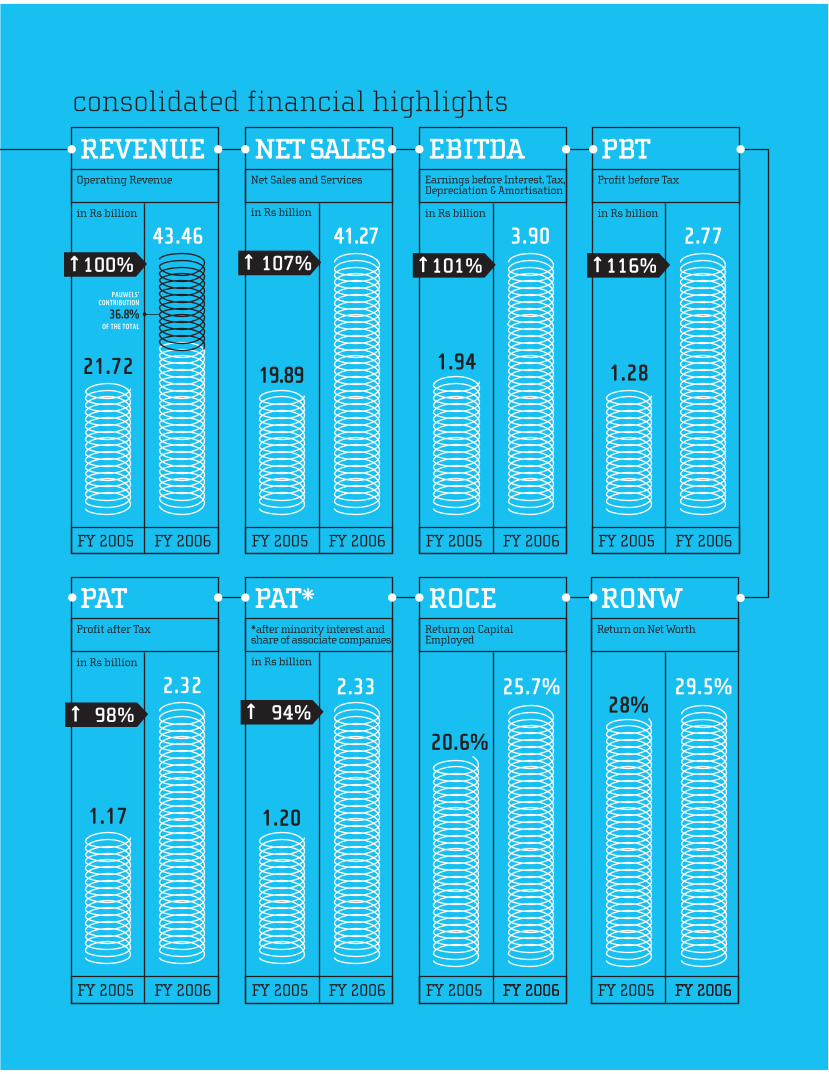
Your Company’s consolidated operatingrevenues for FY2006 doubled to Rs. 43.46billion, of which Pauwels contributed almost37 per cent. EBITDA doubled to Rs.3.90 billion.PAT increased by 98 per cent to Rs.2.32 billion.Return on capital employed was over 25 percent and return on net worth stood at 29.5 percent.
Chairmen of listed companies are expectedto refrain from making ‘forward looking’statements. Even so, I have no doubts that theconsolidated turnover of your Company willcomfortably exceed the US$ 1 billion mark inFY2007.
While the Pauwels acquisition andintegration might have been the mostexciting journey of your Company during theyear, I would fail in my duties if I were not tomention Crompton Greaves’impressivegrowth in revenues, profits and profitability asa stand-alone entity.
Your Company’s stand-alone salesincreased by 27 per cent in FY2006 to Rs.27.39billion — up from a 15.7 per cent growth in theprevious year. EBITDA grew by nearly 40 percent to Rs.2.65 billion. PAT rose by 42 per centto Rs.1.63 billion. RONW stood at 30.4 per cent.ROCE at 27.7 per cent.
Each of the three businesses of CromptonGreaves as a stand-alone entity — PowerSystems, Industrial Systems and ConsumerProducts — performed excellently in FY2006.The Power Systems business in India grew by38 per cent to Rs.12.17 billion; ConsumerProducts, the second largest business of yourCompany, increased by 22 per cent to Rs.8.17billion; and Industrial Systems grew by over 20per cent to Rs.6.86 billion. It is significant tonote that in each segment, your Company’sbusiness grew significantly faster than theindustry, and resulted in Crompton Greavesachieving even greater market shares.
It was, therefore, a case of firing on allcylinders — of growing the businesses andprofitability in India, of integrating Pauwels,and of rapidly increasing the profitability of arecently acquired multi-locationalInternational company.
FY2006, then, has been a successful year,and the management deserves kudos.However, as far as I am concerned, thesereflect the first few stepping stones toCrompton Greaves becoming an even moresignificant global company.
C R O M P TO N G R E AV E S L I M I T E D 7
For any Indian companywith strong internalaccruals, purchasing anInternational corporationis no longer aninsurmountable or even adifficult task. Integratingit rapidly and seamlesslyto generate superiorshareholder value post-acquisition is analtogether differentchallenge.
With Pauwels in its fold, the task of thePower Systems business of your Company is torapidly transform itself into becoming aknowledge-driven, intellectual propertybased complete power solutions provider.This requires Crompton Greaves to developthe capability to design, erect and servicevarious types of power transmission anddistribution systems, backed up by a completeportfolio of equipment and instrumentation. Itwill require creating integrated R&D, design,manufacturing and marketing teams thatutilise a seamless and flexible global deliverymodel to service projects and orders from anypart of the world. It will need hiring keypersonnel; pursuing appropriate inorganicgrowth opportunities; and aligning everyoneto the dynamic vision of the business.
Simultaneously, the Company will need tobuild on its profitable and fast growingIndustrial Systems business to become thepreferred supplier in all it product segments. Itwill also have to leverage its strong brandequity and distribution network to create aneven more commanding presence inConsumer Products such as fans, lights andluminaires, pumps and other electricalappliances.
Crompton Greaves will have to generatehigher growth and greater profits in all threebusinesses not only because it hascompetitive strengths in each, but alsobecause such a portfolio will optimise the mixof revenue growth, profitability, return oncapital employed and cash generation.
Your Company’s journey to becoming atruly global corporation has just begun. Thisexciting transformational voyage will require aDNA change in Crompton Greaves: in itsspeed at doing business; its response to globalcustomers; its ability to learn and assimilatebest practices; and in its success in creating atruly international work force. And, in theprocess, deliver greater revenue andprofitability.
These aren’t easy tasks. However, given itsconsistent track record since FY2002, I amconfident of this young, rejuvenated 69-yearold company meeting and surmounting thesechallenges.
With the dedication of its employees andyour support and good wishes, it surely will.
Yours sincerely,
Gautam ThaparChairman
A N N UA L R E P O R T 2 0 0 5 - 0 68
This excitingtransformational voyagewill require a DNA changein Crompton Greaves: inits speed at doingbusiness; its response toglobal customers; itsability to learn andassimilate best practices;and in its success increating a trulyinternational work force
C R O M P TO N G R E AV E S L I M I T E D 9
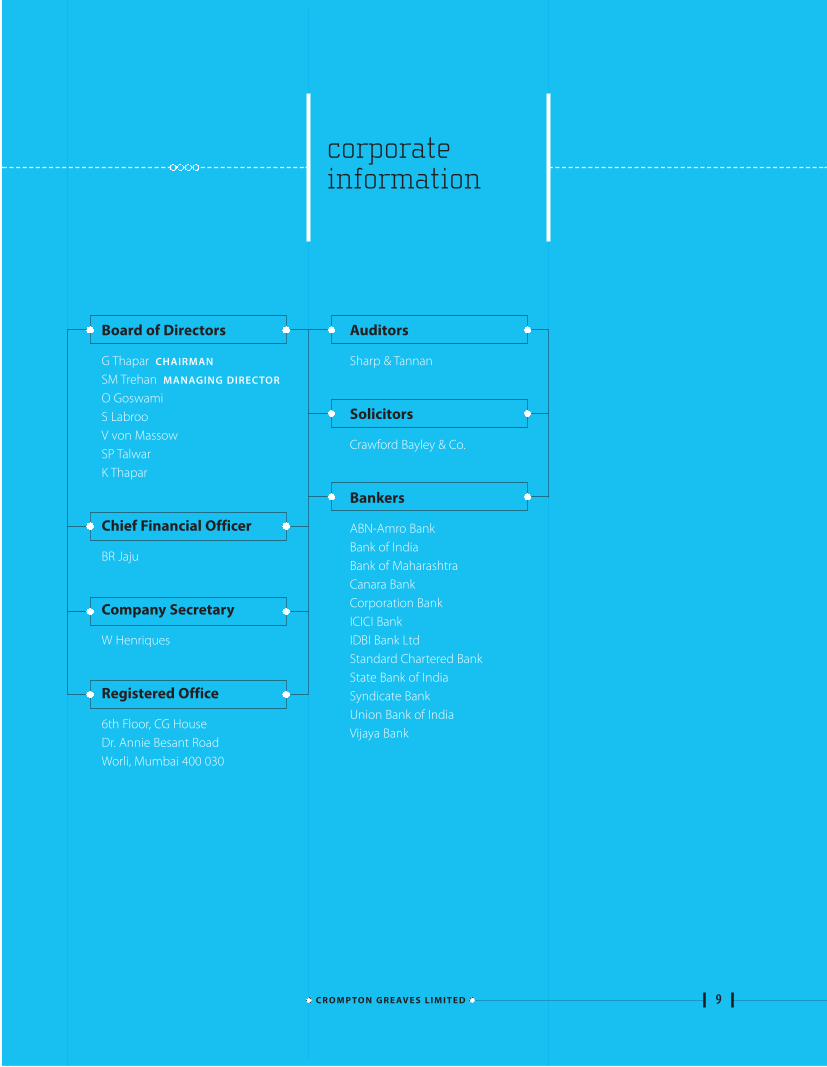
Board of Directors
G Thapar CHAIRMAN
SM Trehan MANAGING DIRECTOR
O GoswamiS LabrooV von MassowSP TalwarK Thapar
Chief Financial Officer
BR Jaju
Company Secretary
W Henriques
Registered Office
6th Floor, CG House Dr. Annie Besant Road Worli, Mumbai 400 030
Auditors
Sharp & Tannan
Solicitors
Crawford Bayley & Co.
Bankers
ABN-Amro BankBank of IndiaBank of MaharashtraCanara BankCorporation BankICICI BankIDBI Bank LtdStandard Chartered BankState Bank of IndiaSyndicate BankUnion Bank of IndiaVijaya Bank
corporateinformation
H E ACQ U I S I T I O N O F T H E
PAU W E L S G R O U P I N M AY 2 0 0 5
has transformed the 69-year old CromptonGreaves Limited (‘Crompton Greaves’, ‘CGL’or‘the company’) from being a leading Indianentity to becoming a major global player.
One of the world’s leaders in thetransformers business with facilities inBelgium, Ireland, Canada, the US andIndonesia, Pauwel’s plants produce over30,000 transformers each year. Well over600,000 such transformers operate in theworld today. Its annualised turnover exceeds€338 million (equivalent to Rs.18,286 million).With rapid integration of operations andbusiness processes between Pauwels andCrompton Greaves, the synergies unleashedby this acquisition have already begun tocatapult CGL to a dominant position in theworld market.
THE JOURNEY SO FARIt has been a significant, almost revolutionary,transformational journey for CromptonGreaves. Corporate analysts and long-termshareholders will recall how, despitemanufacturing quality products, the companyposted losses in FY2000 and FY2001. Thatshock ushered in a new top managementteam and started the process of rapid change.
Between FY2001 and today, there havebeen three distinct phases of transformation— each driven by a clear objective. It is usefulto give a brief story of this process of change, ifonly to emphasise that the today’s globalstatus of Crompton Greaves is an outcome ofdeliberate design, and not of chance.
For the first three years, the overriding goalwas to turnaround the company’s profitabilityby achieving operational excellence. This
involved continuous reduction in workingcapital, borrowings and interest cost;divestment from non-core businesses; closingdown of non-viable units and relocation ofolder units from high cost centres such asMumbai; introducing best-in-class processesand monitoring systems to rapidly raiseproductivity and reduce waste; bringing in SixSigma at the shop floor and then across otherdepartments; using E-sourcing to cut downraw material cost; putting in place a modernERP system under the SAP platform; andseveral others. Most of all, the key task was toget the company’s employees to appreciatethe absolute necessity to rapidly change theirways of doing business.
In a span of three years, these initiatives hadcomprehensively spread across CromptonGreaves with operational excellencebecoming a part of the company’s DNA. Theresults improved. By FY2004, net sales hadrisen by 36 per cent over FY2001 to Rs.17,113million; EBITDA had increased from (-) Rs.436million to Rs.1,846 million; borrowings hadbeen reduced by 47 per cent at Rs.3,337million; and PAT had grown from (-) Rs.732million to Rs.708 million. It was now time tomove to a higher gear.
The second phase, which began aroundFY2003 and intensified thereafter, stressed ongrowth. Operational excellence wasnecessary, but not sufficient. It had to besupplemented by rapid double-digit growthof the company’s businesses. The leitmotif ofthis stage of transformation was growth,cultural change and securing a larger globalfootprint through acquisitions.
Execution of this vision led to the top lineshowing a compound annual growth rate of16.6 per cent between FY2003 and FY2006.
A N N UA L R E P O R T 2 0 0 5 - 0 610
managementdiscussion &analysis
T
Stand-alone net sales crossed the Rs.27 billionmark. Continuing improvements inoperational efficiencies ensured even fastergrowth of EBITDA and PAT. Crompton Greaves’EBITDA margin grew to 10.5 per cent; returnon capital employed steadily increased toalmost 28 per cent; and return on net worthcrossed 30 per cent.
But that was not all. There was a clear movetowards meritocracy, measurability, resultorientation and succession planning in all thecompany’s businesses. To further focus onsecuring superior shareholder returns,Crompton Greaves initiated the process ofmeasuring Economic Value Added (EVA®).There was a concerted impetus on innovation,R&D and creating intellectual properties. Thecompany formally enunciated its Values,Purpose and Mission. It realised that growthhas to be accompanied by wider corporatesocial responsibility. And it began to activelyscout for a large international acquisition. Thatoutcome was Pauwels.
Today, Crompton Greaves is moving on tothe third phase of its transformation. Thatinvolves rapidly completing the process ofintegrating the Pauwels’operations and thenbuilding on synergies to achieve globalleadership. The goal is to become a worldleader in the transmission and distributionbusiness; to attain leadership in most of Asia-Pacific in motors and drives; and to be theleader among SAARC nations in consumerelectrical products. This third chapter intransformation story has just begun.
THE COMPANY’S PERFORMANCE:A BRIEF RESUMÉ Before moving on to Crompton Greaves’different businesses, it is useful to give asnapshot of the company’s results for FY2006.
C R O M P TO N G R E AV E S L I M I T E D 11
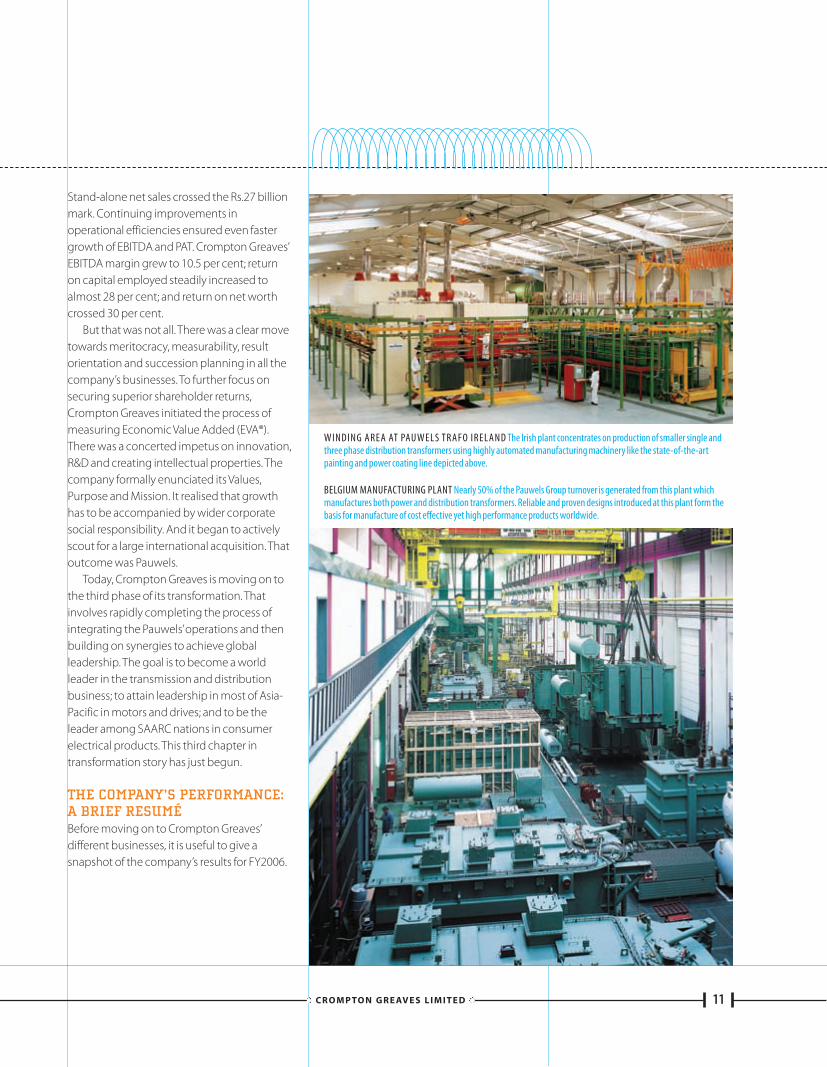
WINDING AREA AT PAUWELS TR AFO IRELAND The Irish plant concentrates on production of smaller single andthree phase distribution transformers using highly automated manufacturing machinery like the state-of-the-artpainting and power coating line depicted above.
BELGIUM MANUFACTURING PLANT Nearly 50% of the Pauwels Group turnover is generated from this plant whichmanufactures both power and distribution transformers. Reliable and proven designs introduced at this plant form thebasis for manufacture of cost effective yet high performance products worldwide.
Consolidated Results–• After taking into account the results of
Pauwels (from 13 May 2005, when theacquisition was concluded),consolidated operating revenue forFY2006 doubled to Rs.43,463 million.
–• Pauwels contributed to 36.8 per cent ofthe company’s consolidated revenue forFY2006. This is expected to grow toabove 40 per cent in the near future.
–• Earnings before interest, depreciation,taxes and amortisation (EBITDA) doubledto Rs.3,895 million, or 9.4 per cent of netsales.
–• Profit before taxes (PBT) grew by 116 percent to Rs.2,773 million.
–• Profit after taxes (PAT) increased by 98per cent to Rs.2,320 million.
–• Return on capital employed (ROCE) was25.7 per cent.
–• Return on net worth (RONW) stood at29.5 per cent.
THE PAUWELS ACQUISITION ANDINTEGRATIONA company globally renowned for itsexpertise, manufacturing quality andservicing of transformers with a powerfulbrand equity, the Pauwels Group was goingthrough a period of financial distress when themanagement of Crompton Greaves andPauwels sought each other out to structure amutually beneficial alliance. There weresignificant complementarities across the twocompanies. Pauwels’transformer range wasup to 525 kV, while Crompton Greaves’was upto 400 kV. Pauwels was also very strong in themanufacture of 36 kV single-phasedistribution transformers that are in highdemand across the developing world; this wasan area where Crompton Greaves needed tostrengthen its position. Pauwels also had thetechnological prowess and a strong marketpresence in very compact transformers thatare ideal for modern windmills — a sector that
is being actively supported by nationalgovernments, and growing rapidlythroughout the globe. In addition, Pauwelshad specialised skills in building turnkeysubstation projects up to 500 kV, and inproviding mobile substations andtransformers that can be rapidly integratedinto power networks and be re-used atdifferent locations. Most significantly, Pauwelshad an excellent list of satisfied global clients.On Crompton Greaves’part, besidestransformers, it also had a strong presence inswitchgear and circuit breakers, which form anintegral part of any electric sub-station. Andafter years of practising operationalexcellence, it had the managerial bandwidthand confidence to re-engineer andturnaround Pauwels towards greaterprofitability.
Today’s power sector customers choosevendors based on their total solutionproviding capabilities. They look for one-stopshops that can supply a portfolio of productsunder one roof — power and distributiontransformers, medium and high voltageswitchgear, circuit breakers, power qualityproducts, instrumentation and systemsdesign, all provided on a turnkey basis andbacked up by after-sales service. The PowerSystems product portfolio of Pauwels andCrompton Greaves spanned the entire rangeof equipment — which made the acquisitionan even more attractive proposition.
Having concluded the acquisition on 13May 2005, the task of the management ofPauwels and Crompton Greaves was tointegrate businesses and processes as quicklyas possible. Key Pauwels employees had to beretained, nurtured and given the space toperform. Key customers needed to be assuredand retained. Employees across vastly differentcultures needed to develop confidence ineach other. The financial and MIS architecturehad to be made uniform across all facilities ofPauwels to align with Crompton Greaves.Greater performance-related accountabilityhad to be put in place. Best practices of each
A N N UA L R E P O R T 2 0 0 5 - 0 612
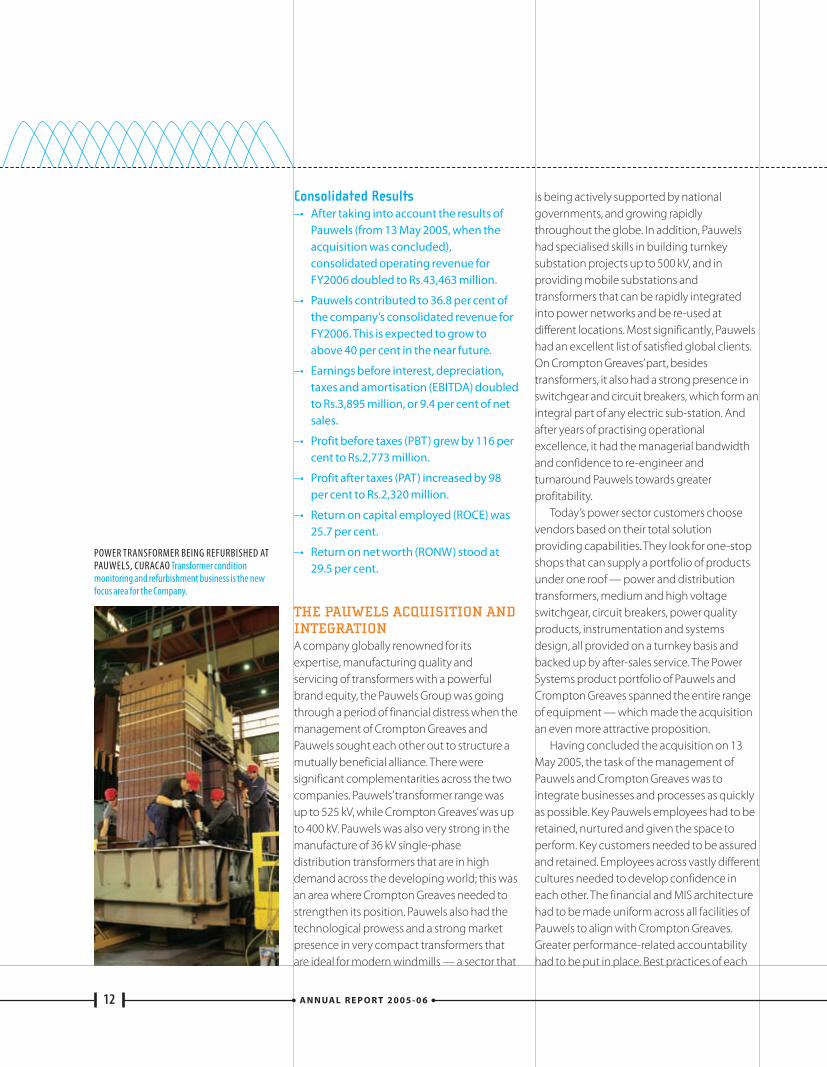
POWER TRANSFORMER BEING REFURBISHED ATPAUWELS, CURACAO Transformer conditionmonitoring and refurbishment business is the newfocus area for the Company.
needed to be incorporated in the other. Mostimportantly, the Power Systems business hadto restructure its way of thinking from runningplants in 10 different locations — five ofPauwels’and five of Crompton Greaves’— tobecoming a single, seamless global operation.And all of it had to be done in the shortestpossible time.
Thanks to a common commitment tointegration and unremitting efforts of themanagement of both Pauwels and CromptonGreaves, much has been completed. Whatremains will be implemented fully during thecourse of FY2007.
The benefits of synergy reflect in Pauwels’results for 13 May 2005 to 31 March 2006.
Pauwels’ Achievements, 13 May 2005to 31 March 2006: Key Highlights*–• Gross sales up from €244 million in 2004
(Jan to Dec) to €296 million — anincrease of 21 per cent in a period of lessthan 11 months, despite adopting morestringent revenue recognition norms,post-acquisition.
–• There has been a 64 per cent growth inorders as on 31 March 2006 compared toDecember 2004.
–• Pauwels’EBIT has risen from €3.2 millionin 2004 to €13.2 million.
–• ROCE has grown from 4.1 per cent in2004 to 20.3 per cent (annualised).
–• RONW has grown from a negative returnto 25.6 per cent (annualised).
* As per Belgium GAAP
OUR BUSINESSES: MARKET ANDPERFORMANCEThe businesses of Crompton Greaves areorganised into three Strategic Business Units(or SBUs):
–• Power Systems, which includestransformers, switchgear, power qualityequipment as well as engineeringprojects.
–• Industrial Systems, comprising motors& alternators, stampings, railwaytransportation and signalling products.
–• Consumer Products, which constitutefans, lighting & luminaires, domesticelectrical appliances and pumps.
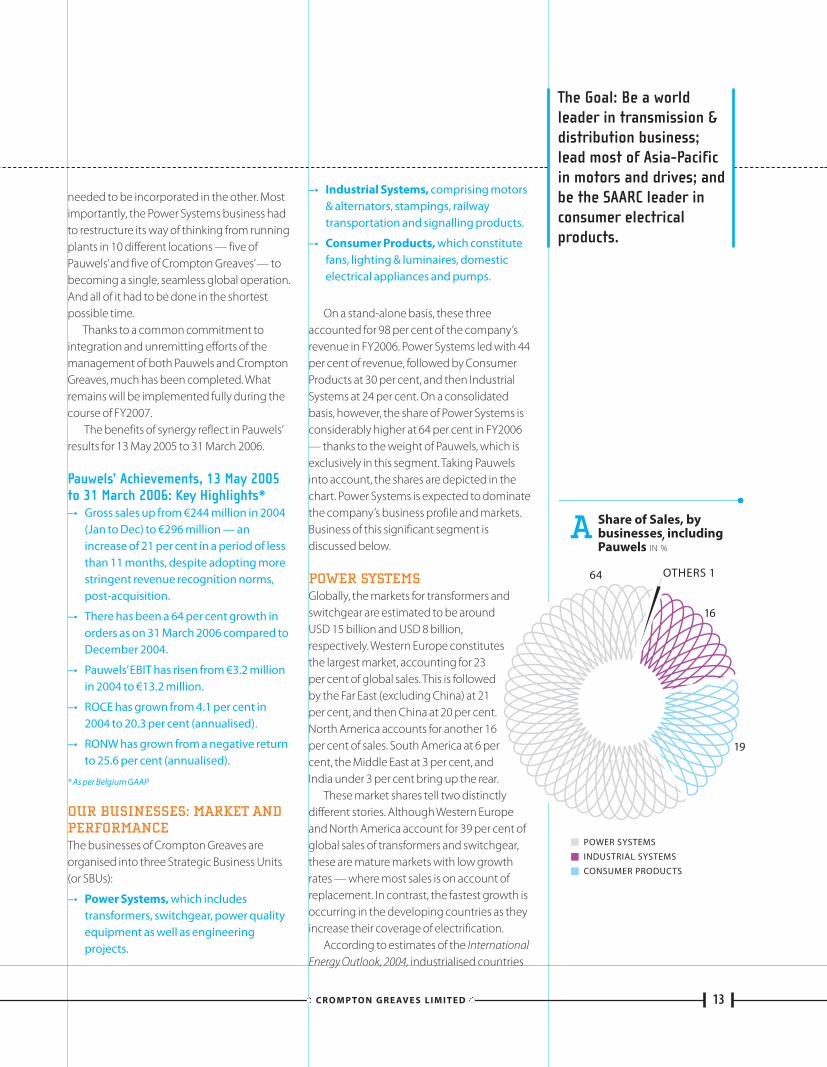
On a stand-alone basis, these threeaccounted for 98 per cent of the company’srevenue in FY2006. Power Systems led with 44per cent of revenue, followed by ConsumerProducts at 30 per cent, and then IndustrialSystems at 24 per cent. On a consolidatedbasis, however, the share of Power Systems isconsiderably higher at 64 per cent in FY2006— thanks to the weight of Pauwels, which isexclusively in this segment. Taking Pauwelsinto account, the shares are depicted in thechart. Power Systems is expected to dominatethe company’s business profile and markets.Business of this significant segment isdiscussed below.
POWER SYSTEMSGlobally, the markets for transformers andswitchgear are estimated to be aroundUSD 15 billion and USD 8 billion,respectively. Western Europe constitutesthe largest market, accounting for 23per cent of global sales. This is followedby the Far East (excluding China) at 21per cent, and then China at 20 per cent.North America accounts for another 16per cent of sales. South America at 6 percent, the Middle East at 3 per cent, andIndia under 3 per cent bring up the rear.
These market shares tell two distinctlydifferent stories. Although Western Europeand North America account for 39 per cent ofglobal sales of transformers and switchgear,these are mature markets with low growthrates — where most sales is on account ofreplacement. In contrast, the fastest growth isoccurring in the developing countries as theyincrease their coverage of electrification.
According to estimates of the InternationalEnergy Outlook, 2004, industrialised countries
The Goal: Be a worldleader in transmission &distribution business;lead most of Asia-Pacificin motors and drives; andbe the SAARC leader inconsumer electricalproducts.
C R O M P TO N G R E AV E S L I M I T E D 13
,
are likely to register a growth of electricityconsumption of 1.6 per cent per year duringthe period 2001-2015; transitional economiesare expected to grow at 2.2 per cent; whiledeveloping countries are forecasted to growat an average of 3.6 per cent — with Chinaleading at 4.6 per cent, followed by India at 3.5per cent.
Except China, the combined business ofCrompton Greaves and Pauwels has asignificant presence in all these regions.Therefore, the company is potentially wellpoised to take advantage of market size as wellas growth in the coming years.
With the Pauwels portfolio, CromptonGreaves now has virtually the entire suite ofproducts that can give it a larger footprint inthe domestic and global Transmission andDistribution equipment and solutionsmarkets. Moreover, Pauwels gives thecompany access to the highly profitabledomain of power services so as to become afull solutions provider with all such end-to-end solutions being backed up by supply ofequipment and services.
Given the size of this business and its highgrowth potential throughout the world, thecompany has created an integrated businessgroup that combines the strength of Pauwelsand Crompton Greaves under unifiedmanagerial leadership. The global marketshave been segmented in terms of Americas;Europe, Middle East and Africa; India andSouth Asia, and South East Asia and Australia— with Pauwels and Crompton Greavesoperating in markets according to theircompetitive strengths and brand presence.
In FY2006, an integrated global request forquotations (RFQ) management system wasinstalled on the company’s website, with theobjective that no power business enquiryfrom anywhere in the world should gounattended. This central pooling of orders hasnot only enhanced margin effectiveness buthas also allowed the company to increase itssales.
Integrating the Power Systems business
has led to many other advantages. CromptonGreaves has adopted several best practices ofPauwels. In the very first year of integration, 17teams from Crompton Greaves and Pauwelshave been assigned to achieve clearlyspecified improvements in quality,manufacturing and design. A substantialnumber of these projects was completed by31 March 2006.
Going forward, the company hopes toaccomplish significantly greater gains fromthe integration. This requires morecomprehensive mutual adoption of bestbusiness practices, greater cross-fertilisation ofideas, more secondment of personnel,systematically identifying and placing bestpeople in the most globally appropriate slots,integrating various design software, and,wherever possible, making full use of India’spersonnel cost advantages while leveragingPauwels’repository of international customers.
The stand-alone performance of CromptonGreaves’Power Systems business is discussedbelow. As mentioned earlier, this comprises:
–• The Transformer Division, with facilitiesin Kanjur (Mumbai), Malanpur (in Bhind,Madhya Pradesh), and Mandideep (inMadhya Pradesh).
–• The Switchgear Division, located atAmbad (in Nashik, Maharashtra) and thePower Quality Division, located at Waluj(in Aurangabad, Maharashtra).
–• The Engineering Projects Division, atGurgaon (Haryana).
Table 1 gives the financial performance ofthe Power Systems business, without taking
A N N UA L R E P O R T 2 0 0 5 - 0 614
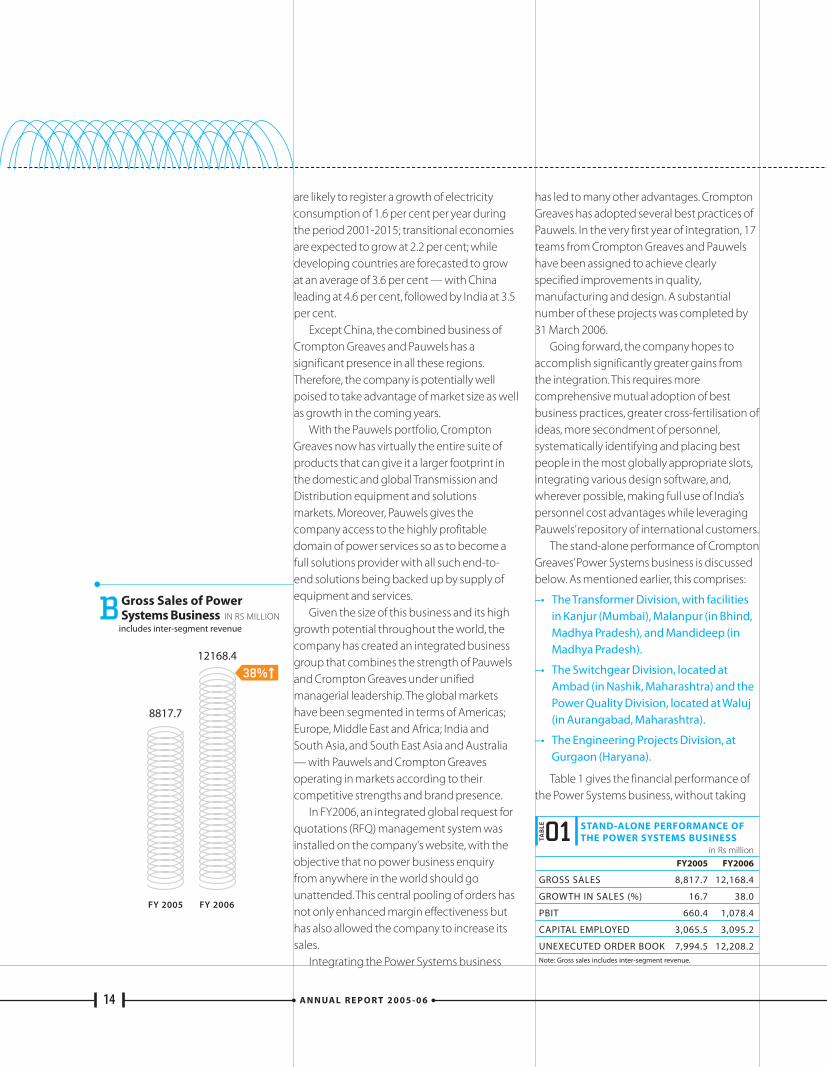
01 STAND-ALONE PERFORMANCE OFTHE POWER SYSTEMS BUSINESS
in Rs millionFY2005 FY2006
GROSS SALES 8,817.7 12,168.4
GROWTH IN SALES (%) 16.7 38.0
PBIT 660.4 1,078.4
CAPITAL EMPLOYED 3,065.5 3,095.2
UNEXECUTED ORDER BOOK 7,994.5 12,208.2Note: Gross sales includes inter-segment revenue.
TAB
LE
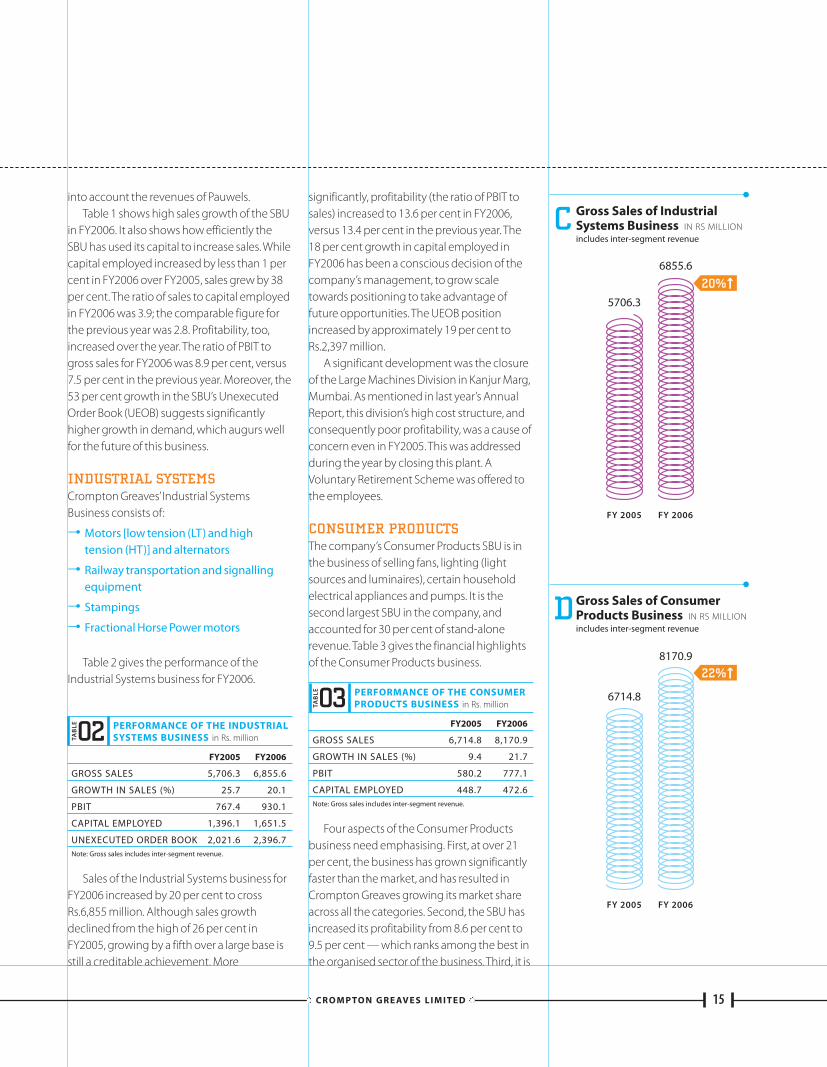
into account the revenues of Pauwels.Table 1 shows high sales growth of the SBU
in FY2006. It also shows how efficiently theSBU has used its capital to increase sales. Whilecapital employed increased by less than 1 percent in FY2006 over FY2005, sales grew by 38per cent. The ratio of sales to capital employedin FY2006 was 3.9; the comparable figure forthe previous year was 2.8. Profitability, too,increased over the year. The ratio of PBIT togross sales for FY2006 was 8.9 per cent, versus7.5 per cent in the previous year. Moreover, the53 per cent growth in the SBU’s UnexecutedOrder Book (UEOB) suggests significantlyhigher growth in demand, which augurs wellfor the future of this business.
INDUSTRIAL SYSTEMSCrompton Greaves’Industrial SystemsBusiness consists of:
–• Motors [low tension (LT) and hightension (HT)] and alternators
–• Railway transportation and signallingequipment
–• Stampings
–• Fractional Horse Power motors
Table 2 gives the performance of theIndustrial Systems business for FY2006.
Sales of the Industrial Systems business forFY2006 increased by 20 per cent to crossRs.6,855 million. Although sales growthdeclined from the high of 26 per cent inFY2005, growing by a fifth over a large base isstill a creditable achievement. More
significantly, profitability (the ratio of PBIT tosales) increased to 13.6 per cent in FY2006,versus 13.4 per cent in the previous year. The18 per cent growth in capital employed inFY2006 has been a conscious decision of thecompany’s management, to grow scaletowards positioning to take advantage offuture opportunities. The UEOB positionincreased by approximately 19 per cent toRs.2,397 million.
A significant development was the closureof the Large Machines Division in Kanjur Marg,Mumbai. As mentioned in last year’s AnnualReport, this division’s high cost structure, andconsequently poor profitability, was a cause ofconcern even in FY2005. This was addressedduring the year by closing this plant. AVoluntary Retirement Scheme was offered tothe employees.
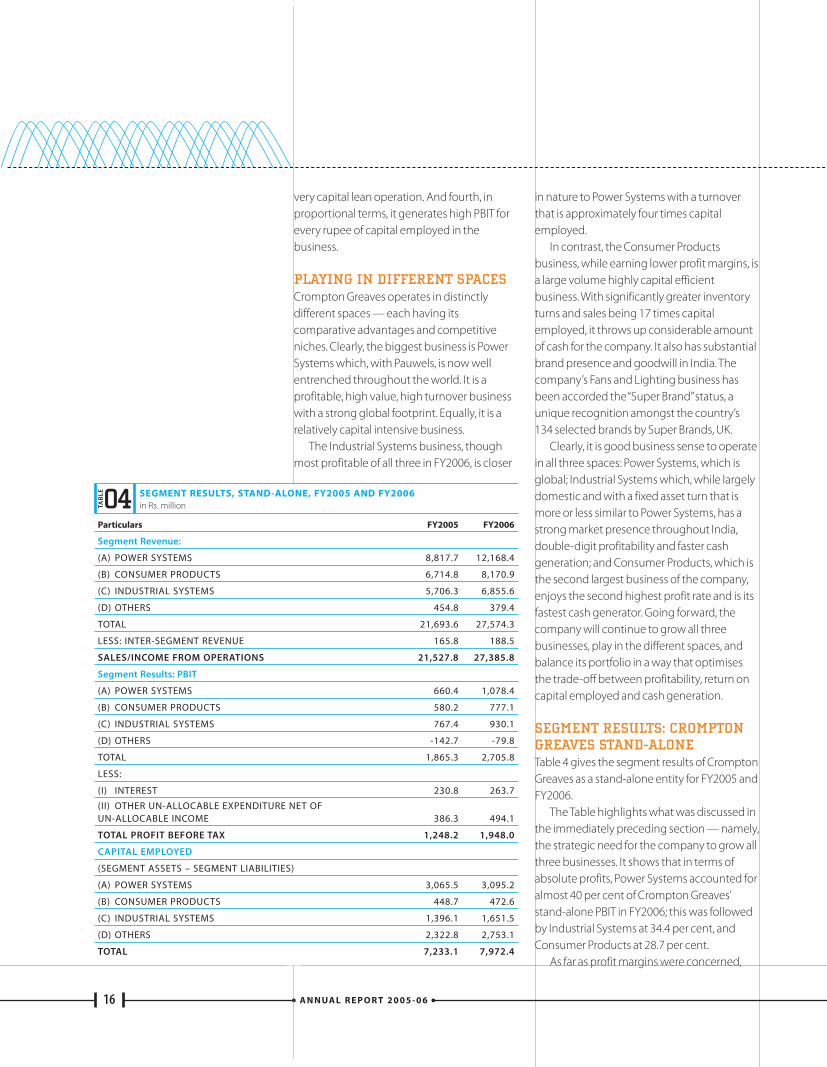
CONSUMER PRODUCTSThe company’s Consumer Products SBU is inthe business of selling fans, lighting (lightsources and luminaires), certain householdelectrical appliances and pumps. It is thesecond largest SBU in the company, andaccounted for 30 per cent of stand-alonerevenue. Table 3 gives the financial highlightsof the Consumer Products business.
Four aspects of the Consumer Productsbusiness need emphasising. First, at over 21per cent, the business has grown significantlyfaster than the market, and has resulted inCrompton Greaves growing its market shareacross all the categories. Second, the SBU hasincreased its profitability from 8.6 per cent to9.5 per cent — which ranks among the best inthe organised sector of the business. Third, it is
C R O M P TO N G R E AV E S L I M I T E D 15
02 PERFORMANCE OF THE INDUSTRIALSYSTEMS BUSINESS in Rs. million
FY2005 FY2006
GROSS SALES 5,706.3 6,855.6
GROWTH IN SALES (%) 25.7 20.1
PBIT 767.4 930.1
CAPITAL EMPLOYED 1,396.1 1,651.5
UNEXECUTED ORDER BOOK 2,021.6 2,396.7Note: Gross sales includes inter-segment revenue.
TAB
LE
03 PERFORMANCE OF THE CONSUMERPRODUCTS BUSINESS in Rs. million
FY2005 FY2006
GROSS SALES 6,714.8 8,170.9
GROWTH IN SALES (%) 9.4 21.7
PBIT 580.2 777.1
CAPITAL EMPLOYED 448.7 472.6Note: Gross sales includes inter-segment revenue.
TAB
LE
very capital lean operation. And fourth, inproportional terms, it generates high PBIT forevery rupee of capital employed in thebusiness.
PLAYING IN DIFFERENT SPACESCrompton Greaves operates in distinctlydifferent spaces — each having itscomparative advantages and competitiveniches. Clearly, the biggest business is PowerSystems which, with Pauwels, is now wellentrenched throughout the world. It is aprofitable, high value, high turnover businesswith a strong global footprint. Equally, it is arelatively capital intensive business.
The Industrial Systems business, thoughmost profitable of all three in FY2006, is closer
in nature to Power Systems with a turnoverthat is approximately four times capitalemployed.
In contrast, the Consumer Productsbusiness, while earning lower profit margins, isa large volume highly capital efficientbusiness. With significantly greater inventoryturns and sales being 17 times capitalemployed, it throws up considerable amountof cash for the company. It also has substantialbrand presence and goodwill in India. Thecompany’s Fans and Lighting business hasbeen accorded the “Super Brand”status, aunique recognition amongst the country’s134 selected brands by Super Brands, UK.
Clearly, it is good business sense to operatein all three spaces: Power Systems, which isglobal; Industrial Systems which, while largelydomestic and with a fixed asset turn that ismore or less similar to Power Systems, has astrong market presence throughout India,double-digit profitability and faster cashgeneration; and Consumer Products, which isthe second largest business of the company,enjoys the second highest profit rate and is itsfastest cash generator. Going forward, thecompany will continue to grow all threebusinesses, play in the different spaces, andbalance its portfolio in a way that optimisesthe trade-off between profitability, return oncapital employed and cash generation.
SEGMENT RESULTS: CROMPTONGREAVES STAND-ALONETable 4 gives the segment results of CromptonGreaves as a stand-alone entity for FY2005 andFY2006.
The Table highlights what was discussed inthe immediately preceding section — namely,the strategic need for the company to grow allthree businesses. It shows that in terms ofabsolute profits, Power Systems accounted foralmost 40 per cent of Crompton Greaves’stand-alone PBIT in FY2006; this was followedby Industrial Systems at 34.4 per cent, andConsumer Products at 28.7 per cent.
As far as profit margins were concerned,
A N N UA L R E P O R T 2 0 0 5 - 0 616
04 SEGMENT RESULTS, STAND-ALONE, FY2005 AND FY2006in Rs. million
Particulars FY2005 FY2006
Segment Revenue:
(A) POWER SYSTEMS 8,817.7 12,168.4
(B) CONSUMER PRODUCTS 6,714.8 8,170.9
(C) INDUSTRIAL SYSTEMS 5,706.3 6,855.6
(D) OTHERS 454.8 379.4
TOTAL 21,693.6 27,574.3
LESS: INTER-SEGMENT REVENUE 165.8 188.5
SALES/INCOME FROM OPERATIONS 21,527.8 27,385.8
Segment Results: PBIT
(A) POWER SYSTEMS 660.4 1,078.4
(B) CONSUMER PRODUCTS 580.2 777.1
(C) INDUSTRIAL SYSTEMS 767.4 930.1
(D) OTHERS -142.7 -79.8
TOTAL 1,865.3 2,705.8
LESS:
(I) INTEREST 230.8 263.7
(II) OTHER UN-ALLOCABLE EXPENDITURE NET OF UN-ALLOCABLE INCOME 386.3 494.1
TOTAL PROFIT BEFORE TAX 1,248.2 1,948.0
CAPITAL EMPLOYED
(SEGMENT ASSETS – SEGMENT LIABILITIES)
(A) POWER SYSTEMS 3,065.5 3,095.2
(B) CONSUMER PRODUCTS 448.7 472.6
(C) INDUSTRIAL SYSTEMS 1,396.1 1,651.5
(D) OTHERS 2,322.8 2,753.1
TOTAL 7,233.1 7,972.4
TAB
LE
Industrial Systems led with a PBIT margin of13.6 per cent of segment revenue for FY2006.This was followed by Consumer Productswhich earned a PBIT margin of 9.5 per cent;and then Power Systems, which achieved amargin of 8.9 per cent.
In terms of sales per rupee of capitalemployed, Consumer Products clearly led,with a ratio of 17.3; followed by IndustrialSystems at 4.2; and then Power Systems at 3.9.
EMPLOYEES — OUR GREATESTCHANGE AGENTSCrompton Greaves has always prided itself inbeing a totally professional company. In itsHuman Resources journey, Crompton Greaveshas consistently experimented with new ideasbased on studies of best practices to attract,retain, nurture and empower its committedpool of employees to remain successful in acompetitive environment. The company’s FiveValues — Performance Excellence, LeadingEdge Knowledge, Nurturance, CustomerOrientation and Intellectual Honesty — reflectits businesses as well as its people philosophy.In FY2006, the Five Values practices wereintegrated into the company’s Unit GradingSystem and Performance ManagementSystems.
With Crompton Greaves becoming aglobal corporation, its senior managementdeliberated the company’s Vision with thetwin purpose of defining a Core Ideology andan Envisioned Future. The former has twocomponents — Core Values and Core Purpose— while the latter consists of the Mission,Energising Goals and a Strategic ActionAgenda. To be finalised shortly, these willbecome the foundation for actions to sustainthe long-term future of the company.
In January 2006, Crompton Greavescompleted its second Employee EngagementSurvey, the first being conducted in October2003. The survey has made managementaware of a new set of expectations, largelyemanating from employee aspirations from asuccessful, prosperous and rapidly growing
C R O M P TO N G R E AV E S L I M I T E D 17
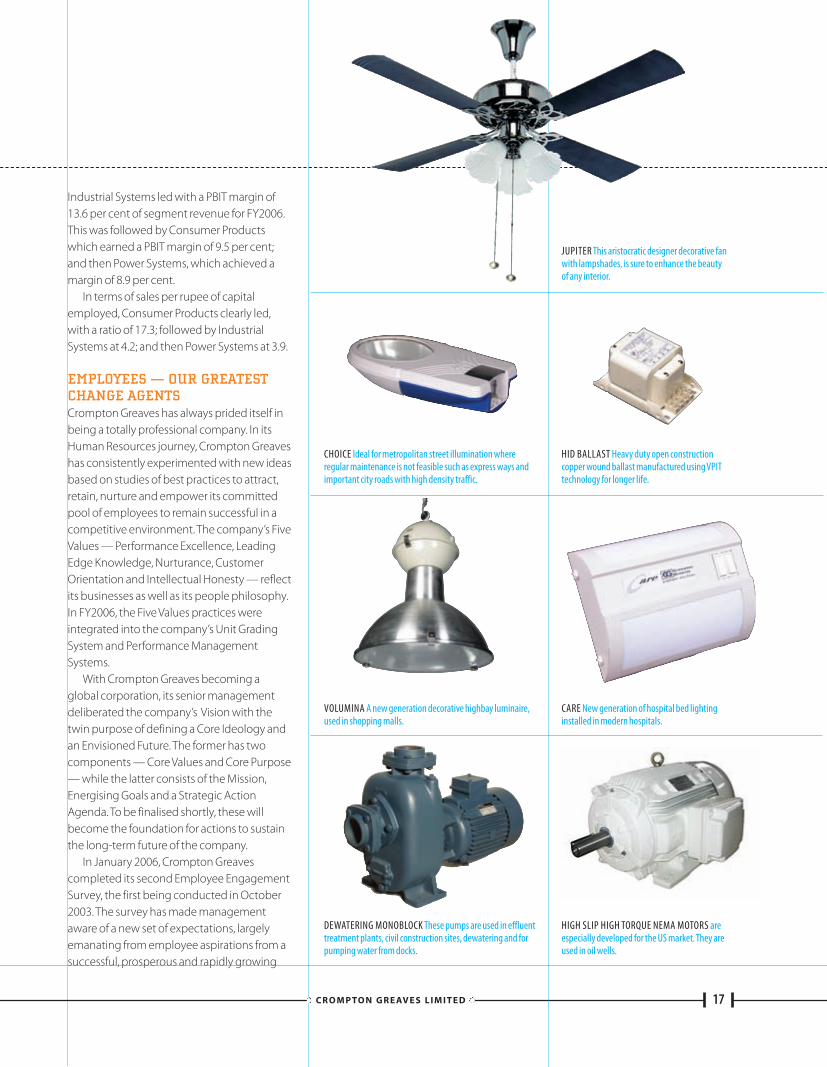
CHOICE Ideal for metropolitan street illumination whereregular maintenance is not feasible such as express ways andimportant city roads with high density traffic.
JUPITER This aristocratic designer decorative fanwith lampshades, is sure to enhance the beautyof any interior.
HID BALLAST Heavy duty open constructioncopper wound ballast manufactured using VPITtechnology for longer life.
VOLUMINA A new generation decorative highbay luminaire,used in shopping malls.
CARE New generation of hospital bed lightinginstalled in modern hospitals.
DEWATERING MONOBLOCK These pumps are used in effluenttreatment plants, civil construction sites, dewatering and forpumping water from docks.
HIGH SLIP HIGH TORQUE NEMA MOTORS areespecially developed for the US market. They areused in oil wells.
company. Senior management is in theprocess of evaluating action plans to addressthe survey results.
Seamlessly touching employees’ lives andfacilitating employee connectivity continue tobe the focus of the company’s e-HR initiatives— which are articulated through its employeeportal, CGHR4U. Several new modules havebeen added to make every employee moreself-sufficient and communicable — so as toincrease decision-making efficiency andsimultaneously reduce the need for physicalinteractions across the company.
The training calendar has been furtherintensified, and new training programmeshave been introduced to equip employeeswith the skills for tomorrow. CromptonGreaves has also increased the number ofsponsored programmes for training atreputed business schools in India and abroadto further strengthen the leadership profile ofsenior executives in niche and high-endmanagement domains.
In FY2006, the company competed, for thefirst time, for the CII HR Excellence Award,2005. It was among the few that received a
Commendation Certificate from CII for “StrongCommitment to HR Excellence”. Moreover,during the year, it facilitated participation byits Units and Divisions in the IndiaManufacturing Excellence Award, 2005. Thecompany’s S6 and Power Quality Division wasbestowed the Gold Award, while itsSwitchgear and Fans & Appliances Divisionwere each honoured with the Silver Award.
RESEARCH AND DEVELOPMENTDuring the year, the R&D Strategy-2010 wascrystallised to align with the company’s GlobalVision, and focuses on creation of platformtechnologies, shrinking product developmentcycle time and enhancing IntellectualProperty Capital of the company. A majorproject to redesign the R&D structure, systems& portfolio has been initiated. Actions in thefive ‘Technology Mission’areas, identified lastyear, are progressing satisfactorily.
The focus for research undertaken at thePauwels locations was on new designconcepts, use of alternate materials, greaterreliability of products and alternative energyapplications. These efforts at Pauwels willfurther reinforce the company’s R&Dmomentum.
During the year, Crompton Greaves wasgranted four patents. Currently, 69 IPRapplications have been filed by the company.The annex to the Directors’Report summarisesthe new products and processes developedby the company during FY2006.
IT INITIATIVESDuring the year, the company invested Rs.70million in IT systems, and undertook thefollowing significant initiatives:–• Disaster recovery A new global disaster
recovery centre has been set up at Chennaiwhich backs up all critical applicationssuch as the group-wise SAP, the humanresource software called CGHR4U, thedealers’portal, Six Sigma, and the like. Thiscentre will ensure business continuity bysaving all the mission critical data of the
A N N UA L R E P O R T 2 0 0 5 - 0 618
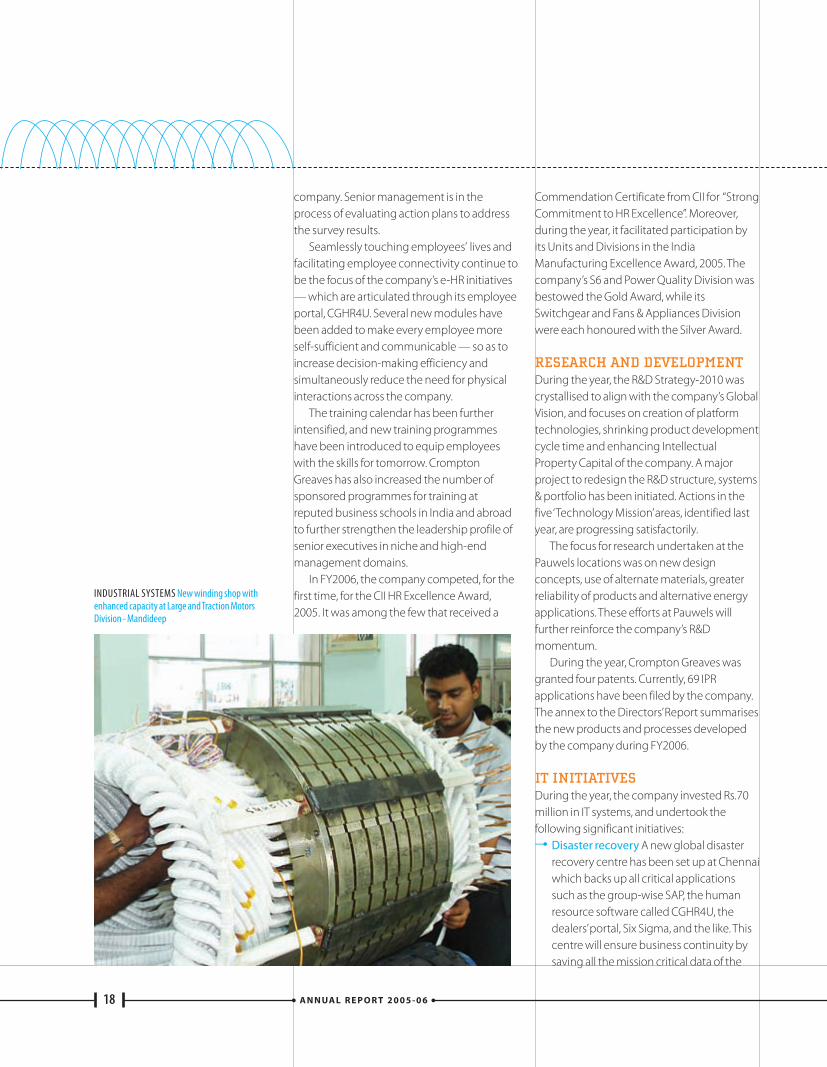
INDUSTRIAL SYSTEMS New winding shop withenhanced capacity at Large and Traction MotorsDivision - Mandideep
company. Crompton Greaves has deviseda well-structured system to enable fastdata recovery at Chennai in the event ofany crisis or breakdown at its Mumbai DataCentre located at Kanjur Marg.
–• New version of SAP The implementationof the upgraded SAP 4.7 has beencompleted throughout all locations ofCrompton Greaves within India. It is now inthe process of being rolled out for alllocations and facilities of Pauwels. ByFY2007, both Crompton Greaves andPauwels will have a unified MIS using thebackbone of real-time SAP 4.7. Thisimplementation of SAP 4.7 also coincidedby migrating all Crompton Greaves datafrom five different servers to a single server.
–• Product Lifecycle Management (PLM) Aninitiative of the Transformer Division, thissoftware solution helps achieve significantreduction in development cycle time. Withthis tool, all Crompton Greaves transformerfacilities will get access to a unified singlesource of data and design — which shouldhelp share design and productionknowledge and reduce customerresponse time.
–• Service Operation ManagementApplication (SOMA) This is a web-basedafter-sales service portal, which has beenimplemented across all the marketingoffices of Crompton Greaves. It is a key toolin improving customer relationship on areal-time basis.
–• E-Commerce Already in operation for thelast year and half, it has benefited from theintroduction of new applications — whichincludes position of the unexecuted orderbooks, despatch reports and facility forordering non-standard motors.
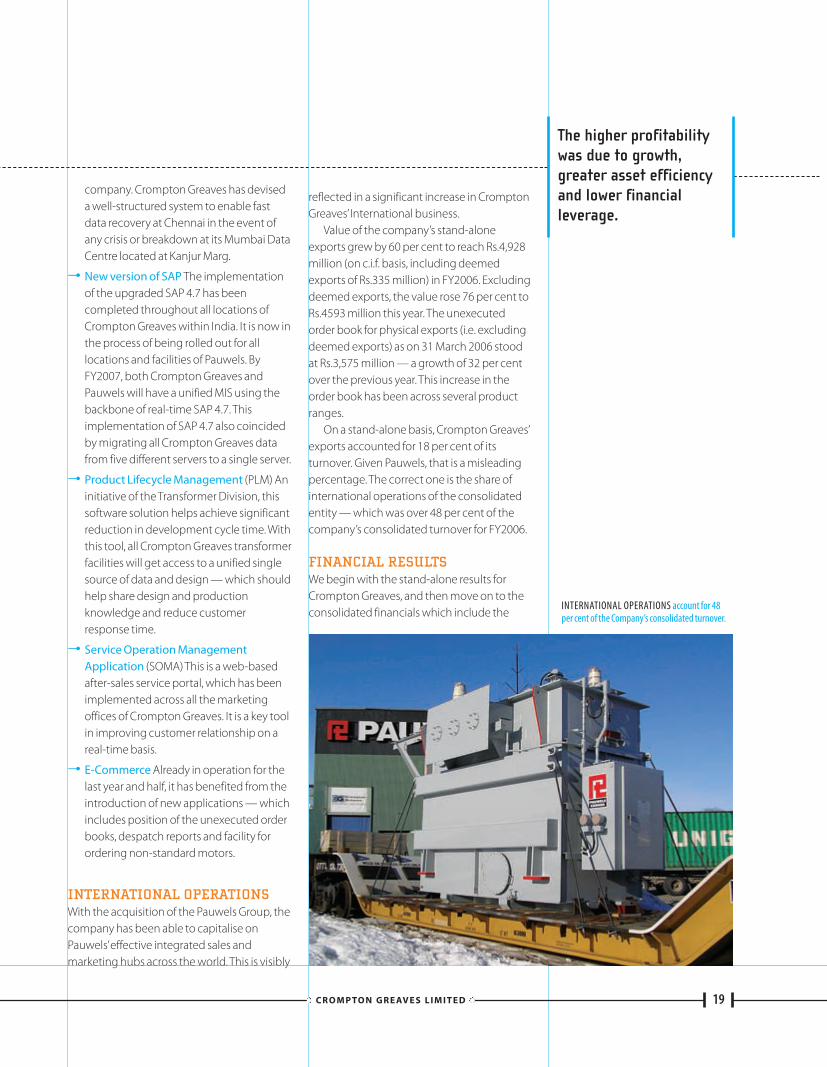
INTERNATIONAL OPERATIONS With the acquisition of the Pauwels Group, thecompany has been able to capitalise onPauwels’effective integrated sales andmarketing hubs across the world. This is visibly
reflected in a significant increase in CromptonGreaves’International business.
Value of the company’s stand-aloneexports grew by 60 per cent to reach Rs.4,928million (on c.i.f. basis, including deemedexports of Rs.335 million) in FY2006. Excludingdeemed exports, the value rose 76 per cent toRs.4593 million this year. The unexecutedorder book for physical exports (i.e. excludingdeemed exports) as on 31 March 2006 stoodat Rs.3,575 million — a growth of 32 per centover the previous year. This increase in theorder book has been across several productranges.
On a stand-alone basis, Crompton Greaves’exports accounted for 18 per cent of itsturnover. Given Pauwels, that is a misleadingpercentage. The correct one is the share ofinternational operations of the consolidatedentity — which was over 48 per cent of thecompany’s consolidated turnover for FY2006.
FINANCIAL RESULTSWe begin with the stand-alone results forCrompton Greaves, and then move on to theconsolidated financials which include the
C R O M P TO N G R E AV E S L I M I T E D 19
The higher profitabilitywas due to growth,greater asset efficiencyand lower financialleverage.
INTERNATIONAL OPERATIONS account for 48per cent of the Company’s consolidated turnover.
20
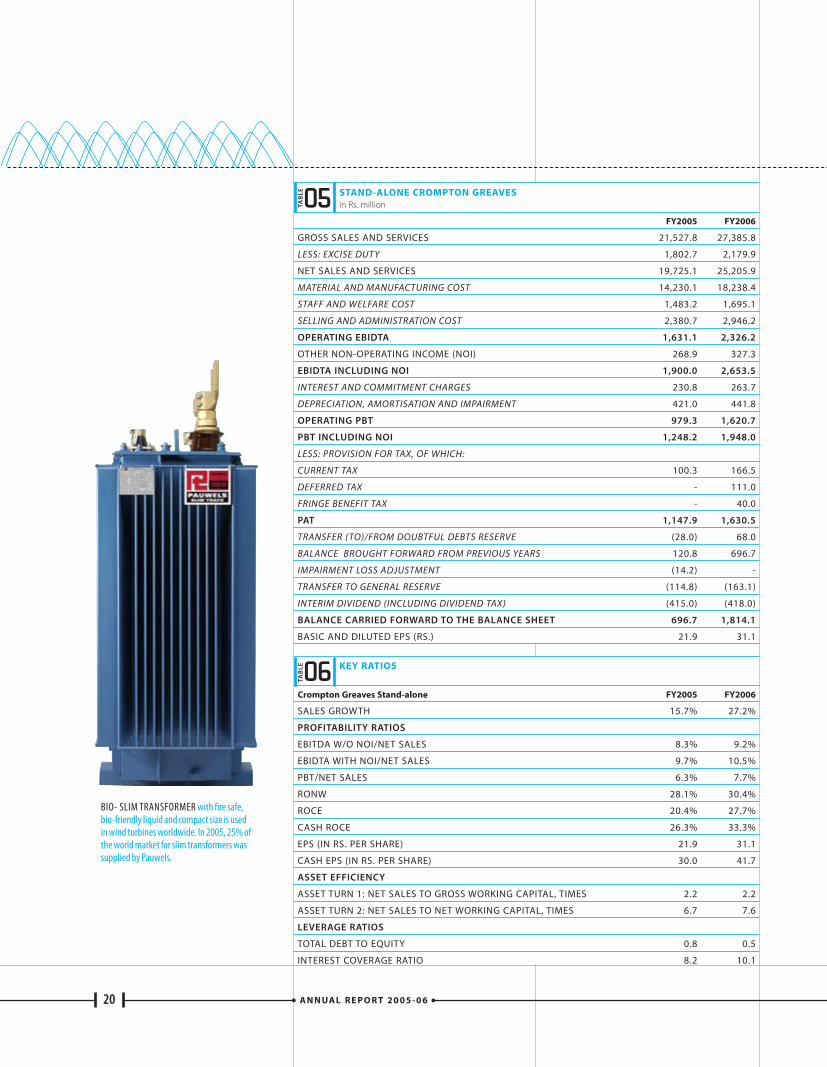
05 STAND-ALONE CROMPTON GREAVESin Rs. million
FY2005 FY2006
GROSS SALES AND SERVICES 21,527.8 27,385.8
LESS: EXCISE DUTY 1,802.7 2,179.9
NET SALES AND SERVICES 19,725.1 25,205.9
MATERIAL AND MANUFACTURING COST 14,230.1 18,238.4
STAFF AND WELFARE COST 1,483.2 1,695.1
SELLING AND ADMINISTRATION COST 2,380.7 2,946.2
OPERATING EBIDTA 1,631.1 2,326.2
OTHER NON-OPERATING INCOME (NOI) 268.9 327.3
EBIDTA INCLUDING NOI 1,900.0 2,653.5
INTEREST AND COMMITMENT CHARGES 230.8 263.7
DEPRECIATION, AMORTISATION AND IMPAIRMENT 421.0 441.8
OPERATING PBT 979.3 1,620.7
PBT INCLUDING NOI 1,248.2 1,948.0
LESS: PROVISION FOR TAX, OF WHICH:
CURRENT TAX 100.3 166.5
DEFERRED TAX - 111.0
FRINGE BENEFIT TAX - 40.0
PAT 1,147.9 1,630.5
TRANSFER ( TO)/FROM DOUBTFUL DEBTS RESERVE (28.0) 68.0
BALANCE BROUGHT FORWARD FROM PREVIOUS YEARS 120.8 696.7
IMPAIRMENT LOSS ADJUSTMENT (14.2) -
TRANSFER TO GENERAL RESERVE (114.8) (163.1)
INTERIM DIVIDEND (INCLUDING DIVIDEND TAX) (415.0) (418.0)
BALANCE CARRIED FORWARD TO THE BALANCE SHEET 696.7 1,814.1
BASIC AND DILUTED EPS (RS.) 21.9 31.1
TAB
LE
06 KEY RATIOS
Crompton Greaves Stand-alone FY2005 FY2006
SALES GROWTH 15.7% 27.2%
PROFITABILITY RATIOS
EBITDA W/O NOI/NET SALES 8.3% 9.2%
EBIDTA WITH NOI/NET SALES 9.7% 10.5%
PBT/NET SALES 6.3% 7.7%
RONW 28.1% 30.4%
ROCE 20.4% 27.7%
CASH ROCE 26.3% 33.3%
EPS (IN RS. PER SHARE) 21.9 31.1
CASH EPS (IN RS. PER SHARE) 30.0 41.7
ASSET EFFICIENCY
ASSET TURN 1: NET SALES TO GROSS WORKING CAPITAL, TIMES 2.2 2.2
ASSET TURN 2: NET SALES TO NET WORKING CAPITAL, TIMES 6.7 7.6
LEVERAGE RATIOS
TOTAL DEBT TO EQUITY 0.8 0.5
INTEREST COVERAGE RATIO 8.2 10.1
A N N UA L R E P O R T 2 0 0 5 - 0 6
TAB
LE
BIO- SLIM TRANSFORMER with fire safe,bio-friendly liquid and compact size is usedin wind turbines worldwide. In 2005, 25% ofthe world market for slim transformers wassupplied by Pauwels.
performance of Pauwels since its acquisitionon 13 May 2005.
Stand-alone ResultsTable 5 gives the stand-alone results forCrompton Greaves for FY2006 and FY2005.Table 6 gives the growth rates, profitabilityratios, capital efficiency ratios and leverageratios for the company on a stand-alone basis.
As the Table shows, on a stand-alone basis,Crompton Greaves’ sales increased by over 27per cent during FY2006. In an environment ofsharply rising raw material and input prices,more remarkable is the company’s profitgrowth. Operating EBIDTA rose by almost 43per cent; PBT by nearly 56 per cent; anddespite a large deferred tax outlay, PATincreased by almost 42 per cent.
Consequently, as Table 6 clearlyunderscores, all profitability ratios moved upduring the year. RONW rose by 230 basispoints to 30.4 per cent; ROCE by 730 basispoints to 27.7 per cent; and EPS increased toRs.31.1.
The higher profitability was due to growth,greater asset efficiency and lower financialleverage. Asset turns (the number of times networking capital has turned in the year)increased from 6.7 times in FY2005 to 7.6times. Leverage ratios also strengthenedsharply: total debt to equity was down to 0.5,from 0.8 in the previous year; and interestcover increased from 8.2 to 10.1.
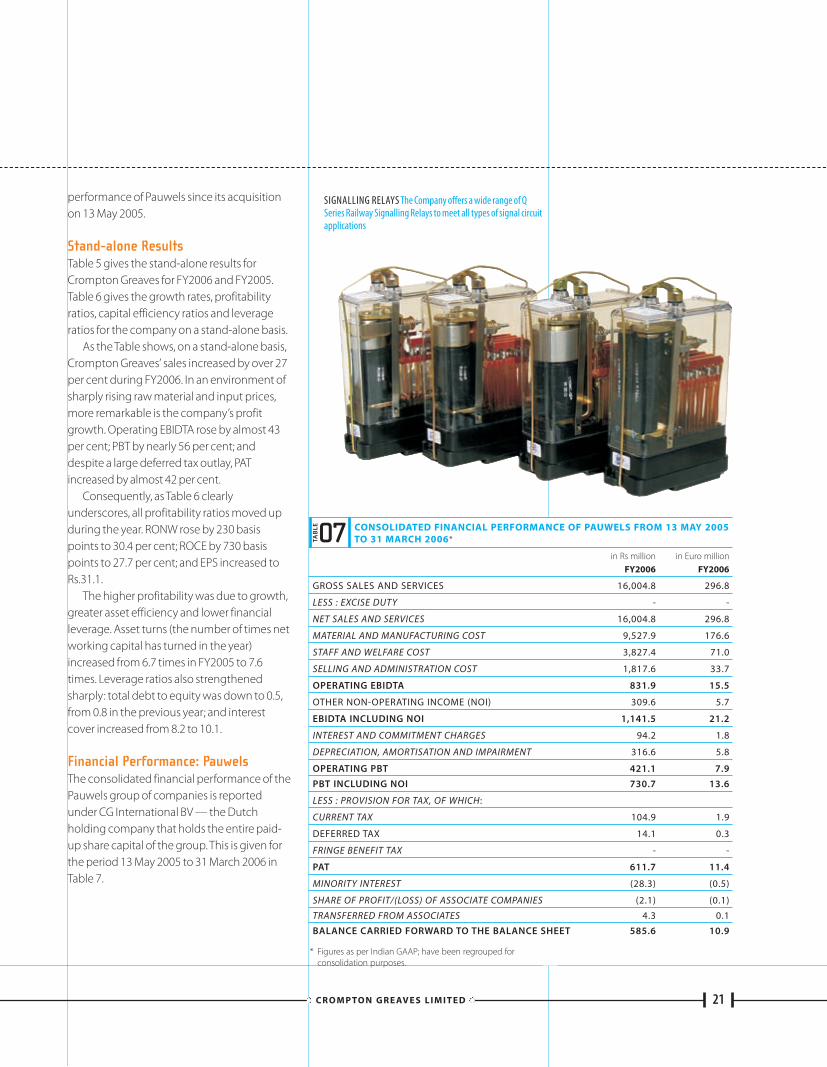
Financial Performance: Pauwels The consolidated financial performance of thePauwels group of companies is reportedunder CG International BV — the Dutchholding company that holds the entire paid-up share capital of the group. This is given forthe period 13 May 2005 to 31 March 2006 inTable 7.
C R O M P TO N G R E AV E S L I M I T E D 21
07 CONSOLIDATED FINANCIAL PERFORMANCE OF PAUWELS FROM 13 MAY 2005TO 31 MARCH 2006*
in Rs million in Euro millionFY2006 FY2006
GROSS SALES AND SERVICES 16,004.8 296.8
LESS : EXCISE DUTY - -
NET SALES AND SERVICES 16,004.8 296.8
MATERIAL AND MANUFACTURING COST 9,527.9 176.6
STAFF AND WELFARE COST 3,827.4 71.0
SELLING AND ADMINISTRATION COST 1,817.6 33.7
OPERATING EBIDTA 831.9 15.5
OTHER NON-OPERATING INCOME (NOI) 309.6 5.7
EBIDTA INCLUDING NOI 1,141.5 21.2
INTEREST AND COMMITMENT CHARGES 94.2 1.8
DEPRECIATION, AMORTISATION AND IMPAIRMENT 316.6 5.8
OPERATING PBT 421.1 7.9
PBT INCLUDING NOI 730.7 13.6
LESS : PROVISION FOR TAX, OF WHICH:
CURRENT TAX 104.9 1.9
DEFERRED TAX 14.1 0.3
FRINGE BENEFIT TAX - -
PAT 611.7 11.4
MINORITY INTEREST (28.3) (0.5)
SHARE OF PROFIT/(LOSS) OF ASSOCIATE COMPANIES (2.1) (0.1)
TRANSFERRED FROM ASSOCIATES 4.3 0.1
BALANCE CARRIED FORWARD TO THE BALANCE SHEET 585.6 10.9
TAB
LE
SIGNALLING RELAYS The Company offers a wide range of QSeries Railway Signalling Relays to meet all types of signal circuitapplications
* Figures as per Indian GAAP; have been regrouped forconsolidation purposes.
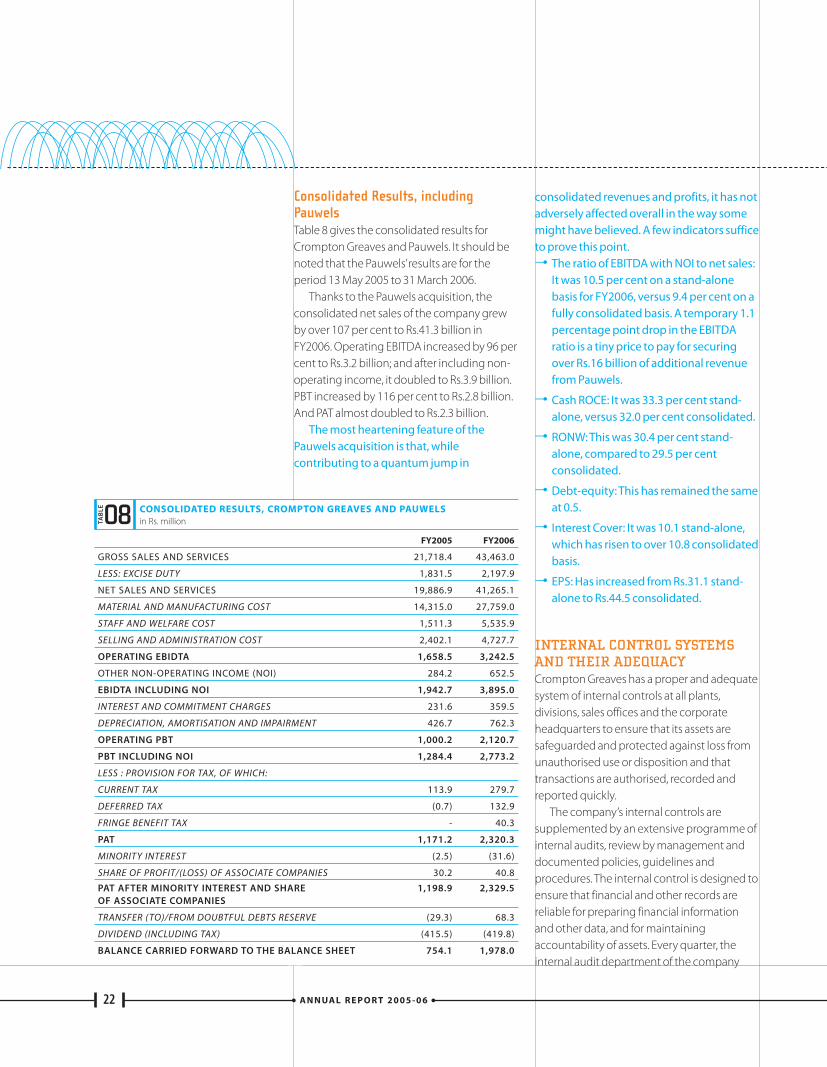
Consolidated Results, includingPauwelsTable 8 gives the consolidated results forCrompton Greaves and Pauwels. It should benoted that the Pauwels’results are for theperiod 13 May 2005 to 31 March 2006.
Thanks to the Pauwels acquisition, theconsolidated net sales of the company grewby over 107 per cent to Rs.41.3 billion inFY2006. Operating EBITDA increased by 96 percent to Rs.3.2 billion; and after including non-operating income, it doubled to Rs.3.9 billion.PBT increased by 116 per cent to Rs.2.8 billion.And PAT almost doubled to Rs.2.3 billion.
The most heartening feature of thePauwels acquisition is that, whilecontributing to a quantum jump in
consolidated revenues and profits, it has notadversely affected overall in the way somemight have believed. A few indicators sufficeto prove this point.–• The ratio of EBITDA with NOI to net sales:
It was 10.5 per cent on a stand-alonebasis for FY2006, versus 9.4 per cent on afully consolidated basis. A temporary 1.1percentage point drop in the EBITDAratio is a tiny price to pay for securingover Rs.16 billion of additional revenuefrom Pauwels.
–• Cash ROCE: It was 33.3 per cent stand-alone, versus 32.0 per cent consolidated.
–• RONW: This was 30.4 per cent stand-alone, compared to 29.5 per centconsolidated.
–• Debt-equity: This has remained the sameat 0.5.
–• Interest Cover: It was 10.1 stand-alone,which has risen to over 10.8 consolidatedbasis.
–• EPS: Has increased from Rs.31.1 stand-alone to Rs.44.5 consolidated.
INTERNAL CONTROL SYSTEMSAND THEIR ADEQUACYCrompton Greaves has a proper and adequatesystem of internal controls at all plants,divisions, sales offices and the corporateheadquarters to ensure that its assets aresafeguarded and protected against loss fromunauthorised use or disposition and thattransactions are authorised, recorded andreported quickly.
The company’s internal controls aresupplemented by an extensive programme ofinternal audits, review by management anddocumented policies, guidelines andprocedures. The internal control is designed toensure that financial and other records arereliable for preparing financial informationand other data, and for maintainingaccountability of assets. Every quarter, theinternal audit department of the company
A N N UA L R E P O R T 2 0 0 5 - 0 622
08 CONSOLIDATED RESULTS, CROMPTON GREAVES AND PAUWELSin Rs. million
FY2005 FY2006
GROSS SALES AND SERVICES 21,718.4 43,463.0
LESS: EXCISE DUTY 1,831.5 2,197.9
NET SALES AND SERVICES 19,886.9 41,265.1
MATERIAL AND MANUFACTURING COST 14,315.0 27,759.0
STAFF AND WELFARE COST 1,511.3 5,535.9
SELLING AND ADMINISTRATION COST 2,402.1 4,727.7
OPERATING EBIDTA 1,658.5 3,242.5
OTHER NON-OPERATING INCOME (NOI) 284.2 652.5
EBIDTA INCLUDING NOI 1,942.7 3,895.0
INTEREST AND COMMITMENT CHARGES 231.6 359.5
DEPRECIATION, AMORTISATION AND IMPAIRMENT 426.7 762.3
OPERATING PBT 1,000.2 2,120.7
PBT INCLUDING NOI 1,284.4 2,773.2
LESS : PROVISION FOR TAX, OF WHICH:
CURRENT TAX 113.9 279.7
DEFERRED TAX (0.7) 132.9
FRINGE BENEFIT TAX - 40.3
PAT 1,171.2 2,320.3
MINORITY INTEREST (2.5) (31.6)
SHARE OF PROFIT/(LOSS) OF ASSOCIATE COMPANIES 30.2 40.8
PAT AFTER MINORITY INTEREST AND SHARE 1,198.9 2,329.5OF ASSOCIATE COMPANIES
TRANSFER ( TO)/FROM DOUBTFUL DEBTS RESERVE (29.3) 68.3
DIVIDEND (INCLUDING TAX) (415.5) (419.8)
BALANCE CARRIED FORWARD TO THE BALANCE SHEET 754.1 1,978.0
TAB
LE
apprises the Audit Committee of the Board ofDirectors of its findings and remedial actionsproposed by it as well as the management.
RISK IDENTIFICATION ANDMITIGATION The revised Clause 49 of the ListingAgreement mandates listed companies to puta risk management policy in place. CromptonGreaves had taken up this task in April 2005 —a full nine months before the revised Clause 49came into effect. The company’s riskmanagement policy identifies key risks,develops mitigation plans and monitors theseon a continuous basis with quarterly reportingto the Risk Management Committee of theBoard of Directors. The Risk ManagementCommittee of the Board is chaired by Mr Sudhir Trehan with Dr Omkar Goswami andMr Sanjay Labroo as the members. TheCorporate Risk Management Department hasbeen vested with the responsibility ofimplementing the policy.
Risk Management Committees have beenformed at all the divisions, which are headedby the risk owner, as identified by the divisionhead. These committees consist of membersdrawn from various functions at the division-level. For most divisions, these committeeshave already identified the key risks, analysedtheir probability and impact, and evolved amitigation plan. Transformers, Fans,Switchgear, Motors, Information Technologyand Legal have already made presentations tothe Board Committee on the various risksenvisaged by them and their mitigation plan.
FUTURE PROSPECTSAs in all businesses, Crompton Greaves too hasits concerns, of which four are particularlyimportant. First, the industry is sufferingseverely because of sharp and sustainedcommodity price increases in all its rawmaterials and inputs — some of which aredriven by pure market forces and othersbecause of business combinations. That thecompany has been able to increase
profitability in such an environment istestimony to its zeal in achieving best-in-classoperational efficiencies and productivityacross the entire supply chain. However, ifprices continue to rise as they have in the lastyear, it will be increasingly difficult to sustain,let aside increase, the current levels ofprofitability.
Second, growth of the Power Systemsbusiness is closely connected to the progressof reforms and other regulatory issues. If, for
C R O M P TO N G R E AV E S L I M I T E D 23
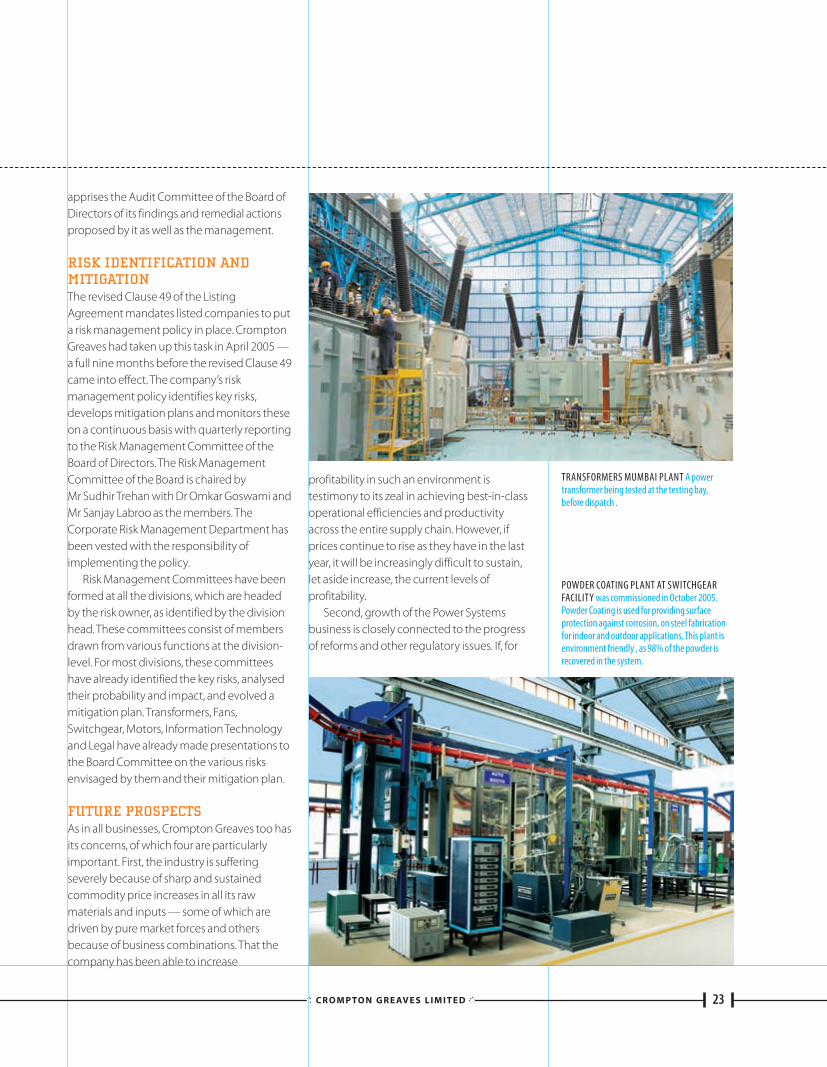
TRANSFORMERS MUMBAI PLANT A powertransformer being tested at the testing bay, before dispatch .
POWDER COATING PLANT AT SWITCHGEARFACILITY was commissioned in October 2005.Powder Coating is used for providing surfaceprotection against corrosion, on steel fabricationfor indoor and outdoor applications. This plant isenvironment friendly , as 98% of the powder isrecovered in the system.
any reason, there is a downturn in investmentsin power generation, transmission anddistribution, it could adversely affect thecompany’s business — which accounts forover 64 per cent of its consolidated revenues.
Third, as the company seeks to getmaximum value through increased multi-shoring operations, its Indian facilities willbecome even more dependent on the state ofthe country’s infrastructure — especially itsports. While there have been someimprovement in efficiencies, Indian ports are along way from meeting minimuminternational standards of efficiency, deliveryand turnaround time. Any significant delay atports can cause serious logistic problems,hamper supply schedules and hurtprofitability.
Finally, with the company havingglobalised, it is now exposed to multiplecurrency fluctuations. While CromptonGreaves has good treasury operations, onecannot rule out the adverse impact ofcurrency risks, hedges and derivatives.
Having stated these caveats, it is a fact thatthere are huge opportunities. India has beengrowing at an average of 8 per cent over thelast three years. Even if this growth rate were to
drop a bit — and presently there seems noreason why that should be so — it would stillbe posting the second highest growth in theworld, after China. Developing countries arecontinuing to grow rapidly. Despite the UScurrent account deficit, global growthprospects continue to be benign. In such anenvironment, it is fair to expect significantincreases in infrastructure spends as well ashousehold disposable incomes throughoutmost parts of the world. Crompton Greaves,therefore, has an optimistic view of its futuregrowth in revenues and profits.
ACKNOWLEDGEMENTThis chapter will not be complete without twomajor acknowledgements. To a large extent,the success of Crompton Greaves during theyear has been due to the efforts of the Pauwelsmanagement in driving integration, achievinggreater growth and in focusing on higherreturns on capital. There has been a commonvision; a common objective; a perfectalignment of action; and a sharedcommitment to business excellence. Mostsignificantly, all of this has been achieved withconstant cooperation and camaraderie. In this,the company acknowledges the key
A N N UA L R E P O R T 2 0 0 5 - 0 624
leadership role played by Mr Eric Van Zele, CEOof the Pauwels Group, and his team.
Second, and no less important, has beenthe role of Crompton Greaves’employees.Across all hierarchies, they have once againshown their total commitment to the businessby increasing sales, profits and profitability.And doing so with the added responsibility ofa major integration process. They have provenwhat it takes to be leaders.
Sudhir TrehanManaging Director
CAUTIONARY STATEMENTThe management of Crompton Greaves hasprepared and is responsible for the financialstatements that appear in this report. These arein conformity with accounting principlesgenerally accepted in India and, therefore,include amounts based on informed judgmentsand estimates. The management also acceptsresponsibility for the preparation of otherfinancial information that is included in thisreport. This presentation includes some forward-looking statements. The management has basedthese forward-looking statements on its currentexpectations and projections about futureevents. Such statements involve known andunknown risks, uncertainties and other factorsthat may cause actual results to differ materially.These factors include, but are not limited to,changes in local and global economicconditions, the company’s ability to successfullyimplement its strategy, the market’s acceptanceof and demand for its products, growth andexpansion, technological change and exposureto market risks. By their nature, theseexpectations and projections are only estimates,and could be materially different from actualresults in the future.
C R O M P TO N G R E AV E S L I M I T E D 25
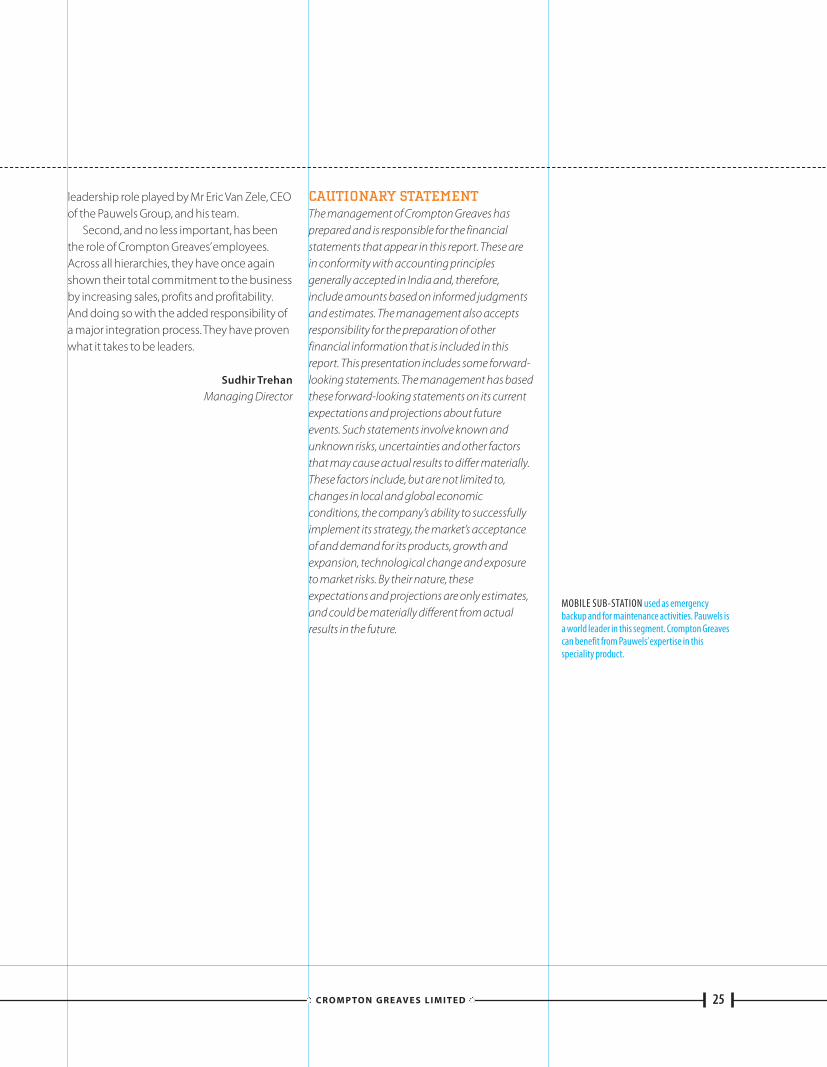
MOBILE SUB-STATION used as emergencybackup and for maintenance activities. Pauwels isa world leader in this segment. Crompton Greavescan benefit from Pauwels’expertise in thisspeciality product.
A N N UA L R E P O R T 2 0 0 5 - 0 626
10year highlights
1997
1998
1999
2000
2001
2002
2003
2004
2005
2006
2005
2006
1997
1998
1999
2000
2001
2002
2003
2004
2005
2006
2005
2006
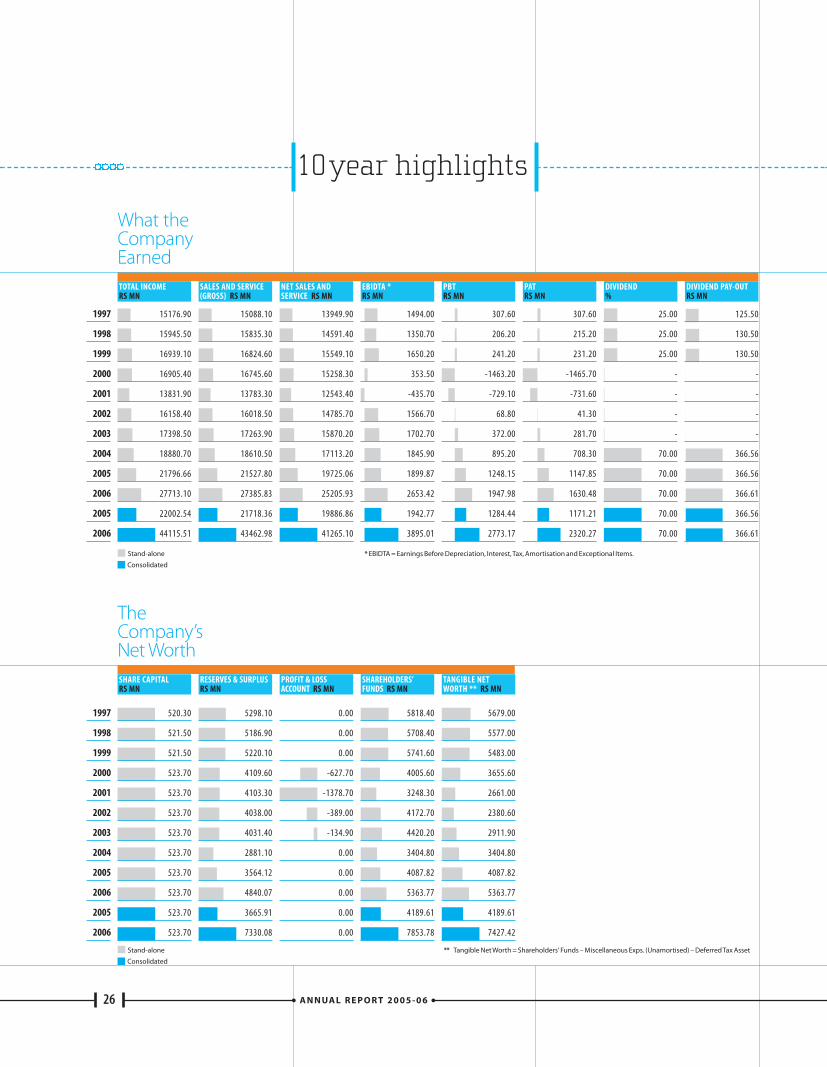
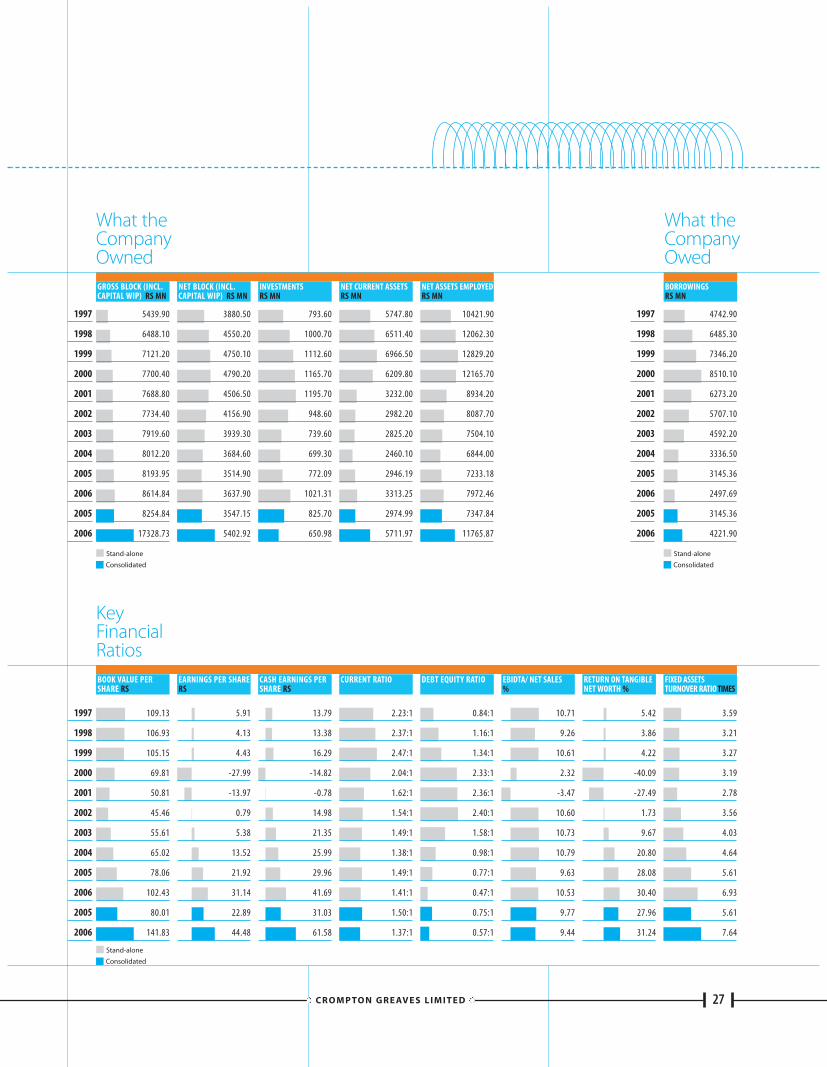
What theCompanyEarned
TheCompany’sNet Worth
TOTAL INCOME RS MN
SHARE CAPITALRS MN
SALES AND SERVICE(GROSS) RS MN
RESERVES & SURPLUSRS MN
NET SALES ANDSERVICE RS MN
PROFIT & LOSSACCOUNT RS MN
EBIDTA * RS MN
SHAREHOLDERS’FUNDS RS MN
PBT RS MN
TANGIBLE NETWORTH ** RS MN
PAT RS MN
DIVIDEND %
DIVIDEND PAY-OUTRS MN
* EBIDTA = Earnings Before Depreciation, Interest, Tax, Amortisation and Exceptional Items.
** Tangible Net Worth = Shareholders' Funds – Miscellaneous Exps. (Unamortised) – Deferred Tax Asset
520.30
521.50
521.50
523.70
523.70
523.70
523.70
523.70
523.70
523.70
523.70
523.70
5298.10
5186.90
5220.10
4109.60
4103.30
4038.00
4031.40
2881.10
3564.12
4840.07
3665.91
7330.08
0.00
0.00
0.00
-627.70
-1378.70
-389.00
-134.90
0.00
0.00
0.00
0.00
0.00
5818.40
5708.40
5741.60
4005.60
3248.30
4172.70
4420.20
3404.80
4087.82
5363.77
4189.61
7853.78
5679.00
5577.00
5483.00
3655.60
2661.00
2380.60
2911.90
3404.80
4087.82
5363.77
4189.61
7427.42
15176.90
15945.50
16939.10
16905.40
13831.90
16158.40
17398.50
18880.70
21796.66
27713.10
22002.54
44115.51
15088.10
15835.30
16824.60
16745.60
13783.30
16018.50
17263.90
18610.50
21527.80
27385.83
21718.36
43462.98
13949.90
14591.40
15549.10
15258.30
12543.40
14785.70
15870.20
17113.20
19725.06
25205.93
19886.86
41265.10
1494.00
1350.70
1650.20
353.50
-435.70
1566.70
1702.70
1845.90
1899.87
2653.42
1942.77
3895.01
307.60
206.20
241.20
-1463.20
-729.10
68.80
372.00
895.20
1248.15
1947.98
1284.44
2773.17
307.60
215.20
231.20
-1465.70
-731.60
41.30
281.70
708.30
1147.85
1630.48
1171.21
2320.27
25.00
25.00
25.00
-
-
-
-
70.00
70.00
70.00
70.00
70.00
125.50
130.50
130.50
-
-
-
-
366.56
366.56
366.61
366.56
366.61
Consolidated
Stand-alone
Consolidated
Stand-alone
C R O M P TO N G R E AV E S L I M I T E D 27
1997
1998
1999
2000
2001
2002
2003
2004
2005
2006
2005
2006
1997
1998
1999
2000
2001
2002
2003
2004
2005
2006
2005
2006
1997
1998
1999
2000
2001
2002
2003
2004
2005
2006
2005
2006
What theCompanyOwned
What theCompanyOwed
KeyFinancialRatios
GROSS BLOCK (INCL.CAPITAL WIP) RS MN
BOOK VALUE PERSHARE RS
NET BLOCK (INCL.CAPITAL WIP) RS MN
EARNINGS PER SHARERS
INVESTMENTS RS MN
CASH EARNINGS PERSHARE RS
NET CURRENT ASSETSRS MN
CURRENT RATIO
NET ASSETS EMPLOYEDRS MN
DEBT EQUITY RATIO EBIDTA/ NET SALES %
RETURN ON TANGIBLENET WORTH %
BORROWINGSRS MN
FIXED ASSETSTURNOVER RATIO TIMES
109.13
106.93
105.15
69.81
50.81
45.46
55.61
65.02
78.06
102.43
80.01
141.83
5.91
4.13
4.43
-27.99
-13.97
0.79
5.38
13.52
21.92
31.14
22.89
44.48
13.79
13.38
16.29
-14.82
-0.78
14.98
21.35
25.99
29.96
41.69
31.03
61.58
2.23:1
2.37:1
2.47:1
2.04:1
1.62:1
1.54:1
1.49:1
1.38:1
1.49:1
1.41:1
1.50:1
1.37:1
0.84:1
1.16:1
1.34:1
2.33:1
2.36:1
2.40:1
1.58:1
0.98:1
0.77:1
0.47:1
0.75:1
0.57:1
10.71
9.26
10.61
2.32
-3.47
10.60
10.73
10.79
9.63
10.53
9.77
9.44
5.42
3.86
4.22
-40.09
-27.49
1.73
9.67
20.80
28.08
30.40
27.96
31.24
3.59
3.21
3.27
3.19
2.78
3.56
4.03
4.64
5.61
6.93
5.61
7.64
5439.90
6488.10
7121.20
7700.40
7688.80
7734.40
7919.60
8012.20
8193.95
8614.84
8254.84
17328.73
3880.50
4550.20
4750.10
4790.20
4506.50
4156.90
3939.30
3684.60
3514.90
3637.90
3547.15
5402.92
793.60
1000.70
1112.60
1165.70
1195.70
948.60
739.60
699.30
772.09
1021.31
825.70
650.98
5747.80
6511.40
6966.50
6209.80
3232.00
2982.20
2825.20
2460.10
2946.19
3313.25
2974.99
5711.97
10421.90
12062.30
12829.20
12165.70
8934.20
8087.70
7504.10
6844.00
7233.18
7972.46
7347.84
11765.87
4742.90
6485.30
7346.20
8510.10
6273.20
5707.10
4592.20
3336.50
3145.36
2497.69
3145.36
4221.90
Consolidated
Stand-alone
Consolidated
Stand-alone
Consolidated
Stand-alone
ToThe Members,
The Directors are pleased to present theirSixty-ninth Report with the audited accountsfor the year ended 31 March 2006.
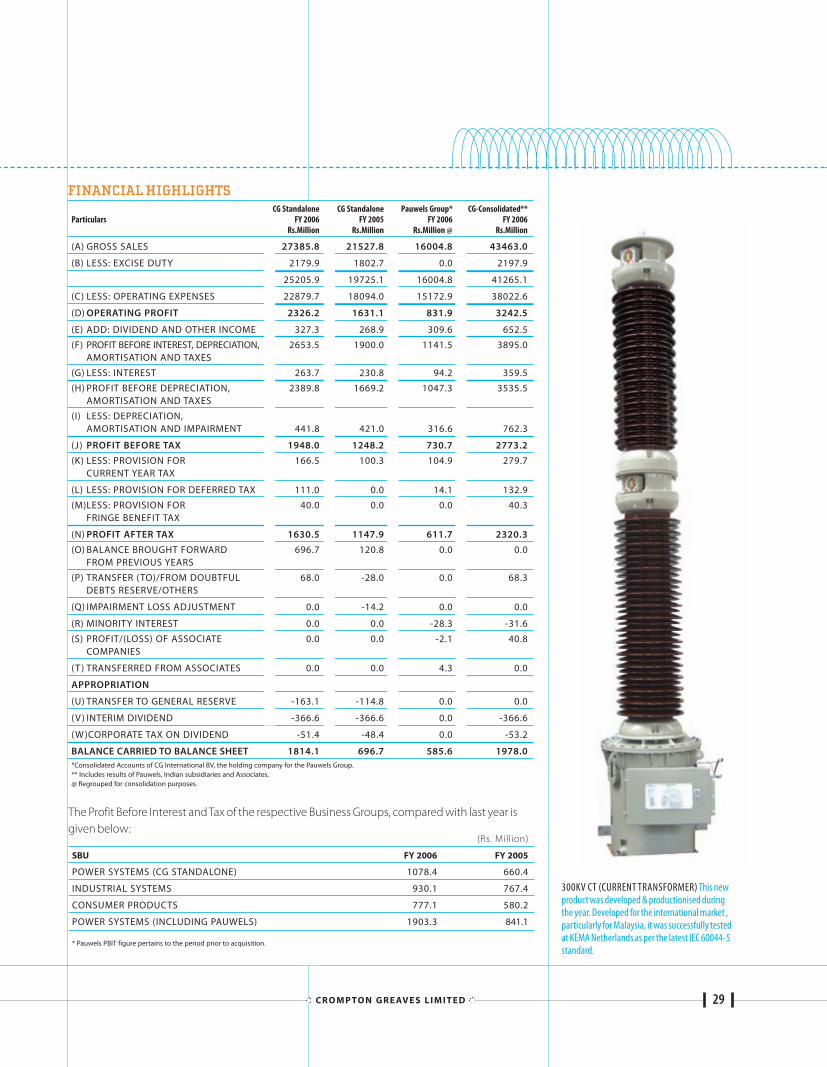
OPERATIONSThe company has recorded a turnover of Rs. 27385.8 million for FY 2006, anencouraging growth of 27.2 per cent over theturnover of Rs.21527.8 million recorded lastyear. The performance is attributable to thecompany’s additional thrust on new markets,International businesses, innovative productsand additional capacities introduced duringthe year. Improvement of fixed and workingcapital efficiencies, productivity increases,value engineering initiatives and efficientsupply chain management has enabled thecompany reach greater performance heights,recording a profit before tax and profit after taxof Rs.1948 million and Rs.1630.5 millionrespectively, an impressive increase of56 per cent and 42 per cent respectively ascompared with last year.
On 13 May 2005, the company acquiredthe Belgium-based Pauwels Group, withmanufacturing facilities in Belgium, Ireland,Canada, USA and Indonesia and a well-spreaddistribution network across the globe. Sincethen, due to the active involvement of themanagement of both the companies, the truespirit of “best of both worlds”has become areality, through the sustained efforts of severalintegration teams in the areas of Design,Purchasing, Manufacturing, Quality, Sales,Marketing & Business Development andManagement Reporting & Support Systems.The synergy between the company and
Pauwels, and their responsiveness to variousinitiatives, is reflected in a turnover ofRs.16004.8 million and a profit after tax of Rs.611.7 million, a remarkable turnaround from aloss position of last year (January 2004 toDecember 2004) of Rs.145.1 million.
The success with Pauwels with respect tooperational and financial efficiencies, togetherwith its increased market presence and futurestrategies for growth, reflect the bright futurethat awaits the company in unison with thePauwels Group. Under the leadership of therespective management teams, we havewitnessed the blend of cultures and a teamspirit that has crossed geographicalboundaries, to make the company a trulyGlobal Corporation with a formidablepresence in the International transmission anddistribution business space.
A N N UA L R E P O R T 2 0 0 5 - 0 628
directors’ reportFY 2006
C R O M P TO N G R E AV E S L I M I T E D 29
FINANCIAL HIGHLIGHTSCG Standalone CG Standalone Pauwels Group* CG-Consolidated**
Particulars FY 2006 FY 2005 FY 2006 FY 2006Rs.Million Rs.Million Rs.Million @ Rs.Million
(A) GROSS SALES 27385.8 21527.8 16004.8 43463.0
(B) LESS: EXCISE DUTY 2179.9 1802.7 0.0 2197.9
25205.9 19725.1 16004.8 41265.1
(C) LESS: OPERATING EXPENSES 22879.7 18094.0 15172.9 38022.6
(D) OPERATING PROFIT 2326.2 1631.1 831.9 3242.5
(E) ADD: DIVIDEND AND OTHER INCOME 327.3 268.9 309.6 652.5
(F) PROFIT BEFORE INTEREST, DEPRECIATION, 2653.5 1900.0 1141.5 3895.0AMORTISATION AND TAXES
(G) LESS: INTEREST 263.7 230.8 94.2 359.5
(H) PROFIT BEFORE DEPRECIATION, 2389.8 1669.2 1047.3 3535.5AMORTISATION AND TAXES
(I) LESS: DEPRECIATION, AMORTISATION AND IMPAIRMENT 441.8 421.0 316.6 762.3
(J) PROFIT BEFORE TAX 1948.0 1248.2 730.7 2773.2
(K) LESS: PROVISION FOR 166.5 100.3 104.9 279.7CURRENT YEAR TAX
(L) LESS: PROVISION FOR DEFERRED TAX 111.0 0.0 14.1 132.9
(M)LESS: PROVISION FOR 40.0 0.0 0.0 40.3FRINGE BENEFIT TAX
(N) PROFIT AFTER TAX 1630.5 1147.9 611.7 2320.3
(O) BALANCE BROUGHT FORWARD 696.7 120.8 0.0 0.0FROM PREVIOUS YEARS
(P) TRANSFER (TO)/FROM DOUBTFUL 68.0 -28.0 0.0 68.3DEBTS RESERVE/OTHERS
(Q) IMPAIRMENT LOSS ADJUSTMENT 0.0 -14.2 0.0 0.0
(R) MINORITY INTEREST 0.0 0.0 -28.3 -31.6
(S) PROFIT/(LOSS) OF ASSOCIATE 0.0 0.0 -2.1 40.8COMPANIES
(T ) TRANSFERRED FROM ASSOCIATES 0.0 0.0 4.3 0.0
APPROPRIATION
(U) TRANSFER TO GENERAL RESERVE -163.1 -114.8 0.0 0.0
(V) INTERIM DIVIDEND -366.6 -366.6 0.0 -366.6
(W)CORPORATE TAX ON DIVIDEND -51.4 -48.4 0.0 -53.2
BALANCE CARRIED TO BALANCE SHEET 1814.1 696.7 585.6 1978.0*Consolidated Accounts of CG International BV, the holding company for the Pauwels Group. ** Includes results of Pauwels, Indian subsidiaries and Associates.@ Regrouped for consolidation purposes.
The Profit Before Interest and Tax of the respective Business Groups, compared with last year isgiven below:
(Rs. Million)
SBU FY 2006 FY 2005
POWER SYSTEMS (CG STANDALONE) 1078.4 660.4
INDUSTRIAL SYSTEMS 930.1 767.4
CONSUMER PRODUCTS 777.1 580.2
POWER SYSTEMS (INCLUDING PAUWELS) 1903.3 841.1
* Pauwels PBIT figure pertains to the period prior to acquisition.
300KV CT (CURRENT TRANSFORMER) This newproduct was developed & productionised duringthe year. Developed for the international market ,particularly for Malaysia, it was successfully testedat KEMA Netherlands as per the latest IEC 60044-5standard.
A detailed review of the operations andperformance of each Business Group and thePauwels Group which is a part of the PowerSystems Group, is contained in theManagement Discussion & Analysis Report,which is given as a separate Chapter in theAnnual Report.
DIVIDENDThe company declared three interim dividendsduring the year:
–• Rs.2.00 per equity share (20%) aggregatingto a total dividend payout of Rs.119.4million (including dividend tax) on 14October 2005; the Record Date for thispurpose was 21 October 2005 and theInterim Dividend was paid on 31 October2005.
–• Rs.2.50 per equity share (25%) aggregatingto a total dividend payout of Rs.149.3million (including dividend tax) on 25January 2006; the Record Date for thispurpose was 3 February 2006 and theInterim Dividend was paid on 13 February2006.
–• Rs.2.50 per equity share (25%) aggregatingto a total dividend payout of Rs.149.3million (including dividend tax) on 29March 2006; the Record Date for thispurpose was 7 April 2006 and the InterimDividend was paid on 20 April 2006.
A proposal for confirmation of theabovementioned three interim dividends asfinal dividend is being placed before theMembers at the forthcoming Annual GeneralMeeting.
RESERVESThe Reserves at the beginning of the year wereRs.3564.1 million. The Reserves at the end ofthe year are Rs.4840.1 million. The Deferred TaxAsset of Rs.144 million has not beenrecognised in the books of accounts, since thisforms part of the amount of Deferred Tax Assetwritten off during earlier years against thebalance in the Securities Premium Account
vide Order dated 15 September 2003, of theHigh Court of Judicature at Mumbai.
DIRECTORATEICICI Bank withdrew its nomination of Mr SBisht as a Director on the company’s Board ofDirectors, consequent to which Mr Bishtceased to be a Director with effect from 16September 2005. The Board places on recordits appreciation for the guidance, support andvaluable contributions of Mr Bisht during histenure as a Director of the company.
Mr SP Talwar and Dr Valentin von Massowwere appointed as Additional Directors on thecompany’s Board of Directors with effect from14 October 2005 and 25 January 2006respectively. They hold office upto the date ofthe forthcoming Annual General Meeting, andconsidering that the company will benefitfrom their continuance as Directors, theirappointments are being recommended.
Mr G Thapar retires by rotation at theforthcoming Annual General Meeting, andbeing eligible, offers himself for re-appointment to the Board.
The details of the Directors beingrecommended for appointment as well as re-appointment are contained in theaccompanying Notice of the forthcomingAnnual General Meeting.
RESEARCH AND DEVELOPMENT During the year, the R&D Strategy-2010 wascrystallised to align with the company’s GlobalVision, and focusses on creation of platformtechnologies, shrinking product developmentcycle time and enhancing IntellectualProperty Capital of the company. A majorproject to redesign the R&D structure, systems& portfolio has been initiated.
Actions in the five ‘Technology Mission’areas, identified last year, are progressingsatisfactorily.
The focus for research undertaken at thePauwels locations, was on new designconcepts, use of alternate materials, greaterreliability of products and alternative energy
A N N UA L R E P O R T 2 0 0 5 - 0 630
applications. These efforts at Pauwels willfurther reinforce the company’s R&Dmomentum.
New products & processes developed aredetailed in the Annexure.
PROMOTER GROUPThe BM Thapar Group currently holds 39.3% ofthe company’s equity capital and this Groupinter alia comprises Greaves Cotton Ltd,Greaves Leasing Finance Ltd, English IndianClays Ltd, Bharat Projects Pvt Ltd, Bharat StarchProducts Ltd, DBH International Pvt Ltd, KarunCarpets Pvt Ltd, KCT Chemicals & ElectricalsLtd, Solaris Biochemicals Ltd, Solaris ChemTech Ltd, Solaris Industrial Chemicals Ltd,Solaris Holdings Ltd and Standard Refinery &Distillery Ltd.
SUBSIDIARY COMPANIESThe company has three Indian subsidiaries vizCG Motors Private Limited (CGM), CG Capital &Investments Ltd (CG Capital) and CG-PPIAdhesive Products Ltd (CG PPI). CGM and CGCapital are 100% subsidiaries of the companyand CG PPI, being a subsidiary of CG Capital, interms of the provisions of the Companies Act,1956, is also the company’s subsidiary.
To implement the Pauwels acquisition, a100% subsidiary of the company, CGInternational B.V. (CGI) was incorporated inApril 2005, in Amsterdam, Netherlands. CGI isthe ultimate holding company of the PauwelsGroup, comprising 16 downstreamsubsidiaries, as under:
–• Pauwels Contracting N.V.
–• Pauwels Canada Inc
–• Pauwels International N.V.
–• Pauwels Transformers Inc
–• Pauwels Trafo Service SA
–• Pauwels Trafo Ireland Ltd
–• Pauwels Contracting Inc
–• Pauwels France SA
–• Pauwels Americas Inc
–• Pauwels Nigeria Ltd
–• Pauwels Africa (Private) Ltd
–• Pauwels Trafo Belgium N.V.
–• PT Pauwels Trafo Asia
–• Pauwels Curacao N.V.
–• Pauwels Trafo Gent N.V.
–• Pauwels Trafo Service N.V.
In totality, the company has 20 subsidiaries, 3Indian and 17 foreign.
The company has obtained an exemptionunder Section 212 of the Companies Act,1956, from annexing to this Report, the AnnualReports of the abovementioned 3 Indiansubsidiaries and 17 foreign subsidiaries, for FY2006. However, if any shareholder of thecompany or its subsidiaries so desires, thecompany will make available, the AnnualAccounts of the subsidiaries to them, on request.The same will also be available for inspection atthe Registered Office of the company and of itssubsidiaries, during working hours upto the dateof the Annual General Meeting.
The details of each subsidiary with respectto capital, reserves, total assets, total liabilities,details of investment (except in case ofinvestment in subsidiaries), turnover, profit
C R O M P TO N G R E AV E S L I M I T E D 31
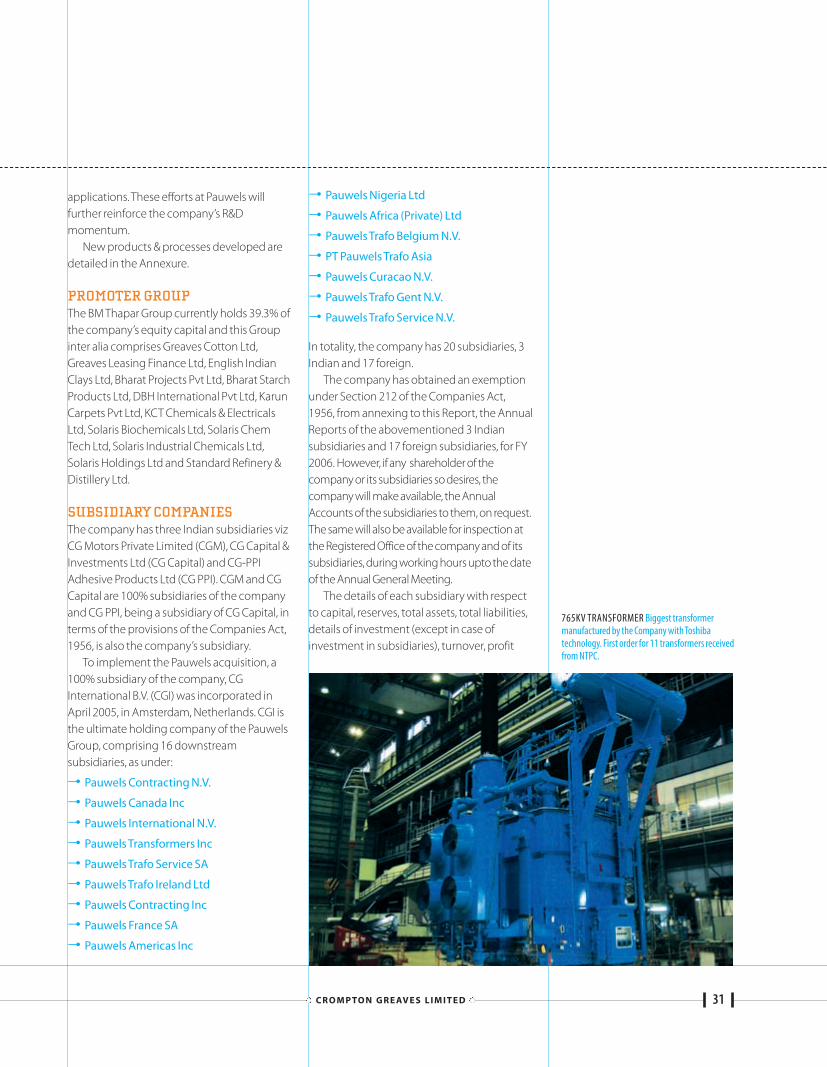
765KV TRANSFORMER Biggest transformermanufactured by the Company with Toshibatechnology. First order for 11 transformers receivedfrom NTPC.
before taxation, provision for taxation, profitafter taxation and proposed dividend aredetailed at page Nos. 89 to 91 of the AnnualReport.
CONSOLIDATION OF ACCOUNTSAs required by Accounting Standards AS-21and AS-23 of the Institute of CharteredAccountants of India, the financial statementsof the company reflecting the consolidation ofthe Accounts of the company, its 20subsidiaries mentioned above, and 7 associatecompanies, are annexed to this Report. Theassociate companies are Brook CromptonGreaves Ltd, CG Actaris ElectricityManagement Ltd, CG Lucy Switchgear Ltd, CGMaersk Information Technologies Pvt Ltd, CGSmith Software Pvt Ltd, InternationalComponents India Ltd and Pauwels MiddleEast Trading & Contracting (Pvt) Ltd.
For the purposes of consolidation inaccordance with AS-23, certain associatecompanies which do not fulfill the criteriaspecified in the said Accounting Standardhave been excluded. Investments in suchassociate companies have been accountedfor, in accordance with AS-13.
CONSERVATION OF ENERGY,TECHNOLOGY ABSORPTION ANDFOREIGN EXCHANGE EARNINGSAND OUTGOAs required by the Companies (Disclosure ofParticulars in the Report of Board of Directors)Rules, 1988, the relevant data pertaining toconservation of energy, technologyabsorption and foreign exchange earningsand outgo are given in the prescribed formatas an Annexure to this Report.
PARTICULARS OF EMPLOYEES The statement of particulars requiredpursuant to Section 217(2A) of the CompaniesAct, 1956 read with the Companies (Particularsof Employees) (Amendment) Rules, 2002,forms a part of this Report. However, aspermitted by the Companies Act, 1956, the
Report and Accounts are being sent to allshareholders and other entitled personsexcluding the above statement. Thoseinterested in obtaining a copy of the saidstatement may write to the CompanySecretary at the Registered Office and thesame will be sent by post. The statement isalso available for inspection at the RegisteredOffice, during working hours upto the date ofthe Annual General Meeting.
AUDITORS’ REPORT &CERTIFICATEThe company’s explanation to the Auditors’observation in their Report has been detailedin Note No 2 in the Notes on Accountscontained in Schedule B to the Accounts,which forms part of the Annual Report.
DIRECTORS’ RESPONSIBILITYSTATEMENTThe Directors would like to assure theshareholders that the financial statements forthe year under review conform in their entiretyto the requirements of the Companies Act,1956. The Directors confirm that:
–• the Annual Accounts have been preparedin conformity with the applicableAccounting Standards;
–• the Accounting Policies selected andapplied on a consistent basis, give a trueand fair view of the affairs of the companyand of the profit for the financial year;
–• sufficient care has been taken thatadequate accounting records have beenmaintained for safeguarding the assets ofthe company; and for prevention anddetection of fraud and other irregularities;
–• the Annual Accounts have been preparedon a going concern basis.
AUDITORSThe company’s Auditors, Sharp & Tannan, holdoffice upto the conclusion of the forthcoming
A N N UA L R E P O R T 2 0 0 5 - 0 632
Annual General Meeting and, being eligible,are recommended for re-appointment onterms to be negotiated by the AuditCommittee of the Board of Directors. Theyhave furnished the requisite certificate to theeffect that their re-appointment, if effected,will be in accordance with Section 224(1B) ofthe Companies Act, 1956.
FIXED DEPOSITSCurrently, the company has discontinuedacceptance of fresh deposits and also renewalof existing deposits. 681 persons had notclaimed repayment of their matured depositsamounting to Rs.10.5 million as at 31 March2006. At the date of this Report, an amount ofRs.1.4 million therefrom has been claimed andrepaid.
Intime Spectrum Registry Limited continueto be the company’s Registrars for all mattersrelated to the company’s Fixed DepositScheme. The contact details of IntimeSpectrum are mentioned in the Report onCorporate Governance.
SHARE REGISTRAR & TRANSFERAGENTThe company’s share registry function is beinglooked after by Sharepro Services (India) PvtLtd, which is a SEBI-registered Registrar &Transfer Agent. The contact details of ShareproServices are mentioned in the Report onCorporate Governance.
Investors are requested to address theirqueries, if any, in this regard, to ShareproServices; however, in case of difficulties, theyare welcome to contact the company’sInvestor Services Department, the contactparticulars of which are contained in theaccompanying Notice of the forthcomingAnnual General Meeting.
ENVIRONMENT, HEALTH & SAFETYThe company recognises and encourages theimportance of occupational health and safetyof its employees. In its endeavour of SocialResponsibility, going beyond environmental
standards and legislation, the company hasadopted a “No Smoking”Policy at all its plantsand offices across India. The operations of itsfactories and establishments are managed toprevent pollution, and conserve, recover andrecycle materials, water and energy, thusminimising any adverse environmentalimpact. The company’s Health and SafetyPolicy ensures the desired health and safetystandards on a sustainable basis. The companyhas received the ISO 14001 EnvironmentalStandards and Management Certification for 8of its Units and the OHSAS 18001 Certificationfor Occupational Health and SafetyManagement Systems for 5 of its Units. Thecompany in its commitment to environmentas well as health and safety has an action planin place for all Units to achieve these twoCertifications. The company also conducts on-going safety awareness programmes, which,together with safety audits and continualsafety training, strengthen the systems andprocesses in this area.
ACKNOWLEDGMENTSThe Directors thank all the employees in Indiaand at Pauwels, for their dedicated efforts,hard work and commitment, which haveproved invaluable to the progress of thecompany. The encouraging results exemplifythe successful unification of cultures,openness to new ideas and team spirit of boththe CGL and Pauwels teams.
The Directors also thank all theShareholders, Dealers, Customers, Suppliers,Financial Institutions, Bankers and otherBusiness Associates for their support andinvolvement as partners in the company’sprogress.
On behalf of the Board of Directors
Mumbai G THAPAR23 May 2006 Chairman
C R O M P TO N G R E AV E S L I M I T E D 33
ANNEXURE TO DIRECTORS’REPORTUnder Section 217(1)(e) of the CompaniesAct, 1956
A. Conservation of Energy(a) Energy Conservation Measures taken:
The company continues its commitmentto energy conservation through itsconsistent efforts to identify potentialenergy-saving opportunities. Thisobjective is achieved through efficientusage of electric power to maintain thepower factor close to unity andsubstitution of electrical energy andpetroleum products with renewableenergy sources.
The typical measures taken towardsfurther energy efficient manufacturingprocesses are:
–• Reduction in consumption of light dieseloil by judicious monitoring of burners,reduction in die changeover time andefficient temperature control
–• Treatment of paint booth water forseparation of paint content from water,which is later used for gardening
–• Regenerative mixed frequency testing
–• Installation of effluent treatment plants forrecycling of water which is used for coolingtower and gardening
–• Rain water harvesting
(b) Additional investments and proposals, ifany, being implemented for reduction inconsumption of energy:
–• 4-Quadrant DC Drives for Motor TypeTesting, DC Type Test plant upto 500kWwith power feed-back arrangement, and athyristorised control system forimpregnation ovens are being set-up atcertain locations to conserve energy.
(c) Impact of the measures at (a) and (b) forreduction of energy consumption and con-sequent impact on the cost of production: Through efficient energy-saving systemsand process optimisation, there will bereduction in energy consumption.However, this saving has a negligibleimpact on the cost of goods, as ourmanufacturing processes are not energyintensive.
B. Technology AbsorptionResearch and Development (R & D)
1. Specific areas of significance in which R&Dis carried out by the company:During the year under review, additionalthrust has been placed on development ofplatform technologies, besides furtherdevelopment of product technologies.Increasing focus is given to newtechnology areas together withenhancing existing technologycapabilities.
2. Benefits derived as a result of the aboveR&D:N E W P R O D U C TS D E V E LO P E D
POWER SYSTEMS–• 800 kV class transformer and shunt reactor
–• Upgradation of Cast Resin dry typetransformers upto 5000 kVA
–• Furnace transformers with jointless mainand booster windings
–• 380 kV capacitor voltage transformers
–• 380 kV, 220 kV class 3 lightning arresters
–• 52 kV bushings for current ratings upto3150 A and 145 kV bushings for currentratings upto 2000 A
–• 420kV bushings with Basic Insulation Levelof 1550 kVp
–• Upgradation of 12 kV indoor vacuumcircuit breakers for ratings upto 40 kA
–• 39kV Poly class 3 surge arresters for Locoapplication
–• 24kV, 25kA, 2500 A vacuum interrupters
A N N UA L R E P O R T 2 0 0 5 - 0 634
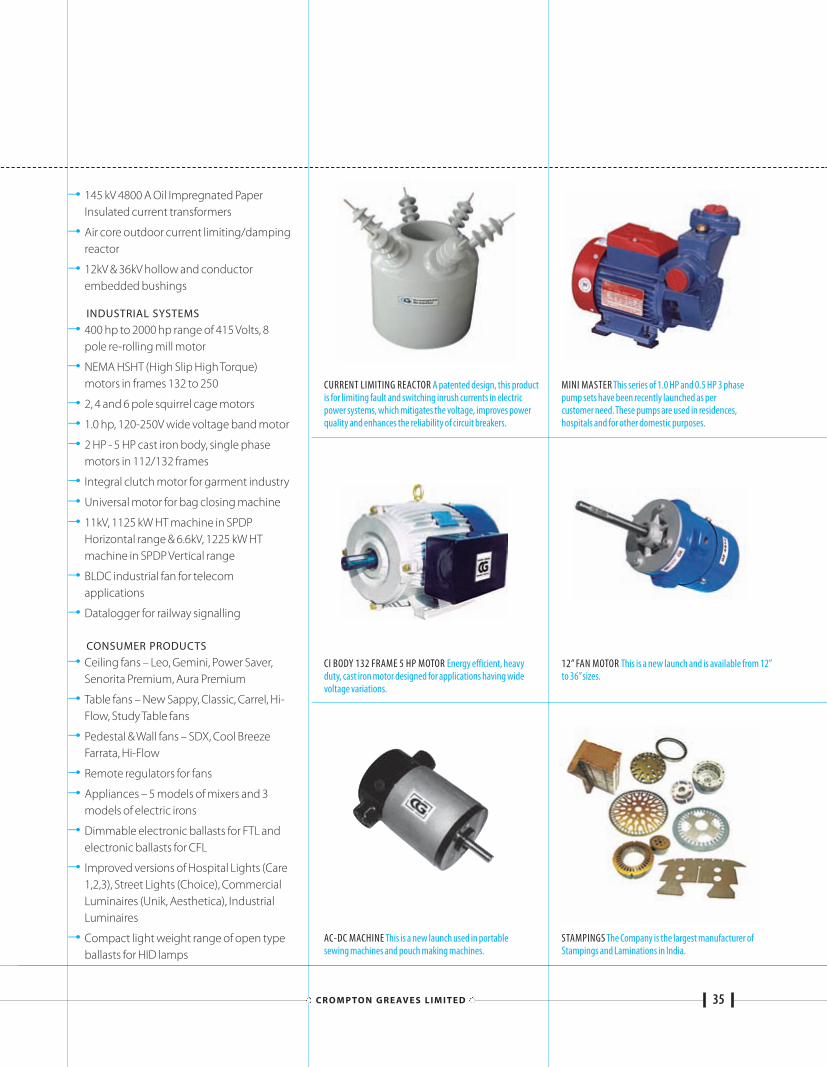
–• 145 kV 4800 A Oil Impregnated PaperInsulated current transformers
–• Air core outdoor current limiting/dampingreactor
–• 12kV & 36kV hollow and conductorembedded bushings
INDUSTRIAL SYSTEMS –• 400 hp to 2000 hp range of 415 Volts, 8
pole re-rolling mill motor
–• NEMA HSHT (High Slip High Torque)motors in frames 132 to 250
–• 2, 4 and 6 pole squirrel cage motors
–• 1.0 hp, 120-250V wide voltage band motor
–• 2 HP - 5 HP cast iron body, single phasemotors in 112/132 frames
–• Integral clutch motor for garment industry
–• Universal motor for bag closing machine
–• 11kV, 1125 kW HT machine in SPDPHorizontal range & 6.6kV, 1225 kW HTmachine in SPDP Vertical range
–• BLDC industrial fan for telecomapplications
–• Datalogger for railway signalling
CONSUMER PRODUCTS–• Ceiling fans – Leo, Gemini, Power Saver,
Senorita Premium, Aura Premium
–• Table fans – New Sappy, Classic, Carrel, Hi-Flow, Study Table fans
–• Pedestal & Wall fans – SDX, Cool BreezeFarrata, Hi-Flow
–• Remote regulators for fans
–• Appliances – 5 models of mixers and 3models of electric irons
–• Dimmable electronic ballasts for FTL andelectronic ballasts for CFL
–• Improved versions of Hospital Lights (Care1,2,3), Street Lights (Choice), CommercialLuminaires (Unik, Aesthetica), IndustrialLuminaires
–• Compact light weight range of open typeballasts for HID lamps
C R O M P TO N G R E AV E S L I M I T E D 35
CI BODY 132 FRAME 5 HP MOTOR Energy efficient, heavyduty, cast iron motor designed for applications having widevoltage variations.
STAMPINGS The Company is the largest manufacturer ofStampings and Laminations in India.
CURRENT LIMITING REACTOR A patented design, this productis for limiting fault and switching inrush currents in electricpower systems, which mitigates the voltage, improves powerquality and enhances the reliability of circuit breakers.
MINI MASTER This series of 1.0 HP and 0.5 HP 3 phasepump sets have been recently launched as percustomer need. These pumps are used in residences,hospitals and for other domestic purposes.
12” FAN MOTOR This is a new launch and is available from 12”to 36”sizes.
AC-DC MACHINE This is a new launch used in portablesewing machines and pouch making machines.
–• LED (Light Emitting Diodes) Luminaires
–• 1HP and 0.5 HP 3 phase pumps(Minimaster I & Minimaster II)
–• 0.5 HP 1 phase monoset pumps withaluminum body for domestic use (Flomax II)
–• Solid handling and de-watering coupledpumpsets from 5 HP to 25 HP for industrialapplications (DWC series)
–• Microcontroller based digital pumpcontrollers and pipe water sensors forpumps
–• Borewell submersible pumps with 6’’boresize (Janata) for agricultural use
N E W P R O C E S S E S I M P L E M E N T E D /
P R O C E S S E S I M P R O V E D
–• Customised design creation of fabricationdrawings software (Electra)
–• Optimisation of electrical design for oilcooled transformers
–• Updation and optimisation of electricaldesign for VPI (Vacuum PressureImpregnation) dry type transformers
–• Noise level prediction and reduction forpower transformers
–• Design methodology for performanceprediction of furnace transformers
–• Insulation optimisation using FEA [FiniteElement Analysis] for high voltagetransformers
–• Development of AMF (Axial MagneticField) contacts geometry for 12 kV, 20/25kA frame
–• Transient thermal and fluid flow analysis ofpower transformer
–• Design synthesis program for single phaseinduction motor
–• Induction brazing of 3-phase electrictraction motor
–• Resistance brazing of stator coiled joints oftraction alternator, HT & LT machines
–• Productivity improvement of non-siliconsteel
–• Shrink packaging for domestic products
T E C H N O LO G Y CO M P E T E N C E
AC H I E V E D
–• Proprietary software tools for analysis andprediction of performance of powertransformer and motors
–• Contact metallurgy process for vacuuminterrupters
–• Low power brushless DC motors
–• Electronically assisted and electronicallycontrolled motors in FHP range
PAU W E L S R & D
In addition, the company will benefit fromthe R & D work undertaken at Pauwels, theprimary direction of which is:
–• Development of new design concepts
–• Use of alternate materials
–• Enhanced reliability of products
–• Alternate energy applications
The company’s integration efforts aretargeted at harmonisation of all R & Dactivities undertaken whether in India orabroad, and sharing of resultant benefits at all its manufacturing locations, acrossthe world.
PAT E N T S
During the year the company was grantedfour patents. 16 patents (13 in India and 3international) filed during the year,together with 9 patents filed earlier, arepending registration.
3. Future Plan of ActionThe company is in the process ofestablishing “Centres of TechnologyExcellence ”in the five chosen TechnologyMission areas. The systems and structureof the company’s Research andDevelopment are being reviewed tomatch the company’s Technology Vision.
A N N UA L R E P O R T 2 0 0 5 - 0 636
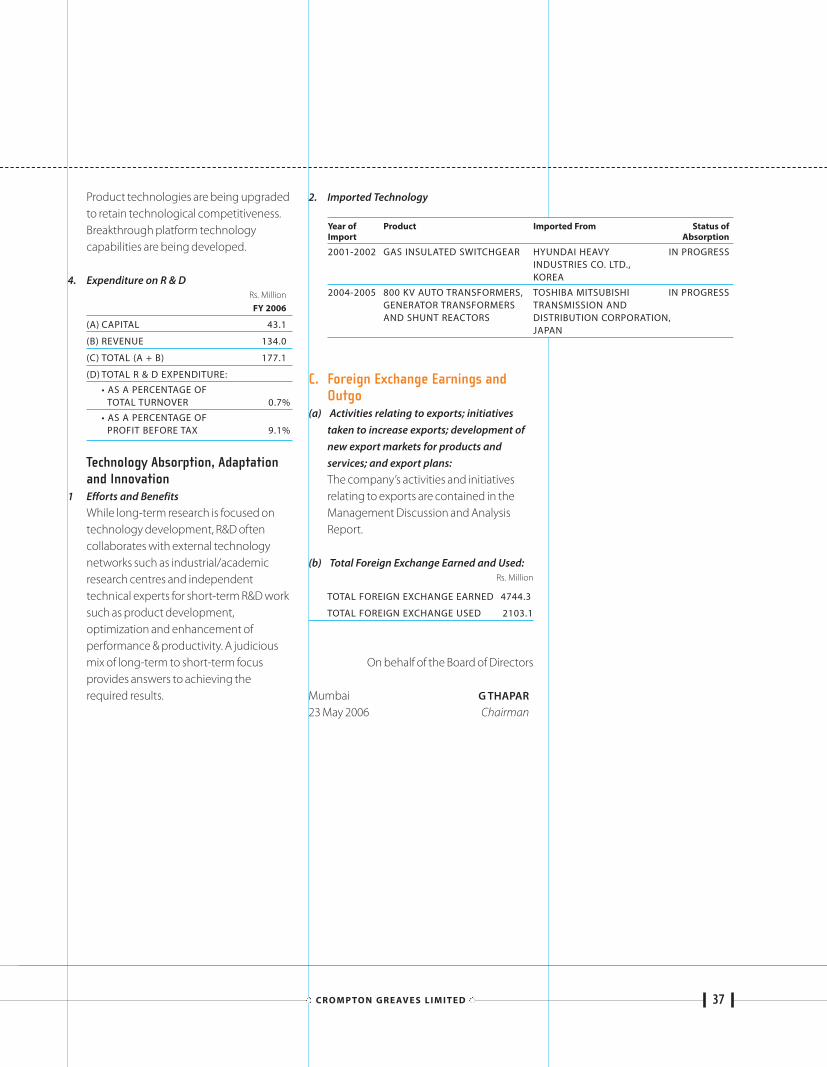
Product technologies are being upgradedto retain technological competitiveness.Breakthrough platform technologycapabilities are being developed.
4. Expenditure on R & D Rs. Million
FY 2006
(A) CAPITAL 43.1
(B) REVENUE 134.0
(C) TOTAL (A + B) 177.1
(D) TOTAL R & D EXPENDITURE:
• AS A PERCENTAGE OF TOTAL TURNOVER 0.7%
• AS A PERCENTAGE OF PROFIT BEFORE TAX 9.1%
Technology Absorption, Adaptationand Innovation
1 Efforts and BenefitsWhile long-term research is focused ontechnology development, R&D oftencollaborates with external technologynetworks such as industrial/academicresearch centres and independenttechnical experts for short-term R&D worksuch as product development,optimization and enhancement ofperformance & productivity. A judiciousmix of long-term to short-term focusprovides answers to achieving therequired results.
2. Imported Technology
C. Foreign Exchange Earnings andOutgo
(a) Activities relating to exports; initiativestaken to increase exports; development ofnew export markets for products andservices; and export plans:The company’s activities and initiativesrelating to exports are contained in theManagement Discussion and AnalysisReport.
(b) Total Foreign Exchange Earned and Used:Rs. Million
TOTAL FOREIGN EXCHANGE EARNED 4744.3
TOTAL FOREIGN EXCHANGE USED 2103.1
On behalf of the Board of Directors
Mumbai G THAPAR23 May 2006 Chairman
C R O M P TO N G R E AV E S L I M I T E D 37
Year of Product Imported From Status of Import Absorption
2001-2002 GAS INSULATED SWITCHGEAR HYUNDAI HEAVY IN PROGRESSINDUSTRIES CO. LTD., KOREA
2004-2005 800 KV AUTO TRANSFORMERS, TOSHIBA MITSUBISHI IN PROGRESSGENERATOR TRANSFORMERS TRANSMISSION AND AND SHUNT REACTORS DISTRIBUTION CORPORATION,
JAPAN
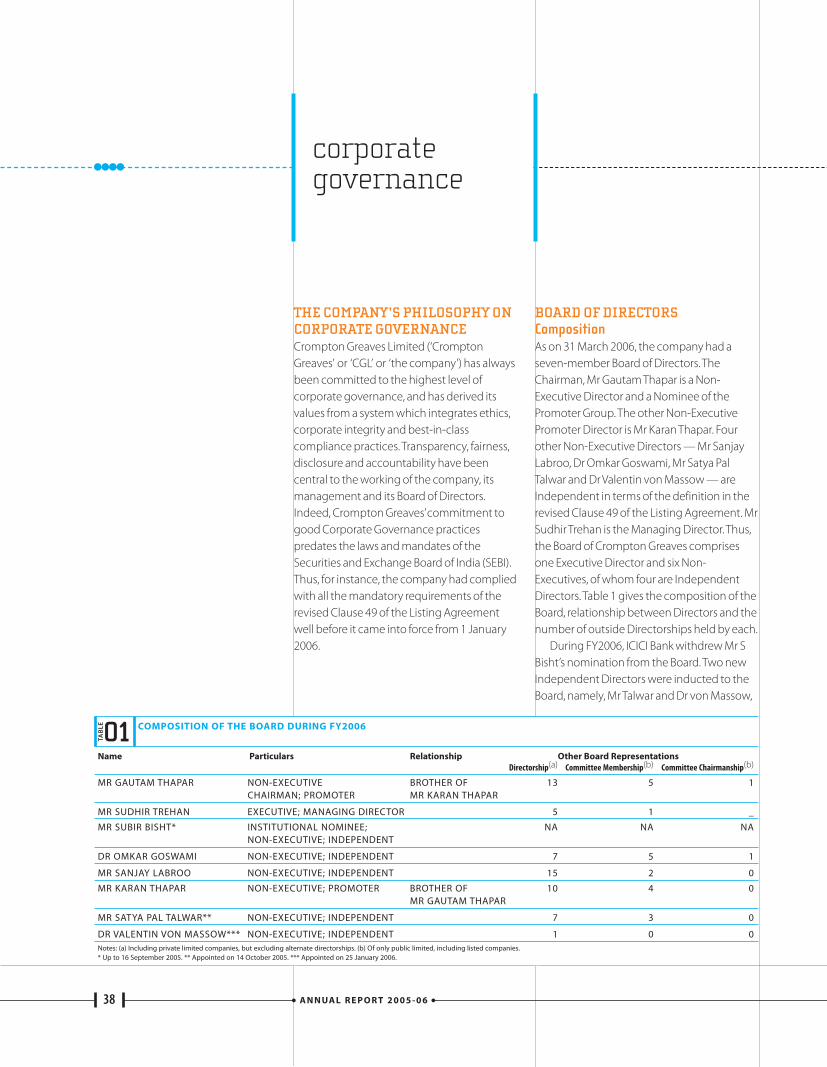
THE COMPANY’S PHILOSOPHY ONCORPORATE GOVERNANCECrompton Greaves Limited (‘CromptonGreaves’ or ‘CGL’ or ‘the company’) has alwaysbeen committed to the highest level ofcorporate governance, and has derived itsvalues from a system which integrates ethics,corporate integrity and best-in-classcompliance practices. Transparency, fairness,disclosure and accountability have beencentral to the working of the company, itsmanagement and its Board of Directors.Indeed, Crompton Greaves’commitment togood Corporate Governance practicespredates the laws and mandates of theSecurities and Exchange Board of India (SEBI).Thus, for instance, the company had compliedwith all the mandatory requirements of therevised Clause 49 of the Listing Agreementwell before it came into force from 1 January2006.
BOARD OF DIRECTORS CompositionAs on 31 March 2006, the company had aseven-member Board of Directors. TheChairman, Mr Gautam Thapar is a Non-Executive Director and a Nominee of thePromoter Group. The other Non-ExecutivePromoter Director is Mr Karan Thapar. Fourother Non-Executive Directors — Mr SanjayLabroo, Dr Omkar Goswami, Mr Satya PalTalwar and Dr Valentin von Massow — areIndependent in terms of the definition in therevised Clause 49 of the Listing Agreement. MrSudhir Trehan is the Managing Director. Thus,the Board of Crompton Greaves comprisesone Executive Director and six Non-Executives, of whom four are IndependentDirectors. Table 1 gives the composition of theBoard, relationship between Directors and thenumber of outside Directorships held by each.
During FY2006, ICICI Bank withdrew Mr SBisht’s nomination from the Board. Two newIndependent Directors were inducted to theBoard, namely, Mr Talwar and Dr von Massow,
A N N UA L R E P O R T 2 0 0 5 - 0 638
corporategovernance
01 COMPOSITION OF THE BOARD DURING FY2006
Name Particulars Relationship Other Board RepresentationsDirectorship(a) Committee Membership(b) Committee Chairmanship(b)
MR GAUTAM THAPAR NON-EXECUTIVE BROTHER OF 13 5 1CHAIRMAN; PROMOTER MR KARAN THAPAR
MR SUDHIR TREHAN EXECUTIVE; MANAGING DIRECTOR 5 1 _
MR SUBIR BISHT* INSTITUTIONAL NOMINEE; NA NA NANON-EXECUTIVE; INDEPENDENT
DR OMKAR GOSWAMI NON-EXECUTIVE; INDEPENDENT 7 5 1
MR SANJAY LABROO NON-EXECUTIVE; INDEPENDENT 15 2 0
MR KARAN THAPAR NON-EXECUTIVE; PROMOTER BROTHER OF 10 4 0MR GAUTAM THAPAR
MR SATYA PAL TALWAR** NON-EXECUTIVE; INDEPENDENT 7 3 0
DR VALENTIN VON MASSOW*** NON-EXECUTIVE; INDEPENDENT 1 0 0Notes: (a) Including private limited companies, but excluding alternate directorships. (b) Of only public limited, including listed companies. * Up to 16 September 2005. ** Appointed on 14 October 2005. *** Appointed on 25 January 2006.
TAB
LE
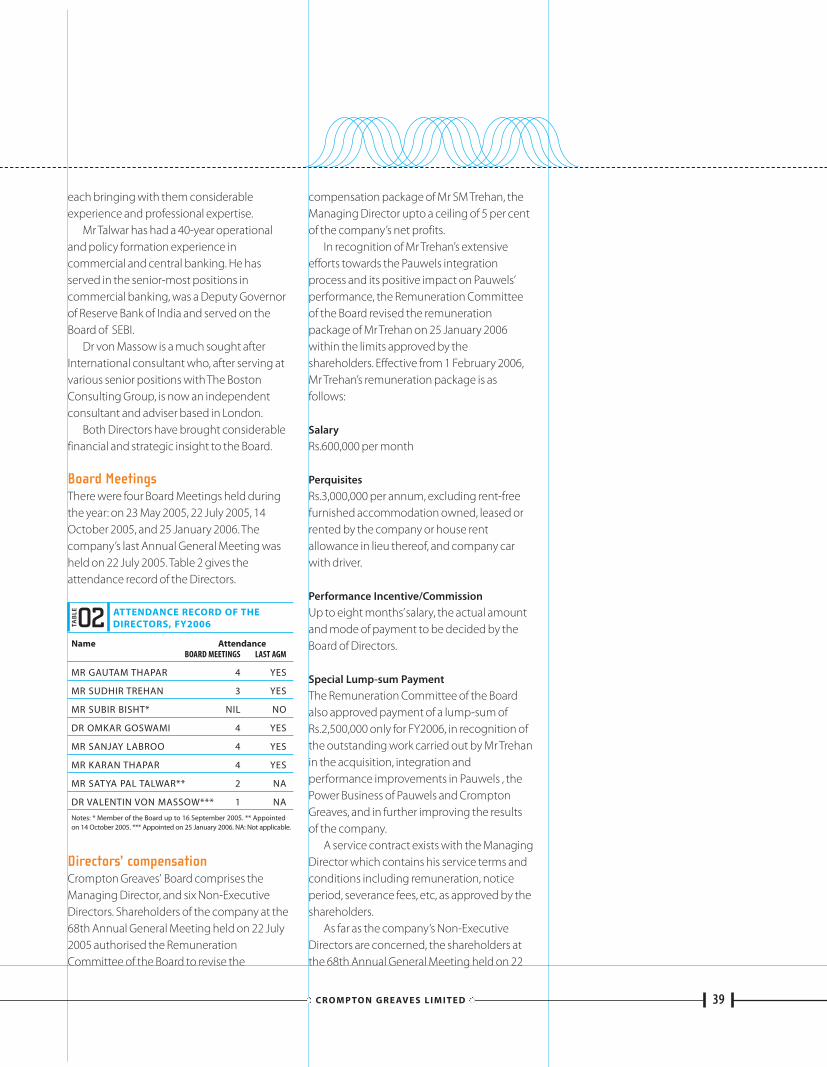
each bringing with them considerableexperience and professional expertise.
Mr Talwar has had a 40-year operationaland policy formation experience incommercial and central banking. He hasserved in the senior-most positions incommercial banking, was a Deputy Governorof Reserve Bank of India and served on theBoard of SEBI.
Dr von Massow is a much sought afterInternational consultant who, after serving atvarious senior positions with The BostonConsulting Group, is now an independentconsultant and adviser based in London.
Both Directors have brought considerablefinancial and strategic insight to the Board.
Board MeetingsThere were four Board Meetings held duringthe year: on 23 May 2005, 22 July 2005, 14October 2005, and 25 January 2006. Thecompany’s last Annual General Meeting washeld on 22 July 2005. Table 2 gives theattendance record of the Directors.
Directors’ compensationCrompton Greaves’ Board comprises theManaging Director, and six Non-ExecutiveDirectors. Shareholders of the company at the68th Annual General Meeting held on 22 July2005 authorised the RemunerationCommittee of the Board to revise the
compensation package of Mr SM Trehan, theManaging Director upto a ceiling of 5 per centof the company’s net profits.
In recognition of Mr Trehan’s extensiveefforts towards the Pauwels integrationprocess and its positive impact on Pauwels’performance, the Remuneration Committeeof the Board revised the remunerationpackage of Mr Trehan on 25 January 2006within the limits approved by theshareholders. Effective from 1 February 2006,Mr Trehan’s remuneration package is asfollows:
SalaryRs.600,000 per month
PerquisitesRs.3,000,000 per annum, excluding rent-freefurnished accommodation owned, leased orrented by the company or house rentallowance in lieu thereof, and company carwith driver.
Performance Incentive/CommissionUp to eight months’salary, the actual amountand mode of payment to be decided by theBoard of Directors.
Special Lump-sum PaymentThe Remuneration Committee of the Boardalso approved payment of a lump-sum ofRs.2,500,000 only for FY2006, in recognition ofthe outstanding work carried out by Mr Trehanin the acquisition, integration andperformance improvements in Pauwels , thePower Business of Pauwels and CromptonGreaves, and in further improving the resultsof the company.
A service contract exists with the ManagingDirector which contains his service terms andconditions including remuneration, noticeperiod, severance fees, etc, as approved by theshareholders.
As far as the company’s Non-ExecutiveDirectors are concerned, the shareholders atthe 68th Annual General Meeting held on 22
C R O M P TO N G R E AV E S L I M I T E D 39
02 ATTENDANCE RECORD OF THEDIRECTORS, FY2006
Name AttendanceBOARD MEETINGS LAST AGM
MR GAUTAM THAPAR 4 YES
MR SUDHIR TREHAN 3 YES
MR SUBIR BISHT* NIL NO
DR OMKAR GOSWAMI 4 YES
MR SANJAY LABROO 4 YES
MR KARAN THAPAR 4 YES
MR SATYA PAL TALWAR** 2 NA
DR VALENTIN VON MASSOW*** 1 NANotes: * Member of the Board up to 16 September 2005. ** Appointedon 14 October 2005. *** Appointed on 25 January 2006. NA: Not applicable.
TAB
LE
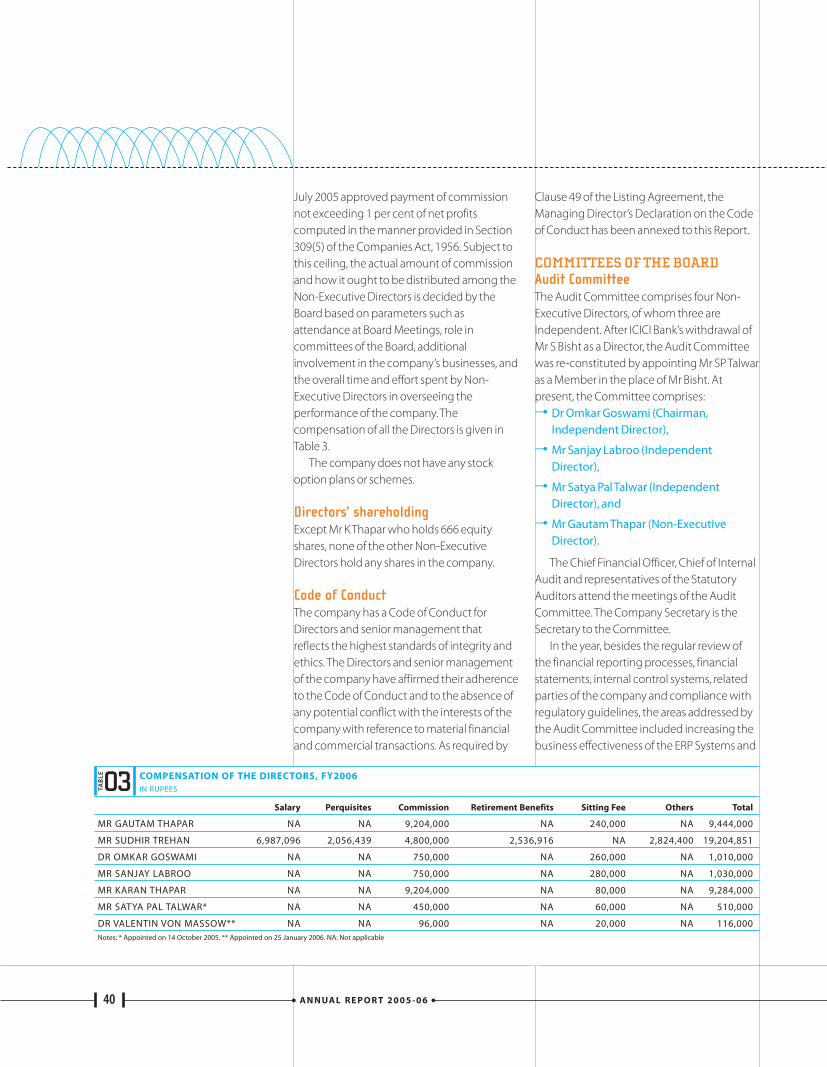
July 2005 approved payment of commissionnot exceeding 1 per cent of net profitscomputed in the manner provided in Section309(5) of the Companies Act, 1956. Subject tothis ceiling, the actual amount of commissionand how it ought to be distributed among theNon-Executive Directors is decided by theBoard based on parameters such asattendance at Board Meetings, role incommittees of the Board, additionalinvolvement in the company’s businesses, andthe overall time and effort spent by Non-Executive Directors in overseeing theperformance of the company. Thecompensation of all the Directors is given inTable 3.
The company does not have any stockoption plans or schemes.
Directors’ shareholdingExcept Mr K Thapar who holds 666 equityshares, none of the other Non-ExecutiveDirectors hold any shares in the company.
Code of ConductThe company has a Code of Conduct forDirectors and senior management thatreflects the highest standards of integrity andethics. The Directors and senior managementof the company have affirmed their adherenceto the Code of Conduct and to the absence ofany potential conflict with the interests of thecompany with reference to material financialand commercial transactions. As required by
Clause 49 of the Listing Agreement, theManaging Director’s Declaration on the Codeof Conduct has been annexed to this Report.
COMMITTEES OF THE BOARDAudit Committee The Audit Committee comprises four Non-Executive Directors, of whom three areIndependent. After ICICI Bank’s withdrawal ofMr S Bisht as a Director, the Audit Committeewas re-constituted by appointing Mr SP Talwaras a Member in the place of Mr Bisht. Atpresent, the Committee comprises:–• Dr Omkar Goswami (Chairman,
Independent Director),
–• Mr Sanjay Labroo (IndependentDirector),
–• Mr Satya Pal Talwar (IndependentDirector), and
–• Mr Gautam Thapar (Non-ExecutiveDirector).
The Chief Financial Officer, Chief of InternalAudit and representatives of the StatutoryAuditors attend the meetings of the AuditCommittee. The Company Secretary is theSecretary to the Committee.
In the year, besides the regular review ofthe financial reporting processes, financialstatements, internal control systems, relatedparties of the company and compliance withregulatory guidelines, the areas addressed bythe Audit Committee included increasing thebusiness effectiveness of the ERP Systems and
A N N UA L R E P O R T 2 0 0 5 - 0 640
03 COMPENSATION OF THE DIRECTORS, FY2006 IN RUPEES
Salary Perquisites Commission Retirement Benefits Sitting Fee Others Total
MR GAUTAM THAPAR NA NA 9,204,000 NA 240,000 NA 9,444,000
MR SUDHIR TREHAN 6,987,096 2,056,439 4,800,000 2,536,916 NA 2,824,400 19,204,851
DR OMKAR GOSWAMI NA NA 750,000 NA 260,000 NA 1,010,000
MR SANJAY LABROO NA NA 750,000 NA 280,000 NA 1,030,000
MR KARAN THAPAR NA NA 9,204,000 NA 80,000 NA 9,284,000
MR SATYA PAL TALWAR* NA NA 450,000 NA 60,000 NA 510,000
DR VALENTIN VON MASSOW** NA NA 96,000 NA 20,000 NA 116,000Notes: * Appointed on 14 October 2005. ** Appointed on 25 January 2006. NA: Not applicable
TAB
LE
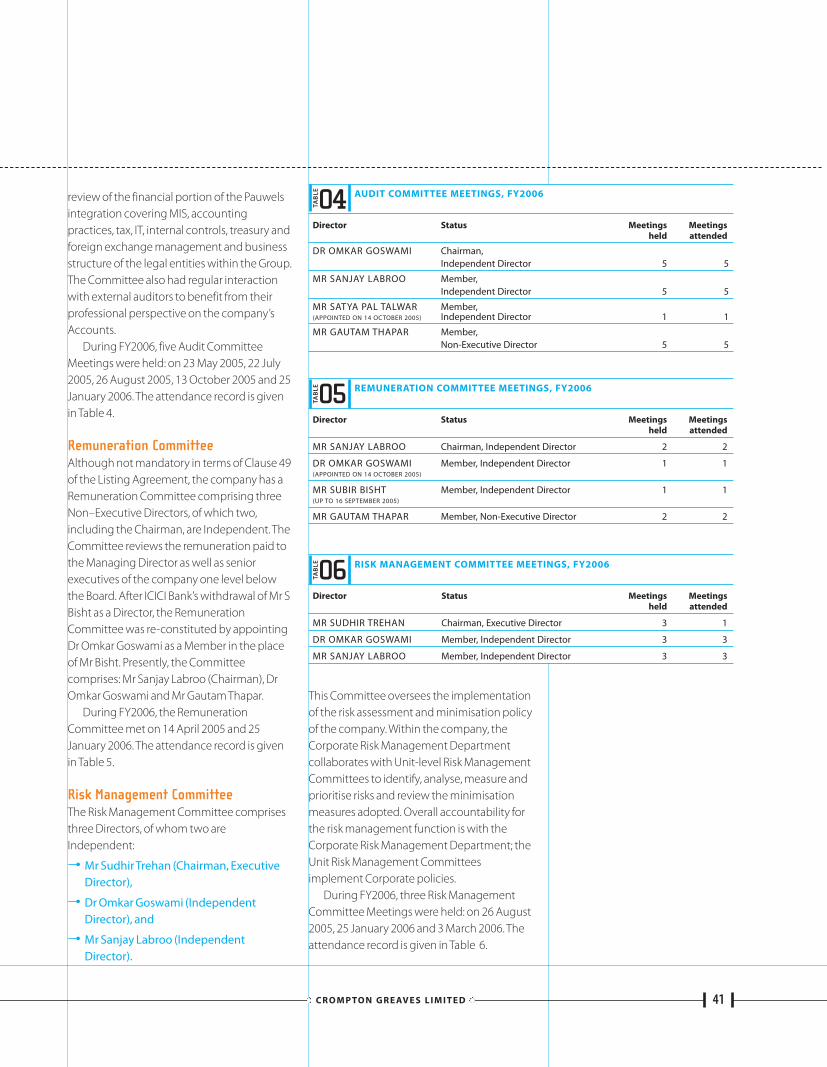
review of the financial portion of the Pauwelsintegration covering MIS, accountingpractices, tax, IT, internal controls, treasury andforeign exchange management and businessstructure of the legal entities within the Group.The Committee also had regular interactionwith external auditors to benefit from theirprofessional perspective on the company’sAccounts.
During FY2006, five Audit CommitteeMeetings were held: on 23 May 2005, 22 July2005, 26 August 2005, 13 October 2005 and 25January 2006. The attendance record is givenin Table 4.
Remuneration CommitteeAlthough not mandatory in terms of Clause 49of the Listing Agreement, the company has aRemuneration Committee comprising threeNon–Executive Directors, of which two,including the Chairman, are Independent. TheCommittee reviews the remuneration paid tothe Managing Director as well as seniorexecutives of the company one level belowthe Board. After ICICI Bank’s withdrawal of Mr SBisht as a Director, the RemunerationCommittee was re-constituted by appointingDr Omkar Goswami as a Member in the placeof Mr Bisht. Presently, the Committeecomprises: Mr Sanjay Labroo (Chairman), DrOmkar Goswami and Mr Gautam Thapar.
During FY2006, the RemunerationCommittee met on 14 April 2005 and 25January 2006. The attendance record is givenin Table 5.
Risk Management CommitteeThe Risk Management Committee comprisesthree Directors, of whom two areIndependent:
–• Mr Sudhir Trehan (Chairman, ExecutiveDirector),
–• Dr Omkar Goswami (IndependentDirector), and
–• Mr Sanjay Labroo (IndependentDirector).
This Committee oversees the implementationof the risk assessment and minimisation policyof the company. Within the company, theCorporate Risk Management Departmentcollaborates with Unit-level Risk ManagementCommittees to identify, analyse, measure andprioritise risks and review the minimisationmeasures adopted. Overall accountability forthe risk management function is with theCorporate Risk Management Department; theUnit Risk Management Committeesimplement Corporate policies.
During FY2006, three Risk ManagementCommittee Meetings were held: on 26 August2005, 25 January 2006 and 3 March 2006. Theattendance record is given in Table 6.
C R O M P TO N G R E AV E S L I M I T E D 41
04 AUDIT COMMITTEE MEETINGS, FY2006
Director Status Meetings Meetingsheld attended
DR OMKAR GOSWAMI Chairman, Independent Director 5 5
MR SANJAY LABROO Member,Independent Director 5 5
MR SATYA PAL TALWAR Member,(APPOINTED ON 14 OCTOBER 2005) Independent Director 1 1
MR GAUTAM THAPAR Member,Non-Executive Director 5 5
05 REMUNERATION COMMITTEE MEETINGS, FY2006
Director Status Meetings Meetingsheld attended
MR SANJAY LABROO Chairman, Independent Director 2 2
DR OMKAR GOSWAMI Member, Independent Director 1 1(APPOINTED ON 14 OCTOBER 2005)
MR SUBIR BISHT Member, Independent Director 1 1(UP TO 16 SEPTEMBER 2005)
MR GAUTAM THAPAR Member, Non-Executive Director 2 2
06 RISK MANAGEMENT COMMITTEE MEETINGS, FY2006
Director Status Meetings Meetingsheld attended
MR SUDHIR TREHAN Chairman, Executive Director 3 1
DR OMKAR GOSWAMI Member, Independent Director 3 3
MR SANJAY LABROO Member, Independent Director 3 3
TAB
LETA
BLE
TAB
LE
Shareholders’/Investors’ GrievanceCommitteeThe company has a Shareholders’/Investors’Grievance Committee, details of which aregiven under section “Shareholders”in thisReport.
MANAGEMENTManagement Discussion and AnalysisReport This is given as a separate Chapter in theAnnual Report.
Disclosure of material transactionsConsidering the size and nature of operations,there were no related party transactions of amaterially significant nature in terms of theListing Agreement with Stock Exchanges, thatmay have a potential conflict with the interestsof the company at large.
Accounting Policies The company has not adopted any differentaccounting treatment compared to thoseprescribed by the Accounting Standards.
Insider trading The company has comprehensive guidelinesin accordance with the SEBI Regulations in thisregard, which advise and caution theDirectors, management and executives on theprocedures to be followed whilst dealing withthe securities of the company. The InsiderTrading Code framed by the company helps inensuring compliance with theserequirements.
SHAREHOLDERSDisclosure regarding appointmentand/or re-appointment of DirectorsMr G Thapar is retiring by rotation and iseligible for re-appointment. His brief profile isgiven below:
Gautam Thapar Mr G Thapar (born in 1960) is a ChemicalEngineer from the Pratt Institute, USA, with
over 20 years of industry experience. He ispresently the Vice Chairman & ManagingDirector of Ballarpur Industries Limited andwill take over as Chairman with effect from 1July 2006. He is the Chairman of CromptonGreaves, and is also a Member of the AuditCommittee and the Chairman of theShareholders’/Investors’ GrievanceCommittee. He is a nominee of the ThaparGroup.
Mr Thapar is also leading the growthstrategy of the US$1.5 billion Thapar Groupacross its diverse businesses that includemanufacture of pulp and paper, electricalequipment and consumer electricals,industrial and performance chemicals, foodprocessing and business process outsourcing.He has served on boards and committees ofvarious industry associations and professionalbodies.
Directorships–• Ballarpur Industries Ltd
–• Bilt Paper Holdings Ltd
–• Global Green Company Ltd
–• Solaris Chem Tech Ltd
–• Greaves Cotton Ltd
–• CG Capital & Investments Ltd
–• Asahi India Glass Ltd
–• KCT Papers Ltd
–• KCT Chemicals & Electricals Ltd
–• Salient Business Solutions Ltd
–• Osian’s Connoisseurs of Art Pvt Ltd
–• Feedback Ventures Pvt Ltd
–• Vani Agencies Pvt Ltd
Committee positions–• Ballarpur Industries Ltd (1)
–• Bilt Paper Holdings Ltd (1)
–• Solaris Chem Tech Ltd (1)
–• CG Capital & Investments Ltd (1)
–• Asahi India Glass Ltd (1)
A N N UA L R E P O R T 2 0 0 5 - 0 642
Mr Satya Pal Talwar and Dr Valentin vonMassow will be considered for re-appointment at the forthcoming AnnualGeneral Meeting. Their brief profiles are givenbelow:
Satya Pal TalwarMr SP Talwar (born in 1939) has a 40-yearoperational and policy formation experiencein commercial and central banking. He wasthe Deputy Governor of the Reserve Bank ofIndia. He has held several eminent positionssuch as Chairman, Indian Banks Association,Chairman and Managing Director of severalnationalised banks and has also served on theBoards of SEBI, banks, insurance companies and financial corporations in Indiaand abroad.
Presently, Mr Talwar is a Senior Adviser withYes Bank and serves as a Member on theAdvisory Committee of the Ministry ofCompany Affairs.
Directorships–• Vemagiri Power Generation Ltd
–• Reliance Life Insurance Company Ltd
–• Reliance General Insurance Company Ltd
–• Reliance Capital Trustee Company Ltd
–• Videocon Industries Ltd
–• Reliance Capital Ventures Ltd
–• Reliance Communications Ventures Ltd
Committee positions–• Reliance Life Insurance Company Ltd (1)
–• Reliance General Insurance Company Ltd (1)
–• Reliance Capital Trustee Company Ltd (1)
Valentin von Massow Dr V von Massow (born in 1956) is an eminentprofessional and a much sought afterInternational consultant who, for 19 years, hadbeen associated with The Boston ConsultingGroup (BCG), which is amongst the mostreputed management consulting firms in the
world. During his tenure with BCG, he heldvarious senior positions, rising to VicePresident and Director of BCG Inc. Since mid-2005, Dr Massow is an independentConsultant, based in London.
Directorship–• Thermax Ltd
The attendance record of these Directors atthe Board Meetings during the year underreview is given in Table 2. None of the threeDirectors hold any shares in the company.
Communication to shareholdersThe company’s quarterly results in the formatprescribed by the Stock Exchanges areapproved and taken on record by the Boardwithin the prescribed time frame, and sentimmediately to all Stock Exchanges on whichthe company’s shares are listed. These resultsare published in leading newspapers – TheEconomic Times, Financial Express andBusiness Standard in English and theMaharashtra Times in vernacular, and are alsouploaded on the Electronic Data InformationFiling And Retrieval System (EDIFAR)maintained on-line by National InformaticsCentre (NIC), as required by the ListingAgreement with Stock Exchanges.
Information about the company in general,its financial results, and other informationincluding official press releases can beaccessed at the company’s websitewww.cglonline.com.
The company also files the followinginformation, statements, reports on EDIFAR:–• Full version of the Annual Report including
the Balance Sheet, Profit & Loss Account,Directors’Report, Auditors’Report andCash Flow Statement.
–• Corporate Governance Report.
–• Shareholding Pattern Statement.
The company further files on-line on“Firstsight”website approved by the LondonStock Exchange, information on financial
C R O M P TO N G R E AV E S L I M I T E D 43
statements and other matters as specified byit.
Meetings are held with institutionalinvestors and research analysts, as necessary.
Information on General Body Meetings The details of the last three Annual GeneralMeetings are as under:
Given below are the Special Resolutions thatwere transacted at the last three AnnualGeneral Meetings held on:
22 July 2003–• Amendment of the company’s Articles of
Association to permit utilisation ofSecurities Premium Account for anyapplication as permitted by law andapproval to the company forimplementation of a Scheme of CapitalReduction by utilising the SecuritiesPremium Account for adjustment ofmiscellaneous expenditure to the extentnot written off or adjusted, deferred taxasset, and debit balance in the Profit & LossAccount as at 31 March 2003 andvariations thereto up to 31 July 2003.
–• Voluntary delisting of the company’sshares from the Calcutta Stock ExchangeAssociation Limited, Delhi Stock ExchangeAssociation Limited and Madras StockExchange Limited.
22 July 2004No Special Resolution was passed at the 67thAnnual General Meeting held on 22 July 2004.
22 July 2005–• Commission to Non-Executive Directors.
–• Remuneration to Non-Executive Directors.
So far, the company has not adopted postalballot for passing any resolution at the generalmeetings, because there has been nooccasion for doing so.
Details of capital market non-compliance, if anyThe Company has complied with allrequirements of the Listing Agreement withStock Exchanges as well as the Regulationsand Guidelines prescribed by SEBI. There wereno penalties or strictures imposed on thecompany by any statutory authorities for non-compliance on any matter related to capitalmarkets, during the last three years.
Shareholders’/Investors’ GrievanceCommitteeThe Committee comprises Mr Gautam Thapar(Chairman) and Mr Sudhir Trehan, ManagingDirector. Mr W Henriques, the CompanySecretary, has been designated by the Boardas the Compliance Officer. During FY2006, theShareholders’/ Investors’Committee met on28 March 2006 at which meeting bothMembers were present.
The Committee reviews the redressal ofshareholders’and investors’complaints relatedto transfers and transmission of shares, non-receipt of annual reports, dividends and othershare related matters, the periodicity andeffectiveness of the share transfer process,statutory certifications, depository relatedissues and activities of the Registrar andTransfer Agent. In addition to review by thisCommittee, the company continues itsexisting practice of reporting to the Directorsat each Board Meeting, the number andcategory of shareholder complaints receivedand the status of their resolution.
The company has received 15shareholders’complaints during the financialyear, which were satisfactorily resolved; thereare no outstanding complaints or sharespending transfer as on 31 March 2006.
A N N UA L R E P O R T 2 0 0 5 - 0 644
Financial Year Location Date Time
2002-2003 PATKAR HALL, MUMBAI 400 020 22 JULY 2003 3.30 P.M.
2003-2004 PATKAR HALL, MUMBAI 400 020 22 JULY 2004 3.30 P.M.
2004-2005 PATKAR HALL, MUMBAI 400 020 22 JULY 2005 3.30 P.M.
CEO/CFO certificationThe Managing Director and Chief FinancialOfficer have signed a joint certificateaccepting responsibility for the financialstatements and confirming the effectivenessof the internal control systems, as required inClause 49 of the Listing Agreement. TheCertificate is contained in this Annual Report.
Report on Corporate GovernanceThis Chapter, read together with theinformation given in the Chapters titled“Additional Shareholder Information”,constitute the Compliance Report onCorporate Governance during FY2006.
Auditors’ certificate on CorporateGovernanceThe company has obtained a certificate fromthe auditors of the company regardingcompliance with the provisions relating toCorporate Governance laid down in Clause 49of the Listing Agreement with the StockExchanges which is attached herewith.
C R O M P TO N G R E AV E S L I M I T E D 45
ANNUAL GENERAL MEETINGDate Tuesday, 18 July 2006 Time 3.30 p.m.Venue Patkar Hall, Nathibai Thackersey Road,
New Marine Lines, Mumbai 400 020
FINANCIAL CALENDAR First Quarter Results End JulySecond Quarter Results End OctoberThird Quarter Results End JanuaryLast Quarter Results and Annual Audited Results May
DATES OF BOOK CLOSUREThe Register of Members and share transferbooks of the company will remain closed fromSaturday, 8 July 2006 to Tuesday, 18 July 2006,both days inclusive.
UNCLAIMED DIVIDENDSDividends pertaining to the financial years1998-1999, 2003-2004, 2004-2005 and 2005-2006, which remain unclaimed for a period ofseven years will be transferred to the InvestorEducation and Protection Fund. To enableshareholders to claim their dividend before itstransfer to the above Fund, the proposeddates of transfer are given below:
REGISTRAR AND AGENTSFor SharesThe share registry activities of the companyare handled by a SEBI registered Registrar andTransfer Agent – Sharepro Services (India) Pvt.Ltd, whose contact details are:
Sharepro Services (India) Pvt LtdUNIT Crompton Greaves Ltd
912, Raheja CentreFree Press Journal RoadNariman Point, Mumbai 400 021
TEL 22881568/69,22825163FAX 22825484EMAIL [email protected]
Sharepro Services (India) Pvt LtdUNIT Crompton Greaves Ltd
Satam Estate, 3rd Floor, Above Bank of Baroda, Chakala, Andheri (E), Mumbai 400 099
TEL 28215168/28215169FAX 28375646EMAIL [email protected]
To enable the company to expeditiouslyfacilitate exchange of shares (including sub-division), issue of duplicate share certificatesand dividends by our Registrar and TransferAgent, shareholders are requested to routetheir requests in these matters only throughthe company’s Investor Services Department.
For all other matters, Sharepro Services maybe contacted directly. However, thecompany’s Investor Services Department willbe happy to assist in case investors experienceany difficulties in their interaction withSharepro Services.
A N N UA L R E P O R T 2 0 0 5 - 0 646
additionalshareholderinformation
Date of Proposed Date of TransferDeclaration to the Investor Educationof Dividend and Protection Fund
23 JULY 1999 23 AUGUST 2006
28 OCTOBER 2003 28 NOVEMBER 2010
22 JULY 2004 22 AUGUST 2011
25 NOVEMBER 2004 26 DECEMBER 2011
22 MARCH 2005 22 APRIL 2012
14 OCTOBER 2005 14 NOVEMBER 2012
25 JANUARY 2006 25 FEBRUARY 2013
29 MARCH 2006 29 APRIL 2013
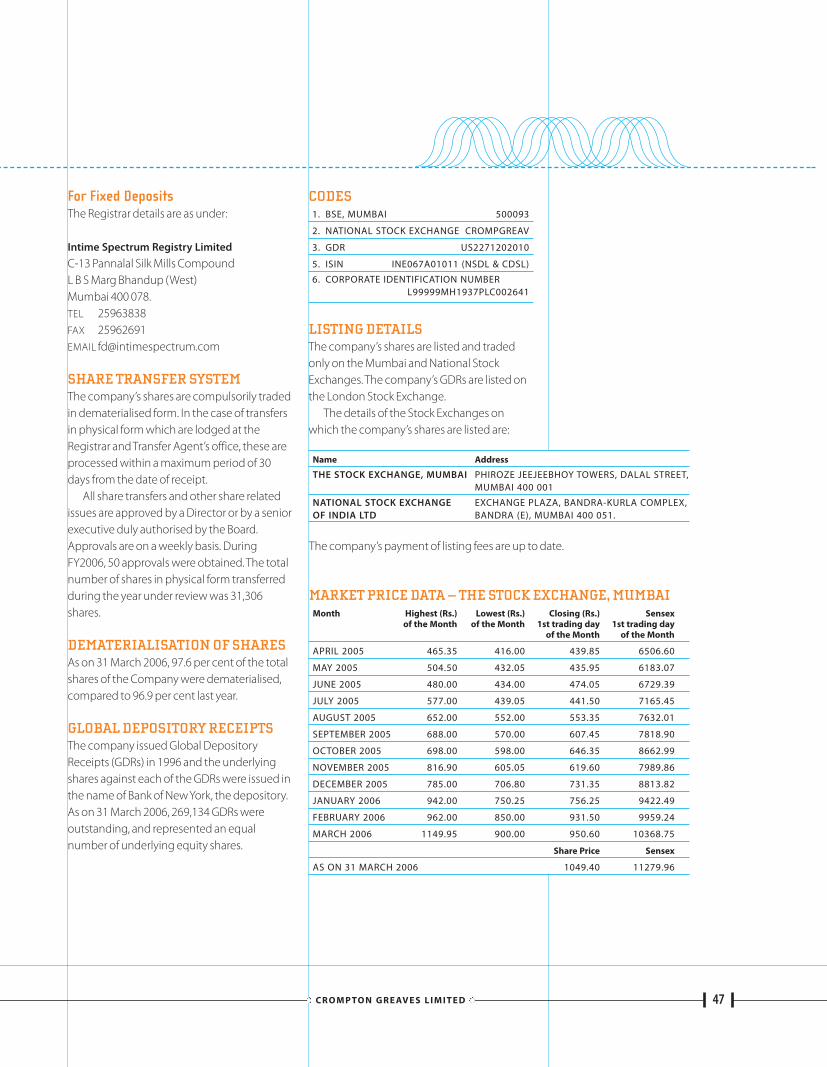
For Fixed DepositsThe Registrar details are as under:
Intime Spectrum Registry LimitedC-13 Pannalal Silk Mills CompoundL B S Marg Bhandup (West)Mumbai 400 078.TEL 25963838FAX 25962691EMAIL [email protected]
SHARE TRANSFER SYSTEMThe company’s shares are compulsorily tradedin dematerialised form. In the case of transfersin physical form which are lodged at theRegistrar and Transfer Agent’s office, these areprocessed within a maximum period of 30days from the date of receipt.
All share transfers and other share relatedissues are approved by a Director or by a seniorexecutive duly authorised by the Board.Approvals are on a weekly basis. DuringFY2006, 50 approvals were obtained. The totalnumber of shares in physical form transferredduring the year under review was 31,306shares.
DEMATERIALISATION OF SHARESAs on 31 March 2006, 97.6 per cent of the totalshares of the Company were dematerialised,compared to 96.9 per cent last year.
GLOBAL DEPOSITORY RECEIPTS The company issued Global DepositoryReceipts (GDRs) in 1996 and the underlyingshares against each of the GDRs were issued inthe name of Bank of New York, the depository.As on 31 March 2006, 269,134 GDRs wereoutstanding, and represented an equalnumber of underlying equity shares.
CODES1. BSE, MUMBAI 500093
2. NATIONAL STOCK EXCHANGE CROMPGREAV
3. GDR US2271202010
5. ISIN INE067A01011 (NSDL & CDSL)
6. CORPORATE IDENTIFICATION NUMBERL99999MH1937PLC002641
LISTING DETAILSThe company’s shares are listed and tradedonly on the Mumbai and National StockExchanges. The company’s GDRs are listed onthe London Stock Exchange.
The details of the Stock Exchanges onwhich the company’s shares are listed are:
C R O M P TO N G R E AV E S L I M I T E D 47
MARKET PRICE DATA – THE STOCK EXCHANGE, MUMBAIMonth Highest (Rs.) Lowest (Rs.) Closing (Rs.) Sensex
of the Month of the Month 1st trading day 1st trading dayof the Month of the Month
APRIL 2005 465.35 416.00 439.85 6506.60
MAY 2005 504.50 432.05 435.95 6183.07
JUNE 2005 480.00 434.00 474.05 6729.39
JULY 2005 577.00 439.05 441.50 7165.45
AUGUST 2005 652.00 552.00 553.35 7632.01
SEPTEMBER 2005 688.00 570.00 607.45 7818.90
OCTOBER 2005 698.00 598.00 646.35 8662.99
NOVEMBER 2005 816.90 605.05 619.60 7989.86
DECEMBER 2005 785.00 706.80 731.35 8813.82
JANUARY 2006 942.00 750.25 756.25 9422.49
FEBRUARY 2006 962.00 850.00 931.50 9959.24
MARCH 2006 1149.95 900.00 950.60 10368.75
Share Price Sensex
AS ON 31 MARCH 2006 1049.40 11279.96
Name Address
THE STOCK EXCHANGE, MUMBAI PHIROZE JEEJEEBHOY TOWERS, DALAL STREET, MUMBAI 400 001
NATIONAL STOCK EXCHANGE EXCHANGE PLAZA, BANDRA-KURLA COMPLEX,OF INDIA LTD BANDRA (E), MUMBAI 400 051.
The company’s payment of listing fees are up to date.
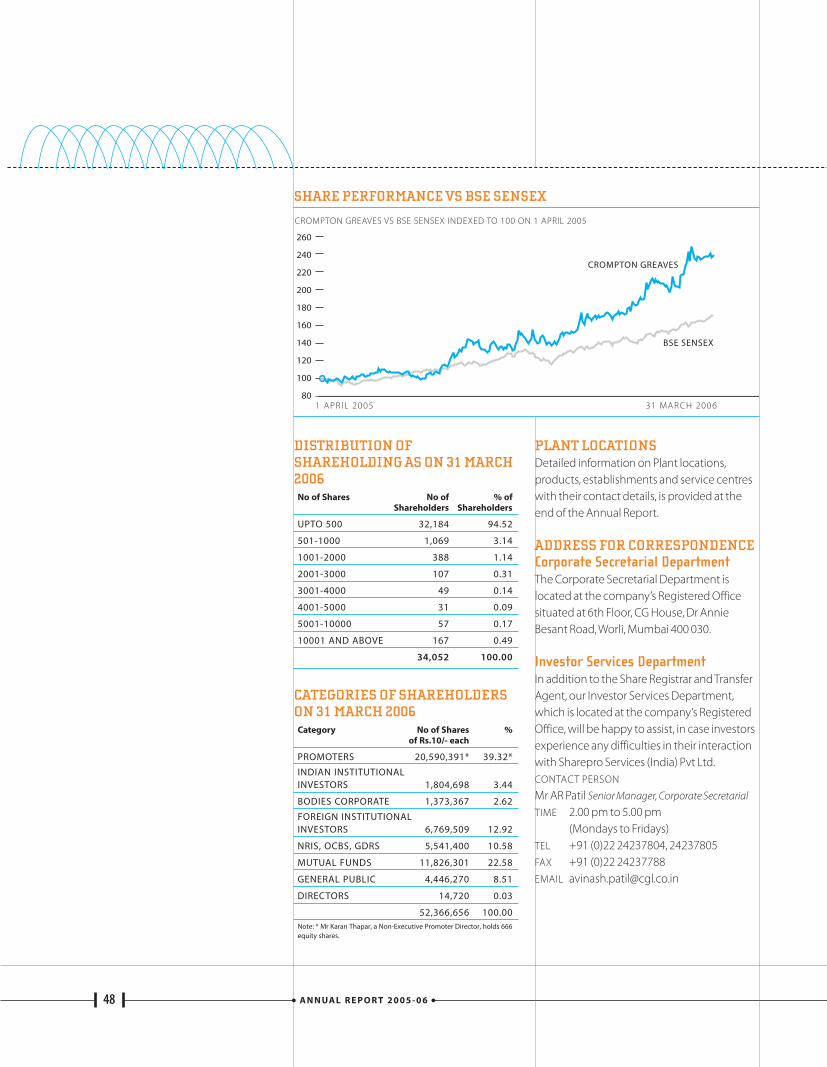
DISTRIBUTION OFSHAREHOLDING AS ON 31 MARCH2006
No of Shares No of % of Shareholders Shareholders
UPTO 500 32,184 94.52
501-1000 1,069 3.14
1001-2000 388 1.14
2001-3000 107 0.31
3001-4000 49 0.14
4001-5000 31 0.09
5001-10000 57 0.17
10001 AND ABOVE 167 0.49
34,052 100.00
CATEGORIES OF SHAREHOLDERSON 31 MARCH 2006
Category No of Shares %of Rs.10/- each
PROMOTERS 20,590,391* 39.32*
INDIAN INSTITUTIONAL INVESTORS 1,804,698 3.44
BODIES CORPORATE 1,373,367 2.62
FOREIGN INSTITUTIONAL INVESTORS 6,769,509 12.92
NRIS, OCBS, GDRS 5,541,400 10.58
MUTUAL FUNDS 11,826,301 22.58
GENERAL PUBLIC 4,446,270 8.51
DIRECTORS 14,720 0.03
52,366,656 100.00Note: * Mr Karan Thapar, a Non-Executive Promoter Director, holds 666equity shares.
PLANT LOCATIONSDetailed information on Plant locations,products, establishments and service centreswith their contact details, is provided at theend of the Annual Report.
ADDRESS FOR CORRESPONDENCECorporate Secretarial DepartmentThe Corporate Secretarial Department islocated at the company’s Registered Officesituated at 6th Floor, CG House, Dr AnnieBesant Road, Worli, Mumbai 400 030.
Investor Services DepartmentIn addition to the Share Registrar and TransferAgent, our Investor Services Department,which is located at the company’s RegisteredOffice, will be happy to assist, in case investorsexperience any difficulties in their interactionwith Sharepro Services (India) Pvt Ltd.CONTACT PERSON
Mr AR Patil Senior Manager, Corporate SecretarialTIME 2.00 pm to 5.00 pm
(Mondays to Fridays)TEL +91 (0)22 24237804, 24237805FAX +91 (0)22 24237788 EMAIL [email protected]
A N N UA L R E P O R T 2 0 0 5 - 0 648
SHARE PERFORMANCE VS BSE SENSEX
NON-MANDATORYREQUIREMENTSThe company has implemented the followingnon-mandatory requirements recommendedunder Clause 49 of the Listing Agreement:
Chairman’s OfficeA Chairman’s Office with requisite facilities isprovided and maintained at the company’sexpense for use by its Non-ExecutiveChairman. The company also reimburses allexpenses incurred in his furthering thecompany’s business interests.
Audit Qualifications & JustificationThe only audit qualification pertains to noprovision for excise and sales tax demands ason 31 March 2006, aggregating to Rs.59.3million (net of tax). The company has filedappeals against the orders passed. Since it hasenough legal merits in its favour, the companyis confident that these demands will bedecided in its favour. Hence, no provision hasbeen considered necessary. The managementis of the opinion that such a non-provisiondoes not impact the true and fair view of theunderlying business transactions.
Remuneration CommitteeA Remuneration Committee comprising threeNon-Executive Directors is already functional,for review and decisions on remunerationpackages of the Managing Director and keysenior executives of the Company.
Financial ResultsFinancial results as published in thenewspapers are made available to theshareholders on request.
On behalf of the Board of Directors
Mumbai G Thapar23 May 2006 Chairman
CERTIFICATE ON CORPORATEGOVERNANCE
ToThe MembersCrompton Greaves LimitedCG House, Dr Annie Besant RoadWorli, Mumbai 400 030
Dear Sirs,
We have reviewed the implementation of therequirements of Corporate Governance by thecompany, as prescribed by the ListingAgreement with Stock Exchanges, for the yearended 31 March 2006, with the relevantrecords and other documents maintained bythe company, furnished to us for our reviewand the report on Corporate Governance asapproved by the Board of Directors.
On the basis of the above and according to theinformation and explanations given to us, inour opinion, the company has complied withClause 49 of the Listing Agreement with StockExchanges, in respect thereof.
For Sharp & TannanChartered Accountants
Mumbai L Vaidyanathan23 May 2006 Partner
C R O M P TO N G R E AV E S L I M I T E D 49
DECLARATION OF COMPLIANCEWITH CODE OF CONDUCTThis is to certify that all the Members of theBoard of Directors and Senior Management(i.e. one level below the Executive Directors i.e.Vice President level in the company) of thecompany, have confirmed compliance withthe company’s Code of Conduct during April2005 to March 2006.
The company’s Code requires everyMember of the Board and SeniorManagement to: –• Fulfill the functions of their office with
integrity as well as professionalism andexercise the powers attached thereto, withdue care and diligence.
–• Act in the best interests of, and fulfill theirfiduciary obligations to the company’sshareholders, whilst also considering theinterests of other stakeholders.
–• Take informed business decisions basedon independent judgment and in the bestinterests of the company, not influencedby personal interest or gain.
–• Respect the confidentiality of informationand use utmost discretion whilst decidingits disclosure or dissemination, ensuringthat no personal advantage or detrimentto the company results from the same.
–• Make available to, and share informationwith fellow Directors/Executives whenconsidered expedient in the best interestsof the company.
–• Protect and use the company’s assets forlegitimate business purposes and be alertto situations that could lead to loss ormisuse of these assets.
–• Minimise any situation or action that cancreate conflict of interests of the companyvis-à-vis personal interest or interests ofassociated persons, and make adequatedisclosures, where necessary.
–• Act in a manner that will protect thecompany’s reputation.
–• Encourage reporting of behaviour, whichis contrary to the company’s “Values”, andensure that the person reporting suchviolation is not aggrieved in any manner.
–• Comply, in letter and spirit, with allapplicable laws, rules and regulations, andalso honour the philosophy of “good faith”,guided by one’s sense of right and wrong.
–• Abide by the relevant terms of the InsiderTrading Code formulated by the company,and any other Code that may beformulated from time to time, asapplicable.
–• Adhere to the terms of the powersdelegated by the Board.
–• Whilst entering into contracts with ServiceProviders and Consultants, protect thearrangement for disclosure ordissemination of confidential information.
–• Establish processes and systems forstorage, retrieval and dissemination ofdocuments, both in physical andelectronic form, so that the obligations ofthis Code of Conduct are fulfilled.
–• Raise concerns, if any, on the above issues,at a Board Meeting.
Mumbai SM Trehan23 May 2006 Managing Director
A N N UA L R E P O R T 2 0 0 5 - 0 650
C R O M P TO N G R E AV E S L I M I T E D 51
MANAGING DIRECTOR’S AND CHIEF FINANCIAL OFFICER’SCERTIFICATE ON CORPORATE GOVERNANCE
ToThe Board of DirectorsCrompton Greaves Limited
C E R T I F I C A T E
We have reviewed financial statements and the cash flow statement of Crompton GreavesLimited for FY 2006, and certify that:
(a) These statements to the best of our knowledge and belief:(i) do not contain any materially untrue statements or omit any material facts or contain
statements that might be misleading;(ii) present a true and fair view of the company’s affairs and are in compliance with existing
accounting standards, applicable laws and regulations.
(b) To the best of our knowledge and belief, there are no transactions entered into by theDirectors and senior management during the year, which are fraudulent, illegal or violative ofthe company’s Code of Conduct.
(c) We accept responsibility for establishing and maintaining internal controls for financialreporting and have evaluated the effectiveness of the internal control systems of thecompany for such reporting. We have disclosed to the Auditors and the Audit Committee,deficiencies, if any, in the design or operation of such internal controls, of which we areaware, and the steps taken and/or proposed to be taken to rectify these deficiencies.
(d) We have also indicated to the Auditors and the Audit Committee:(i) significant changes in the internal controls with respect to financial reporting during the
year and the achievement of adequate internal controls within SAP; (ii) significant changes in accounting policies during the year, and these have been
disclosed in the notes to the financial statements.
(e) To the best of our knowledge and belief, there are no instances of significant fraud involvingeither the management or employees having a significant role in the company’s internalcontrol systems with respect to financial reporting.
Mumbai SM Trehan BR Jaju23 May 2006 Managing Director Chief Financial Officer
52 A N N UA L R E P O R T 2 0 0 5 - 0 6
CromptonGreavesFinancials
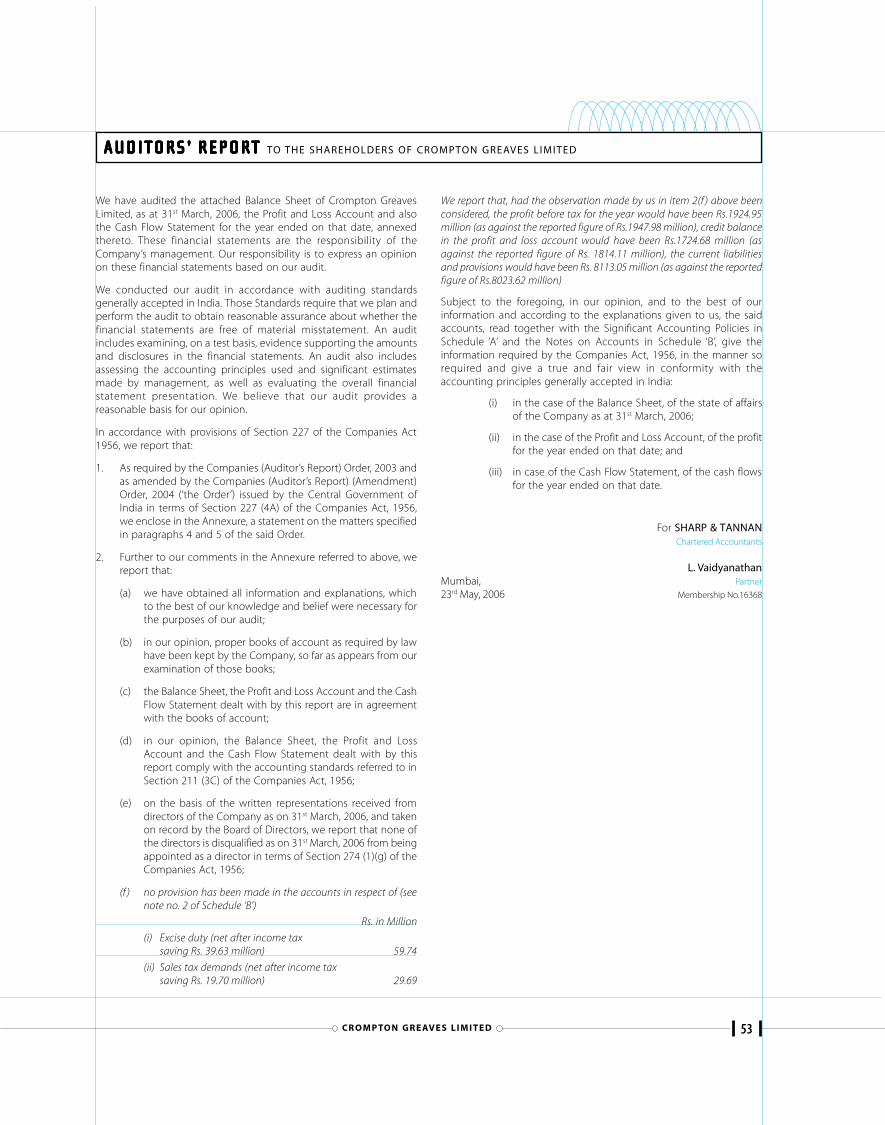
53CR O M P TO N G R E AV E S L I M I T E D
AUDITORSAUDITORSAUDITORSAUDITORSAUDITORS ’’’’’ REPORT REPORT REPORT REPORT REPORT TO THE SHAREHOLDERS OF CROMPTON GREAVES L IMITED
We have audited the attached Balance Sheet of Crompton GreavesLimited, as at 31st March, 2006, the Profit and Loss Account and alsothe Cash Flow Statement for the year ended on that date, annexedthereto. These financial statements are the responsibility of theCompany’s management. Our responsibility is to express an opinionon these financial statements based on our audit.
We conducted our audit in accordance with auditing standardsgenerally accepted in India. Those Standards require that we plan andperform the audit to obtain reasonable assurance about whether thefinancial statements are free of material misstatement. An auditincludes examining, on a test basis, evidence supporting the amountsand disclosures in the financial statements. An audit also includesassessing the accounting principles used and significant estimatesmade by management, as well as evaluating the overall financialstatement presentation. We believe that our audit provides areasonable basis for our opinion.
In accordance with provisions of Section 227 of the Companies Act1956, we report that:
1. As required by the Companies (Auditor’s Report) Order, 2003 andas amended by the Companies (Auditor’s Report) (Amendment)Order, 2004 (‘the Order’) issued by the Central Government ofIndia in terms of Section 227 (4A) of the Companies Act, 1956,we enclose in the Annexure, a statement on the matters specifiedin paragraphs 4 and 5 of the said Order.
2. Further to our comments in the Annexure referred to above, wereport that:
(a) we have obtained all information and explanations, whichto the best of our knowledge and belief were necessary forthe purposes of our audit;
(b) in our opinion, proper books of account as required by lawhave been kept by the Company, so far as appears from ourexamination of those books;
(c) the Balance Sheet, the Profit and Loss Account and the CashFlow Statement dealt with by this report are in agreementwith the books of account;
(d) in our opinion, the Balance Sheet, the Profit and LossAccount and the Cash Flow Statement dealt with by thisreport comply with the accounting standards referred to inSection 211 (3C) of the Companies Act, 1956;
(e) on the basis of the written representations received fromdirectors of the Company as on 31st March, 2006, and takenon record by the Board of Directors, we report that none ofthe directors is disqualified as on 31st March, 2006 from beingappointed as a director in terms of Section 274 (1)(g) of theCompanies Act, 1956;
(f ) no provision has been made in the accounts in respect of (seenote no. 2 of Schedule ‘B’)
Rs. in Million
(i) Excise duty (net after income taxsaving Rs. 39.63 million) 59.74
(ii) Sales tax demands (net after income taxsaving Rs. 19.70 million) 29.69
We report that, had the observation made by us in item 2(f ) above beenconsidered, the profit before tax for the year would have been Rs.1924.95million (as against the reported figure of Rs.1947.98 million), credit balancein the profit and loss account would have been Rs.1724.68 million (asagainst the reported figure of Rs. 1814.11 million), the current liabilitiesand provisions would have been Rs. 8113.05 million (as against the reportedfigure of Rs.8023.62 million)
Subject to the foregoing, in our opinion, and to the best of ourinformation and according to the explanations given to us, the saidaccounts, read together with the Significant Accounting Policies inSchedule ‘A’ and the Notes on Accounts in Schedule ‘B’, give theinformation required by the Companies Act, 1956, in the manner sorequired and give a true and fair view in conformity with theaccounting principles generally accepted in India:
(i) in the case of the Balance Sheet, of the state of affairsof the Company as at 31st March, 2006;
(ii) in the case of the Profit and Loss Account, of the profitfor the year ended on that date; and
(iii) in case of the Cash Flow Statement, of the cash flowsfor the year ended on that date.
For SHARP & TANNANChartered Accountants
L. VaidyanathanMumbai, Partner
23rd May, 2006 Membership No.16368
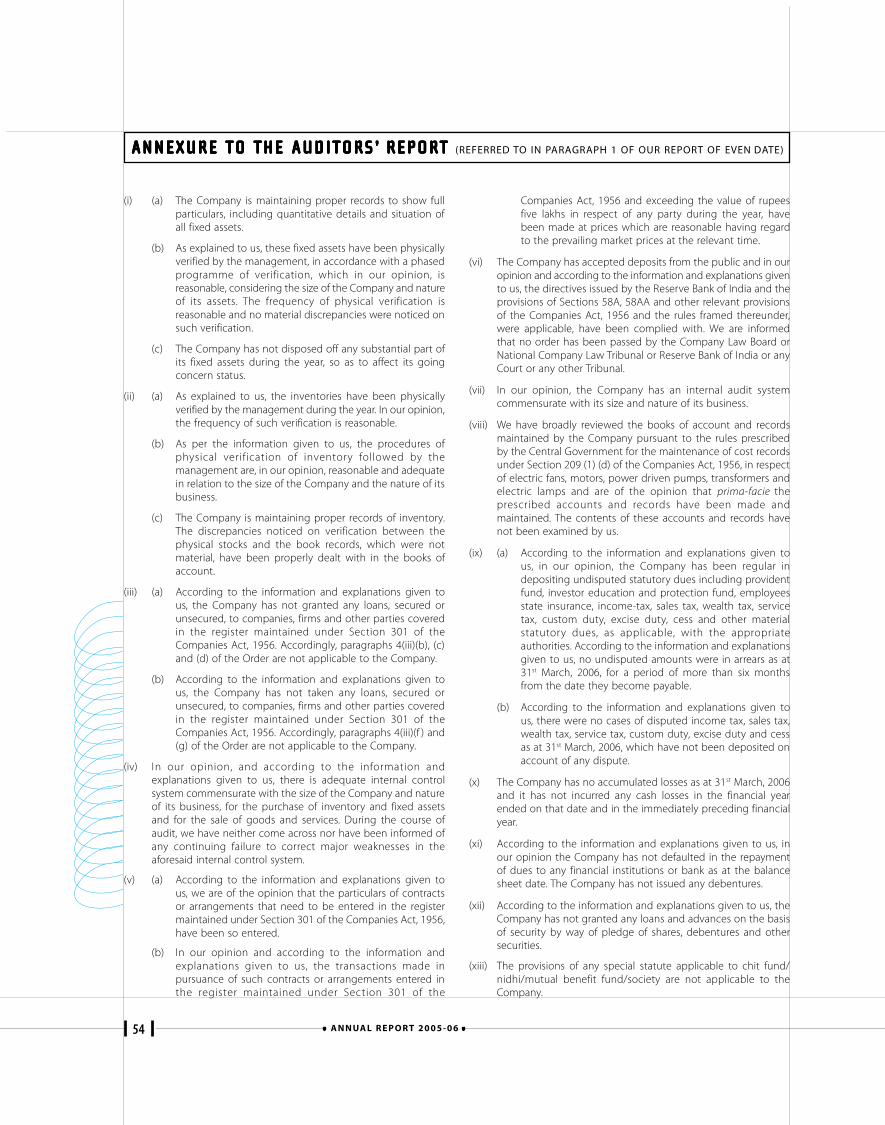
54 A N N UA L R E P O R T 2 0 0 5 - 0 6
Companies Act, 1956 and exceeding the value of rupeesfive lakhs in respect of any party during the year, havebeen made at prices which are reasonable having regardto the prevailing market prices at the relevant time.
(vi) The Company has accepted deposits from the public and in ouropinion and according to the information and explanations givento us, the directives issued by the Reserve Bank of India and theprovisions of Sections 58A, 58AA and other relevant provisionsof the Companies Act, 1956 and the rules framed thereunder,were applicable, have been complied with. We are informedthat no order has been passed by the Company Law Board orNational Company Law Tribunal or Reserve Bank of India or anyCourt or any other Tribunal.
(vii) In our opinion, the Company has an internal audit systemcommensurate with its size and nature of its business.
(viii) We have broadly reviewed the books of account and recordsmaintained by the Company pursuant to the rules prescribedby the Central Government for the maintenance of cost recordsunder Section 209 (1) (d) of the Companies Act, 1956, in respectof electric fans, motors, power driven pumps, transformers andelectric lamps and are of the opinion that prima-facie theprescribed accounts and records have been made andmaintained. The contents of these accounts and records havenot been examined by us.
(ix) (a) According to the information and explanations given tous, in our opinion, the Company has been regular indepositing undisputed statutory dues including providentfund, investor education and protection fund, employeesstate insurance, income-tax, sales tax, wealth tax, servicetax, custom duty, excise duty, cess and other materialstatutory dues, as applicable, with the appropriateauthorities. According to the information and explanationsgiven to us, no undisputed amounts were in arrears as at31st March, 2006, for a period of more than six monthsfrom the date they become payable.
(b) According to the information and explanations given tous, there were no cases of disputed income tax, sales tax,wealth tax, service tax, custom duty, excise duty and cessas at 31st March, 2006, which have not been deposited onaccount of any dispute.
(x) The Company has no accumulated losses as at 31st March, 2006and it has not incurred any cash losses in the financial yearended on that date and in the immediately preceding financialyear.
(xi) According to the information and explanations given to us, inour opinion the Company has not defaulted in the repaymentof dues to any financial institutions or bank as at the balancesheet date. The Company has not issued any debentures.
(xii) According to the information and explanations given to us, theCompany has not granted any loans and advances on the basisof security by way of pledge of shares, debentures and othersecurities.
(xiii) The provisions of any special statute applicable to chit fund/nidhi/mutual benefit fund/society are not applicable to theCompany.
ANNEXURE TO THE AUDITORSANNEXURE TO THE AUDITORSANNEXURE TO THE AUDITORSANNEXURE TO THE AUDITORSANNEXURE TO THE AUDITORS ’’’’’ REPORT REPORT REPORT REPORT REPORT (REFERRED TO IN PARAGRAPH 1 OF OUR REPORT OF EVEN DATE)
(i) (a) The Company is maintaining proper records to show fullparticulars, including quantitative details and situation ofall fixed assets.
(b) As explained to us, these fixed assets have been physicallyverified by the management, in accordance with a phasedprogramme of verification, which in our opinion, isreasonable, considering the size of the Company and natureof its assets. The frequency of physical verification isreasonable and no material discrepancies were noticed onsuch verification.
(c) The Company has not disposed off any substantial part ofits fixed assets during the year, so as to affect its goingconcern status.
(ii) (a) As explained to us, the inventories have been physicallyverified by the management during the year. In our opinion,the frequency of such verification is reasonable.
(b) As per the information given to us, the procedures ofphysical verification of inventory followed by themanagement are, in our opinion, reasonable and adequatein relation to the size of the Company and the nature of itsbusiness.
(c) The Company is maintaining proper records of inventory.The discrepancies noticed on verification between thephysical stocks and the book records, which were notmaterial, have been properly dealt with in the books ofaccount.
(iii) (a) According to the information and explanations given tous, the Company has not granted any loans, secured orunsecured, to companies, firms and other parties coveredin the register maintained under Section 301 of theCompanies Act, 1956. Accordingly, paragraphs 4(iii)(b), (c)and (d) of the Order are not applicable to the Company.
(b) According to the information and explanations given tous, the Company has not taken any loans, secured orunsecured, to companies, firms and other parties coveredin the register maintained under Section 301 of theCompanies Act, 1956. Accordingly, paragraphs 4(iii)(f ) and(g) of the Order are not applicable to the Company.
(iv) In our opinion, and according to the information andexplanations given to us, there is adequate internal controlsystem commensurate with the size of the Company and natureof its business, for the purchase of inventory and fixed assetsand for the sale of goods and services. During the course ofaudit, we have neither come across nor have been informed ofany continuing failure to correct major weaknesses in theaforesaid internal control system.
(v) (a) According to the information and explanations given tous, we are of the opinion that the particulars of contractsor arrangements that need to be entered in the registermaintained under Section 301 of the Companies Act, 1956,have been so entered.
(b) In our opinion and according to the information andexplanations given to us, the transactions made inpursuance of such contracts or arrangements entered inthe register maintained under Section 301 of the
55CR O M P TO N G R E AV E S L I M I T E D
ANNEXURE TO THE AUDITORSANNEXURE TO THE AUDITORSANNEXURE TO THE AUDITORSANNEXURE TO THE AUDITORSANNEXURE TO THE AUDITORS ’’’’’ REPORT REPORT REPORT REPORT REPORT (Contd.)
(xiv) In our opinion and according to the information andexplanations given to us, the Company is not dealing in ortrading in securities. The Company has invested surplus fund inmutual funds. According to the information and explanationsgiven to us, proper records have been made of the transactionsand contracts and timely entries have been made therein. Theinvestments in mutual funds have been held by the Companyin its own name.
(xv) In our opinion and according to the information andexplanations given to us, the terms and conditions of guaranteegiven by the Company for loans taken by others from banks orfinancial institutions are not prima facie prejudicial to the interestsof the Company except for guarantee given to Power EquipmentLimited, where no details were available for our comment.
(xvi) In our opinion and according to the information andexplanations given to us, the term loans have been applied forthe purposes for which they were obtained.
(xvii) According to the information and explanations given to us andon overall examination of the balance sheet of the Company,we report that no funds raised on short-term basis have beenused for long-term investments.
(xviii) The Company has not made any preferential allotment of shares
to parties or companies covered in the register maintained underSection 301 of the Companies Act, 1956, during the year.
(xix) The Company has not issued any debentures during the year.Hence, reporting on paragraph 4 (xix) of the Order pertaining tocreation of security or charge for debentures does not arise.
(xx) The Company has not raised any money by public issues duringthe year. Accordingly, paragraph 4 (xx) of The Order is notapplicable to the Company.
(xxi) During the course of our examination of books and records ofthe company, carried out in accordance with the generallyaccepted auditing practices in India, and according to theinformation and explanations given to us, we have neither comeacross any instances of material fraud on or by the Company,noticed or reported during the year, nor have we been informedof such case by the management.
For SHARP & TANNANChartered Accountants
L. VaidyanathanMumbai, Partner
23rd May, 2006 Membership No.16368
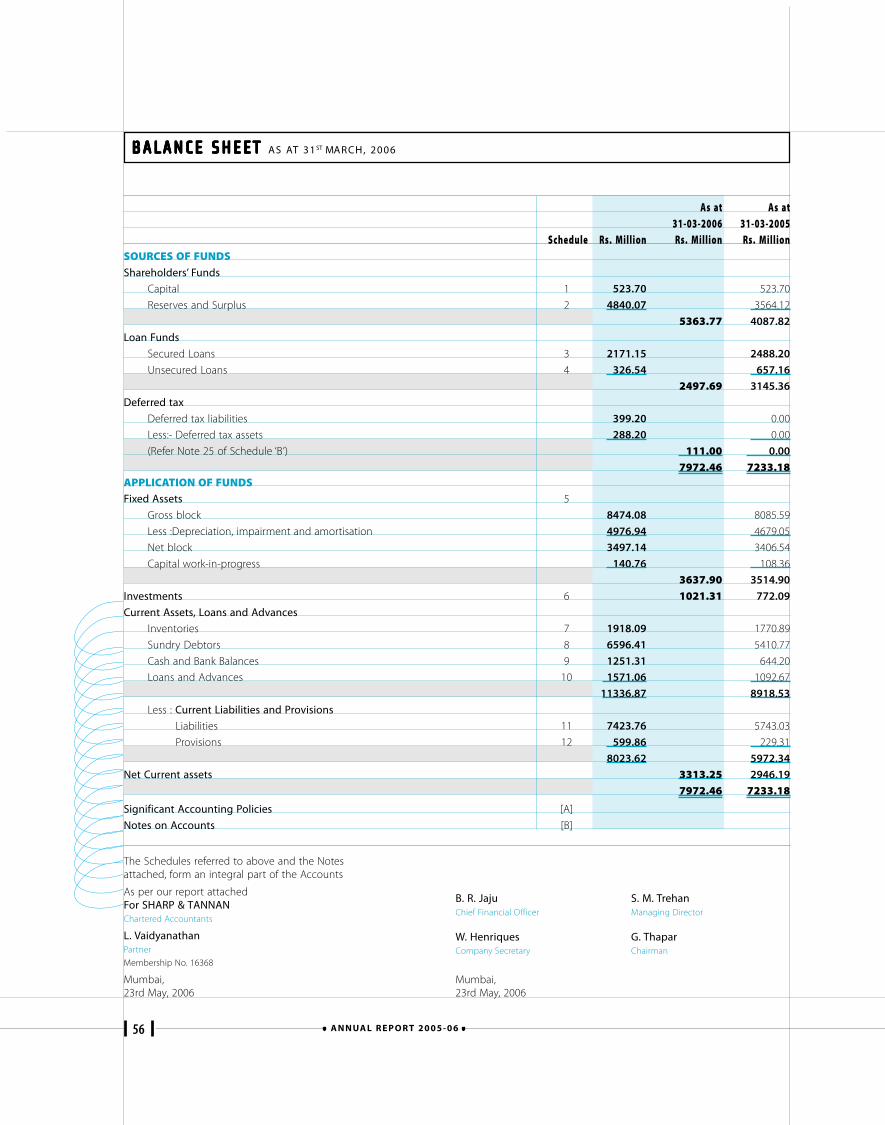
56 A N N UA L R E P O R T 2 0 0 5 - 0 6
BALANCE SHEETBALANCE SHEETBALANCE SHEETBALANCE SHEETBALANCE SHEET AS AT 31 ST MARCH, 2006
As at As at31-03-2006 31-03-2005
Schedule Rs. Million Rs. Million Rs. MillionSOURCES OF FUNDSShareholders’ Funds
Capital 1 523.70 523.70
Reserves and Surplus 2 4840.07 3564.12
5363.77 4087.82
Loan Funds
Secured Loans 3 2171.15 2488.20
Unsecured Loans 4 326.54 657.16
2497.69 3145.36
Deferred tax
Deferred tax liabilities 399.20 0.00
Less:- Deferred tax assets 288.20 0.00
(Refer Note 25 of Schedule ‘B’) 111.00 0.00
7972.46 7233.18APPLICATION OF FUNDSFixed Assets 5
Gross block 8474.08 8085.59
Less :Depreciation, impairment and amortisation 4976.94 4679.05
Net block 3497.14 3406.54
Capital work-in-progress 140.76 108.36
3637.90 3514.90
Investments 6 1021.31 772.09
Current Assets, Loans and Advances
Inventories 7 1918.09 1770.89
Sundry Debtors 8 6596.41 5410.77
Cash and Bank Balances 9 1251.31 644.20
Loans and Advances 10 1571.06 1092.67
11336.87 8918.53
Less : Current Liabilities and Provisions
Liabilities 11 7423.76 5743.03
Provisions 12 599.86 229.31
8023.62 5972.34
Net Current assets 3313.25 2946.19
7972.46 7233.18
Significant Accounting Policies [A]
Notes on Accounts [B]
B. R. Jaju S. M. TrehanChief Financial Officer Managing Director
W. Henriques G. ThaparCompany Secretary Chairman
Mumbai,23rd May, 2006
The Schedules referred to above and the Notesattached, form an integral part of the Accounts
As per our report attachedFor SHARP & TANNANChartered Accountants
L. VaidyanathanPartner
Membership No. 16368
Mumbai,23rd May, 2006
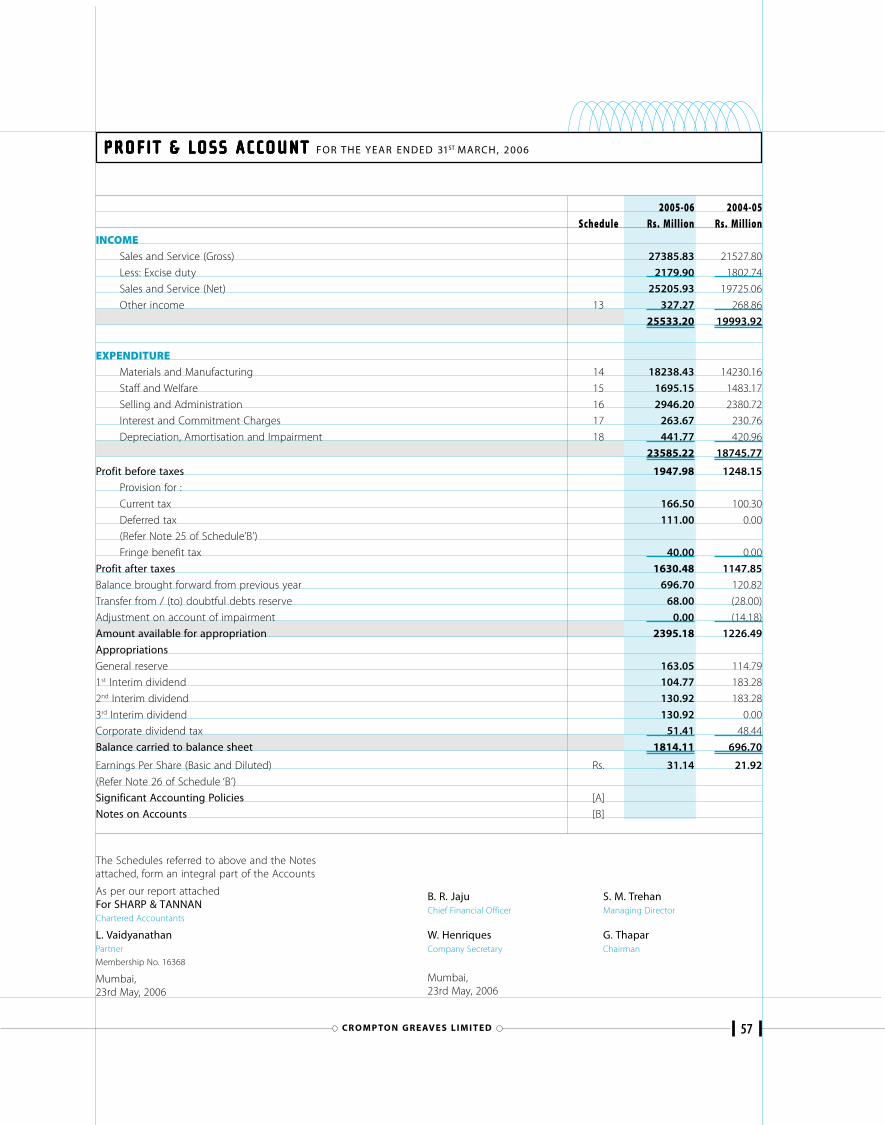
57CR O M P TO N G R E AV E S L I M I T E D
2005-06 2004-05Schedule Rs. Million Rs. Million
INCOMESales and Service (Gross) 27385.83 21527.80
Less: Excise duty 2179.90 1802.74
Sales and Service (Net) 25205.93 19725.06
Other income 13 327.27 268.86
25533.20 19993.92
EXPENDITUREMaterials and Manufacturing 14 18238.43 14230.16
Staff and Welfare 15 1695.15 1483.17
Selling and Administration 16 2946.20 2380.72
Interest and Commitment Charges 17 263.67 230.76
Depreciation, Amortisation and Impairment 18 441.77 420.96
23585.22 18745.77
Profit before taxes 1947.98 1248.15
Provision for :
Current tax 166.50 100.30
Deferred tax 111.00 0.00
(Refer Note 25 of Schedule’B’)
Fringe benefit tax 40.00 0.00
Profit after taxes 1630.48 1147.85
Balance brought forward from previous year 696.70 120.82
Transfer from / (to) doubtful debts reserve 68.00 (28.00)
Adjustment on account of impairment 0.00 (14.18)
Amount available for appropriation 2395.18 1226.49
Appropriations
General reserve 163.05 114.79
1st Interim dividend 104.77 183.28
2nd Interim dividend 130.92 183.28
3rd Interim dividend 130.92 0.00
Corporate dividend tax 51.41 48.44
Balance carried to balance sheet 1814.11 696.70
Earnings Per Share (Basic and Diluted) Rs. 31.14 21.92
(Refer Note 26 of Schedule ‘B’)
Significant Accounting Policies [A]
Notes on Accounts [B]
PROFIT & LOSS ACCOUNTPROFIT & LOSS ACCOUNTPROFIT & LOSS ACCOUNTPROFIT & LOSS ACCOUNTPROFIT & LOSS ACCOUNT FOR THE YEAR ENDED 31ST MARCH, 2006
B. R. Jaju S. M. TrehanChief Financial Officer Managing Director
W. Henriques G. ThaparCompany Secretary Chairman
Mumbai,23rd May, 2006
The Schedules referred to above and the Notesattached, form an integral part of the Accounts
As per our report attachedFor SHARP & TANNANChartered Accountants
L. VaidyanathanPartner
Membership No. 16368
Mumbai,23rd May, 2006
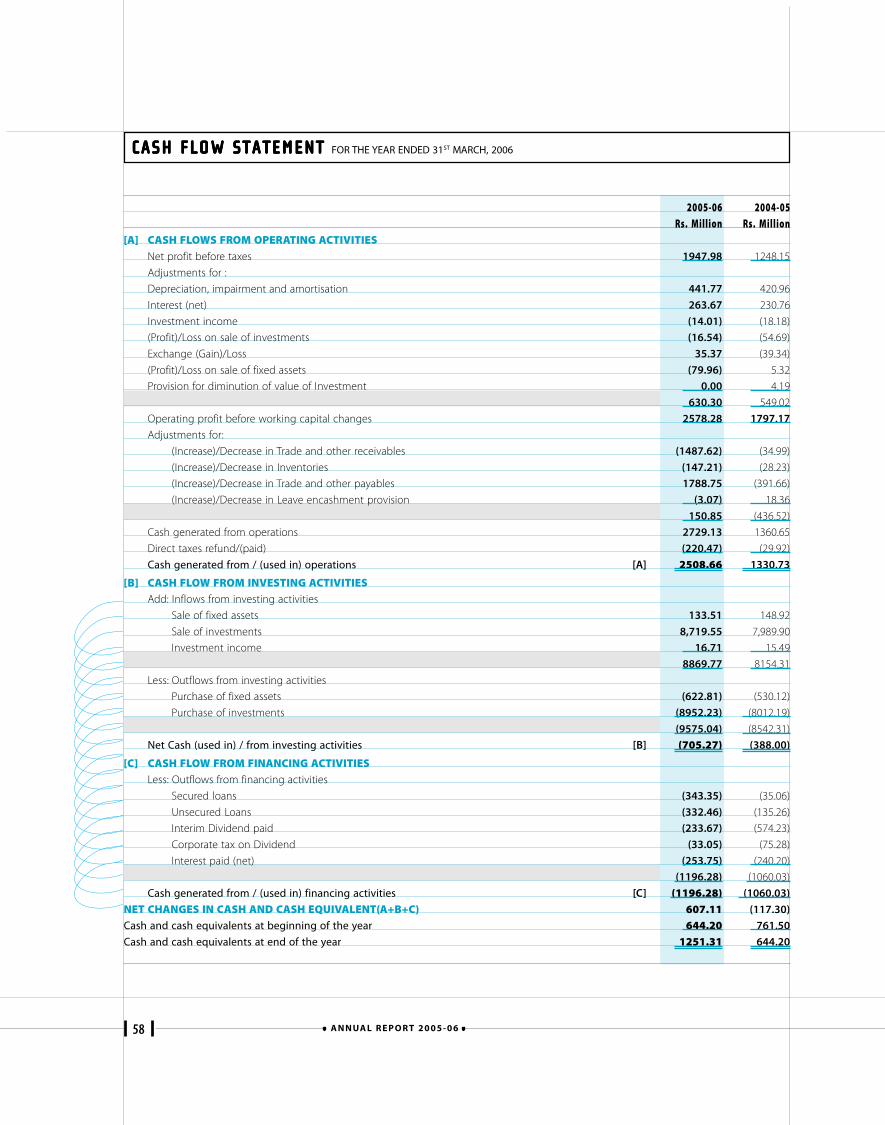
58 A N N UA L R E P O R T 2 0 0 5 - 0 6
CASH FLOW STATEMENTCASH FLOW STATEMENTCASH FLOW STATEMENTCASH FLOW STATEMENTCASH FLOW STATEMENT FOR THE YEAR ENDED 31ST MARCH, 2006
2005-06 2004-05Rs. Million Rs. Million
[A] CASH FLOWS FROM OPERATING ACTIVITIESNet profit before taxes 1947.98 1248.15
Adjustments for :
Depreciation, impairment and amortisation 441.77 420.96
Interest (net) 263.67 230.76
Investment income (14.01) (18.18)
(Profit)/Loss on sale of investments (16.54) (54.69)
Exchange (Gain)/Loss 35.37 (39.34)
(Profit)/Loss on sale of fixed assets (79.96) 5.32
Provision for diminution of value of Investment 0.00 4.19
630.30 549.02
Operating profit before working capital changes 2578.28 1797.17
Adjustments for:
(Increase)/Decrease in Trade and other receivables (1487.62) (34.99)
(Increase)/Decrease in Inventories (147.21) (28.23)
(Increase)/Decrease in Trade and other payables 1788.75 (391.66)
(Increase)/Decrease in Leave encashment provision (3.07) 18.36
150.85 (436.52)
Cash generated from operations 2729.13 1360.65
Direct taxes refund/(paid) (220.47) (29.92)
Cash generated from / (used in) operations [A] 2508.66 1330.73
[B] CASH FLOW FROM INVESTING ACTIVITIESAdd: Inflows from investing activities
Sale of fixed assets 133.51 148.92
Sale of investments 8,719.55 7,989.90
Investment income 16.71 15.49
8869.77 8154.31
Less: Outflows from investing activities
Purchase of fixed assets (622.81) (530.12)
Purchase of investments (8952.23) (8012.19)
(9575.04) (8542.31)
Net Cash (used in) / from investing activities [B] (705.27) (388.00)
[C] CASH FLOW FROM FINANCING ACTIVITIESLess: Outflows from financing activities
Secured loans (343.35) (35.06)
Unsecured Loans (332.46) (135.26)
Interim Dividend paid (233.67) (574.23)
Corporate tax on Dividend (33.05) (75.28)
Interest paid (net) (253.75) (240.20)
(1196.28) (1060.03)
Cash generated from / (used in) financing activities [C] (1196.28) (1060.03)
NET CHANGES IN CASH AND CASH EQUIVALENT(A+B+C) 607.11 (117.30)
Cash and cash equivalents at beginning of the year 644.20 761.50
Cash and cash equivalents at end of the year 1251.31 644.20
59CR O M P TO N G R E AV E S L I M I T E D
NOTES:
1 The cash flow statement has been prepared under the indirect method as set out in Accounting Standard (AS) - 3 ‘Cash Flow Statements’issued by the Institute of Chartered Accountants of India.
2 Additions to fixed assets includes movements of capital work-in-progress during the year
3 Figures for the previous year have been re-grouped/re-classified wherever necessary.
CASH FLOW STATEMENTCASH FLOW STATEMENTCASH FLOW STATEMENTCASH FLOW STATEMENTCASH FLOW STATEMENT FOR THE YEAR ENDED 31ST MARCH, 2006 (contd.)
B. R. Jaju S. M. TrehanChief Financial Officer Managing Director
W. Henriques G. ThaparCompany Secretary Chairman
Mumbai,23rd May, 2006
As per our report attachedFor SHARP & TANNANChartered Accountants
L. VaidyanathanPartner
Membership No. 16368
Mumbai,23rd May, 2006
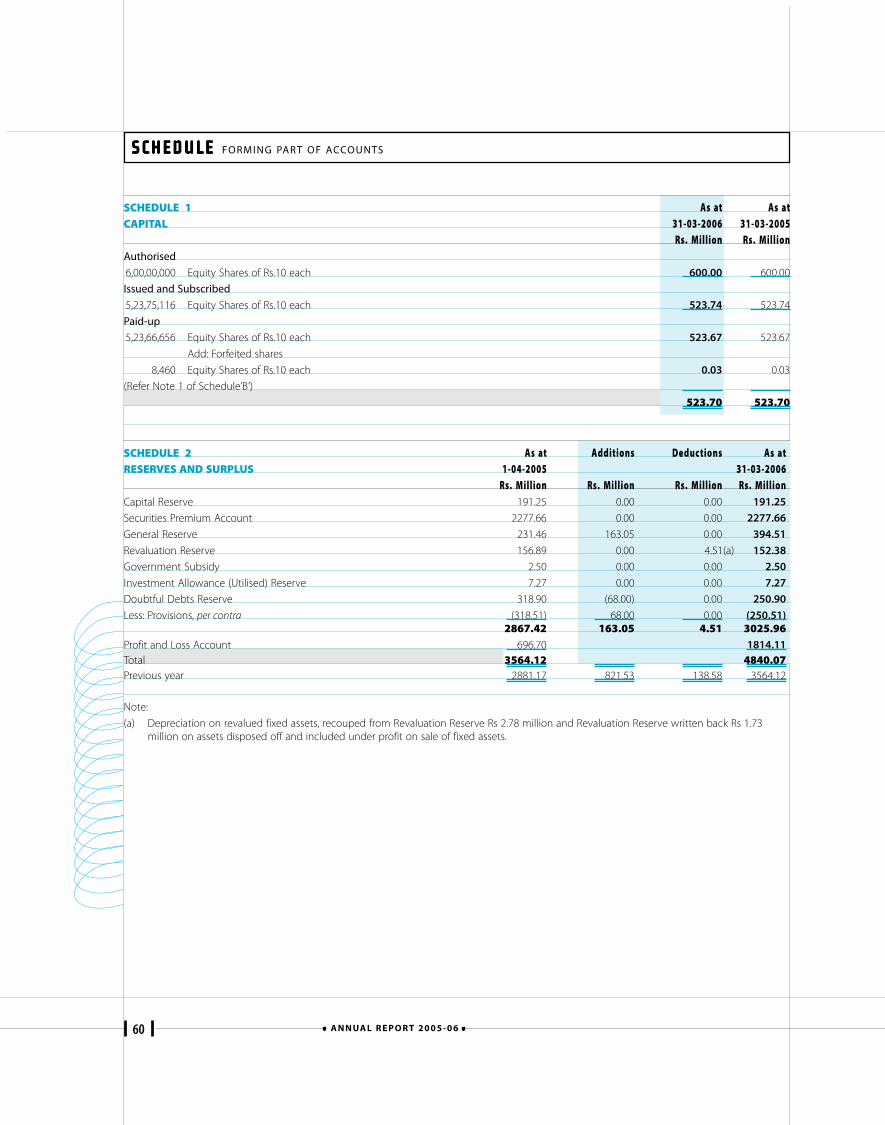
60 A N N UA L R E P O R T 2 0 0 5 - 0 6
SCHEDULE SCHEDULE SCHEDULE SCHEDULE SCHEDULE FORMING PART OF ACCOUNTS
SCHEDULE 1 As at As atCAPITAL 31-03-2006 31-03-2005
Rs. Million Rs. MillionAuthorised
6,00,00,000 Equity Shares of Rs.10 each 600.00 600.00
Issued and Subscribed
5,23,75,116 Equity Shares of Rs.10 each 523.74 523.74
Paid-up
5,23,66,656 Equity Shares of Rs.10 each 523.67 523.67
Add: Forfeited shares
8,460 Equity Shares of Rs.10 each 0.03 0.03
(Refer Note 1 of Schedule’B’)
523.70 523.70
SCHEDULE 2 As at Additions Deduc tions As atRESERVES AND SURPLUS 1-04-2005 31-03-2006
Rs. Million Rs. Million Rs. Million Rs. MillionCapital Reserve 191.25 0.00 0.00 191.25
Securities Premium Account 2277.66 0.00 0.00 2277.66
General Reserve 231.46 163.05 0.00 394.51
Revaluation Reserve 156.89 0.00 4.51(a) 152.38
Government Subsidy 2.50 0.00 0.00 2.50
Investment Allowance (Utilised) Reserve 7.27 0.00 0.00 7.27
Doubtful Debts Reserve 318.90 (68.00) 0.00 250.90
Less: Provisions, per contra (318.51) 68.00 0.00 (250.51)2867.42 163.05 4.51 3025.96
Profit and Loss Account 696.70 1814.11Total 3564.12 4840.07Previous year 2881.17 821.53 138.58 3564.12
Note:
(a) Depreciation on revalued fixed assets, recouped from Revaluation Reserve Rs 2.78 million and Revaluation Reserve written back Rs 1.73million on assets disposed off and included under profit on sale of fixed assets.
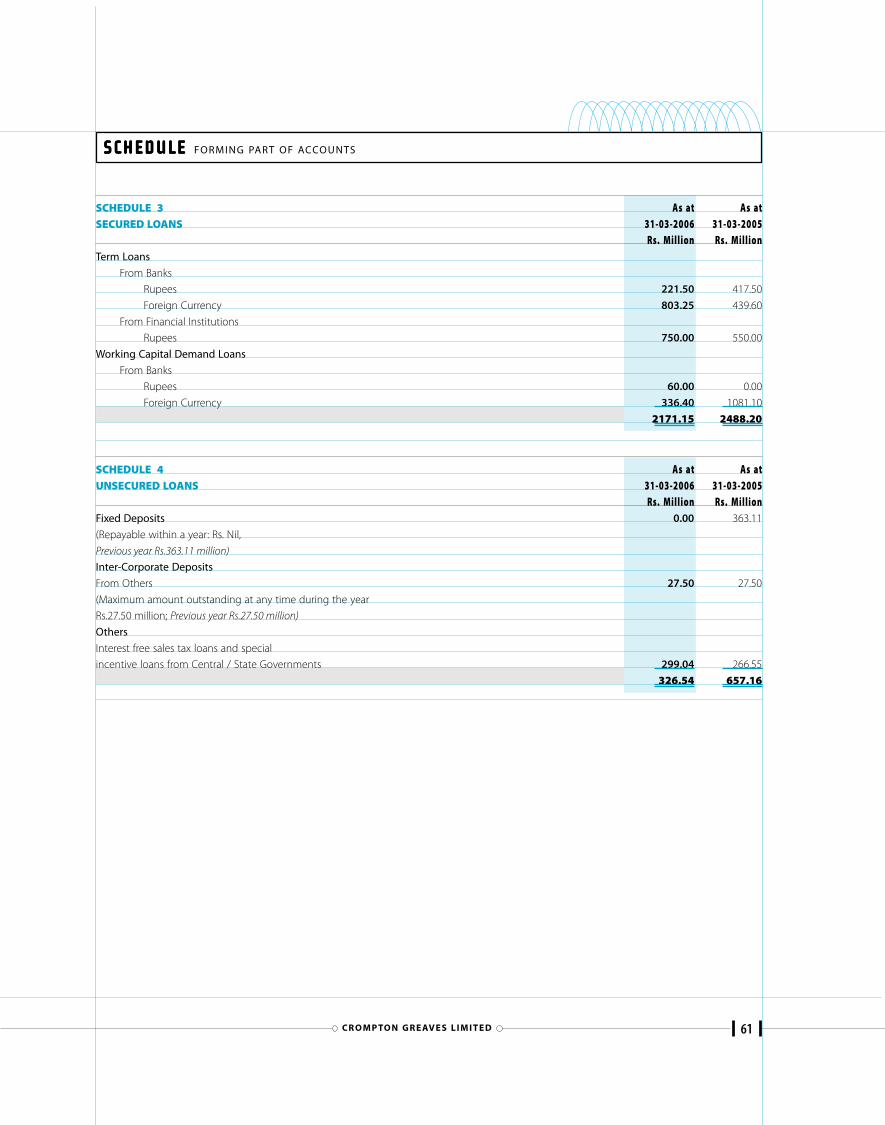
61CR O M P TO N G R E AV E S L I M I T E D
SCHEDULE SCHEDULE SCHEDULE SCHEDULE SCHEDULE FORMING PART OF ACCOUNTS
SCHEDULE 3 As at As atSECURED LOANS 31-03-2006 31-03-2005
Rs. Million Rs. MillionTerm Loans
From Banks
Rupees 221.50 417.50
Foreign Currency 803.25 439.60
From Financial Institutions
Rupees 750.00 550.00
Working Capital Demand Loans
From Banks
Rupees 60.00 0.00
Foreign Currency 336.40 1081.10
2171.15 2488.20
SCHEDULE 4 As at As atUNSECURED LOANS 31-03-2006 31-03-2005
Rs. Million Rs. MillionFixed Deposits 0.00 363.11
(Repayable within a year: Rs. Nil,
Previous year Rs.363.11 million)
Inter-Corporate Deposits
From Others 27.50 27.50
(Maximum amount outstanding at any time during the year
Rs.27.50 million; Previous year Rs.27.50 million)
Others
Interest free sales tax loans and special
incentive loans from Central / State Governments 299.04 266.55
326.54 657.16
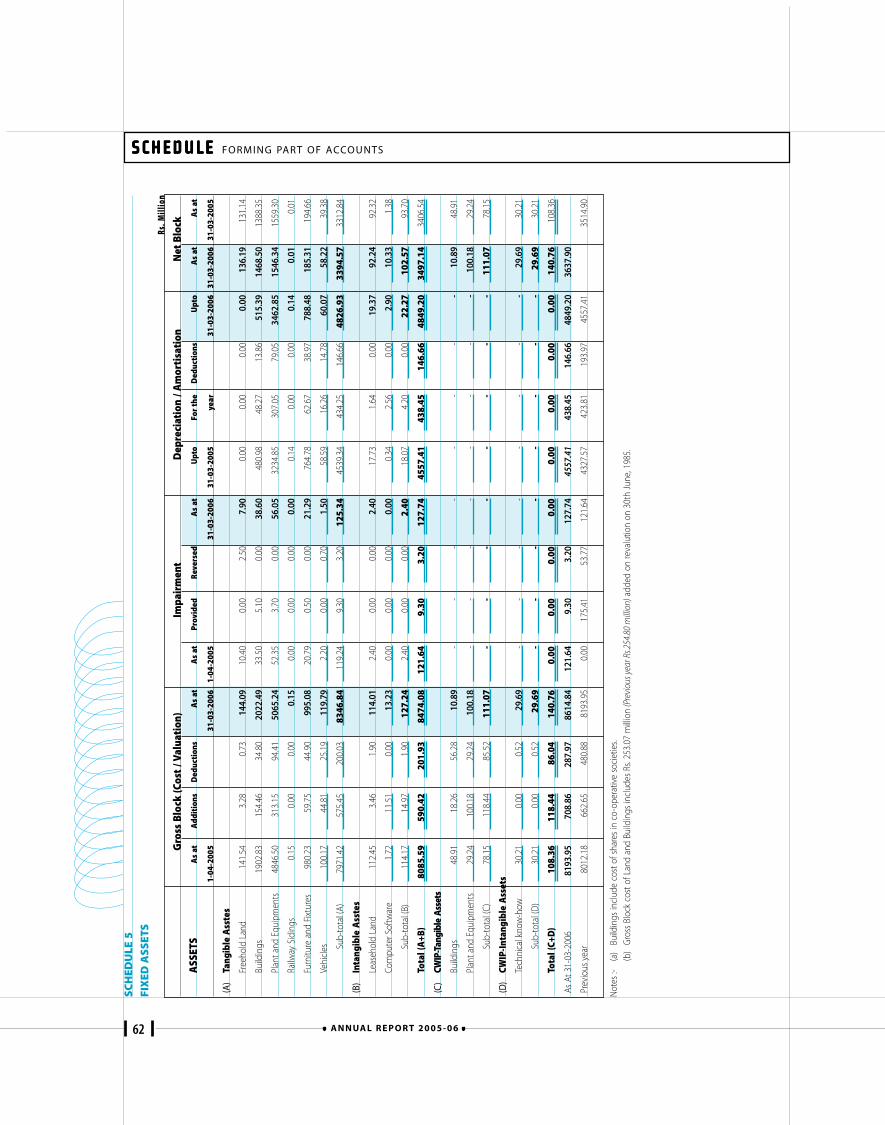
62 A N N UA L R E P O R T 2 0 0 5 - 0 6
SCHEDULE SCHEDULE SCHEDULE SCHEDULE SCHEDULE FORMING PART OF ACCOUNTS
SCH
EDU
LE 5
FIX
ED A
SSET
SRs
. Mill
ion
Gro
ss B
lock
(Cos
t / V
alua
tion
)Im
pair
men
tD
epre
ciat
ion
/ Am
orti
sati
onN
et B
lock
ASS
ETS
As
atA
ddit
ions
Ded
ucti
ons
As
atA
s at
Prov
ided
Reve
rsed
As
atU
pto
For
the
Ded
ucti
ons
Upt
oA
s at
As
at
1-04
-200
531
-03-
2006
1-04
-200
531
-03-
2006
31-0
3-20
05ye
ar31
-03-
2006
31-0
3-20
0631
-03-
2005
(A)
Tang
ible
Ass
tes
Free
hold
Lan
d14
1.54
3.28
0.73
144.
0910
.40
0.00
2.50
7.90
0.00
0.00
0.00
0.00
136.
1913
1.14
Build
ings
1902
.83
154.
4634
.80
2022
.49
33.5
05.
100.
0038
.60
480.
9848
.27
13.8
651
5.39
1468
.50
1388
.35
Plan
t and
Equ
ipm
ents
4846
.50
313.
1594
.41
5065
.24
52.3
53.
700.
0056
.05
3234
.85
307.
0579
.05
3462
.85
1546
.34
1559
.30
Railw
ay S
idin
gs0.
150.
000.
000.
150.
000.
000.
000.
000.
140.
000.
000.
140.
010.
01
Furn
iture
and
Fix
ture
s98
0.23
59.7
544
.90
995.
0820
.79
0.50
0.00
21.2
976
4.78
62.6
738
.97
788.
4818
5.31
194.
66
Vehi
cles
100.
1744
.81
25.1
911
9.79
2.20
0.00
0.70
1.50
58.5
916
.26
14.7
860
.07
58.2
239
.38
Sub-
tota
l (A)
7971
.42
575.
4520
0.03
8346
.84
119.
249.
303.
2012
5.34
4539
.34
434.
2514
6.66
4826
.93
3394
.57
3312
.84
(B)
Inta
ngib
le A
sste
s
Leas
ehol
d La
nd11
2.45
3.46
1.90
114.
012.
400.
000.
002.
4017
.73
1.64
0.00
19.3
792
.24
92.3
2
Com
pute
r Sof
twar
e1.
7211
.51
0.00
13.2
30.
000.
000.
000.
000.
342.
560.
002.
9010
.33
1.38
Sub-
tota
l (B)
114.
1714
.97
1.90
127.
242.
400.
000.
002.
4018
.07
4.20
0.00
22.2
710
2.57
93.7
0
Tota
l (A
+B)
8085
.59
590.
4220
1.93
8474
.08
121.
649.
303.
2012
7.74
4557
.41
438.
4514
6.66
4849
.20
3497
.14
3406
.54
(C)
CWIP
-Tan
gibl
eAs
sets
Build
ings
48.9
118
.26
56.2
810
.89
--
--
--
--
10.8
948
.91
Plan
t and
Equ
ipm
ents
29.2
410
0.18
29.2
410
0.18
--
--
--
--
100.
1829
.24
Sub-
tota
l (C)
78.1
511
8.44
85.5
211
1.07
--
--
--
--
111.
0778
.15
(D)
CWIP
-Inta
ngib
le A
sset
s
Tech
nica
l kno
w-h
ow30
.21
0.00
0.52
29.6
9-
--
--
--
-29
.69
30.2
1
Sub-
tota
l (D
)30
.21
0.00
0.52
29.6
9-
--
--
--
-29
.69
30.2
1
Tota
l (C+
D)
108.
3611
8.44
86.0
414
0.76
0.00
0.00
0.00
0.00
0.00
0.00
0.00
0.00
140.
7610
8.36
As A
t 31-
03-2
006
8193
.95
708.
8628
7.97
8614
.84
121.
649.
303.
2012
7.74
4557
.41
438.
4514
6.66
4849
.20
3637
.90
Prev
ious
yea
r80
12.1
866
2.65
480.
8881
93.9
50.
0017
5.41
53.7
712
1.64
4327
.57
423.
8119
3.97
4557
.41
3514
.90
Not
es :-
(a)
Build
ings
incl
ude
cost
of s
hare
s in
co-
oper
ativ
e so
ciet
ies.
(b)
Gros
s Bl
ock
cost
of L
and
and
Build
ings
incl
udes
Rs.
253.
07 m
illio
n (P
revi
ous y
ear R
s.254
.80
milli
on) a
dded
on
reva
lutio
n on
30t
h Ju
ne, 1
985.
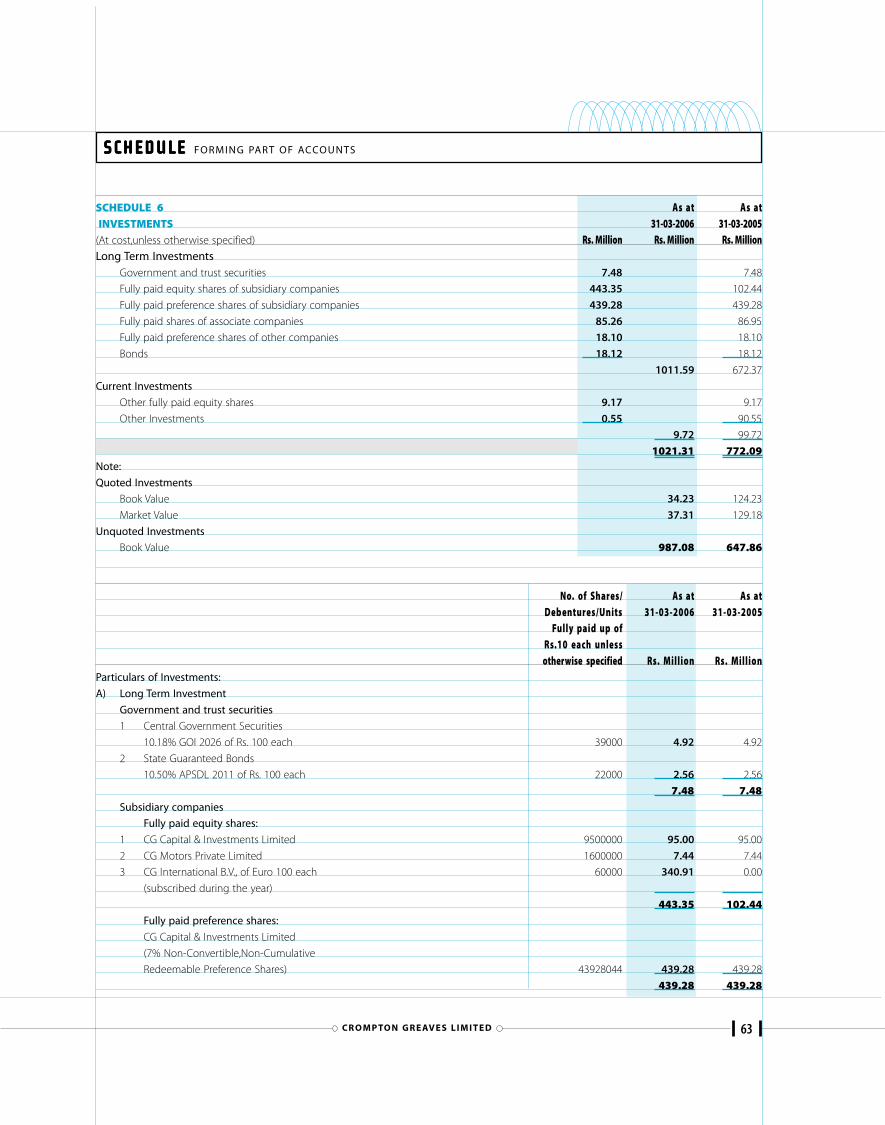
63CR O M P TO N G R E AV E S L I M I T E D
SCHEDULE SCHEDULE SCHEDULE SCHEDULE SCHEDULE FORMING PART OF ACCOUNTS
SCHEDULE 6 As at As at INVESTMENTS 31-03-2006 31-03-2005(At cost,unless otherwise specified) Rs. Million Rs. Million Rs. MillionLong Term Investments
Government and trust securities 7.48 7.48
Fully paid equity shares of subsidiary companies 443.35 102.44
Fully paid preference shares of subsidiary companies 439.28 439.28
Fully paid shares of associate companies 85.26 86.95
Fully paid preference shares of other companies 18.10 18.10
Bonds 18.12 18.12
1011.59 672.37
Current Investments
Other fully paid equity shares 9.17 9.17
Other Investments 0.55 90.55
9.72 99.72
1021.31 772.09Note:
Quoted Investments
Book Value 34.23 124.23
Market Value 37.31 129.18
Unquoted Investments
Book Value 987.08 647.86
No. of Shares/ As at As atDebentures/Units 31-03-2006 31-03-2005
Fully paid up ofRs.10 each unlessotherwise specified Rs. Million Rs. Million
Particulars of Investments:
A) Long Term Investment
Government and trust securities
1 Central Government Securities
10.18% GOI 2026 of Rs. 100 each 39000 4.92 4.92
2 State Guaranteed Bonds
10.50% APSDL 2011 of Rs. 100 each 22000 2.56 2.56
7.48 7.48Subsidiary companies
Fully paid equity shares:
1 CG Capital & Investments Limited 9500000 95.00 95.00
2 CG Motors Private Limited 1600000 7.44 7.44
3 CG International B.V., of Euro 100 each 60000 340.91 0.00
(subscribed during the year)
443.35 102.44Fully paid preference shares:
CG Capital & Investments Limited
(7% Non-Convertible,Non-Cumulative
Redeemable Preference Shares) 43928044 439.28 439.28
439.28 439.28
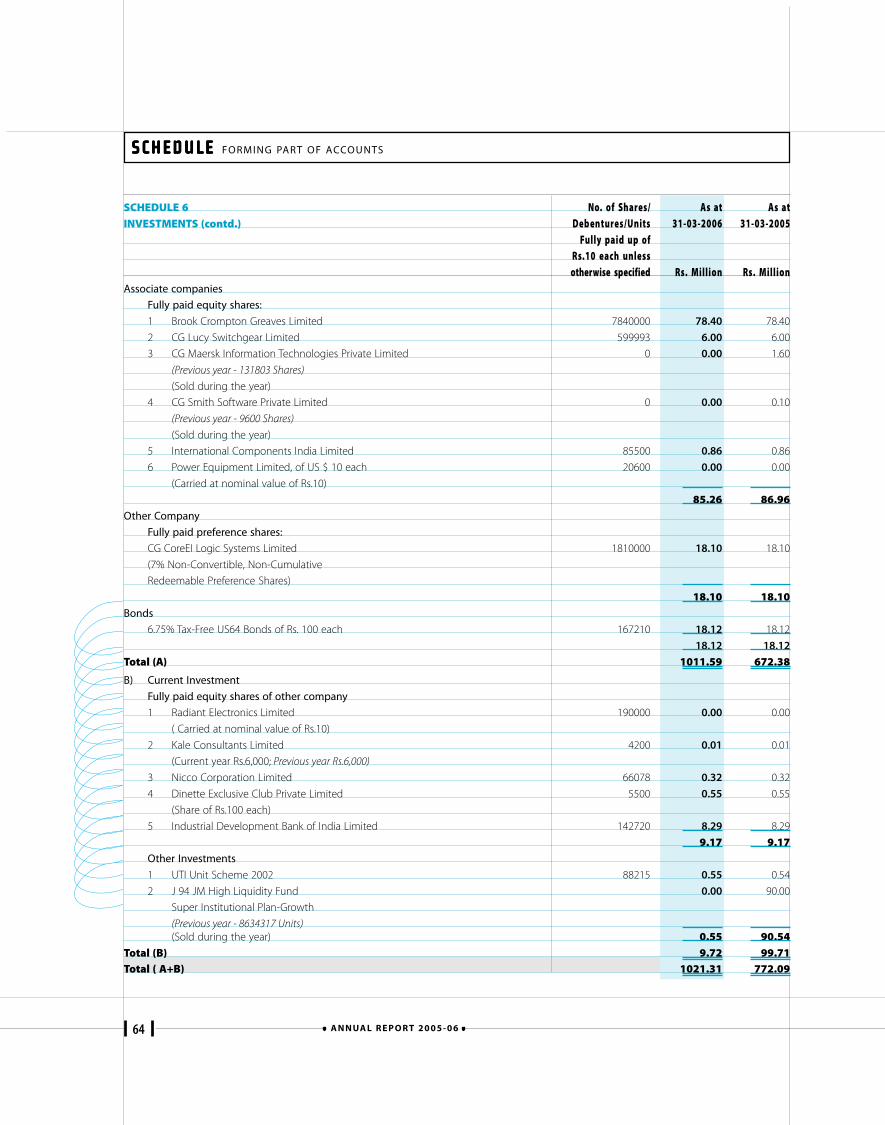
64 A N N UA L R E P O R T 2 0 0 5 - 0 6
SCHEDULE SCHEDULE SCHEDULE SCHEDULE SCHEDULE FORMING PART OF ACCOUNTS
SCHEDULE 6 No. of Shares/ As at As atINVESTMENTS (contd.) Debentures/Units 31-03-2006 31-03-2005
Fully paid up ofRs.10 each unlessotherwise specified Rs. Million Rs. Million
Associate companies
Fully paid equity shares:
1 Brook Crompton Greaves Limited 7840000 78.40 78.40
2 CG Lucy Switchgear Limited 599993 6.00 6.00
3 CG Maersk Information Technologies Private Limited 0 0.00 1.60
(Previous year - 131803 Shares)
(Sold during the year)
4 CG Smith Software Private Limited 0 0.00 0.10
(Previous year - 9600 Shares)
(Sold during the year)
5 International Components India Limited 85500 0.86 0.86
6 Power Equipment Limited, of US $ 10 each 20600 0.00 0.00
(Carried at nominal value of Rs.10)
85.26 86.96Other Company
Fully paid preference shares:
CG CoreEI Logic Systems Limited 1810000 18.10 18.10
(7% Non-Convertible, Non-Cumulative
Redeemable Preference Shares)
18.10 18.10Bonds
6.75% Tax-Free US64 Bonds of Rs. 100 each 167210 18.12 18.12
18.12 18.12
Total (A) 1011.59 672.38
B) Current Investment
Fully paid equity shares of other company
1 Radiant Electronics Limited 190000 0.00 0.00
( Carried at nominal value of Rs.10)
2 Kale Consultants Limited 4200 0.01 0.01
(Current year Rs.6,000; Previous year Rs.6,000)
3 Nicco Corporation Limited 66078 0.32 0.32
4 Dinette Exclusive Club Private Limited 5500 0.55 0.55
(Share of Rs.100 each)
5 Industrial Development Bank of India Limited 142720 8.29 8.29
9.17 9.17Other Investments
1 UTI Unit Scheme 2002 88215 0.55 0.54
2 J 94 JM High Liquidity Fund 0.00 90.00
Super Institutional Plan-Growth
(Previous year - 8634317 Units)(Sold during the year) 0.55 90.54
Total (B) 9.72 99.71Total ( A+B) 1021.31 772.09
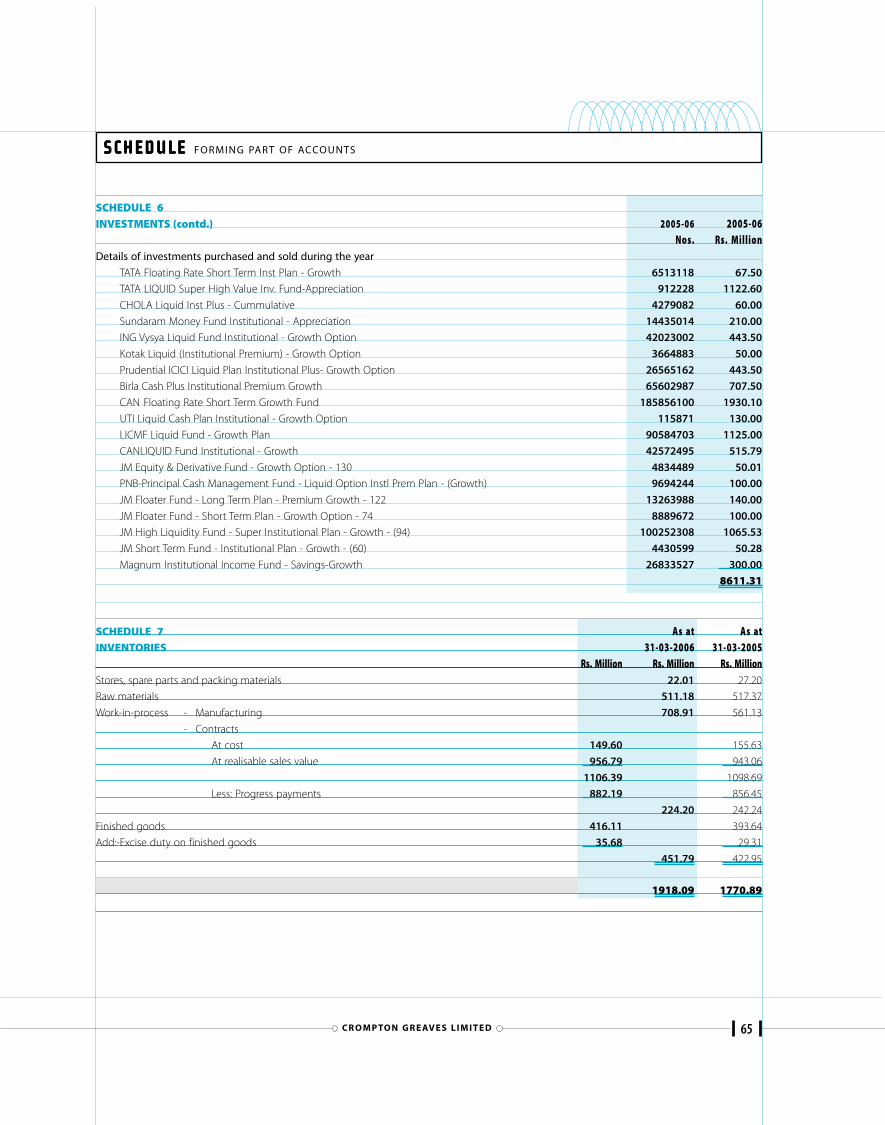
65CR O M P TO N G R E AV E S L I M I T E D
SCHEDULE SCHEDULE SCHEDULE SCHEDULE SCHEDULE FORMING PART OF ACCOUNTS
SCHEDULE 6INVESTMENTS (contd.) 2005-06 2005-06
Nos. Rs. MillionDetails of investments purchased and sold during the year
TATA Floating Rate Short Term Inst Plan - Growth 6513118 67.50
TATA LIQUID Super High Value Inv. Fund-Appreciation 912228 1122.60
CHOLA Liquid Inst Plus - Cummulative 4279082 60.00
Sundaram Money Fund Institutional - Appreciation 14435014 210.00
ING Vysya Liquid Fund Institutional - Growth Option 42023002 443.50
Kotak Liquid (Institutional Premium) - Growth Option 3664883 50.00
Prudential ICICI Liquid Plan Institutional Plus- Growth Option 26565162 443.50
Birla Cash Plus Institutional Premium Growth 65602987 707.50
CAN Floating Rate Short Term Growth Fund 185856100 1930.10
UTI Liquid Cash Plan Institutional - Growth Option 115871 130.00
LICMF Liquid Fund - Growth Plan 90584703 1125.00
CANLIQUID Fund Institutional - Growth 42572495 515.79
JM Equity & Derivative Fund - Growth Option - 130 4834489 50.01
PNB-Principal Cash Management Fund - Liquid Option Instl Prem Plan - (Growth) 9694244 100.00
JM Floater Fund - Long Term Plan - Premium Growth - 122 13263988 140.00
JM Floater Fund - Short Term Plan - Growth Option - 74 8889672 100.00
JM High Liquidity Fund - Super Institutional Plan - Growth - (94) 100252308 1065.53
JM Short Term Fund - Institutional Plan - Growth - (60) 4430599 50.28
Magnum Institutional Income Fund - Savings-Growth 26833527 300.00
8611.31
SCHEDULE 7 As at As atINVENTORIES 31-03-2006 31-03-2005
Rs. Million Rs. Million Rs. MillionStores, spare parts and packing materials 22.01 27.20
Raw materials 511.18 517.37
Work-in-process - Manufacturing 708.91 561.13
- Contracts
At cost 149.60 155.63
At realisable sales value 956.79 943.06
1106.39 1098.69
Less: Progress payments 882.19 856.45
224.20 242.24
Finished goods 416.11 393.64
Add:-Excise duty on finished goods 35.68 29.31
451.79 422.95
1918.09 1770.89
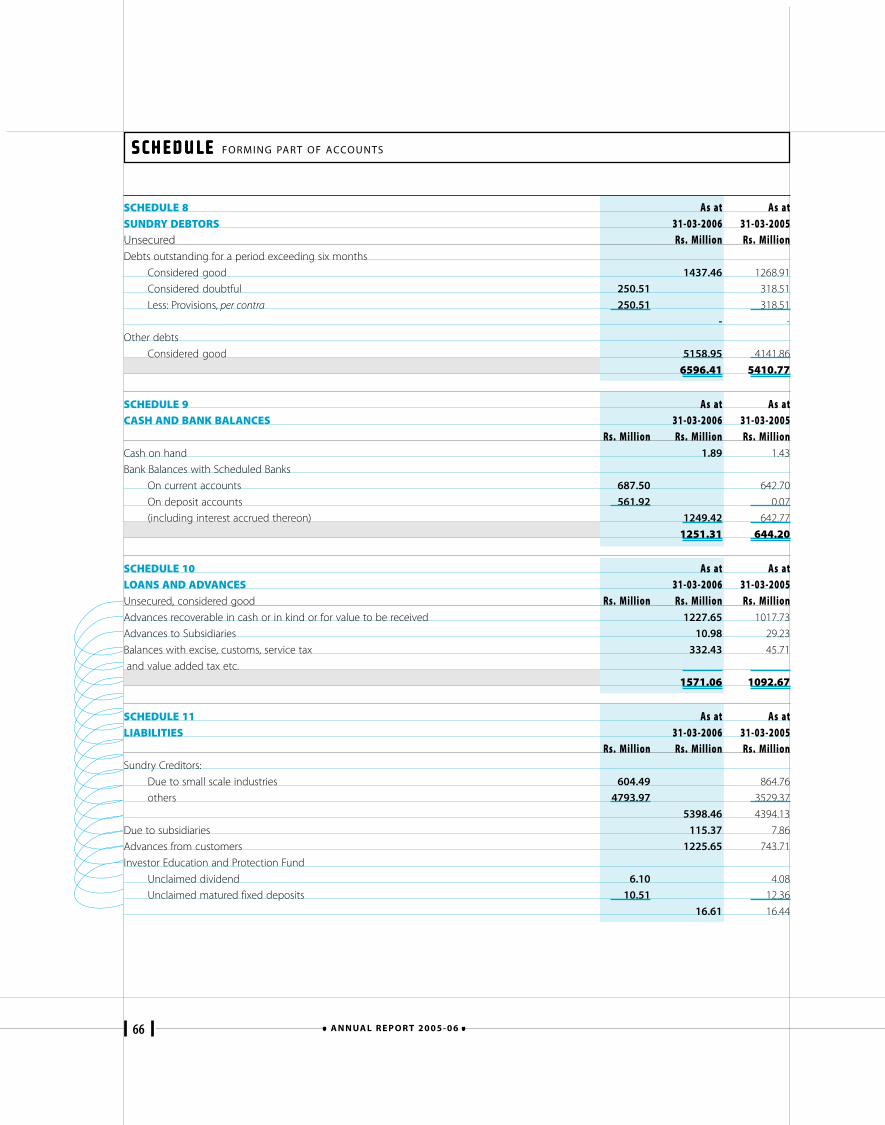
66 A N N UA L R E P O R T 2 0 0 5 - 0 6
SCHEDULE SCHEDULE SCHEDULE SCHEDULE SCHEDULE FORMING PART OF ACCOUNTS
SCHEDULE 8 As at As atSUNDRY DEBTORS 31-03-2006 31-03-2005Unsecured Rs. Million Rs. MillionDebts outstanding for a period exceeding six months
Considered good 1437.46 1268.91
Considered doubtful 250.51 318.51
Less: Provisions, per contra 250.51 318.51
- -
Other debts
Considered good 5158.95 4141.86
6596.41 5410.77
SCHEDULE 9 As at As atCASH AND BANK BALANCES 31-03-2006 31-03-2005
Rs. Million Rs. Million Rs. MillionCash on hand 1.89 1.43
Bank Balances with Scheduled Banks
On current accounts 687.50 642.70
On deposit accounts 561.92 0.07
(including interest accrued thereon) 1249.42 642.77
1251.31 644.20
SCHEDULE 10 As at As atLOANS AND ADVANCES 31-03-2006 31-03-2005Unsecured, considered good Rs. Million Rs. Million Rs. MillionAdvances recoverable in cash or in kind or for value to be received 1227.65 1017.73
Advances to Subsidiaries 10.98 29.23
Balances with excise, customs, service tax 332.43 45.71
and value added tax etc.
1571.06 1092.67
SCHEDULE 11 As at As atLIABILITIES 31-03-2006 31-03-2005
Rs. Million Rs. Million Rs. MillionSundry Creditors:
Due to small scale industries 604.49 864.76
others 4793.97 3529.37
5398.46 4394.13
Due to subsidiaries 115.37 7.86
Advances from customers 1225.65 743.71
Investor Education and Protection Fund
Unclaimed dividend 6.10 4.08
Unclaimed matured fixed deposits 10.51 12.36
16.61 16.44
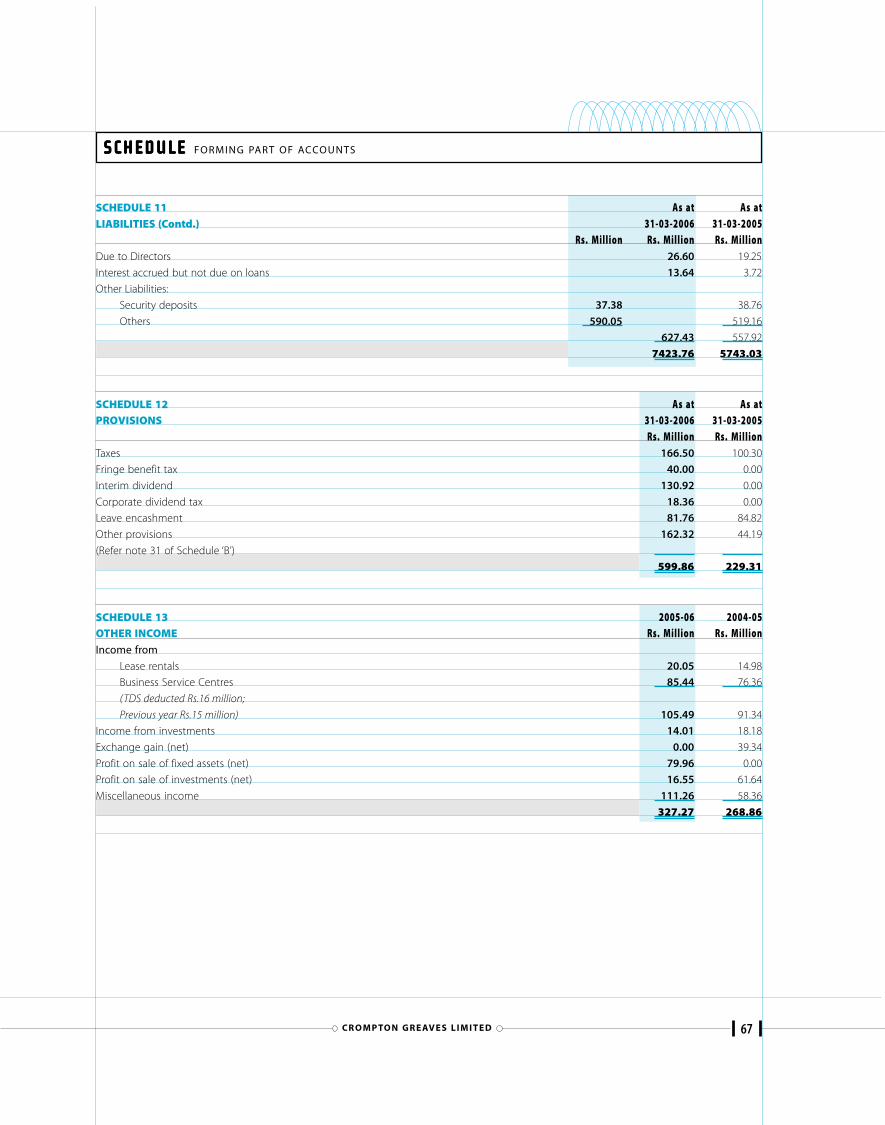
67CR O M P TO N G R E AV E S L I M I T E D
SCHEDULE SCHEDULE SCHEDULE SCHEDULE SCHEDULE FORMING PART OF ACCOUNTS
SCHEDULE 11 As at As atLIABILITIES (Contd.) 31-03-2006 31-03-2005
Rs. Million Rs. Million Rs. MillionDue to Directors 26.60 19.25
Interest accrued but not due on loans 13.64 3.72
Other Liabilities:
Security deposits 37.38 38.76
Others 590.05 519.16
627.43 557.92
7423.76 5743.03
SCHEDULE 12 As at As atPROVISIONS 31-03-2006 31-03-2005
Rs. Million Rs. MillionTaxes 166.50 100.30
Fringe benefit tax 40.00 0.00
Interim dividend 130.92 0.00
Corporate dividend tax 18.36 0.00
Leave encashment 81.76 84.82
Other provisions 162.32 44.19
(Refer note 31 of Schedule ‘B’)
599.86 229.31
SCHEDULE 13 2005-06 2004-05OTHER INCOME Rs. Million Rs. MillionIncome from
Lease rentals 20.05 14.98
Business Service Centres 85.44 76.36
(TDS deducted Rs.16 million;
Previous year Rs.15 million) 105.49 91.34
Income from investments 14.01 18.18
Exchange gain (net) 0.00 39.34
Profit on sale of fixed assets (net) 79.96 0.00
Profit on sale of investments (net) 16.55 61.64
Miscellaneous income 111.26 58.36
327.27 268.86
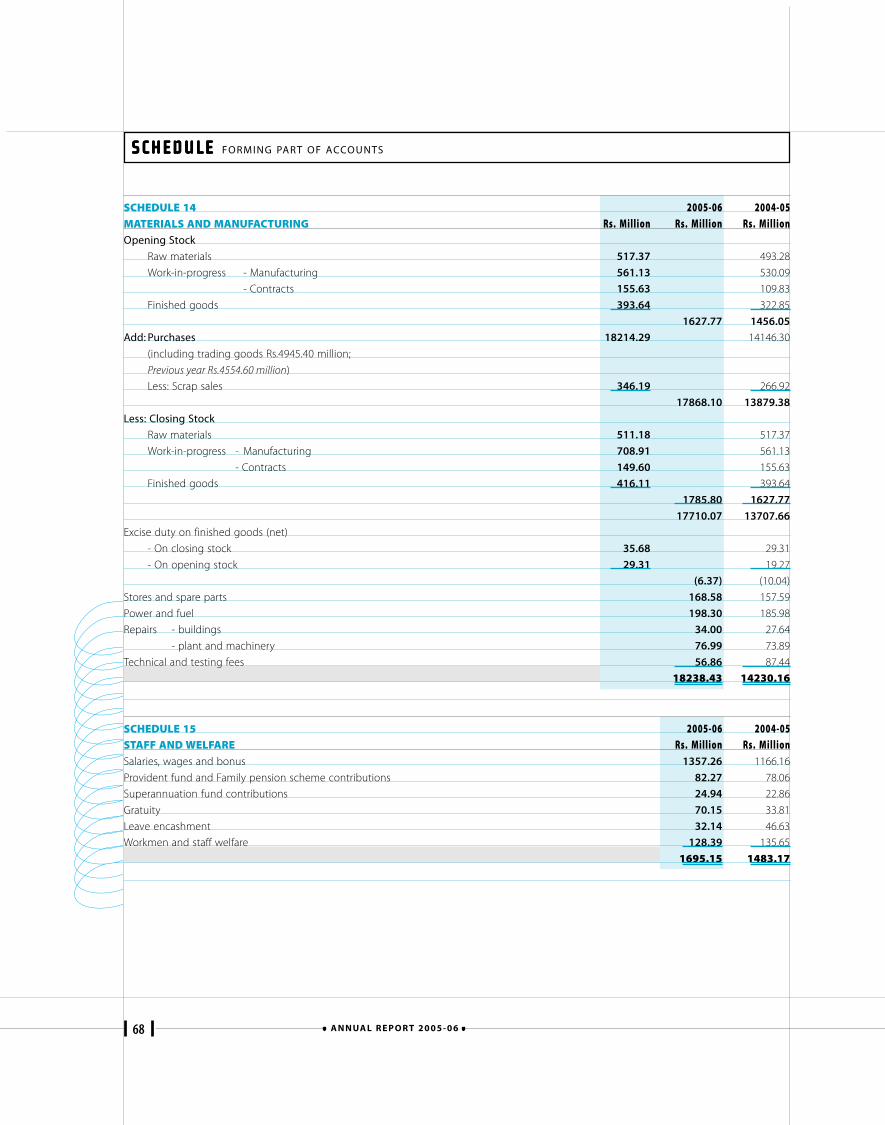
68 A N N UA L R E P O R T 2 0 0 5 - 0 6
SCHEDULE SCHEDULE SCHEDULE SCHEDULE SCHEDULE FORMING PART OF ACCOUNTS
SCHEDULE 14 2005-06 2004-05MATERIALS AND MANUFACTURING Rs. Million Rs. Million Rs. MillionOpening Stock
Raw materials 517.37 493.28
Work-in-progress - Manufacturing 561.13 530.09
- Contracts 155.63 109.83
Finished goods 393.64 322.85
1627.77 1456.05
Add: Purchases 18214.29 14146.30
(including trading goods Rs.4945.40 million;
Previous year Rs.4554.60 million)
Less: Scrap sales 346.19 266.92
17868.10 13879.38
Less: Closing Stock
Raw materials 511.18 517.37
Work-in-progress - Manufacturing 708.91 561.13
- Contracts 149.60 155.63
Finished goods 416.11 393.64
1785.80 1627.77
17710.07 13707.66
Excise duty on finished goods (net)
- On closing stock 35.68 29.31
- On opening stock 29.31 19.27
(6.37) (10.04)
Stores and spare parts 168.58 157.59
Power and fuel 198.30 185.98
Repairs - buildings 34.00 27.64
- plant and machinery 76.99 73.89
Technical and testing fees 56.86 87.44
18238.43 14230.16
SCHEDULE 15 2005-06 2004-05STAFF AND WELFARE Rs. Million Rs. MillionSalaries, wages and bonus 1357.26 1166.16
Provident fund and Family pension scheme contributions 82.27 78.06
Superannuation fund contributions 24.94 22.86
Gratuity 70.15 33.81
Leave encashment 32.14 46.63
Workmen and staff welfare 128.39 135.65
1695.15 1483.17
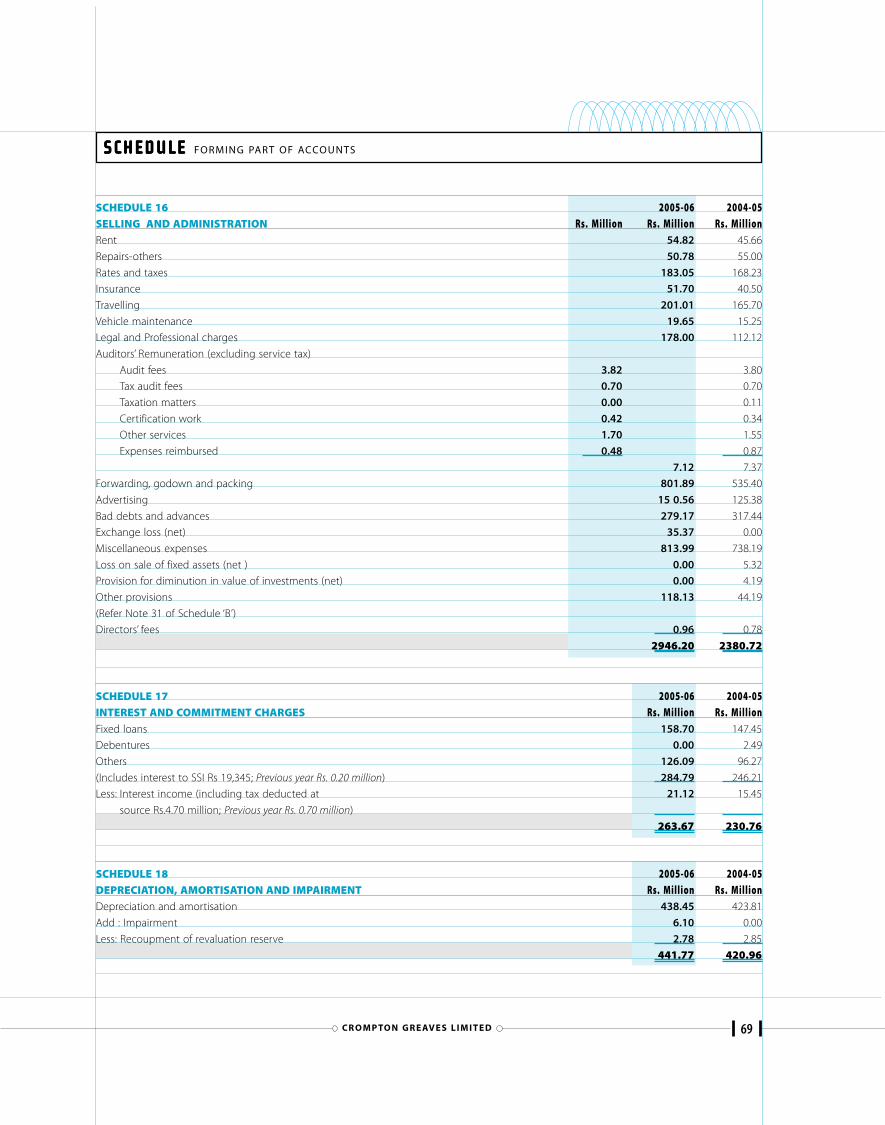
69CR O M P TO N G R E AV E S L I M I T E D
SCHEDULE 16 2005-06 2004-05SELLING AND ADMINISTRATION Rs. Million Rs. Million Rs. MillionRent 54.82 45.66
Repairs-others 50.78 55.00
Rates and taxes 183.05 168.23
Insurance 51.70 40.50
Travelling 201.01 165.70
Vehicle maintenance 19.65 15.25
Legal and Professional charges 178.00 112.12
Auditors’ Remuneration (excluding service tax)
Audit fees 3.82 3.80
Tax audit fees 0.70 0.70
Taxation matters 0.00 0.11
Certification work 0.42 0.34
Other services 1.70 1.55
Expenses reimbursed 0.48 0.87
7.12 7.37
Forwarding, godown and packing 801.89 535.40
Advertising 15 0.56 125.38
Bad debts and advances 279.17 317.44
Exchange loss (net) 35.37 0.00
Miscellaneous expenses 813.99 738.19
Loss on sale of fixed assets (net ) 0.00 5.32
Provision for diminution in value of investments (net) 0.00 4.19
Other provisions 118.13 44.19
(Refer Note 31 of Schedule ‘B’)
Directors’ fees 0.96 0.78
2946.20 2380.72
SCHEDULE 17 2005-06 2004-05INTEREST AND COMMITMENT CHARGES Rs. Million Rs. MillionFixed loans 158.70 147.45
Debentures 0.00 2.49
Others 126.09 96.27
(Includes interest to SSI Rs 19,345; Previous year Rs. 0.20 million) 284.79 246.21
Less: Interest income (including tax deducted at 21.12 15.45
source Rs.4.70 million; Previous year Rs. 0.70 million)
263.67 230.76
SCHEDULE 18 2005-06 2004-05DEPRECIATION, AMORTISATION AND IMPAIRMENT Rs. Million Rs. MillionDepreciation and amortisation 438.45 423.81
Add : Impairment 6.10 0.00
Less: Recoupment of revaluation reserve 2.78 2.85
441.77 420.96
SCHEDULE SCHEDULE SCHEDULE SCHEDULE SCHEDULE FORMING PART OF ACCOUNTS
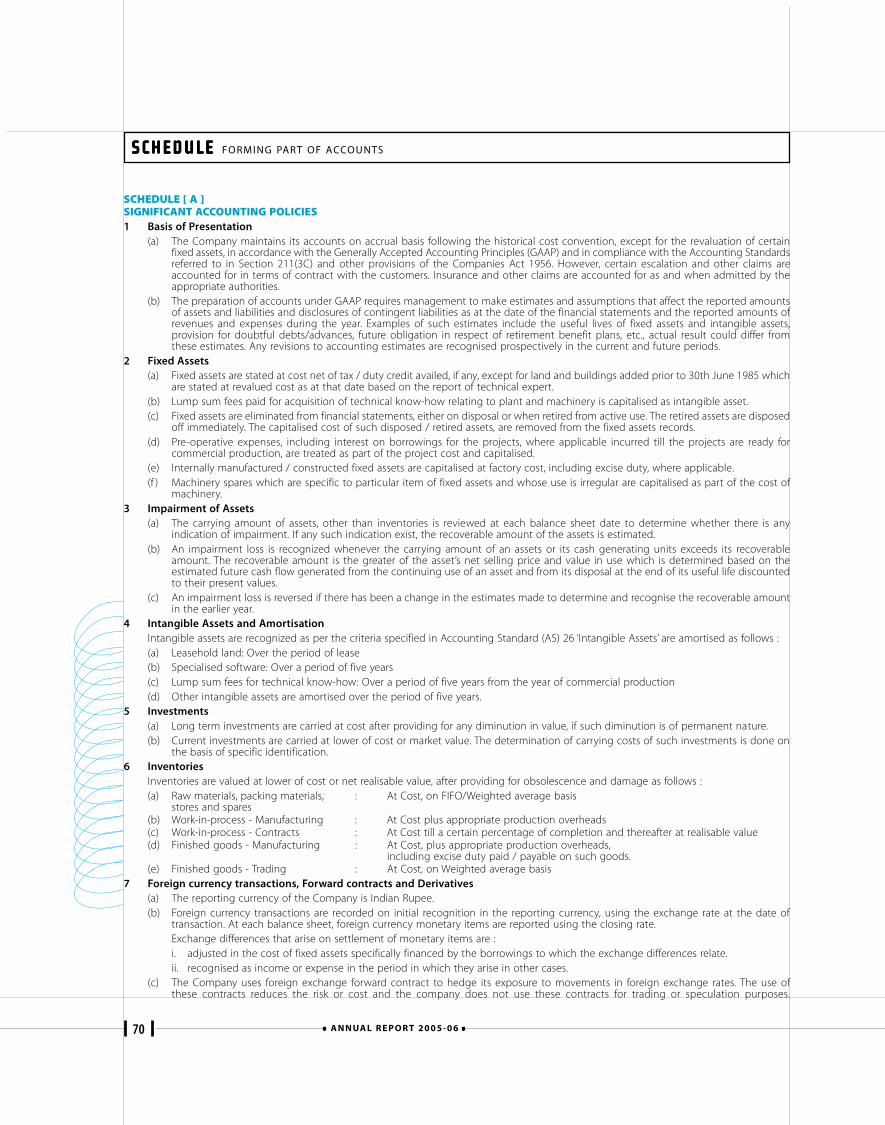
70 A N N UA L R E P O R T 2 0 0 5 - 0 6
SCHEDULE SCHEDULE SCHEDULE SCHEDULE SCHEDULE FORMING PART OF ACCOUNTS
SCHEDULE [ A ]SIGNIFICANT ACCOUNTING POLICIES1 Basis of Presentation
(a) The Company maintains its accounts on accrual basis following the historical cost convention, except for the revaluation of certainfixed assets, in accordance with the Generally Accepted Accounting Principles (GAAP) and in compliance with the Accounting Standardsreferred to in Section 211(3C) and other provisions of the Companies Act 1956. However, certain escalation and other claims areaccounted for in terms of contract with the customers. Insurance and other claims are accounted for as and when admitted by theappropriate authorities.
(b) The preparation of accounts under GAAP requires management to make estimates and assumptions that affect the reported amountsof assets and liabilities and disclosures of contingent liabilities as at the date of the financial statements and the reported amounts ofrevenues and expenses during the year. Examples of such estimates include the useful lives of fixed assets and intangible assets,provision for doubtful debts/advances, future obligation in respect of retirement benefit plans, etc., actual result could differ fromthese estimates. Any revisions to accounting estimates are recognised prospectively in the current and future periods.
2 Fixed Assets(a) Fixed assets are stated at cost net of tax / duty credit availed, if any, except for land and buildings added prior to 30th June 1985 which
are stated at revalued cost as at that date based on the report of technical expert.(b) Lump sum fees paid for acquisition of technical know-how relating to plant and machinery is capitalised as intangible asset.(c) Fixed assets are eliminated from financial statements, either on disposal or when retired from active use. The retired assets are disposed
off immediately. The capitalised cost of such disposed / retired assets, are removed from the fixed assets records.(d) Pre-operative expenses, including interest on borrowings for the projects, where applicable incurred till the projects are ready for
commercial production, are treated as part of the project cost and capitalised.(e) Internally manufactured / constructed fixed assets are capitalised at factory cost, including excise duty, where applicable.(f ) Machinery spares which are specific to particular item of fixed assets and whose use is irregular are capitalised as part of the cost of
machinery.3 Impairment of Assets
(a) The carrying amount of assets, other than inventories is reviewed at each balance sheet date to determine whether there is anyindication of impairment. If any such indication exist, the recoverable amount of the assets is estimated.
(b) An impairment loss is recognized whenever the carrying amount of an assets or its cash generating units exceeds its recoverableamount. The recoverable amount is the greater of the asset’s net selling price and value in use which is determined based on theestimated future cash flow generated from the continuing use of an asset and from its disposal at the end of its useful life discountedto their present values.
(c) An impairment loss is reversed if there has been a change in the estimates made to determine and recognise the recoverable amountin the earlier year.
4 Intangible Assets and AmortisationIntangible assets are recognized as per the criteria specified in Accounting Standard (AS) 26 ‘Intangible Assets’ are amortised as follows :(a) Leasehold land: Over the period of lease(b) Specialised software: Over a period of five years(c) Lump sum fees for technical know-how: Over a period of five years from the year of commercial production(d) Other intangible assets are amortised over the period of five years.
5 Investments(a) Long term investments are carried at cost after providing for any diminution in value, if such diminution is of permanent nature.(b) Current investments are carried at lower of cost or market value. The determination of carrying costs of such investments is done on
the basis of specific identification.6 Inventories
Inventories are valued at lower of cost or net realisable value, after providing for obsolescence and damage as follows :(a) Raw materials, packing materials, : At Cost, on FIFO/Weighted average basis
stores and spares(b) Work-in-process - Manufacturing : At Cost plus appropriate production overheads(c) Work-in-process - Contracts : At Cost till a certain percentage of completion and thereafter at realisable value(d) Finished goods - Manufacturing : At Cost, plus appropriate production overheads,
including excise duty paid / payable on such goods.(e) Finished goods - Trading : At Cost, on Weighted average basis
7 Foreign currency transactions, Forward contracts and Derivatives(a) The reporting currency of the Company is Indian Rupee.(b) Foreign currency transactions are recorded on initial recognition in the reporting currency, using the exchange rate at the date of
transaction. At each balance sheet, foreign currency monetary items are reported using the closing rate.Exchange differences that arise on settlement of monetary items are :i. adjusted in the cost of fixed assets specifically financed by the borrowings to which the exchange differences relate.ii. recognised as income or expense in the period in which they arise in other cases.
(c) The Company uses foreign exchange forward contract to hedge its exposure to movements in foreign exchange rates. The use ofthese contracts reduces the risk or cost and the company does not use these contracts for trading or speculation purposes.
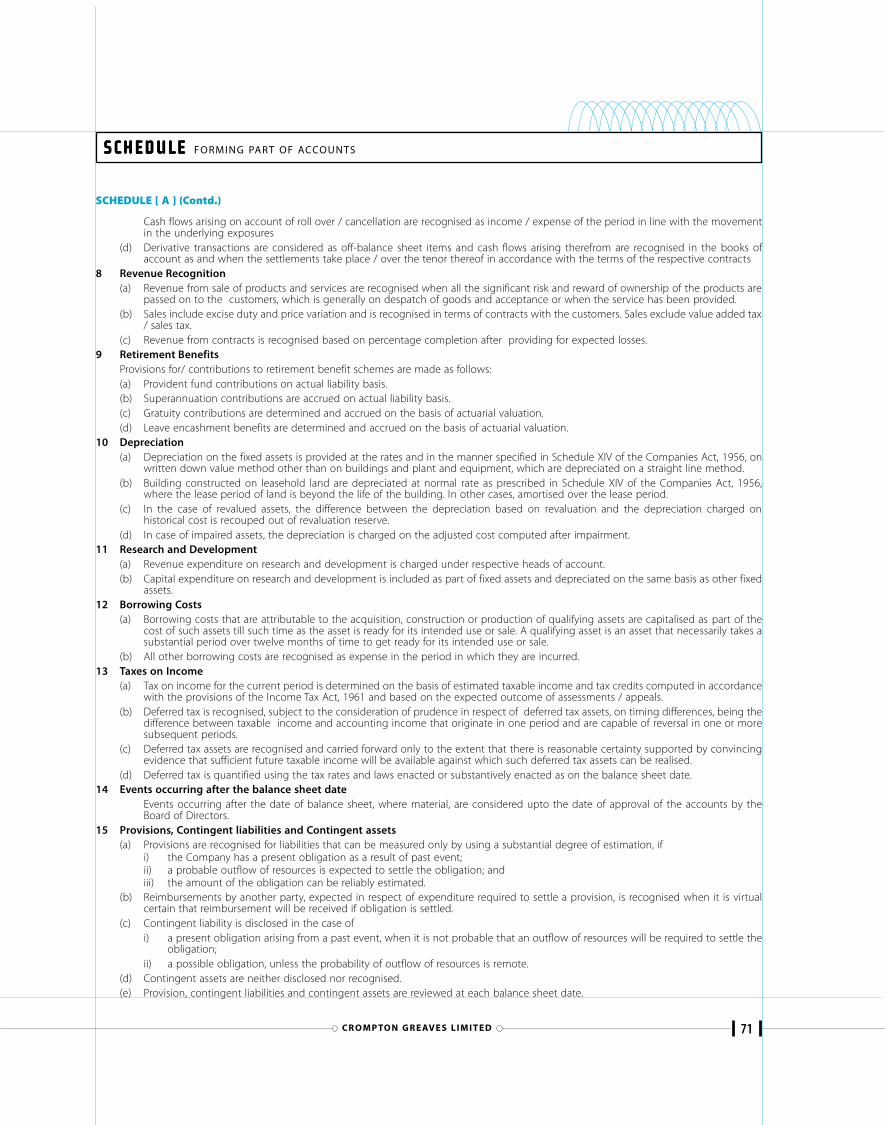
71CR O M P TO N G R E AV E S L I M I T E D
SCHEDULE SCHEDULE SCHEDULE SCHEDULE SCHEDULE FORMING PART OF ACCOUNTS
Cash flows arising on account of roll over / cancellation are recognised as income / expense of the period in line with the movementin the underlying exposures
(d) Derivative transactions are considered as off-balance sheet items and cash flows arising therefrom are recognised in the books ofaccount as and when the settlements take place / over the tenor thereof in accordance with the terms of the respective contracts
8 Revenue Recognition(a) Revenue from sale of products and services are recognised when all the significant risk and reward of ownership of the products are
passed on to the customers, which is generally on despatch of goods and acceptance or when the service has been provided.(b) Sales include excise duty and price variation and is recognised in terms of contracts with the customers. Sales exclude value added tax
/ sales tax.(c) Revenue from contracts is recognised based on percentage completion after providing for expected losses.
9 Retirement BenefitsProvisions for/ contributions to retirement benefit schemes are made as follows:(a) Provident fund contributions on actual liability basis.(b) Superannuation contributions are accrued on actual liability basis.(c) Gratuity contributions are determined and accrued on the basis of actuarial valuation.(d) Leave encashment benefits are determined and accrued on the basis of actuarial valuation.
10 Depreciation(a) Depreciation on the fixed assets is provided at the rates and in the manner specified in Schedule XIV of the Companies Act, 1956, on
written down value method other than on buildings and plant and equipment, which are depreciated on a straight line method.(b) Building constructed on leasehold land are depreciated at normal rate as prescribed in Schedule XIV of the Companies Act, 1956,
where the lease period of land is beyond the life of the building. In other cases, amortised over the lease period.(c) In the case of revalued assets, the difference between the depreciation based on revaluation and the depreciation charged on
historical cost is recouped out of revaluation reserve.(d) In case of impaired assets, the depreciation is charged on the adjusted cost computed after impairment.
11 Research and Development(a) Revenue expenditure on research and development is charged under respective heads of account.(b) Capital expenditure on research and development is included as part of fixed assets and depreciated on the same basis as other fixed
assets.12 Borrowing Costs
(a) Borrowing costs that are attributable to the acquisition, construction or production of qualifying assets are capitalised as part of thecost of such assets till such time as the asset is ready for its intended use or sale. A qualifying asset is an asset that necessarily takes asubstantial period over twelve months of time to get ready for its intended use or sale.
(b) All other borrowing costs are recognised as expense in the period in which they are incurred.13 Taxes on Income
(a) Tax on income for the current period is determined on the basis of estimated taxable income and tax credits computed in accordancewith the provisions of the Income Tax Act, 1961 and based on the expected outcome of assessments / appeals.
(b) Deferred tax is recognised, subject to the consideration of prudence in respect of deferred tax assets, on timing differences, being thedifference between taxable income and accounting income that originate in one period and are capable of reversal in one or moresubsequent periods.
(c) Deferred tax assets are recognised and carried forward only to the extent that there is reasonable certainty supported by convincingevidence that sufficient future taxable income will be available against which such deferred tax assets can be realised.
(d) Deferred tax is quantified using the tax rates and laws enacted or substantively enacted as on the balance sheet date.14 Events occurring after the balance sheet date
Events occurring after the date of balance sheet, where material, are considered upto the date of approval of the accounts by theBoard of Directors.
15 Provisions, Contingent liabilities and Contingent assets(a) Provisions are recognised for liabilities that can be measured only by using a substantial degree of estimation, if
i) the Company has a present obligation as a result of past event;ii) a probable outflow of resources is expected to settle the obligation; andiii) the amount of the obligation can be reliably estimated.
(b) Reimbursements by another party, expected in respect of expenditure required to settle a provision, is recognised when it is virtualcertain that reimbursement will be received if obligation is settled.
(c) Contingent liability is disclosed in the case ofi) a present obligation arising from a past event, when it is not probable that an outflow of resources will be required to settle the
obligation;ii) a possible obligation, unless the probability of outflow of resources is remote.
(d) Contingent assets are neither disclosed nor recognised.(e) Provision, contingent liabilities and contingent assets are reviewed at each balance sheet date.
SCHEDULE [ A ] (Contd.)
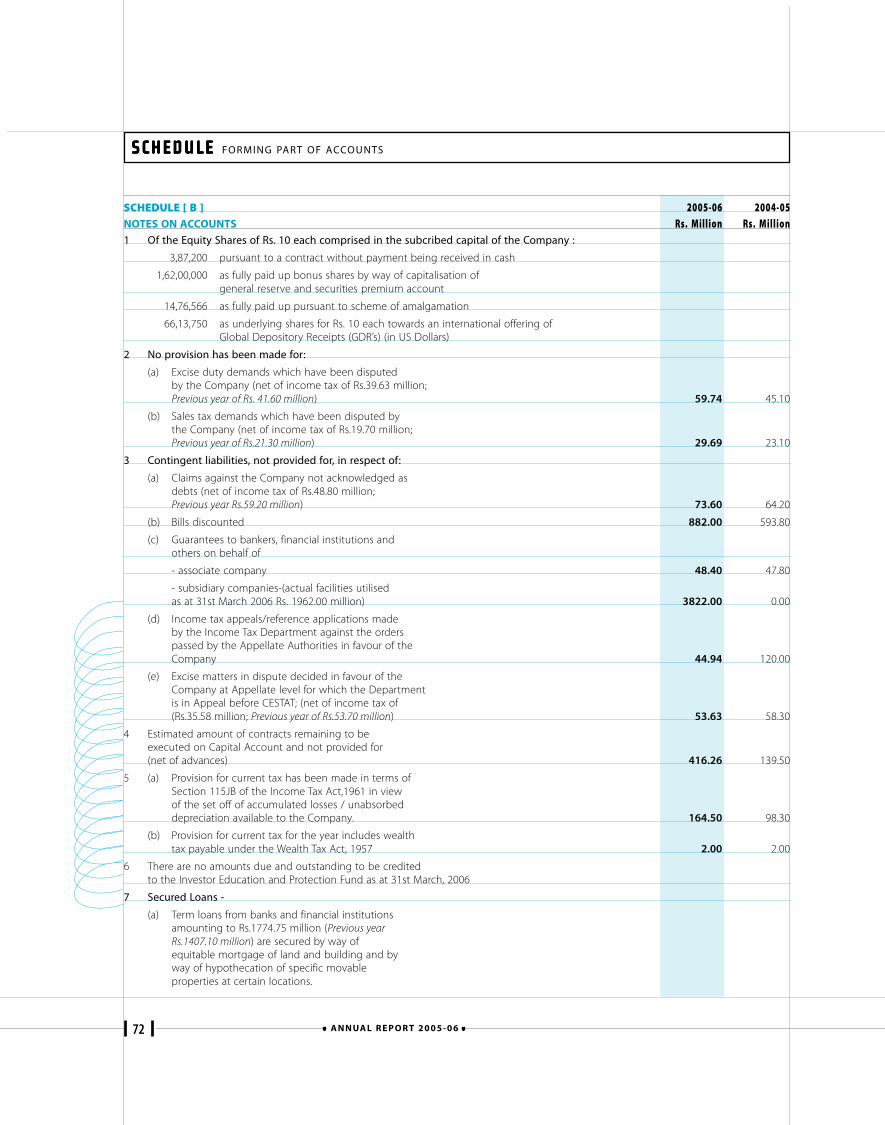
72 A N N UA L R E P O R T 2 0 0 5 - 0 6
SCHEDULE SCHEDULE SCHEDULE SCHEDULE SCHEDULE FORMING PART OF ACCOUNTS
SCHEDULE [ B ] 2005-06 2004-05NOTES ON ACCOUNTS Rs. Million Rs. Million1 Of the Equity Shares of Rs. 10 each comprised in the subcribed capital of the Company :
3,87,200 pursuant to a contract without payment being received in cash
1,62,00,000 as fully paid up bonus shares by way of capitalisation ofgeneral reserve and securities premium account
14,76,566 as fully paid up pursuant to scheme of amalgamation
66,13,750 as underlying shares for Rs. 10 each towards an international offering ofGlobal Depository Receipts (GDR’s) (in US Dollars)
2 No provision has been made for:
(a) Excise duty demands which have been disputedby the Company (net of income tax of Rs.39.63 million;Previous year of Rs. 41.60 million) 59.74 45.10
(b) Sales tax demands which have been disputed bythe Company (net of income tax of Rs.19.70 million;Previous year of Rs.21.30 million) 29.69 23.10
3 Contingent liabilities, not provided for, in respect of:
(a) Claims against the Company not acknowledged asdebts (net of income tax of Rs.48.80 million;Previous year Rs.59.20 million) 73.60 64.20
(b) Bills discounted 882.00 593.80
(c) Guarantees to bankers, financial institutions andothers on behalf of
- associate company 48.40 47.80
- subsidiary companies-(actual facilities utilisedas at 31st March 2006 Rs. 1962.00 million) 3822.00 0.00
(d) Income tax appeals/reference applications madeby the Income Tax Department against the orderspassed by the Appellate Authorities in favour of theCompany 44.94 120.00
(e) Excise matters in dispute decided in favour of theCompany at Appellate level for which the Departmentis in Appeal before CESTAT; (net of income tax of(Rs.35.58 million; Previous year of Rs.53.70 million) 53.63 58.30
4 Estimated amount of contracts remaining to beexecuted on Capital Account and not provided for(net of advances) 416.26 139.50
5 (a) Provision for current tax has been made in terms ofSection 115JB of the Income Tax Act,1961 in viewof the set off of accumulated losses / unabsorbeddepreciation available to the Company. 164.50 98.30
(b) Provision for current tax for the year includes wealthtax payable under the Wealth Tax Act, 1957 2.00 2.00
6 There are no amounts due and outstanding to be creditedto the Investor Education and Protection Fund as at 31st March, 2006
7 Secured Loans -
(a) Term loans from banks and financial institutionsamounting to Rs.1774.75 million (Previous yearRs.1407.10 million) are secured by way ofequitable mortgage of land and building and byway of hypothecation of specific movableproperties at certain locations.
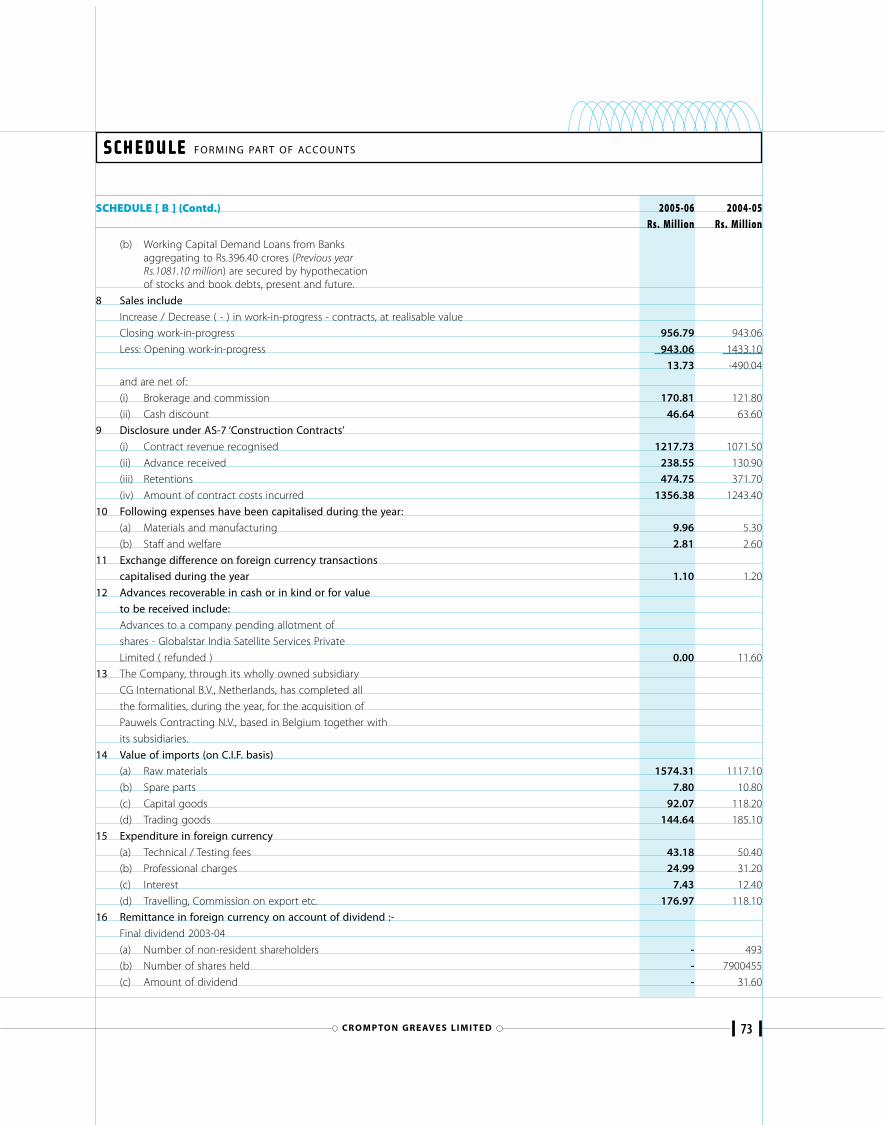
73CR O M P TO N G R E AV E S L I M I T E D
SCHEDULE SCHEDULE SCHEDULE SCHEDULE SCHEDULE FORMING PART OF ACCOUNTS
SCHEDULE [ B ] (Contd.) 2005-06 2004-05Rs. Million Rs. Million
(b) Working Capital Demand Loans from Banksaggregating to Rs.396.40 crores (Previous yearRs.1081.10 million) are secured by hypothecationof stocks and book debts, present and future.
8 Sales include
Increase / Decrease ( - ) in work-in-progress - contracts, at realisable value
Closing work-in-progress 956.79 943.06
Less: Opening work-in-progress 943.06 1433.10
13.73 -490.04
and are net of:
(i) Brokerage and commission 170.81 121.80
(ii) Cash discount 46.64 63.60
9 Disclosure under AS-7 ‘Construction Contracts’
(i) Contract revenue recognised 1217.73 1071.50
(ii) Advance received 238.55 130.90
(iii) Retentions 474.75 371.70
(iv) Amount of contract costs incurred 1356.38 1243.40
10 Following expenses have been capitalised during the year:
(a) Materials and manufacturing 9.96 5.30
(b) Staff and welfare 2.81 2.60
11 Exchange difference on foreign currency transactions
capitalised during the year 1.10 1.20
12 Advances recoverable in cash or in kind or for value
to be received include:
Advances to a company pending allotment of
shares - Globalstar India Satellite Services Private
Limited ( refunded ) 0.00 11.60
13 The Company, through its wholly owned subsidiary
CG International B.V., Netherlands, has completed all
the formalities, during the year, for the acquisition of
Pauwels Contracting N.V., based in Belgium together with
its subsidiaries.
14 Value of imports (on C.I.F. basis)
(a) Raw materials 1574.31 1117.10
(b) Spare parts 7.80 10.80
(c) Capital goods 92.07 118.20
(d) Trading goods 144.64 185.10
15 Expenditure in foreign currency
(a) Technical / Testing fees 43.18 50.40
(b) Professional charges 24.99 31.20
(c) Interest 7.43 12.40
(d) Travelling, Commission on export etc. 176.97 118.10
16 Remittance in foreign currency on account of dividend :-
Final dividend 2003-04
(a) Number of non-resident shareholders - 493
(b) Number of shares held - 7900455
(c) Amount of dividend - 31.60
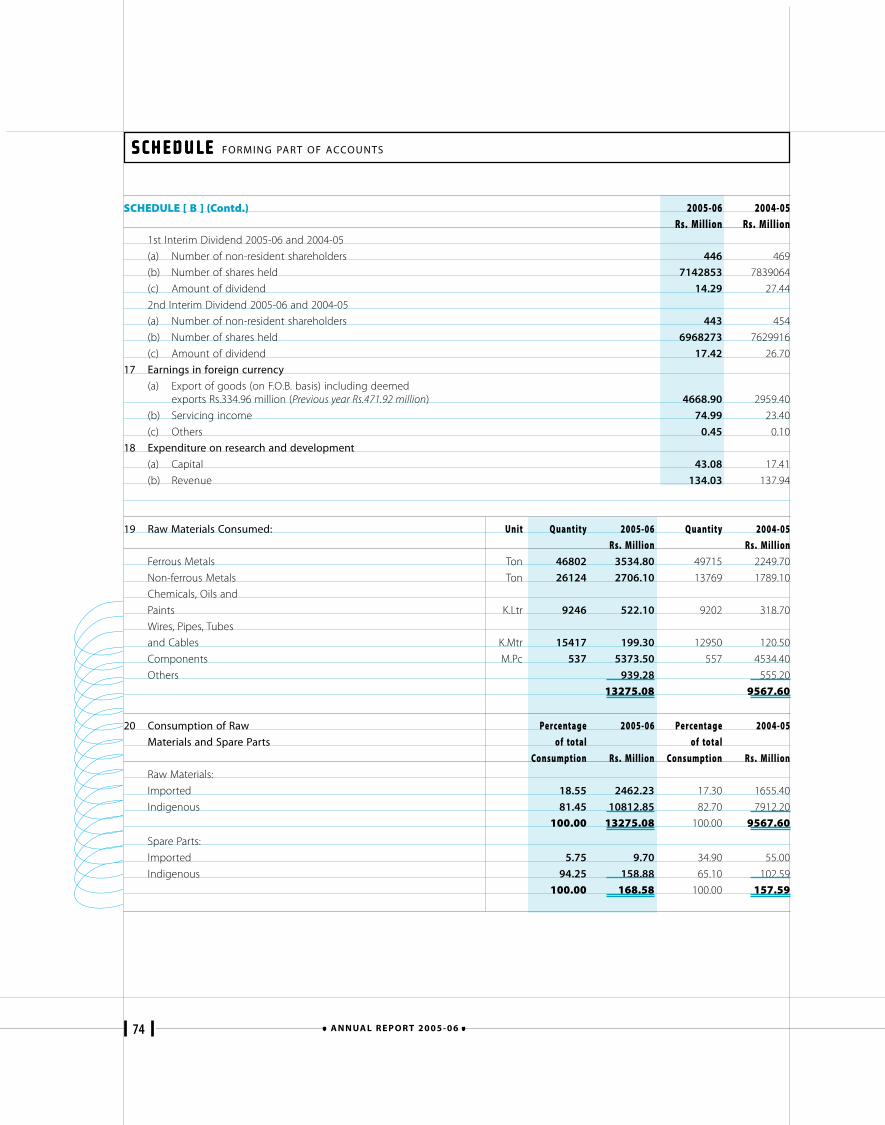
74 A N N UA L R E P O R T 2 0 0 5 - 0 6
SCHEDULE SCHEDULE SCHEDULE SCHEDULE SCHEDULE FORMING PART OF ACCOUNTS
SCHEDULE [ B ] (Contd.) 2005-06 2004-05Rs. Million Rs. Million
1st Interim Dividend 2005-06 and 2004-05
(a) Number of non-resident shareholders 446 469
(b) Number of shares held 7142853 7839064
(c) Amount of dividend 14.29 27.44
2nd Interim Dividend 2005-06 and 2004-05
(a) Number of non-resident shareholders 443 454
(b) Number of shares held 6968273 7629916
(c) Amount of dividend 17.42 26.70
17 Earnings in foreign currency
(a) Export of goods (on F.O.B. basis) including deemedexports Rs.334.96 million (Previous year Rs.471.92 million) 4668.90 2959.40
(b) Servicing income 74.99 23.40
(c) Others 0.45 0.10
18 Expenditure on research and development
(a) Capital 43.08 17.41
(b) Revenue 134.03 137.94
19 Raw Materials Consumed: Unit Quantity 2005-06 Quantity 2004-05Rs. Million Rs. Million
Ferrous Metals Ton 46802 3534.80 49715 2249.70
Non-ferrous Metals Ton 26124 2706.10 13769 1789.10
Chemicals, Oils and
Paints K.Ltr 9246 522.10 9202 318.70
Wires, Pipes, Tubes
and Cables K.Mtr 15417 199.30 12950 120.50
Components M.Pc 537 5373.50 557 4534.40
Others 939.28 555.20
13275.08 9567.60
20 Consumption of Raw Percentage 2005-06 Percentage 2004-05Materials and Spare Parts of total of total
Consumption Rs. Million Consumption Rs. MillionRaw Materials:
Imported 18.55 2462.23 17.30 1655.40
Indigenous 81.45 10812.85 82.70 7912.20
100.00 13275.08 100.00 9567.60
Spare Parts:
Imported 5.75 9.70 34.90 55.00
Indigenous 94.25 158.88 65.10 102.59
100.00 168.58 100.00 157.59
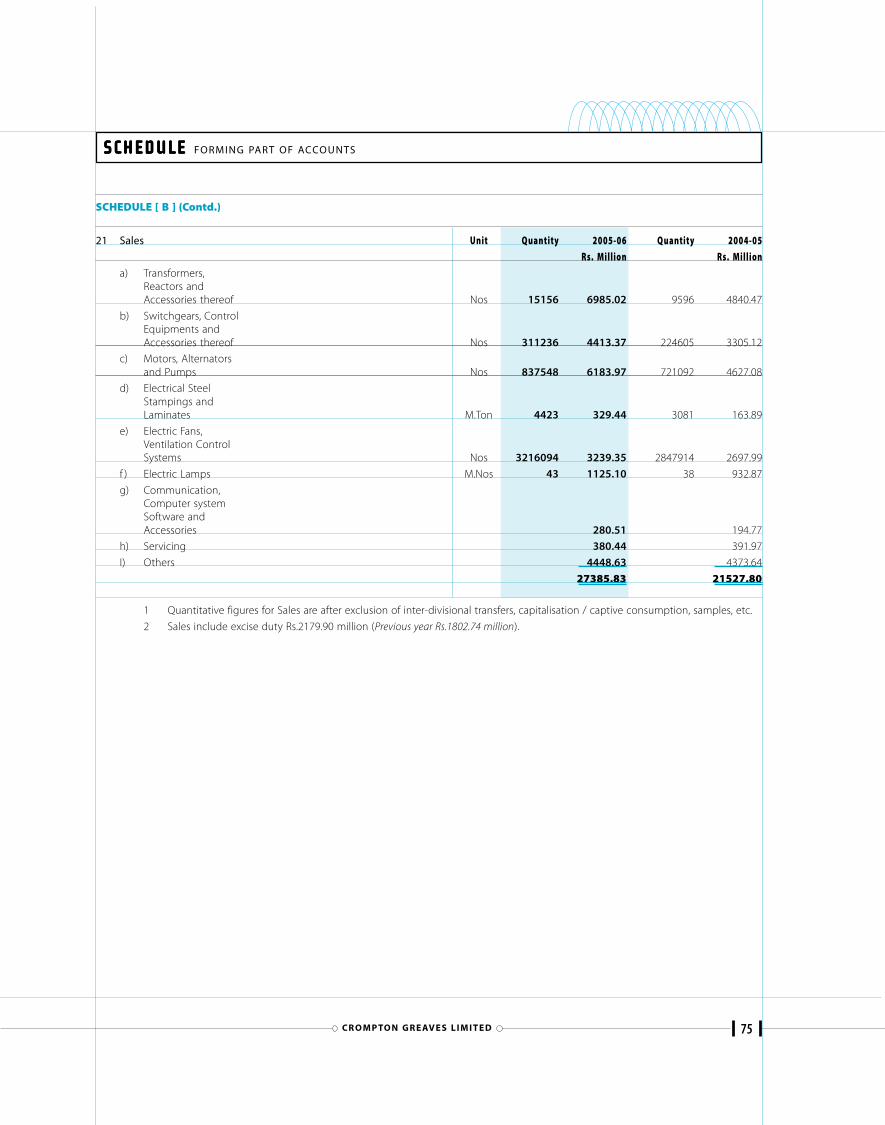
75CR O M P TO N G R E AV E S L I M I T E D
SCHEDULE SCHEDULE SCHEDULE SCHEDULE SCHEDULE FORMING PART OF ACCOUNTS
SCHEDULE [ B ] (Contd.)
21 Sales Unit Quantity 2005-06 Quantity 2004-05Rs. Million Rs. Million
a) Transformers,Reactors andAccessories thereof Nos 15156 6985.02 9596 4840.47
b) Switchgears, ControlEquipments andAccessories thereof Nos 311236 4413.37 224605 3305.12
c) Motors, Alternatorsand Pumps Nos 837548 6183.97 721092 4627.08
d) Electrical SteelStampings andLaminates M.Ton 4423 329.44 3081 163.89
e) Electric Fans,Ventilation ControlSystems Nos 3216094 3239.35 2847914 2697.99
f ) Electric Lamps M.Nos 43 1125.10 38 932.87
g) Communication,Computer systemSoftware andAccessories 280.51 194.77
h) Servicing 380.44 391.97
I) Others 4448.63 4373.64
27385.83 21527.80
1 Quantitative figures for Sales are after exclusion of inter-divisional transfers, capitalisation / captive consumption, samples, etc.
2 Sales include excise duty Rs.2179.90 million (Previous year Rs.1802.74 million).
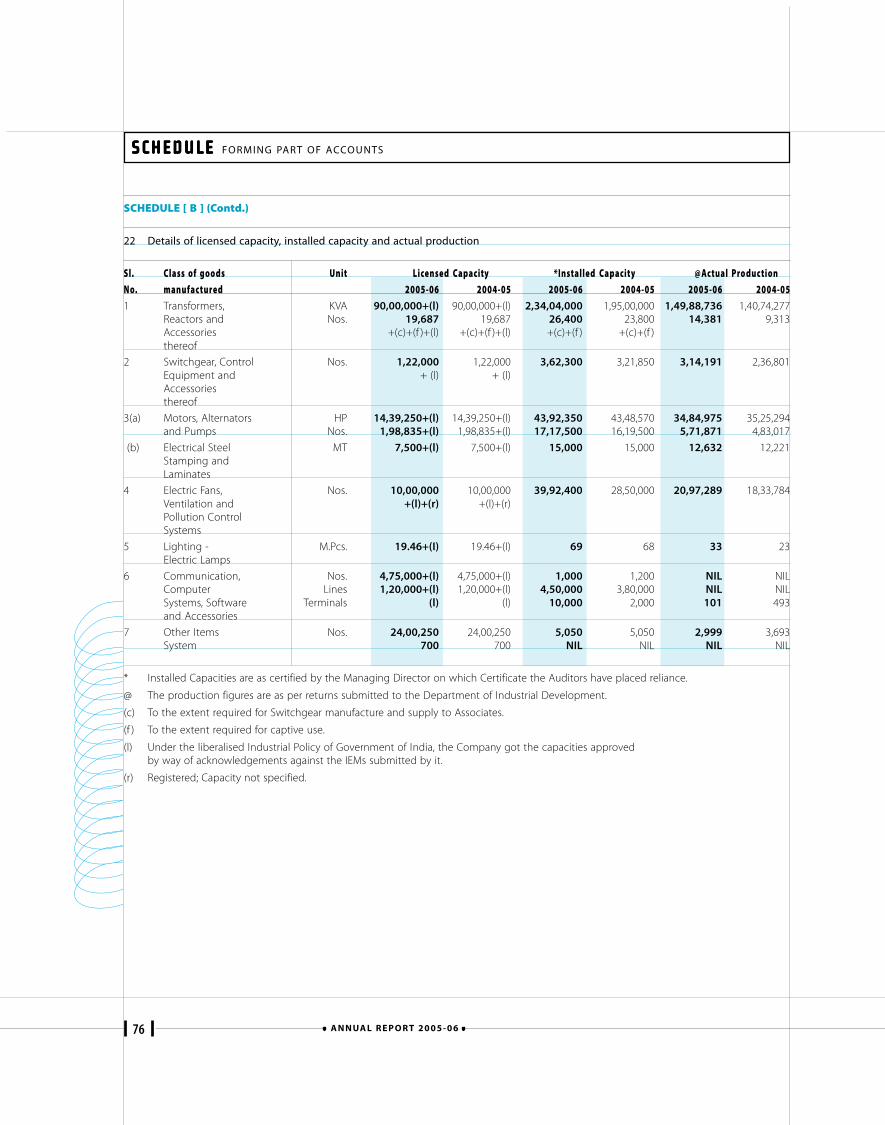
76 A N N UA L R E P O R T 2 0 0 5 - 0 6
SCHEDULE SCHEDULE SCHEDULE SCHEDULE SCHEDULE FORMING PART OF ACCOUNTS
SCHEDULE [ B ] (Contd.)
22 Details of licensed capacity, installed capacity and actual production
Sl. Class of goods Unit Licensed Capacity *Installed Capacity @Actual Produc tionNo. manufac tured 2005-06 2004-05 2005-06 2004-05 2005-06 2004-051 Transformers, KVA 90,00,000+(l) 90,00,000+(l) 2,34,04,000 1,95,00,000 1,49,88,736 1,40,74,277
Reactors and Nos. 19,687 19,687 26,400 23,800 14,381 9,313Accessories +(c)+(f )+(l) +(c)+(f )+(l) +(c)+(f ) +(c)+(f )thereof
2 Switchgear, Control Nos. 1,22,000 1,22,000 3,62,300 3,21,850 3,14,191 2,36,801Equipment and + (l) + (l)Accessoriesthereof
3(a) Motors, Alternators HP 14,39,250+(l) 14,39,250+(l) 43,92,350 43,48,570 34,84,975 35,25,294and Pumps Nos. 1,98,835+(l) 1,98,835+(l) 17,17,500 16,19,500 5,71,871 4,83,017
(b) Electrical Steel MT 7,500+(l) 7,500+(l) 15,000 15,000 12,632 12,221Stamping andLaminates
4 Electric Fans, Nos. 10,00,000 10,00,000 39,92,400 28,50,000 20,97,289 18,33,784Ventilation and +(l)+(r) +(l)+(r)Pollution ControlSystems
5 Lighting - M.Pcs. 19.46+(I) 19.46+(I) 69 68 33 23Electric Lamps
6 Communication, Nos. 4,75,000+(l) 4,75,000+(l) 1,000 1,200 NIL NILComputer Lines 1,20,000+(l) 1,20,000+(l) 4,50,000 3,80,000 NIL NILSystems, Software Terminals (l) (l) 10,000 2,000 101 493and Accessories
7 Other Items Nos. 24,00,250 24,00,250 5,050 5,050 2,999 3,693System 700 700 NIL NIL NIL NIL
* Installed Capacities are as certified by the Managing Director on which Certificate the Auditors have placed reliance.
@ The production figures are as per returns submitted to the Department of Industrial Development.
(c) To the extent required for Switchgear manufacture and supply to Associates.
(f ) To the extent required for captive use.
(l) Under the liberalised Industrial Policy of Government of India, the Company got the capacities approvedby way of acknowledgements against the IEMs submitted by it.
(r) Registered; Capacity not specified.
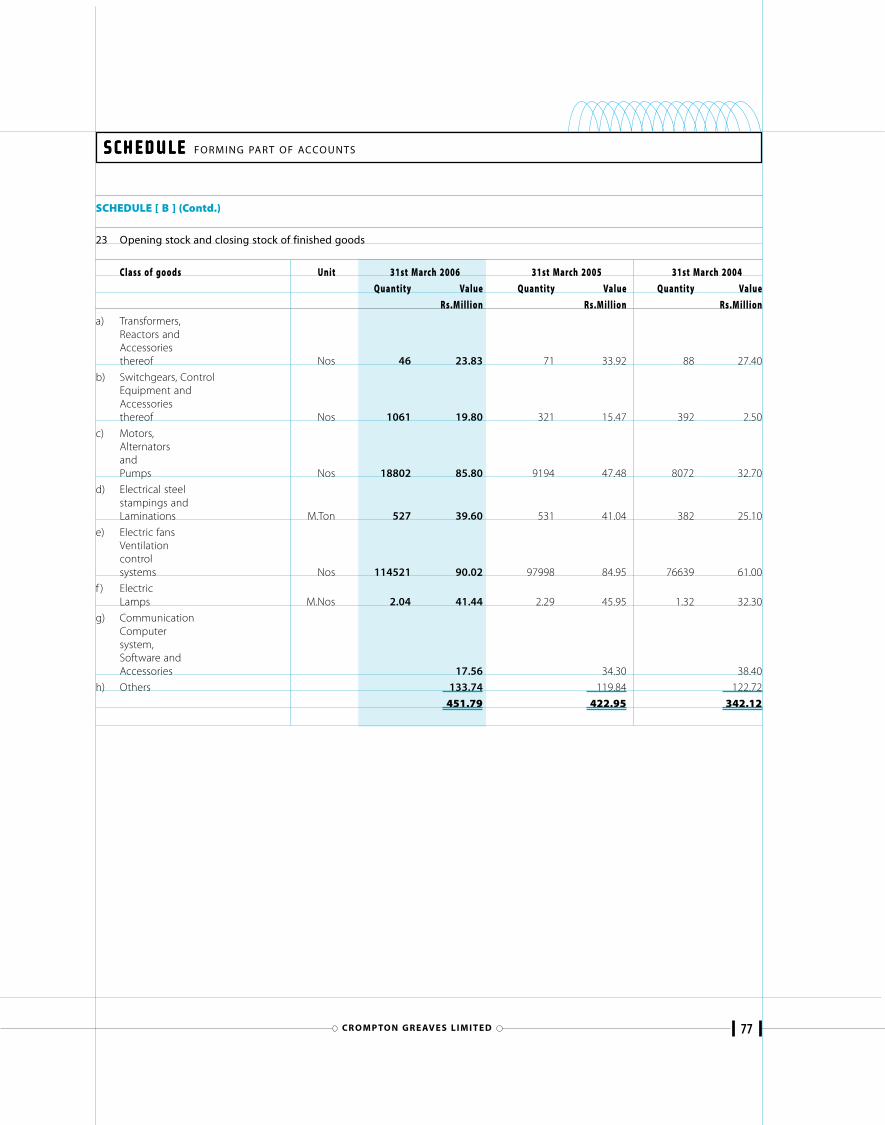
77CR O M P TO N G R E AV E S L I M I T E D
SCHEDULE SCHEDULE SCHEDULE SCHEDULE SCHEDULE FORMING PART OF ACCOUNTS
SCHEDULE [ B ] (Contd.)
23 Opening stock and closing stock of finished goods
Class of goods Unit 31st March 2006 31st March 2005 31st March 2004Quantity Value Quantity Value Quantity Value
Rs.M illion Rs.M illion Rs.M illiona) Transformers,
Reactors andAccessoriesthereof Nos 46 23.83 71 33.92 88 27.40
b) Switchgears, ControlEquipment andAccessoriesthereof Nos 1061 19.80 321 15.47 392 2.50
c) Motors,AlternatorsandPumps Nos 18802 85.80 9194 47.48 8072 32.70
d) Electrical steelstampings andLaminations M.Ton 527 39.60 531 41.04 382 25.10
e) Electric fansVentilationcontrolsystems Nos 114521 90.02 97998 84.95 76639 61.00
f ) ElectricLamps M.Nos 2.04 41.44 2.29 45.95 1.32 32.30
g) CommunicationComputersystem,Software andAccessories 17.56 34.30 38.40
h) Others 133.74 119.84 122.72
451.79 422.95 342.12
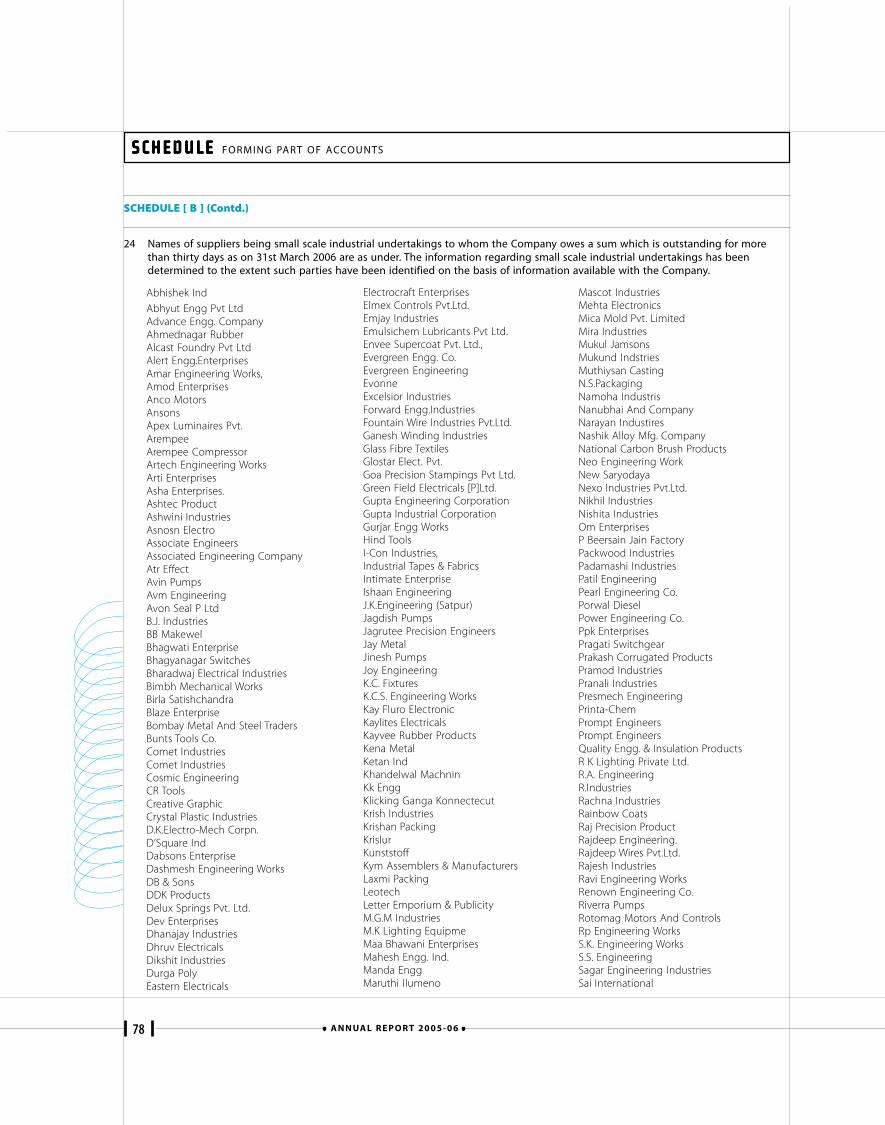
78 A N N UA L R E P O R T 2 0 0 5 - 0 6
SCHEDULE SCHEDULE SCHEDULE SCHEDULE SCHEDULE FORMING PART OF ACCOUNTS
SCHEDULE [ B ] (Contd.)
24 Names of suppliers being small scale industrial undertakings to whom the Company owes a sum which is outstanding for morethan thirty days as on 31st March 2006 are as under. The information regarding small scale industrial undertakings has beendetermined to the extent such parties have been identified on the basis of information available with the Company.
Abhishek IndAbhyut Engg Pvt LtdAdvance Engg. CompanyAhmednagar RubberAlcast Foundry Pvt LtdAlert Engg.EnterprisesAmar Engineering Works,Amod EnterprisesAnco MotorsAnsonsApex Luminaires Pvt.ArempeeArempee CompressorArtech Engineering WorksArti EnterprisesAsha Enterprises.Ashtec ProductAshwini IndustriesAsnosn ElectroAssociate EngineersAssociated Engineering CompanyAtr EffectAvin PumpsAvm EngineeringAvon Seal P LtdB.J. IndustriesBB MakewelBhagwati EnterpriseBhagyanagar SwitchesBharadwaj Electrical IndustriesBimbh Mechanical WorksBirla SatishchandraBlaze EnterpriseBombay Metal And Steel TradersBunts Tools Co.Comet IndustriesComet IndustriesCosmic EngineeringCR ToolsCreative GraphicCrystal Plastic IndustriesD.K.Electro-Mech Corpn.D’Square IndDabsons EnterpriseDashmesh Engineering WorksDB & SonsDDK ProductsDelux Springs Pvt. Ltd.Dev EnterprisesDhanajay IndustriesDhruv ElectricalsDikshit IndustriesDurga PolyEastern Electricals
Electrocraft EnterprisesElmex Controls Pvt.Ltd.Emjay IndustriesEmulsichem Lubricants Pvt Ltd.Envee Supercoat Pvt. Ltd.,Evergreen Engg. Co.Evergreen EngineeringEvonneExcelsior IndustriesForward Engg.IndustriesFountain Wire Industries Pvt.Ltd.Ganesh Winding IndustriesGlass Fibre TextilesGlostar Elect. Pvt.Goa Precision Stampings Pvt Ltd.Green Field Electricals [P]Ltd.Gupta Engineering CorporationGupta Industrial CorporationGurjar Engg WorksHind ToolsI-Con Industries,Industrial Tapes & FabricsIntimate EnterpriseIshaan EngineeringJ.K.Engineering (Satpur)Jagdish PumpsJagrutee Precision EngineersJay MetalJinesh PumpsJoy EngineeringK.C. FixturesK.C.S. Engineering WorksKay Fluro ElectronicKaylites ElectricalsKayvee Rubber ProductsKena MetalKetan IndKhandelwal MachninKk EnggKlicking Ganga KonnectecutKrish IndustriesKrishan PackingKrislurKunststoffKym Assemblers & ManufacturersLaxmi PackingLeotechLetter Emporium & PublicityM.G.M IndustriesM.K Lighting EquipmeMaa Bhawani EnterprisesMahesh Engg. Ind.Manda EnggMaruthi Ilumeno
Mascot IndustriesMehta ElectronicsMica Mold Pvt. LimitedMira IndustriesMukul JamsonsMukund IndstriesMuthiysan CastingN.S.PackagingNamoha IndustrisNanubhai And CompanyNarayan IndustiresNashik Alloy Mfg. CompanyNational Carbon Brush ProductsNeo Engineering WorkNew SaryodayaNexo Industries Pvt.Ltd.Nikhil IndustriesNishita IndustriesOm EnterprisesP Beersain Jain FactoryPackwood IndustriesPadamashi IndustriesPatil EngineeringPearl Engineering Co.Porwal DieselPower Engineering Co.Ppk EnterprisesPragati SwitchgearPrakash Corrugated ProductsPramod IndustriesPranali IndustriesPresmech EngineeringPrinta-ChemPrompt EngineersPrompt EngineersQuality Engg. & Insulation ProductsR K Lighting Private Ltd.R.A. EngineeringR.IndustriesRachna IndustriesRainbow CoatsRaj Precision ProductRajdeep Engineering.Rajdeep Wires Pvt.Ltd.Rajesh IndustriesRavi Engineering WorksRenown Engineering Co.Riverra PumpsRotomag Motors And ControlsRp Engineering WorksS.K. Engineering WorksS.S. EngineeringSagar Engineering IndustriesSai International
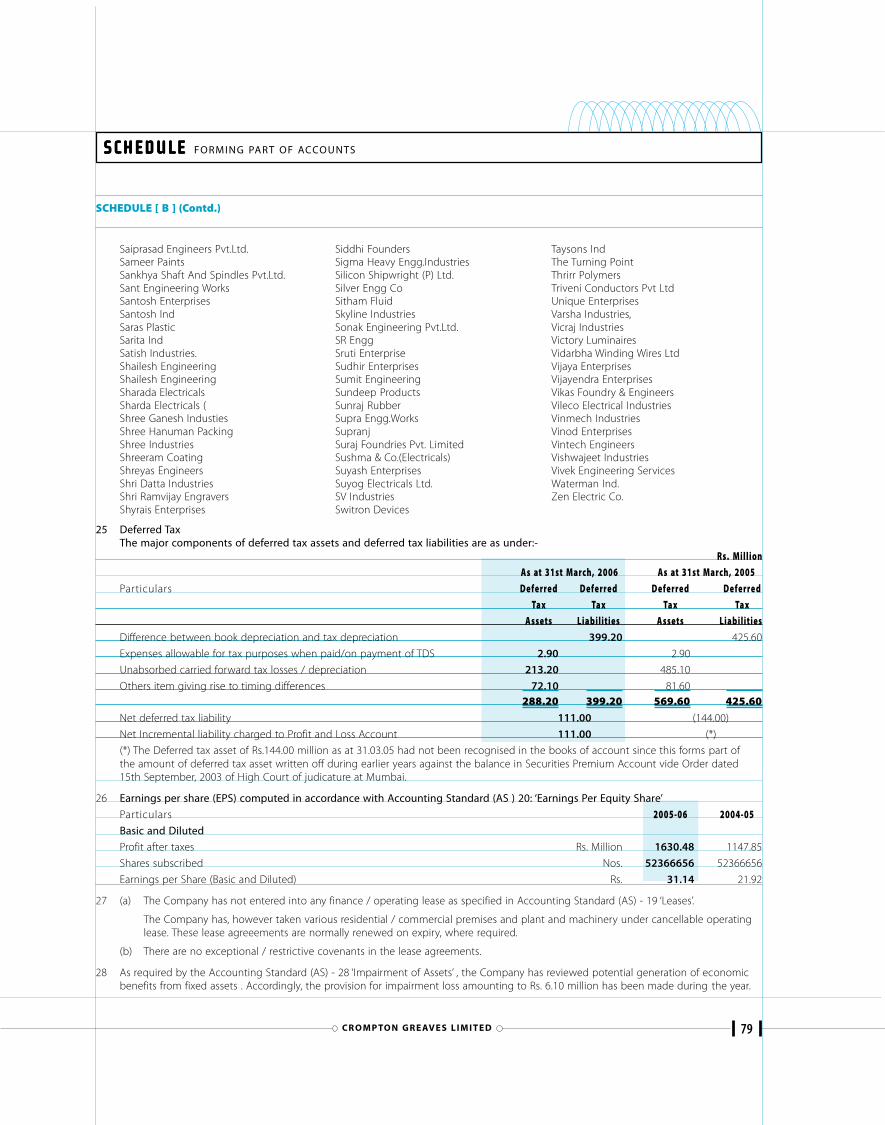
79CR O M P TO N G R E AV E S L I M I T E D
SCHEDULE SCHEDULE SCHEDULE SCHEDULE SCHEDULE FORMING PART OF ACCOUNTS
SCHEDULE [ B ] (Contd.)
25 Deferred TaxThe major components of deferred tax assets and deferred tax liabilities are as under:-
Rs. MillionAs at 31st March, 2006 As at 31st March, 2005
Particulars Deferre d Deferre d Deferre d Deferre dTax Tax Tax Tax
Assets Liabilities Assets LiabilitiesDifference between book depreciation and tax depreciation 399.20 425.60
Expenses allowable for tax purposes when paid/on payment of TDS 2.90 2.90
Unabsorbed carried forward tax losses / depreciation 213.20 485.10
Others item giving rise to timing differences 72.10 81.60288.20 399.20 569.60 425.60
Net deferred tax liability 111.00 (144.00)
Net Incremental liability charged to Profit and Loss Account 111.00 (*)
(*) The Deferred tax asset of Rs.144.00 million as at 31.03.05 had not been recognised in the books of account since this forms part ofthe amount of deferred tax asset written off during earlier years against the balance in Securities Premium Account vide Order dated15th September, 2003 of High Court of judicature at Mumbai.
26 Earnings per share (EPS) computed in accordance with Accounting Standard (AS ) 20: ‘Earnings Per Equity Share’
Particulars 2005-06 2004-05Basic and Diluted
Profit after taxes Rs. Million 1630.48 1147.85
Shares subscribed Nos. 52366656 52366656
Earnings per Share (Basic and Diluted) Rs. 31.14 21.92
27 (a) The Company has not entered into any finance / operating lease as specified in Accounting Standard (AS) - 19 ‘Leases’.
The Company has, however taken various residential / commercial premises and plant and machinery under cancellable operatinglease. These lease agreeements are normally renewed on expiry, where required.
(b) There are no exceptional / restrictive covenants in the lease agreements.
28 As required by the Accounting Standard (AS) - 28 ‘Impairment of Assets’ , the Company has reviewed potential generation of economicbenefits from fixed assets . Accordingly, the provision for impairment loss amounting to Rs. 6.10 million has been made during the year.
Saiprasad Engineers Pvt.Ltd.Sameer PaintsSankhya Shaft And Spindles Pvt.Ltd.Sant Engineering WorksSantosh EnterprisesSantosh IndSaras PlasticSarita IndSatish Industries.Shailesh EngineeringShailesh EngineeringSharada ElectricalsSharda Electricals (Shree Ganesh IndustiesShree Hanuman PackingShree IndustriesShreeram CoatingShreyas EngineersShri Datta IndustriesShri Ramvijay EngraversShyrais Enterprises
Siddhi FoundersSigma Heavy Engg.IndustriesSilicon Shipwright (P) Ltd.Silver Engg CoSitham FluidSkyline IndustriesSonak Engineering Pvt.Ltd.SR EnggSruti EnterpriseSudhir EnterprisesSumit EngineeringSundeep ProductsSunraj RubberSupra Engg.WorksSupranjSuraj Foundries Pvt. LimitedSushma & Co.(Electricals)Suyash EnterprisesSuyog Electricals Ltd.SV IndustriesSwitron Devices
Taysons IndThe Turning PointThrirr PolymersTriveni Conductors Pvt LtdUnique EnterprisesVarsha Industries,Vicraj IndustriesVictory LuminairesVidarbha Winding Wires LtdVijaya EnterprisesVijayendra EnterprisesVikas Foundry & EngineersVileco Electrical IndustriesVinmech IndustriesVinod EnterprisesVintech EngineersVishwajeet IndustriesVivek Engineering ServicesWaterman Ind.Zen Electric Co.
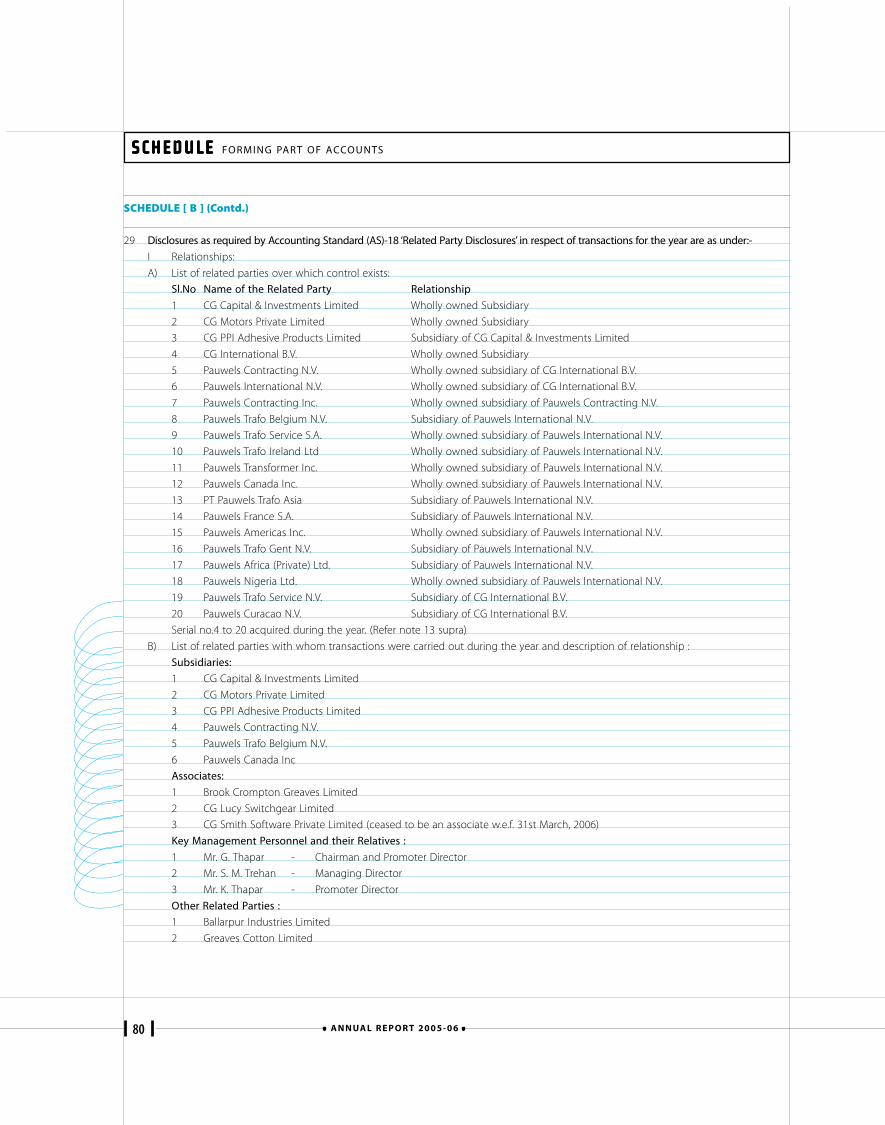
80 A N N UA L R E P O R T 2 0 0 5 - 0 6
SCHEDULE SCHEDULE SCHEDULE SCHEDULE SCHEDULE FORMING PART OF ACCOUNTS
SCHEDULE [ B ] (Contd.)
29 Disclosures as required by Accounting Standard (AS)-18 ‘Related Party Disclosures’ in respect of transactions for the year are as under:-
I Relationships:
A) List of related parties over which control exists:
Sl.No Name of the Related Party Relationship
1 CG Capital & Investments Limited Wholly owned Subsidiary
2 CG Motors Private Limited Wholly owned Subsidiary
3 CG PPI Adhesive Products Limited Subsidiary of CG Capital & Investments Limited
4 CG International B.V. Wholly owned Subsidiary
5 Pauwels Contracting N.V. Wholly owned subsidiary of CG International B.V.
6 Pauwels International N.V. Wholly owned subsidiary of CG International B.V.
7 Pauwels Contracting Inc. Wholly owned subsidiary of Pauwels Contracting N.V.
8 Pauwels Trafo Belgium N.V. Subsidiary of Pauwels International N.V.
9 Pauwels Trafo Service S.A. Wholly owned subsidiary of Pauwels International N.V.
10 Pauwels Trafo Ireland Ltd Wholly owned subsidiary of Pauwels International N.V.
11 Pauwels Transformer Inc. Wholly owned subsidiary of Pauwels International N.V.
12 Pauwels Canada Inc. Wholly owned subsidiary of Pauwels International N.V.
13 PT Pauwels Trafo Asia Subsidiary of Pauwels International N.V.
14 Pauwels France S.A. Subsidiary of Pauwels International N.V.
15 Pauwels Americas Inc. Wholly owned subsidiary of Pauwels International N.V.
16 Pauwels Trafo Gent N.V. Subsidiary of Pauwels International N.V.
17 Pauwels Africa (Private) Ltd. Subsidiary of Pauwels International N.V.
18 Pauwels Nigeria Ltd. Wholly owned subsidiary of Pauwels International N.V.
19 Pauwels Trafo Service N.V. Subsidiary of CG International B.V.
20 Pauwels Curacao N.V. Subsidiary of CG International B.V.
Serial no.4 to 20 acquired during the year. (Refer note 13 supra)
B) List of related parties with whom transactions were carried out during the year and description of relationship :
Subsidiaries:
1 CG Capital & Investments Limited
2 CG Motors Private Limited
3 CG PPI Adhesive Products Limited
4 Pauwels Contracting N.V.
5 Pauwels Trafo Belgium N.V.
6 Pauwels Canada Inc
Associates:
1 Brook Crompton Greaves Limited
2 CG Lucy Switchgear Limited
3 CG Smith Software Private Limited (ceased to be an associate w.e.f. 31st March, 2006)
Key Management Personnel and their Relatives :
1 Mr. G. Thapar - Chairman and Promoter Director
2 Mr. S. M. Trehan - Managing Director
3 Mr. K. Thapar - Promoter Director
Other Related Parties :
1 Ballarpur Industries Limited
2 Greaves Cotton Limited
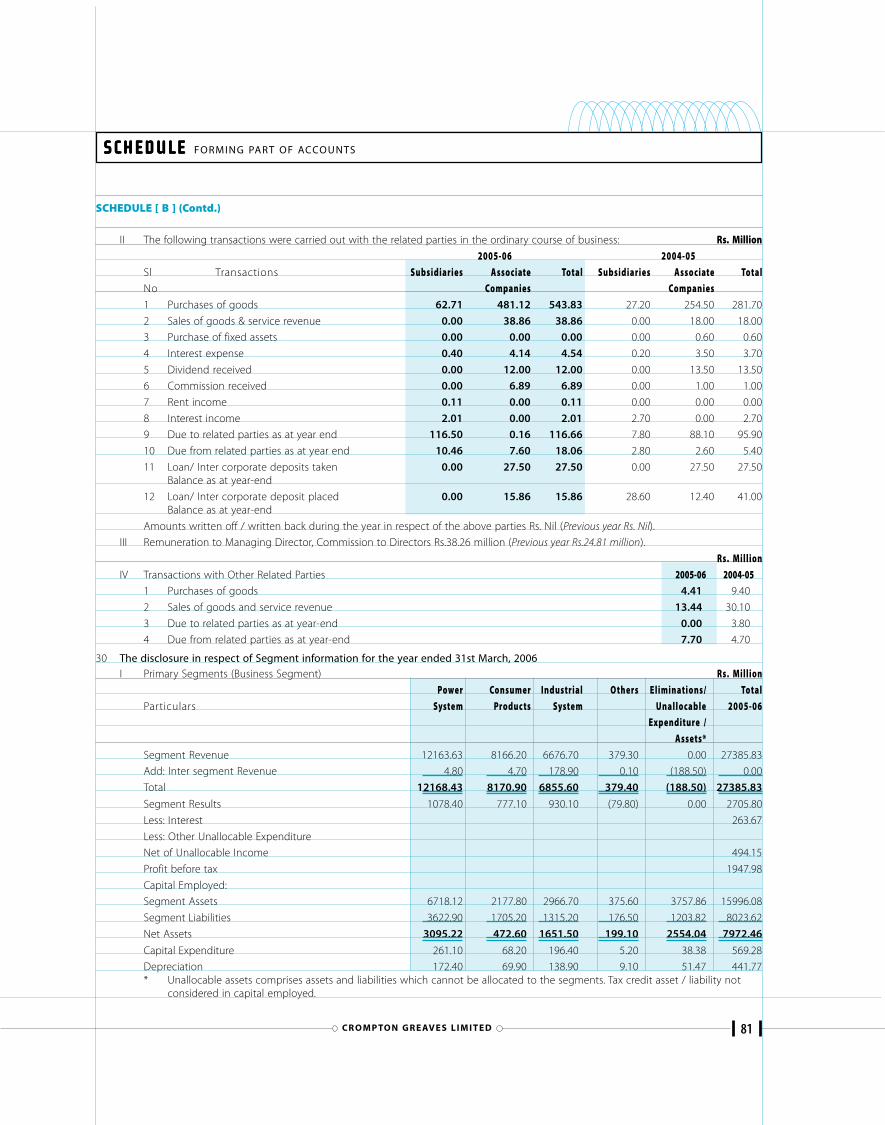
81CR O M P TO N G R E AV E S L I M I T E D
SCHEDULE SCHEDULE SCHEDULE SCHEDULE SCHEDULE FORMING PART OF ACCOUNTS
SCHEDULE [ B ] (Contd.)
II The following transactions were carried out with the related parties in the ordinary course of business: Rs. Million2005-06 2004-05
Sl Transactions Subsidiaries Associate Total Subsidiaries Asso ciate TotalNo Companies Companies1 Purchases of goods 62.71 481.12 543.83 27.20 254.50 281.70
2 Sales of goods & service revenue 0.00 38.86 38.86 0.00 18.00 18.00
3 Purchase of fixed assets 0.00 0.00 0.00 0.00 0.60 0.60
4 Interest expense 0.40 4.14 4.54 0.20 3.50 3.70
5 Dividend received 0.00 12.00 12.00 0.00 13.50 13.50
6 Commission received 0.00 6.89 6.89 0.00 1.00 1.00
7 Rent income 0.11 0.00 0.11 0.00 0.00 0.00
8 Interest income 2.01 0.00 2.01 2.70 0.00 2.70
9 Due to related parties as at year end 116.50 0.16 116.66 7.80 88.10 95.90
10 Due from related parties as at year end 10.46 7.60 18.06 2.80 2.60 5.40
11 Loan/ Inter corporate deposits taken 0.00 27.50 27.50 0.00 27.50 27.50Balance as at year-end
12 Loan/ Inter corporate deposit placed 0.00 15.86 15.86 28.60 12.40 41.00Balance as at year-end
Amounts written off / written back during the year in respect of the above parties Rs. Nil (Previous year Rs. Nil).
III Remuneration to Managing Director, Commission to Directors Rs.38.26 million (Previous year Rs.24.81 million).
Rs. MillionIV Transactions with Other Related Parties 2005-06 2004-05
1 Purchases of goods 4.41 9.40
2 Sales of goods and service revenue 13.44 30.10
3 Due to related parties as at year-end 0.00 3.80
4 Due from related parties as at year-end 7.70 4.70
30 The disclosure in respect of Segment information for the year ended 31st March, 2006I Primary Segments (Business Segment) Rs. Million
Power Consumer Industrial Others Eliminations/ TotalParticulars Syste m Produc ts Syste m Unallocable 2005-06
Expenditure /Assets*
Segment Revenue 12163.63 8166.20 6676.70 379.30 0.00 27385.83
Add: Inter segment Revenue 4.80 4.70 178.90 0.10 (188.50) 0.00
Total 12168.43 8170.90 6855.60 379.40 (188.50) 27385.83
Segment Results 1078.40 777.10 930.10 (79.80) 0.00 2705.80
Less: Interest 263.67
Less: Other Unallocable Expenditure
Net of Unallocable Income 494.15
Profit before tax 1947.98
Capital Employed:
Segment Assets 6718.12 2177.80 2966.70 375.60 3757.86 15996.08
Segment Liabilities 3622.90 1705.20 1315.20 176.50 1203.82 8023.62
Net Assets 3095.22 472.60 1651.50 199.10 2554.04 7972.46
Capital Expenditure 261.10 68.20 196.40 5.20 38.38 569.28
Depreciation 172.40 69.90 138.90 9.10 51.47 441.77* Unallocable assets comprises assets and liabilities which cannot be allocated to the segments. Tax credit asset / liability not
considered in capital employed.
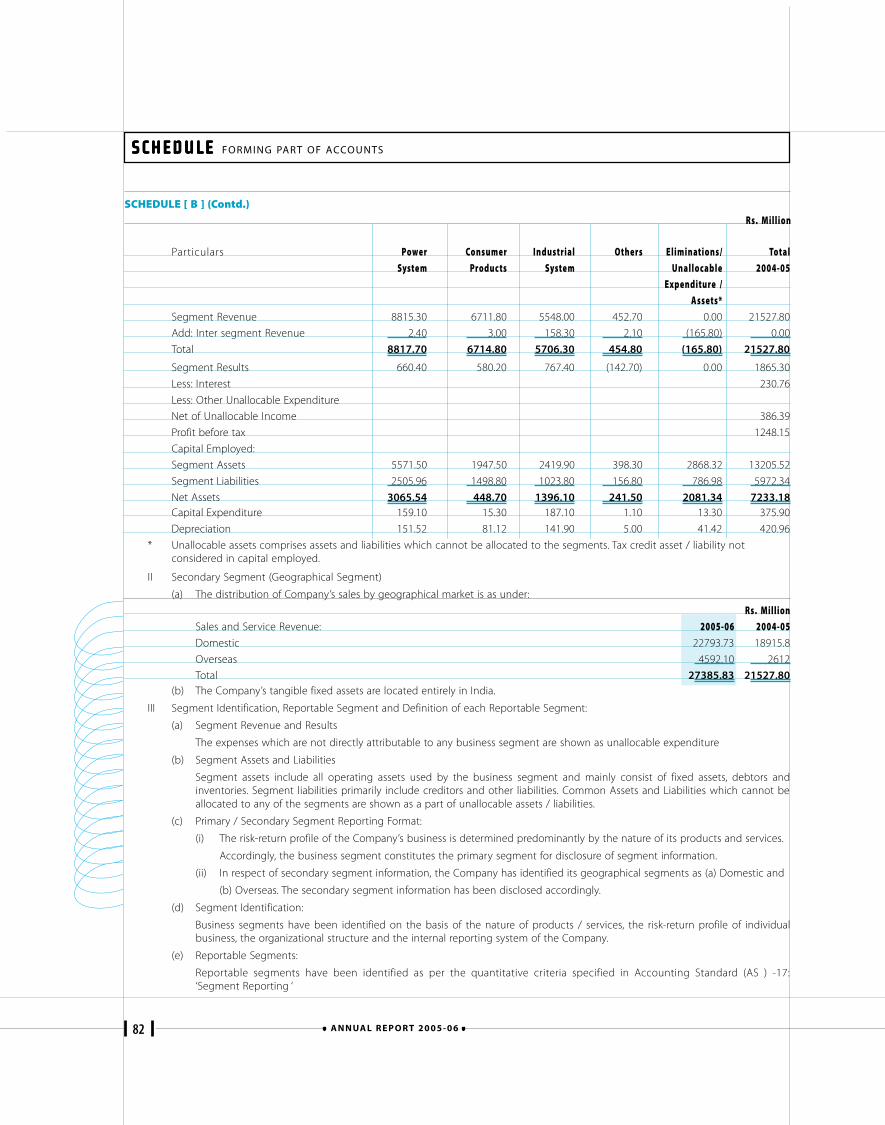
82 A N N UA L R E P O R T 2 0 0 5 - 0 6
SCHEDULE SCHEDULE SCHEDULE SCHEDULE SCHEDULE FORMING PART OF ACCOUNTS
SCHEDULE [ B ] (Contd.)Rs. Million
Particulars Power Consumer Industrial Others Eliminations/ TotalSyste m Produc ts Syste m Unallocable 2004-05
Expenditure /Assets*
Segment Revenue 8815.30 6711.80 5548.00 452.70 0.00 21527.80
Add: Inter segment Revenue 2.40 3.00 158.30 2.10 (165.80) 0.00
Total 8817.70 6714.80 5706.30 454.80 (165.80) 21527.80
Segment Results 660.40 580.20 767.40 (142.70) 0.00 1865.30
Less: Interest 230.76
Less: Other Unallocable Expenditure
Net of Unallocable Income 386.39
Profit before tax 1248.15
Capital Employed:
Segment Assets 5571.50 1947.50 2419.90 398.30 2868.32 13205.52
Segment Liabilities 2505.96 1498.80 1023.80 156.80 786.98 5972.34
Net Assets 3065.54 448.70 1396.10 241.50 2081.34 7233.18Capital Expenditure 159.10 15.30 187.10 1.10 13.30 375.90
Depreciation 151.52 81.12 141.90 5.00 41.42 420.96
* Unallocable assets comprises assets and liabilities which cannot be allocated to the segments. Tax credit asset / liability notconsidered in capital employed.
II Secondary Segment (Geographical Segment)
(a) The distribution of Company’s sales by geographical market is as under:
Rs. MillionSales and Service Revenue: 2005-06 2004-05Domestic 22793.73 18915.8
Overseas 4592.10 2612
Total 27385.83 21527.80(b) The Company’s tangible fixed assets are located entirely in India.
III Segment Identification, Reportable Segment and Definition of each Reportable Segment:
(a) Segment Revenue and Results
The expenses which are not directly attributable to any business segment are shown as unallocable expenditure
(b) Segment Assets and Liabilities
Segment assets include all operating assets used by the business segment and mainly consist of fixed assets, debtors andinventories. Segment liabilities primarily include creditors and other liabilities. Common Assets and Liabilities which cannot beallocated to any of the segments are shown as a part of unallocable assets / liabilities.
(c) Primary / Secondary Segment Reporting Format:
(i) The risk-return profile of the Company’s business is determined predominantly by the nature of its products and services.
Accordingly, the business segment constitutes the primary segment for disclosure of segment information.
(ii) In respect of secondary segment information, the Company has identified its geographical segments as (a) Domestic and
(b) Overseas. The secondary segment information has been disclosed accordingly.
(d) Segment Identification:
Business segments have been identified on the basis of the nature of products / services, the risk-return profile of individualbusiness, the organizational structure and the internal reporting system of the Company.
(e) Reportable Segments:
Reportable segments have been identified as per the quantitative criteria specified in Accounting Standard (AS ) -17:‘Segment Reporting ‘
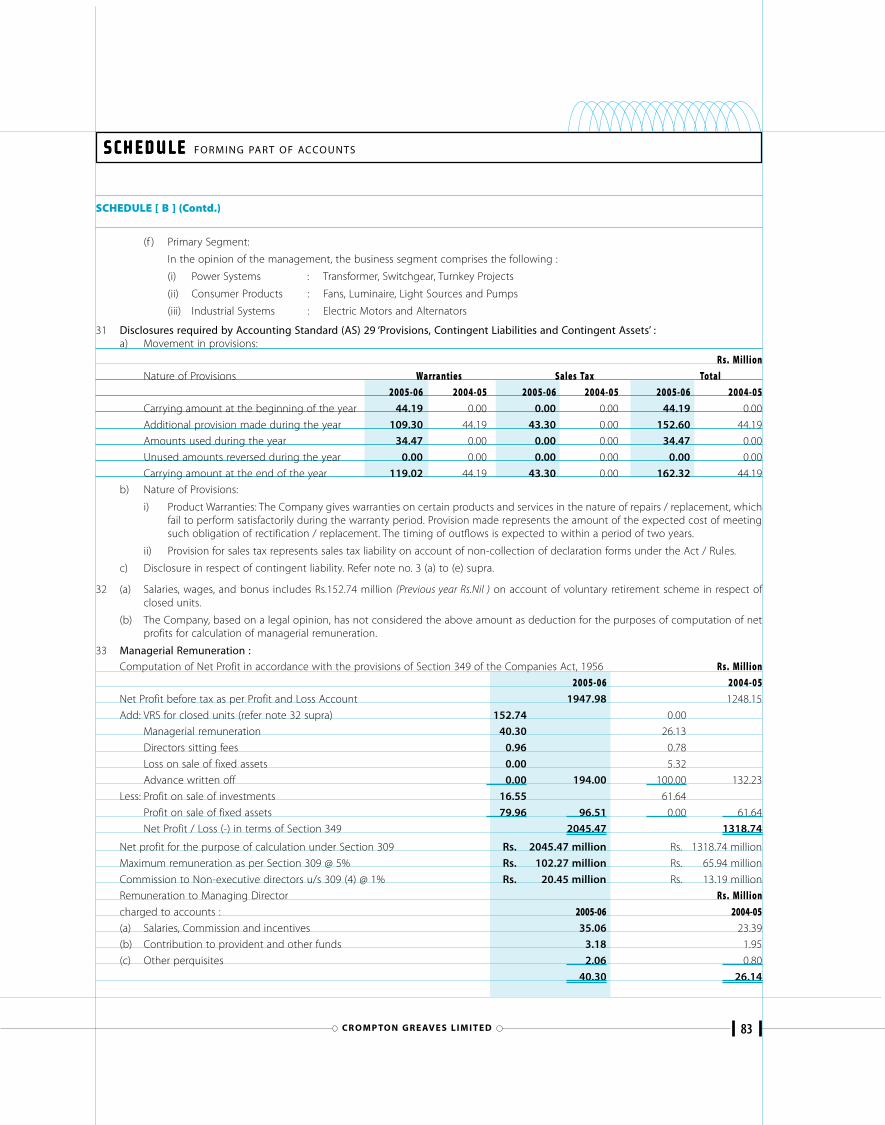
83CR O M P TO N G R E AV E S L I M I T E D
SCHEDULE SCHEDULE SCHEDULE SCHEDULE SCHEDULE FORMING PART OF ACCOUNTS
SCHEDULE [ B ] (Contd.)
31 Disclosures required by Accounting Standard (AS) 29 ‘Provisions, Contingent Liabilities and Contingent Assets’ :a) Movement in provisions:
Rs. MillionNature of Provisions Warra nties Sales Tax Total
2005-06 2004-05 2005-06 2004-05 2005-06 2004-05Carrying amount at the beginning of the year 44.19 0.00 0.00 0.00 44.19 0.00
Additional provision made during the year 109.30 44.19 43.30 0.00 152.60 44.19
Amounts used during the year 34.47 0.00 0.00 0.00 34.47 0.00
Unused amounts reversed during the year 0.00 0.00 0.00 0.00 0.00 0.00
Carrying amount at the end of the year 119.02 44.19 43.30 0.00 162.32 44.19
b) Nature of Provisions:
i) Product Warranties: The Company gives warranties on certain products and services in the nature of repairs / replacement, whichfail to perform satisfactorily during the warranty period. Provision made represents the amount of the expected cost of meetingsuch obligation of rectification / replacement. The timing of outflows is expected to within a period of two years.
ii) Provision for sales tax represents sales tax liability on account of non-collection of declaration forms under the Act / Rules.
c) Disclosure in respect of contingent liability. Refer note no. 3 (a) to (e) supra.
32 (a) Salaries, wages, and bonus includes Rs.152.74 million (Previous year Rs.Nil ) on account of voluntary retirement scheme in respect ofclosed units.
(b) The Company, based on a legal opinion, has not considered the above amount as deduction for the purposes of computation of netprofits for calculation of managerial remuneration.
33 Managerial Remuneration :Computation of Net Profit in accordance with the provisions of Section 349 of the Companies Act, 1956 Rs. Million
2005-06 2004-05Net Profit before tax as per Profit and Loss Account 1947.98 1248.15
Add: VRS for closed units (refer note 32 supra) 152.74 0.00
Managerial remuneration 40.30 26.13
Directors sitting fees 0.96 0.78
Loss on sale of fixed assets 0.00 5.32
Advance written off 0.00 194.00 100.00 132.23
Less: Profit on sale of investments 16.55 61.64
Profit on sale of fixed assets 79.96 96.51 0.00 61.64
Net Profit / Loss (-) in terms of Section 349 2045.47 1318.74
Net profit for the purpose of calculation under Section 309 Rs. 2045.47 million Rs. 1318.74 million
Maximum remuneration as per Section 309 @ 5% Rs. 102.27 million Rs. 65.94 million
Commission to Non-executive directors u/s 309 (4) @ 1% Rs. 20.45 million Rs. 13.19 million
Remuneration to Managing Director Rs. Millioncharged to accounts : 2005-06 2004-05(a) Salaries, Commission and incentives 35.06 23.39
(b) Contribution to provident and other funds 3.18 1.95
(c) Other perquisites 2.06 0.80
40.30 26.14
(f ) Primary Segment:
In the opinion of the management, the business segment comprises the following :
(i) Power Systems : Transformer, Switchgear, Turnkey Projects
(ii) Consumer Products : Fans, Luminaire, Light Sources and Pumps
(iii) Industrial Systems : Electric Motors and Alternators
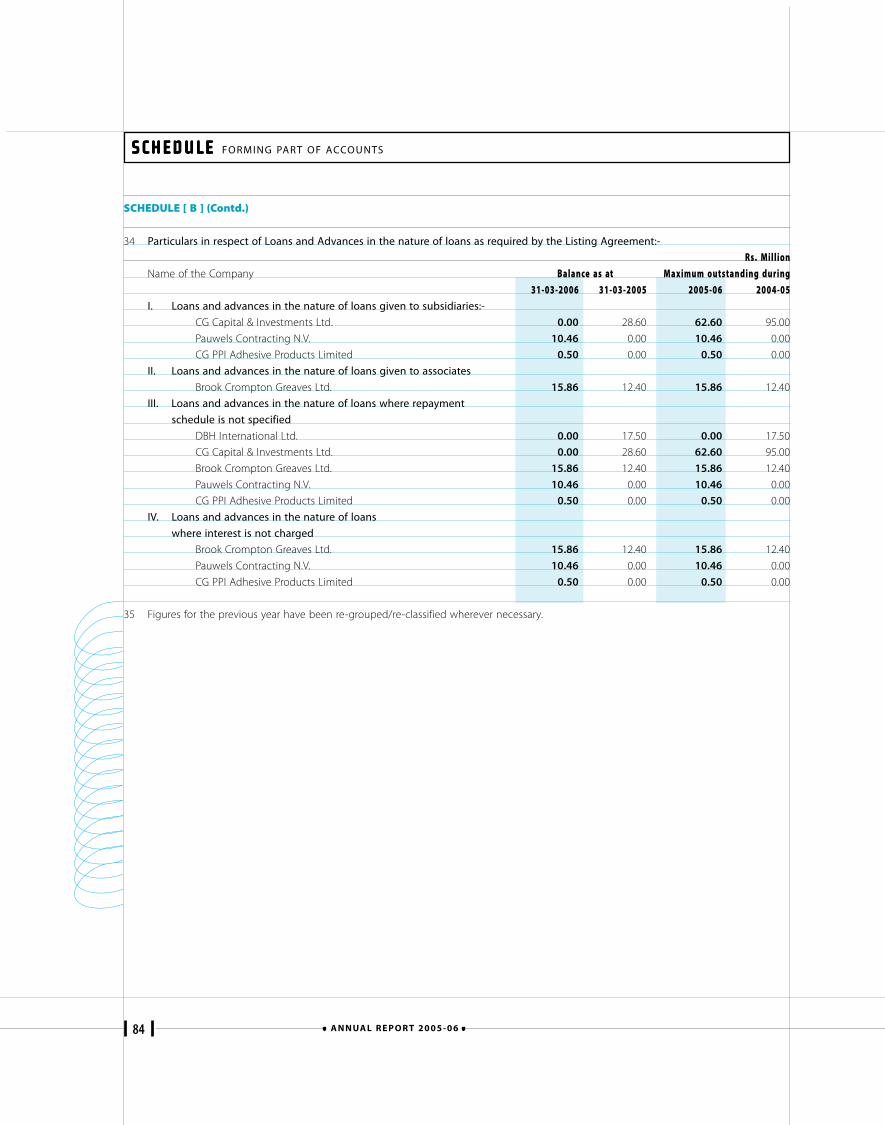
84 A N N UA L R E P O R T 2 0 0 5 - 0 6
SCHEDULE SCHEDULE SCHEDULE SCHEDULE SCHEDULE FORMING PART OF ACCOUNTS
SCHEDULE [ B ] (Contd.)
34 Particulars in respect of Loans and Advances in the nature of loans as required by the Listing Agreement:-
Rs. MillionName of the Company Balance as at Maximum outstanding during
31-03-2006 31-03-2005 2005-06 2004-05I. Loans and advances in the nature of loans given to subsidiaries:-
CG Capital & Investments Ltd. 0.00 28.60 62.60 95.00
Pauwels Contracting N.V. 10.46 0.00 10.46 0.00
CG PPI Adhesive Products Limited 0.50 0.00 0.50 0.00
II. Loans and advances in the nature of loans given to associates
Brook Crompton Greaves Ltd. 15.86 12.40 15.86 12.40
III. Loans and advances in the nature of loans where repayment
schedule is not specified
DBH International Ltd. 0.00 17.50 0.00 17.50
CG Capital & Investments Ltd. 0.00 28.60 62.60 95.00
Brook Crompton Greaves Ltd. 15.86 12.40 15.86 12.40
Pauwels Contracting N.V. 10.46 0.00 10.46 0.00
CG PPI Adhesive Products Limited 0.50 0.00 0.50 0.00
IV. Loans and advances in the nature of loans
where interest is not charged
Brook Crompton Greaves Ltd. 15.86 12.40 15.86 12.40
Pauwels Contracting N.V. 10.46 0.00 10.46 0.00
CG PPI Adhesive Products Limited 0.50 0.00 0.50 0.00
35 Figures for the previous year have been re-grouped/re-classified wherever necessary.
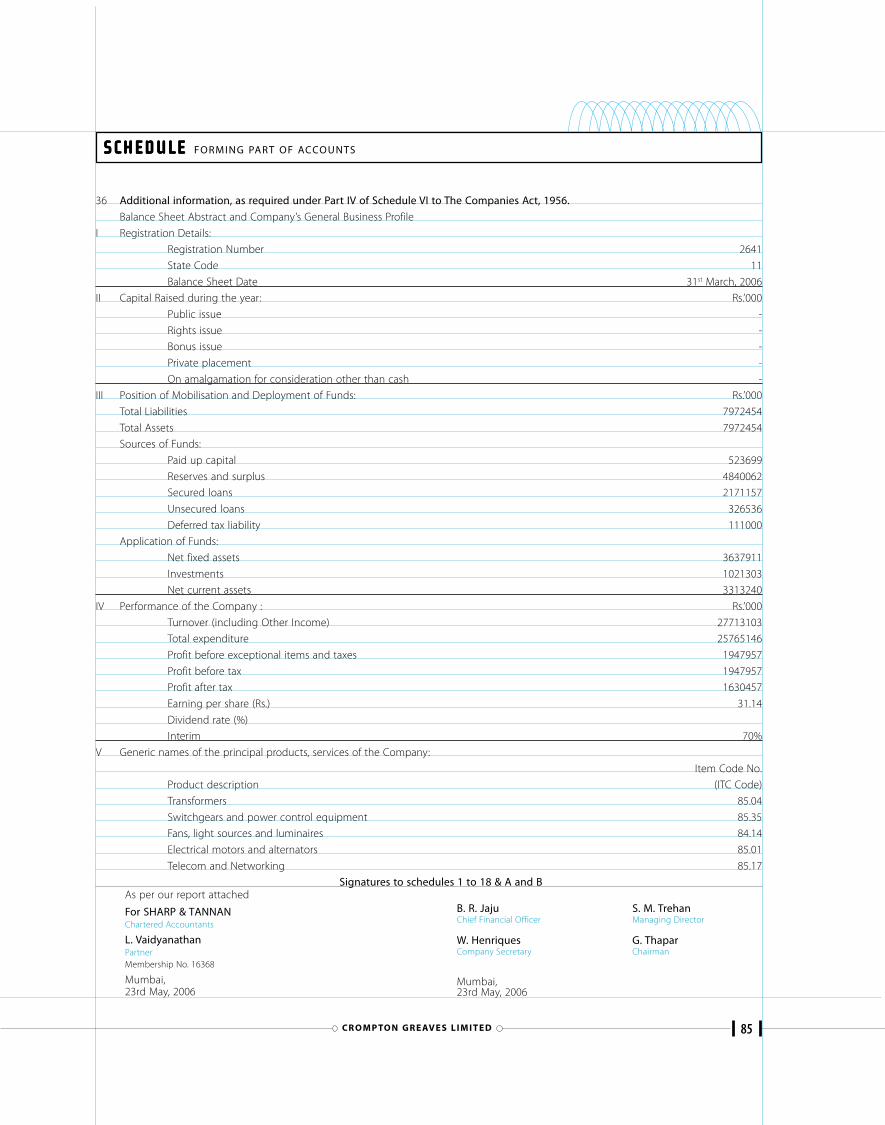
85CR O M P TO N G R E AV E S L I M I T E D
36 Additional information, as required under Part IV of Schedule VI to The Companies Act, 1956.
Balance Sheet Abstract and Company’s General Business Profile
I Registration Details:
Registration Number 2641
State Code 11
Balance Sheet Date 31st March, 2006
II Capital Raised during the year: Rs.’000
Public issue -
Rights issue -
Bonus issue -
Private placement -
On amalgamation for consideration other than cash -
III Position of Mobilisation and Deployment of Funds: Rs.’000
Total Liabilities 7972454
Total Assets 7972454
Sources of Funds:
Paid up capital 523699
Reserves and surplus 4840062
Secured loans 2171157
Unsecured loans 326536
Deferred tax liability 111000
Application of Funds:
Net fixed assets 3637911
Investments 1021303
Net current assets 3313240
IV Performance of the Company : Rs.’000
Turnover (including Other Income) 27713103
Total expenditure 25765146
Profit before exceptional items and taxes 1947957
Profit before tax 1947957
Profit after tax 1630457
Earning per share (Rs.) 31.14
Dividend rate (%)
Interim 70%
V Generic names of the principal products, services of the Company:
Item Code No.
Product description (ITC Code)
Transformers 85.04
Switchgears and power control equipment 85.35
Fans, light sources and luminaires 84.14
Electrical motors and alternators 85.01
Telecom and Networking 85.17
Signatures to schedules 1 to 18 & A and B
SCHEDULE SCHEDULE SCHEDULE SCHEDULE SCHEDULE FORMING PART OF ACCOUNTS
B. R. Jaju S. M. TrehanChief Financial Officer Managing Director
W. Henriques G. ThaparCompany Secretary Chairman
Mumbai,23rd May, 2006
As per our report attached
For SHARP & TANNANChartered Accountants
L. VaidyanathanPartnerMembership No. 16368
Mumbai,23rd May, 2006
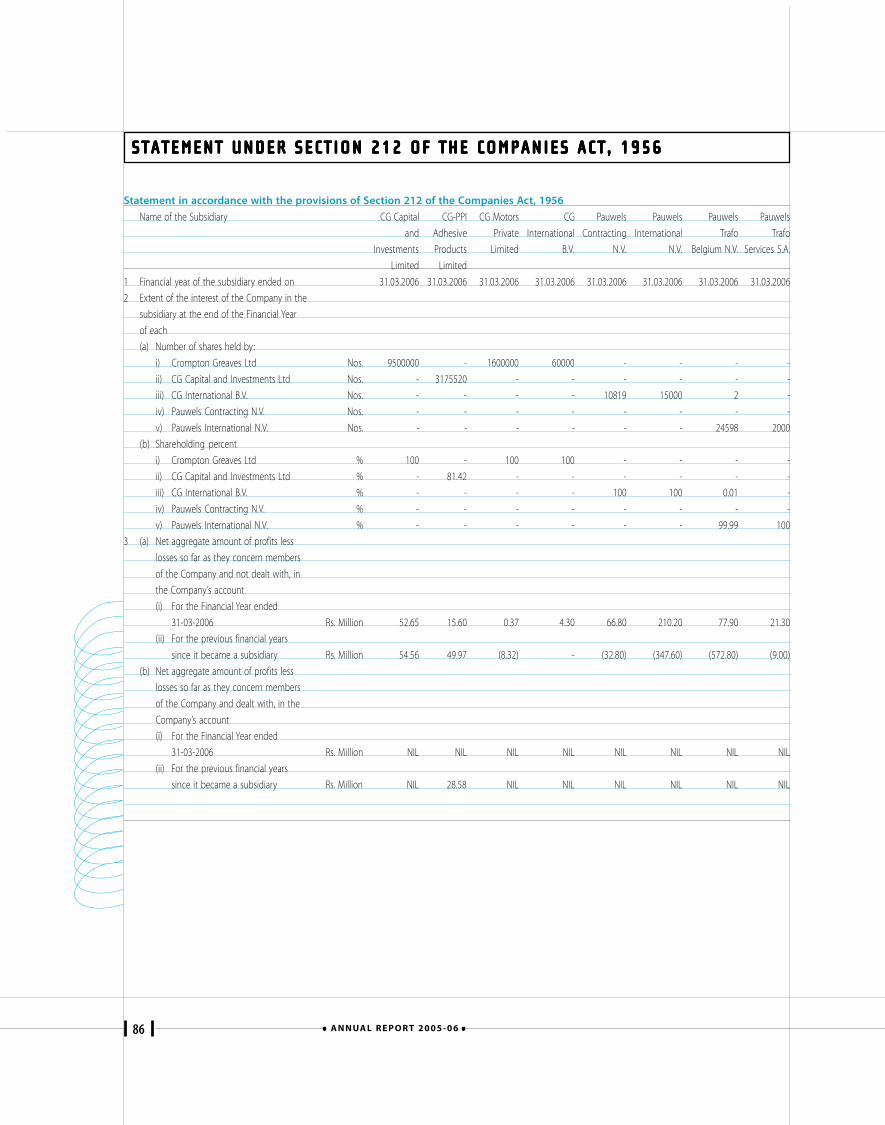
86 A N N UA L R E P O R T 2 0 0 5 - 0 6
STATEMENT UNDER SECTION 212 OF THE COMPANIES ACT , 1956STATEMENT UNDER SECTION 212 OF THE COMPANIES ACT , 1956STATEMENT UNDER SECTION 212 OF THE COMPANIES ACT , 1956STATEMENT UNDER SECTION 212 OF THE COMPANIES ACT , 1956STATEMENT UNDER SECTION 212 OF THE COMPANIES ACT , 1956
Statement in accordance with the provisions of Section 212 of the Companies Act, 1956
Name of the Subsidiary CG Capital CG-PPI CG Motors CG Pauwels Pauwels Pauwels Pauwels
and Adhesive Private International Contracting International Trafo Trafo
Investments Products Limited B.V. N.V. N.V. Belgium N.V. Services S.A.
Limited Limited
1 Financial year of the subsidiary ended on 31.03.2006 31.03.2006 31.03.2006 31.03.2006 31.03.2006 31.03.2006 31.03.2006 31.03.2006
2 Extent of the interest of the Company in the
subsidiary at the end of the Financial Year
of each
(a) Number of shares held by:
i) Crompton Greaves Ltd Nos. 9500000 - 1600000 60000 - - - -
ii) CG Capital and Investments Ltd Nos. - 3175520 - - - - - -
iii) CG International B.V. Nos. - - - - 10819 15000 2 -
iv) Pauwels Contracting N.V. Nos. - - - - - - - -
v) Pauwels International N.V. Nos. - - - - - - 24598 2000
(b) Shareholding percent
i) Crompton Greaves Ltd % 100 - 100 100 - - - -
ii) CG Capital and Investments Ltd % - 81.42 - - - - - -
iii) CG International B.V. % - - - - 100 100 0.01 -
iv) Pauwels Contracting N.V. % - - - - - - - -
v) Pauwels International N.V. % - - - - - - 99.99 100
3 (a) Net aggregate amount of profits less
losses so far as they concern members
of the Company and not dealt with, in
the Company’s account
(i) For the Financial Year ended
31-03-2006 Rs. Million 52.65 15.60 0.37 4.30 66.80 210.20 77.90 21.30
(ii) For the previous financial years
since it became a subsidiary Rs. Million 54.56 49.97 (8.32) - (32.80) (347.60) (572.80) (9.00)
(b) Net aggregate amount of profits less
losses so far as they concern members
of the Company and dealt with, in the
Company’s account
(i) For the Financial Year ended
31-03-2006 Rs. Million NIL NIL NIL NIL NIL NIL NIL NIL
(ii) For the previous financial years
since it became a subsidiary Rs. Million NIL 28.58 NIL NIL NIL NIL NIL NIL
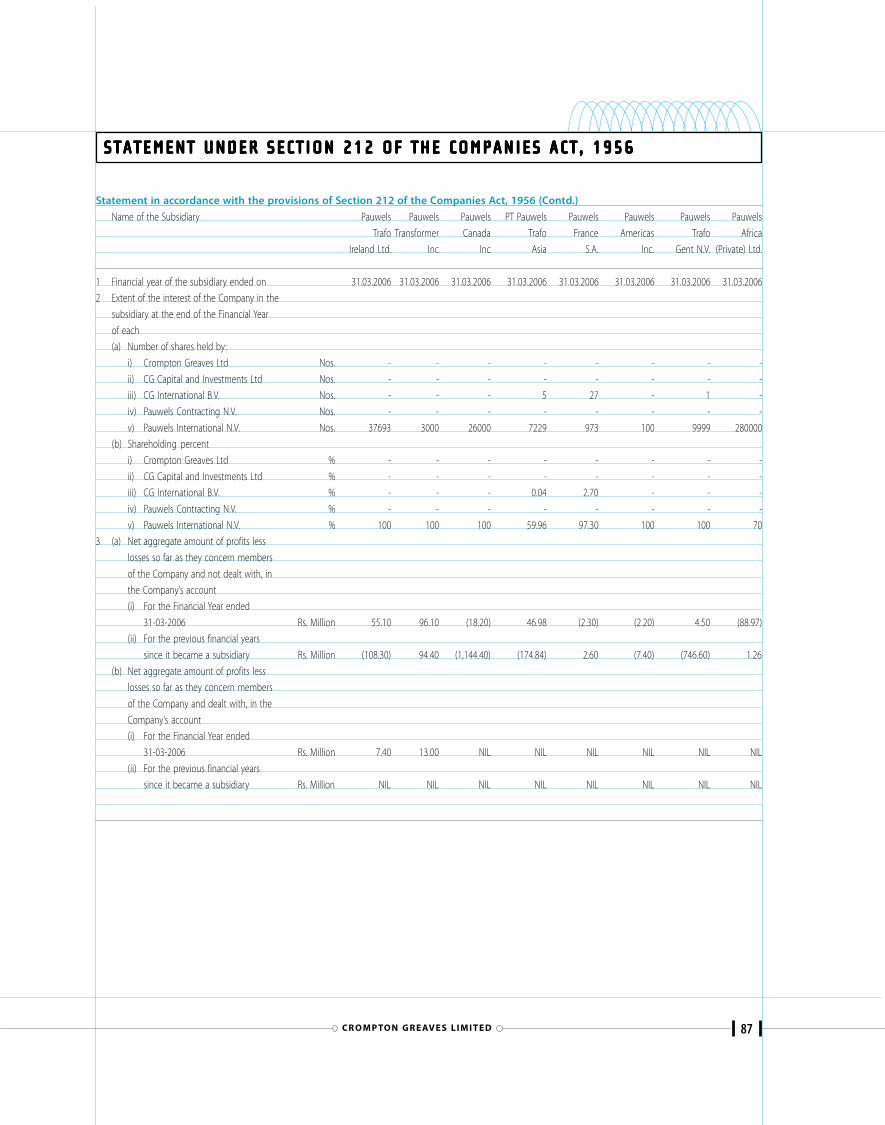
87CR O M P TO N G R E AV E S L I M I T E D
STATEMENT UNDER SECTION 212 OF THE COMPANIES ACT , 1956STATEMENT UNDER SECTION 212 OF THE COMPANIES ACT , 1956STATEMENT UNDER SECTION 212 OF THE COMPANIES ACT , 1956STATEMENT UNDER SECTION 212 OF THE COMPANIES ACT , 1956STATEMENT UNDER SECTION 212 OF THE COMPANIES ACT , 1956
Statement in accordance with the provisions of Section 212 of the Companies Act, 1956 (Contd.)
Name of the Subsidiary Pauwels Pauwels Pauwels PT Pauwels Pauwels Pauwels Pauwels Pauwels
Trafo Transformer Canada Trafo France Americas Trafo Africa
Ireland Ltd. Inc Inc Asia S.A. Inc. Gent N.V. (Private) Ltd.
1 Financial year of the subsidiary ended on 31.03.2006 31.03.2006 31.03.2006 31.03.2006 31.03.2006 31.03.2006 31.03.2006 31.03.2006
2 Extent of the interest of the Company in the
subsidiary at the end of the Financial Year
of each
(a) Number of shares held by:
i) Crompton Greaves Ltd Nos. - - - - - - - -
ii) CG Capital and Investments Ltd Nos. - - - - - - - -
iii) CG International B.V. Nos. - - - 5 27 - 1 -
iv) Pauwels Contracting N.V. Nos. - - - - - - - -
v) Pauwels International N.V. Nos. 37693 3000 26000 7229 973 100 9999 280000
(b) Shareholding percent
i) Crompton Greaves Ltd % - - - - - - - -
ii) CG Capital and Investments Ltd % - - - - - - - -
iii) CG International B.V. % - - - 0.04 2.70 - - -
iv) Pauwels Contracting N.V. % - - - - - - - -
v) Pauwels International N.V. % 100 100 100 59.96 97.30 100 100 70
3 (a) Net aggregate amount of profits less
losses so far as they concern members
of the Company and not dealt with, in
the Company’s account
(i) For the Financial Year ended
31-03-2006 Rs. Million 55.10 96.10 (18.20) 46.98 (2.30) (2.20) 4.50 (88.97)
(ii) For the previous financial years
since it became a subsidiary Rs. Million (108.30) 94.40 (1,144.40) (174.84) 2.60 (7.40) (746.60) 1.26
(b) Net aggregate amount of profits less
losses so far as they concern members
of the Company and dealt with, in the
Company’s account
(i) For the Financial Year ended
31-03-2006 Rs. Million 7.40 13.00 NIL NIL NIL NIL NIL NIL
(ii) For the previous financial years
since it became a subsidiary Rs. Million NIL NIL NIL NIL NIL NIL NIL NIL
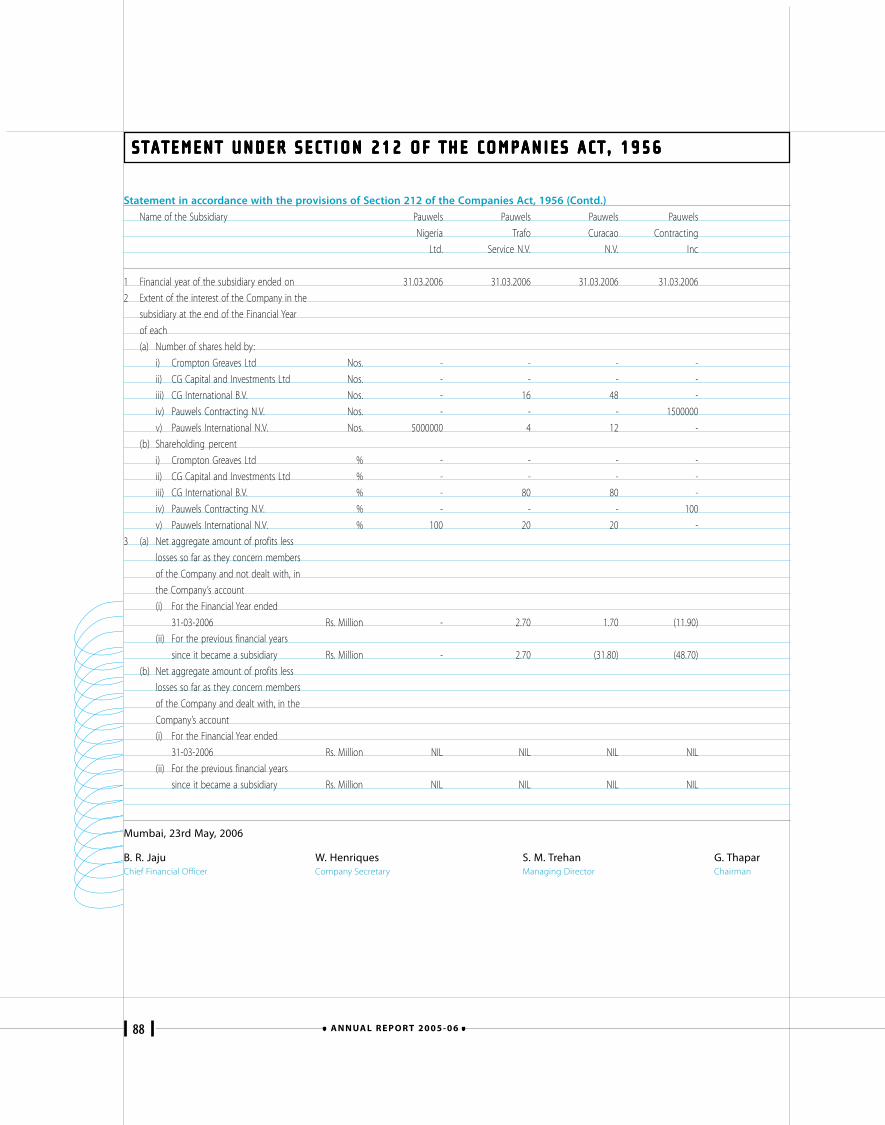
88 A N N UA L R E P O R T 2 0 0 5 - 0 6
STATEMENT UNDER SECTION 212 OF THE COMPANIES ACT , 1956STATEMENT UNDER SECTION 212 OF THE COMPANIES ACT , 1956STATEMENT UNDER SECTION 212 OF THE COMPANIES ACT , 1956STATEMENT UNDER SECTION 212 OF THE COMPANIES ACT , 1956STATEMENT UNDER SECTION 212 OF THE COMPANIES ACT , 1956
Statement in accordance with the provisions of Section 212 of the Companies Act, 1956 (Contd.)
Name of the Subsidiary Pauwels Pauwels Pauwels Pauwels
Nigeria Trafo Curacao Contracting
Ltd. Service N.V. N.V. Inc
1 Financial year of the subsidiary ended on 31.03.2006 31.03.2006 31.03.2006 31.03.2006
2 Extent of the interest of the Company in the
subsidiary at the end of the Financial Year
of each
(a) Number of shares held by:
i) Crompton Greaves Ltd Nos. - - - -
ii) CG Capital and Investments Ltd Nos. - - - -
iii) CG International B.V. Nos. - 16 48 -
iv) Pauwels Contracting N.V. Nos. - - - 1500000
v) Pauwels International N.V. Nos. 5000000 4 12 -
(b) Shareholding percent
i) Crompton Greaves Ltd % - - - -
ii) CG Capital and Investments Ltd % - - - -
iii) CG International B.V. % - 80 80 -
iv) Pauwels Contracting N.V. % - - - 100
v) Pauwels International N.V. % 100 20 20 -
3 (a) Net aggregate amount of profits less
losses so far as they concern members
of the Company and not dealt with, in
the Company’s account
(i) For the Financial Year ended
31-03-2006 Rs. Million - 2.70 1.70 (11.90)
(ii) For the previous financial years
since it became a subsidiary Rs. Million - 2.70 (31.80) (48.70)
(b) Net aggregate amount of profits less
losses so far as they concern members
of the Company and dealt with, in the
Company’s account
(i) For the Financial Year ended
31-03-2006 Rs. Million NIL NIL NIL NIL
(ii) For the previous financial years
since it became a subsidiary Rs. Million NIL NIL NIL NIL
Mumbai, 23rd May, 2006
B. R. Jaju W. Henriques S. M. Trehan G. ThaparChief Financial Officer Company Secretary Managing Director Chairman
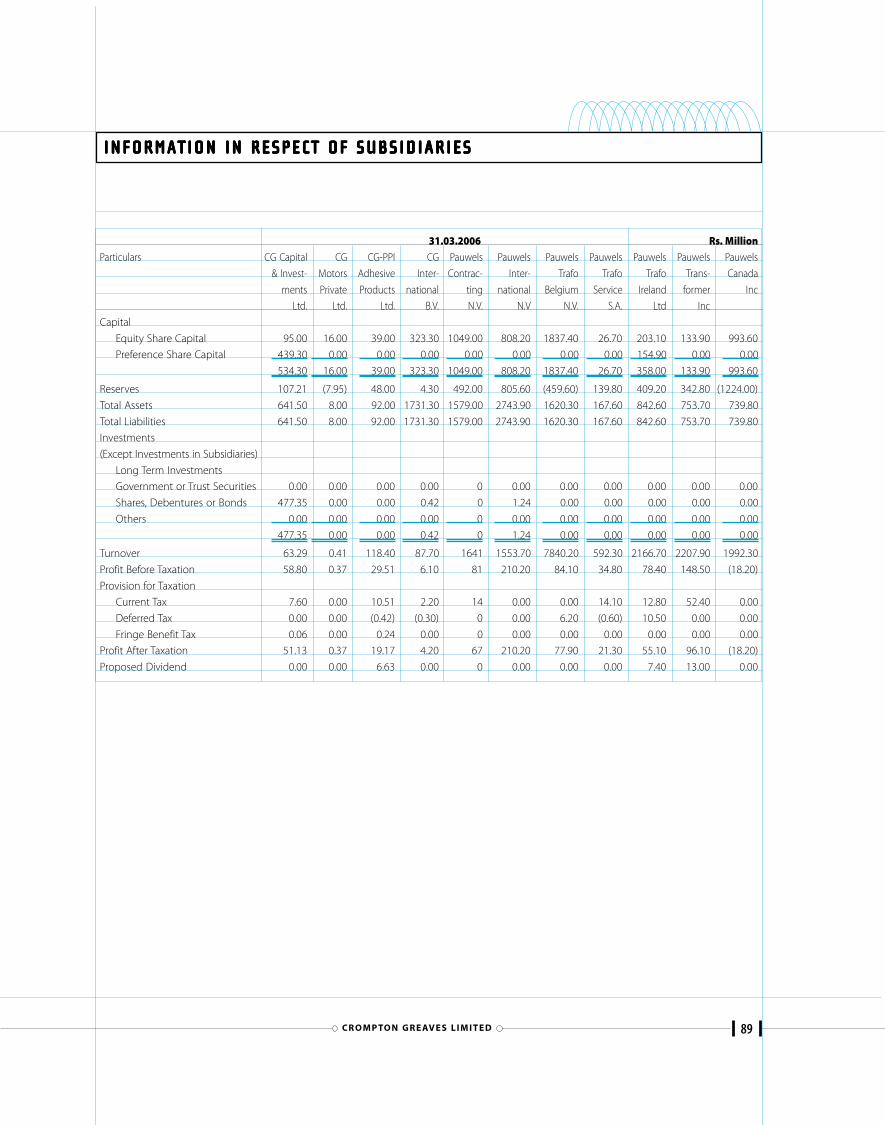
89CR O M P TO N G R E AV E S L I M I T E D
INFORMATION IN RESPECT OF SUBSIDIARIESINFORMATION IN RESPECT OF SUBSIDIARIESINFORMATION IN RESPECT OF SUBSIDIARIESINFORMATION IN RESPECT OF SUBSIDIARIESINFORMATION IN RESPECT OF SUBSIDIARIES
31.03.2006 Rs. MillionParticulars CG Capital CG CG-PPI CG Pauwels Pauwels Pauwels Pauwels Pauwels Pauwels Pauwels
& Invest- Motors Adhesive Inter- Contrac- Inter- Trafo Trafo Trafo Trans- Canada
ments Private Products national ting national Belgium Service Ireland former Inc
Ltd. Ltd. Ltd. B.V. N.V. N.V N.V. S.A. Ltd Inc
Capital
Equity Share Capital 95.00 16.00 39.00 323.30 1049.00 808.20 1837.40 26.70 203.10 133.90 993.60
Preference Share Capital 439.30 0.00 0.00 0.00 0.00 0.00 0.00 0.00 154.90 0.00 0.00
534.30 16.00 39.00 323.30 1049.00 808.20 1837.40 26.70 358.00 133.90 993.60
Reserves 107.21 (7.95) 48.00 4.30 492.00 805.60 (459.60) 139.80 409.20 342.80 (1224.00)
Total Assets 641.50 8.00 92.00 1731.30 1579.00 2743.90 1620.30 167.60 842.60 753.70 739.80
Total Liabilities 641.50 8.00 92.00 1731.30 1579.00 2743.90 1620.30 167.60 842.60 753.70 739.80
Investments
(Except Investments in Subsidiaries)
Long Term Investments
Government or Trust Securities 0.00 0.00 0.00 0.00 0 0.00 0.00 0.00 0.00 0.00 0.00
Shares, Debentures or Bonds 477.35 0.00 0.00 0.42 0 1.24 0.00 0.00 0.00 0.00 0.00
Others 0.00 0.00 0.00 0.00 0 0.00 0.00 0.00 0.00 0.00 0.00
477.35 0.00 0.00 0.42 0 1.24 0.00 0.00 0.00 0.00 0.00
Turnover 63.29 0.41 118.40 87.70 1641 1553.70 7840.20 592.30 2166.70 2207.90 1992.30
Profit Before Taxation 58.80 0.37 29.51 6.10 81 210.20 84.10 34.80 78.40 148.50 (18.20)
Provision for Taxation
Current Tax 7.60 0.00 10.51 2.20 14 0.00 0.00 14.10 12.80 52.40 0.00
Deferred Tax 0.00 0.00 (0.42) (0.30) 0 0.00 6.20 (0.60) 10.50 0.00 0.00
Fringe Benefit Tax 0.06 0.00 0.24 0.00 0 0.00 0.00 0.00 0.00 0.00 0.00
Profit After Taxation 51.13 0.37 19.17 4.20 67 210.20 77.90 21.30 55.10 96.10 (18.20)
Proposed Dividend 0.00 0.00 6.63 0.00 0 0.00 0.00 0.00 7.40 13.00 0.00
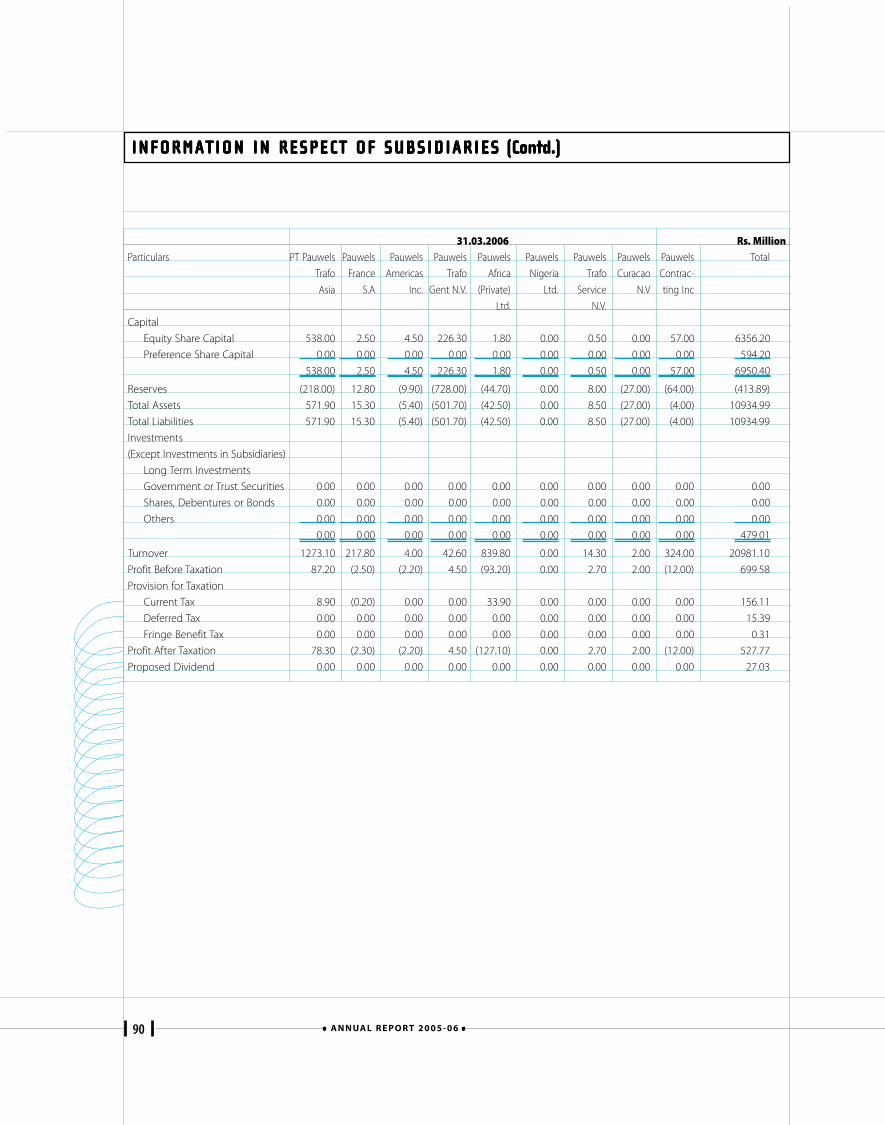
90 A N N UA L R E P O R T 2 0 0 5 - 0 6
INFORMATION IN RESPECT OF SUBSIDIARIESINFORMATION IN RESPECT OF SUBSIDIARIESINFORMATION IN RESPECT OF SUBSIDIARIESINFORMATION IN RESPECT OF SUBSIDIARIESINFORMATION IN RESPECT OF SUBSIDIARIES (C (C (C (C (Contd.)ontd.)ontd.)ontd.)ontd.)
31.03.2006 Rs. MillionParticulars PT Pauwels Pauwels Pauwels Pauwels Pauwels Pauwels Pauwels Pauwels Pauwels Total
Trafo France Americas Trafo Africa Nigeria Trafo Curacao Contrac-
Asia S.A Inc. Gent N.V. (Private) Ltd. Service N.V ting Inc
Ltd. N.V.
Capital
Equity Share Capital 538.00 2.50 4.50 226.30 1.80 0.00 0.50 0.00 57.00 6356.20
Preference Share Capital 0.00 0.00 0.00 0.00 0.00 0.00 0.00 0.00 0.00 594.20
538.00 2.50 4.50 226.30 1.80 0.00 0.50 0.00 57.00 6950.40
Reserves (218.00) 12.80 (9.90) (728.00) (44.70) 0.00 8.00 (27.00) (64.00) (413.89)
Total Assets 571.90 15.30 (5.40) (501.70) (42.50) 0.00 8.50 (27.00) (4.00) 10934.99
Total Liabilities 571.90 15.30 (5.40) (501.70) (42.50) 0.00 8.50 (27.00) (4.00) 10934.99
Investments
(Except Investments in Subsidiaries)
Long Term Investments
Government or Trust Securities 0.00 0.00 0.00 0.00 0.00 0.00 0.00 0.00 0.00 0.00
Shares, Debentures or Bonds 0.00 0.00 0.00 0.00 0.00 0.00 0.00 0.00 0.00 0.00
Others 0.00 0.00 0.00 0.00 0.00 0.00 0.00 0.00 0.00 0.00
0.00 0.00 0.00 0.00 0.00 0.00 0.00 0.00 0.00 479.01
Turnover 1273.10 217.80 4.00 42.60 839.80 0.00 14.30 2.00 324.00 20981.10
Profit Before Taxation 87.20 (2.50) (2.20) 4.50 (93.20) 0.00 2.70 2.00 (12.00) 699.58
Provision for Taxation
Current Tax 8.90 (0.20) 0.00 0.00 33.90 0.00 0.00 0.00 0.00 156.11
Deferred Tax 0.00 0.00 0.00 0.00 0.00 0.00 0.00 0.00 0.00 15.39
Fringe Benefit Tax 0.00 0.00 0.00 0.00 0.00 0.00 0.00 0.00 0.00 0.31
Profit After Taxation 78.30 (2.30) (2.20) 4.50 (127.10) 0.00 2.70 2.00 (12.00) 527.77
Proposed Dividend 0.00 0.00 0.00 0.00 0.00 0.00 0.00 0.00 0.00 27.03
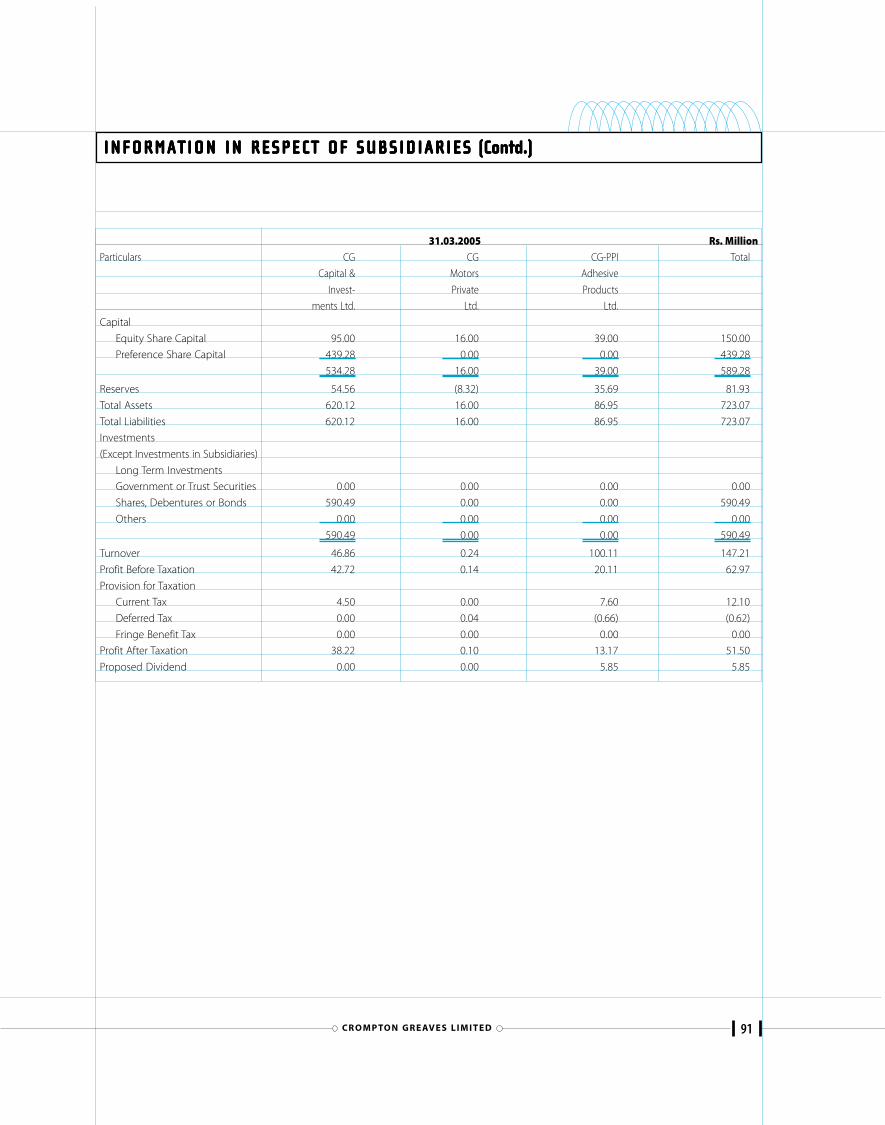
91CR O M P TO N G R E AV E S L I M I T E D
INFORMATION IN RESPECT OF SUBSIDIARIESINFORMATION IN RESPECT OF SUBSIDIARIESINFORMATION IN RESPECT OF SUBSIDIARIESINFORMATION IN RESPECT OF SUBSIDIARIESINFORMATION IN RESPECT OF SUBSIDIARIES (C (C (C (C (Contd.)ontd.)ontd.)ontd.)ontd.)
31.03.2005 Rs. MillionParticulars CG CG CG-PPI Total
Capital & Motors Adhesive
Invest- Private Products
ments Ltd. Ltd. Ltd.
Capital
Equity Share Capital 95.00 16.00 39.00 150.00
Preference Share Capital 439.28 0.00 0.00 439.28
534.28 16.00 39.00 589.28
Reserves 54.56 (8.32) 35.69 81.93
Total Assets 620.12 16.00 86.95 723.07
Total Liabilities 620.12 16.00 86.95 723.07
Investments
(Except Investments in Subsidiaries)
Long Term Investments
Government or Trust Securities 0.00 0.00 0.00 0.00
Shares, Debentures or Bonds 590.49 0.00 0.00 590.49
Others 0.00 0.00 0.00 0.00
590.49 0.00 0.00 590.49
Turnover 46.86 0.24 100.11 147.21
Profit Before Taxation 42.72 0.14 20.11 62.97
Provision for Taxation
Current Tax 4.50 0.00 7.60 12.10
Deferred Tax 0.00 0.04 (0.66) (0.62)
Fringe Benefit Tax 0.00 0.00 0.00 0.00
Profit After Taxation 38.22 0.10 13.17 51.50
Proposed Dividend 0.00 0.00 5.85 5.85
92 A N N UA L R E P O R T 2 0 0 5 - 0 6
CromptonGreavesConsolidatedFinancials
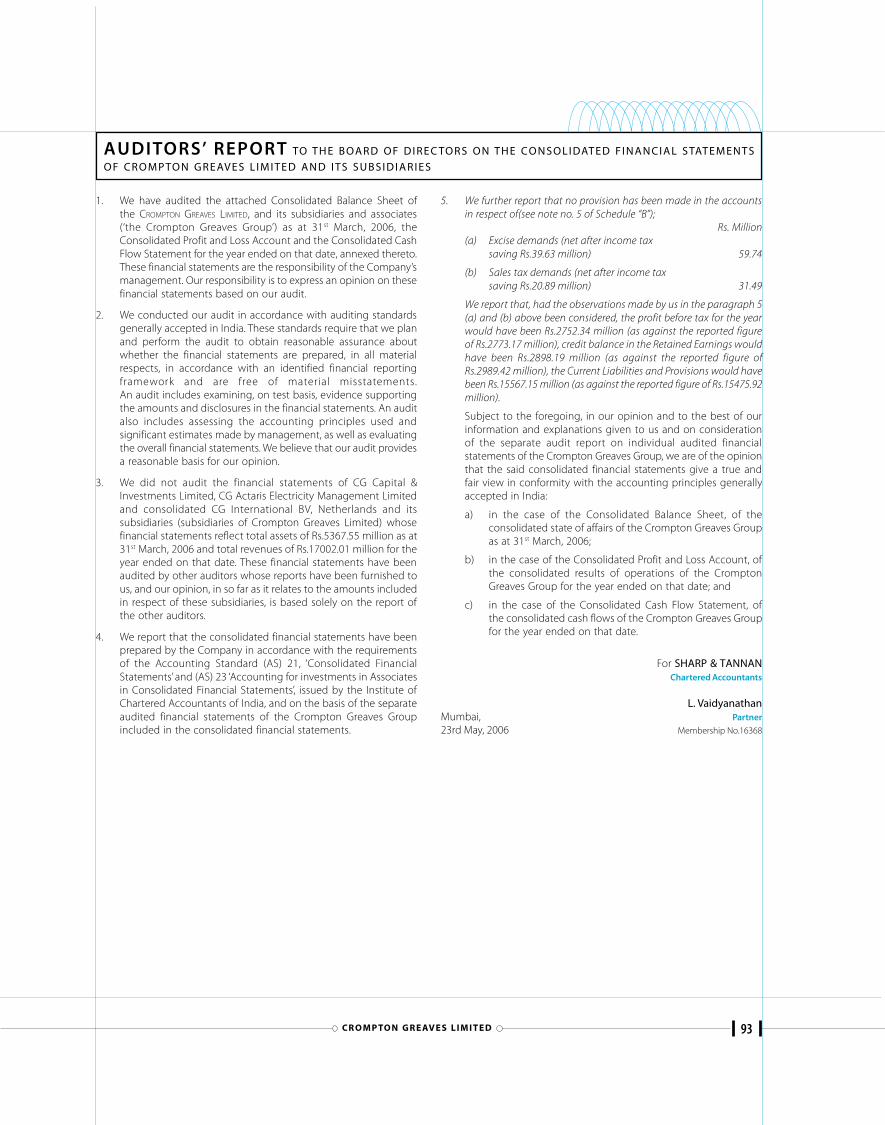
93CR O M P TO N G R E AV E S L I M I T E D
AUDITORS’ REPORT TO T H E B OA R D O F D I R E C TO R S O N T H E C O N S O L I DAT E D F I N A N C I A L S TAT E M E N T SO F C R O M P TO N G R E AV E S L I M I T E D A N D I TS S U B S I D I A R I E S
1. We have audited the attached Consolidated Balance Sheet ofthe CROMPTON GREAVES LIMITED, and its subsidiaries and associates(‘the Crompton Greaves Group’) as at 31st March, 2006, theConsolidated Profit and Loss Account and the Consolidated CashFlow Statement for the year ended on that date, annexed thereto.These financial statements are the responsibility of the Company’smanagement. Our responsibility is to express an opinion on thesefinancial statements based on our audit.
2. We conducted our audit in accordance with auditing standardsgenerally accepted in India. These standards require that we planand perform the audit to obtain reasonable assurance aboutwhether the financial statements are prepared, in all materialrespects, in accordance with an identified financial reportingframework and are free of material misstatements.An audit includes examining, on test basis, evidence supportingthe amounts and disclosures in the financial statements. An auditalso includes assessing the accounting principles used andsignificant estimates made by management, as well as evaluatingthe overall financial statements. We believe that our audit providesa reasonable basis for our opinion.
3. We did not audit the financial statements of CG Capital &Investments Limited, CG Actaris Electricity Management Limitedand consolidated CG International BV, Netherlands and itssubsidiaries (subsidiaries of Crompton Greaves Limited) whosefinancial statements reflect total assets of Rs.5367.55 million as at31st March, 2006 and total revenues of Rs.17002.01 million for theyear ended on that date. These financial statements have beenaudited by other auditors whose reports have been furnished tous, and our opinion, in so far as it relates to the amounts includedin respect of these subsidiaries, is based solely on the report ofthe other auditors.
4. We report that the consolidated financial statements have beenprepared by the Company in accordance with the requirementsof the Accounting Standard (AS) 21, ‘Consolidated FinancialStatements’ and (AS) 23 ‘Accounting for investments in Associatesin Consolidated Financial Statements’, issued by the Institute ofChartered Accountants of India, and on the basis of the separateaudited financial statements of the Crompton Greaves Groupincluded in the consolidated financial statements.
5. We further report that no provision has been made in the accountsin respect of(see note no. 5 of Schedule “B”);
Rs. Million(a) Excise demands (net after income tax
saving Rs.39.63 million) 59.74
(b) Sales tax demands (net after income taxsaving Rs.20.89 million) 31.49
We report that, had the observations made by us in the paragraph 5(a) and (b) above been considered, the profit before tax for the yearwould have been Rs.2752.34 million (as against the reported figureof Rs.2773.17 million), credit balance in the Retained Earnings wouldhave been Rs.2898.19 million (as against the reported figure ofRs.2989.42 million), the Current Liabilities and Provisions would havebeen Rs.15567.15 million (as against the reported figure of Rs.15475.92million).
Subject to the foregoing, in our opinion and to the best of ourinformation and explanations given to us and on considerationof the separate audit report on individual audited financialstatements of the Crompton Greaves Group, we are of the opinionthat the said consolidated financial statements give a true andfair view in conformity with the accounting principles generallyaccepted in India:
a) in the case of the Consolidated Balance Sheet, of theconsolidated state of affairs of the Crompton Greaves Groupas at 31st March, 2006;
b) in the case of the Consolidated Profit and Loss Account, ofthe consolidated results of operations of the CromptonGreaves Group for the year ended on that date; and
c) in the case of the Consolidated Cash Flow Statement, ofthe consolidated cash flows of the Crompton Greaves Groupfor the year ended on that date.
For SHARP & TANNANChartered Accountants
L. VaidyanathanMumbai, Partner23rd May, 2006 Membership No.16368
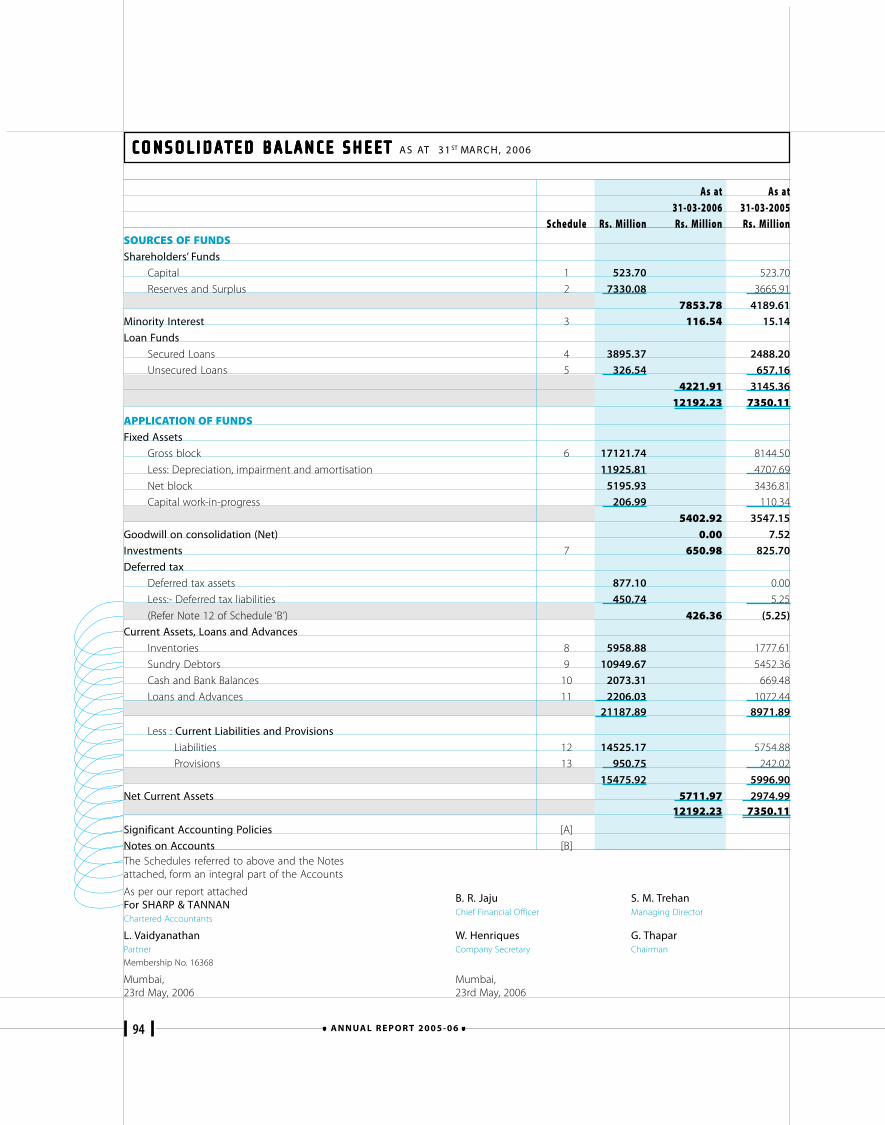
94 A N N UA L R E P O R T 2 0 0 5 - 0 6
CONSOLIDATED BALANCE SHEETCONSOLIDATED BALANCE SHEETCONSOLIDATED BALANCE SHEETCONSOLIDATED BALANCE SHEETCONSOLIDATED BALANCE SHEET AS AT 31 ST MARCH, 2006
As at As at31-03-2006 31-03-2005
Schedule Rs. Million Rs. Million Rs. MillionSOURCES OF FUNDSShareholders’ Funds
Capital 1 523.70 523.70
Reserves and Surplus 2 7330.08 3665.91
7853.78 4189.61
Minority Interest 3 116.54 15.14
Loan Funds
Secured Loans 4 3895.37 2488.20
Unsecured Loans 5 326.54 657.16
4221.91 3145.36
12192.23 7350.11
APPLICATION OF FUNDSFixed Assets
Gross block 6 17121.74 8144.50
Less: Depreciation, impairment and amortisation 11925.81 4707.69
Net block 5195.93 3436.81
Capital work-in-progress 206.99 110.34
5402.92 3547.15
Goodwill on consolidation (Net) 0.00 7.52
Investments 7 650.98 825.70
Deferred tax
Deferred tax assets 877.10 0.00
Less:- Deferred tax liabilities 450.74 5.25
(Refer Note 12 of Schedule ‘B’) 426.36 (5.25)
Current Assets, Loans and Advances
Inventories 8 5958.88 1777.61
Sundry Debtors 9 10949.67 5452.36
Cash and Bank Balances 10 2073.31 669.48
Loans and Advances 11 2206.03 1072.4421187.89 8971.89
Less : Current Liabilities and Provisions
Liabilities 12 14525.17 5754.88
Provisions 13 950.75 242.02
15475.92 5996.90
Net Current Assets 5711.97 2974.9912192.23 7350.11
Significant Accounting Policies [A]
Notes on Accounts [B]
B. R. Jaju S. M. TrehanChief Financial Officer Managing Director
W. Henriques G. ThaparCompany Secretary Chairman
Mumbai,23rd May, 2006
The Schedules referred to above and the Notesattached, form an integral part of the Accounts
As per our report attachedFor SHARP & TANNANChartered Accountants
L. VaidyanathanPartner
Membership No. 16368
Mumbai,23rd May, 2006
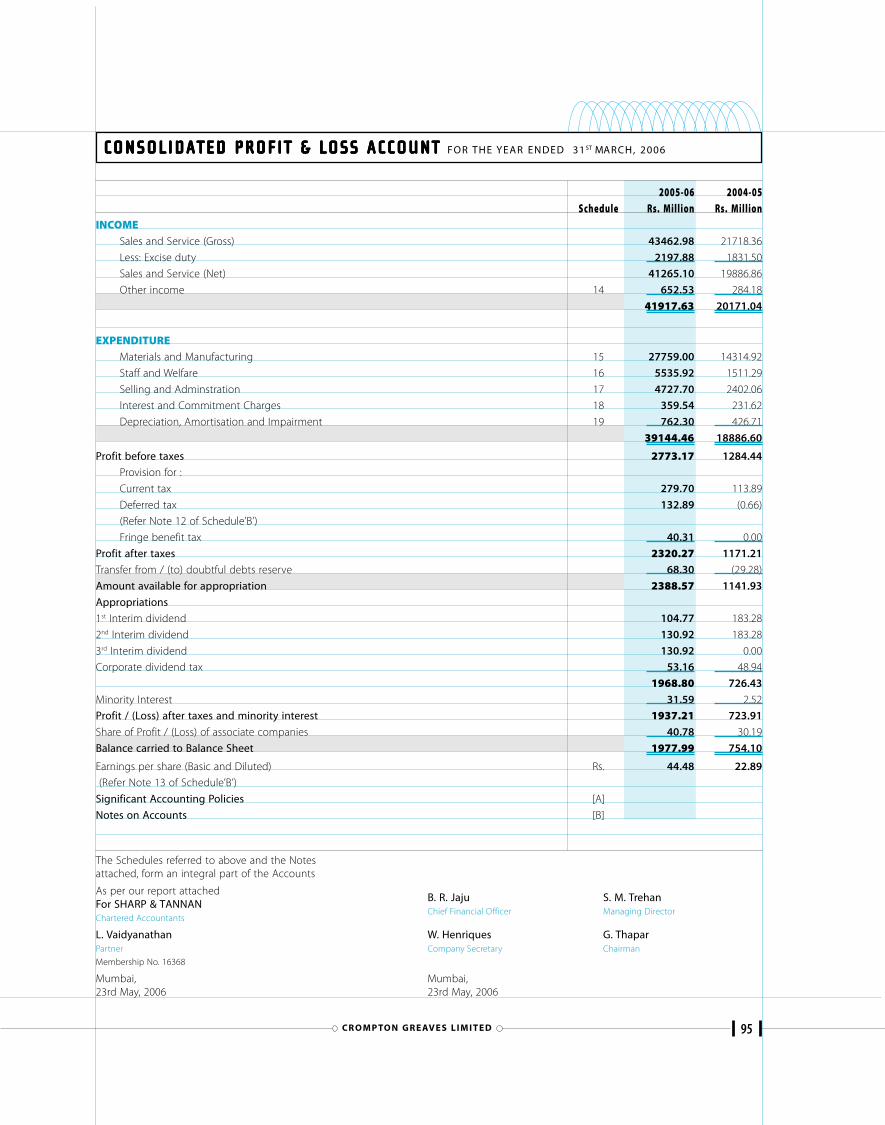
95CR O M P TO N G R E AV E S L I M I T E D
CONSOLIDATED PROFIT & LOSS ACCOUNTCONSOLIDATED PROFIT & LOSS ACCOUNTCONSOLIDATED PROFIT & LOSS ACCOUNTCONSOLIDATED PROFIT & LOSS ACCOUNTCONSOLIDATED PROFIT & LOSS ACCOUNT FOR THE YEAR ENDED 31 ST MARCH, 2006
2005-06 2004-05Schedule Rs. Million Rs. Million
INCOMESales and Service (Gross) 43462.98 21718.36
Less: Excise duty 2197.88 1831.50
Sales and Service (Net) 41265.10 19886.86
Other income 14 652.53 284.18
41917.63 20171.04
EXPENDITUREMaterials and Manufacturing 15 27759.00 14314.92
Staff and Welfare 16 5535.92 1511.29
Selling and Adminstration 17 4727.70 2402.06
Interest and Commitment Charges 18 359.54 231.62
Depreciation, Amortisation and Impairment 19 762.30 426.71
39144.46 18886.60
Profit before taxes 2773.17 1284.44
Provision for :
Current tax 279.70 113.89
Deferred tax 132.89 (0.66)
(Refer Note 12 of Schedule’B’)
Fringe benefit tax 40.31 0.00
Profit after taxes 2320.27 1171.21
Transfer from / (to) doubtful debts reserve 68.30 (29.28)
Amount available for appropriation 2388.57 1141.93
Appropriations
1st Interim dividend 104.77 183.28
2nd Interim dividend 130.92 183.28
3rd Interim dividend 130.92 0.00
Corporate dividend tax 53.16 48.94
1968.80 726.43
Minority Interest 31.59 2.52
Profit / (Loss) after taxes and minority interest 1937.21 723.91
Share of Profit / (Loss) of associate companies 40.78 30.19
Balance carried to Balance Sheet 1977.99 754.10
Earnings per share (Basic and Diluted) Rs. 44.48 22.89
(Refer Note 13 of Schedule’B’)
Significant Accounting Policies [A]
Notes on Accounts [B]
The Schedules referred to above and the Notesattached, form an integral part of the Accounts
As per our report attachedFor SHARP & TANNANChartered Accountants
L. VaidyanathanPartner
Membership No. 16368
Mumbai,23rd May, 2006
B. R. Jaju S. M. TrehanChief Financial Officer Managing Director
W. Henriques G. ThaparCompany Secretary Chairman
Mumbai,23rd May, 2006
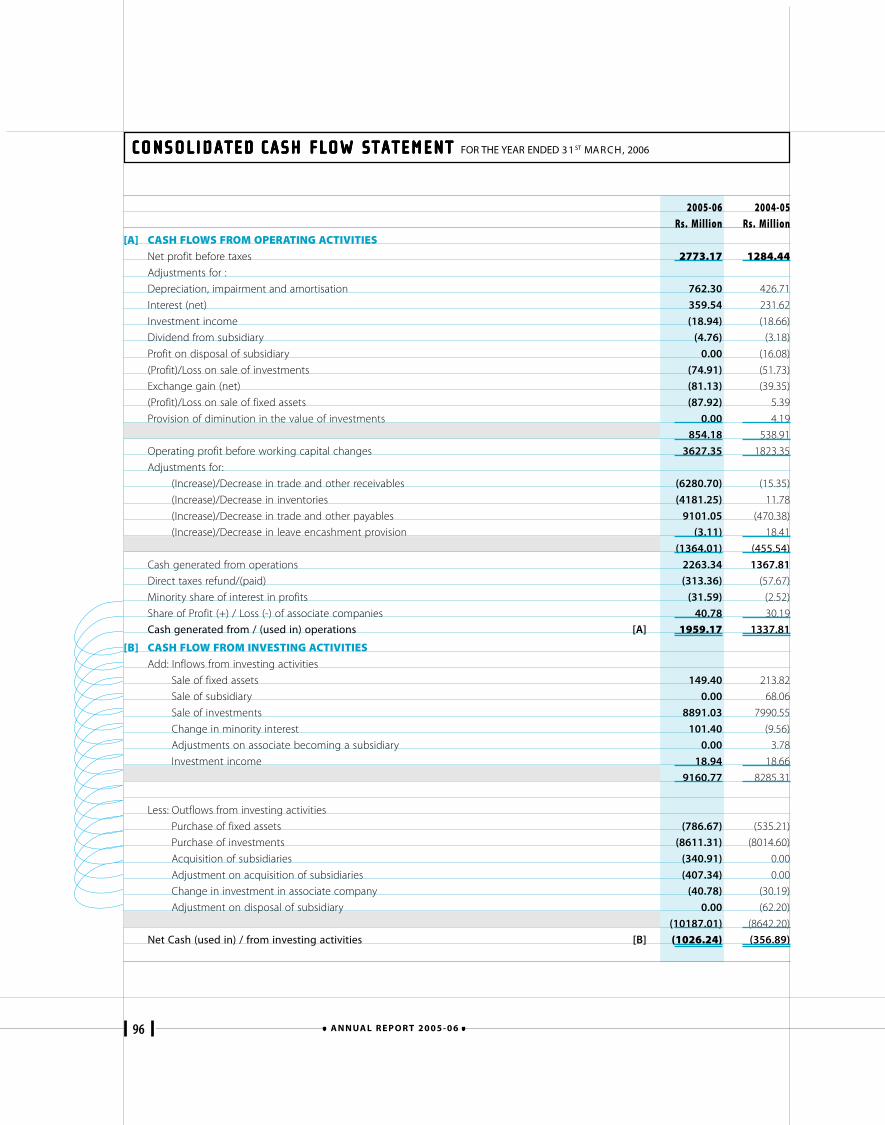
96 A N N UA L R E P O R T 2 0 0 5 - 0 6
CONSOLIDATEDCONSOLIDATEDCONSOLIDATEDCONSOLIDATEDCONSOLIDATED CASH FLOW STATEMENTCASH FLOW STATEMENTCASH FLOW STATEMENTCASH FLOW STATEMENTCASH FLOW STATEMENT FOR THE YEAR ENDED 31 ST MARCH, 2006
2005-06 2004-05Rs. Million Rs. Million
[A] CASH FLOWS FROM OPERATING ACTIVITIESNet profit before taxes 2773.17 1284.44Adjustments for :
Depreciation, impairment and amortisation 762.30 426.71
Interest (net) 359.54 231.62
Investment income (18.94) (18.66)
Dividend from subsidiary (4.76) (3.18)
Profit on disposal of subsidiary 0.00 (16.08)
(Profit)/Loss on sale of investments (74.91) (51.73)
Exchange gain (net) (81.13) (39.35)
(Profit)/Loss on sale of fixed assets (87.92) 5.39
Provision of diminution in the value of investments 0.00 4.19
854.18 538.91
Operating profit before working capital changes 3627.35 1823.35
Adjustments for:
(Increase)/Decrease in trade and other receivables (6280.70) (15.35)
(Increase)/Decrease in inventories (4181.25) 11.78
(Increase)/Decrease in trade and other payables 9101.05 (470.38)
(Increase)/Decrease in leave encashment provision (3.11) 18.41
(1364.01) (455.54)
Cash generated from operations 2263.34 1367.81
Direct taxes refund/(paid) (313.36) (57.67)
Minority share of interest in profits (31.59) (2.52)
Share of Profit (+) / Loss (-) of associate companies 40.78 30.19
Cash generated from / (used in) operations [A] 1959.17 1337.81
[B] CASH FLOW FROM INVESTING ACTIVITIESAdd: Inflows from investing activities
Sale of fixed assets 149.40 213.82
Sale of subsidiary 0.00 68.06
Sale of investments 8891.03 7990.55
Change in minority interest 101.40 (9.56)
Adjustments on associate becoming a subsidiary 0.00 3.78
Investment income 18.94 18.66
9160.77 8285.31
Less: Outflows from investing activities
Purchase of fixed assets (786.67) (535.21)
Purchase of investments (8611.31) (8014.60)
Acquisition of subsidiaries (340.91) 0.00
Adjustment on acquisition of subsidiaries (407.34) 0.00
Change in investment in associate company (40.78) (30.19)
Adjustment on disposal of subsidiary 0.00 (62.20)
(10187.01) (8642.20)
Net Cash (used in) / from investing activities [B] (1026.24) (356.89)
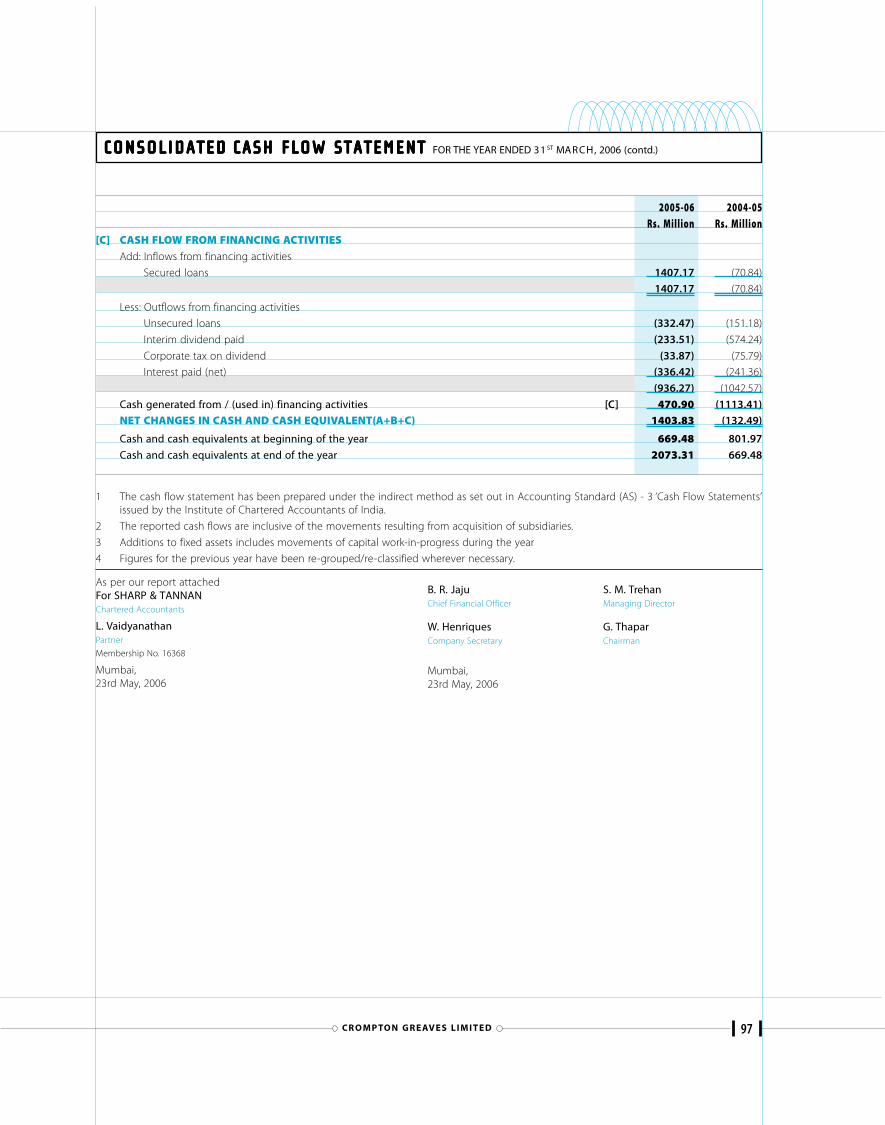
97CR O M P TO N G R E AV E S L I M I T E D
CONSOLIDATEDCONSOLIDATEDCONSOLIDATEDCONSOLIDATEDCONSOLIDATED CASH FLOW STATEMENTCASH FLOW STATEMENTCASH FLOW STATEMENTCASH FLOW STATEMENTCASH FLOW STATEMENT FOR THE YEAR ENDED 31 ST MARCH, 2006 (contd.)
2005-06 2004-05Rs. Million Rs. Million
[C] CASH FLOW FROM FINANCING ACTIVITIESAdd: Inflows from financing activities
Secured loans 1407.17 (70.84)
1407.17 (70.84)
Less: Outflows from financing activities
Unsecured loans (332.47) (151.18)
Interim dividend paid (233.51) (574.24)
Corporate tax on dividend (33.87) (75.79)
Interest paid (net) (336.42) (241.36)
(936.27) (1042.57)
Cash generated from / (used in) financing activities [C] 470.90 (1113.41)
NET CHANGES IN CASH AND CASH EQUIVALENT(A+B+C) 1403.83 (132.49)
Cash and cash equivalents at beginning of the year 669.48 801.97
Cash and cash equivalents at end of the year 2073.31 669.48
1 The cash flow statement has been prepared under the indirect method as set out in Accounting Standard (AS) - 3 ‘Cash Flow Statements’issued by the Institute of Chartered Accountants of India.
2 The reported cash flows are inclusive of the movements resulting from acquisition of subsidiaries.
3 Additions to fixed assets includes movements of capital work-in-progress during the year
4 Figures for the previous year have been re-grouped/re-classified wherever necessary.
As per our report attachedFor SHARP & TANNANChartered Accountants
L. VaidyanathanPartner
Membership No. 16368
Mumbai,23rd May, 2006
B. R. Jaju S. M. TrehanChief Financial Officer Managing Director
W. Henriques G. ThaparCompany Secretary Chairman
Mumbai,23rd May, 2006
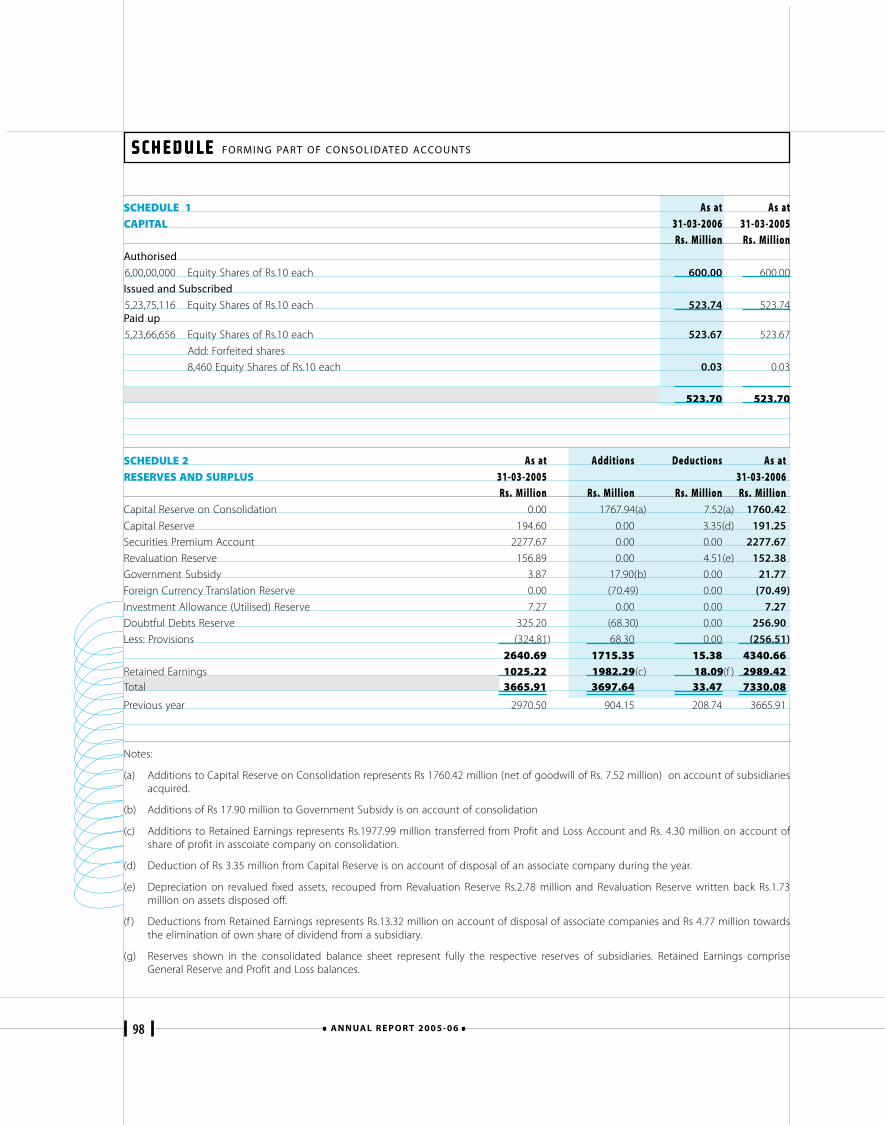
98 A N N UA L R E P O R T 2 0 0 5 - 0 6
SCHEDULE SCHEDULE SCHEDULE SCHEDULE SCHEDULE FORMING PART OF CONSOLIDATED ACCOUNTS
SCHEDULE 1 As at As atCAPITAL 31-03-2006 31-03-2005
Rs. Million Rs. MillionAuthorised
6,00,00,000 Equity Shares of Rs.10 each 600.00 600.00
Issued and Subscribed
5,23,75,116 Equity Shares of Rs.10 each 523.74 523.74Paid up
5,23,66,656 Equity Shares of Rs.10 each 523.67 523.67
Add: Forfeited shares
8,460 Equity Shares of Rs.10 each 0.03 0.03
523.70 523.70
SCHEDULE 2 As at Additions Deduc tions As atRESERVES AND SURPLUS 31-03-2005 31-03-2006
Rs. Million Rs. Million Rs. Million Rs. MillionCapital Reserve on Consolidation 0.00 1767.94(a) 7.52(a) 1760.42
Capital Reserve 194.60 0.00 3.35(d) 191.25
Securities Premium Account 2277.67 0.00 0.00 2277.67
Revaluation Reserve 156.89 0.00 4.51(e) 152.38
Government Subsidy 3.87 17.90(b) 0.00 21.77
Foreign Currency Translation Reserve 0.00 (70.49) 0.00 (70.49)
Investment Allowance (Utilised) Reserve 7.27 0.00 0.00 7.27
Doubtful Debts Reserve 325.20 (68.30) 0.00 256.90
Less: Provisions (324.81) 68.30 0.00 (256.51)
2640.69 1715.35 15.38 4340.66Retained Earnings 1025.22 1982.29(c) 18.09(f ) 2989.42Total 3665.91 3697.64 33.47 7330.08
Previous year 2970.50 904.15 208.74 3665.91
Notes:
(a) Additions to Capital Reserve on Consolidation represents Rs 1760.42 million (net of goodwill of Rs. 7.52 million) on account of subsidiariesacquired.
(b) Additions of Rs 17.90 million to Government Subsidy is on account of consolidation
(c) Additions to Retained Earnings represents Rs.1977.99 million transferred from Profit and Loss Account and Rs. 4.30 million on account ofshare of profit in asscoiate company on consolidation.
(d) Deduction of Rs 3.35 million from Capital Reserve is on account of disposal of an associate company during the year.
(e) Depreciation on revalued fixed assets, recouped from Revaluation Reserve Rs.2.78 million and Revaluation Reserve written back Rs.1.73million on assets disposed off.
(f ) Deductions from Retained Earnings represents Rs.13.32 million on account of disposal of associate companies and Rs 4.77 million towardsthe elimination of own share of dividend from a subsidiary.
(g) Reserves shown in the consolidated balance sheet represent fully the respective reserves of subsidiaries. Retained Earnings compriseGeneral Reserve and Profit and Loss balances.
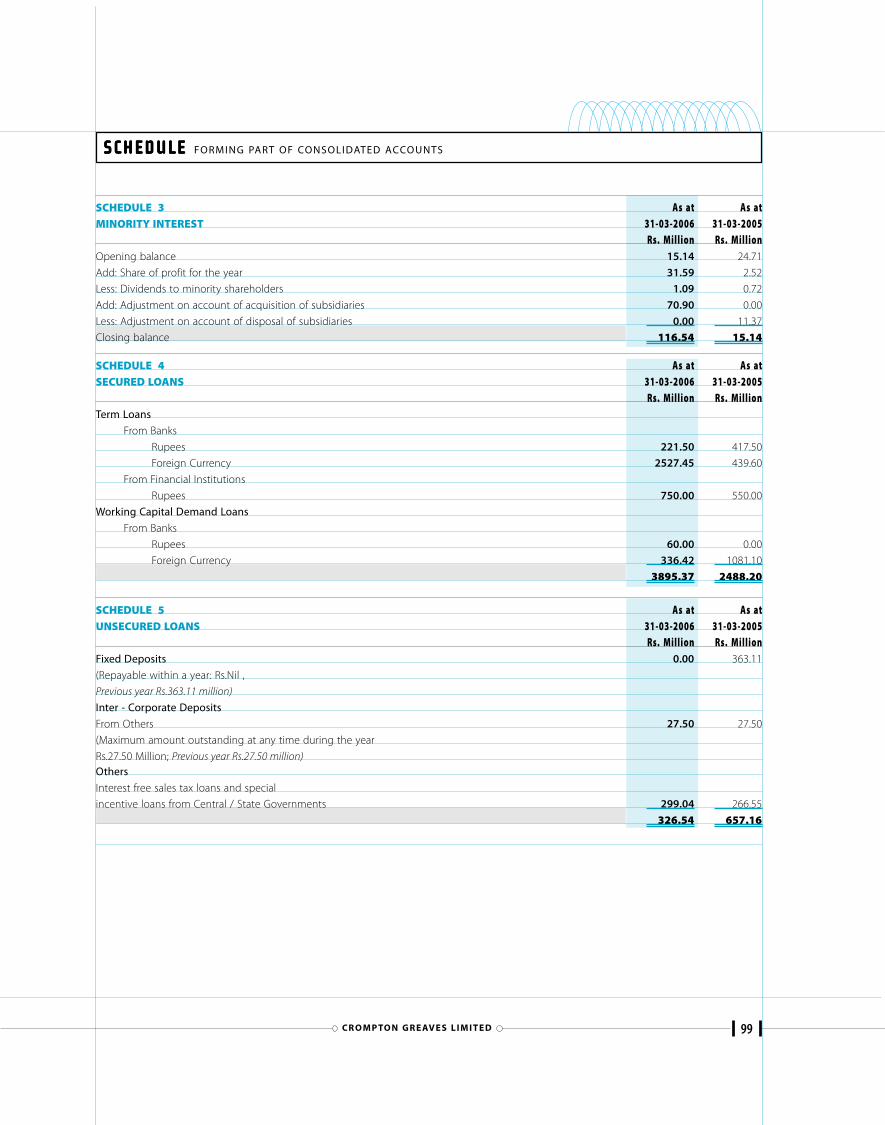
99CR O M P TO N G R E AV E S L I M I T E D
SCHEDULE SCHEDULE SCHEDULE SCHEDULE SCHEDULE FORMING PART OF CONSOLIDATED ACCOUNTS
SCHEDULE 3 As at As atMINORITY INTEREST 31-03-2006 31-03-2005
Rs. Million Rs. MillionOpening balance 15.14 24.71
Add: Share of profit for the year 31.59 2.52
Less: Dividends to minority shareholders 1.09 0.72
Add: Adjustment on account of acquisition of subsidiaries 70.90 0.00
Less: Adjustment on account of disposal of subsidiaries 0.00 11.37
Closing balance 116.54 15.14
SCHEDULE 4 As at As atSECURED LOANS 31-03-2006 31-03-2005
Rs. Million Rs. MillionTerm Loans
From Banks
Rupees 221.50 417.50
Foreign Currency 2527.45 439.60
From Financial Institutions
Rupees 750.00 550.00
Working Capital Demand Loans
From Banks
Rupees 60.00 0.00
Foreign Currency 336.42 1081.10
3895.37 2488.20
SCHEDULE 5 As at As atUNSECURED LOANS 31-03-2006 31-03-2005
Rs. Million Rs. MillionFixed Deposits 0.00 363.11
(Repayable within a year: Rs.Nil ,
Previous year Rs.363.11 million)
Inter - Corporate Deposits
From Others 27.50 27.50
(Maximum amount outstanding at any time during the year
Rs.27.50 Million; Previous year Rs.27.50 million)Others
Interest free sales tax loans and special
incentive loans from Central / State Governments 299.04 266.55
326.54 657.16
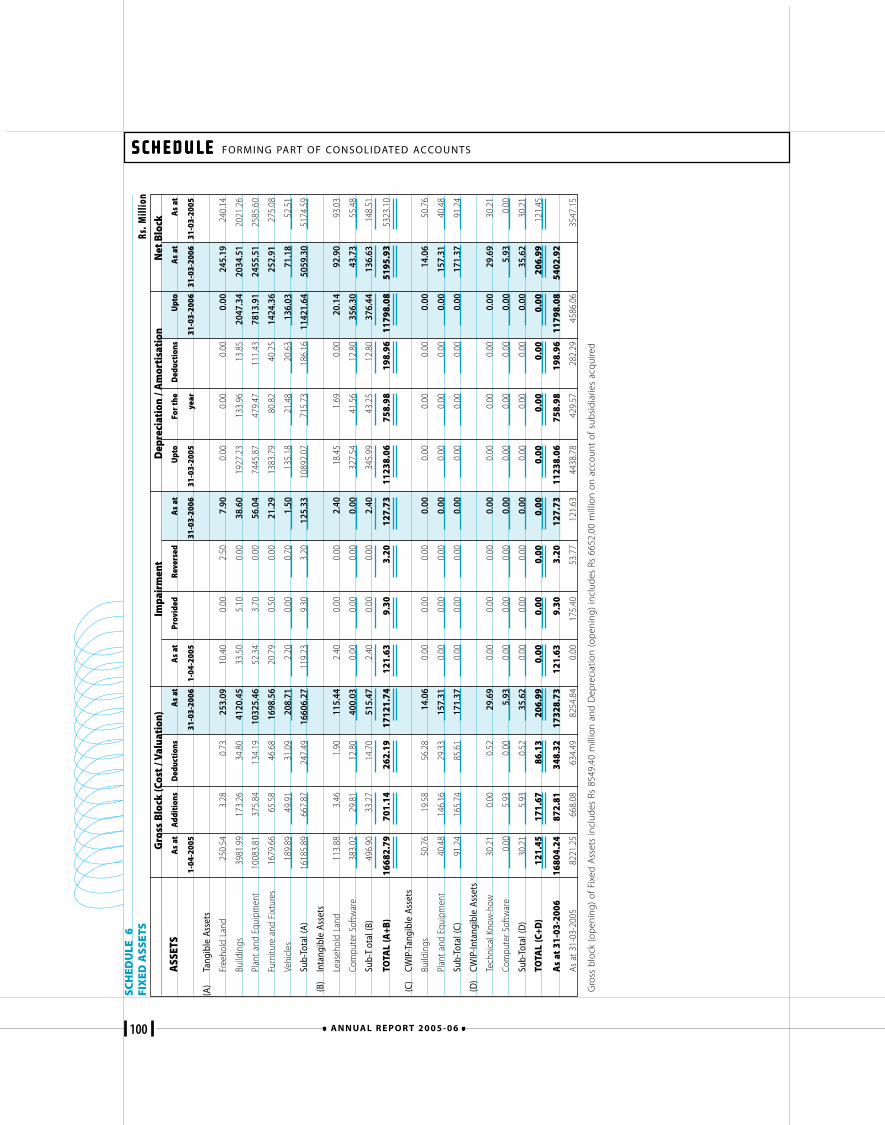
100 A N N UA L R E P O R T 2 0 0 5 - 0 6
SCHEDULE SCHEDULE SCHEDULE SCHEDULE SCHEDULE FORMING PART OF CONSOLIDATED ACCOUNTS
SCH
EDU
LE 6
FIX
ED A
SSET
SRs
. Mill
ion
Gro
ss B
lock
(Cos
t / V
alua
tion
)Im
pair
men
tD
epre
ciat
ion
/ Am
orti
sati
onN
et B
lock
ASS
ETS
As
atA
ddit
ions
Ded
ucti
ons
As
atA
s at
Prov
ided
Reve
rsed
As
atU
pto
For
the
Ded
ucti
ons
Upt
oA
s at
As
at
1-04
-200
531
-03-
2006
1-04
-200
531
-03-
2006
31-0
3-20
05ye
ar31
-03-
2006
31-0
3-20
0631
-03-
2005
(A)
Tang
ible
Ass
ets
Free
hold
Lan
d25
0.54
3.28
0.73
253.
0910
.40
0.00
2.50
7.90
0.00
0.00
0.00
0.00
245.
1924
0.14
Build
ings
3981
.99
173.
2634
.80
4120
.45
33.5
05.
100.
0038
.60
1927
.23
133.
9613
.85
2047
.34
2034
.51
2021
.26
Plan
t and
Equ
ipm
ent
1008
3.81
375.
8413
4.19
1032
5.46
52.3
43.
700.
0056
.04
7445
.87
479.
4711
1.43
7813
.91
2455
.51
2585
.60
Furn
iture
and
Fix
ture
s16
79.6
665
.58
46.6
816
98.5
620
.79
0.50
0.00
21.2
913
83.7
980
.82
40.2
514
24.3
625
2.91
275.
08
Vehi
cles
189.
8949
.91
31.0
920
8.71
2.20
0.00
0.70
1.50
135.
1821
.48
20.6
313
6.03
71.1
852
.51
Sub-
Tota
l (A)
1618
5.89
667.
8724
7.49
1660
6.27
119.
239.
303.
2012
5.33
1089
2.07
715.
7318
6.16
1142
1.64
5059
.30
5174
.59
(B)
Inta
ngib
le A
sset
s
Leas
ehol
d La
nd11
3.88
3.46
1.90
115.
442.
400.
000.
002.
4018
.45
1.69
0.00
20.1
492
.90
93.0
3
Com
pute
r Sof
twar
e38
3.02
29.8
112
.80
400.
030.
000.
000.
000.
0032
7.54
41.5
612
.80
356.
3043
.73
55.4
8
Sub-
Tot
al (B
)49
6.90
33.2
714
.70
515.
472.
400.
000.
002.
4034
5.99
43.2
512
.80
376.
4413
6.63
148.
51
TOTA
L (A
+B)
1668
2.79
701.
1426
2.19
1712
1.74
121.
639.
303.
2012
7.73
1123
8.06
758.
9819
8.96
1179
8.08
5195
.93
5323
.10
(C)
CWIP
-Tan
gibl
e As
sets
Build
ings
50.7
619
.58
56.2
814
.06
0.00
0.00
0.00
0.00
0.00
0.00
0.00
0.00
14.0
650
.76
Plan
t and
Equ
ipm
ent
40.4
814
6.16
29.3
315
7.31
0.00
0.00
0.00
0.00
0.00
0.00
0.00
0.00
157.
3140
.48
Sub-
Tota
l (C)
91.2
416
5.74
85.6
117
1.37
0.00
0.00
0.00
0.00
0.00
0.00
0.00
0.00
171.
3791
.24
(D)
CWIP
-Inta
ngib
le A
sset
s
Tech
nica
l Kno
w-h
ow30
.21
0.00
0.52
29.6
90.
000.
000.
000.
000.
000.
000.
000.
0029
.69
30.2
1
Com
pute
r Sof
twar
e0.
005.
930.
005.
930.
000.
000.
000.
000.
000.
000.
000.
005.
930.
00
Sub-
Tota
l (D
)30
.21
5.93
0.52
35.6
20.
000.
000.
000.
000.
000.
000.
000.
0035
.62
30.2
1
TOTA
L (C
+D)
121.
4517
1.67
86.1
320
6.99
0.00
0.00
0.00
0.00
0.00
0.00
0.00
0.00
206.
9912
1.45
As
at 3
1-03
-200
616
804.
2487
2.81
348.
3217
328.
7312
1.63
9.30
3.20
127.
7311
238.
0675
8.98
198.
9611
798.
0854
02.9
2
As a
t 31-
03-2
005
8221
.25
668.
0863
4.49
8254
.84
0.00
175.
4053
.77
121.
6344
38.7
842
9.57
282.
2945
86.0
635
47.1
5
Gro
ss b
lock
(ope
ning
) of F
ixed
Ass
ets
incl
udes
Rs
8549
.40
mill
ion
and
Dep
reci
atio
n (o
peni
ng) i
nclu
des
Rs 6
652.
00 m
illio
n on
acc
ount
of s
ubsi
diar
ies
acqu
ired
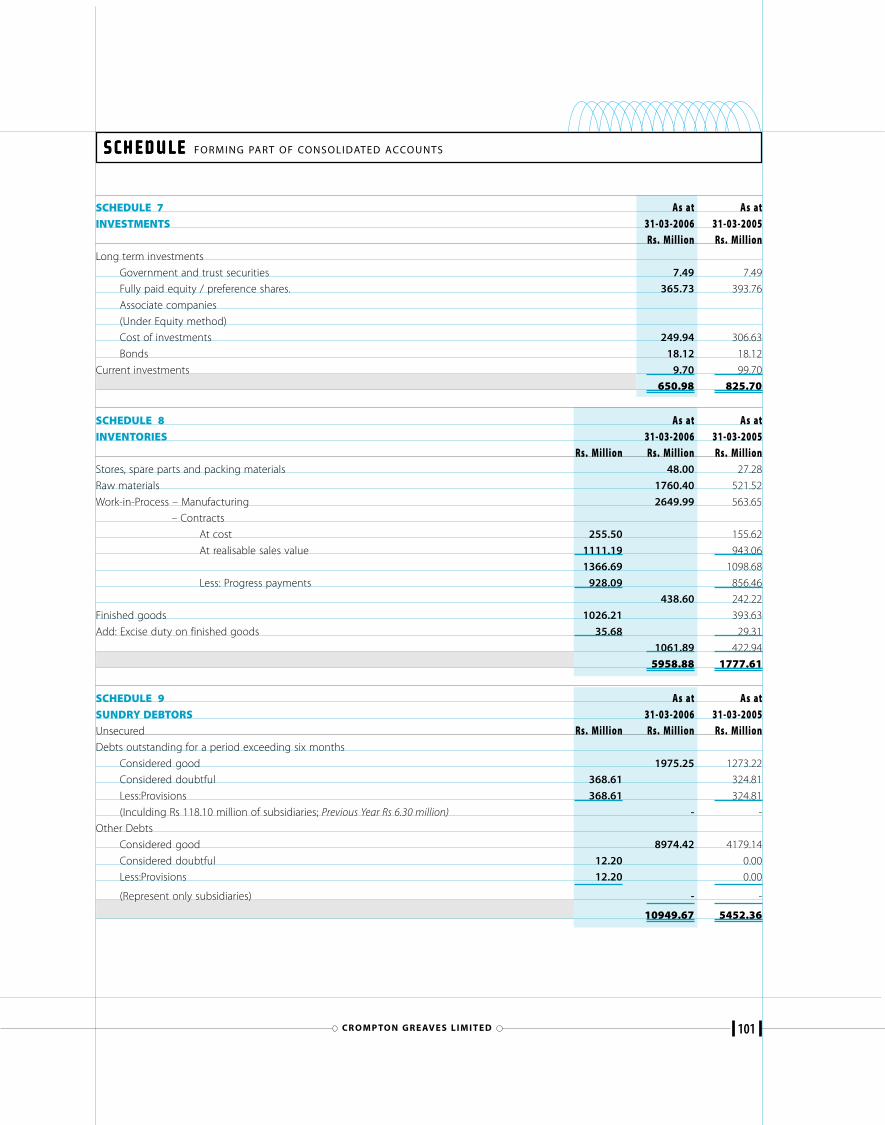
101CR O M P TO N G R E AV E S L I M I T E D
SCHEDULE SCHEDULE SCHEDULE SCHEDULE SCHEDULE FORMING PART OF CONSOLIDATED ACCOUNTS
SCHEDULE 7 As at As atINVESTMENTS 31-03-2006 31-03-2005
Rs. Million Rs. MillionLong term investments
Government and trust securities 7.49 7.49
Fully paid equity / preference shares. 365.73 393.76
Associate companies
(Under Equity method)
Cost of investments 249.94 306.63
Bonds 18.12 18.12
Current investments 9.70 99.70
650.98 825.70
SCHEDULE 8 As at As atINVENTORIES 31-03-2006 31-03-2005
Rs. Million Rs. Million Rs. MillionStores, spare parts and packing materials 48.00 27.28
Raw materials 1760.40 521.52
Work-in-Process – Manufacturing 2649.99 563.65
– Contracts
At cost 255.50 155.62
At realisable sales value 1111.19 943.06
1366.69 1098.68
Less: Progress payments 928.09 856.46
438.60 242.22
Finished goods 1026.21 393.63
Add: Excise duty on finished goods 35.68 29.31
1061.89 422.94
5958.88 1777.61
SCHEDULE 9 As at As atSUNDRY DEBTORS 31-03-2006 31-03-2005Unsecured Rs. Million Rs. Million Rs. MillionDebts outstanding for a period exceeding six months
Considered good 1975.25 1273.22
Considered doubtful 368.61 324.81
Less:Provisions 368.61 324.81
(Inculding Rs 118.10 million of subsidiaries; Previous Year Rs 6.30 million) - -
Other Debts
Considered good 8974.42 4179.14
Considered doubtful 12.20 0.00
Less:Provisions 12.20 0.00
(Represent only subsidiaries) - -
10949.67 5452.36
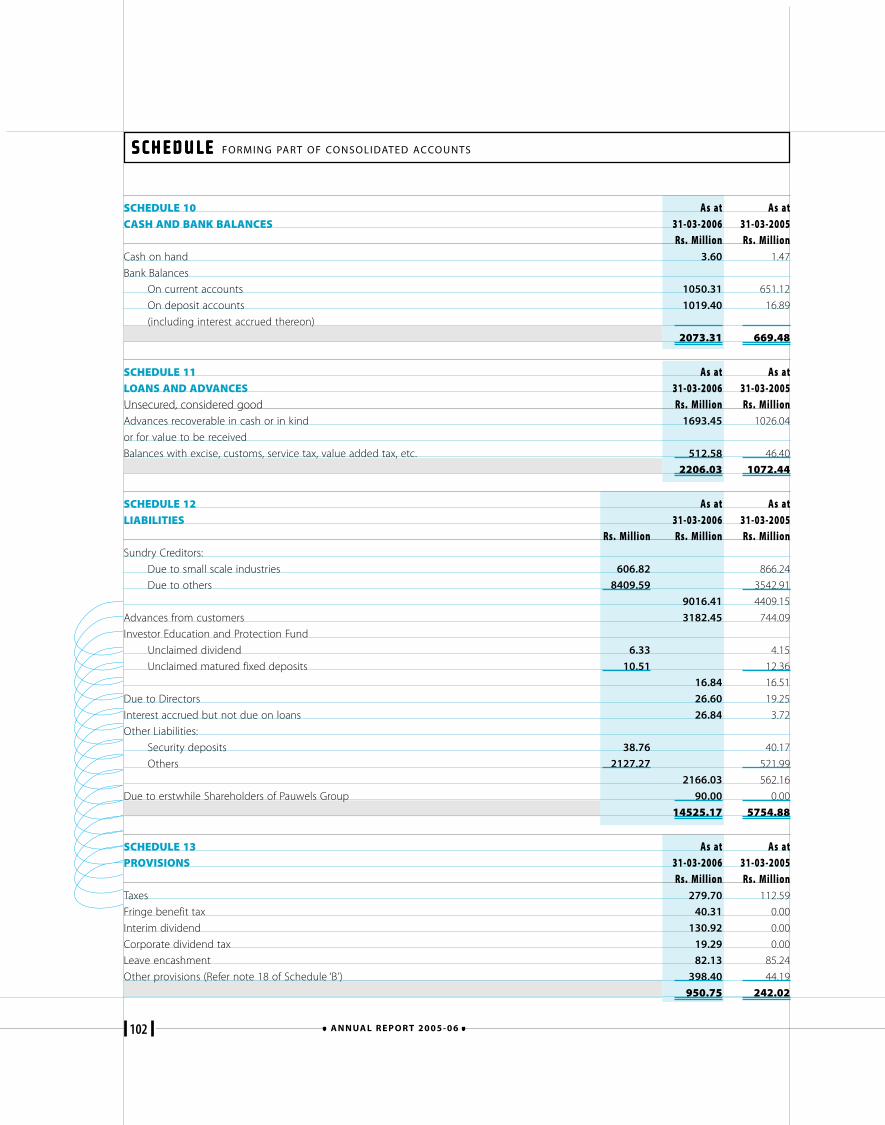
102 A N N UA L R E P O R T 2 0 0 5 - 0 6
SCHEDULE SCHEDULE SCHEDULE SCHEDULE SCHEDULE FORMING PART OF CONSOLIDATED ACCOUNTS
SCHEDULE 10 As at As atCASH AND BANK BALANCES 31-03-2006 31-03-2005
Rs. Million Rs. MillionCash on hand 3.60 1.47
Bank Balances
On current accounts 1050.31 651.12
On deposit accounts 1019.40 16.89
(including interest accrued thereon)
2073.31 669.48
SCHEDULE 11 As at As atLOANS AND ADVANCES 31-03-2006 31-03-2005Unsecured, considered good Rs. Million Rs. MillionAdvances recoverable in cash or in kind 1693.45 1026.04
or for value to be received
Balances with excise, customs, service tax, value added tax, etc. 512.58 46.40
2206.03 1072.44
SCHEDULE 12 As at As atLIABILITIES 31-03-2006 31-03-2005
Rs. Million Rs. Million Rs. MillionSundry Creditors:
Due to small scale industries 606.82 866.24
Due to others 8409.59 3542.91
9016.41 4409.15
Advances from customers 3182.45 744.09
Investor Education and Protection Fund
Unclaimed dividend 6.33 4.15
Unclaimed matured fixed deposits 10.51 12.36
16.84 16.51
Due to Directors 26.60 19.25
Interest accrued but not due on loans 26.84 3.72
Other Liabilities:
Security deposits 38.76 40.17
Others 2127.27 521.99
2166.03 562.16
Due to erstwhile Shareholders of Pauwels Group 90.00 0.00
14525.17 5754.88
SCHEDULE 13 As at As atPROVISIONS 31-03-2006 31-03-2005
Rs. Million Rs. MillionTaxes 279.70 112.59
Fringe benefit tax 40.31 0.00
Interim dividend 130.92 0.00
Corporate dividend tax 19.29 0.00
Leave encashment 82.13 85.24
Other provisions (Refer note 18 of Schedule ‘B’) 398.40 44.19
950.75 242.02
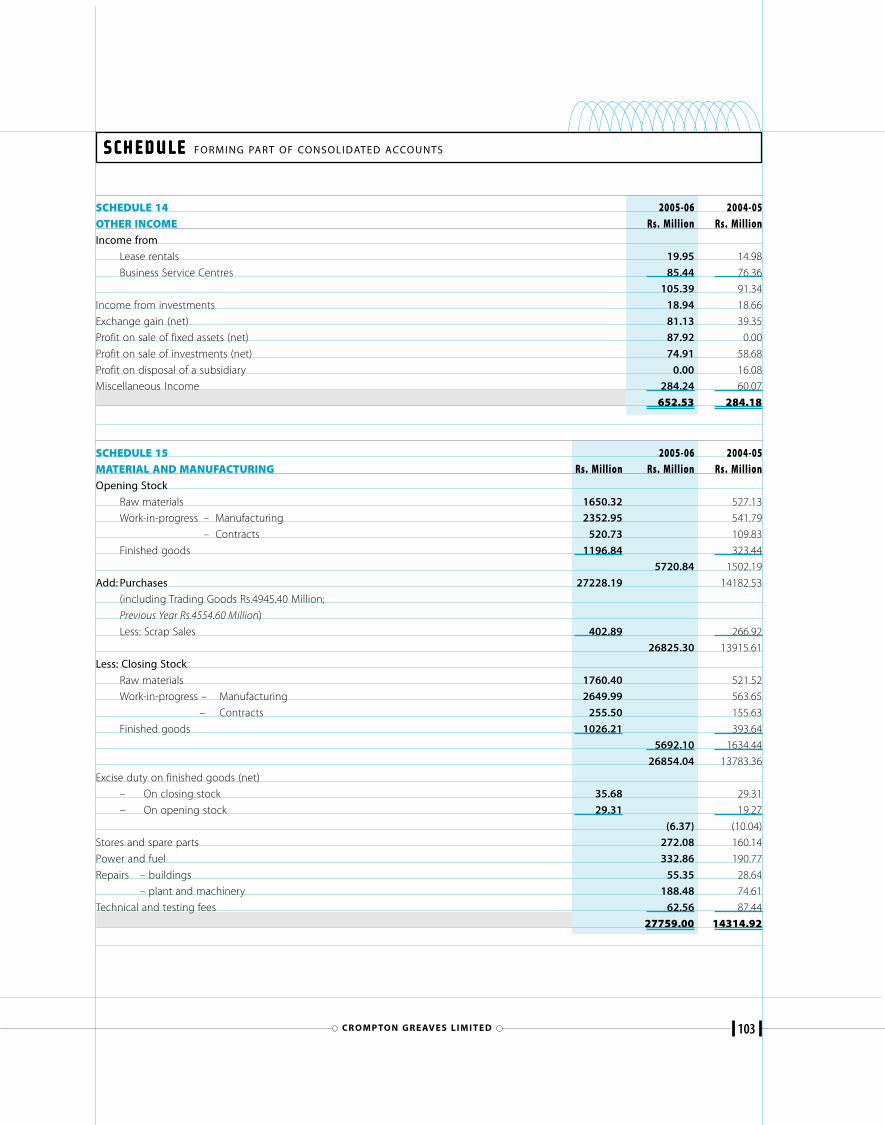
103CR O M P TO N G R E AV E S L I M I T E D
SCHEDULE SCHEDULE SCHEDULE SCHEDULE SCHEDULE FORMING PART OF CONSOLIDATED ACCOUNTS
SCHEDULE 14 2005-06 2004-05OTHER INCOME Rs. Million Rs. MillionIncome from
Lease rentals 19.95 14.98
Business Service Centres 85.44 76.36
105.39 91.34
Income from investments 18.94 18.66
Exchange gain (net) 81.13 39.35
Profit on sale of fixed assets (net) 87.92 0.00
Profit on sale of investments (net) 74.91 58.68
Profit on disposal of a subsidiary 0.00 16.08
Miscellaneous Income 284.24 60.07
652.53 284.18
SCHEDULE 15 2005-06 2004-05MATERIAL AND MANUFACTURING Rs. Million Rs. Million Rs. MillionOpening Stock
Raw materials 1650.32 527.13
Work-in-progress – Manufacturing 2352.95 541.79
– Contracts 520.73 109.83
Finished goods 1196.84 323.44
5720.84 1502.19
Add: Purchases 27228.19 14182.53
(including Trading Goods Rs.4945.40 Million;
Previous Year Rs.4554.60 Million)
Less: Scrap Sales 402.89 266.92
26825.30 13915.61
Less: Closing Stock
Raw materials 1760.40 521.52
Work-in-progress – Manufacturing 2649.99 563.65
– Contracts 255.50 155.63
Finished goods 1026.21 393.64
5692.10 1634.44
26854.04 13783.36
Excise duty on finished goods (net)
– On closing stock 35.68 29.31
– On opening stock 29.31 19.27
(6.37) (10.04)
Stores and spare parts 272.08 160.14
Power and fuel 332.86 190.77
Repairs – buildings 55.35 28.64
– plant and machinery 188.48 74.61
Technical and testing fees 62.56 87.44
27759.00 14314.92
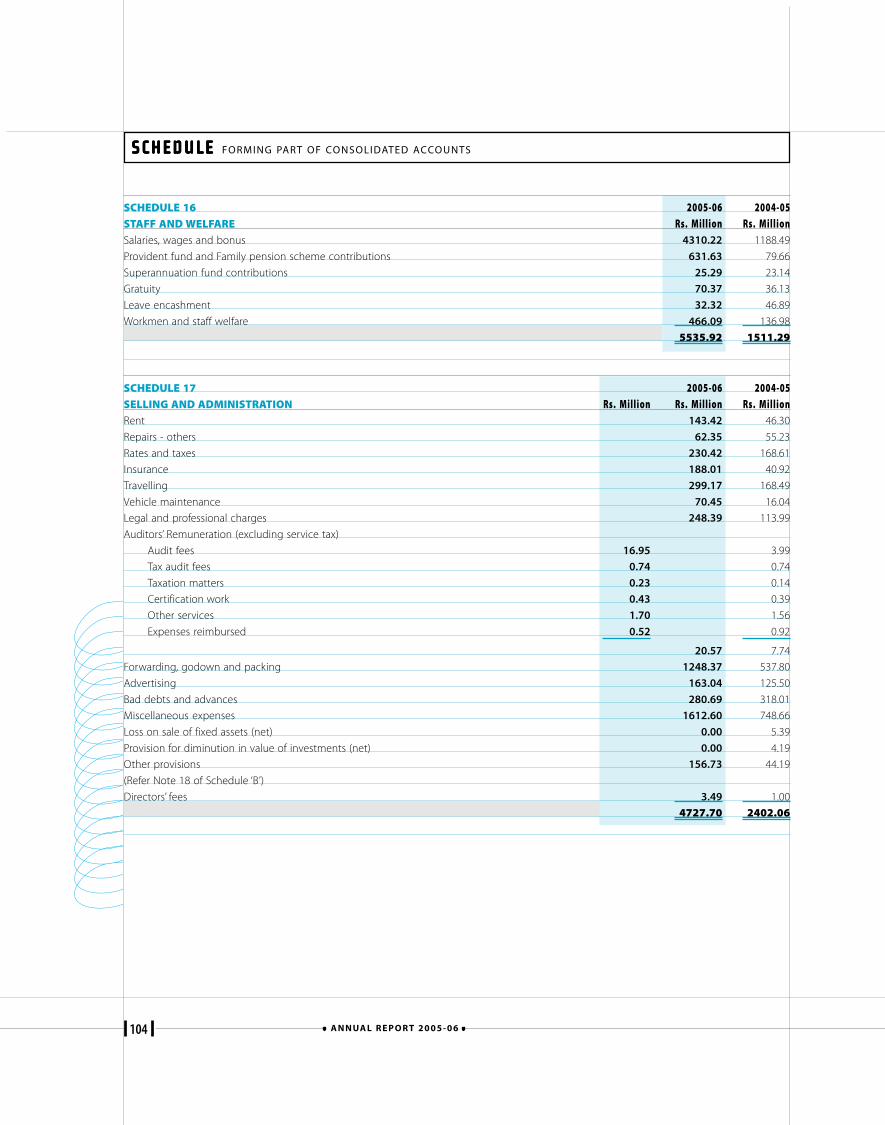
104 A N N UA L R E P O R T 2 0 0 5 - 0 6
SCHEDULE SCHEDULE SCHEDULE SCHEDULE SCHEDULE FORMING PART OF CONSOLIDATED ACCOUNTS
SCHEDULE 16 2005-06 2004-05STAFF AND WELFARE Rs. Million Rs. MillionSalaries, wages and bonus 4310.22 1188.49
Provident fund and Family pension scheme contributions 631.63 79.66
Superannuation fund contributions 25.29 23.14
Gratuity 70.37 36.13
Leave encashment 32.32 46.89
Workmen and staff welfare 466.09 136.98
5535.92 1511.29
SCHEDULE 17 2005-06 2004-05SELLING AND ADMINISTRATION Rs. Million Rs. Million Rs. MillionRent 143.42 46.30
Repairs - others 62.35 55.23
Rates and taxes 230.42 168.61
Insurance 188.01 40.92
Travelling 299.17 168.49
Vehicle maintenance 70.45 16.04
Legal and professional charges 248.39 113.99
Auditors’ Remuneration (excluding service tax)
Audit fees 16.95 3.99
Tax audit fees 0.74 0.74
Taxation matters 0.23 0.14
Certification work 0.43 0.39
Other services 1.70 1.56
Expenses reimbursed 0.52 0.92
20.57 7.74
Forwarding, godown and packing 1248.37 537.80
Advertising 163.04 125.50
Bad debts and advances 280.69 318.01
Miscellaneous expenses 1612.60 748.66
Loss on sale of fixed assets (net) 0.00 5.39
Provision for diminution in value of investments (net) 0.00 4.19
Other provisions 156.73 44.19
(Refer Note 18 of Schedule ‘B’)
Directors’ fees 3.49 1.00
4727.70 2402.06
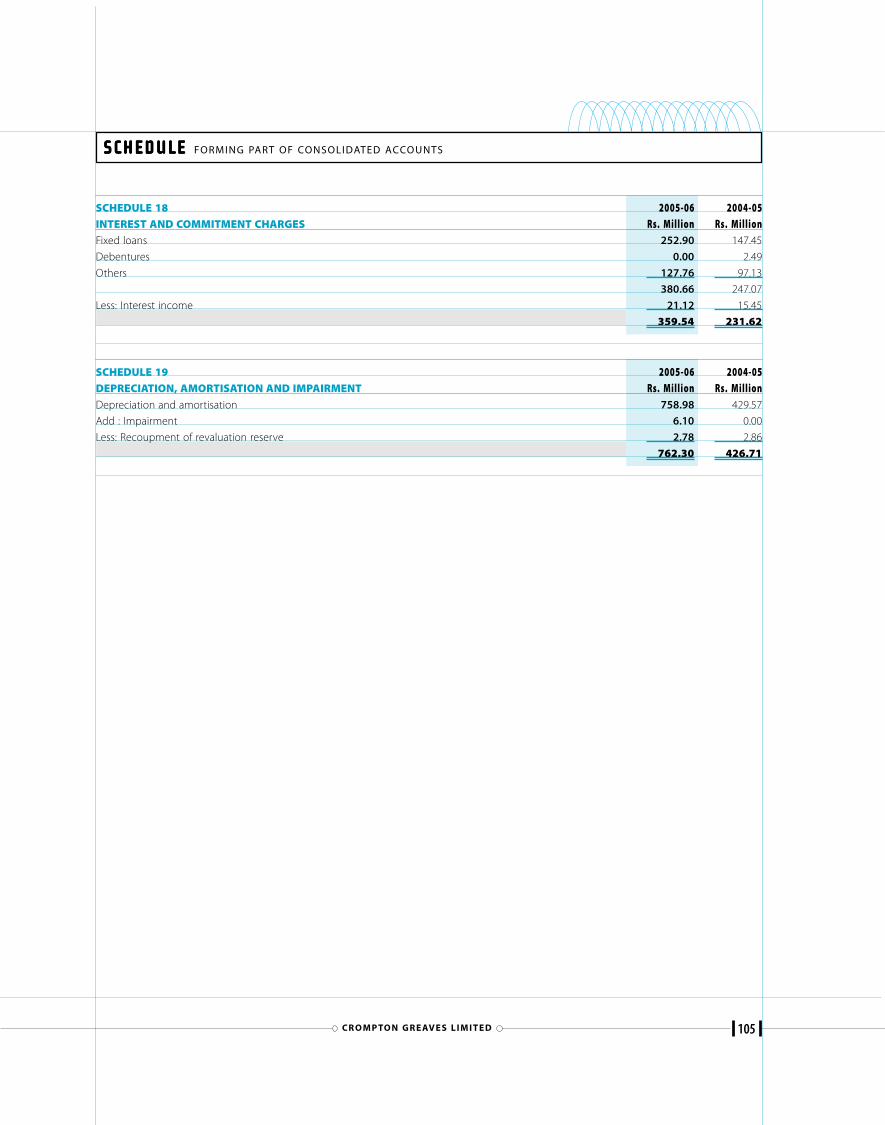
105CR O M P TO N G R E AV E S L I M I T E D
SCHEDULE SCHEDULE SCHEDULE SCHEDULE SCHEDULE FORMING PART OF CONSOLIDATED ACCOUNTS
SCHEDULE 18 2005-06 2004-05INTEREST AND COMMITMENT CHARGES Rs. Million Rs. MillionFixed loans 252.90 147.45
Debentures 0.00 2.49
Others 127.76 97.13
380.66 247.07
Less: Interest income 21.12 15.45
359.54 231.62
SCHEDULE 19 2005-06 2004-05DEPRECIATION, AMORTISATION AND IMPAIRMENT Rs. Million Rs. MillionDepreciation and amortisation 758.98 429.57
Add : Impairment 6.10 0.00
Less: Recoupment of revaluation reserve 2.78 2.86
762.30 426.71
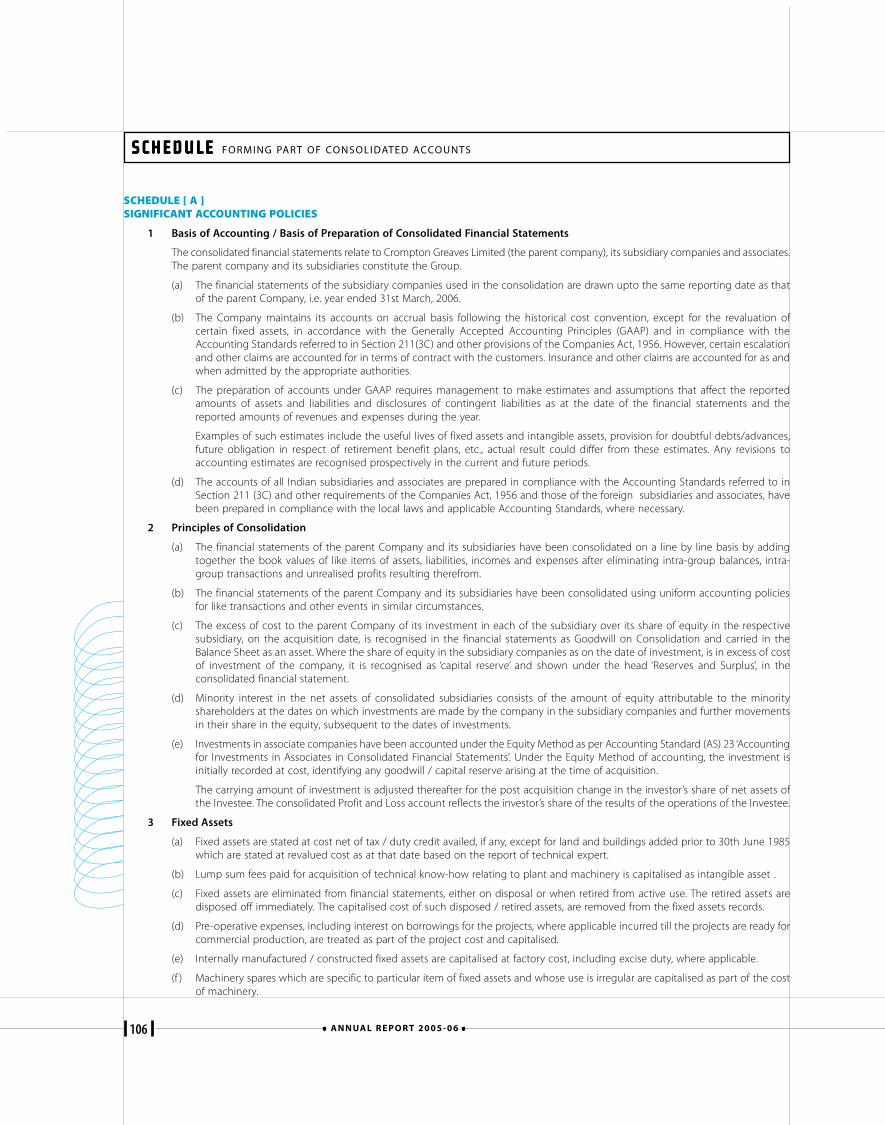
106 A N N UA L R E P O R T 2 0 0 5 - 0 6
SCHEDULE [ A ]SIGNIFICANT ACCOUNTING POLICIES
1 Basis of Accounting / Basis of Preparation of Consolidated Financial Statements
The consolidated financial statements relate to Crompton Greaves Limited (the parent company), its subsidiary companies and associates.The parent company and its subsidiaries constitute the Group.
(a) The financial statements of the subsidiary companies used in the consolidation are drawn upto the same reporting date as thatof the parent Company, i.e. year ended 31st March, 2006.
(b) The Company maintains its accounts on accrual basis following the historical cost convention, except for the revaluation ofcertain fixed assets, in accordance with the Generally Accepted Accounting Principles (GAAP) and in compliance with theAccounting Standards referred to in Section 211(3C) and other provisions of the Companies Act, 1956. However, certain escalationand other claims are accounted for in terms of contract with the customers. Insurance and other claims are accounted for as andwhen admitted by the appropriate authorities.
(c) The preparation of accounts under GAAP requires management to make estimates and assumptions that affect the reportedamounts of assets and liabilities and disclosures of contingent liabilities as at the date of the financial statements and thereported amounts of revenues and expenses during the year.
Examples of such estimates include the useful lives of fixed assets and intangible assets, provision for doubtful debts/advances,future obligation in respect of retirement benefit plans, etc., actual result could differ from these estimates. Any revisions toaccounting estimates are recognised prospectively in the current and future periods.
(d) The accounts of all Indian subsidiaries and associates are prepared in compliance with the Accounting Standards referred to inSection 211 (3C) and other requirements of the Companies Act, 1956 and those of the foreign subsidiaries and associates, havebeen prepared in compliance with the local laws and applicable Accounting Standards, where necessary.
2 Principles of Consolidation
(a) The financial statements of the parent Company and its subsidiaries have been consolidated on a line by line basis by addingtogether the book values of like items of assets, liabilities, incomes and expenses after eliminating intra-group balances, intra-group transactions and unrealised profits resulting therefrom.
(b) The financial statements of the parent Company and its subsidiaries have been consolidated using uniform accounting policiesfor like transactions and other events in similar circumstances.
(c) The excess of cost to the parent Company of its investment in each of the subsidiary over its share of equity in the respectivesubsidiary, on the acquisition date, is recognised in the financial statements as Goodwill on Consolidation and carried in theBalance Sheet as an asset. Where the share of equity in the subsidiary companies as on the date of investment, is in excess of costof investment of the company, it is recognised as ‘capital reserve’ and shown under the head ‘Reserves and Surplus’, in theconsolidated financial statement.
(d) Minority interest in the net assets of consolidated subsidiaries consists of the amount of equity attributable to the minorityshareholders at the dates on which investments are made by the company in the subsidiary companies and further movementsin their share in the equity, subsequent to the dates of investments.
(e) Investments in associate companies have been accounted under the Equity Method as per Accounting Standard (AS) 23 ‘Accountingfor Investments in Associates in Consolidated Financial Statements’. Under the Equity Method of accounting, the investment isinitially recorded at cost, identifying any goodwill / capital reserve arising at the time of acquisition.
The carrying amount of investment is adjusted thereafter for the post acquisition change in the investor’s share of net assets ofthe Investee. The consolidated Profit and Loss account reflects the investor’s share of the results of the operations of the Investee.
3 Fixed Assets
(a) Fixed assets are stated at cost net of tax / duty credit availed, if any, except for land and buildings added prior to 30th June 1985which are stated at revalued cost as at that date based on the report of technical expert.
(b) Lump sum fees paid for acquisition of technical know-how relating to plant and machinery is capitalised as intangible asset .
(c) Fixed assets are eliminated from financial statements, either on disposal or when retired from active use. The retired assets aredisposed off immediately. The capitalised cost of such disposed / retired assets, are removed from the fixed assets records.
(d) Pre-operative expenses, including interest on borrowings for the projects, where applicable incurred till the projects are ready forcommercial production, are treated as part of the project cost and capitalised.
(e) Internally manufactured / constructed fixed assets are capitalised at factory cost, including excise duty, where applicable.
(f ) Machinery spares which are specific to particular item of fixed assets and whose use is irregular are capitalised as part of the costof machinery.
SCHEDULE SCHEDULE SCHEDULE SCHEDULE SCHEDULE FORMING PART OF CONSOLIDATED ACCOUNTS
107CR O M P TO N G R E AV E S L I M I T E D
SCHEDULE [ A ] (Contd.)
4 Impairment of Assets
(a) The carrying amount of assets, other than inventories is reviewed at each balance sheet date to determine whether there is anyindication of impairment. If any such indication exist, the recoverable amount of the assets is estimated.
(b) An impairment loss is recognized whenever the carrying amount of an assets or its cash generating units exceeds its recoverableamount. The recoverable amount is the greater of the asset’s net selling price and value in use which is determined based on theestimated future cash flow generated from the continuing use of an asset and from its disposal at the end of its useful lifediscounted to their present values.
(c) An impairment loss is reversed if there has been a change in the estimates made to determine and recognise the recoverableamount in the earlier years.
5 Intangible Assets and Amortisation
Intangible assets are recognized as per the criteria specified in Accounting Standard (AS) 26 ‘Intangible Assets’ are amortisedas follows :
(a) Leasehold land: over the period of lease
(b) Specialised software: Over a period of five years
(c) Lump sum fees for technical know-how: Over a period of five years from the year of commercial production
(d) Other intangible assets are amortised over the period of five years.
6 Investments
(a) Long term investments are carried at cost after providing for any diminution in value, if such diminution is of permanent nature.
(b) Current investments are carried at lower of cost or market value. The determination of carrying costs of such investments is doneon the basis of specific identification.
7 Inventories
Inventories are valued at lower of cost or net realisable value, after providing for obsolescence and damage as follows :
(a) Raw materials, packing materials, : At Cost, on FIFO/Weighted average basisstores and spares
(b) Work-in-process - Manufacturing : At Cost plus appropriate production overheads
(c) Work-in-process - Contracts : At Cost till a certain percentage of completion and thereafter at realisable value
(d) Finished goods - Manufacturing : At Cost, plus appropriate production overheads, including excise duty paid /payable on such goods.
(e) Finished goods - Trading : At Cost, on Weighted average basis
8 Foreign currency transactions, Forward contracts and Derivatives
(a) The reporting currency of the Company is Indian Rupee.
(b) Foreign currency transactions are recorded on initial recognition in the reporting currency, using the exchange rate at the date oftransaction. At each balance sheet, foreign currency monetary items are reported using the closing rate.
Exchange differences that arise on settlement of monetary items are :
i) adjusted in the cost of fixed assets specifically financed by the borrowings to which the exchange differences relate.
ii) recognised as income or expense in the period in which they arise.
(c) The Company uses foreign exchange forward contract to hedge its exposure to movements in foreign exchange rates. The use ofthese contracts reduces the risk or cost and the company does not use these contracts for trading or speculation purposes. Cashflows arising on account of roll over / cancellation are recognised as income / expense of the period in line with the movementin the underlying exposures.
(d) Derivative transactions are considered as off-balance sheet items and cash flows arising therefrom are recognised in the books ofaccount as and when the settlements take place / over the tenor thereof in accordance with the terms of the respectivecontracts.
SCHEDULE SCHEDULE SCHEDULE SCHEDULE SCHEDULE FORMING PART OF CONSOLIDATED ACCOUNTS
108 A N N UA L R E P O R T 2 0 0 5 - 0 6
(e) In accordance with the requirement of Accounting Standard -11 (Revised) - “The effects of changes in foreign exchange rates”,operations of foreign subsidiaries which are considered as non-integral operations, their financial statements are converted inIndian Rupees at the following exchange rates:
i) Revenue and Expenses: At the average exchange rate during the period
ii) Current Assets and Current Liabilities: Exchange rate prevailing at the end of the period.
iii) Fixed Assets: Exchange Rate prevailing at the end of the period
iv) Share Capital: At the original rate when the capital was infused
The resultant translation exchange differences are accumulated in the Foreign Currency Translation Reserves.
9 Revenue Recognition
(a) Revenue from sale of products and services are recognised when all the significant risk and reward of ownership of the productsare passed on to the customers, which is generally on despatch of goods and acceptance or when the service has beenprovided.
(b) Sales include excise duty and price variation and is recognised in terms of contracts with the customers. Sales exclude valueadded tax / sales tax.
(c) Revenue from contracts is recognised based on percentage completion after providing for expected losses.
10 Retirement Benefits
Provisions for/ contributions to retirement benefit schemes are made as follows:
(a) Provident fund contributions on actual liability basis.
(b) Superannuation contributions are accrued on actual liability basis.
(c) Gratuity contributions are determined and accrued on the basis of actuarial valuation.
(d) Leave encashment benefits are determined and accrued on the basis of actuarial valuation.
11 Depreciation
(a) Depreciation on the fixed assets is provided at the rates and in the manner specified in Schedule XIV of the Companies Act, 1956,on written down value method other than on buildings and plant and equipment, which are depreciated on a straight linemethod.
(b) Building constructed on leasehold land are depreciated at normal rate as prescribed in Schedule XIV to the Companies Act, 1956,where the lease period of land is beyond the life of the building. In other cases, amortised over the lease period.
(c) In the case of revalued assets, the difference between the depreciation based on revaluation and the depreciation charged onhistorical cost is recouped out of revaluation reserve.
(d) In case of impaired assets, the depreciation is charged on the adjusted cost computed after impairment.
(e) In case of foreign subsidiaries, depreciation on fixed assets has been provided at the rates required/ permissible by the GenerallyAccepted Accounting Principles of the respective countires. However, the depreciation rates are higher than the rates specified inthe Schedule XIV of the Indian Companies Act, 1956.
12 Research and Development
(a) Revenue expenditure on research and development is charged under respective heads of account.
(b) Capital expenditure on research and development is included as part of fixed assets and depreciated on the same basis as otherfixed assets.
13 Borrowing Costs
(a) Borrowing costs that are attributable to the acquisition, construction or production of qualifying assets are capitalised as part ofthe cost of such assets till such time as the asset is ready for its intended use or sale. A qualifying asset is an asset that necessarilytakes a substantial period over twelve months of time to get ready for its intended use or sale.
(b) All other borrowing costs are recognised as expense in the period in which they are incurred.
14 Taxes on Income
(a) Tax on income for the current period is determined on the basis of estimated taxable income and tax credits computed inaccordance with the provisions of relevant tax laws and based on the expected outcome of assessments / appeals.
SCHEDULE [ A ] (Contd.)
SCHEDULE SCHEDULE SCHEDULE SCHEDULE SCHEDULE FORMING PART OF CONSOLIDATED ACCOUNTS
109CR O M P TO N G R E AV E S L I M I T E D
(b) Deferred tax is recognised, subject to the consideration of prudence in respect of deferred tax assets, on timing differences,being the difference between taxable income and accounting income that originate in one period and are capable of reversal inone or more subsequent periods.
(c) Deferred tax assets are recognised and carried forward only to the extent that there is reasonable certainty supported byconvincing evidence that sufficient future taxable income will be available against which such deferred tax assets can be realised.
(d) Deferred tax is quantified using the tax rates and laws enacted or substantively enacted as on the balance sheet date.
15 Events occurring after the balance sheet date
Events occurring after the date of balance sheet, where material, are considered upto the date of approval of the accounts by theBoard of Directors.
16 Provisions, Contingent liabilities and Contingent assets
(a) Provisions are recognised for liabilities that can be measured only by using a substantial degree of estimation, if
i) the Company has a present obligation as a result of past event;
ii) a probable outflow of resources is expected to settle the obligation; and
iii) the amount of the obligation can be reliably estimated.
(b) Reimbursements by another party, expected in respect of expenditure required to settle a provision, is recognised when it isvirtual certain that reimbursement will be received if obligation is settled.
(c) Contingent liability is disclosed in the case of
i) a present obligation arising from a past event, when it is not probable that an outflow of resources will be required to settlethe obligation;
ii) a possible obligation, unless the probability of outflow of resources is remote.
(d) Contingent assets are neither disclosed nor recognised.
(e) Provision, contingent liabilities and contingent assets are reviewed at each balance sheet date.
SCHEDULE [ A ] (Contd.)
SCHEDULE SCHEDULE SCHEDULE SCHEDULE SCHEDULE FORMING PART OF CONSOLIDATED ACCOUNTS
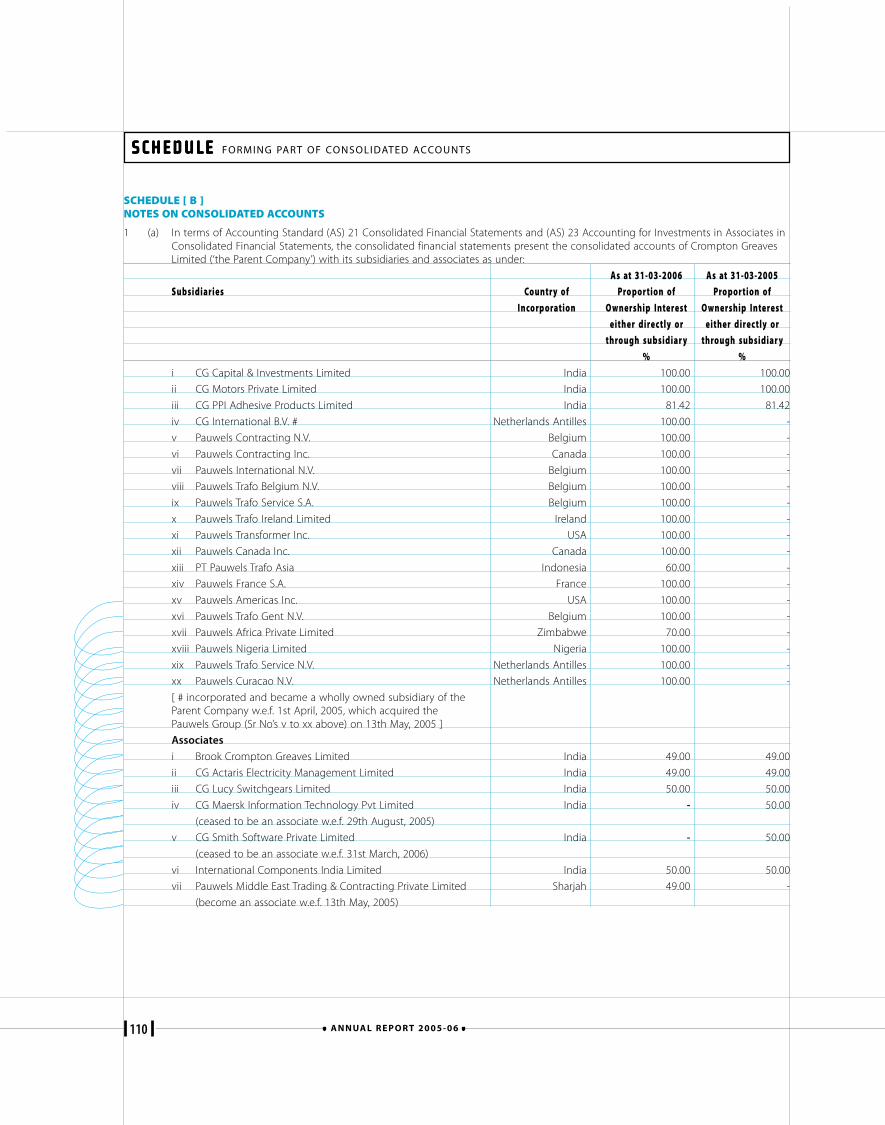
110 A N N UA L R E P O R T 2 0 0 5 - 0 6
1 (a) In terms of Accounting Standard (AS) 21 Consolidated Financial Statements and (AS) 23 Accounting for Investments in Associates inConsolidated Financial Statements, the consolidated financial statements present the consolidated accounts of Crompton GreavesLimited (‘the Parent Company’) with its subsidiaries and associates as under:
As at 31-03-2006 As at 31-03-2005Subsidiaries Country of Propor tion of Propor tion of
Incorporation Ownership Interest Ownership Interesteither direc tly or either direc tly or
through subsidiar y through subsidiar y% %
i CG Capital & Investments Limited India 100.00 100.00
ii CG Motors Private Limited India 100.00 100.00
iii CG PPI Adhesive Products Limited India 81.42 81.42
iv CG International B.V. # Netherlands Antilles 100.00 -
v Pauwels Contracting N.V. Belgium 100.00 -
vi Pauwels Contracting Inc. Canada 100.00 -
vii Pauwels International N.V. Belgium 100.00 -
viii Pauwels Trafo Belgium N.V. Belgium 100.00 -
ix Pauwels Trafo Service S.A. Belgium 100.00 -
x Pauwels Trafo Ireland Limited Ireland 100.00 -
xi Pauwels Transformer Inc. USA 100.00 -
xii Pauwels Canada Inc. Canada 100.00 -
xiii PT Pauwels Trafo Asia Indonesia 60.00 -
xiv Pauwels France S.A. France 100.00 -
xv Pauwels Americas Inc. USA 100.00 -
xvi Pauwels Trafo Gent N.V. Belgium 100.00 -
xvii Pauwels Africa Private Limited Zimbabwe 70.00 -
xviii Pauwels Nigeria Limited Nigeria 100.00 -
xix Pauwels Trafo Service N.V. Netherlands Antilles 100.00 -
xx Pauwels Curacao N.V. Netherlands Antilles 100.00 -
[ # incorporated and became a wholly owned subsidiary of theParent Company w.e.f. 1st April, 2005, which acquired thePauwels Group (Sr No’s v to xx above) on 13th May, 2005 ]
Associates
i Brook Crompton Greaves Limited India 49.00 49.00
ii CG Actaris Electricity Management Limited India 49.00 49.00
iii CG Lucy Switchgears Limited India 50.00 50.00
iv CG Maersk Information Technology Pvt Limited India - 50.00
(ceased to be an associate w.e.f. 29th August, 2005)
v CG Smith Software Private Limited India - 50.00
(ceased to be an associate w.e.f. 31st March, 2006)
vi International Components India Limited India 50.00 50.00
vii Pauwels Middle East Trading & Contracting Private Limited Sharjah 49.00 -
(become an associate w.e.f. 13th May, 2005)
SCHEDULE [ B ]NOTES ON CONSOLIDATED ACCOUNTS
SCHEDULE SCHEDULE SCHEDULE SCHEDULE SCHEDULE FORMING PART OF CONSOLIDATED ACCOUNTS
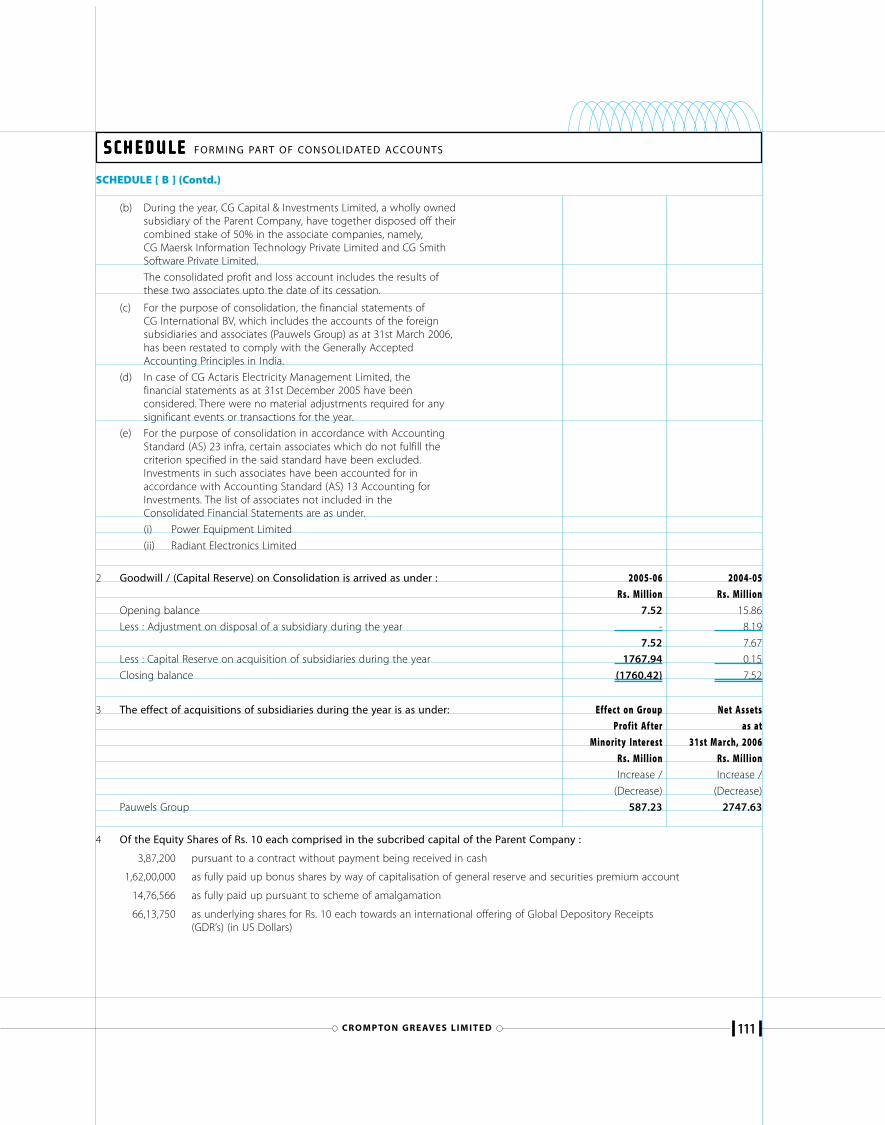
111CR O M P TO N G R E AV E S L I M I T E D
(b) During the year, CG Capital & Investments Limited, a wholly ownedsubsidiary of the Parent Company, have together disposed off theircombined stake of 50% in the associate companies, namely,CG Maersk Information Technology Private Limited and CG SmithSoftware Private Limited.
The consolidated profit and loss account includes the results ofthese two associates upto the date of its cessation.
(c) For the purpose of consolidation, the financial statements ofCG International BV, which includes the accounts of the foreignsubsidiaries and associates (Pauwels Group) as at 31st March 2006,has been restated to comply with the Generally AcceptedAccounting Principles in India.
(d) In case of CG Actaris Electricity Management Limited, thefinancial statements as at 31st December 2005 have beenconsidered. There were no material adjustments required for anysignificant events or transactions for the year.
(e) For the purpose of consolidation in accordance with AccountingStandard (AS) 23 infra, certain associates which do not fulfill thecriterion specified in the said standard have been excluded.Investments in such associates have been accounted for inaccordance with Accounting Standard (AS) 13 Accounting forInvestments. The list of associates not included in theConsolidated Financial Statements are as under.
(i) Power Equipment Limited
(ii) Radiant Electronics Limited
2 Goodwill / (Capital Reserve) on Consolidation is arrived as under : 2005-06 2004-05Rs. Million Rs. Million
Opening balance 7.52 15.86
Less : Adjustment on disposal of a subsidiary during the year - 8.19
7.52 7.67
Less : Capital Reserve on acquisition of subsidiaries during the year 1767.94 0.15
Closing balance (1760.42) 7.52
3 The effect of acquisitions of subsidiaries during the year is as under: Effec t on Group Net AssetsProfit Af ter as at
Minorit y Interest 31st March, 2006Rs. Million Rs. MillionIncrease / Increase /
(Decrease) (Decrease)
Pauwels Group 587.23 2747.63
4 Of the Equity Shares of Rs. 10 each comprised in the subcribed capital of the Parent Company :
3,87,200 pursuant to a contract without payment being received in cash
1,62,00,000 as fully paid up bonus shares by way of capitalisation of general reserve and securities premium account
14,76,566 as fully paid up pursuant to scheme of amalgamation
66,13,750 as underlying shares for Rs. 10 each towards an international offering of Global Depository Receipts(GDR’s) (in US Dollars)
SCHEDULE [ B ] (Contd.)
SCHEDULE SCHEDULE SCHEDULE SCHEDULE SCHEDULE FORMING PART OF CONSOLIDATED ACCOUNTS
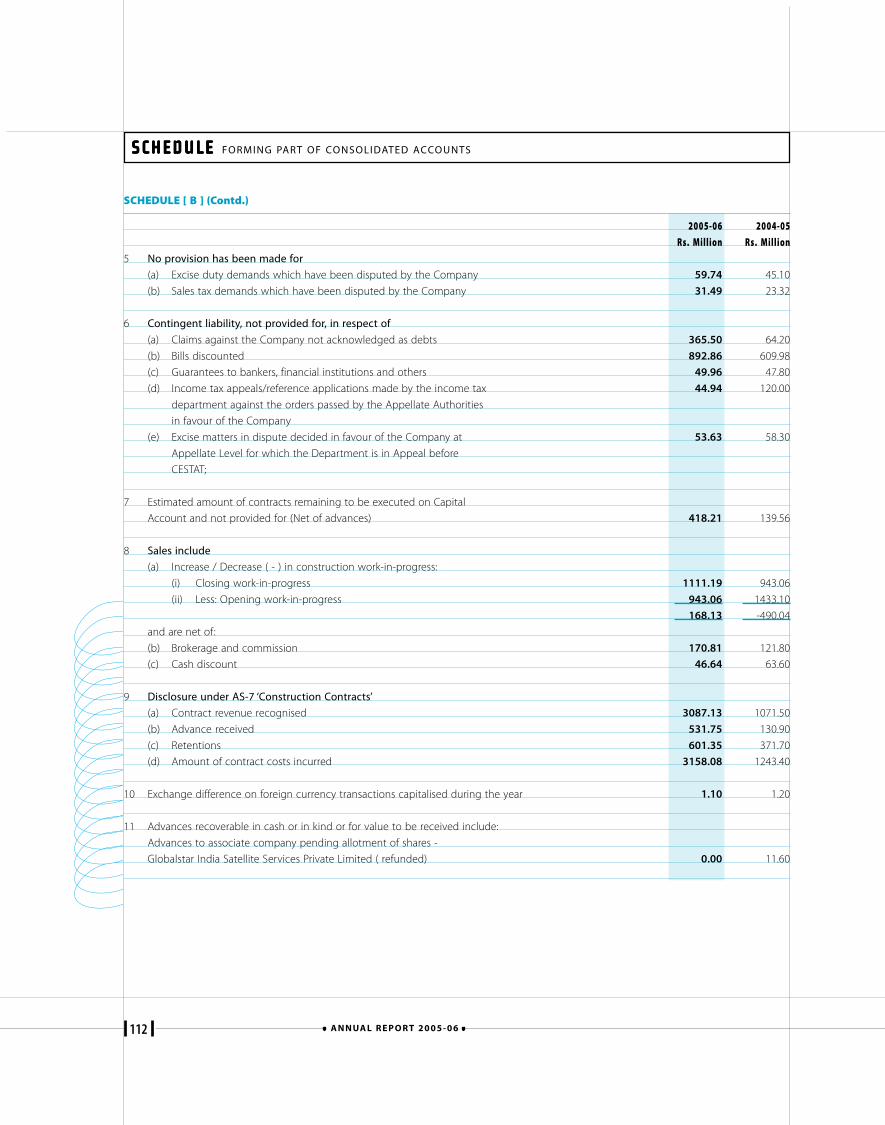
112 A N N UA L R E P O R T 2 0 0 5 - 0 6
SCHEDULE [ B ] (Contd.)
2005-06 2004-05Rs. Million Rs. Million
5 No provision has been made for
(a) Excise duty demands which have been disputed by the Company 59.74 45.10
(b) Sales tax demands which have been disputed by the Company 31.49 23.32
6 Contingent liability, not provided for, in respect of
(a) Claims against the Company not acknowledged as debts 365.50 64.20
(b) Bills discounted 892.86 609.98
(c) Guarantees to bankers, financial institutions and others 49.96 47.80
(d) Income tax appeals/reference applications made by the income tax 44.94 120.00
department against the orders passed by the Appellate Authorities
in favour of the Company
(e) Excise matters in dispute decided in favour of the Company at 53.63 58.30
Appellate Level for which the Department is in Appeal before
CESTAT;
7 Estimated amount of contracts remaining to be executed on Capital
Account and not provided for (Net of advances) 418.21 139.56
8 Sales include
(a) Increase / Decrease ( - ) in construction work-in-progress:
(i) Closing work-in-progress 1111.19 943.06
(ii) Less: Opening work-in-progress 943.06 1433.10
168.13 -490.04
and are net of:
(b) Brokerage and commission 170.81 121.80
(c) Cash discount 46.64 63.60
9 Disclosure under AS-7 ‘Construction Contracts’
(a) Contract revenue recognised 3087.13 1071.50
(b) Advance received 531.75 130.90
(c) Retentions 601.35 371.70
(d) Amount of contract costs incurred 3158.08 1243.40
10 Exchange difference on foreign currency transactions capitalised during the year 1.10 1.20
11 Advances recoverable in cash or in kind or for value to be received include:
Advances to associate company pending allotment of shares -
Globalstar India Satellite Services Private Limited ( refunded) 0.00 11.60
SCHEDULE SCHEDULE SCHEDULE SCHEDULE SCHEDULE FORMING PART OF CONSOLIDATED ACCOUNTS
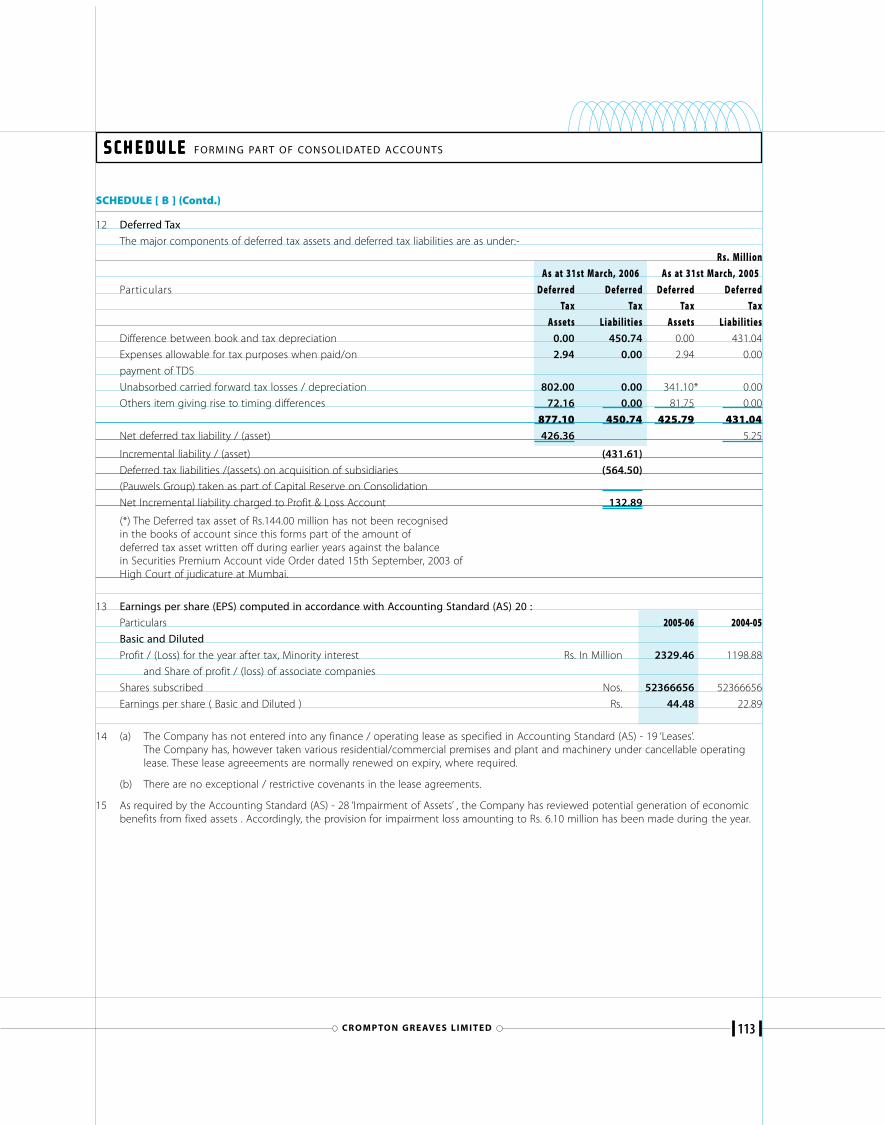
113CR O M P TO N G R E AV E S L I M I T E D
SCHEDULE [ B ] (Contd.)
12 Deferred Tax
The major components of deferred tax assets and deferred tax liabilities are as under:-
Rs. MillionAs at 31st March, 2006 As at 31st March, 2005
Particulars Deferre d Deferre d Deferre d Deferre dTax Tax Tax Tax
Assets Liabilities Assets LiabilitiesDifference between book and tax depreciation 0.00 450.74 0.00 431.04
Expenses allowable for tax purposes when paid/on 2.94 0.00 2.94 0.00
payment of TDS
Unabsorbed carried forward tax losses / depreciation 802.00 0.00 341.10* 0.00
Others item giving rise to timing differences 72.16 0.00 81.75 0.00
877.10 450.74 425.79 431.04Net deferred tax liability / (asset) 426.36 5.25
Incremental liability / (asset) (431.61)
Deferred tax liabilities /(assets) on acquisition of subsidiaries (564.50)
(Pauwels Group) taken as part of Capital Reserve on Consolidation
Net Incremental liability charged to Profit & Loss Account 132.89
(*) The Deferred tax asset of Rs.144.00 million has not been recognisedin the books of account since this forms part of the amount ofdeferred tax asset written off during earlier years against the balancein Securities Premium Account vide Order dated 15th September, 2003 ofHigh Court of judicature at Mumbai.
13 Earnings per share (EPS) computed in accordance with Accounting Standard (AS) 20 :
Particulars 2005-06 2004-05Basic and Diluted
Profit / (Loss) for the year after tax, Minority interest Rs. In Million 2329.46 1198.88
and Share of profit / (loss) of associate companies
Shares subscribed Nos. 52366656 52366656
Earnings per share ( Basic and Diluted ) Rs. 44.48 22.89
14 (a) The Company has not entered into any finance / operating lease as specified in Accounting Standard (AS) - 19 ‘Leases’.The Company has, however taken various residential/commercial premises and plant and machinery under cancellable operatinglease. These lease agreeements are normally renewed on expiry, where required.
(b) There are no exceptional / restrictive covenants in the lease agreements.
15 As required by the Accounting Standard (AS) - 28 ‘Impairment of Assets’ , the Company has reviewed potential generation of economicbenefits from fixed assets . Accordingly, the provision for impairment loss amounting to Rs. 6.10 million has been made during the year.
SCHEDULE SCHEDULE SCHEDULE SCHEDULE SCHEDULE FORMING PART OF CONSOLIDATED ACCOUNTS
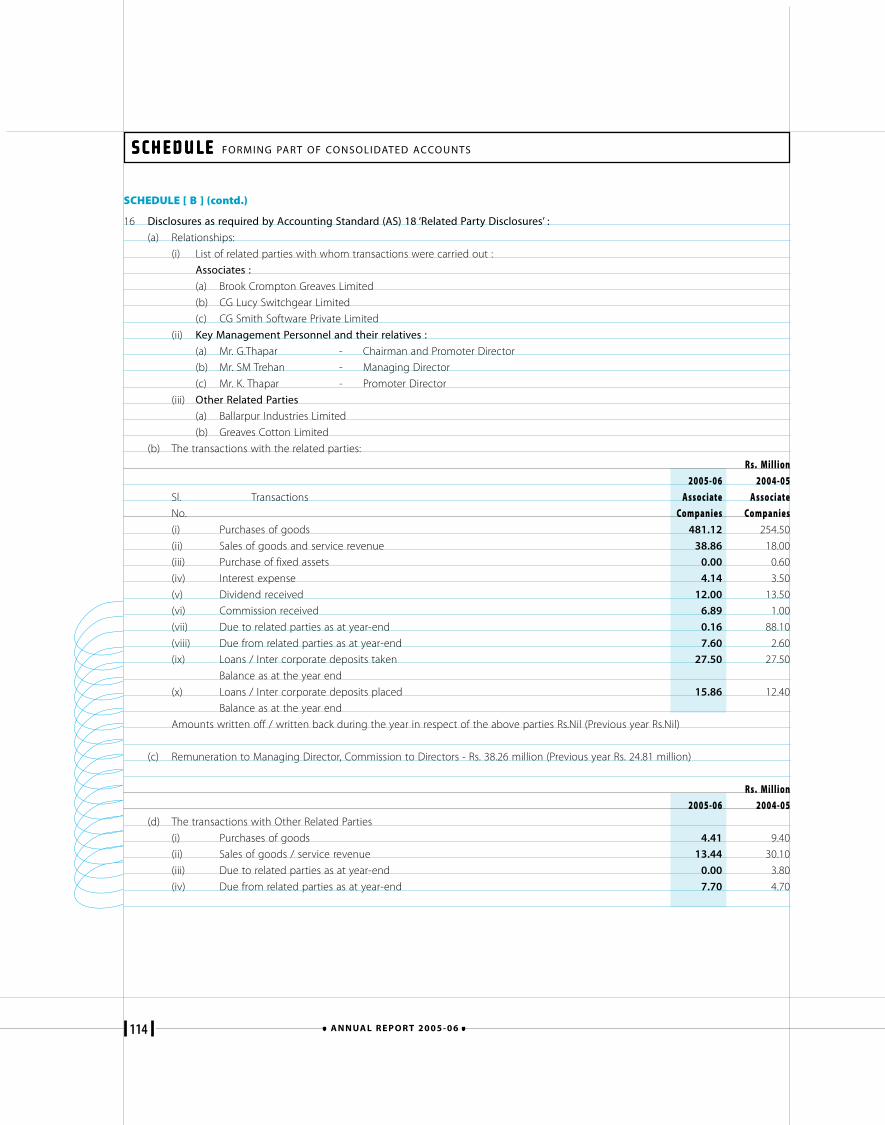
114 A N N UA L R E P O R T 2 0 0 5 - 0 6
SCHEDULE [ B ] (contd.)
16 Disclosures as required by Accounting Standard (AS) 18 ‘Related Party Disclosures’ :
(a) Relationships:
(i) List of related parties with whom transactions were carried out :
Associates :
(a) Brook Crompton Greaves Limited
(b) CG Lucy Switchgear Limited
(c) CG Smith Software Private Limited
(ii) Key Management Personnel and their relatives :
(a) Mr. G.Thapar - Chairman and Promoter Director
(b) Mr. SM Trehan - Managing Director
(c) Mr. K. Thapar - Promoter Director
(iii) Other Related Parties
(a) Ballarpur Industries Limited
(b) Greaves Cotton Limited
(b) The transactions with the related parties:
Rs. Million2005-06 2004-05
Sl. Transactions Associate AssociateNo. Companies Companies(i) Purchases of goods 481.12 254.50
(ii) Sales of goods and service revenue 38.86 18.00
(iii) Purchase of fixed assets 0.00 0.60
(iv) Interest expense 4.14 3.50
(v) Dividend received 12.00 13.50
(vi) Commission received 6.89 1.00
(vii) Due to related parties as at year-end 0.16 88.10
(viii) Due from related parties as at year-end 7.60 2.60
(ix) Loans / Inter corporate deposits taken 27.50 27.50
Balance as at the year end
(x) Loans / Inter corporate deposits placed 15.86 12.40
Balance as at the year end
Amounts written off / written back during the year in respect of the above parties Rs.Nil (Previous year Rs.Nil)
(c) Remuneration to Managing Director, Commission to Directors - Rs. 38.26 million (Previous year Rs. 24.81 million)
Rs. Million2005-06 2004-05
(d) The transactions with Other Related Parties
(i) Purchases of goods 4.41 9.40
(ii) Sales of goods / service revenue 13.44 30.10
(iii) Due to related parties as at year-end 0.00 3.80
(iv) Due from related parties as at year-end 7.70 4.70
SCHEDULE SCHEDULE SCHEDULE SCHEDULE SCHEDULE FORMING PART OF CONSOLIDATED ACCOUNTS
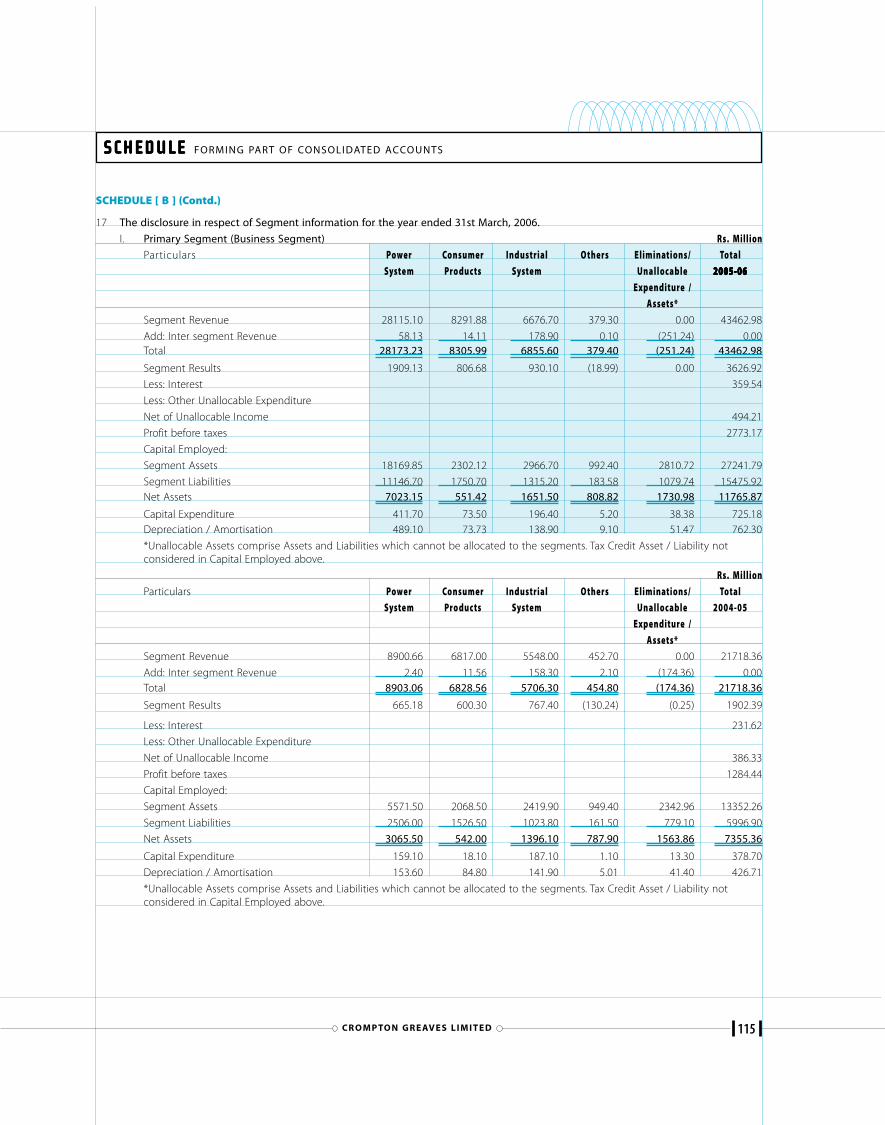
115CR O M P TO N G R E AV E S L I M I T E D
SCHEDULE SCHEDULE SCHEDULE SCHEDULE SCHEDULE FORMING PART OF CONSOLIDATED ACCOUNTS
17 The disclosure in respect of Segment information for the year ended 31st March, 2006.
I. Primary Segment (Business Segment) Rs. MillionParticulars Power Consumer Industrial Others Eliminations/ Total
Syste m Produc ts Syste m Unallocable 2005-062005-062005-062005-062005-06Expenditure /
Assets*Segment Revenue 28115.10 8291.88 6676.70 379.30 0.00 43462.98
Add: Inter segment Revenue 58.13 14.11 178.90 0.10 (251.24) 0.00Total 28173.23 8305.99 6855.60 379.40 (251.24) 43462.98
Segment Results 1909.13 806.68 930.10 (18.99) 0.00 3626.92
Less: Interest 359.54
Less: Other Unallocable Expenditure
Net of Unallocable Income 494.21
Profit before taxes 2773.17
Capital Employed:
Segment Assets 18169.85 2302.12 2966.70 992.40 2810.72 27241.79
Segment Liabilities 11146.70 1750.70 1315.20 183.58 1079.74 15475.92Net Assets 7023.15 551.42 1651.50 808.82 1730.98 11765.87
Capital Expenditure 411.70 73.50 196.40 5.20 38.38 725.18Depreciation / Amortisation 489.10 73.73 138.90 9.10 51.47 762.30
*Unallocable Assets comprise Assets and Liabilities which cannot be allocated to the segments. Tax Credit Asset / Liability notconsidered in Capital Employed above.
Rs. MillionParticulars Power Consumer Industrial Others Eliminations/ Total
Syste m Produc ts Syste m Unallocable 2004-05Expenditure /
Assets*Segment Revenue 8900.66 6817.00 5548.00 452.70 0.00 21718.36
Add: Inter segment Revenue 2.40 11.56 158.30 2.10 (174.36) 0.00Total 8903.06 6828.56 5706.30 454.80 (174.36) 21718.36
Segment Results 665.18 600.30 767.40 (130.24) (0.25) 1902.39
Less: Interest 231.62
Less: Other Unallocable Expenditure
Net of Unallocable Income 386.33
Profit before taxes 1284.44
Capital Employed:
Segment Assets 5571.50 2068.50 2419.90 949.40 2342.96 13352.26
Segment Liabilities 2506.00 1526.50 1023.80 161.50 779.10 5996.90
Net Assets 3065.50 542.00 1396.10 787.90 1563.86 7355.36
Capital Expenditure 159.10 18.10 187.10 1.10 13.30 378.70
Depreciation / Amortisation 153.60 84.80 141.90 5.01 41.40 426.71
*Unallocable Assets comprise Assets and Liabilities which cannot be allocated to the segments. Tax Credit Asset / Liability notconsidered in Capital Employed above.
SCHEDULE [ B ] (Contd.)
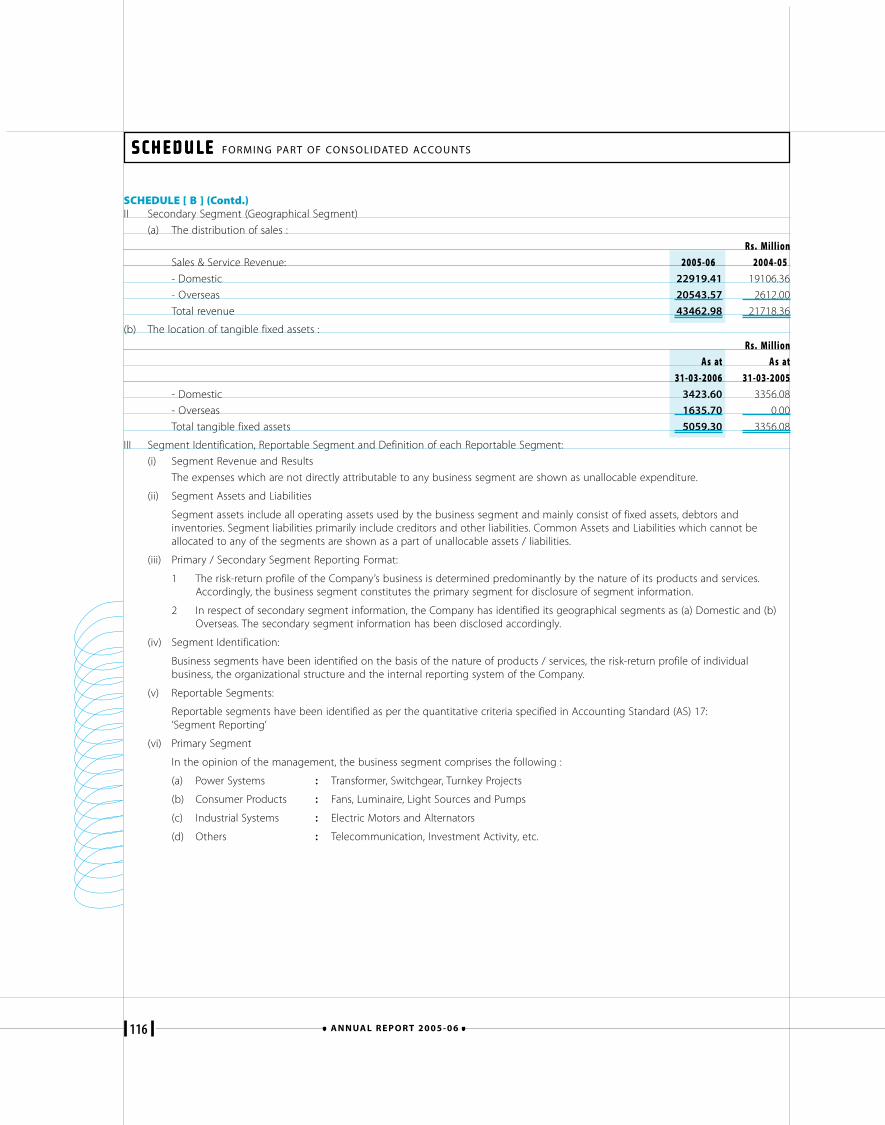
116 A N N UA L R E P O R T 2 0 0 5 - 0 6
II Secondary Segment (Geographical Segment)
(a) The distribution of sales :
Rs. MillionSales & Service Revenue: 2005-06 2004-05- Domestic 22919.41 19106.36
- Overseas 20543.57 2612.00
Total revenue 43462.98 21718.36
(b) The location of tangible fixed assets :
Rs. MillionAs at As at
31-03-2006 31-03-2005- Domestic 3423.60 3356.08
- Overseas 1635.70 0.00
Total tangible fixed assets 5059.30 3356.08
III Segment Identification, Reportable Segment and Definition of each Reportable Segment:
(i) Segment Revenue and Results
The expenses which are not directly attributable to any business segment are shown as unallocable expenditure.
(ii) Segment Assets and Liabilities
Segment assets include all operating assets used by the business segment and mainly consist of fixed assets, debtors andinventories. Segment liabilities primarily include creditors and other liabilities. Common Assets and Liabilities which cannot beallocated to any of the segments are shown as a part of unallocable assets / liabilities.
(iii) Primary / Secondary Segment Reporting Format:
1 The risk-return profile of the Company’s business is determined predominantly by the nature of its products and services.Accordingly, the business segment constitutes the primary segment for disclosure of segment information.
2 In respect of secondary segment information, the Company has identified its geographical segments as (a) Domestic and (b)Overseas. The secondary segment information has been disclosed accordingly.
(iv) Segment Identification:
Business segments have been identified on the basis of the nature of products / services, the risk-return profile of individualbusiness, the organizational structure and the internal reporting system of the Company.
(v) Reportable Segments:
Reportable segments have been identified as per the quantitative criteria specified in Accounting Standard (AS) 17:‘Segment Reporting’
(vi) Primary Segment
In the opinion of the management, the business segment comprises the following :
(a) Power Systems : Transformer, Switchgear, Turnkey Projects
(b) Consumer Products : Fans, Luminaire, Light Sources and Pumps
(c) Industrial Systems : Electric Motors and Alternators
(d) Others : Telecommunication, Investment Activity, etc.
SCHEDULE [ B ] (Contd.)
SCHEDULE SCHEDULE SCHEDULE SCHEDULE SCHEDULE FORMING PART OF CONSOLIDATED ACCOUNTS
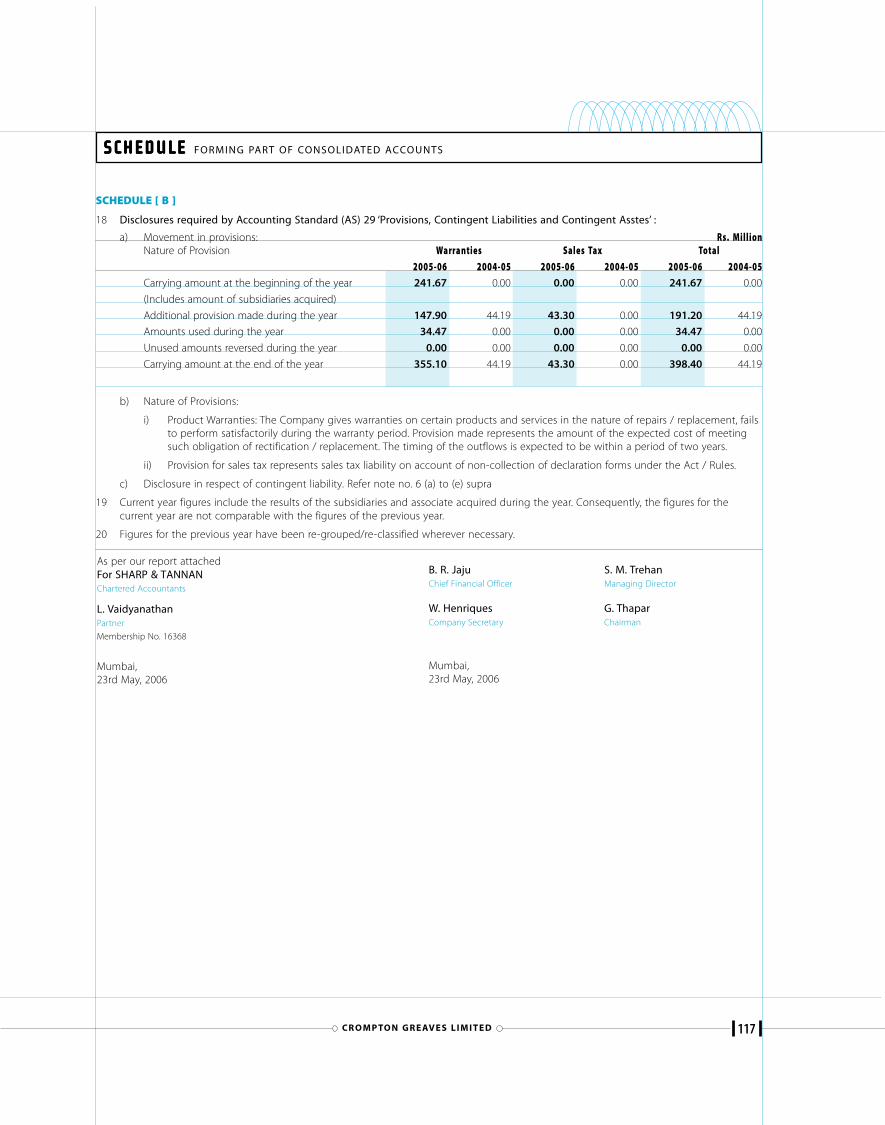
117CR O M P TO N G R E AV E S L I M I T E D
18 Disclosures required by Accounting Standard (AS) 29 ‘Provisions, Contingent Liabilities and Contingent Asstes’ :
a) Movement in provisions: Rs. MillionNature of Provision Warra nties Sales Tax Total
2005-06 2004-05 2005-06 2004-05 2005-06 2004-05Carrying amount at the beginning of the year 241.67 0.00 0.00 0.00 241.67 0.00
(Includes amount of subsidiaries acquired)
Additional provision made during the year 147.90 44.19 43.30 0.00 191.20 44.19
Amounts used during the year 34.47 0.00 0.00 0.00 34.47 0.00
Unused amounts reversed during the year 0.00 0.00 0.00 0.00 0.00 0.00
Carrying amount at the end of the year 355.10 44.19 43.30 0.00 398.40 44.19
b) Nature of Provisions:
i) Product Warranties: The Company gives warranties on certain products and services in the nature of repairs / replacement, failsto perform satisfactorily during the warranty period. Provision made represents the amount of the expected cost of meetingsuch obligation of rectification / replacement. The timing of the outflows is expected to be within a period of two years.
ii) Provision for sales tax represents sales tax liability on account of non-collection of declaration forms under the Act / Rules.
c) Disclosure in respect of contingent liability. Refer note no. 6 (a) to (e) supra
19 Current year figures include the results of the subsidiaries and associate acquired during the year. Consequently, the figures for thecurrent year are not comparable with the figures of the previous year.
20 Figures for the previous year have been re-grouped/re-classified wherever necessary.
SCHEDULE [ B ]
SCHEDULE SCHEDULE SCHEDULE SCHEDULE SCHEDULE FORMING PART OF CONSOLIDATED ACCOUNTS
As per our report attachedFor SHARP & TANNANChartered Accountants
L. VaidyanathanPartner
Membership No. 16368
Mumbai,23rd May, 2006
B. R. Jaju S. M. TrehanChief Financial Officer Managing Director
W. Henriques G. ThaparCompany Secretary Chairman
Mumbai,23rd May, 2006
118 A N N UA L R E P O R T 2 0 0 5 - 0 6
CG International B.V.ConsolidatedFinancials
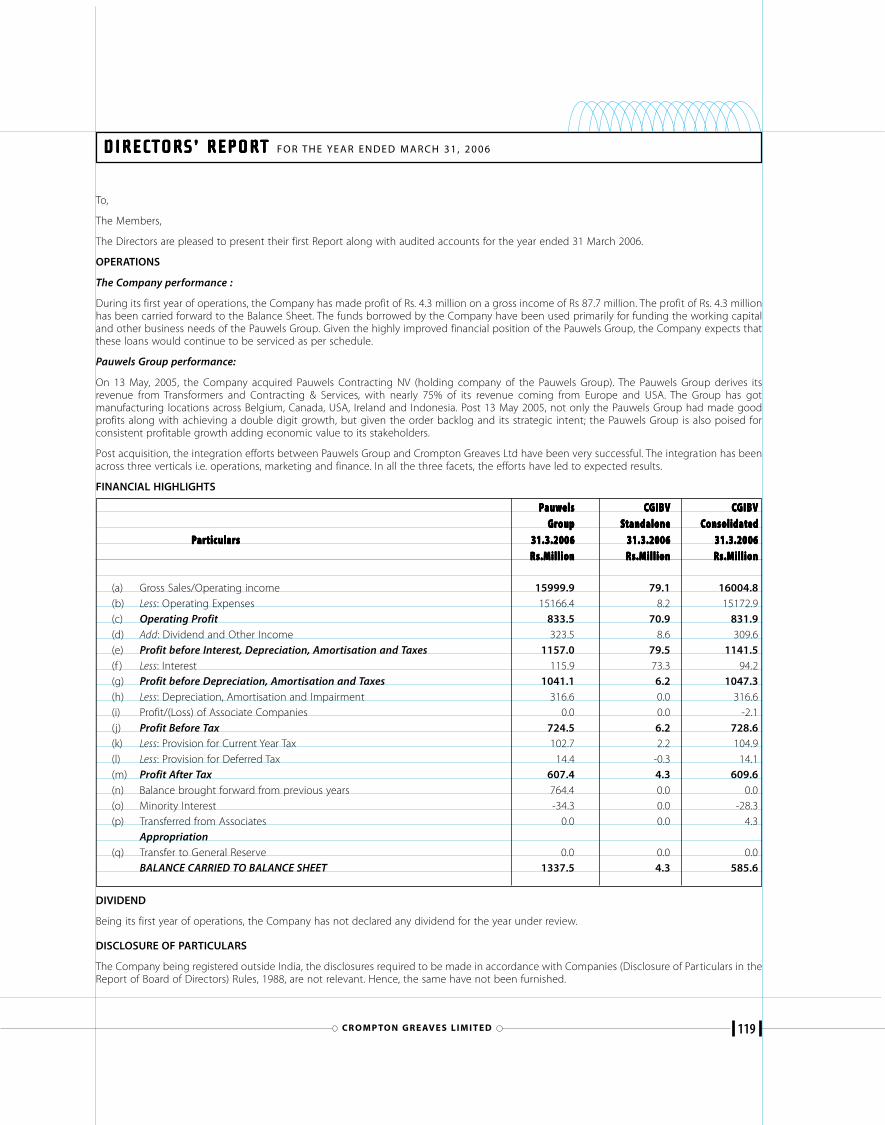
119CR O M P TO N G R E AV E S L I M I T E D
To,
The Members,
The Directors are pleased to present their first Report along with audited accounts for the year ended 31 March 2006.
OPERATIONS
The Company performance :
During its first year of operations, the Company has made profit of Rs. 4.3 million on a gross income of Rs 87.7 million. The profit of Rs. 4.3 millionhas been carried forward to the Balance Sheet. The funds borrowed by the Company have been used primarily for funding the working capitaland other business needs of the Pauwels Group. Given the highly improved financial position of the Pauwels Group, the Company expects thatthese loans would continue to be serviced as per schedule.
Pauwels Group performance:
On 13 May, 2005, the Company acquired Pauwels Contracting NV (holding company of the Pauwels Group). The Pauwels Group derives itsrevenue from Transformers and Contracting & Services, with nearly 75% of its revenue coming from Europe and USA. The Group has gotmanufacturing locations across Belgium, Canada, USA, Ireland and Indonesia. Post 13 May 2005, not only the Pauwels Group had made goodprofits along with achieving a double digit growth, but given the order backlog and its strategic intent; the Pauwels Group is also poised forconsistent profitable growth adding economic value to its stakeholders.
Post acquisition, the integration efforts between Pauwels Group and Crompton Greaves Ltd have been very successful. The integration has beenacross three verticals i.e. operations, marketing and finance. In all the three facets, the efforts have led to expected results.
FINANCIAL HIGHLIGHTS
PPPPPauwauwauwauwauwelselselselsels CCCCCGIBGIBGIBGIBGIBVVVVV CCCCCGIBGIBGIBGIBGIBVVVVVGGGGGrrrrroupoupoupoupoup SSSSStandalonetandalonetandalonetandalonetandalone C C C C Consolidaonsolidaonsolidaonsolidaonsolidatttttededededed
PPPPPararararar ticularsticularsticularsticularsticulars 31.3.200631.3.200631.3.200631.3.200631.3.2006 31.3.200631.3.200631.3.200631.3.200631.3.2006 31.3.200631.3.200631.3.200631.3.200631.3.2006RsRsRsRsRs.M.M.M.M.Millionillionillionillionillion RsRsRsRsRs.M.M.M.M.Millionillionillionillionillion RsRsRsRsRs.M.M.M.M.Millionillionillionillionillion
(a) Gross Sales/Operating income 15999.9 79.1 16004.8(b) Less: Operating Expenses 15166.4 8.2 15172.9(c) Operating Profit 833.5 70.9 831.9(d) Add: Dividend and Other Income 323.5 8.6 309.6(e) Profit before Interest, Depreciation, Amortisation and Taxes 1157.0 79.5 1141.5(f ) Less: Interest 115.9 73.3 94.2(g) Profit before Depreciation, Amortisation and Taxes 1041.1 6.2 1047.3(h) Less: Depreciation, Amortisation and Impairment 316.6 0.0 316.6(i) Profit/(Loss) of Associate Companies 0.0 0.0 -2.1(j) Profit Before Tax 724.5 6.2 728.6(k) Less: Provision for Current Year Tax 102.7 2.2 104.9(l) Less: Provision for Deferred Tax 14.4 -0.3 14.1(m) Profit After Tax 607.4 4.3 609.6(n) Balance brought forward from previous years 764.4 0.0 0.0(o) Minority Interest -34.3 0.0 -28.3(p) Transferred from Associates 0.0 0.0 4.3
Appropriation(q) Transfer to General Reserve 0.0 0.0 0.0
BALANCE CARRIED TO BALANCE SHEET 1337.5 4.3 585.6
DIVIDEND
Being its first year of operations, the Company has not declared any dividend for the year under review.
DISCLOSURE OF PARTICULARS
The Company being registered outside India, the disclosures required to be made in accordance with Companies (Disclosure of Particulars in theReport of Board of Directors) Rules, 1988, are not relevant. Hence, the same have not been furnished.
DIRECTORS’ REPORTDIRECTORS’ REPORTDIRECTORS’ REPORTDIRECTORS’ REPORTDIRECTORS’ REPORT F O R T H E YE A R E N D E D M A R C H 3 1 , 2 0 0 6
120 A N N UA L R E P O R T 2 0 0 5 - 0 6
PARTICULARS OF EMPLOYEES
Since the Company is registered outside India, the provisions of Section 217(2A) of the Companies Act, 1956, read with the Companies (Particularsof Employees) Rules, 1975 are not relevant.
DIRECTORS’ RESPONSIBILITY STATEMENT
The Directors would like to assure the Members that the financial statements for the year under review conform in their entirety to therequirements of the Companies Act, 1956.
The Directors confirm that:
• the Annual Accounts have been prepared in conformity with the applicable Accounting Standards;
• the Accounting Policies selected and applied on a consistent basis, give a true and fair view of the affairs of the Company and of the profit forthe financial year;
• sufficient care has been taken that adequate accounting records have been maintained for safeguarding the assets of the Company; and forprevention and detection of fraud and other irregularities;
• the Annual Accounts have been prepared on a going concern basis.
ACKNOWLEDGMENTS
The Directors thank all the Members, Financial Institutions, Bankers and other Business Associates for their support and co-operation as partnersin the Company’s progress.
On behalf of the Board of Directors
W Henriques Sanjay Jain RPS Puar JCJ van der Woord
19 May, 2006Amstelveen, Netherlands
DIRECTORS’ REPORTDIRECTORS’ REPORTDIRECTORS’ REPORTDIRECTORS’ REPORTDIRECTORS’ REPORT F O R T H E YE A R E N D E D M A R C H 3 1 , 2 0 0 6 ( c o ntd. )
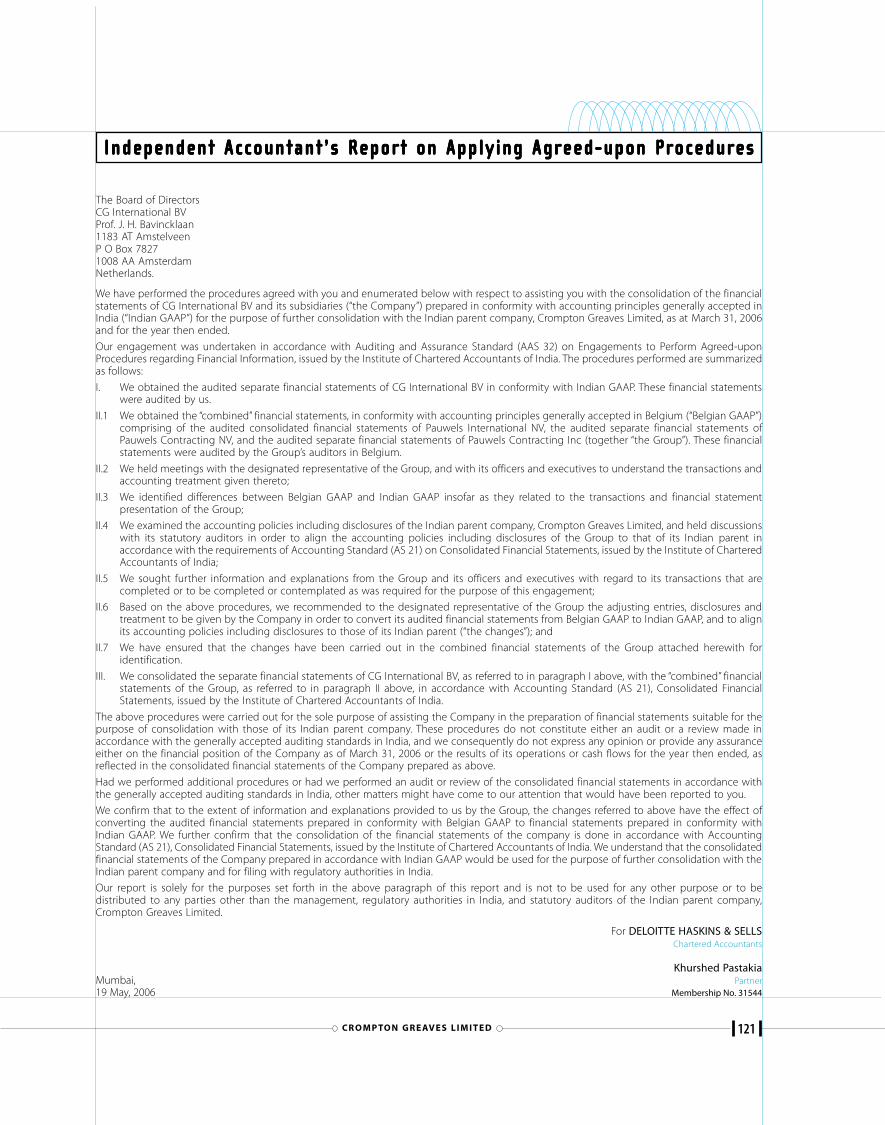
121CR O M P TO N G R E AV E S L I M I T E D
The Board of DirectorsCG International BVProf. J. H. Bavincklaan1183 AT AmstelveenP O Box 78271008 AA AmsterdamNetherlands.
We have performed the procedures agreed with you and enumerated below with respect to assisting you with the consolidation of the financialstatements of CG International BV and its subsidiaries (“the Company”) prepared in conformity with accounting principles generally accepted inIndia (“Indian GAAP”) for the purpose of further consolidation with the Indian parent company, Crompton Greaves Limited, as at March 31, 2006and for the year then ended.
Our engagement was undertaken in accordance with Auditing and Assurance Standard (AAS 32) on Engagements to Perform Agreed-uponProcedures regarding Financial Information, issued by the Institute of Chartered Accountants of India. The procedures performed are summarizedas follows:
I. We obtained the audited separate financial statements of CG International BV in conformity with Indian GAAP. These financial statementswere audited by us.
II.1 We obtained the “combined” financial statements, in conformity with accounting principles generally accepted in Belgium (“Belgian GAAP”)comprising of the audited consolidated financial statements of Pauwels International NV, the audited separate financial statements ofPauwels Contracting NV, and the audited separate financial statements of Pauwels Contracting Inc (together “the Group”). These financialstatements were audited by the Group’s auditors in Belgium.
II.2 We held meetings with the designated representative of the Group, and with its officers and executives to understand the transactions andaccounting treatment given thereto;
II.3 We identified differences between Belgian GAAP and Indian GAAP insofar as they related to the transactions and financial statementpresentation of the Group;
II.4 We examined the accounting policies including disclosures of the Indian parent company, Crompton Greaves Limited, and held discussionswith its statutory auditors in order to align the accounting policies including disclosures of the Group to that of its Indian parent inaccordance with the requirements of Accounting Standard (AS 21) on Consolidated Financial Statements, issued by the Institute of CharteredAccountants of India;
II.5 We sought further information and explanations from the Group and its officers and executives with regard to its transactions that arecompleted or to be completed or contemplated as was required for the purpose of this engagement;
II.6 Based on the above procedures, we recommended to the designated representative of the Group the adjusting entries, disclosures andtreatment to be given by the Company in order to convert its audited financial statements from Belgian GAAP to Indian GAAP, and to alignits accounting policies including disclosures to those of its Indian parent (“the changes”); and
II.7 We have ensured that the changes have been carried out in the combined financial statements of the Group attached herewith foridentification.
III. We consolidated the separate financial statements of CG International BV, as referred to in paragraph I above, with the “combined” financialstatements of the Group, as referred to in paragraph II above, in accordance with Accounting Standard (AS 21), Consolidated FinancialStatements, issued by the Institute of Chartered Accountants of India.
The above procedures were carried out for the sole purpose of assisting the Company in the preparation of financial statements suitable for thepurpose of consolidation with those of its Indian parent company. These procedures do not constitute either an audit or a review made inaccordance with the generally accepted auditing standards in India, and we consequently do not express any opinion or provide any assuranceeither on the financial position of the Company as of March 31, 2006 or the results of its operations or cash flows for the year then ended, asreflected in the consolidated financial statements of the Company prepared as above.
Had we performed additional procedures or had we performed an audit or review of the consolidated financial statements in accordance withthe generally accepted auditing standards in India, other matters might have come to our attention that would have been reported to you.
We confirm that to the extent of information and explanations provided to us by the Group, the changes referred to above have the effect ofconverting the audited financial statements prepared in conformity with Belgian GAAP to financial statements prepared in conformity withIndian GAAP. We further confirm that the consolidation of the financial statements of the company is done in accordance with AccountingStandard (AS 21), Consolidated Financial Statements, issued by the Institute of Chartered Accountants of India. We understand that the consolidatedfinancial statements of the Company prepared in accordance with Indian GAAP would be used for the purpose of further consolidation with theIndian parent company and for filing with regulatory authorities in India.
Our report is solely for the purposes set forth in the above paragraph of this report and is not to be used for any other purpose or to bedistributed to any parties other than the management, regulatory authorities in India, and statutory auditors of the Indian parent company,Crompton Greaves Limited.
For DELOITTE HASKINS & SELLSChartered Accountants
Khurshed PastakiaMumbai, Partner19 May, 2006 Membership No. 31544
Independent Accountant ’s Report on App ly ing Agreed-upon ProceduresIndependent Accountant ’s Report on App ly ing Agreed-upon ProceduresIndependent Accountant ’s Report on App ly ing Agreed-upon ProceduresIndependent Accountant ’s Report on App ly ing Agreed-upon ProceduresIndependent Accountant ’s Report on App ly ing Agreed-upon Procedures
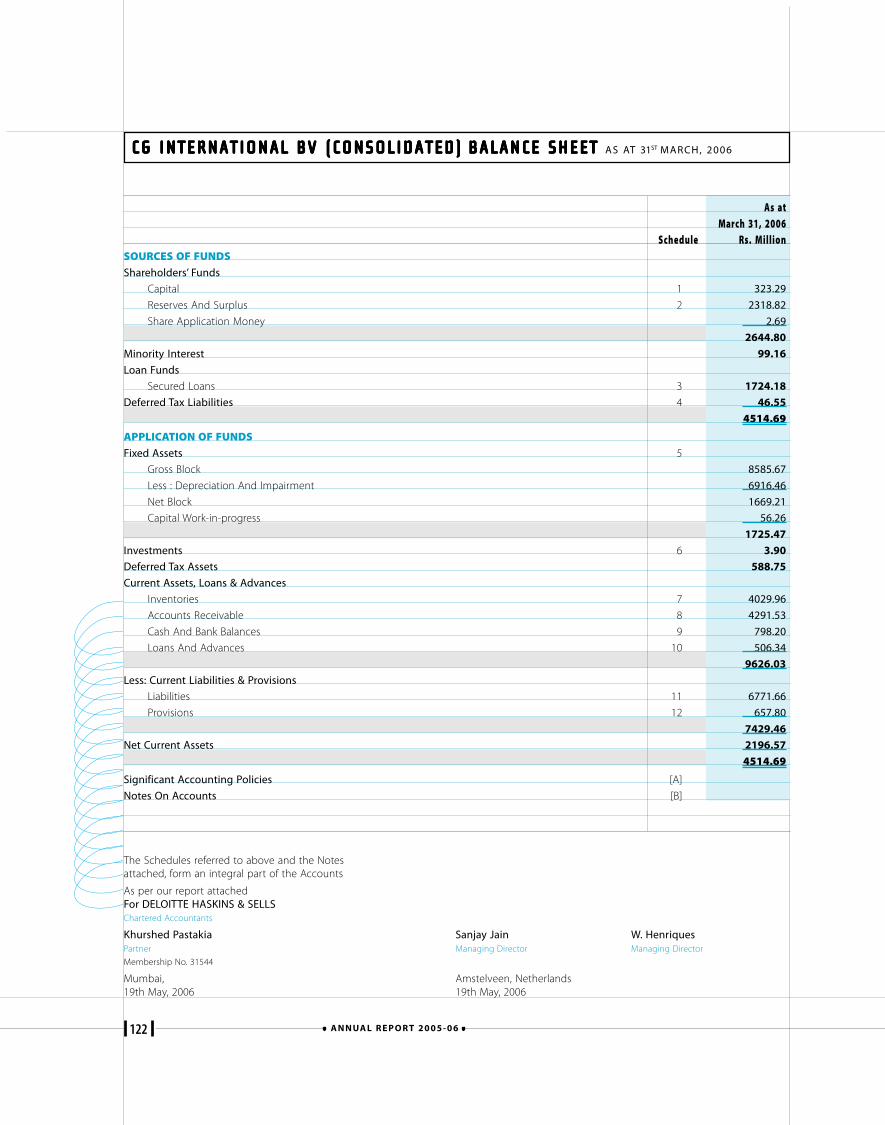
122 A N N UA L R E P O R T 2 0 0 5 - 0 6
CG INTERNATIONAL BV (CONSOLIDATED)CG INTERNATIONAL BV (CONSOLIDATED)CG INTERNATIONAL BV (CONSOLIDATED)CG INTERNATIONAL BV (CONSOLIDATED)CG INTERNATIONAL BV (CONSOLIDATED) BALANCE SHEETBALANCE SHEETBALANCE SHEETBALANCE SHEETBALANCE SHEET AS AT 31ST MARCH, 2006
As atMarch 31, 2006
Schedule Rs. MillionSOURCES OF FUNDSShareholders’ Funds
Capital 1 323.29
Reserves And Surplus 2 2318.82
Share Application Money 2.69
2644.80
Minority Interest 99.16
Loan Funds
Secured Loans 3 1724.18
Deferred Tax Liabilities 4 46.55
4514.69
APPLICATION OF FUNDSFixed Assets 5
Gross Block 8585.67
Less : Depreciation And Impairment 6916.46
Net Block 1669.21
Capital Work-in-progress 56.26
1725.47
Investments 6 3.90Deferred Tax Assets 588.75
Current Assets, Loans & Advances
Inventories 7 4029.96
Accounts Receivable 8 4291.53
Cash And Bank Balances 9 798.20
Loans And Advances 10 506.34
9626.03
Less: Current Liabilities & Provisions
Liabilities 11 6771.66
Provisions 12 657.80
7429.46Net Current Assets 2196.57
4514.69
Significant Accounting Policies [A]
Notes On Accounts [B]
Sanjay Jain W. HenriquesManaging Director Managing Director
Amstelveen, Netherlands19th May, 2006
The Schedules referred to above and the Notesattached, form an integral part of the Accounts
As per our report attachedFor DELOITTE HASKINS & SELLSChartered Accountants
Khurshed PastakiaPartner
Membership No. 31544
Mumbai,19th May, 2006
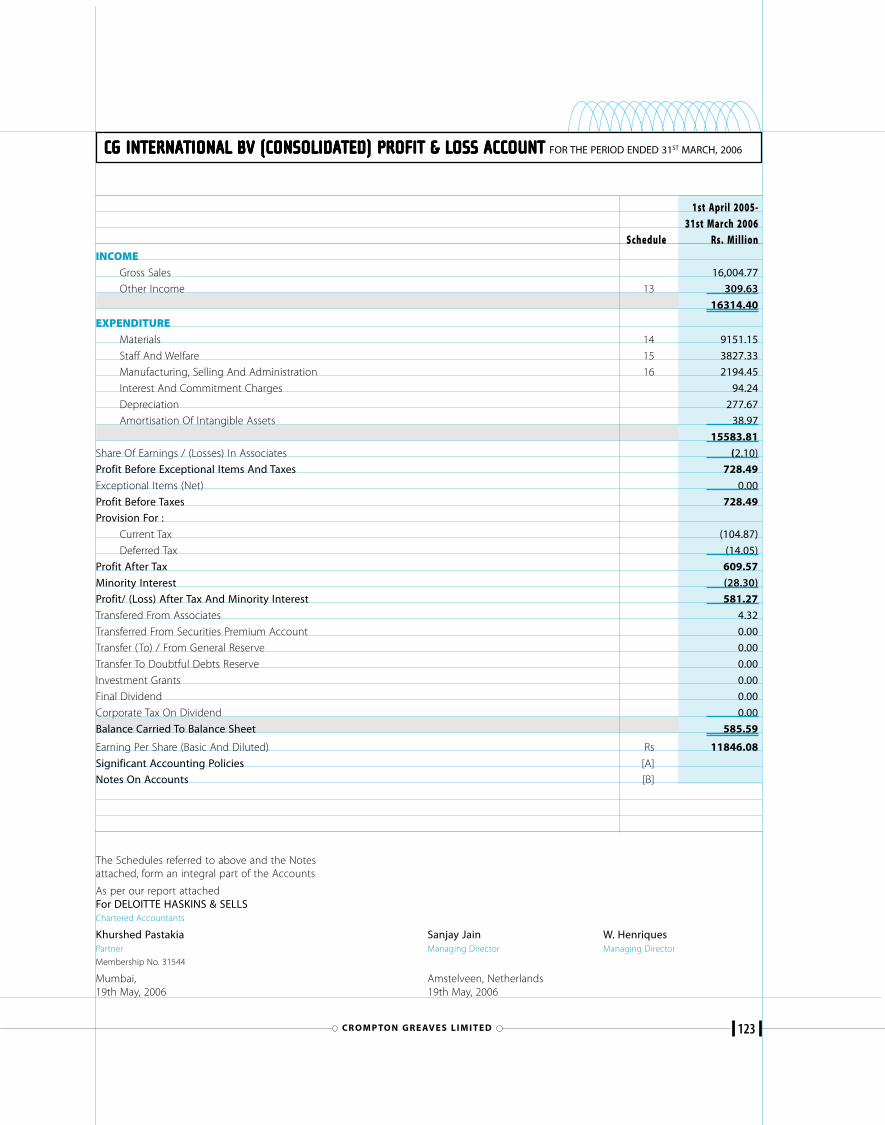
123CR O M P TO N G R E AV E S L I M I T E D
CG INTERNATIONAL BV (CONSOLIDATED)CG INTERNATIONAL BV (CONSOLIDATED)CG INTERNATIONAL BV (CONSOLIDATED)CG INTERNATIONAL BV (CONSOLIDATED)CG INTERNATIONAL BV (CONSOLIDATED) PROFIT & LOSS ACCOUNT PROFIT & LOSS ACCOUNT PROFIT & LOSS ACCOUNT PROFIT & LOSS ACCOUNT PROFIT & LOSS ACCOUNT FOR THE PERIOD ENDED 31ST MARCH, 2006
1st April 2005-31st March 2006
Schedule Rs. MillionINCOME
Gross Sales 16,004.77
Other Income 13 309.63
16314.40
EXPENDITUREMaterials 14 9151.15
Staff And Welfare 15 3827.33
Manufacturing, Selling And Administration 16 2194.45
Interest And Commitment Charges 94.24
Depreciation 277.67
Amortisation Of Intangible Assets 38.97
15583.81
Share Of Earnings / (Losses) In Associates (2.10)
Profit Before Exceptional Items And Taxes 728.49
Exceptional Items (Net) 0.00
Profit Before Taxes 728.49Provision For :
Current Tax (104.87)
Deferred Tax (14.05)
Profit After Tax 609.57
Minority Interest (28.30)
Profit/ (Loss) After Tax And Minority Interest 581.27
Transfered From Associates 4.32
Transferred From Securities Premium Account 0.00
Transfer (To) / From General Reserve 0.00
Transfer To Doubtful Debts Reserve 0.00
Investment Grants 0.00
Final Dividend 0.00
Corporate Tax On Dividend 0.00
Balance Carried To Balance Sheet 585.59
Earning Per Share (Basic And Diluted) Rs 11846.08
Significant Accounting Policies [A]
Notes On Accounts [B]
Sanjay Jain W. HenriquesManaging Director Managing Director
Amstelveen, Netherlands19th May, 2006
The Schedules referred to above and the Notesattached, form an integral part of the Accounts
As per our report attachedFor DELOITTE HASKINS & SELLSChartered Accountants
Khurshed PastakiaPartner
Membership No. 31544
Mumbai,19th May, 2006
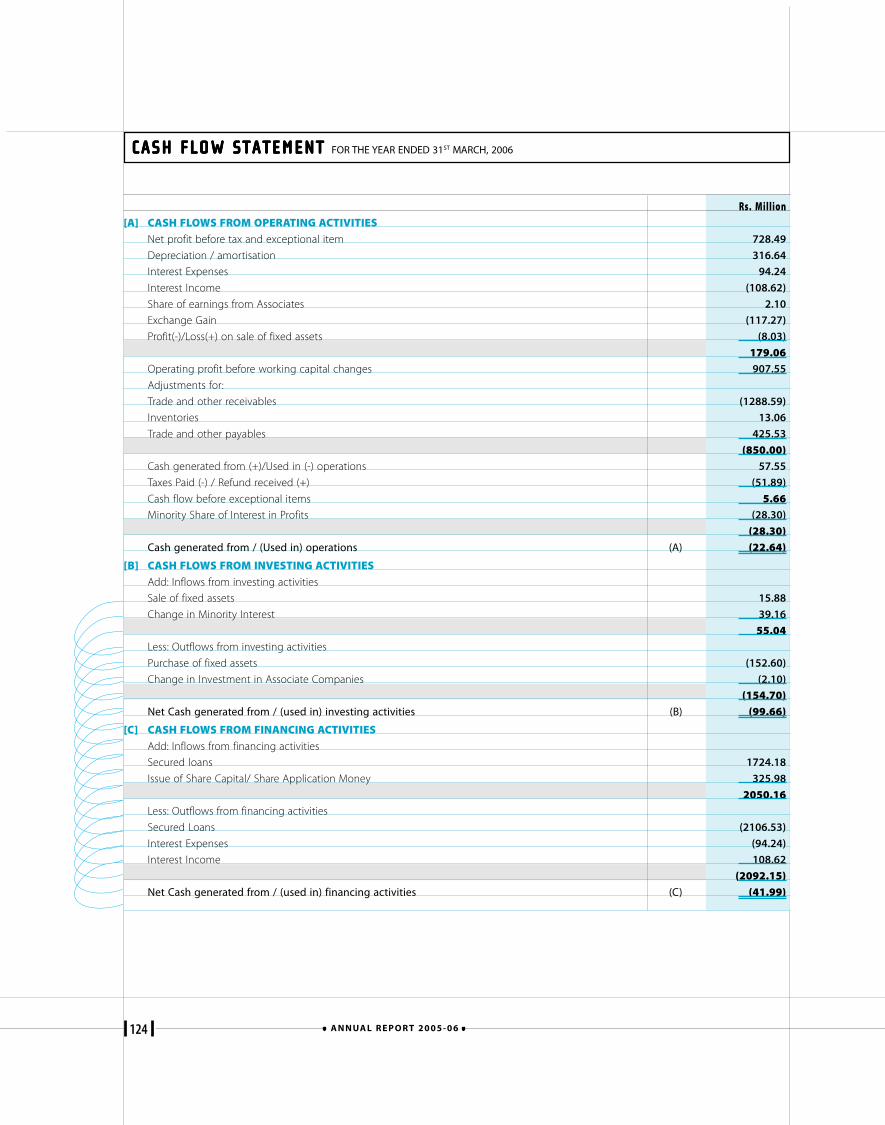
124 A N N UA L R E P O R T 2 0 0 5 - 0 6
CASH FLOW STATEMENTCASH FLOW STATEMENTCASH FLOW STATEMENTCASH FLOW STATEMENTCASH FLOW STATEMENT FOR THE YEAR ENDED 31ST MARCH, 2006
Rs. Million[A] CASH FLOWS FROM OPERATING ACTIVITIES
Net profit before tax and exceptional item 728.49
Depreciation / amortisation 316.64
Interest Expenses 94.24
Interest Income (108.62)
Share of earnings from Associates 2.10
Exchange Gain (117.27)
Profit(-)/Loss(+) on sale of fixed assets (8.03)
179.06Operating profit before working capital changes 907.55
Adjustments for:
Trade and other receivables (1288.59)
Inventories 13.06
Trade and other payables 425.53
(850.00)Cash generated from (+)/Used in (-) operations 57.55
Taxes Paid (-) / Refund received (+) (51.89)
Cash flow before exceptional items 5.66Minority Share of Interest in Profits (28.30)
(28.30)Cash generated from / (Used in) operations (A) (22.64)
[B] CASH FLOWS FROM INVESTING ACTIVITIESAdd: Inflows from investing activities
Sale of fixed assets 15.88
Change in Minority Interest 39.16
55.04Less: Outflows from investing activities
Purchase of fixed assets (152.60)
Change in Investment in Associate Companies (2.10)
(154.70)Net Cash generated from / (used in) investing activities (B) (99.66)
[C] CASH FLOWS FROM FINANCING ACTIVITIESAdd: Inflows from financing activities
Secured loans 1724.18
Issue of Share Capital/ Share Application Money 325.98
2050.16Less: Outflows from financing activities
Secured Loans (2106.53)
Interest Expenses (94.24)
Interest Income 108.62
(2092.15)Net Cash generated from / (used in) financing activities (C) (41.99)
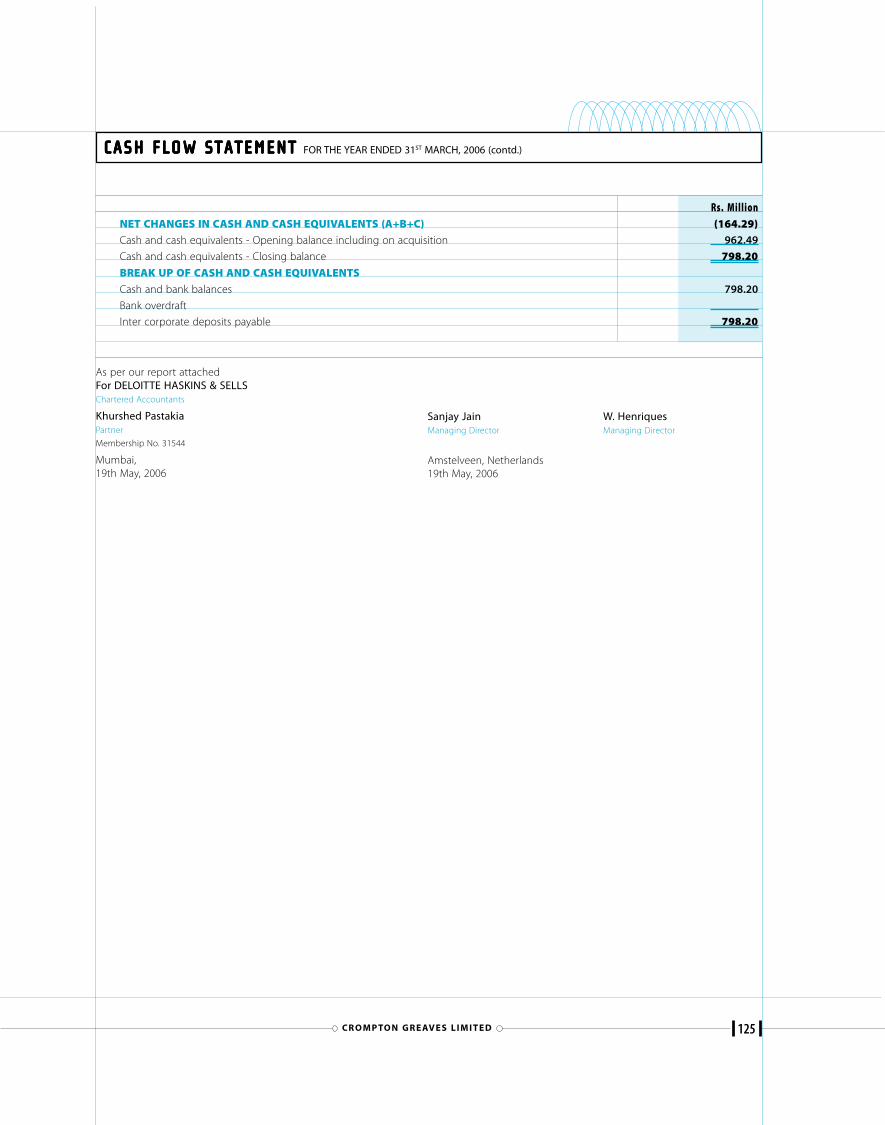
125CR O M P TO N G R E AV E S L I M I T E D
CASH FLOW STATEMENTCASH FLOW STATEMENTCASH FLOW STATEMENTCASH FLOW STATEMENTCASH FLOW STATEMENT FOR THE YEAR ENDED 31ST MARCH, 2006 (contd.)
Rs. MillionNET CHANGES IN CASH AND CASH EQUIVALENTS (A+B+C) (164.29)Cash and cash equivalents - Opening balance including on acquisition 962.49
Cash and cash equivalents - Closing balance 798.20
BREAK UP OF CASH AND CASH EQUIVALENTSCash and bank balances 798.20
Bank overdraft
Inter corporate deposits payable 798.20
Sanjay Jain W. HenriquesManaging Director Managing Director
Amstelveen, Netherlands19th May, 2006
As per our report attachedFor DELOITTE HASKINS & SELLSChartered Accountants
Khurshed PastakiaPartner
Membership No. 31544
Mumbai,19th May, 2006
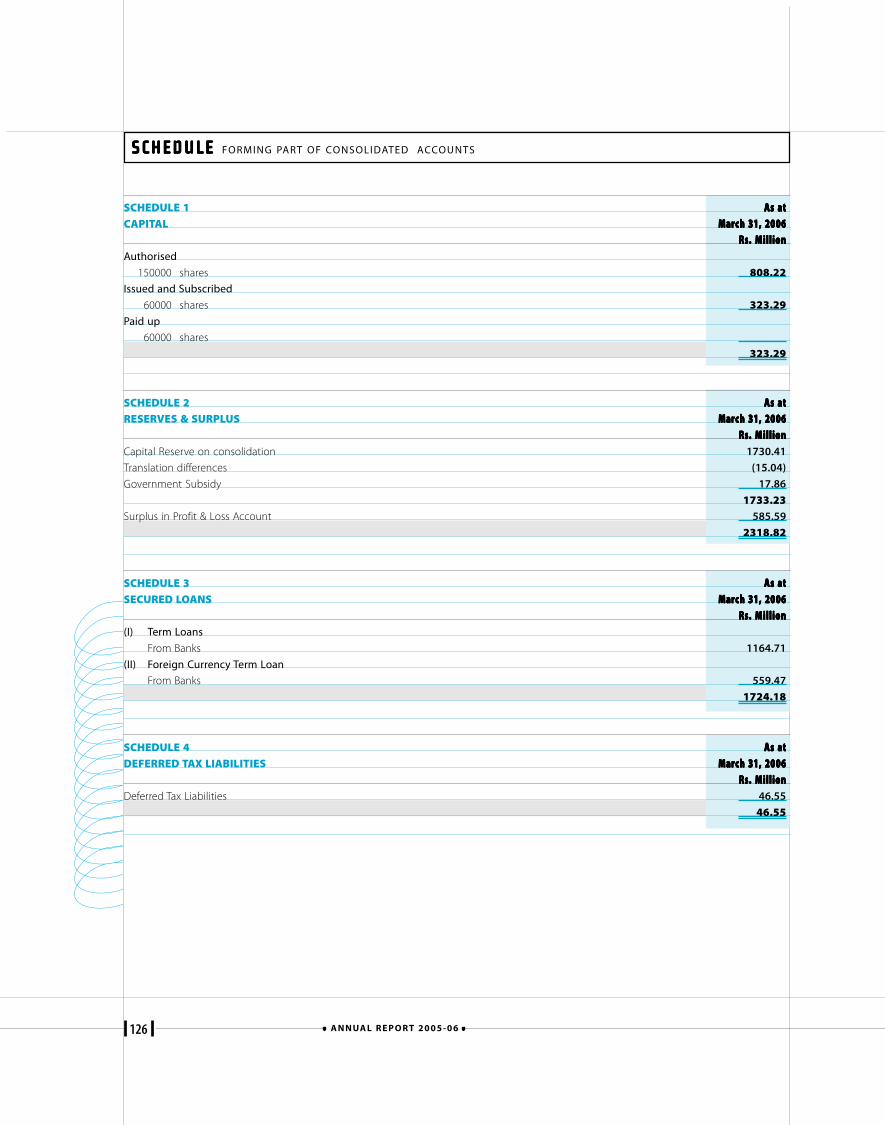
126 A N N UA L R E P O R T 2 0 0 5 - 0 6
SCHEDULE 1 As aAs aAs aAs aAs atttttCAPITAL MarMarMarMarMarch 31, 2006ch 31, 2006ch 31, 2006ch 31, 2006ch 31, 2006
RsRsRsRsRs. M. M. M. M. MillionillionillionillionillionAuthorised
150000 shares 808.22Issued and Subscribed
60000 shares 323.29Paid up
60000 shares
323.29
SCHEDULE 2 As aAs aAs aAs aAs atttttRESERVES & SURPLUS MarMarMarMarMarch 31, 2006ch 31, 2006ch 31, 2006ch 31, 2006ch 31, 2006
RsRsRsRsRs. M. M. M. M. MillionillionillionillionillionCapital Reserve on consolidation 1730.41
Translation differences (15.04)
Government Subsidy 17.86
1733.23Surplus in Profit & Loss Account 585.59
2318.82
SCHEDULE 3 As aAs aAs aAs aAs atttttSECURED LOANS MarMarMarMarMarch 31, 2006ch 31, 2006ch 31, 2006ch 31, 2006ch 31, 2006
RsRsRsRsRs. M. M. M. M. Millionillionillionillionillion(I) Term Loans
From Banks 1164.71
(II) Foreign Currency Term Loan
From Banks 559.47
1724.18
SCHEDULE 4 As aAs aAs aAs aAs atttttDEFERRED TAX LIABILITIES MarMarMarMarMarch 31, 2006ch 31, 2006ch 31, 2006ch 31, 2006ch 31, 2006
RsRsRsRsRs. M. M. M. M. MillionillionillionillionillionDeferred Tax Liabilities 46.55
46.55
SCHEDULE SCHEDULE SCHEDULE SCHEDULE SCHEDULE FORMING PART OF CONSOLIDATED ACCOUNTS
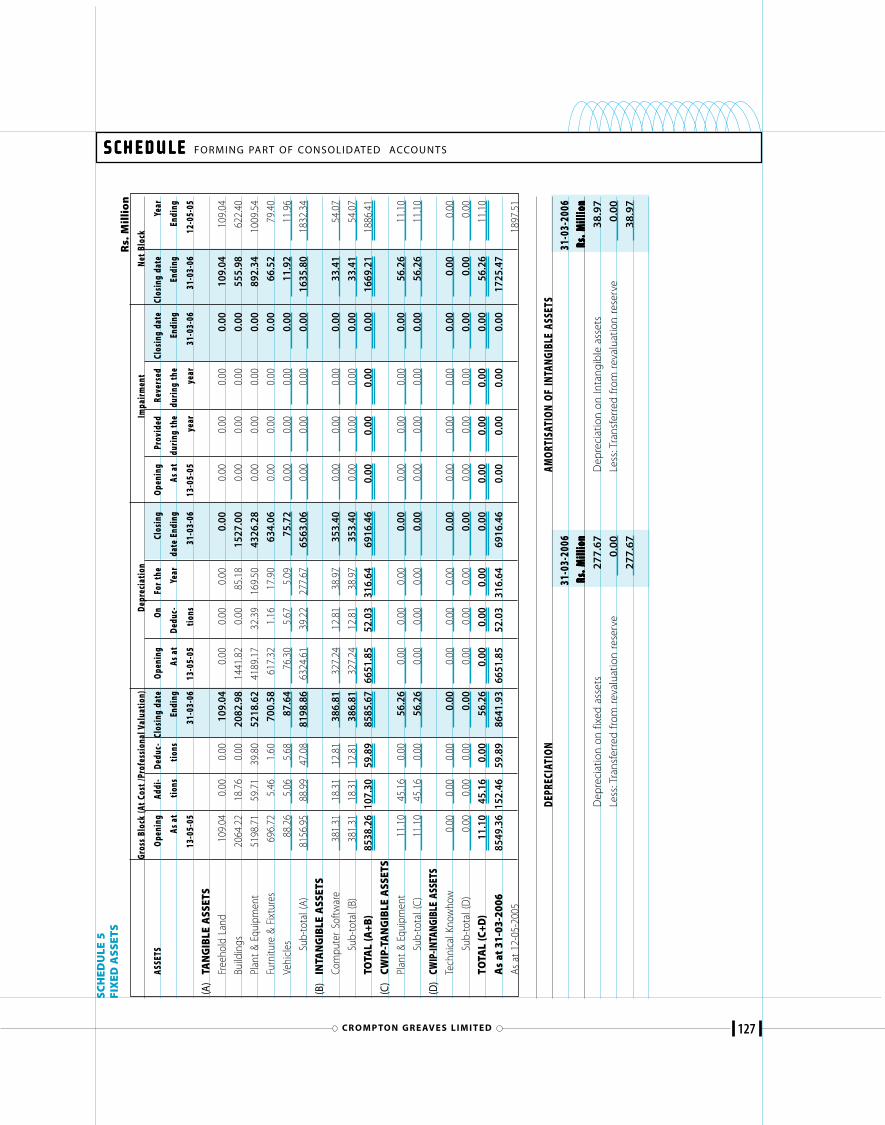
127CR O M P TO N G R E AV E S L I M I T E D
SCHEDULE SCHEDULE SCHEDULE SCHEDULE SCHEDULE FORMING PART OF CONSOLIDATED ACCOUNTS
SCH
EDU
LE 5
FIX
ED A
SSET
SR
s. M
illi
on
Gros
s Bl
ock
(At C
ost /
Prof
essi
onal
Val
uati
on)
Depr
ecia
tion
Impa
irm
ent
Net
Bloc
k
ASSE
TSO
peni
ngAd
di-
Dedu
c-Cl
osin
g da
teO
peni
ngOn
For
the
Clos
ing
Open
ing
Prov
ided
Reve
rsed
Clos
ing
date
Clos
ing
date
Year
As a
tti
ons
tion
sEn
ding
As a
tDe
duc-
Year
date
End
ing
As a
tdu
ring
the
duri
ng th
eEn
ding
Endi
ngEn
ding
13-0
5-05
31-0
3-06
13-0
5-05
tion
s31
-03-
0613
-05-
05ye
arye
ar31
-03-
0631
-03-
0612
-05-
05
(A)
TAN
GIB
LE A
SSET
SFr
eeho
ld L
and
109.
040.
000.
0010
9.04
0.00
0.00
0.00
0.00
0.00
0.00
0.00
0.00
109.
0410
9.04
Build
ings
2064
.22
18.7
60.
0020
82.9
814
41.8
20.
0085
.18
1527
.00
0.00
0.00
0.00
0.00
555.
9862
2.40
Plan
t &
Equi
pmen
t51
98.7
159
.71
39.8
052
18.6
241
89.1
732
.39
169.
5043
26.2
80.
000.
000.
000.
0089
2.34
1009
.54
Furn
iture
& F
ixtu
res
696.
725.
461.
6070
0.58
617.
321.
1617
.90
634.
060.
000.
000.
000.
0066
.52
79.4
0
Vehi
cles
88.2
65.
065.
6887
.64
76.3
05.
675.
0975
.72
0.00
0.00
0.00
0.00
11.9
211
.96
Sub-
tota
l (A)
8156
.95
88.9
947
.08
8198
.86
6324
.61
39.2
227
7.67
6563
.06
0.00
0.00
0.00
0.00
1635
.80
1832
.34
(B)
INTA
NG
IBLE
ASS
ETS
Com
pute
r So
ftwar
e38
1.31
18.3
112
.81
386.
8132
7.24
12.8
138
.97
353.
400.
000.
000.
000.
0033
.41
54.0
7
Sub-
tota
l (B)
381.
3118
.31
12.8
138
6.81
327.
2412
.81
38.9
735
3.40
0.00
0.00
0.00
0.00
33.4
154
.07
TOTA
L (A
+B)
8538
.26
107.
3059
.89
8585
.67
6651
.85
52.0
331
6.64
6916
.46
0.00
0.00
0.00
0.00
1669
.21
1886
.41
(C)
CWIP
-TA
NG
IBLE
ASS
ETS
Plan
t &
Equi
pmen
t11
.10
45.1
60.
0056
.26
0.00
0.00
0.00
0.00
0.00
0.00
0.00
0.00
56.2
611
.10
Sub-
tota
l (C)
11.1
045
.16
0.00
56.2
60.
000.
000.
000.
000.
000.
000.
000.
0056
.26
11.1
0
(D)
CWIP
-INTA
NGIB
LEAS
SETS
Tech
nica
l Kno
who
w0.
000.
000.
000.
000.
000.
000.
000.
000.
000.
000.
000.
000.
000.
00
Sub-
tota
l (D
)0.
000.
000.
000.
000.
000.
000.
000.
000.
000.
000.
000.
000.
000.
00
TOTA
L (C
+D)
11.1
045
.16
0.00
56.2
60.
000.
000.
000.
000.
000.
000.
000.
0056
.26
11.1
0
As
at 3
1-03
-200
685
49.3
615
2.46
59.8
986
41.9
366
51.8
552
.03
316.
6469
16.4
60.
000.
000.
000.
0017
25.4
7
As a
t 12-
05-2
005
1897
.51
DEPR
ECIA
TION
AMOR
TISA
TION
OF
INTA
NGIB
LE A
SSET
S31
-03-
2006
31-0
3-20
06RsRsRsRs Rs
. M. M. M. M . Mill
ion
illio
nill
ion
illio
nill
ion
RsRsRsRs Rs. M. M. M. M . M
illio
nill
ion
illio
nill
ion
illio
nD
epre
ciat
ion
on fi
xed
asse
ts27
7.67
Dep
reci
atio
n on
Inta
ngib
le a
sset
s38
.97
Less
: Tra
nsfe
rred
from
rev
alua
tion
rese
rve
0.00
Less
: Tra
nsfe
rred
from
rev
alua
tion
rese
rve
0.00
277.
6738
.97
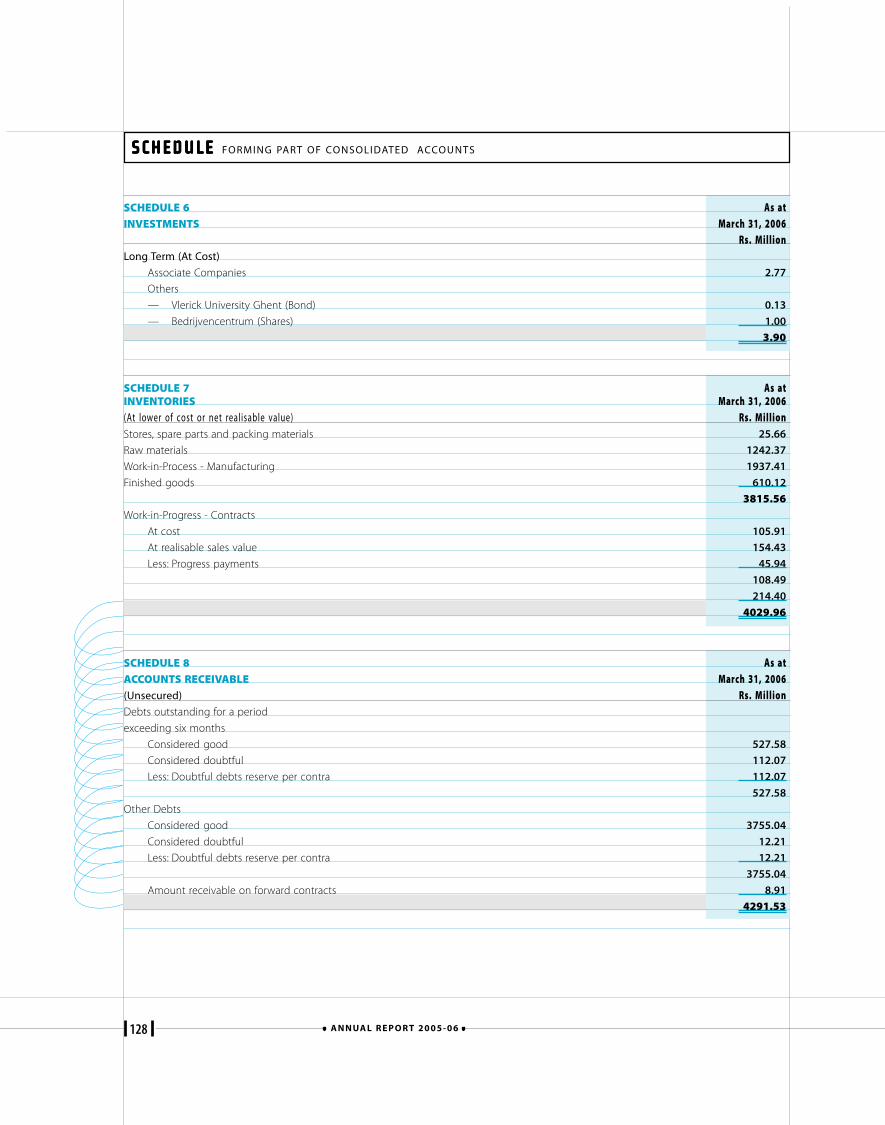
128 A N N UA L R E P O R T 2 0 0 5 - 0 6
SCHEDULE 6 As atINVESTMENTS March 31, 2006
Rs. MillionLong Term (At Cost)
Associate Companies 2.77
Others
— Vlerick University Ghent (Bond) 0.13
— Bedrijvencentrum (Shares) 1.00
3.90
SCHEDULE 7 As atINVENTORIES March 31, 2006(At lower of cost or net realisable value) Rs. MillionStores, spare parts and packing materials 25.66
Raw materials 1242.37
Work-in-Process - Manufacturing 1937.41
Finished goods 610.12
3815.56Work-in-Progress - Contracts
At cost 105.91
At realisable sales value 154.43
Less: Progress payments 45.94
108.49
214.40
4029.96
SCHEDULE 8 As atACCOUNTS RECEIVABLE March 31, 2006(Unsecured) Rs. MillionDebts outstanding for a period
exceeding six months
Considered good 527.58
Considered doubtful 112.07
Less: Doubtful debts reserve per contra 112.07
527.58
Other Debts
Considered good 3755.04
Considered doubtful 12.21
Less: Doubtful debts reserve per contra 12.21
3755.04
Amount receivable on forward contracts 8.91
4291.53
SCHEDULE SCHEDULE SCHEDULE SCHEDULE SCHEDULE FORMING PART OF CONSOLIDATED ACCOUNTS
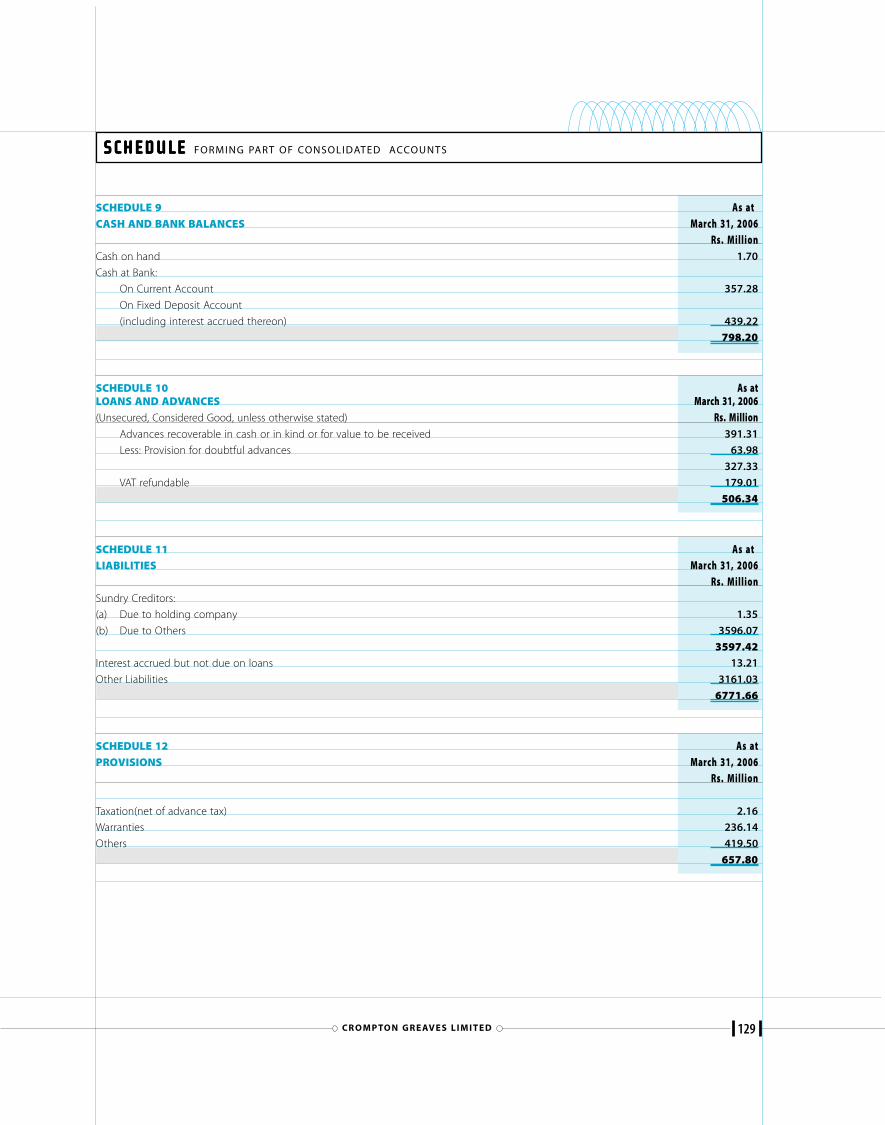
129CR O M P TO N G R E AV E S L I M I T E D
SCHEDULE 9 As atCASH AND BANK BALANCES March 31, 2006
Rs. MillionCash on hand 1.70
Cash at Bank:
On Current Account 357.28
On Fixed Deposit Account
(including interest accrued thereon) 439.22
798.20
SCHEDULE 10 As atLOANS AND ADVANCES March 31, 2006(Unsecured, Considered Good, unless otherwise stated) Rs. Million
Advances recoverable in cash or in kind or for value to be received 391.31
Less: Provision for doubtful advances 63.98
327.33
VAT refundable 179.01
506.34
SCHEDULE 11 As atLIABILITIES March 31, 2006
Rs. MillionSundry Creditors:
(a) Due to holding company 1.35
(b) Due to Others 3596.07
3597.42Interest accrued but not due on loans 13.21
Other Liabilities 3161.03
6771.66
SCHEDULE 12 As atPROVISIONS March 31, 2006
Rs. Million
Taxation(net of advance tax) 2.16
Warranties 236.14
Others 419.50
657.80
SCHEDULE SCHEDULE SCHEDULE SCHEDULE SCHEDULE FORMING PART OF CONSOLIDATED ACCOUNTS
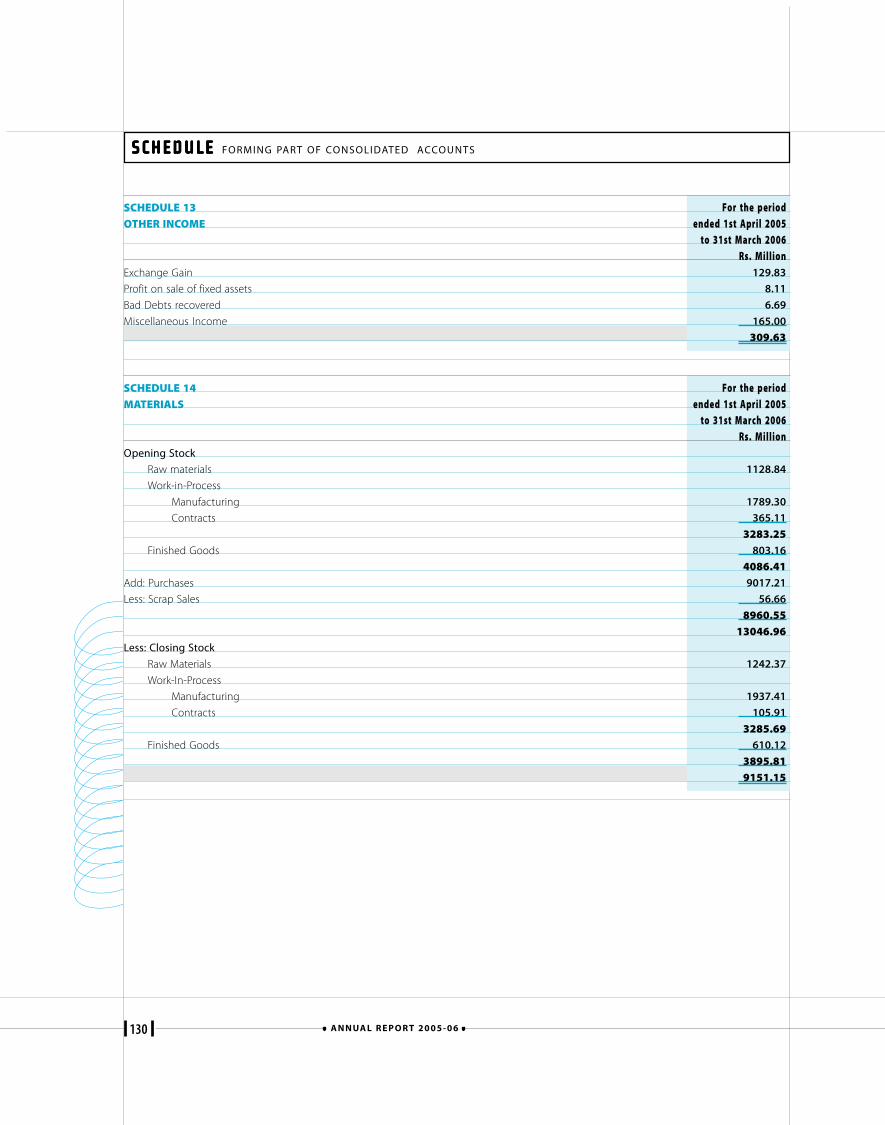
130 A N N UA L R E P O R T 2 0 0 5 - 0 6
SCHEDULE 13 For the periodOTHER INCOME ended 1st April 2005
to 31st March 2006Rs. Million
Exchange Gain 129.83
Profit on sale of fixed assets 8.11
Bad Debts recovered 6.69
Miscellaneous Income 165.00
309.63
SCHEDULE 14 For the periodMATERIALS ended 1st April 2005
to 31st March 2006Rs. Million
Opening Stock
Raw materials 1128.84
Work-in-Process
Manufacturing 1789.30
Contracts 365.11
3283.25Finished Goods 803.16
4086.41Add: Purchases 9017.21
Less: Scrap Sales 56.66
8960.5513046.96
Less: Closing Stock
Raw Materials 1242.37
Work-In-Process
Manufacturing 1937.41
Contracts 105.91
3285.69Finished Goods 610.12
3895.819151.15
SCHEDULE SCHEDULE SCHEDULE SCHEDULE SCHEDULE FORMING PART OF CONSOLIDATED ACCOUNTS
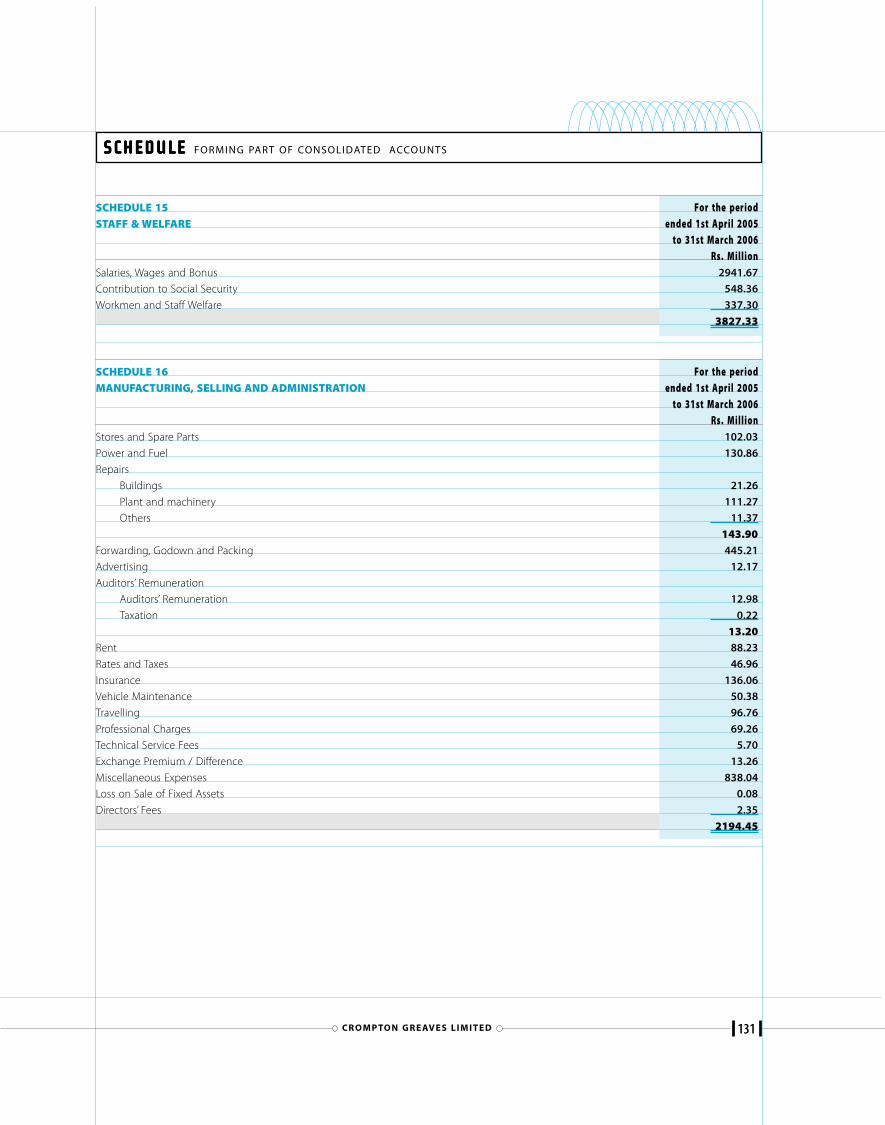
131CR O M P TO N G R E AV E S L I M I T E D
SCHEDULE 15 For the periodSTAFF & WELFARE ended 1st April 2005
to 31st March 2006Rs. Million
Salaries, Wages and Bonus 2941.67
Contribution to Social Security 548.36
Workmen and Staff Welfare 337.30
3827.33
SCHEDULE 16 For the periodMANUFACTURING, SELLING AND ADMINISTRATION ended 1st April 2005
to 31st March 2006Rs. Million
Stores and Spare Parts 102.03
Power and Fuel 130.86
Repairs
Buildings 21.26
Plant and machinery 111.27
Others 11.37
143.90Forwarding, Godown and Packing 445.21
Advertising 12.17
Auditors’ Remuneration
Auditors’ Remuneration 12.98
Taxation 0.22
13.20Rent 88.23
Rates and Taxes 46.96
Insurance 136.06
Vehicle Maintenance 50.38
Travelling 96.76
Professional Charges 69.26
Technical Service Fees 5.70
Exchange Premium / Difference 13.26
Miscellaneous Expenses 838.04
Loss on Sale of Fixed Assets 0.08
Directors’ Fees 2.35
2194.45
SCHEDULE SCHEDULE SCHEDULE SCHEDULE SCHEDULE FORMING PART OF CONSOLIDATED ACCOUNTS
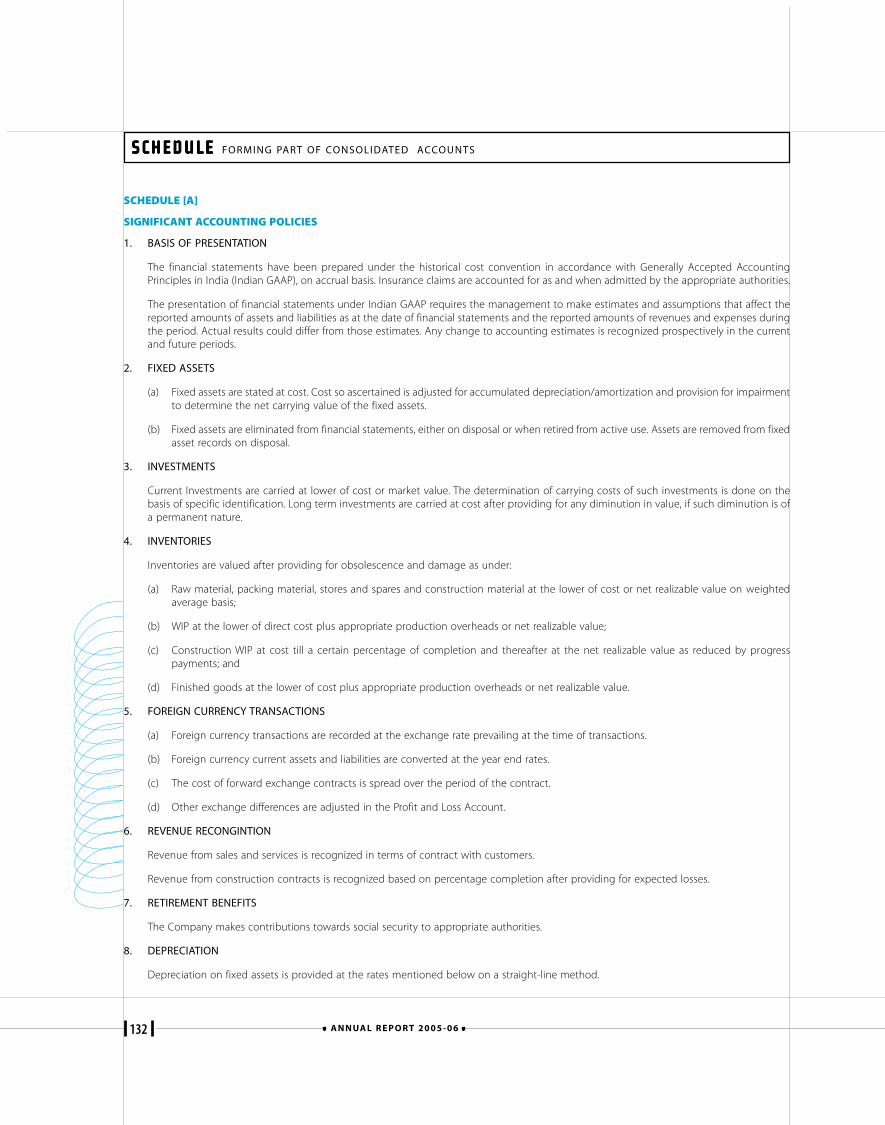
132 A N N UA L R E P O R T 2 0 0 5 - 0 6
SCHEDULE [A]
SIGNIFICANT ACCOUNTING POLICIES
1. BASIS OF PRESENTATION
The financial statements have been prepared under the historical cost convention in accordance with Generally Accepted AccountingPrinciples in India (Indian GAAP), on accrual basis. Insurance claims are accounted for as and when admitted by the appropriate authorities.
The presentation of financial statements under Indian GAAP requires the management to make estimates and assumptions that affect thereported amounts of assets and liabilities as at the date of financial statements and the reported amounts of revenues and expenses duringthe period. Actual results could differ from those estimates. Any change to accounting estimates is recognized prospectively in the currentand future periods.
2. FIXED ASSETS
(a) Fixed assets are stated at cost. Cost so ascertained is adjusted for accumulated depreciation/amortization and provision for impairmentto determine the net carrying value of the fixed assets.
(b) Fixed assets are eliminated from financial statements, either on disposal or when retired from active use. Assets are removed from fixedasset records on disposal.
3. INVESTMENTS
Current Investments are carried at lower of cost or market value. The determination of carrying costs of such investments is done on thebasis of specific identification. Long term investments are carried at cost after providing for any diminution in value, if such diminution is ofa permanent nature.
4. INVENTORIES
Inventories are valued after providing for obsolescence and damage as under:
(a) Raw material, packing material, stores and spares and construction material at the lower of cost or net realizable value on weightedaverage basis;
(b) WIP at the lower of direct cost plus appropriate production overheads or net realizable value;
(c) Construction WIP at cost till a certain percentage of completion and thereafter at the net realizable value as reduced by progresspayments; and
(d) Finished goods at the lower of cost plus appropriate production overheads or net realizable value.
5. FOREIGN CURRENCY TRANSACTIONS
(a) Foreign currency transactions are recorded at the exchange rate prevailing at the time of transactions.
(b) Foreign currency current assets and liabilities are converted at the year end rates.
(c) The cost of forward exchange contracts is spread over the period of the contract.
(d) Other exchange differences are adjusted in the Profit and Loss Account.
6. REVENUE RECONGINTION
Revenue from sales and services is recognized in terms of contract with customers.
Revenue from construction contracts is recognized based on percentage completion after providing for expected losses.
7. RETIREMENT BENEFITS
The Company makes contributions towards social security to appropriate authorities.
8. DEPRECIATION
Depreciation on fixed assets is provided at the rates mentioned below on a straight-line method.
SCHEDULE SCHEDULE SCHEDULE SCHEDULE SCHEDULE FORMING PART OF CONSOLIDATED ACCOUNTS
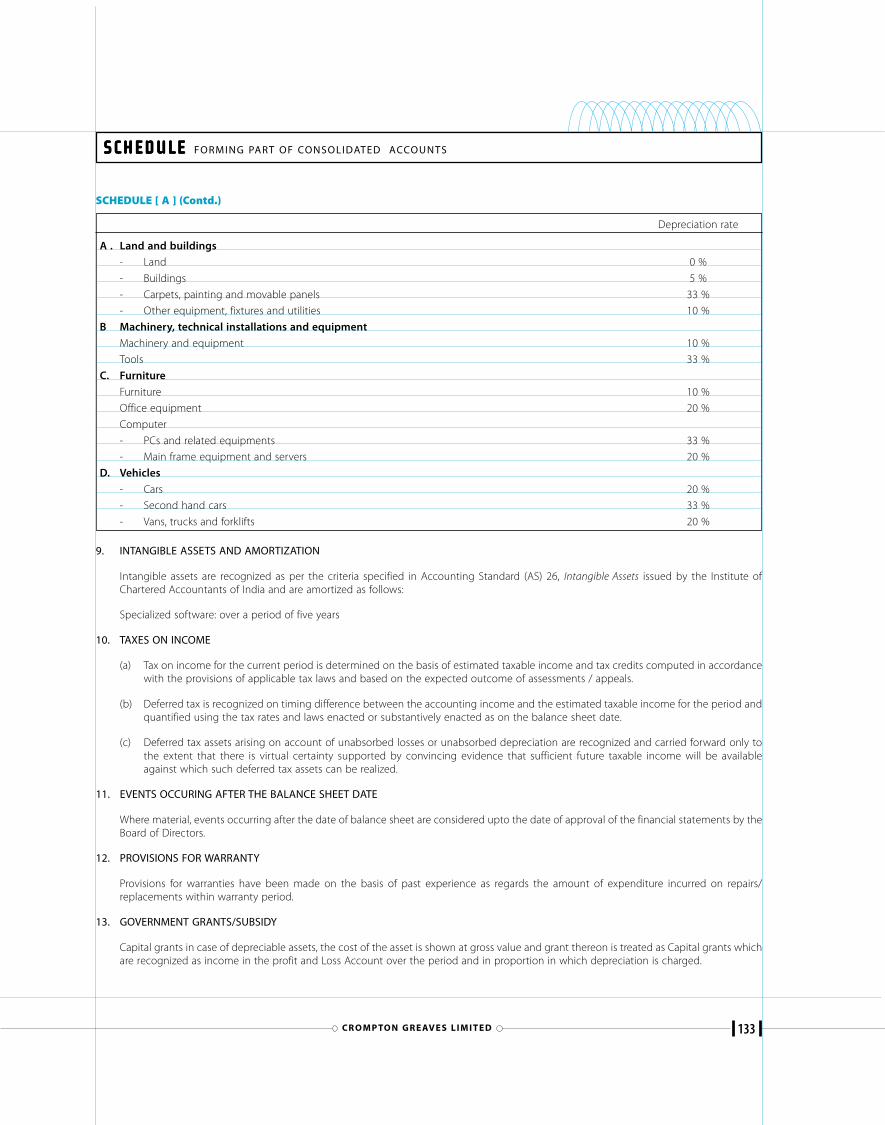
133CR O M P TO N G R E AV E S L I M I T E D
SCHEDULE [ A ] (Contd.)
Depreciation rate
A . Land and buildings
- Land 0 %
- Buildings 5 %
- Carpets, painting and movable panels 33 %
- Other equipment, fixtures and utilities 10 %
B Machinery, technical installations and equipment
Machinery and equipment 10 %
Tools 33 %
C. Furniture
Furniture 10 %
Office equipment 20 %
Computer
- PCs and related equipments 33 %
- Main frame equipment and servers 20 %
D. Vehicles
- Cars 20 %
- Second hand cars 33 %
- Vans, trucks and forklifts 20 %
9. INTANGIBLE ASSETS AND AMORTIZATION
Intangible assets are recognized as per the criteria specified in Accounting Standard (AS) 26, Intangible Assets issued by the Institute ofChartered Accountants of India and are amortized as follows:
Specialized software: over a period of five years
10. TAXES ON INCOME
(a) Tax on income for the current period is determined on the basis of estimated taxable income and tax credits computed in accordancewith the provisions of applicable tax laws and based on the expected outcome of assessments / appeals.
(b) Deferred tax is recognized on timing difference between the accounting income and the estimated taxable income for the period andquantified using the tax rates and laws enacted or substantively enacted as on the balance sheet date.
(c) Deferred tax assets arising on account of unabsorbed losses or unabsorbed depreciation are recognized and carried forward only tothe extent that there is virtual certainty supported by convincing evidence that sufficient future taxable income will be availableagainst which such deferred tax assets can be realized.
11. EVENTS OCCURING AFTER THE BALANCE SHEET DATE
Where material, events occurring after the date of balance sheet are considered upto the date of approval of the financial statements by theBoard of Directors.
12. PROVISIONS FOR WARRANTY
Provisions for warranties have been made on the basis of past experience as regards the amount of expenditure incurred on repairs/replacements within warranty period.
13. GOVERNMENT GRANTS/SUBSIDY
Capital grants in case of depreciable assets, the cost of the asset is shown at gross value and grant thereon is treated as Capital grants whichare recognized as income in the profit and Loss Account over the period and in proportion in which depreciation is charged.
SCHEDULE SCHEDULE SCHEDULE SCHEDULE SCHEDULE FORMING PART OF CONSOLIDATED ACCOUNTS
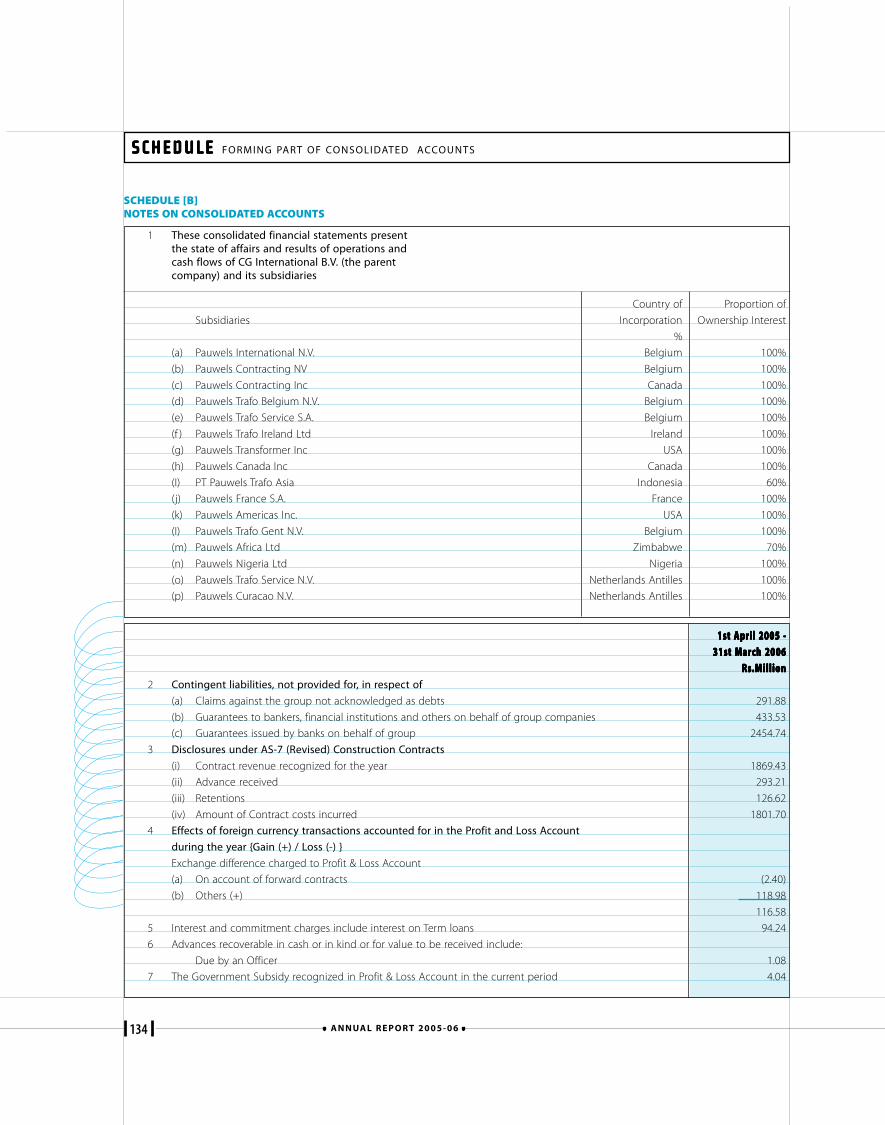
134 A N N UA L R E P O R T 2 0 0 5 - 0 6
SCHEDULE [B]NOTES ON CONSOLIDATED ACCOUNTS
1 These consolidated financial statements presentthe state of affairs and results of operations andcash flows of CG International B.V. (the parentcompany) and its subsidiaries
Country of Proportion of
Subsidiaries Incorporation Ownership Interest
%
(a) Pauwels International N.V. Belgium 100%
(b) Pauwels Contracting NV Belgium 100%
(c) Pauwels Contracting Inc Canada 100%
(d) Pauwels Trafo Belgium N.V. Belgium 100%
(e) Pauwels Trafo Service S.A. Belgium 100%
(f ) Pauwels Trafo Ireland Ltd Ireland 100%
(g) Pauwels Transformer Inc USA 100%
(h) Pauwels Canada Inc Canada 100%
(I) PT Pauwels Trafo Asia Indonesia 60%
(j) Pauwels France S.A. France 100%
(k) Pauwels Americas Inc. USA 100%
(I) Pauwels Trafo Gent N.V. Belgium 100%
(m) Pauwels Africa Ltd Zimbabwe 70%
(n) Pauwels Nigeria Ltd Nigeria 100%
(o) Pauwels Trafo Service N.V. Netherlands Antilles 100%
(p) Pauwels Curacao N.V. Netherlands Antilles 100%
1st A1st A1st A1st A1st Aprprprprpril 2005 -il 2005 -il 2005 -il 2005 -il 2005 -31st Mar31st Mar31st Mar31st Mar31st March 2006ch 2006ch 2006ch 2006ch 2006
RsRsRsRsRs.M.M.M.M.M illionillionillionillionillion2 Contingent liabilities, not provided for, in respect of
(a) Claims against the group not acknowledged as debts 291.88
(b) Guarantees to bankers, financial institutions and others on behalf of group companies 433.53
(c) Guarantees issued by banks on behalf of group 2454.74
3 Disclosures under AS-7 (Revised) Construction Contracts
(i) Contract revenue recognized for the year 1869.43
(ii) Advance received 293.21
(iii) Retentions 126.62
(iv) Amount of Contract costs incurred 1801.70
4 Effects of foreign currency transactions accounted for in the Profit and Loss Account
during the year {Gain (+) / Loss (-) }
Exchange difference charged to Profit & Loss Account
(a) On account of forward contracts (2.40)
(b) Others (+) 118.98
116.58
5 Interest and commitment charges include interest on Term loans 94.24
6 Advances recoverable in cash or in kind or for value to be received include:
Due by an Officer 1.08
7 The Government Subsidy recognized in Profit & Loss Account in the current period 4.04
SCHEDULE SCHEDULE SCHEDULE SCHEDULE SCHEDULE FORMING PART OF CONSOLIDATED ACCOUNTS
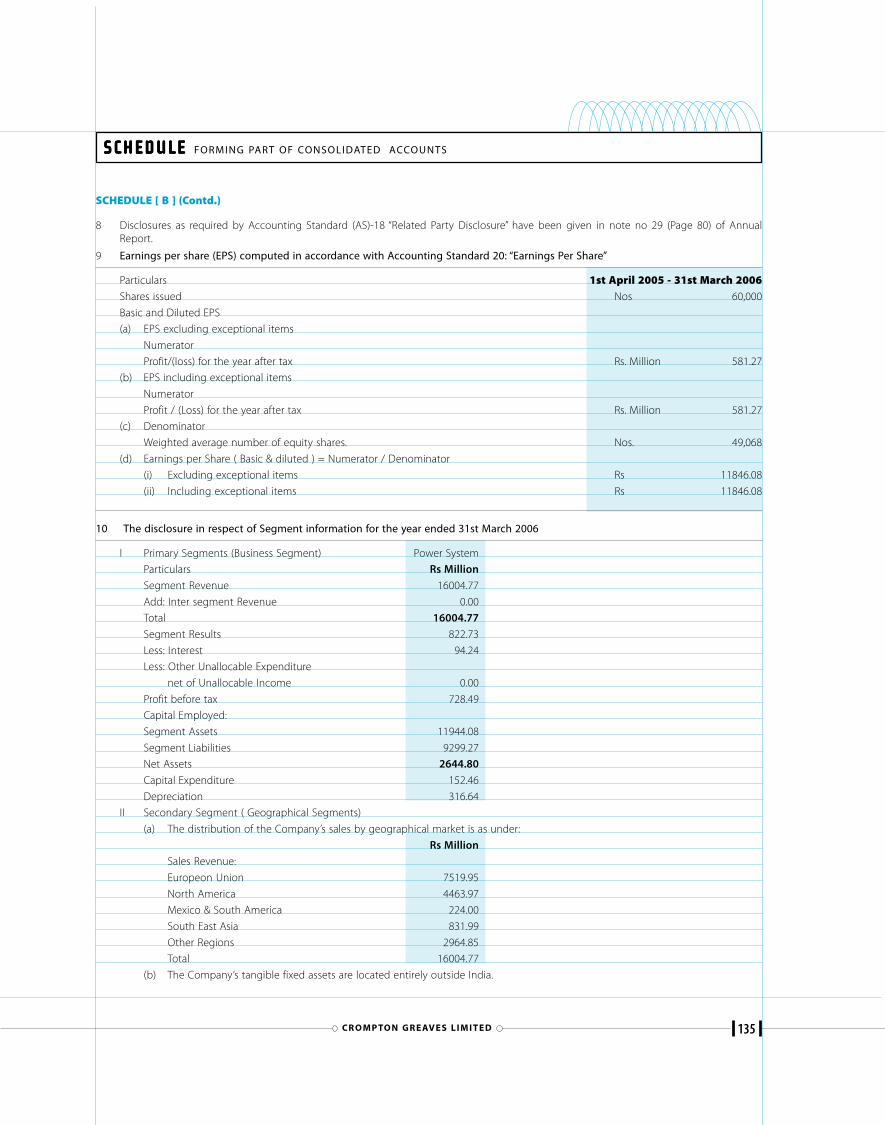
135CR O M P TO N G R E AV E S L I M I T E D
SCHEDULE [ B ] (Contd.)
8 Disclosures as required by Accounting Standard (AS)-18 “Related Party Disclosure” have been given in note no 29 (Page 80) of AnnualReport.
9 Earnings per share (EPS) computed in accordance with Accounting Standard 20: “Earnings Per Share”
Particulars 1st April 2005 - 31st March 2006Shares issued Nos 60,000
Basic and Diluted EPS
(a) EPS excluding exceptional items
Numerator
Profit/(loss) for the year after tax Rs. Million 581.27
(b) EPS including exceptional items
Numerator
Profit / (Loss) for the year after tax Rs. Million 581.27
(c) Denominator
Weighted average number of equity shares. Nos. 49,068
(d) Earnings per Share ( Basic & diluted ) = Numerator / Denominator
(i) Excluding exceptional items Rs 11846.08
(ii) Including exceptional items Rs 11846.08
10 The disclosure in respect of Segment information for the year ended 31st March 2006
I Primary Segments (Business Segment) Power System
Particulars Rs Million
Segment Revenue 16004.77
Add: Inter segment Revenue 0.00
Total 16004.77
Segment Results 822.73
Less: Interest 94.24
Less: Other Unallocable Expenditure
net of Unallocable Income 0.00
Profit before tax 728.49
Capital Employed:
Segment Assets 11944.08
Segment Liabilities 9299.27
Net Assets 2644.80
Capital Expenditure 152.46
Depreciation 316.64
II Secondary Segment ( Geographical Segments)
(a) The distribution of the Company’s sales by geographical market is as under:
Rs Million
Sales Revenue:
Europeon Union 7519.95
North America 4463.97
Mexico & South America 224.00
South East Asia 831.99
Other Regions 2964.85
Total 16004.77
(b) The Company’s tangible fixed assets are located entirely outside India.
SCHEDULE SCHEDULE SCHEDULE SCHEDULE SCHEDULE FORMING PART OF CONSOLIDATED ACCOUNTS
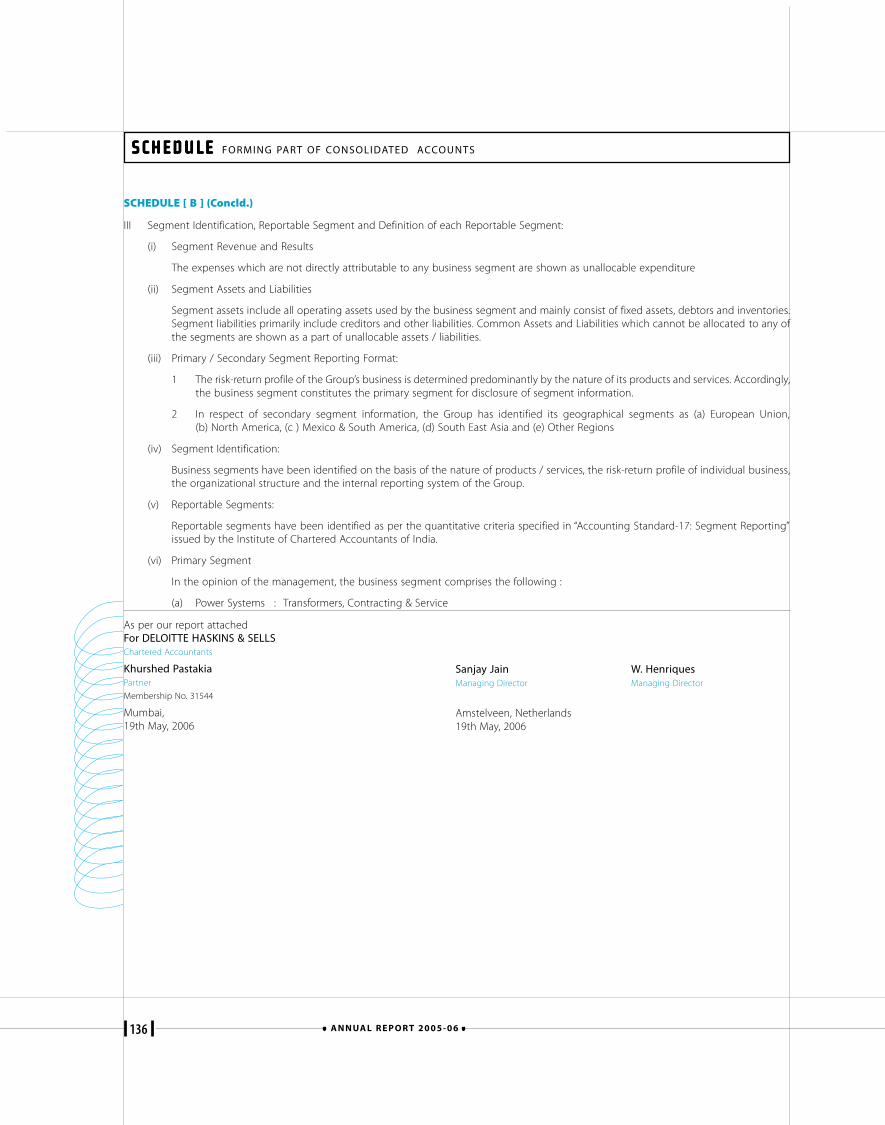
136 A N N UA L R E P O R T 2 0 0 5 - 0 6
III Segment Identification, Reportable Segment and Definition of each Reportable Segment:
(i) Segment Revenue and Results
The expenses which are not directly attributable to any business segment are shown as unallocable expenditure
(ii) Segment Assets and Liabilities
Segment assets include all operating assets used by the business segment and mainly consist of fixed assets, debtors and inventories.Segment liabilities primarily include creditors and other liabilities. Common Assets and Liabilities which cannot be allocated to any ofthe segments are shown as a part of unallocable assets / liabilities.
(iii) Primary / Secondary Segment Reporting Format:
1 The risk-return profile of the Group’s business is determined predominantly by the nature of its products and services. Accordingly,the business segment constitutes the primary segment for disclosure of segment information.
2 In respect of secondary segment information, the Group has identified its geographical segments as (a) European Union,(b) North America, (c ) Mexico & South America, (d) South East Asia and (e) Other Regions
(iv) Segment Identification:
Business segments have been identified on the basis of the nature of products / services, the risk-return profile of individual business,the organizational structure and the internal reporting system of the Group.
(v) Reportable Segments:
Reportable segments have been identified as per the quantitative criteria specified in “Accounting Standard-17: Segment Reporting”issued by the Institute of Chartered Accountants of India.
(vi) Primary Segment
In the opinion of the management, the business segment comprises the following :
(a) Power Systems : Transformers, Contracting & Service
SCHEDULE [ B ] (Concld.)
SCHEDULE SCHEDULE SCHEDULE SCHEDULE SCHEDULE FORMING PART OF CONSOLIDATED ACCOUNTS
Sanjay Jain W. HenriquesManaging Director Managing Director
Amstelveen, Netherlands19th May, 2006
As per our report attachedFor DELOITTE HASKINS & SELLSChartered Accountants
Khurshed PastakiaPartner
Membership No. 31544
Mumbai,19th May, 2006
137CR O M P TO N G R E AV E S L I M I T E D
Products & Services
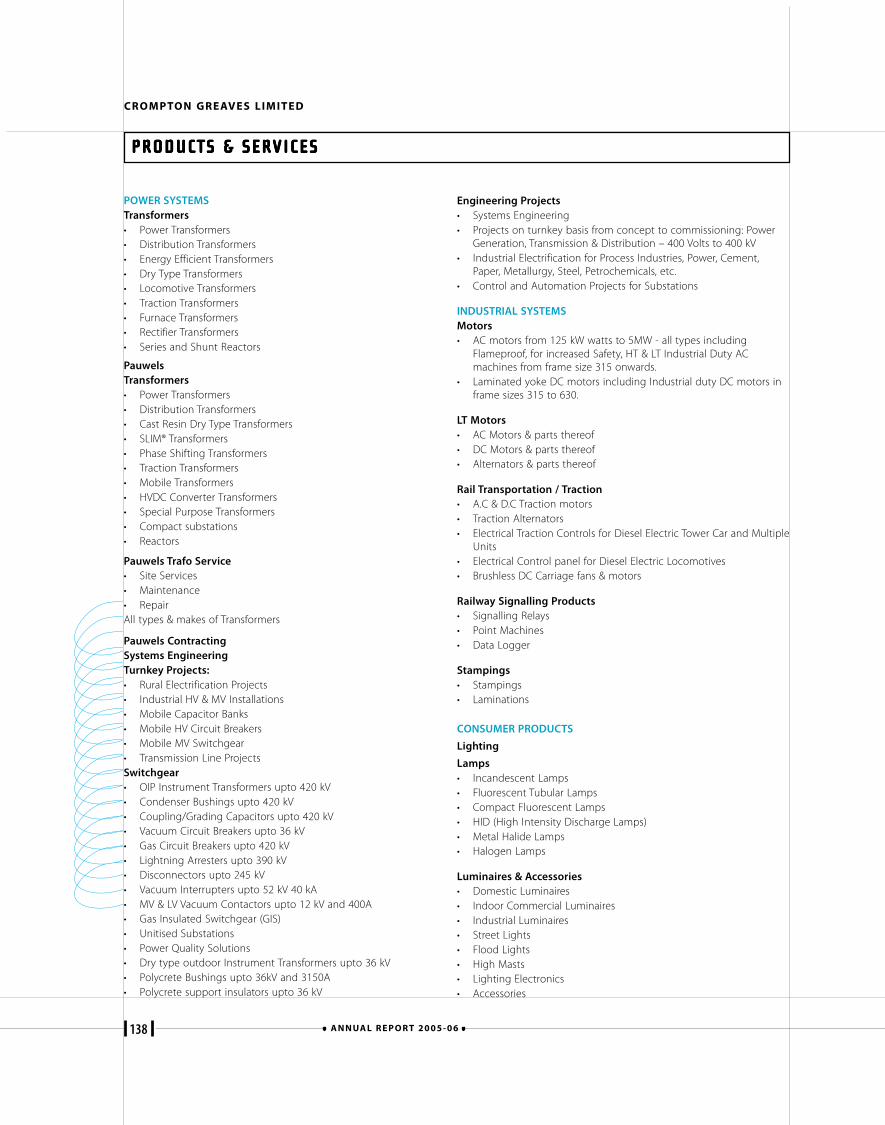
CROMPTON GREAVES LIMITED
138 A N N UA L R E P O R T 2 0 0 5 - 0 6
PRODUCTS & SERVICESPRODUCTS & SERVICESPRODUCTS & SERVICESPRODUCTS & SERVICESPRODUCTS & SERVICES
POWER SYSTEMSTransformers• Power Transformers• Distribution Transformers• Energy Efficient Transformers• Dry Type Transformers• Locomotive Transformers• Traction Transformers• Furnace Transformers• Rectifier Transformers• Series and Shunt Reactors
PauwelsTransformers• Power Transformers• Distribution Transformers• Cast Resin Dry Type Transformers• SLIM® Transformers• Phase Shifting Transformers• Traction Transformers• Mobile Transformers• HVDC Converter Transformers• Special Purpose Transformers• Compact substations• Reactors
Pauwels Trafo Service• Site Services• Maintenance• RepairAll types & makes of Transformers
Pauwels ContractingSystems EngineeringTurnkey Projects:• Rural Electrification Projects• Industrial HV & MV Installations• Mobile Capacitor Banks• Mobile HV Circuit Breakers• Mobile MV Switchgear• Transmission Line ProjectsSwitchgear• OIP Instrument Transformers upto 420 kV• Condenser Bushings upto 420 kV• Coupling/Grading Capacitors upto 420 kV• Vacuum Circuit Breakers upto 36 kV• Gas Circuit Breakers upto 420 kV• Lightning Arresters upto 390 kV• Disconnectors upto 245 kV• Vacuum Interrupters upto 52 kV 40 kA• MV & LV Vacuum Contactors upto 12 kV and 400A• Gas Insulated Switchgear (GIS)• Unitised Substations• Power Quality Solutions• Dry type outdoor Instrument Transformers upto 36 kV• Polycrete Bushings upto 36kV and 3150A• Polycrete support insulators upto 36 kV
Engineering Projects• Systems Engineering• Projects on turnkey basis from concept to commissioning: Power
Generation, Transmission & Distribution – 400 Volts to 400 kV• Industrial Electrification for Process Industries, Power, Cement,
Paper, Metallurgy, Steel, Petrochemicals, etc.• Control and Automation Projects for Substations
INDUSTRIAL SYSTEMSMotors• AC motors from 125 kW watts to 5MW - all types including
Flameproof, for increased Safety, HT & LT Industrial Duty ACmachines from frame size 315 onwards.
• Laminated yoke DC motors including Industrial duty DC motors inframe sizes 315 to 630.
LT Motors• AC Motors & parts thereof• DC Motors & parts thereof• Alternators & parts thereof
Rail Transportation / Traction• A.C & D.C Traction motors• Traction Alternators• Electrical Traction Controls for Diesel Electric Tower Car and Multiple
Units• Electrical Control panel for Diesel Electric Locomotives• Brushless DC Carriage fans & motors
Railway Signalling Products• Signalling Relays• Point Machines• Data Logger
Stampings• Stampings• Laminations
CONSUMER PRODUCTS
Lighting
Lamps• Incandescent Lamps• Fluorescent Tubular Lamps• Compact Fluorescent Lamps• HID (High Intensity Discharge Lamps)• Metal Halide Lamps• Halogen Lamps
Luminaires & Accessories• Domestic Luminaires• Indoor Commercial Luminaires• Industrial Luminaires• Street Lights• Flood Lights• High Masts• Lighting Electronics• Accessories
139CR O M P TO N G R E AV E S L I M I T E D
PRODUCTS & SERVICESPRODUCTS & SERVICESPRODUCTS & SERVICESPRODUCTS & SERVICESPRODUCTS & SERVICES
Fans & Appliances
• Ceiling Fans in various models• Table, Pedestal and Wall Mounting Fans in metal and plastic• Kitchen Fresh Air Fans• Cooler Kits• Industrial Fan, Exhaust Fans and Air Circulators• Special Purpose Fans• Geysers• Household Appliances
Pumps
• Electrically driven Pumps• Centrifugal Monoblock Pumpsets- Single/Two Stage• Self Priming Pumpsets – Monobloc/Coupled• Submersible Pumpsets for 75,78,100, 150, 200 & 250mm Borewells• Jet Centrifugal Pumpsets – Single/ Multi Stage• Dewatering Pumpsets• Vertical In Line Pumpsets• Open well Submersible Pumpsets• Diesel Engines and Diesel Engine Pumps• Petrol Kerosene Engine Pumps• Compressor Pumps and Air Compressors• Diesel Generating Sets
INTERNATIONAL• Exports of all Crompton Greaves manufactured and factored
products.
OTHERSSwitching• 200 Ports C-DOT Rural Automatic Exchanges (TAX)• 400-1400 Ports C-DOT Single Base Module RAX• C-DOT MAX-L Exchanges of Capacities upto 10K lines• C-DOT MAX-XL Exchanges of Capacities upto 40K Lines• Network Synchronisation Equipment (NSE)• Huawei D-TAX Exchange of Capacity upto 800K lines
Transmission• 2/8 Mbps Optimux Equipments• 2/8 Mbps Optimux in 1+1 Hot Standby Mode• 2/34 Mbps Optimux Equipment• TDMA-PMP Digital MARR Systems• Optical Modems at 8 Mbps• STM-1 & STM4 equipments.
Access Products• CorDECT – Wireless Local loop Equipments• High-bit-rate Digital Subscriber Loop (HDSL) systems• DLC on SDH’s (Digital Loop Carrier on SDH)• Multiplexer Equipment
Meters• Energy Meters – 1 phase & 3 phase
Private Switching• Coral Range of EPABX Systems of capacities upto 6000 ports with
CTI and ACD facilities• Call Centres• VOIP Range products• Key Telephone System (Small Exchanges)
CROMPTON GREAVES LIMITED
140 A N N UA L R E P O R T 2 0 0 5 - 0 6
Establishments
141CR O M P TO N G R E AV E S L I M I T E D
REGISTERED OFFICECG House, 6th Floor, Dr. Annie Besant Road, Worli,Mumbai-400030, IndiaTel. +91-(0)22-24237777Fax +91-(0)22-24237788
INTERNATIONAL DIVISION“Jagruti”, 2nd floor, Kanjur Marg (East), Mumbai-400042, India.Tel: +91-(0)22-67558931, +91-(0)22-67558365,Fax: +91-(0)22-25774066e-mail: [email protected]
POWER SYSTEMSTransformer Division• Kanjur Marg (East), Mumbai-400042, India.
Tel: +91-(0)22-25782974,+91-(0)22-67558000FAX: +91-(0)22-67558305.e-mail: [email protected]
• Plot No. T1&T2 MPAKVN Industrial Area, Malanpur (Dist. Bhind),Pin-477116, Madhya Pradesh, India.Tel: +91(0)7539 283502/3/5/7FAX: +91(0)7539-283585e-mail: [email protected]
• Plot No. 29, 31& 32 New Industrial Area No.1, AKVN,Mandideep-462046, Madhya Pradesh, India.Tel: +91(0)7480 508285/6,233306FAX: +91(0)7480-233149,email:[email protected]
SwitchgearA-3, M.I.D.C., Ambad, Nashik -422010(Maharashtra), India.Tel: +91(0)253-2382271-75Fax : +91(0)253-2381247email:[email protected]
S6 & Power QualityD2- MIDC, Waluj, Aurangabad-431136, India.Tel: +91(0)240-2554662, 2558031,FAX: +91(0)240-2554697e-mail: [email protected]
Engineering Projects DivisionDLF Cyber-Green, Tower A, 3rd Floor, Sector 25-A, DLF Phase III,Gurgaon-122002, Haryana, India.Tel: +91(0)124-3047700FAX: +91(0)124-3047777, 3047888e-mail: [email protected]
INDUSTRIAL SYSTEMSMachines 7 Division:D-5, Industrial Area, MPAKVN, Mandideep- 462046(M.P), India.Tel: +91(0)7480 400000400181/2FAX: +91(0)7480-403119e-mail: [email protected]
ESTABLISHMENTSESTABLISHMENTSESTABLISHMENTSESTABLISHMENTSESTABLISHMENTS
Railway Signalling Division11 B, Industrial Area No1, Pithampur-454775,District-Dhar (M.P), India.Tel: +91-(0)7292 410000403095FAX: +91-(0)7292 253211e-mail: [email protected]
Stampings Division
Kanjur Marg (East), Mumbai-400042, India.Tel: +91-(0)22-67558715/6,Fax: +91-(0)22-25787970e-mail: [email protected]
B-110, MIDC Industrial Area, Ahmednagar-414111, India.Tel: +91-(0)241-2778521, 5616020FAX: +91(0)241-2778521.e-mail: [email protected]
LT Motors Division:A/6-2, MIDC Industrial Area,Ahmednagar- 414111(Maharashtra), India.Tel: +91-(0)241-2777372FAX: +91-(0)241-2777508, 2777800e-mail: [email protected]
D-2-21, 22, 23 Tivim Industrial Estate, Karaswada, Bardez,Goa-403526, IndiaTel: +91-(0)832-2257639, 2257409FAX: +91-(0)832-2257207email:[email protected]
FHP Motors Division196-198, Kundaim Industrial Estate, Kundaim, Ponda, Goa-403115, IndiaTel: +91-(0)832-3983200, 2395954FAX: +91-(0)832-2395377, 3983299e-mail: [email protected]
CONSUMER PRODUCTS
Fans DivisionPlot No. 1 Goa IDC Industrial Estate, Bethora, Ponda, Goa-403409,IndiaTel: +91-(0)832-2331200, 2331256,FAX: +91-(0)832-2330155e-mail: [email protected]
Plot No. 214-A Kundaim Industrial Estate, Kundaim, Goa-403115Tel: +91-(0)832-2395901, 2395814FAX: +91-(0)832-2395305e-mail: [email protected]
Plot No. 81, HPSIDC Indl. Area,Baddi, District Solan, HP-173205Tel: +91- (0)1795-246140e-mail: [email protected]
CROMPTON GREAVES LIMITED
142 A N N UA L R E P O R T 2 0 0 5 - 0 6
ESTABLISHMENTSESTABLISHMENTSESTABLISHMENTSESTABLISHMENTSESTABLISHMENTS
Lighting DivisionR&D Building 1, 2nd floor, Kanjur Marg (East), Mumbai-400042, India.Tel: +91-(0)22-67558000FAX: +91-(0)22-25787283, 25783027e-mail: [email protected]
Baroda Lamp Works, Kural Village, Padra Taluka, Padra Jambusar Road,District Baroda-391430, Gujarat, India.Tel: +91-(0)2662-242278, 329822FAX: +91-(0)2662-242326e-mail: [email protected]
Pumps DivisionA-28, MIDC, Ahmednagar-414111, India.Tel: +91-(0)241-6606500, 6606501Fax: +91-(0)241- 6606550e-mail: [email protected]
Switching, Transmission & Access ProductsH.O: 562/640, First Floor, Janardhana Towers, Bannerghatta Road,Bilekahalli, Bangalore-560076, India.Tel: +91-(0)80-41292390, 41292399.FAX: +91-(0)80-41292389e-mail: [email protected]
10A, Jigani Industrial Area, Jigani,Anekal Taluk, Bangalore Rural, Bangalore-562106, India.Tel: +91-(0)80-7825206, 7825207FAX: +91-(0)80-7825205e-mail: [email protected]
BRANCH & MARKETING OFFICES
Northern Region
Regional Head Office: New Delhi- Vandhana Building, 11 TolstoyMarg, New Delhi-110001, India.Tel: +91-(0)11-30416300, 23352161FAX: +91-(0)11-23324360e-mail: [email protected]
Rail Transportation SystemsBranch DetailsVandhna Building, 11, Tolstoy Marg, New Delhi-110001, India.Tel: +91(0)11-30416300, 23352147FAX: +91-(0)11-23352134e-mail: [email protected]
Jaipur: Church Road, PO Box 173, Jaipur-302001, India.Tel: +91-(0)141-3018800/01FAX: +91-(0)141-2365371e-mail: [email protected]
Jalandhar: 416-417, 3rd Floor, Prestige Chambers, GT Road,Jalandhar-144001, India.Tel: +91-(0)181-3240990-3FAX: +91-(0)181-2226342e-mail: [email protected]
Lucknow: Saran Chambers II, 3rd Floor, 5 Park Road, Lucknow-226001,India.Tel: +91-(0)522-3018850-57FAX: +91-(0)522-3018858e-mail:[email protected]
Eastern RegionRegional Head Office: Kolkata-50 Chowringhee Road, Kolkata-700071, India.Tel: +91-(0)33-22829681-85.FAX: +91-(0)33-22829942e-mail: [email protected]; [email protected]@cgl.co.in
Bhubaneshwar: Janpath Tower, 3rd Floor, Ashok Nagar Unit II,Bhubaneshwar-751009, India.Tel: +91-(0)674-2531128, 2531429FAX: +91-(0)674-2533521e-mail: [email protected]
Western RegionRegional Head Office: Mumbai- Kanjur Marg (East), Mumbai-400042,India.Tel: +91-(0)22-67558000, 25780234FAX: +91-(0)22-67558669e-mail: [email protected]
Ahmedabad: 909-916, Sakar II, Near Ellis Bridge, Ahmedabad-380006,India.Tel: +91-(0)79-40012000FAX: +91-(0)79-40012222e-mail: [email protected]
Indore: 103-B, Apollo Trade Centre, 2B, Rajgarh Kothi, Mumbai-AgraRoad, Indore-452001, India.Tel: +91-(0)731-2498269, 2498271FAX: +91-(0)731-4065621e-mail: [email protected]
Pune: Premium Point Building, 4th Floor, Opp Modern High School,J M Road, Shivajinagar, Pune-411005, India.Tel: +91-(0)20-25534675-77.FAX: +91-(0)20-25534684e-mail: [email protected]
Nagpur: 3, West High Court Road, Lal Bahadur Shastri Chowk,Dharampeth, Nagpur-440010, India.Tel: +91-(0)712-2531271, 2560870,FAX: +91-(0)712-2537196.e-mail: [email protected]
Southern RegionRegional Head Office: Chennai- Crompton House-3, Dr. MGR Salai(Kodambakkam High Road), Nungambakkam, Chennai-600034, India.Tel: +91-(0)44-42247500, 28257375.FAX: +91(0)44-28231973e-mail:[email protected]
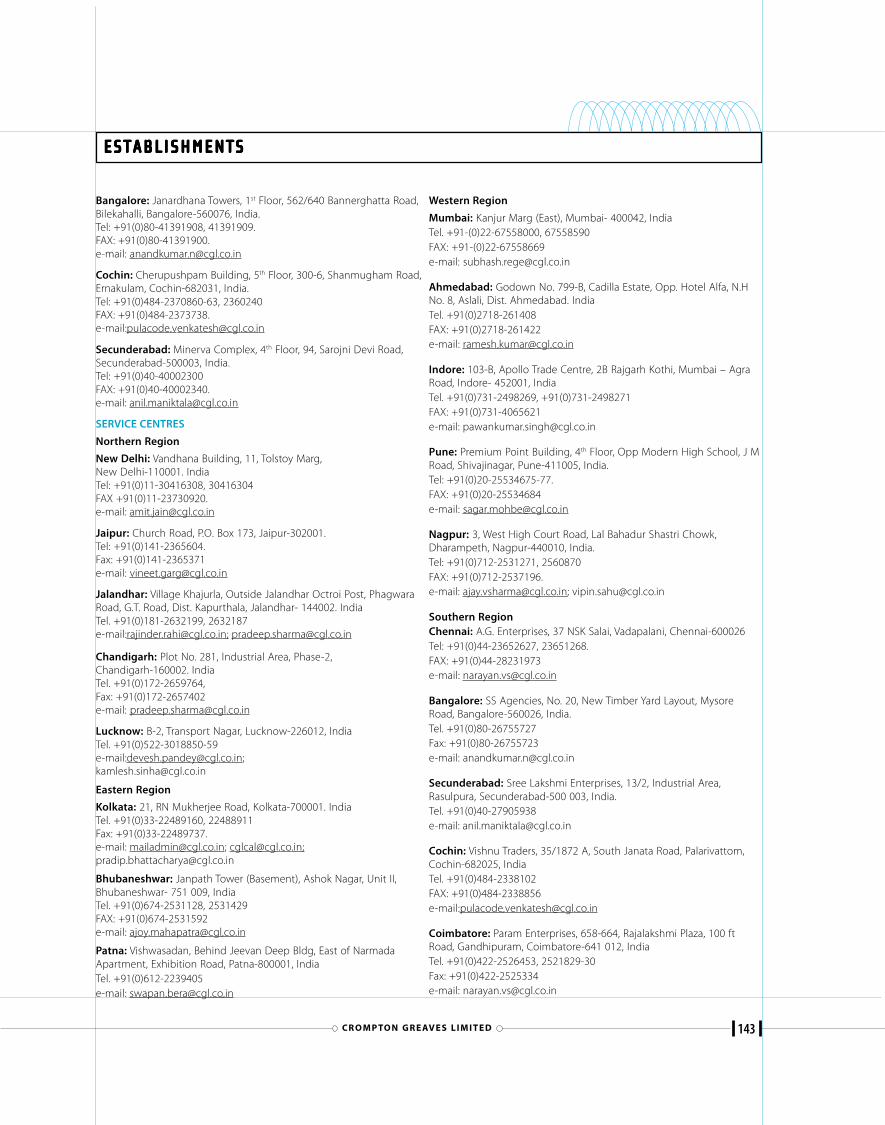
143CR O M P TO N G R E AV E S L I M I T E D
ESTABLISHMENTSESTABLISHMENTSESTABLISHMENTSESTABLISHMENTSESTABLISHMENTS
Bangalore: Janardhana Towers, 1st Floor, 562/640 Bannerghatta Road,Bilekahalli, Bangalore-560076, India.Tel: +91(0)80-41391908, 41391909.FAX: +91(0)80-41391900.e-mail: [email protected]
Cochin: Cherupushpam Building, 5th Floor, 300-6, Shanmugham Road,Ernakulam, Cochin-682031, India.Tel: +91(0)484-2370860-63, 2360240FAX: +91(0)484-2373738.e-mail:[email protected]
Secunderabad: Minerva Complex, 4th Floor, 94, Sarojni Devi Road,Secunderabad-500003, India.Tel: +91(0)40-40002300FAX: +91(0)40-40002340.e-mail: [email protected]
SERVICE CENTRES
Northern Region
New Delhi: Vandhana Building, 11, Tolstoy Marg,New Delhi-110001. IndiaTel: +91(0)11-30416308, 30416304FAX +91(0)11-23730920.e-mail: [email protected]
Jaipur: Church Road, P.O. Box 173, Jaipur-302001.Tel: +91(0)141-2365604.Fax: +91(0)141-2365371e-mail: [email protected]
Jalandhar: Village Khajurla, Outside Jalandhar Octroi Post, PhagwaraRoad, G.T. Road, Dist. Kapurthala, Jalandhar- 144002. IndiaTel. +91(0)181-2632199, 2632187e-mail:[email protected]; [email protected]
Chandigarh: Plot No. 281, Industrial Area, Phase-2,Chandigarh-160002. IndiaTel. +91(0)172-2659764,Fax: +91(0)172-2657402e-mail: [email protected]
Lucknow: B-2, Transport Nagar, Lucknow-226012, IndiaTel. +91(0)522-3018850-59e-mail:[email protected];[email protected]
Eastern Region
Kolkata: 21, RN Mukherjee Road, Kolkata-700001. IndiaTel. +91(0)33-22489160, 22488911Fax: +91(0)33-22489737.e-mail: [email protected]; [email protected];[email protected]
Bhubaneshwar: Janpath Tower (Basement), Ashok Nagar, Unit II,Bhubaneshwar- 751 009, IndiaTel. +91(0)674-2531128, 2531429FAX: +91(0)674-2531592e-mail: [email protected]
Patna: Vishwasadan, Behind Jeevan Deep Bldg, East of NarmadaApartment, Exhibition Road, Patna-800001, IndiaTel. +91(0)612-2239405e-mail: [email protected]
Western Region
Mumbai: Kanjur Marg (East), Mumbai- 400042, IndiaTel. +91-(0)22-67558000, 67558590FAX: +91-(0)22-67558669e-mail: [email protected]
Ahmedabad: Godown No. 799-B, Cadilla Estate, Opp. Hotel Alfa, N.HNo. 8, Aslali, Dist. Ahmedabad. IndiaTel. +91(0)2718-261408FAX: +91(0)2718-261422e-mail: [email protected]
Indore: 103-B, Apollo Trade Centre, 2B Rajgarh Kothi, Mumbai – AgraRoad, Indore- 452001, IndiaTel. +91(0)731-2498269, +91(0)731-2498271FAX: +91(0)731-4065621e-mail: [email protected]
Pune: Premium Point Building, 4th Floor, Opp Modern High School, J MRoad, Shivajinagar, Pune-411005, India.Tel: +91(0)20-25534675-77.FAX: +91(0)20-25534684e-mail: [email protected]
Nagpur: 3, West High Court Road, Lal Bahadur Shastri Chowk,Dharampeth, Nagpur-440010, India.Tel: +91(0)712-2531271, 2560870FAX: +91(0)712-2537196.e-mail: [email protected]; [email protected]
Southern RegionChennai: A.G. Enterprises, 37 NSK Salai, Vadapalani, Chennai-600026Tel: +91(0)44-23652627, 23651268.FAX: +91(0)44-28231973e-mail: [email protected]
Bangalore: SS Agencies, No. 20, New Timber Yard Layout, MysoreRoad, Bangalore-560026, India.Tel. +91(0)80-26755727Fax: +91(0)80-26755723e-mail: [email protected]
Secunderabad: Sree Lakshmi Enterprises, 13/2, Industrial Area,Rasulpura, Secunderabad-500 003, India.Tel. +91(0)40-27905938e-mail: [email protected]
Cochin: Vishnu Traders, 35/1872 A, South Janata Road, Palarivattom,Cochin-682025, IndiaTel. +91(0)484-2338102FAX: +91(0)484-2338856e-mail:[email protected]
Coimbatore: Param Enterprises, 658-664, Rajalakshmi Plaza, 100 ftRoad, Gandhipuram, Coimbatore-641 012, IndiaTel. +91(0)422-2526453, 2521829-30Fax: +91(0)422-2525334e-mail: [email protected]
CROMPTON GREAVES LIMITED
144 A N N UA L R E P O R T 2 0 0 5 - 0 6
MANUFACTURING/ CONTRACTING/ SERVICES:
PAUWELS INTERNATIONAL N.V.Antwerpsesteenweg 167B-2800 Mechelen, BelgiumTel. + 32 15 283 333 - Fax + 32 15 283 520e-mail: [email protected]
PAUWELS TRAFO BELGIUM N.V.Antwerpsesteenweg 167B-2800 Mechelen, BelgiumTel. + 32 15 283 333 - Fax + 32 15 283 300e-mail: [email protected]
PAUWELS CONTRACTING N.V.Antwerpsesteenweg 167B-2800 Mechelen, BelgiumTel. + 32 15 283 333 - Fax + 32 15 283 491e-mail: [email protected]
PAUWELS TRAFO SERVICE S.A.Vital Françoisse 220, B.P. 1581B-6000 Charleroi, BelgiumTel. + 32 71 472 525 - Fax + 32 71 470 189e-mail: [email protected]
PAUWELS TRAFO GENT N.V.Antwerpsesteenweg 167B-2800 Mechelen, BelgiumTel. + 32 15 283 333 - Fax + 32 15 283 50e-mail: [email protected]
PAUWELS TRAFO IRELAND LTD.Dublin RoadCavan, IrelandTel. + 353 49 43 31 588 - Fax + 353 49 43 32 053e-mail: [email protected]
PAUWELS TRANSFORMERS, INC.One Pauwels DriveWashington, Missouri 63090, USATel. + 1 636 239 9300 - Fax + 1 636 239 9398e-mail: [email protected]
PAUWELS CANADA, INC.101 Rockman StreetWinnipeg, MB R3T 0L7, CanadaTel + 1 204 452 7446 - Fax + 1 204 453 8644e-mail: [email protected]
PAUWELS CONTRACTING, INC.101 Rockman StreetWinnipeg, MB R3T 0L7, CanadaTel. + 1 204 452 7446 - Fax + 1 204 452 8055e-mail: [email protected]
PT PAUWELS TRAFO ASIAKawasan Industri Menara Permai Kav. 10Jl. Raya Narogong, Cileungsi,Bogor 16820, IndonesiaTel. + 62 21 823 04 30/36 - Fax + 62 21 823 02 68/42 22e-mail: [email protected]
PAUWELS TRAFO SERVICE N.V.Sans Souci z/nWillemstadCuracao, Dutch AntillesTel. + 599 9 888 33 55 - Fax + 599 9 888 33 53e-mail: [email protected]
PAUWELS ESTABLISHMENTSPAUWELS ESTABLISHMENTSPAUWELS ESTABLISHMENTSPAUWELS ESTABLISHMENTSPAUWELS ESTABLISHMENTS
SALES OFFICES (SEPARATE LEGAL ENTITIES):
PAUWELS FRANCE S.A.Immeuble Arago 141 boulevard VaubanF-78280 Guyancourt, FranceTel. + 33 1 34 52 10 80 - Fax + 33 1 34 52 27 30e-mail: [email protected]
PAUWELS MIDDLE EASTP.O. Box 5730Al Fardan Building, Al Zahra StreetSharjah, United Arab EmiratesTel. + 971 6 574 03 13 - Fax + 971 6 574 01 31e-mail: [email protected]
PAUWELS AMERICAS, INC.One Pauwels DriveWashington, Missouri 63090, USATel. + 1 636 239 9349 - Fax + 1 636 239 9398e-mail: [email protected]
PAUWELS CURACAO N.V.Sans Souci z/nWillemstadCuracao, Dutch AntillesTel. + 599 9 888 33 55 - Fax + 599 9 888 33 53e-mail: [email protected]
PAUWELS AFRICA LtdP.O. Box A 1831No 4 King Road, Office No 2 $ 3Avondale,Harare, Zimbabwee-mail: [email protected]
PAUWELS INTERNATIONAL NIGERIA LtdKajola House (4th Floor)62/ 64 Campbell StreetLagos, Nigeriae-mail: [email protected]
SALES OFFICES (REPRESENTATIVE OFFICES):
PAUWELS INTERNATIONAL N.V.UK Representative OfficeIn-House,Callendar Boulevarde.Callendar Business ParkFalkirk FK1 1YR, United KingdomTel. + 44 1324 679730 - Fax + 44 1324 679729e-mail: william.o’[email protected]
PAUWELS INTERNATIONAL N.V.Saudi Arabia Representative OfficeP.O. Box 59276Riyadh 11525, Saudi ArabiaTel. + 966 1 462 09 27 - Fax + 966 1 462 42 08e-mail: [email protected]
PAUWELS CONTRACTING N.V.Plaza PP, 5th FloorJl. TB. Simatupang No. 57Pasar ReboJakarta 13760, IndonesiaTel. + 62 21 841 40 57 - Fax + 62 21 841 43 64e-mail: [email protected]
PAUWELS TRAFO ASIANZ Representative OfficeP.O. Box 28099Christchurch, New ZealandTel. + 64 3 331 8290 - Fax + 64 3 331 8299e-mail: [email protected]