Embed Size (px)
Citation preview

Acoustoelastic Coefficients in Thick Steel Plates under Normaland Shear Stresses
Z. Abbasi1 & D. Ozevin1
Received: 12 November 2015 /Accepted: 21 June 2016# Society for Experimental Mechanics 2016
Abstract Ultrasonic monitoring of the integrity of structuralmaterials utilizes the acoustoelasticity of materials (stress-dependence of ultrasonic wave velocity) obtained from thehigher order strain terms in the constitutive equations. Thismethod has been applied to measure residual and appliedstresses in thin metals under principal stresses without shear.Here, acoustoelastic coefficients are determined in thick steelplates in normal, orthogonal, and angled directions by meansof an array of ultrasonic sensors. A three-dimensional materialmodel is developed which includes Murnaghan hyper-elasticity and can determine the effects of plate thicknessand excitation frequency on the acoustoelastic coefficients.This model is experimentally validated by tensile loading ofa thick steel plate by measuring the ultrasonic signals in threedirections. Numerical and experimental results agree withinthe measurement uncertainties of each method. The1.0 MHz ultrasonic frequency has the highest resolution formeasuring normal and shear stresses in structural plates typi-cally used in highway bridges.
Keywords Shear stress . Acoustoelasticity . Ultrasonics .
Frequency
Introduction
Increase in traffic on bridges as well as upgrades not foreseenin the original design (which may add to the dead load) can
increase the cumulative stress in critical bridge components,which may lead to unexpected failures. The collapse of the I-35W Mississippi River truss arch bridge in Minnesota is afamous case. It was attributed to an increase of the dead loadby 30 % over the original design from concrete deck overlay,plus additional construction-related loads on the day of thecollapse located above the weakest point of the structure, apair of gusset plates [1]. As the bridge was a non-redundant,fracture-critical bridge, the failure of gusset plates caused thecomplete failure of the bridge. Although the I-35W bridgewasregularly inspected for corrosion and cracks, these were notidentified as contributing factors. In order to estimate the over-load and the remaining strength capacity of any built structuralelement, the quantification of the stress state is needed. Thisstudy focuses on the acoustoelastic method of non-destructiveevaluation, which can provide a materials-dependent coeffi-cient that enables calculation of stress in structures made ofthis material.
There are several Nondestructive Evaluation (NDE)methods for measuring stress in structures, including hole-drilling, X-ray diffraction, and magneto-elastic methods. Inconcrete structures, the hole-drilling method introduced byMathar in 1933 is widely used for residual stresses. This meth-od requires a small hole to be drilled into the material; there-fore, it is considered a semi-destructive technique. The resul-tant deformations are then used to calculate the residual stress-es [2]. However, hole-drilling fails to detect high level stressgradients or stresses greater than one-third of yield stress.Additionally, the area being measured should be easily acces-sible and the thickness should be approximately 1 to 2 holediameters [3]. The X-Ray diffraction method is based on theeffect of stress on the atomic spacing structure of the metalspecimen. The stress is calculated by measuring the strain forat least two known orientations relative to the materials sur-face and assuming a linear distortion in the crystal lattice [4].
* D. [email protected]
1 Civil and Materials Engineering, University of Illinois at Chicago,842 W Taylor Street ERF 2095, Chicago, IL 60607, USA
Experimental MechanicsDOI 10.1007/s11340-016-0186-6

This method is considered expensive and difficult to apply inthe field and also requires a well-trained operator [5, 6].Magneto-elastic methods are based on the stress-magnetic re-lationships in ferromagnetic materials. Magnetic BarkhausenNoise (MBN) is a magneto-elastic method commonly used inthe NDE assessment of stresses. The stress dependence ofmagnetic properties of ferromagnetic materials such as coer-civity and permeability is the basis for this technique.Barkhausen’s demonstration of this technique in 1919 showedthat magnetizing a ferromagnetic material generates a noise ina neighboring coil. The amplitude of MBN signal is depen-dent on residual and applied stresses. The amplitude valueincreases if the elastic tensile stress is in the direction of mag-netization and decreases under compressive stress [7]. This
method is limited since it can only be applied to ferromagneticmaterials, and the measurement depth is dependent on thepermeability of the material. Additionally, the saturation ofthe MBN signal limits the stress detection in the material [8].
The acoustoelastic effect is a non-destructive method ofdetermining stresses in structures by means of ultrasonicwaves that is defined as the stress-dependence of ultrasonicwave velocity and only fully expressed when the higher orderstrain terms are considered in the constitutive equations of thematerial’s stress–strain relationship. The classical theory ofelasticity is based on small deformations (using only secondorder elasticity constants) and neglects the squares and prod-ucts of the strain terms; therefore, it does not provide thenecessary means to explain the ultrasonic wave-stress
Fig. 1 Two-dimensional stressplane and three ultrasonicmeasurement directions indicatedwith dashed arrows
Fig. 2 3D view of numerical model indicating loading direction, boundary condition, and ultrasonic excitation in the direction (a) parallel, (b)orthogonal, and (c) angled at 30° to the stress direction
Exp Mech
relationship. Consequently, the classical theory has to be ex-tended to include the finite deformations. Murnaghan [9] de-veloped the hyper-elastic materials model that represents non-linear ultrasonic behavior of materials and introduced the thirdorder elasticity constants (TOE) known as l, m and n for iso-tropic materials. Hughes and Kelly [10] used Murnaghan’smodel and calculated the third order elasticity constants fordifferent materials and loading conditions.
Numerous studies have implemented the acoustoelasticmethod with an emphasis on uniaxial stress measurement.For instance, acoustoelasticity has been applied to measurestress at prestressed steel strands [11–13], longitudinal stressin rails [14, 15], and uniaxial residual stress in metals [16–18]and in welds [19–22]. Wave modes such as longitudinal [23],shear [24], and surface waves [25, 26] can be used to measurestress with ultrasonic wave velocity. The acoustoelasticity
coefficient depends on wave mode [27], frequency [28, 29],material texture [30], and temperature [31, 32].
Other studies focus on the application of acoustoelasticityto complex loaded structures. Jassby and Saltoun [33] imple-mented Rayleigh waves to measure the biaxial surface stressesin 2024-T352 aluminum plates and proposed the biaxialacoustoelasticity equation. Todaro and Capsimalis [29] stud-ied the frequency dependence of Rayleigh wave velocity un-der non-uniform stress fields in steel cylinders. Husson et al.[34] used an electromagnetic acoustic transducer (EMAT) tomeasure the acoustoelastic coefficients for stainless steel.Vangi [35] used longitudinal waves in pulse-echo techniqueto calculate the biaxial stress field near notches and fatiguecracks. Duquennoy [36] determined the biaxial stress fieldalong the thickness of aluminum alloy sheets by variationsof Rayleigh wave velocity using wedge transducers.
Table 1 The material constants used in the numerical simulations [46]
Property A572 Grade 50 Steel
Density [kg/m3] 7850
Young’s modulus [MPa] 200E03
Poisson’s ratio 0.33
Lame constants [MPa]λ ¼ 150E03 μ ¼ 75E03
Murnaghan constants[MPa]
l ¼ �300E03 m ¼ �620E03 n ¼ �720E03
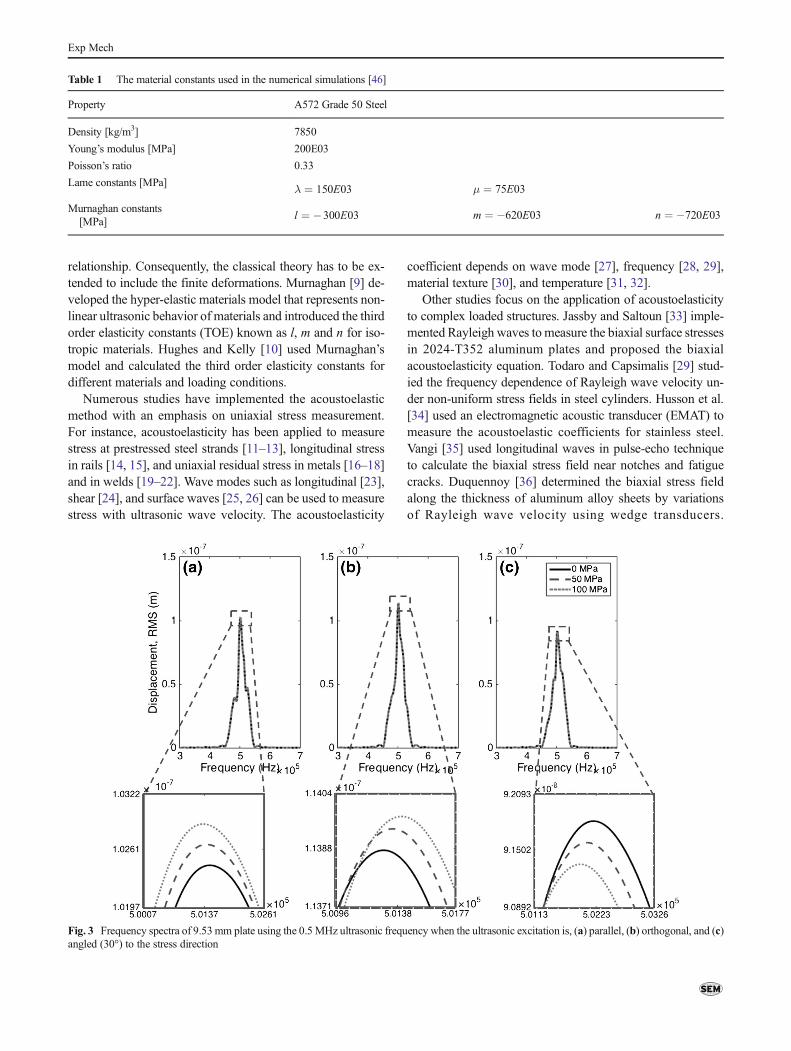
Fig. 3 Frequency spectra of 9.53 mm plate using the 0.5 MHz ultrasonic frequency when the ultrasonic excitation is, (a) parallel, (b) orthogonal, and (c)angled (30°) to the stress direction
Exp Mech

Akhshik et al. [37] used the Rayleigh wavemethod tomeasureresidual stresses of circumferential welds in thin walled pipes.
Hu et al. [38] used the digital correlation method to identifythe differences in the time of flight of Rayleigh waves and
Fig. 4 Unwrapped phase angle corresponding to the frequency spectra of 9.53 mm plate using the 0.5 MHz ultrasonic frequency when the ultrasonicexcitation is, (a) parallel, (b) orthogonal, and (c) angled (30°) to the stress direction
Fig. 5 Frequency spectra of 12.7 mm plate using the 0.5 MHz ultrasonic frequency when the ultrasonic excitation is, (a) parallel, (b) orthogonal, and (c)angled (30°) to the stress direction
Exp Mech
calculated the acoustoelastic coefficients for two directions.Gandhi [39] developed the theoretical equations of
acoustoelastic Lamb waves in thin aluminum plates underbiaxial loading.
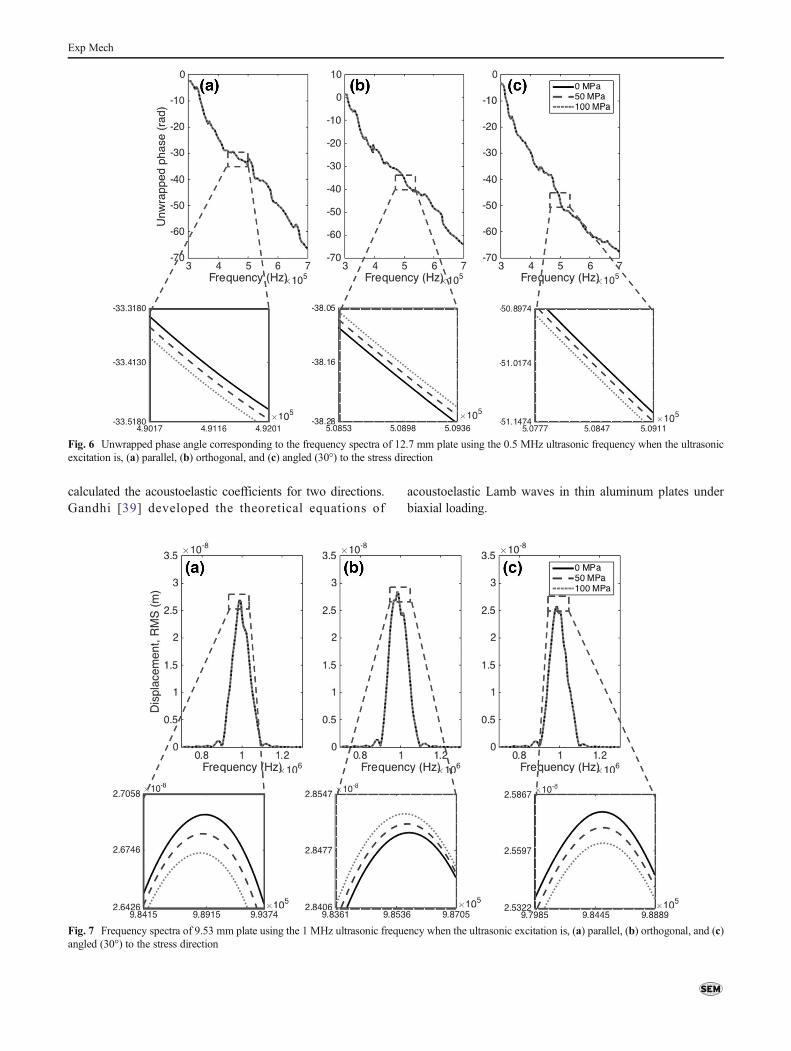
Fig. 6 Unwrapped phase angle corresponding to the frequency spectra of 12.7 mm plate using the 0.5 MHz ultrasonic frequency when the ultrasonicexcitation is, (a) parallel, (b) orthogonal, and (c) angled (30°) to the stress direction
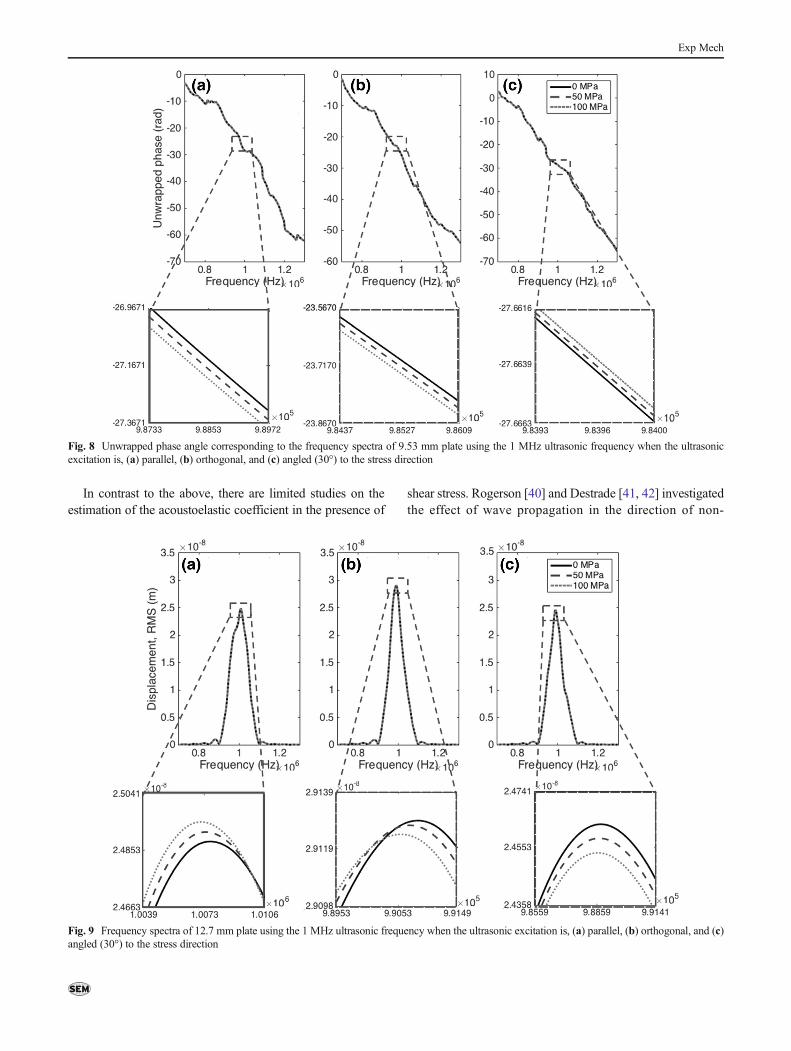
Fig. 7 Frequency spectra of 9.53 mm plate using the 1 MHz ultrasonic frequency when the ultrasonic excitation is, (a) parallel, (b) orthogonal, and (c)angled (30°) to the stress direction
Exp Mech
In contrast to the above, there are limited studies on theestimation of the acoustoelastic coefficient in the presence of
shear stress. Rogerson [40] and Destrade [41, 42] investigatedthe effect of wave propagation in the direction of non-
Fig. 8 Unwrapped phase angle corresponding to the frequency spectra of 9.53 mm plate using the 1 MHz ultrasonic frequency when the ultrasonicexcitation is, (a) parallel, (b) orthogonal, and (c) angled (30°) to the stress direction
Fig. 9 Frequency spectra of 12.7 mm plate using the 1 MHz ultrasonic frequency when the ultrasonic excitation is, (a) parallel, (b) orthogonal, and (c)angled (30°) to the stress direction
Exp Mech
principal stresses for incompressible materials using theMooney-Rivlin material model and showed its complex na-ture compared to the principal stress measurement. Connor[43, 44] developed the theoretical equations for the influenceof simple shear on the propagation of surface waves in aprestressed incompressible material. Shi et al. [45] studiedthe dependence of the acoustoelastic coefficient for lambwaves on propagation direction and wave mode and frequen-cy in a biaxially stressed aluminum plate.
The present research is focused on applying theacoustoelastic method for stress analysis to thick steel plates(9–12 mm) of the type commonly used for gusset plates of
steel truss bridges, where shear stress is significant. The ultra-sonic velocity and stress equation is modified in order to addthe shear effect in addition to normal stresses. The outline ofthis paper is as follows. Numerical demonstration to extractthe acoustoelastic coefficients in a three-dimensional structur-al geometry using Murnaghan’s hyper-elastic materials modelis described in section BNumerical Study .̂ The experimentalcomponent is presented in section BExperimental Study ,̂which consists of loading a thick plate while measuring theultrasonic wave in three directions in order to simulate differ-ent stress states (normal as well as shear stress), measure theacoustoelastic coefficients, and compare the results with the
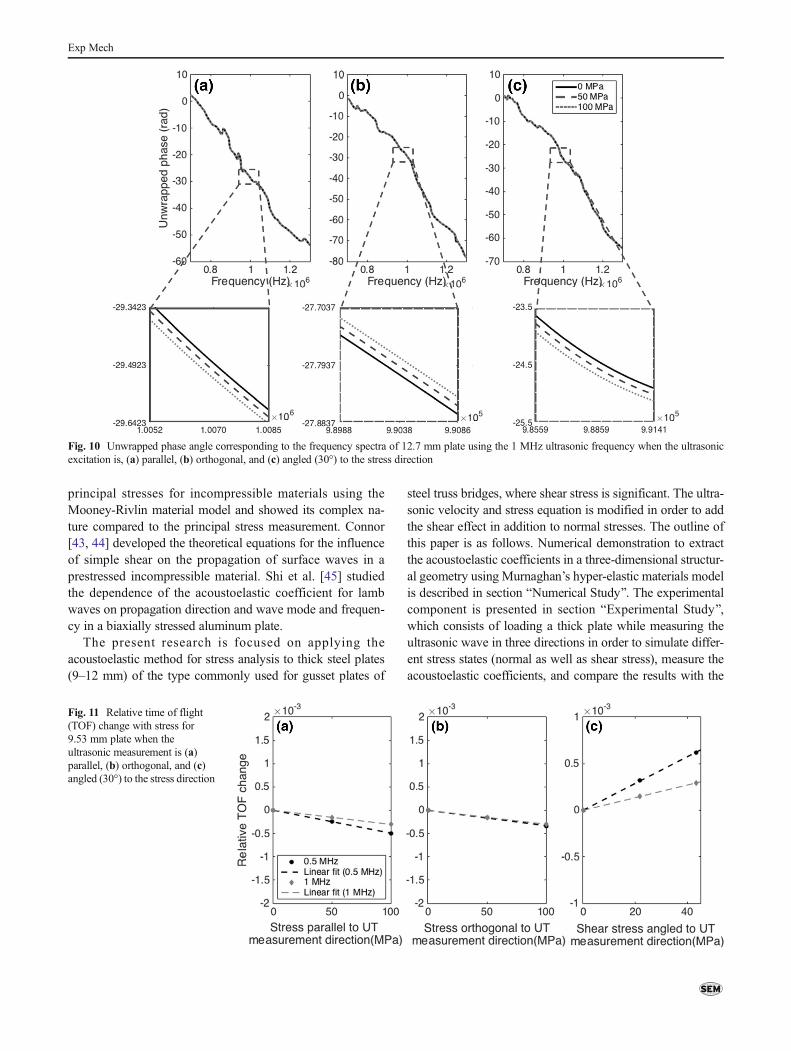
Fig. 10 Unwrapped phase angle corresponding to the frequency spectra of 12.7 mm plate using the 1 MHz ultrasonic frequency when the ultrasonicexcitation is, (a) parallel, (b) orthogonal, and (c) angled (30°) to the stress direction
Fig. 11 Relative time of flight(TOF) change with stress for9.53 mm plate when theultrasonic measurement is (a)parallel, (b) orthogonal, and (c)angled (30°) to the stress direction
Exp Mech
numerical simulations. Section BConclusions^ includes theconclusions of this study.
Numerical Study
Acoustoelastic Equations to Measure Stress
The acoustoelastic equation for a biaxial stress solution ispresented by Jassby and Saltoun [33] as:
v−vovo
¼ K1σ11 þ K2σ22 ð1Þ
where v and vo are the wave velocity in the stressed and stress-free body, K1 and K2 are acoustoelastic coefficients paralleland orthogonal to the measurement direction, and σ11 and σ22
are the principal stresses in two directions. This equation canbe solved for two material dependent coefficients, K1 and K2,using the analytical solution of plates or experimental mea-surement. Since there are two unknowns (σ11 and σ22Þ in abiaxial loading condition in the principal stress direction, twoseparate measurements are required in order to solve thestresses. As the measurement is taken in the principal stressdirection, equation (1) does not include the shear stress.
When the measurement is rotated from the principal stressdirection and taken from an arbitrary direction, shear stressexists in addition to normal stresses. The acoustoelastic equa-tion should consider the multiple stress effects in the measure-ment as:
v−vovo
¼ K1σ011 þ K2σ
022 þ K3σ
012 ð2Þ
where K3 is defined as the acoustoelastic coefficient due to
shear stress and σ012 is the shear stress in the plane of the
measurement direction. Figure 1 shows the stresses at a givencross section for three measurement directions at three anglesas 0°, 90° and 30° in a given plane. There are three unknowns
(σ011, σ
022 and σ
012 ); therefore, three measurements are required
to solve three equations simultaneously.
Numerical Model
Numerical study includes generating Rayleigh waves in athick steel plate in order to understand the effects of theultrasonic frequency and the plate thickness on theacoustoelastic coefficients. COMSOL Multiphysics soft-ware (COMSOL 4.2a) is used for numerical simulationin the present study, Fig. 2. The distance between thetransmitter (S1) and the receiver (S2) is 2.54 cm (1 in.).The numerical model includes a three-dimensional steelplate, which is loaded by a two-step process. In the ini-tial step, the structure is statically loaded at three levels(0, 50 and 100 MPa) to generate a stressed medium. Thesecond step consists of applying frequency domain finiteelement analysis (available in COMSOL) within a fre-quency range near perturbation frequency (i.e. centralfrequency of the excitation signal) when the structure is
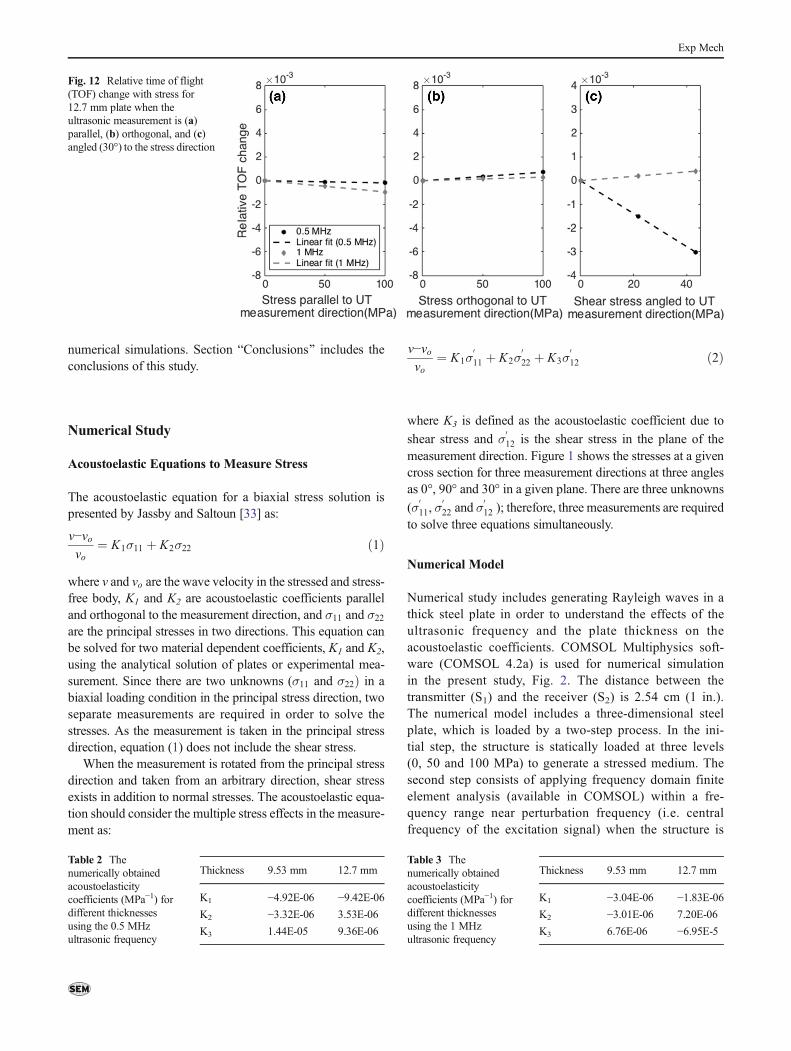
Fig. 12 Relative time of flight(TOF) change with stress for12.7 mm plate when theultrasonic measurement is (a)parallel, (b) orthogonal, and (c)angled (30°) to the stress direction
Table 2 Thenumerically obtainedacoustoelasticitycoefficients (MPa−1) fordifferent thicknessesusing the 0.5 MHzultrasonic frequency
Thickness 9.53 mm 12.7 mm
K1 −4.92E-06 −9.42E-06K2 −3.32E-06 3.53E-06
K3 1.44E-05 9.36E-06
Table 3 Thenumerically obtainedacoustoelasticitycoefficients (MPa−1) fordifferent thicknessesusing the 1 MHzultrasonic frequency
Thickness 9.53 mm 12.7 mm
K1 −3.04E-06 −1.83E-06K2 −3.01E-06 7.20E-06
K3 6.76E-06 −6.95E-5
Exp Mech
under each stress level. The direction of excitation signalis varied to obtain parallel, orthogonal, and angled mea-surements with respect to uniaxial stress direction asshown in Fig. 2. The linear and nonlinear elastic proper-ties assigned to the model are summarized in Table 1.
The purpose of the numerical simulation is to under-stand the effects of plate thickness and ultrasonic frequen-cy on the acoustoelastic coefficients. Two different platethicknesses of 9.53 and 12.7 mm (the most commonthicknesses used in steel truss highway bridges) are con-sidered. To understand the acoustoelastic coefficient andultrasonic frequency relationship, two different excitationfrequencies of 0.5 and 1 MHz are considered. Higherexcitation frequency would be influenced more by thesurface texture; lower excitation frequency would producepla te waves tha t resul t in th ickness-dependentacoustoelastic coefficients. The process consists of threemeasurement directions with a direct surface load pertur-bation in the direction of wave propagation. The receivingpoints located at three angles of 0, 30 and 90° resemblethe rosette geometry. The mesh size is gradually reducednear the wave propagation region until no significantchange in the result is observed.
In order to calculate the change in wave velocity due tostress as shown in equation (2), time delay has to bemeasured. There are various methods of time delay esti-mation in the literature, such as direct arrival time estima-tion, cross correlation, and measuring phase shift in thefrequency domain. The selection of arrival time to indi-rectly calculate wave velocity introduces higher error inmeasurement due to imprecision in determining the actualwave arrival time. However, the selection of phase shiftintroduces less error in measurement and is accordingly
used here. Piersol [47] demonstrated a method to calculatethe time delay based on the phase change in the frequencyspectrum. The shift in the phase angle in the frequencydomain can be correlated to the time delay in the timedomain data as
Δϕ fð Þ ¼ 2πfΔt ð3Þ
In order to calculated the time delay, the following equationcan be used.
Δt
to¼ Δϕ fð Þ
2π f d=v0ð4Þ
where Δtto
is the relative time delay due to the presence of
stress, d is the distance between the transmitting and receivingpoints, f is the peak frequency, andΔϕ fð Þ is the shift in phasein the frequency spectrum of the signal (corresponding to thepeak frequency).
The acoustoelastic equation is divided into three separateequations to calculate three acoustoelastic coefficients, K1, K2
and K3:
Δt1to
¼ K1σ11 þ K2σ22 ð5Þ
Δt2to
¼ K2σ11 þ K1σ22 ð6Þ
Δt3to
¼ K1σ011 þ K2σ
022 þ K3σ
012 ð7Þ
where σ011, σ
022 and σ
012 are the rotated stresses according to the
measurement direction and can be calculated using stresstransformation at θ, the selected angle direction, as shown inFig. 1:
σ011 ¼
σ11 þ σ22
2þ σ11−σ22
2cos2θ ð8Þ
σ022 ¼
σ11 þ σ22
2−σ11−σ22
2cos2θ ð9Þ
σ012 ¼ −
σ11−σ22
2sin2θ ð10Þ
Numerical Results
The variations in the phase shift corresponding to peakfrequency with different levels of stress for parallel, or-thogonal, and angled directions with respect to the uni-axial stress direction are obtained for different platethicknesses as well as different perturbation frequencies.Figure 3 and 4 show the results of frequency domainanalyses for 9.53 mm thick plate and 0.5 MHz excitationfrequency. Shifts in the peak frequency as well as phase
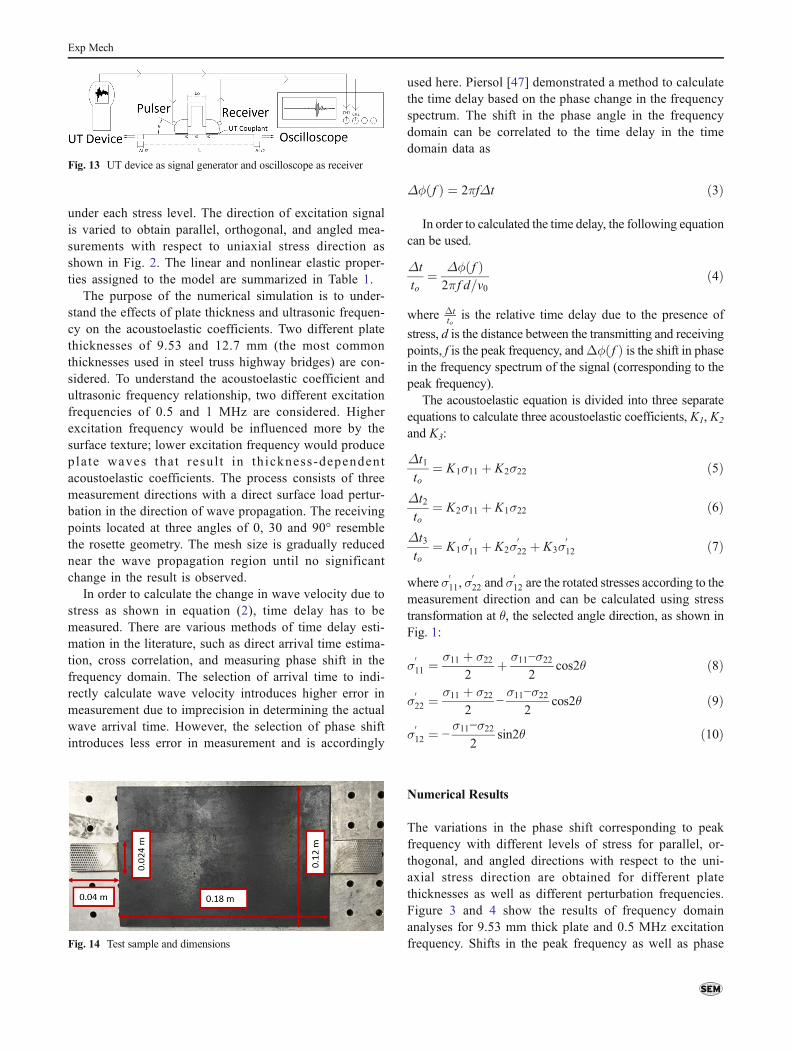
Fig. 13 UT device as signal generator and oscilloscope as receiver
Fig. 14 Test sample and dimensions
Exp Mech
angle with the presence of stress are observed. Figures 5and 6 show the similar results for 12.7 mm thick plateand support the same conclusion. The simulations arerepeated for the 1 MHz excitation frequency for twoplate thicknesses, and presented in Figs. 7, 8, 9 and 10.
Similar behaviors of phase angle shift with stress as the0.5 MHz excitation frequency are again observed.
As Fig. 2 indicates, the plate is uniaxially stressed byrestraining one side of the plate and loading the other side witha uniform stress in the x direction. When the ultrasonic
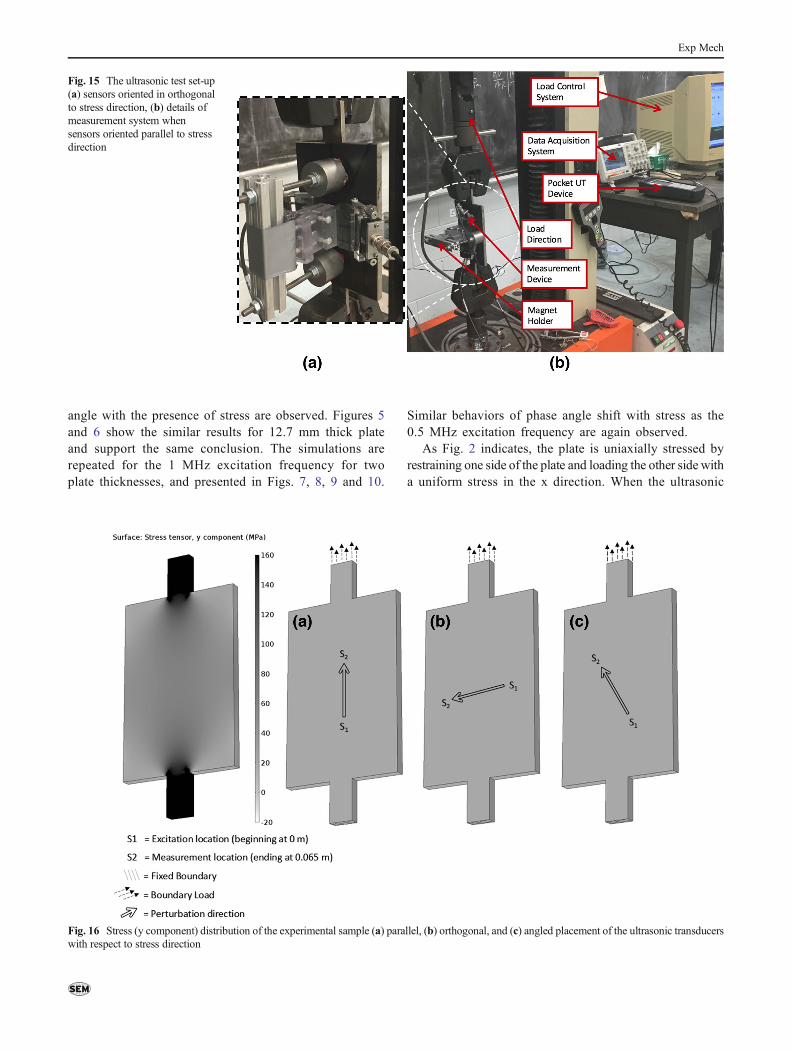
Fig. 15 The ultrasonic test set-up(a) sensors oriented in orthogonalto stress direction, (b) details ofmeasurement system whensensors oriented parallel to stressdirection
Fig. 16 Stress (y component) distribution of the experimental sample (a) parallel, (b) orthogonal, and (c) angled placement of the ultrasonic transducerswith respect to stress direction
Exp Mech
excitation is in the x direction (parallel to stress), equation (5)
is simplified as Δt1to
¼ K1σ11. When the ultrasonic excitation is
in y direction (orthogonal to stress), equation (6) is simplified
as Δt2to
¼ K2σ11. For the angled direction, both normal and
shear stresses exist. Once K1 and K2 are obtained and K3 isextracted using equation (7). The vertical axis of angled direc-
tion is calculated by Δtmeasuredt0
−K1σ′11−K2σ′
22 such that the
slope of the data results in the K3 coefficient. Figures 11 and12 show the relative TOF changes with stress for two excita-tion frequencies and 9.53 mm and 12.7 mm thick steel plates,respectively.
Tables 2 and 3 summarize the acoustoelastic coefficientsobtained using the slopes of curves shown in Figs. 11 and 12.The acoustoelastic coefficients of normal stress componentsfor the same plate thickness have similar values for two fre-quencies. However, the acoustoelastic coefficients show sig-nificant change with the plate thickness. The plate with12.7 mm thickness has acoustoelastic coefficients in agree-ment [48] with the theory for surface waves where K1 coeffi-cient has negative sign, and K2 coefficient has positive sign.When the plate thickness decreases, different wave modes
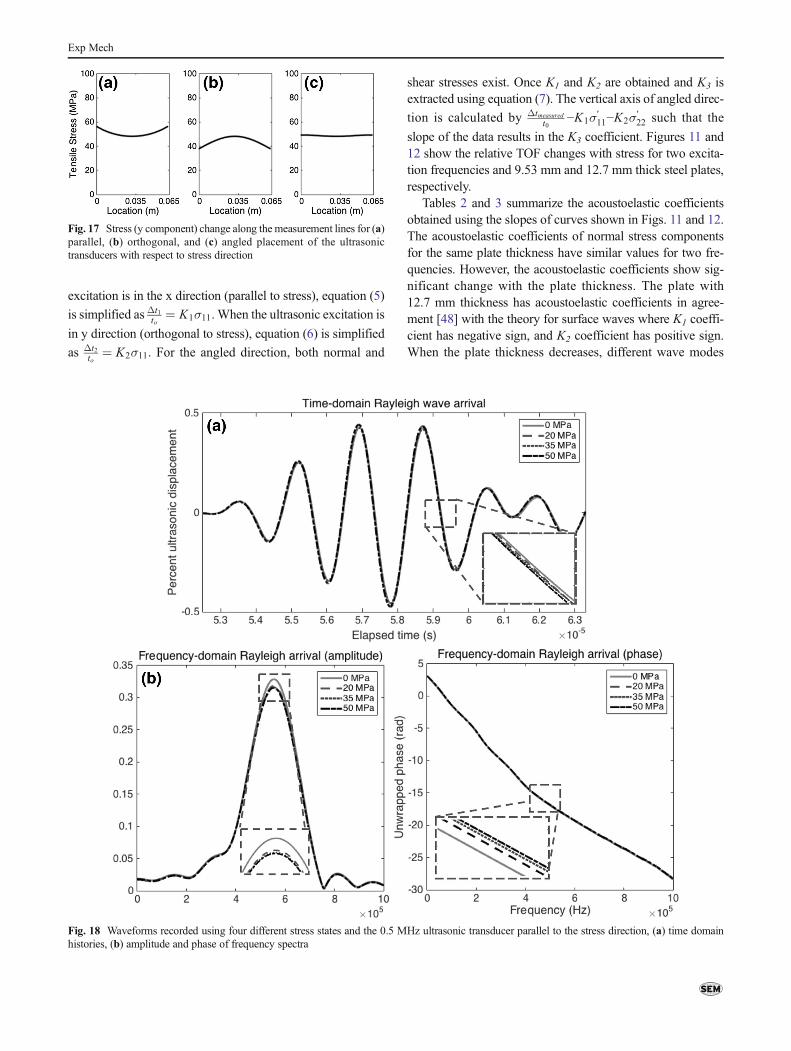
Fig. 17 Stress (y component) change along the measurement lines for (a)parallel, (b) orthogonal, and (c) angled placement of the ultrasonictransducers with respect to stress direction
Fig. 18 Waveforms recorded using four different stress states and the 0.5 MHz ultrasonic transducer parallel to the stress direction, (a) time domainhistories, (b) amplitude and phase of frequency spectra
Exp Mech

may affect the measurement and the acoustoelastic coefficient.Therefore, it is concluded that the 1MHz excitation frequencyis more suitable to measure stresses in thick plates in order toreduce the effect of plate thickness in the acoustoelasticcoefficients.
Experimental Study
Measurement Equipment
To validate the numerical results a laboratory scale test isrequired. Error in the measurement chain is investigated.The study shows major differences between the frequencyspectra of a hand-held ultrasonic device and oscilloscopemea-surement. Significant differences are observed when the hand-held ultrasonic device is utilized to record the signal [49]. Onthe other hand, an oscilloscope has more consistent results intime and frequency domains. As the oscilloscope provides
more repeatable output signals than the hand-held device, itis utilized to record ultrasonic waves in this study. Figure 13displays the layout of the measurement technique, which con-sists of two types of data acquisition systems, a hand-heldultrasonic device manufactured by Mistras Group workingas signal transmitter and a MSO2014 oscilloscopemanufactured by Tektronix as signal receiver, which has100 MHz frequency resolution.
The excitation signal is a spike signal. The piezoelectricultrasonic transducers with resonant frequencies are utilizedin through-transmissionmode, and the experiments are repeat-ed for two different frequency transducers at 0.5 MHz and1 MHz. The sensors are placed on wedges and angled at thesecond critical angle in order to generate Rayleigh surfacewaves. The wedges are bridged with a Plexiglas plate in orderto keep the distance between transducers fixed (at 6.5 cmapart) while the steel plate is elongated under loading.Figure 14 shows the specimen used, with the dimensions as18 × 12 × 0.953 cm and the material as A572 grade 50 steel
Fig. 19 Waveforms recorded using four different stress states and the 1 MHz ultrasonic transducer parallel to the stress direction, (a) time domainhistories, (b) amplitude and phase of frequency spectra
Exp Mech

plate with two 2.4 × 4 cm prongs in the middle of the width ofthe plate for connecting to the loading machine. The transduc-ers are coupled to the steel plate using oil, and held in placeusing a magnetic holder.
Experimental Procedure
The testing procedure consists of an incremental increase oftensile vertical loading from 1 to 50 kN. Ultrasonic data isrecorded at eleven evenly distributed load steps. Figure 15shows the test set-up. The ultrasonic transducers with wedgesand Plexiglas bridge as shown in Fig. 13 are oriented at threedifferent directions (parallel, orthogonal, and angled to thestress direction) similar to the numerical models. The resultingtime domain waveform is converted into the frequency do-main using a Matlab script with a windowed FFT over theRayleigh wave arrival window to calculate the phase shiftfor different directions on the plate. Using equations (5) to
(7) and the experimental results, the acoustoelasticity coeffi-cients are obtained.
Experimental Results
In order to extract the accurate stress values at the ultrasonicmeasurement location a numerical model is built usingCOMSOLMultiphysics software (COMSOL 4.2a). The exactdimensions of the plate (including the prongs) are modeled. Asimple static loading condition similar to the experiment iscarried out to get the stress values at the measurement loca-tions. Figure 16 shows the stress distribution and the locationsof the measurement lines, and Fig. 17 shows the stress varia-tion along the measurement lines for different placements ofthe ultrasonic transducers. The average stress between themeasurement points is used in order to compare the ultrasonicdata with the stress level.
The time domain waveform is transformed into the fre-quency domain. Figure 18 shows the time domain waveforms
Fig. 20 Waveforms recorded using four different stress states and the 1 MHz ultrasonic transducer orthogonal to the stress direction, (a) time domainhistories, (b) amplitude and phase of frequency spectra
Exp Mech

and their frequency spectra (amplitude and phase) at four dif-ferent load levels when the 0.5 MHz ultrasonic transducer isused parallel to the stress direction. The arrival time decreaseswhen the stress increases; the peak frequency increases whenthe stress increases as expected. Similar waveforms are ob-tained for the 1 MHz excitation frequency, and shown in
Figs. 19, 20 and 21 for three directions. It is important to notethat the ultrasonic waves penetrate through the thickness ofplate for 0.5 MHz. Therefore, the wave reflections from thebottom surface interact slightly with surface waves.
Using equations (5) to (7) and the experimental data, theacoustoelasticity coefficients are calculated. Figures 22, 23
Fig. 21 Waveforms recorded using four different stress states and the 1 MHz ultrasonic transducer angled (30°) to the stress direction, (a) time domainhistories, (b) amplitude and phase of frequency spectra
Fig. 22 Relative time of flight (TOF) change with stress using the 1MHzultrasonic transducer parallel to stress direction
Fig. 23 Relative time of flight (TOF) change with stress using the 1MHzultrasonic transducer orthogonal, to stress direction
Exp Mech

and 24 show the relative time of flight change with stress forthe parallel, orthogonal, and angled measurements using the1 MHz sensor. Two methods are used in order to calculate thearrival time variation with stress. In the first method (directmethod) the second zero crossing after the peak amplitude intime domain waveform is used as seen in Fig. 19(a) [45]. Thesecond method (indirect method) includes the arrival timeextracted from the phase data in the frequency domain usingequation (4). As shown in the figures, both methods agreewith each other. The indirect method introduces slightly bettercorrelation coefficient to calculate the acoustoelastic coeffi-cients. The calculated acoustoelastic coefficients K1, K2 andK3 for the 1 MHz excitation frequency (using the indirectmethod) are −1.14 × 10⁻⁶, −3.97 × 10⁻⁶ and 2.29 × 10⁻⁵
MPa−1, respectively. The acoustoelastic coefficients K1, K2
and K3 for the 9.53 mm thick plate and 1 MHz perturbationfrequency in the numerical study are −3.04 × 10⁻⁶, −3.01 ×10⁻⁶ and 6.76 × 10⁻⁶ MPa−1. The numerical and experimentalmethods are in good agreement.
The same procedure is repeated for the data obtained usingthe 0.5 MHz ultrasonic transducer. Figures 25, 26 and 27show the relative TOF changes of the parallel, orthogonal,and angled directions with respect to the stress direction.The acoustoelastic coefficients K1, K2 and K3 (using the indi-rect method) for the 0.5 MHz excitation frequency are mea-sured as −6.85 × 10⁻⁶, −5.68 × 10⁻⁶ and 1.66 × 10⁻⁵ MPa−1
respectively. The acoustoelastic coefficients K1, K2 and K3
for the 9.53 mm thick plate and 0.5 MHz perturbation
frequency in the numerical study are calculated as −4.92 ×10⁻⁶, −3.32 × 10⁻⁶ and 1.44 × 10⁻⁵ MPa−1. Similar to the1 MHz excitation frequency, the numerical and experimentalresults are in good agreement.
Conclusions
In this paper, the influences of plate thickness and excitationfrequency on acoustoelastic coefficients of steel material arenumerically and experimentally investigated. Theacoustoelastic equation for principal stresses is modified toadd the effect of shear stress into the measurement taken inan arbitrary angle. Numerical results are obtained in the fre-quency domain, and the change in wave velocity with stress iscalculated indirectly by measuring the change in phase angle.The numerical results show the influence of plate thicknessand excitation frequency on three acoustoelastic coefficients.When the plate thickness and the excitation frequency in-crease, the acoustoelastic coefficients are similar to the theo-retical values of the Rayleigh wave solution. For the deeperpenetration depth of the ultrasonic signal, the acoustoelasticcoefficients become thickness and excitation frequency de-pendent. The experimental data include 9.53 mm plate thick-ness and two excitation frequencies, 0.5MHz and 1MHz. Theexperimentally obtained acoustoelastic coefficients are ingood agreement with the numerical results. It is concluded
Fig. 24 Relative time of flight (TOF) change with stress using the 1MHzultrasonic transducer angled (30°) to the stress direction
Fig. 26 Relative time of flight (TOF) change with stress using the0.5 MHz ultrasonic transducer orthogonal to stress direction
Fig. 25 Relative time of flight (TOF) change with stress using the0.5 MHz ultrasonic transducer parallel to stress direction
Fig. 27 Relative time of flight (TOF) change with stress using the0.5 MHz ultrasonic transducer angled (30°) to the stress direction
Exp Mech

that the 1 MHz ultrasonic frequency is the most suitable fre-quency to reduce the effect of plate thickness on theacoustoelastic coefficients. When the ultrasonic data is mea-sured from three directions in the kind of steel typically usedin gusset plates in highway bridges, normal and shear stressescan be extracted using the acoustoelastic coefficients obtainedin this study.
Acknowledgments This investigation was supported by NationalScience Foundation Award No. 133552. The support from the sponsoris gratefully acknowledged. We acknowledge Dr. Daniel P. Bailey fordetailed copy editing and discussion of the manuscript. Any opinions,findings, and conclusions or recommendations expressed in this paperare those of the authors and do not necessarily reflect the views of theorganization acknowledged above.
References
1. Liao M, Okazaki T, Ballarini R, Schultz A, Galambos T (2011)Nonlinear finite-element analysis of critical gusset plates in the I-35W bridge in Minnesota. J Struct Eng 137(1):59–68
2. Steinzig M, Ponslet E (2003) Residual stress measurement usingthe Hole-Drillingmethod and laser speckle interferometry: PART 1.Exp Tech 27(3):43–46
3. Withers PJ, Bhadeshia HKDH (2001) Residual stress, part 1 –mea-surement techniques. J Mater Sci Technol 17:355–365
4. Prevey PS (1996) Current applications of X-ray diffraction residualstress measurement. In: Vander Voort G, Friel J (eds) Developmentsin materials characterization technologies. ASM International,Materials Park, OH, pp 103–110
5. Ruud CO (1982) A review of selected non-destructive methods forresidual stress measurement. NDT Int 15:15–23
6. Fitzpatrick ME, Fry AT, Holdway P, Kandil FA, Shakleton J,Souminen L (2005) Determination of residual stresses by x-raydiffraction, measurement good practice guide No 52. NationalPhysics Laboratory, UK
7. Wang Z, Gu Y, Wang Y (2012) A review of three magnetic NDTtechnologies. Magn Magn Mater 324:382–388
8. Rossini N, Dassisti M, Benyounis K, Olabi A (2012) Methods ofmeasuring residual stresses in components. Mater Des 35:572–588
9. Murnaghan FD (1937) Finite deformations of an elastic solid. Am JMath 59(2):235–260
10. Hughes DS, Kelly JL (1953) Second order elastic deformation ofsolids. Phys Rev 92(5):1145–1149
11. Lanza di Scalea F, Rizzo P, Seible F (2003) Stress measurement anddefect detection in steel strands by guided stress waves. J Mater CivEng 15(3):219–227
12. Chaki S, Bourse G (2009) Stress level measurement in prestressedsteel strands using acoustoelastic effect. Exp Mech 49:673–681
13. Salamone S, Bartoli I, Srivastava A, Philips R, Nucera C, ScaleaFLD (2009) Nonlinear ultrasonic guided waves for stress monitor-ing in Prestressing tendons for post-tensioned concrete structures.ASNT NDE/NDT for Highways and Bridges, New York
14. Gokhale S (2007) Determination of applied stresses in rails usingthe acoustoelastic effect of ultrasonic waves. M.SC Thesis. Texas A& M University
15. Szelazek J (2013) Sets of piezoelectric probeheads for stress eval-uation with subsurface waves. J Nondestruct Eval 32:188–199
16. Kato M, Sato T, Kameyama K, Ninoyu H (1995) Estimation of thestress distribution in metals using nonlinear acoustoelasticity. JAcoust Soc Am 98:1496–1504
17. Kino GS, Hunter JB, Johnson GC, Selfridge AR, Barnett DM,Hermann G, Steele CR (1978) Acoustoelastic imaging of stressfields. J Appl Phys 50(4):2607–2613
18. Allen DR, Sayers CM (1984) The measurement of residual stressesin textured steel using an ultrasonic velocity combinations tech-nique. J Ultrasonics 22:179–188
19. Kobayashi H, Arai Y, Ohsawa H, Nakamura H, Todoroki A (1992)Nondestructive measurement of welding residual stresses byacoustoelastic technique and prediction of fatigue crack growth.ASME J Press Vessel Technol 114:417–421
20. Leon-Salamanca T, Bray DE (1996) Residual stress measurementin steel plates and welds using critically refracted longitudinal(LCR) waves. Res Nondestruct Eval 7:169184
21. Lu H, Liu XS, Yang JG, Zhang SP, Fang HY (2008) Ultrasonicstress evaluation onwelded plates with Lcr wave. Sci TechnolWeldJoin 13:7075
22. Walaszek H, Hoblos J, Bourse G, Robin C (2002) Effect of micro-structure on ultrasonic measurements of residual stresses in weldedjoints. In: Dias AM, Pina J, Batista AC, Diogo E (eds) ECRS 6 :proceedings of the 6th European Conference on Residual Stresses,Coimbra, Portugal, 10-12 July, 2002. Mater Sci Forum, vol 404.Trans Tech Publications, Switzerland, pp 875–880
23. Uzun F, Bilge AN (2011) Immersion ultrasonic technique for in-vestigation of total welding residual stress. Procedia Eng 10:30983103
24. Fukuhara M, Kuwano Y, Saito K, Hirasawa T, Komura I (1998)Performance of nondestructive evaluation by diffracted SH ultra-sonic waves in predicting degree of fatigue in cyclic bending offerritic steel. J Nondestruct Eval Int 31:211–216
25. Berruti T, Gola MM (1996) Acoustoelastic determination of stress-es in steel using Rayleigh ultrasonic waves. In: Batros AL, GreenRE, Ruud CO (eds) Nondestructive characterization of materialsVII. Transtec Pub. Ltd, Lebanon, pp 171–178, Part 1
26. Sanderson RM, Shen YC (2010) Measurement of residual stressusing laser-generated ultrasound. J Press Vessels Pip 87:762–765
27. Kim N, Hong M (2009) Measurement of axial stress using mode-converted ultrasound. J NDT & E Int 42:164–169
28. Javadi Y, Akhlaghi M, Ahmadi Najafabadi M (2003) Using finiteelement and ultrasonic method to evaluate welding longitudinalresidual stress through the thickness in austenitic stainless steelplates. J Mater Des 45:628–642
29. Todaro ME, Capsimalis GP (1986) Acoustoelastic effect forRayleigh surface waves in the presence of a non-uniform stressfield. Proc IEEE Ultrason Symp 1:229232
30. Deputat J (1990) Application of acoustoelastic effect in measure-ments of residual stresses. Arch Acoust 15(1-2):69–92
31. Sgalla M, Vangi D (2003) A device for measuring the velocity ofultrasonic waves: an application to stress analysis. J Exp Mech44(1):85–90
32. Buenos AA, Pereira P Jr, Mei PR, dos Santos AA (2014) Influenceof grain size on the propagation of LCRwaves in low carbon steel. JNondestruct Eval 33:562–570
33. Jassby K, Saltoun D (1982) Use of ultrasonic Rayleigh waves forthe measurement of applied biaxial surface stresses in aluminum2024-T351 alloy. J Mater Eval 40(2):198–205
34. Husson D, Bennett SD, Kino GS (1982)Measurement of surfacestresses using Rayleigh waves. IEEE, San Diego, pp 889–892.doi:10.1109/ULTSYM.1982.197962
35. Vangi D (2001) Stress evaluation by pulse-echo ultrasonic longitu-dinal wave. J Exp Mech 41:277–281
36. DuquennoyM, OuaftouhM, OurakM (1999) Ultrasonic evaluationof stresses in orthotropic materials using Rayleigh waves. J NDT&E Int 32:189–199
37. Akhshik S, Moharrami R (2009) Improvement in accuracy of themeasurement of residual stress Due to circumferential welds in thin-
Exp Mech

walled pipe using Rayleigh wave method. J Nucl Eng Des 239(10):2201–2208
38. Hu E, He Y, Chen Y (2009) Experimental study on the surfacestress measurement with Rayleigh wave detection technique. JAppl Acoust 70:356–360
39. Gandhi N (2010) Determination of dispersion curves foracoustoelastic lamb wave propagation, M.SC. Thesis. GeorgiaInstitute of Technology University
40. Rogerson GA, Sandiford KJ (1999) Harmonic wave propagationalong a non-principal direction in a pre-stressed elastic plate. J EngSci 37:1663–1691
41. Destrade M, Ogden RW (2005) Surface waves in a stretched andsheared incompressible elastic material. J Non-Linear Mech 40:241–253
42. Destrade M, Otténio M, Pichugin AV, Rogerson GA (2005) Non-principal surface waves in deformed incompressible materials. JEng Sci 43:1092–1106
43. Connor P, Ogden RW (1995) The effect of shear on the propagationof elastic surface waves. J Eng Sci 33(7):973–982
44. Connor P, Ogden RW (1996) The influence of shear strain andhydrostatic stress on stability and elastic waves in a layer. J EngSci 34(4):375–397
45. Shi F, Michaels JE, Lee SJ (2012) In situ estimation of appliedbiaxial loads with lamb waves. J Acoust Soc Am 133(2):677–687
46. Egle DM, Bray DE (1976) Measurement of acoustoelastic andthird-order elastic constants for rail steel. J Acoust Soc Am 60(3):741–744
47. Piersol AG (1981) Time delay estimation using phase data. J IEEETrans Acoust 29(3):471–477
48. Makhort FG, Gushcha OI, Chernoochenko AA (1990) Theory ofacoustoelasticity of Rayleigh surface waves. J Int ApplMech 26(4):346–350
49. Abbasi Z, Cunningham M, Ozevin O (2015) The quantification oferrors in the measurement of nonlinear ultrasonics. SAEConference, Michigan
Exp Mech