Embed Size (px)
Citation preview
Journal of Conoid and Interface Science 216, 303-308 (1999) @Article m jcis.I999.6322. available online at http://www.idea1ibrary.com on IDE ~l
Acoustic Spectroscopy for Characterizing Heptane/H2O/ AOTReverse Microemulsions
Thomas H. Wines,. Andrei S. Dukhin, t and Poniseril Somasundaran*
.Colwnbia University. //40 Amsterdam Avenue. New York, New York /0027; and tDisper.fian Technology Inc,3 Hillside Avenue. Mt Kisco. New York 10549
Acoustic spectroscopy was used to monitor the droplet sizedistribution in a classic three component system of heptane, water,and aerosol-OT (AOT). The size of the reverse microemulsiondrops was varied by changing the molar ratio of water to AOTsurfactant. The acoustic results for this transparent microemulsionwere found to be in close agreement with literature results ob-tained with small angle neutron scattering and small angle X-rayscattering. The system was investigated well into the turbid regionwhere microemulsion changes to macroemulsion. The droplet sizedistribution was found to shift to a bimodal form due to thistransition. C 1999 Academic Pnss
Key Words: acoustic; microemulsion; reverse, Aerosol-OT; AOT;heptane; SANS; SAXS; PSD.
INTRODUCTION
Received January 8. 1999
The mixture of heptane with water and AOT is a classicthree component system. It has been widely studied due to anumber of interesting features it exhibits. This system formsstable reverse microemulsions (water in oil) without the com-plication introduced by an additional cosurfactant. Such acosurfactant (usually alcohol) is required by many other re-verse microemulsion systems. This simplification makes thealkane/water/AOT system a model for studying reverse micro-emulsions.
There have been many studies devoted to the characteriza-tion of these practically important systems. Reverse emulsiondroplets have been used as chemical microreactors to producenano-sized inorganic and polymer particles with special prop-erties that are not found in the bulk form (1-5). These micro-emulsion systems have also been a topic of research for bio-logical systems and the AOT head groups have been found toinfluence the conformation of proteins and increase enzymeactivity (6-9). The unique environment created in the smallwater pools of swollen reverse micelles allows for increasedchemical reactivity. The increase in surface area with thedecrease in size of the droplets also can significantly increasereactivity by allowing greater contact of immiscible reactants.
There have been many attempts to measure the droplet sizeof this microemulsion. Several different techniques were used:
Acoustic Spectroscopy
Acoustic spectroscopy offers a new opportunity for charac-terizing these complicated systems. This technique has theadvantage of being applicable to turbid emulsions where othermethods such as light scattering will not work. Dilution of suchsystems can indeed alter their physical properties. Acousticspectroscopy is also sensitive enough for characterizing poly-dispersity. There have been many successful application of thistechnique to regular emulsions (24-27). However, acousticcharacterization of rnicroemulsions for drop size and polydis-persity has not been reported.
303 0021-9797199 $30.00Copyright C 1999 by Academk Press
All righls of reproductj(K\ in any (onn reserved.
; accepted May 19, 1999
PCS (10-15), classic light scattering (12, 14, 16), SANS (17-19), SAXS (II, 20, 21), ultracentrifugation (9, 13, 16), andviscosity (II, 12, 14). It was observed that the heptane/waterlAOT microemulsions have water pools with diameters rangingfrom two nanometers up to thirty nanometers. The water dropsare encapsulated by the AOT surfactant so that virtually all ofthe AOT is located at the interface shell. The size of the waterdroplets can be conveniently altered by adjusting the molarratios of water to surfactant designated as R ([H20)1 [AOT]).At low R values (R S 10) the water is strongly bound to theAOT surfactant polar head groups and exhibits unique charac-teristics different from bulk water (16). At higher water ratios,(R > 20), free water is predominant in the swollen reversemicellular solutions, and at approximately R = 60, the systemundergoes a transition from a transparent microemulsion intoan unstable turbid macroemulsion. This macroemulsion sepa-rates on standing into a clear upper phase and a turbid lowerphase.
The increase in droplet size and phase boundary can also beachieved by raising the temperature up to a critical temperatureof 55°C. In addition this system has been found to exhibit anelectrical percolation threshold whereby the conductivity in-creases by several orders of magnitude by either varying the Rratio or increasing the temperature (19, 20, 22, 23). Despite allthese efforts, there still remain questions regarding the poly-dispersity of the water droplets, and few studies are availableabove the R value of 60 where a turbid macroemulsion stateexists.
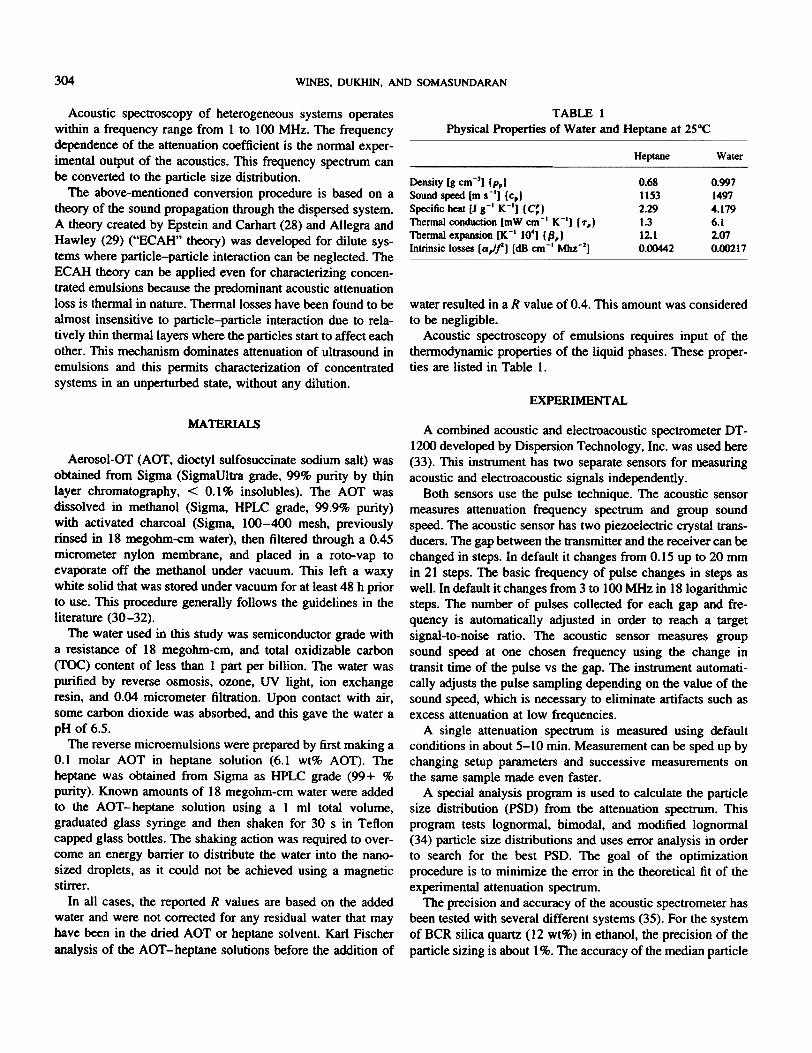
304 WINES, DUKHIN, AND SOMASUNDARAN
TABLE 1Physical Properties of Water and Heptane at 25°C
Heptane Water
0.6811532.291.312.10.00442
0.99714974.1796.12.070.00217
Acoustic spectroscopy of heterogeneous systems operateswithin a frequency range from I to I ()() MHz. The frequencydependence of the attenuation coefficient is the normal exper-imental output of the acoustics. This frequency spectrum canbe converted to the particle size distribution.
The above-mentioned conversion procedure is based on atheory of the sound propagation through the dispersed system.A theory created by Epstein and Carhart (28) and Allegra andHawley (29) ("ECAH" theory) was developed for dilute sys-tems where particle-particle interaction can be neglected. TheECAH theory can be applied even for characterizing concen-trated emulsions because the predominant acoustic attenuationloss is thermal in nature. Thermal losses have been found to bealmost insensitive to particle-particle interaction due to rela-tively thin thermal layers where the particles start to affect eachother. This mechanism dominates attenuation of ultrasound inemulsions and this permits characterization of concentratedsystems in an unperturbed state, without any dilution.
Density [g cm-'] Ipp)Sound speed [m S-I] Ic,)Specific heat [J I-i K-'] I C:)Thennal conduction [roW cm-1 K-1j IT,)Thennal expansioo [K-1 10'] I~,)Intrinsic losses [a/f) [dB cm-1 Mhz-2]
water resulted in a R value of 0.4. This amount was consideredto be negligible.
Acoustic spectroscopy of emulsions requires input of thethermodynamic properties of the liquid phases. These proper-ties are listed in Table 1.
EXPERIMENTAL
MATERIALS
Aerosol-OT (AOT, dioctyl sulfosuccinate sodium salt) wasobtained from Sigma (Sigmallib'a grade, 99% purity by thinlayer chromatography, < 0.1% insolubles). The AOT wasdissolved in methanol (Sigma, HPLC grade, 99.9% purity)with activated charcoal (Sigma, 100-400 mesh, previouslyrinsed in 18 megohm-cm water), then filtered through a 0.45micrometer nylon membrane, and placed in a roto-vap toevaporate off the methanol under vacuum. This left a waxywhite solid that was stored under vacuum for at least 48 h priorto use. This procedure generally follows the guidelines in theliterature (30-32).
The water used in this study was semiconductor grade witha resistance of 18 megohm-cm, and total oxidizable carbon(TOC) content of less than 1 part per billion. The water waspurified by reverse osmosis, ozone, UV light, ion exchangeresin, and 0.04 micrometer filtration. Upon contact with air,some carbon dioxide was absorbed, and this gave the water apH of 6.5.
The reverse microemulsions were prepared by first making a0.1 molar AOT in heptane solution (6.1 wt% AOT). Theheptane was obtained from Sigma as HPLC grade (99 + %purity). Known amounts of 18 megohm-cm water were addedto the AOT-heptane solution using a 1 ml total volume,graduated glass syringe and then shaken for 30 s in Tefloncapped glass bottles. The shaking action was required to over-come an energy barrier to distribute the water into the nano-sized droplets, as it could not be achieved using a magneticstirrer.
In all cases, the reported R values are based on the addedwater and were not corrected for any residual water that mayhave been in the dried AOT or heptane solvent. Karl Fischeranalysis of the AOT - heptane solutions before the addition of
A combined acoustic and electroacoustic spectrometer DT-1200 developed by Dispersion Technology, Inc. was used here(33). This instrument has two separate sensors for measuringacoustic and e1ectroacoustic signals independently.
Both sensors use the pulse technique. The acoustic sensormeasures attenuation frequency spectrum and group soundspeed. The acoustic sensor has two piezoelectric crystal trans-ducers. The gap between the transmitter and the receiver can bechanged in steps. In default it changes from 0.15 up to 20 mmin 21 steps. The basic frequency of pulse changes in steps aswell. In default it changes from 3 to 100 MHz in 18 logarithmicsteps. The number of pulses collected for each gap and fre-quency is automatically adjusted in order to reach a targetsignal-to-noise ratio. The acoustic sensor measures groupsound speed at one chosen frequency using the change intransit time of the pulse vs the gap. The instrument automati-cally adjusts the pulse sampling depending on the value of thesound speed, which is necessary to eliminate artifacts such asexcess attenuation at low frequencies.
A single attenuation spectrum is measured using defaultconditions in about 5-10 min. Measurement can be sped up bychanging setup parameters and successive measurements onthe same sample made even faster.
A special analysis program is used to calculate the particlesize distribution (PSD) from the attenuation spectrum. Thisprogram tests lognormal, bimodal, and modified lognormal(34) particle size distributions and uses error analysis in orderto search for the best PSD. The goal of the optimizationprocedure is to minimize the error in the theoretical fit of theexperimental attenuation spectrum.
The precision and accuracy of the acoustic spectrometer hasbeen tested with several different systems (35). For the systemof BCR silica quartz (12 wt%) in ethanol, the precision of theparticle sizing is about I %. The accuracy of the median particle
305HEPTANFlH,O/AOT REVERSE MICROEMULSIONS
-$-R=80-4- R=60
-+-R.=50-f-R.=40-4-R.=JO-.- R.=ZO~ R.=10-$- R.--o-e- heptane--- R.--70-e- R=70-.&-R.=60
-+-~-M- R.=40-+-R.=JO
R.=20R.= 1 0
-.- water
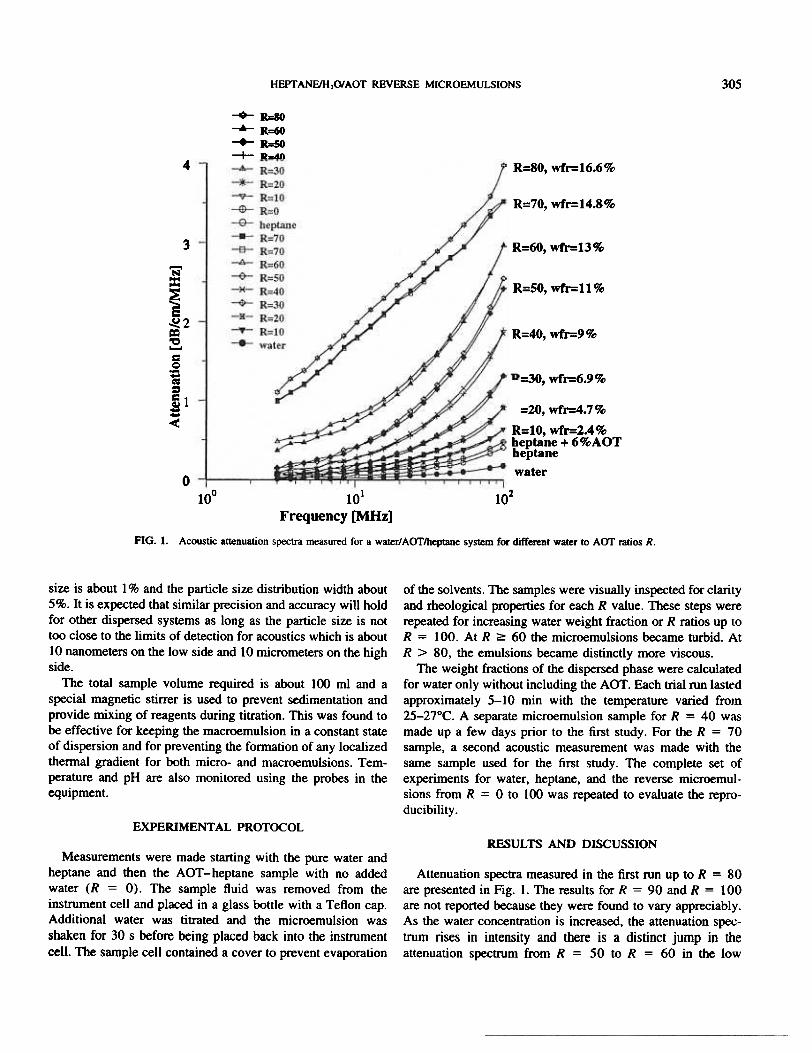
4 / R=80, wfr=16.6%
R=70, wfr=14.8%
3 R=60, wfr=13%
'N==
~~2~=0i=
it--<
R=50, wfr=ll %
R=40,wfr=9%
." &,=30, wfr=6.9%/~.../
~
~~ R=20, wfr=4.7%
R=10, wfr=2.4%~~~~:~::~ -- ~ heptane + 6%AOTheptanewater
.::-
010° 101 102
Frequency [MHz]
FIG. 1. Acoustic attenuation spectra mea...ured for a water/AOT/heptane system for different water to AOT ratios R.
of the solvents. The samples were visually inspected for clarityand rheological properties for each R value. These steps wererepeated for increasing water weight fraction or R ratios up toR = 100. At R ~ 60 the microemulsions became turbid. At
R > 80, the emulsions became distinctly more viscous.The weight fractions of the dispersed phase were calculated
for water only without including the AOT. Each trial run lastedapproximately 5-10 min with the temperature varied from25-27°C. A separate microemulsion sample for R = 40 wasmade up a few days prior to the first study. For the R = 70
sample, a second acoustic measurement was made with thesame sample used for the first study. The complete set ofexperiments for water, heptane, and the reverse microemul-sions from R = 0 to 100 was repeated to evaluate the repro-ducibility .
size is about I % and the particle size distribution width about5%. It is expected that similar precision and accuracy will holdfor other dispersed systems as long as the particle size is nottoo close to the limits of detection for acoustics which is about10 nanometers on the low side and 10 micrometers on the highside.
The total sample volume required is about 100 m1 and aspecial magnetic stirrer is used to prevent sedimentation andprovide mixing of reagents during titration. This was found tobe effective for keeping the macroemulsion in a constant stateof dispersion and for preventing the formation of any localizedthermal gradient for both micro- and macroemulsions. Tem-perature and pH are also monitored using the probes in theequipment.
EXPERIMENTAL PROTOCOLRESULTS AND DISCUSSION
Measurements were made starting with the pure water andheptane and then the AOT-heptane sample with no addedwater (R = 0). The sample fluid was removed from theinstrument cell and placed in a glass bottle with a Teflon cap.Additional water was titrated and the rnicroemulsion wasshaken for 30 s before being placed back into the instrumentcell. The sample cell contained a cover to prevent evaporation
Attenuation spectra measured in the first run up to R = 80are presented in Fig. I. The results for R = 90 and R = 100are not reported because they were found to vary appreciably.As the water concentration is increased, the attenuation spec-trum rises in intensity and there is a distinct jump in theattenuation spectrum from R = 50 to R = 60 in the low
306 WINES. DUKHIN. AND SOMASUNDARAN
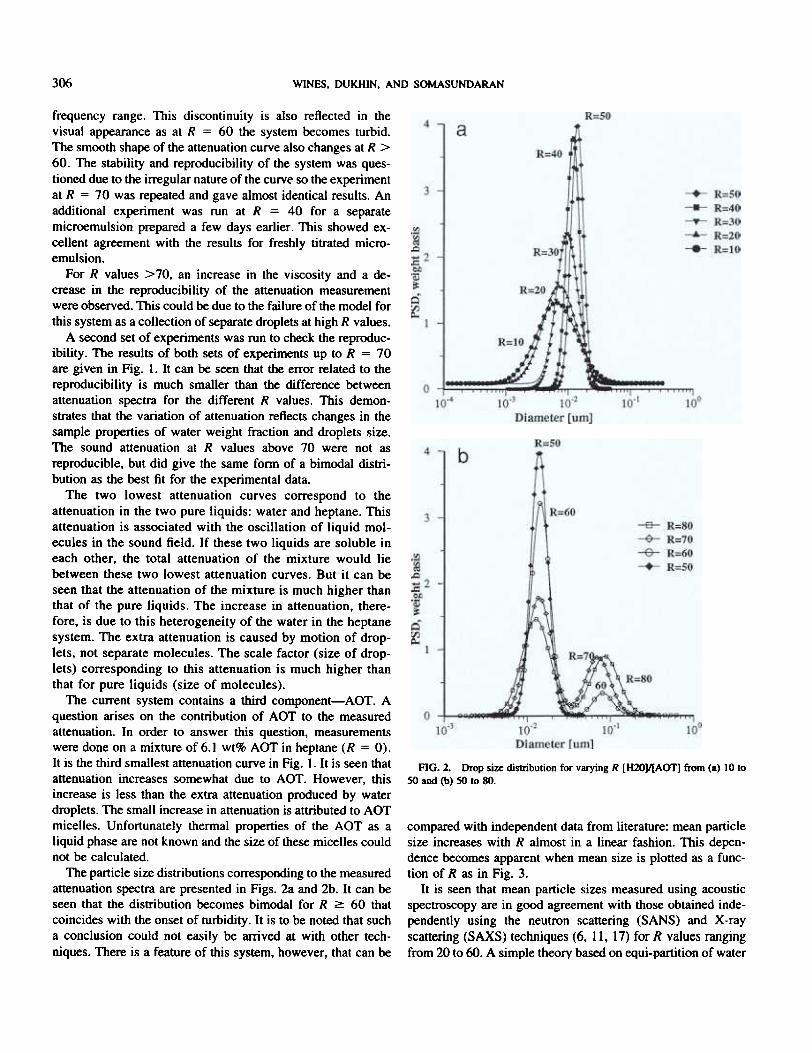
FIG. 2. Drop size distribution for varying R [H20]/[AOT] from (a) 10 to50 and (b) 50 to SO.
frequency range. This discontinuity is also reflected in thevisual appearance as at R = 60 the system becomes turbid.
The smooth shape of the attenuation curve also changes at R >60. The stability and reproducibility of the system was ques-tioned due to the irregular nature of the curve so the experimentat R = 70 was repeated and gave almost identical results. Anadditional experiment was run at R = 40 for a separate
microemulsion prepared a few days earlier. This showed ex-cellent agreement with the results for freshly titrated micro-emulsion.
For R values> 70, an increase in the viscosity and a de-crease in the reproducibility of the attenuation measurementwere observed. This could be due to the failure of the model forthis system as a collection of separate droplets at high R values.
A second set of experiments was run to check the reproduc-ibility. The results of both sets of experiments up to R = 70
are given in Fig. I. It can be seen that the error related to thereproducibility is much smaller than the difference betweenattenuation spectra for the different R values. This demon-strates that the variation of attenuation reflects changes in thesample properties of water weight fraction and droplets size.The sound attenuation at R values above 70 were not asreproducible, but did give the same form of a bimodal distri-bution as the best fit for the experimental data.
The two lowest attenuation curves correspond to theattenuation in the two pure liquids: water and heptane. Thisattenuation is associated with the oscillation of liquid mol-ecules in the sound field. If these two liquids are soluble ineach other, the total attenuation of the mixture would liebetween these two lowest attenuation curves. But it can beseen that the attenuation of the mixture is much higher thanthat of the pure liquids. The increase in attenuation, there-fore, is due to this heterogeneity of the water in the heptanesystem. The extra attenuation is caused by motion of drop-lets, not separate molecules. The scale factor (size of drop-lets) corresponding to this attenuation is much higher thanthat for pure liquids (size of molecules).
The current system contains a third component-AOT. Aquestion arises on the contribution of AOT to the measuredattenuation. In order to answer this question, measurementswere done on a mixture of6.1 wt% AOT in heptane (R = 0).
It is the third smallest attenuation curve in Fig. I. It is seen thatattenuation increases somewhat due to AOT. However, thisincrease is less than the extra attenuation produced by waterdroplets. The small increase in attenuation is attributed to AOTmicelles. Unfortunately thermal properties of the AOT as aliquid phase are not known and the size of these micelles couldnot be calculated.
The particle size distributions corresponding to the measuredattenuation spectra are presented in Figs. 2a and 2b. It can beseen that the distribution becomes bimodal for R ~ 60 thatcoincides with the onset of turbidity. It is to be noted that sucha conclusion could not easily be arrived at with other tech-niques. There is a feature of this system, however, that can be
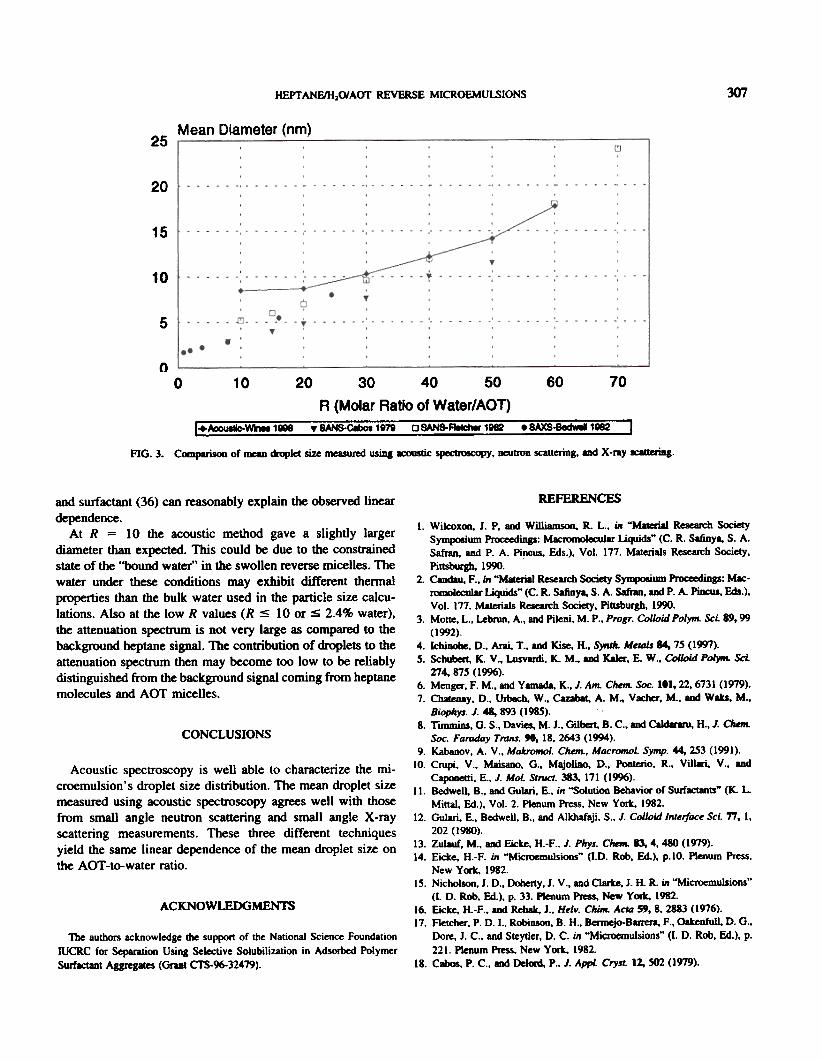
compared with independent data from literature: mean particlesize increases with R almost in a linear fashion. This depen-dence becomes apparent when mean size is plotted as a func-tion of R as in Fig. 3.
It is seen that mean particle sizes measured using acousticspectroscopy are in good agreement with those obtained inde-pendently using the neutron scattering (SANS) and X-rayscattering (SAXS) techniques (6, II, 17) for R values rangingfrom 20 to 60. A simple theory based on eQui-partition of water
307HEPTANFJHzO/AOT REVERSE MlCROEMULSIONS
Mean Diameter (nm)25
20
15
10
5
00 10 20 30 40 50 60 70
R (Molar Ratio of Water/ACT)I+~.~ 1908 . SNIIS-C8b08 1m [J SANSoFletdw 1- . ~ 1- I
FIG. 3. ComP8rison of IM8D droplet m measured usiD3 ~ s~. ~bon scattering. and X-ray 1CaItaiDg.
REFERENCESand surfactant (36) can reasonably explain the observed linear
dependence.At R = 10 the acoustic method gave a slightly larger
diameter than expected. This could be due to the constrainedstate of the "bound water" in the swollen reverse micelles. Thewater under these conditions may exhibit different thermalproperties than the bulk water used in the particle size calcu-lations. Also at the low R values (R :S 10 or S 2.4% water),the attenuation spectrum is not very large as compared to thebackground heptane signal. The contribution of droplets to theattenuation spectrum then may become too low to be reliablydistinguished from the background signal coming from heptanemolecules and AOT micelles.
CONCLUSIONS
Acoustic spectroscopy is well able to characterize the mi-croemulsion's droplet size distribution. The mean droplet sizemeasured using acoustic spectroscopy agrees well with thosefrom small angle neutron scattering and small angle X-rayscattering measurements. These three different techniquesyield the same linear dependence of the mean droplet size onthe AOT -to-water ratio.
A CKNO WLEDG MENTS
The authors acknowledge the support of the National Science FoundationIUCRC for Separation Using Selective Solubilization in Adsorbed PolymerSurf8Ctant Aggregates (Grant crs-96-32419).
I. Wikoxon, J. p, and Williamson. R. L., ill "Material Research SocietySymposium Proceedinp: MacroDM>lecular Liquids" (C. R. Safinya. S. A.Safran. and P. A. Pincus. Eds.), Vol. 177. Materials Resean:h Society,Pittsburgh. 1990.
2. CaIJdau. F., ill "MMerial Research Society S~um ~: Mac-romolecular Liquids" (C. R. Safinya. S. A. Safran. and P. A. PiIx:Us. Eds.),Vol. l77. Materials Research Society, Pittsburgh, 1990.
3. Motte, L., Lebrun, A., and Pileni, M. P., Progr. Colloid Po/YIII. ScL 89,99
(1992).4. khinohe, D., Ani. T.. IIMI Kise, H~ SyratII. MetDls 84, 75 (1m).5. Schubert. K. V.. Lusvlrdi, K. M.. and Kaler, E. W.. Colloid Pol)WI. sa.
274, 875 (1996).6. Menger, F. M.. and Yamada. K.. J. Alii. Chelll. Soc. 101,22.6731 (1979).7. Charenay, D., Urbach. W., CaDb8t. A. M.. Vacher. M., and Wits, M..
BiophYs. J. 41, 893 (1985).8. Timmins, G. S.. Davies. M. J., Gilbert. B. C..IIMI Caldar8rU. 8.. J. CMrIL
Soc. Faraday Trans. 90, 18,2643 (1994).9. Kabanov, A. V., Makromo/. Chelll., Macronwl. Symp. 44, 253 (1991).
10. Crupi, V.. Maisano, G., Majolino. D., Pooterio, R.. Villari, V ~ andCaponeui. E., J. Mol. Stnlct. 383. 171 (1996).
II. Bedwell. B.. am Gulari, E., in "Solution Behavirx of Swfactants" (K. L.Mittal. Ed.), Vol. 2. Plenum Press. New York:, 1982.
12. Gulari, E., Bedwell. B., am Alkhafaji. S., J. Colloid Interface ScL 77, I,202 (1980).
13. Zulauf. M., am Eicke, H.-F.. J. Phys. Chern. 13, 4, 480 (1979).14. Eicte, H.-F. ill "Microemulsioos" (I.D. Rob. Ed.). p.IO. Plenum Press,
New York. 1982.15. Nicholson. J. D.. Doherty, J. V.. and Clute. J. H. R. ill "Microemulsions"
(L D. Rob. Ed.). p. 33. Plenum Press. New York, 1982.16. Eicke, H.-F.. IIMI Rehak. J.. He/v. Chilli. Acto 59, 8. 2883 (1976).17. Fletcher, P. D. L, Robinson. B. H., Bemlejo-Banera. P., Oakenfull. D. G..
Dore, J. C., and Steytler, D. C. in "Microemulsions" (I. D. Rob, fA.), p.221. Plenum Press. New York:, 1982.
18. ~ P. C., am Delcxd. P.. J. AppL Cryst. 12, SO2 (1979).
308 WINES. DUKHIN. AND SOMASUNDARAN
19. Radiman, S., Fountain, L. E., Toprakcioglu, C., de Vallera. A., andChieux, P., Progr. Colloid Po/JIll. Sci. 81,54(1990).
20. Huruguen, 1. P., Zemb, T., and Pileni, M. P., Progr. Colloid Po/ym. Sci.89,39 (1992).
21. Pileni, M. P., Zemb, T., and Petit, C., Chem. Phys. Len. 118,4,414 (1985).22. Sager, W., Sun, W., and Eicke, H.-F., Progr. Colloid Po/ym. Sci. 89,284
(1992) 284.23. Safran, S. A., Grest, G. S., and Bug, A. L. R. in "Microemulsion Systems"
(H. L. Rosano and M. Clause, Eds.), p. 235. Man:el Dekker, New York,1987.
24. Dukhin, A. S., and Goetz. P. 1., Langmuir 12, 21, 4998 (1996).25. McClernents, 1. D., Co/loids Sulj: 90,25 (1994).26. McClements, 1. D., Adv. Colloid /nleiface Sci. 37, 33 (1991).27. Dukhin, A. S., and Goetz, P. 1., Langmuir 12, 19,4334 (1996).28. Epstein, P. S., and Carhart, R. R.. J. Acoust. Soc. Am. 25,3,553 (1953).
29. Allegra. J. R.. and Hawley. S. A.. J. Acou.vt. Soc. Am. 51, 1545 (1972).30. :lJIou. z.. Hilfiker. R.. and Eicke. H.-F.. Progr. Colloid Polyrn. Sci. 89,66
(1992).31. K()()archyk. M.. Chen. S.-H.. Huang J. S.. and Kim. M. W.. Phys. Rev. A
29,4.2054(1984).32. Kitahara. A.. Kobayashi. T.. and Tachibana, T.. J. Phys. Chern. 66, 363
(1962).33. Dukhin. A. S.. and Goetz. P. J.. US Patent. Pending.34. Irani. R. R.. and Callis. C. F.. "Particle Size: Measurement. Interpretation
and Application." Wiley. New York:. 1971.35. Dukhin. A. S.. and Goetz. P. J.. in "Handbook of Ultrasonic and
Dielectric Characterization Techniques for Suspended Particles" (V. A.Hackley and J. Texter. Eds.). p. 77. American Ceramic Society. West-erville. 1998.
36. Oakenfun. D.. J. Chern. Soc. Faraday 176, 1875 (1980).


![Index [lib3.dss.go.th]lib3.dss.go.th/fulltext/index/663-665/664.117non.pdfIndex. A AAS. See Atomic-absorption spectroscopy Acoustic impedance, 50-51 Acoustic spectrometer, low frequency,](https://img.pdfslide.us/doc/110x75/5afb657a7f8b9a2d5d8f8c54/index-lib3dssgothlib3dssgothfulltextindex663-665664-a-aas-see-atomic-absorption.jpg)