Embed Size (px)
Citation preview
Journal of Voice Vol. 4, No. 3, pp. 213-219 © 1990 Raven Press, Ltd., New York
Acoustic Representation of Speaking-Voice Quality
F. Klingholz
Department of Phoniatrics, University of Munich, Munich, Federal Republic of Germany
Summary: This study describes an acoustic technique to establish a three- dimensional representation of voice features. These "voice prints" are created by statistical analysis of running speech signals using the measured distribu- tions of fundamental frequency (Fo), voice sound pressure level (SPL), and voice purity, as expressed by the signal-to-noise ratio (SNR). The technique is demonstrated by illustrative examples of the Fo-SPL-SNR distribution. This manner of representing voice quality is compared to other available tech- niques. Key Words: Dysphonia--Acoustic analysis--Signal statistics-- Running speech--Voice quality.
The nature of equipment applied in the diagnos- tics of laryngeal disorders are mainly based on methods also used without instrumental tools--the phoniatrican listens to the voice (acoustic devices) and the phoniatrican observes the larynx (optic de- vices). Practicality, cost, and expenditure of time determine the equipment and its utilization. For in- stance, in optic techniques, apart from laryngosco- py, laryngostroboscopy instead of high-speed pic- turizing has been successfully applied for the obser- vation of vocal fold oscillation.
To evaluate voice by means of an acoustic pro- cedure, one is faced with an immense variety of methods. Questions arise whether the analysis should be based on sustained vowels or running speech and what should be measured: fundamental frequency, sound pressure, perturbation, or spec- tral characteristic of the voice. This article presents a method for application in the phoniatric practice where a global representation of the acoustics of the speaking voice is required.
Voice features are ext rac ted from running speech, thus avoiding numerous drawbacks in- volved with the utilization of sustained vowels. First, the measurement of sustained vowels is more appropriate to singing rather than speaking. Pertur-
Address correspondence and reprint requests to Dr. F. Kling- holz at Department of Phoniatrics, University of Munich, Pet- tenkoferstr. 4a, 8000 Munich 2, Federal Republic of Germany.
bation degree and spectral characteristic of vowels are strongly dependent on fundamental frequency (Fo) and sound pressure. Patients with highly per- turbated speaking voice are often able to produce clear vowels within small ranges of pitch and inten- sity. These arguments, however, are less relevant for an analysis of running speech, the acoustic fea- tures of which provide more adequate description of voice pathology.
Apart from some few studies in which certain de- terministic features were extracted from the speech signal (1,2), in an analysis of running speech, tem- porally successive values of a speech wave variable are sampled and are represented in a distribution. Voice is usually characterized by F 0, intensity (am- plitude), and spectral characteristic, whereby the respective distributions are those of F o (or related variables such as period), amplitude density, and spectral partials [long-term average spectrum (LTAS)]. Spectral characteristic does not explicitly include perturbation effects of the voice. Therefore, the distribution of a perturbation measure should also be taken into consideration. Prior to construct- ing the proposed method, these distributions must be described and evaluated.
DISTRIBUTION
Most methods of the Fo measurement are suitable for assessing the distribution of the F o in the speech
213

214 F. KLINGHOLZ
signal. Hess (3) has presented an excellent review of these methods. Several authors (1,4-8) have ver- ified that this distribution reflects pathological voice conditions. Figure 1 shows examples of this distri- bution. The advantage of this distribution is that it includes both the mean speaking frequency and the range of frequency variation.
AMPLITUDE DENSITY DISTRIBUTION
Measurement of the amplitude density is gener- ally performed on the envelope of the speech signal. This envelope can be obtained either by lowpass filtering the speech wave (short-term envelope) or by the construction of the complex analytic signal (instantaneous envelope), where the real part is rep- resented by the original input signal and the imagi- nary part by its Hilbert-transform. As Weiss (9) has demonstrated for differences between normal and whispered speech, it is to be expected that this dis- tribution would also reflect pathological voice con- dition. Examples are demonstrated in Fig. 2. The form factor (rms amplitude to average absolute am- plitude) can be used to characterize the distribution.
LONG-TERM AVERAGE SPECTRUM
Determination of the LTAS requires measure- ments over very long signal lengths. This can be managed by a parallel filter set. However, the uti- lization of FFT-algorithms limits signal lengths to an order of magnitude of 100 ms. In this case, sev- eral spectra must be averaged, which means that such a spectrum is no longer a true LTAS, but a summation spectrum. Nevertheless, both types of LTAS have been used to indicate laryngeal pathol- ogy (10-16). Figure 3 demonstrates examples of LTAS. There are some drawbacks that restrain its utilization in the presented method: (a) Although distributions of F 0 and amplitude density are one-
dimensional, the LTAS represents several variables of the signal; i.e., it includes the distribution of the voice fundamental as well as those of harmonics and noise. (b) Apart from laryngeal features, the LTAS is also determined by the individual vocal tract characteristic (for this reason, the LTAS can also be used in speaker recognition). (c) Laryngeal features can be masked by articulatory behavior. (d) The purity of voice is preferable to spectral char- acteristic with respect to pathologic laryngeal con- ditions.
DISTRIBUTION OF PERTURBATION MEASURE
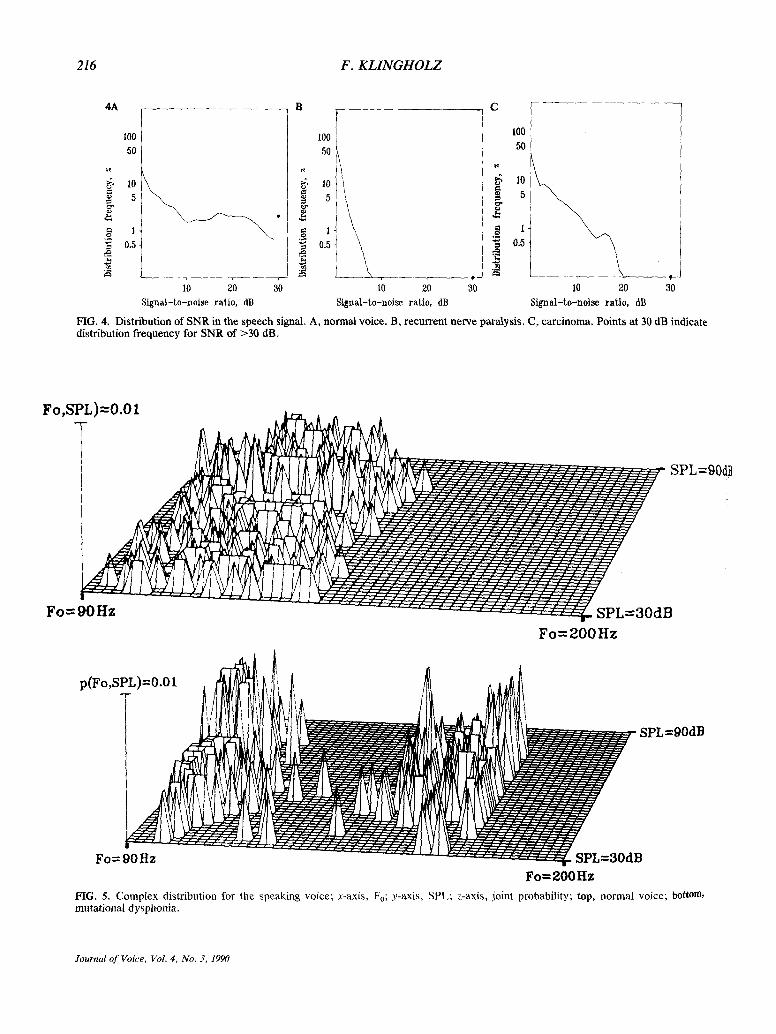
A useful supplement to the above methods is the measurement of the signal-to-noise ratio (SNR) or related measures in the speech signal as they char- acterize the perturbation and purity of the speaking voice. The SNR distribution of the speech signal would exhibit a SNR value of 0 dB for voiceless consonants and otherwise low SNR values due to time variations of frequency components. This amount of low SNR, however, can be considered as constant from a statistical point of view. On the other hand, such voice defects as lack of glottal periodicity, additive noise, voice breaks, vocal fry components, jumps of Fo, and hard glottal attacks are reflected in the SNR. In Fig. 4, SNR distribu- tions in speech signals with different voice qualities are shown.
THREE-DIMENSIONAL DISTRIBUTION
In contrast to the phonetogram representing min- imum and maximum loudness levels in the produc- tion of sustained vowels in the entire vocal range, Sonninen (17) measured the area of the speaking voice. He used an oscilloscope, whereby F0 was plotted along the x-axis, and the sound pressure
IA
0.I00
0.010
0,001
B {
0.i00 1
~ 0.010 !
I o.oot
L 050 100 150 200
Fundamental frequency, Hz Fundamental frequency, Itz 050 I00 150 2oo
C
0.100
0.010
0.001
050 100 150 200 Fundamental frequency, Hz
FIG. 1. Distribution of Fo in the speech signal. A, normal voice. B, recurrent nerve paralysis. C, carcinomal.
Journal of Voice, Vol. 4, No. 3, 1990

ACOUSTIC REPRESENTATION OF SPEAKING VOICE 215
2A
1.0O0
~ 0.100
0.010
0.001
form. factor = 3.60dB
1 2 3 4 5
Amplitude/rms amplitude
B F form factor = 5.36 dB 1.000
• -
o.oo1
L
1 2 3 4 5 hmplitude/rms amplitude
c r form, factor = 3.10 dB
1
o.oo l
1 2 3 4 5 hmplitude/rms amplitude
FIG. 2. Ampli tude densi ty distribution in the speech signal (without speech pauses) . B, recurrent nerve paralysis .
(SPL) was plotted along the y-axis. The more fre- quently Fo-SPL pairs of values occur, the brighter was the screen at the equivalent coordinates. The corresponding three-dimensional representation is shown in Fig. 5. For each speech segment, a value triplet is obtained: F0, SPL, and P(Fo,SPL) (joint probability, relative frequency of occurrence of a F0-SPL pair). This distribution describes only two voice features fundamental frequency and inten- sity. The voice sound characteristic, however, is neglected. To complement this information, the joint probability can be replaced by a perturbation measure.
METHOD
Speech material and recording The subjects were required to read the beginning
of a well-known German fairy tale over a period of at least 1 min. The text contained 30 sentences. Since statistical signal analysis was used, no atten- tion was paid to any particular phonemic combina- tions.
The signals were recorded in an acoustically iso- lated room with no specific reflection characteris- tics. The noise level in the recording booth was <24 dB. The signals were stored on digital audio tape (recorder type XD-Zll00, JVC; microphone type 4125, Brfiel & Kjaer).
Data processing Antialiasing filtering (5 kHz, 72 dB/oct) was per-
formed on the signals before digitisation. The sig-
nals were sampled at 12.5 kHz using a 12-bit A/D converter (DT 2821, Data Translation). Distribu- tions of speech wave variables do not change sig- nificantly for signal lengths >30 s. Therefore, 30-s signal lengths were used in the analyses, whereby the shift of the moving time window (length of 82 ms) amounted to 20 ms; i.e. 1,500 values of each speech wave variable were extracted.
Measurement of the sound pressure level Sound pressure level of voice was measured in
the range between 30 and 90 dB (level recorder type 2209, Brfiel & Kjaer) with the microphone posi- tioned 20 cm from the speaker's lips. The envelope of the signal was obtained from the speech wave and from its Hilbert transform. The mean sound pressure of the envelope was determined for each moving window along the time axis.
Measurement of Fo F 0 was determined by the product spectrum (18),
which also allows F0 determination when the SNR of the signal is low.
Measurement of SNR Estimation of SNR can be performed by examin-
ing sustained vowels, thus requiring long time win- dows (e.g., ref. 19), by speech wave averaging (e.g., ref. 20) or by approximation to the noise spectrum (21,22). In natural speech, however, sustained vow- els seldom occur, and the noise characteristics are a priori unknown. On the other hand, harmonics are
3A 5o f
°
2,0 4,0 6,0 Frequency, kltz
B 50 " C 50 S . . . . . . . . . . . 1
2.0 4.0 6.0 B.0 2.0 4,0 6.0 8.0
Frequency, kHz Frequency, kI/z
FIG. 3. Long- te rm average power spectra (without high f requency preemphasis) . C, carc inoma.
Journal of Voice, Vol. 4, No. 3, 1990
216 F. KLINGHOLZ
4A
100 50
~ 5 &
. , , o $ 05
N 10 20 30
Signal-to-noise ratio, dB
B
I00
50
lO
! 5
~ O.5 2
Signal-to-noise ratio, dB
I00
50
t 5 &
I0 30
Signal-to-noise ratio, dB
FIG. 4. Distribution of SNR in the speech signal. A, normal voice. B, recurrent nerve paralysis. C, carcinoma. Points at 30 dB indicate distribution frequency for SNR of >30 dB.
Fo,SPL)=0.01
I SPL=90dB
Fo= 90Hz SPL=30dB Fo=200Hz
p(Fo,SPL)=0.01 ~ /
=90dB
Fo= 90 Hz Fo=2OOHz
FIG. 5. Complex distribution for the speaking voice; x-axis, Fo; y-axis, SPL; z-axis, joint probability; top, normal voice; bottom, mutational dysphonia.
Journal of Voice, Vol. 4, No. 3, 1990

ACOUSTIC REPRESENTATION OF SPEAKING VOICE 217
defined by their frequency location, amplitude, and shape. Therefore, in the present study, the harmon- ics were reconstructed (from their remnants if they were affected by perturbation) to calculate har- monic energy.
Speech pauses were excluded from the analysis. They were assumed to occur when the signal level within the analysis window was <10% of the rms amplitude of the total signal. This procedure has been reported previously (23). It may be briefly characterized as follows: The time window is Gaus- sian-shaped, and, hence, the harmonics can be de- scribed by e x p ( - x 2) terms. The window length amounts to 82 ms with a 3-dB width of 32 ms. After zero padding, a 2,048-point FFT is used to deter- mine power spectra. The spectral sample density is increased fourfold by using a digital interpolation filter. Spectral peaks are identified as harmonics if they fulfill three criteria: (a) They are localized at (n)Fo (n = 1, 2, 3 . . . . ); (b) they exceed surrounding components by at least 6 dB, and (c) they exhibit a bandwidth between 12 and 14 Hz.
The harmonic amplitude spectrum was synthe- sized by means of magnitudes, bandwidths, and lo- cations of the identified harmonic peaks. The total short-time energy (Et) and the harmonic short-time energy (Eh) were determined by summation of the squared amplitudes of the amplitude spectrum and the synthesized spectrum, respectively. The SNR is determined from SNR = 10 log10 (Et/(En), where En = Et - Eh is the short-time noise energy. The re- liability of this procedure has been tested by means of SNR measurement of synthetic vowels (23).
The method evaluates signal components as fol- lows: When harmonic components cannot be found, i.e., Et = En (SNR = 0 dB), the frame might contain voiceless consonants, transients, or de- voiced or extremely perturbated voiced sounds. In the case E t > En (SNR > 0 dB), harmonic compo- nents, at least the fundamental, are found indicating sounds with a periodic characteristic. Pure har- monic energy would be found when En -- 0 (SNR = 00 dB). However, this is a theoretical case because the voice signal always shows natural aperiodicity (jitter, shimmer). Nevertheless, when the SNR is measured above 30 dB it is set to 30 dB.
Design of the three-dimensional representation To avoid masking effects in the three-dimensional
graphics representation, a gray scale was used for the representation of the SNR. In cases where sev-
eral SNRs were measured for one Fo-SPL pair, the maximum SNR was chosen. Eight gray levels were available. Each increment on the gray scale repre- sents an increment of 3 dB in the SNR. Values of SNR above 21 dB were set to the eighth level (black). The zero level (white) represented a lack of a value triplet. The image was filtered by a two- dimensional (3 x 3) Hanningfilter.
RESULTS AND DISCUSSION
Figure 6 illustrates the distribution of a normal male voice. In this distribution, higher values of SNR are correlated with higher SPLs, indicating that vowels tend to be the loudest and clearest sig- nal components. Figure 7 demonstrates that--from a clinical point of viewma pathologic voice (hy- pofunctional dysphonia) shows high SNRs over the entire distribution area. In this case, a lowered ten- sion of the laryngeal muscles have caused a de- crease in mean speaking frequency and in fre- quency variation. Because the SNR is sensitive to frequency variation (it is reduced due to the varia- tion), higher SNRs occur more frequently in this voice. Figure 8 demonstrates the typical distribu- tion in mutational dysphonia. The distribution in Fig. 9 was obtained from a patient (recurrent nerve paralysis) who was able to produce vowels with me- dium voice quality, but whose speaking voice qual- ity was very low. In Fig. 10, the preoperative and postoperative distributions are compared for a pa- tient who suffered from laryngeal carcinoma. Post-
80
~.q 60
~"~ 40
I I I I I
10~ 125 150 17S 200
Fttnda~ental f~equeney, llz FIG. 6. Fo-SPL-SNR distribution for a normal male voice; x- axis, Fo; y-axis, SPL; z-axis (gray scale), SNR.
Journal of Voice, Vol. 4, No. 3, 1990

218 F. KLINGHOLZ
8~
~J
0 g.O
I I I
I~ 125 15~ 175 2~
Fundamental f~equeneg, Hz FIG. 7. Fo-SPL-SNR distribution for a male voice with hy- pofunctional dysphonia; x-axis, Fo; y-axis, SPL; z-axis (gray scale), SNR.
8 0 --7 =1.
6~
"~ 4 0 e--
¢.0
iiiii~ iiiiii[ii]~]],§]]i~:iii~iiii~i]i::=:i~l[ii[[~iH[ '1;]iiiiiiii~"~:]:ii:=: iiii::::iiii '~= i~ i i
~ii i iiiiiiiiii ibii :i~.,, ~ilqiii]iil iiii,=ii~ = ~ J i i i ~t~=, ~!i~=im ....
I I ! I I
18~ i25 15~ i?~ 2~
Fundamental ~equencg, Hz FIG. 9. Fo-SPL-SNR distribution for a male voice with recurrent nerve paralysis; x-axis, Fo; y-axis, SPL; z-axis (gray scale), SNR.
operatively, the purity of the voice was better than preoperatively. The ability of phonatory adjustment of the vocal folds was apparently improved, as seen in the normal distribution with respect to the vari- ation range of Fo (cf. Fig. 6).
The voice print--an intensity scaled sonagram-- that was directed to speaker recognition was intro- duced by Kersta (24). In contrast to the sonagram, which displays the speech structure (phonemes and their transients), the F0-SPL-SNR distribution is worthier of the term "voice print" because it incor- porates true voice features.
This presentation of a voice print is more closely
8 0
] 6a i~,,~ = % . . . . . . . . ~ i .....
#~ii i: . . . . . . . . .
I | I I
£ 0 0 12S 1S~ . I .75 I
2 ~ 0
Fundamental frequencg, Hz FIG. 8. Fo-SPL-SNR distribution for a male voice with muta- tional dysphonia; x-axis, Fo; y-axis, SPL; z-axis (gray scale), SNR.
related to the phonetograms published by Pabon and Plomb (25). These phonetograms represent sus- tained vowels supplemented with acoustic voice- quality parameters within the entire range of F o and intensity. The determination of these phoneto- grams, however, is time consuming because many of Fo-SPL pairs must be measured over the F0-SPL range. Moreover, the use of sustained vowels does not correctly represent running speech.
Distributions of single speech-wave variables do not always correspond systematically with clinical evaluation of voices. In Fig. 3, for instance, the LTAS show only small differences between the nor- mal voice and the case of chronic hyperplastic lar- yngitis. The differences may be caused by individ- ual vocal tracts rather than by glottal conditions. The combined representation of several distribution types should reduce such ambiguity.
In the application of the F0-SPL-SNR distribu- tion, one should bear the following limitations in
IOA m
,-7
1
B e I 8 e 1 j . ~ 8~]
i!! ~ ~
1oo 125 15o ~?5 z~o io~ Iz~ 15~ 17S zoo
FundaNenLal f~equencg, Hz FundaNental £requeaC~, Hz FIG. 10. Fo-SPL-SNR distribution for a male voice with laryn" geal carcinoma. A, preoperative; B, postoperative; x-axis, F0; y-axis, SPL; z-axis (gray scale), SNR.
6 0
Journal of Voice, Vol. 4, No. 3, 1990

ACOUSTIC REPRESENTATION OF SPEAKING VOICE 219
mind: (a) the voice print obtained is based on run- ning speech; i.e., nonpathologic speech features such as emotional factors or individual speech hab- its or colloquialisms are included to an unknown degree in the complex distribution. (b) Although the F0-SPL-SNR distribution reflects the quality of the speaking voice very well, the joint probabilities be- tween pairs of Fo, SPL, and SNR are eliminated in this three-dimensional plot. The SNRs are only ref- erenced to F0and SPL; i.e., some features of the one-dimensional distributions are lost. For in- stance, the information on frequently used Fo-SPL pairs, as still available from the representation as shown in Fig. 5, is no longer available.
Acknowledgment: This research was supported by the Deutsche Forschungsgemeinschaft (Project K1 580/ 1-1-743/87).
REFERENCES
1. Hecker MHL, Kreul EJ. Descriptions of patients with can- cer of the vocal folds. Part I: measures of fundamental fre- quency. J Acoust Soc Am 1971;49:1275-82.
2. Muta H, Baer T, Wagatsuma K, Muraoka T, Fukuda H. A pitch-synchronous analysis of hoarseness in running speech. J Acoust Soc Am 1988;84:1292-301.
3. Hess W. Pitch determination o f speech signals. Berlin, Heidelberg, New York, Toronto: Springer-Verlag, 1983.
4. Bowler NW. A fundamental frequency analysis of harsh voice quality. Speech Monograph 1964;31:128-34.
5. Gubrynowicz R, Mikiel W, Zarnecki P. An acoustic method for the evaluation of the state of larynx source in cases in- volving pathological changes in the vocal folds. Arch Acous- tics 1980;5:3-30.
6. Hammarberg B. Pitch and quality characteristics of muta- tional voice disorders before and after therapy. Folia Pho- niatr (Basel) 1987;39:201-16.
7. Murry T, Doherty ET. Selected acoustic characteristics of pathologic and normal speakers. J Speech Hear Res 1980;23:361-9.
8. Schultz-Coulon HJ. Grundtonanalyse--ein Beitrag zur ob-
jektiven Beurteilung der Sprechund Singstimme. HNO 1975;23:218-25.
9. Weiss W. Statistische Untersuchungen an Sprachschwin- gungen. Nachrichtentechn Z 1964;17:339--48.
10. Froekjaer-Jensen B, Prytz S. Evaluation of speech disorders by means of long-time average spectra. Annual Report In- sti tute o f Phonetics, University o f Copenhagen 1974; 8:227-37.
11. Hammarberg B, Fritzell B, Gauffin J, Sundberg J, Wedin L. Perceptual and acoustic correlates of abnormal voice qual- ity. Acta Otolaryngol 1980;90:441-51.
12. Hurme P, Sonninen A. Normal and disordered voice quality: listening tests and long-term spectrum analyses. In: Hurme P, ed. Papers in speech research. Vol. 6. Jyv/iskyl~i: Uni- versity of Jyv~iskyla, 1985:49-72.
13. Kitzing P. LTAS criteria pertinent to the measurement of voice quality. Journal o f Phonetics 1986;14:477-82.
14. Lrfqvist A. The long-term average spectrum as a tool in voice research. Journal o f Phonetics 1986;14:471--6.
15. Wendler J, Doherty ET, Hollien H. Voice classification by means of long-time speech-spectra. Folia Phoniatr (Basel) 1980;32:51--60.
16. Wieser M. The long-term period measurement, an instru- mental method in phoniatry. Arch Otorhinolaryngol 1980;226:63-72.
17. Sonninen A, Lehtonen J. Potential voice field measurement method. In: Schutte HK, ed. Proceedings o f the 9th Con- gress o f the UEP. Amsterdam: Central Reproductied ienst Vrige Universitiet, 1981:83-95.
18. Schroeder MR. Period histogram and product spectrum: New methods for fundamental frequency measurement. J Acoust Soc Am 1968;43:829-34.
19. Hiraoka N, Kitazoe Y, Ueta H, Tanaka S, Tanabe M. Har- monic-intensity analysis of normal and hoarse voice. J Acoust Soc Am 1984;76:1648-51.
20. Yumoto E, Gould WJ, Baer T. The harmonics-to-noise ratio as an index of the degree of hoarseness. J Acoust Soc Am 1982;71:1544-50.
21. Kasuya H, Ogawa S, Mashima K, Ebihara S. Normalized noise energy as an acoustic measure to evaluate pathologic voice. J Acoust Soc Am 1986;80:1329-34.
22. Kitajima K. Quantitative evaluation of the noise level in the pathologic voice. Folia Phoniatr (Basel) 1981 ;33:115-24.
23. Klingholz F. The measurement of the signal-to-noise ratio (SNR) in continuous speech. Speech Commun 1987;6:15-26.
24. Kersta LG. Voice print identification. Nature 1962; 196:1253-7.
25. Pabon JPJ, Plomp R. Automatic phonetogram recording sup- plemented with acoustical voice-quality parameters. J Speech Hear Res 1988;32:710-22.
Journal of Voice, Vol. 4, No. 3, 1990