Embed Size (px)
Citation preview

8/6/2019 ACL_II_Assignment_B_CMBC
http://slidepdf.com/reader/full/acliiassignmentbcmbc 1/9
Assignment Assessment Report
Campus: Sainik Farms Year/semester 2011-12
Level: ACL-IIAssignmentType
Assignment B
Module Name: CMBCAssessor’sName
Ms. Monica
Student’sName:
Manish VermaReqdSubmissionDate
e-mail id & MobNo
9899715278/[email protected]
ActualSubmissionDate
Stream Business Submitted to : ewlci
Certificate by the Student:Plagiarism is a serious College offence.I certify that this is my own work. I have referenced all relevant materials.Manish Verma
(Student’s Name/Signatures)
Expected
Outcomes
Assessment
Criteria
Grade
based onD,M,P,Rsystem
Feedback
General ParametersClarity Clear
understandingof the concept
Analytical Thinking-
Ability toanalyze theproblemrealistically
Research Done- Research carried
out to solve theproblem
Formatting &Presentation-
Concise& clearthinking alongwithpresentation
Subject Specific Parameters

8/6/2019 ACL_II_Assignment_B_CMBC
http://slidepdf.com/reader/full/acliiassignmentbcmbc 2/9
Assignment Grading Summary (To be filled by the Assessor)OVERALL ASSESSMENTGRADE:
TUTOR’S COMMENTS ONASSIGNMENT:
SUGGESTED MAKE UP PLAN(applicable in case thestudent is askedto re-do the assignment)REVISED ASSESSMENTGRADETUTOR’S COMMENT ONREVISEDWORK (IF ANY)
Date: Assessor’s Name / Signatures:
Assignment B
Ques 1 : Each student will be given one of the under mentionedindustry for assignment work.
• Education Industry
• Manufacturing Industry• Hospital Industry
• IT Industry
• Transport Industry
The students will have to visit a company from the assigned industry,meet the Accounts person and do the following:-
a. Find out and understand the Cost procedures followed by thecompany.b. If possible get a sample of cost sheet or Statement of Accounts
A presentation on the above and recommendation for areas of improvement has to be made.
Ans. Manufacturing Industry- Nestlé India Ltd.
Profile: Nestle India is a subsidiary of Nestle S.A. of Switzerland. NestleIndia manufactures a variety of food products such as infant food, milkproducts, beverages, prepared dishes & cooking aids, and chocolates &confectionary. Some of the famous brands of Nestle are NESCAFE,
Grades Grade DescriptorsAchieved Yes/No(Y / N)
PA Pass grade is achieved by meeting all the requirementsdefined.
MIdentify & apply strategies/techniques to find appropriatesolutions
D Demonstrate convergent, lateral and creative thinking.

8/6/2019 ACL_II_Assignment_B_CMBC
http://slidepdf.com/reader/full/acliiassignmentbcmbc 3/9
MAGGI, MILKYBAR, MILO, KIT KAT, BAR-ONE, MILKMAID, NESTEA,NESTLE TOMATO KETCHUP, NESTLE Milk, NESTLE SLIM Milk, NESTLEFresh 'n' Natural Dahi and NESTLE Jeera Raita Cost procedure followed in Nestlé India Ltd.- TOMATO KETCHUPAnd CHOCOLATESA company’s production process helps in determine the best way of accounting for its costs. Process costing works well whenever relativelyhomogeneous products pass through a series of processes and theyreceive similar amount of manufacturing costs. Nestle accounts for its
vast chocolate chips production by using a process costing system.Sequential Processing: The units typically pass through a series of manufacturing or producing departments, in each departments orprocess is an operation that brings the product one step closer tocompletion.
Parallel Processing: This pattern require two or more sequentialprocesses to produce the finished goods. Partially completed units areworked on simultaneously in different processes and then broughttogether in a final process for completion.
FLOW OF MANUFACTURING COSTS THROUGH THE ACCOUNTS OFPROCESS COSTING(Tomato Ketchup)
Picking Department
Work in Progress
Flavoring Department
Work in Progress
Bottling Department
Work in Progress
Materials:Fresh tomatoes
Sugar
SaltDistillation –
Vinegar
Spices
Picking labour
Applied Overhead
Transferred in from picking (includes all
manufacturing costs)
Materials:
Ketchup
Flavoring Labour Applied Overhead
Transferred in fromFlavoring (includes
all manufacturing
costs from pickingand flavoring)
Materials:
BottlesBottling Labour
Applied Overhead

8/6/2019 ACL_II_Assignment_B_CMBC
http://slidepdf.com/reader/full/acliiassignmentbcmbc 4/9
COST SHEET
Nestle India Ltd. (Chocolates)
Total output= 4,50,000 unitsParticulars Cost per unit Total CostRaw Material:Cocoa Butter=3,00,000Sugar=3,00,000Cocoa Solids= 3,20,000Peanuts= 2,00,000 5.16 23,20,000Chocolate coated resins= 4,00,000Almonds= 3,00,000Vanillin= 1,00,000
Honey=50,000Boston Baked Bean= 1,50,000
Direct Labour=7,00,000 1.56 7,00,000Carriage on Material= 2,42,500 0.53 2,42,500
Prime Cost 7.25 32,62,500Factory Expenses :Fixed:Depreciation on Plants &Machinery=2,57,500Rent= 1,50,000Power & ConsumablesStores=1,50,000Factory insurance=1,50,000Supervisors Salary=50,000 2.35 10,57,500
Variable:Electricity charges=50,000Power & Consumable stores=1,00,000Running Expenses of machines=1,50,000
Factory Cost 9.60 43,20,000Office Administration Expenses
Office staff salary=10,00,000Rent= 80,000Computer=1,20,000Furniture=3,00,000 4.40 19,80,000Telephone= 10,000Carriage outward=20,000Depreciation on furniture=50,000Salaries of administrative =3,70,000Rent, rates & taxes=30,000Office and Administration costs 14.00 63,00,000Selling & Distribution Expenses

8/6/2019 ACL_II_Assignment_B_CMBC
http://slidepdf.com/reader/full/acliiassignmentbcmbc 5/9
Advertisement(print & local TVchannel)=4,00,000Petrol=1,00,000 2.00 9,00,000Delivery Vehicles=2,50,200Maintenance of deliveringVehicles=2,50,200Packing rates= 50,000Bad Debts written off= 1,00,000
Total Cost 16.00 72,00,000
Net Profit (20% on selling price) 4.00 18,00,000
Sales20.00 90,00,000
Ques 2 :1. Discuss the technique of marginal costing as a key for managementproblems.
2. The following is the trading and profit and loss account of M/s PremIndustries for the year ende2d 31 st March 2000.
To Material consumed 708000 By Sales 30000 units 1500000
To Direct wages 371000By Finished Stock (1000units) 40000
To Works overhead 213000 By work-in-progress
To Administration overheads 95500 Material 17000 To Selling & distributionoverheads 113500 Wages 8000
To Net profit for the year 69000 Works Overhead 5000
1570000 1570000
In manufacturing a standard unit, the company’s cost records show that:
a. Work overhead have been charged to work-in-progress at 20% on primecost.b. Administration overheads have been recovered as Rs.3 per finished unit.c. Selling and distribution overheads have been recovered as Rs.4 per unitsold.d. The under-absorbed or over-absorbed overheads have not been adjustedinto the costing P & L a/c.
8/6/2019 ACL_II_Assignment_B_CMBC
http://slidepdf.com/reader/full/acliiassignmentbcmbc 6/9
Prepare:
1. A costing profit & loss account indicating net profits.2. A Statement reconciling the profit as disclosed by the cost accounts andthat
Shown in the financial accounts.
Ans.Techniques of Marginal costing:
Profit/volume ratio (P/V Ratio)When the contribution from sales is expressed as a percentage of salesvalue, it is known as Profit/Volume ratio (or P/V ratio). It expressesrelationship between contribution and sales. Better P/V ratio is an indexof sound ‘financial health’ of a company’s product. This ratio reflectschange in profit due to change in volume. Broadly speaking, it showshow large the contribution will appear, if it is expressed on equalfooting with sales.
P/V ratio may be expressed as:P/V ratio = (Sales - Marginal cost of sales)/Sales
or = Contribution/Salesor = Change in contribution/Change in salesor = Change in profit/Change in sales
Marginal Costing and CVP AnalysisCost-Volume -Profit analysis is an important tool for profit planning. Itprovides information about the following matters:
a) The behavior of cost in relation to volume.b) Volume of production or sales, where the business will break-
even.c) Sensitivity of profits due to variation in output.d) Amount for profit for a projected sales volume.e) Quantity of production and sales for a target profit level.
Cost-Volume-Profit analysis may therefore be defined as a managerialtool showing the relationship between profit planning, viz., cost (both
fixed and variable), selling price and volume of activity.
Break –Even AnalysisBreak-even analysis is a widely used technique to study Cost-volume-profit relationship. The narrower interpretation of the term Break evenanalysis is defined as a system of determination of that level of activitywhere total cost equals total selling price.The broader interpretationrefers to that system of analysis which determines probable profit atany level of activity.
8/6/2019 ACL_II_Assignment_B_CMBC
http://slidepdf.com/reader/full/acliiassignmentbcmbc 7/9
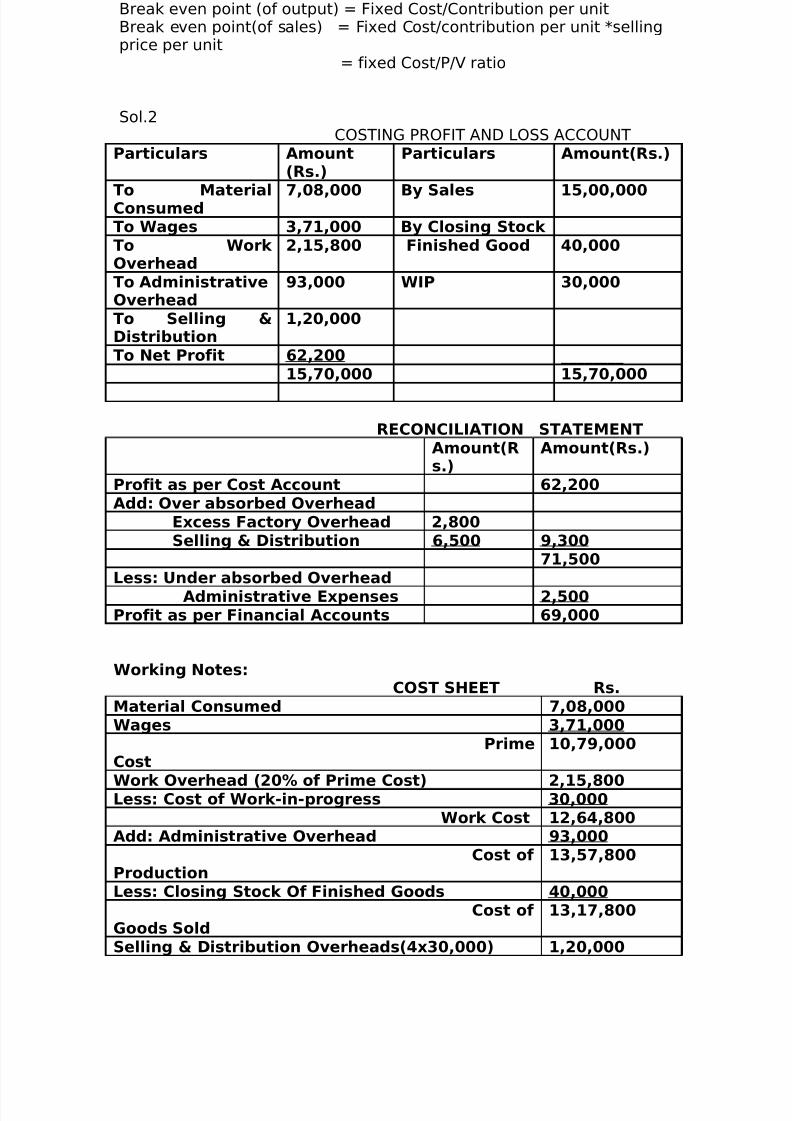
Break even point (of output) = Fixed Cost/Contribution per unitBreak even point(of sales) = Fixed Cost/contribution per unit *sellingprice per unit
= fixed Cost/P/V ratio
Sol.2COSTING PROFIT AND LOSS ACCOUNT
Particulars Amount(Rs.)
Particulars Amount(Rs.)
To MaterialConsumed 7,08,000 By Sales 15,00,000
To Wages 3,71,000 By Closing Stock To Work Overhead
2,15,800 Finished Good 40,000
To AdministrativeOverhead
93,000 WIP 30,000
To Selling &Distribution
1,20,000
To Net Profit 62,200 ________15,70,000 15,70,000
RECONCILIATION STATEMENTAmount(Rs.)
Amount(Rs.)
Profit as per Cost Account 62,200Add: Over absorbed Overhead
Excess Factory Overhead 2,800Selling & Distribution 6,500 9,300
71,500Less: Under absorbed Overhead
Administrative Expenses 2,500Profit as per Financial Accounts 69,000
Working Notes:COST SHEET Rs.
Material Consumed 7,08,000Wages 3,71,000
PrimeCost
10,79,000
Work Overhead (20% of Prime Cost) 2,15,800Less: Cost of Work-in-progress 30,000Work Cost 12,64,800
Add: Administrative Overhead 93,000Cost of
Production13,57,800
Less: Closing Stock Of Finished Goods 40,000Cost of
Goods Sold13,17,800
Selling & Distribution Overheads(4x30,000) 1,20,000

8/6/2019 ACL_II_Assignment_B_CMBC
http://slidepdf.com/reader/full/acliiassignmentbcmbc 8/9
_________Cost of Sales 14,37,800
Profit 62,200
Sales 15,00,000
Total Finished good units during the year = Unit sold-Openingstock + Closing stock = 30000 - 0 + 1000
= 31000Administration overheads have been recovered as Rs.3 perfinished unit= 31000*3= 93000
Ques 3 :
Work out in appropriate cost sheet from the unit cost per passenger km for
the year 2006-07 for a fleet of passenger buses run by a Transport Companyfrom the following figures extracted from its books.
5 passenger buses costing Rs.50000, Rs. 120000, Rs. 45000, Rs.55000 andRs.80000 respectively. Yearly depreciation of vehicles 20% of the cost.Annual repair, maintenance and spare parts – 80% of depreciation. Wages of 10 drivers @ Rs.100 each per month, wages of Rs.20 cleaners @ Rs. 50 eachper month. Yearly rate of interest @ 4%on capital. Rent of six garages @Rs.50 each month. Director’s fees @ Rs.400 per month, office establishment@ Rs.1000 per month, licences and taxes @ Rs.1000 every six months,realization by sales of old tyres and tubes @ Rs.3200 every six months, 900passengers were carried over 1600 kms during the year.
Sol.Cost of buses= Rs. 50,000 + 1,20,000 + 45,000 + 55,000 + 80,000
= Rs. 3,50,000
Yearly Depreciation(20% of cost) = Rs. 70,000Yearly Repairs(80% of Depreciation) = Rs. 56,000
Operating Cost- Sheet
For the year 2006-07
Particulars Amount (Rs.) Amount (Rs.)
(A)Standing Charges
Wages of
drivers(10x100x12)
12,000
Wages of cleaners
(20x50x12)
12,000
____________ 24,000
Interest(4% on capital) 14,000
Directors fees(Rs.400x12) 4,800
Licence & Taxes(Rs.
1000x2)
2,000

8/6/2019 ACL_II_Assignment_B_CMBC
http://slidepdf.com/reader/full/acliiassignmentbcmbc 9/9
Office establishment(Rs.
1000x12)
12,000
Garage rent(6x50x12) __ 3,600
60,400
(B) Maintenance Charges
Repairs, Spare parts etc. 56,000
(-) Sale proceeds from oldtyres & tubes
6,400
___________
49,600
(C) Operating ChargesDepreciation 70,000
Total(A+ B + C) 1,80,000
(E)Passenger Km.
Carried(900x1600)
14,40,000
(F) Cost per passenger Km.
Rs.(1,80,000/14,40,000) 0.125


