Embed Size (px)
Citation preview
An-Najah National UniversityFaculty of Nursing
Bone Mineral Density results; Estrogen, Vitamin D and other factors among woman in Nablus city– Palestine
Prepared by
Maryam Hajahmad Mohammad Abdell-rahman Hanaa Issa Motaz Awawda
Sponsors
Supervisor
Dr. Mariam Al-Tell
Submitted as the requirement for the final project thesis of the bachelor's
degree in nursing. Faculty of medicine and health sciences at An-Najah
National University, Nablus, Palestine.2015
اإلهداء من أعماق القلوب نوجه كلمة شكر
مشفوعة باالمتنان والتقدير إلى الجهة الداعمة
لمشروعنا التخرج
جمعية الكتاب المقدس " " الفلسطينية
الذين جادت أيديهم الكريمة بالخيروأنفسهم العظيمة
... بالبذل والعطاء إلنجاح هذا المشروع
Page 2 of 129

Table of Contents
Acknowledgment............................................................................................
Abstract..................................................................................................................
Abbreviation..........................................................................................................
OHD : Hydroxyvitamin D.....................................................................................
Definitions..............................................................................................................
Introduction...........................................................................................................
History of osteoporosis....................................................................................14
Background............................................................................................................
Bone modeling and remodeling......................................................................15
Definition of osteoporosis...............................................................................16
Osteoporosis Symptoms..................................................................................16
Diagnosis of osteoporosis................................................................................16
Bone mineral density.......................................................................................17
Laboratory tests...............................................................................................18
Risk factors of osteoporosis............................................................................18
Risk factors of osteoporosis that cannot be changed or influenced.............19
Risk factors of osteoporosis that can be changed or influenced..................20
Aims of the study...................................................................................................
Study Questions.....................................................................................................
Hypothesis..............................................................................................................
Page 3 of 129
Problem Statement................................................................................................
The significance of the study................................................................................
Literature Review..................................................................................................
Osteoporosis and Risk Factors........................................................................28
Osteoporosis and estrogen...............................................................................34
Osteoporosis and Vitamin D...........................................................................35
Bone density scan (DXA)...............................................................................37
Awareness of osteoporosis..............................................................................38
Methodology...........................................................................................................
Study design....................................................................................................41
Setting..............................................................................................................41
Population........................................................................................................41
Sample method and sample size......................................................................41
Inclusion criteria..............................................................................................42
Exclusion criteria.............................................................................................42
Data collection tools........................................................................................42
Validity and Reliability of the questionnaire..................................................43
Pilot study....................................................................................................44
Cronbach's (alpha) test.................................................................................44
Validity and reliability for DXA.....................................................................44
BMD test in little hand association.................................................................45
Vitamin D test validity and reliability.............................................................46
Validity and reliability of estrogen (Estradiol (E2)).......................................48
Filed work.......................................................................................................49
Data Analysis.........................................................................................................
Page 4 of 129
Ethical Considerations.....................................................................................51
Financial issues:..............................................................................................51
Budget.............................................................................................................51
Results.....................................................................................................................
Discussion...............................................................................................................
Conclusion..............................................................................................................
Recommendations................................................................................................100
Limitations...........................................................................................................101
References (APA style)........................................................................................102
Annex I (questionnaire)......................................................................................116
Annex II Facebook event....................................................................................122
Annex III IRB approval latter............................................................................123
Annex IV (consent form).....................................................................................124
Annex V (Approval of funding)..........................................................................125
Page 5 of 129
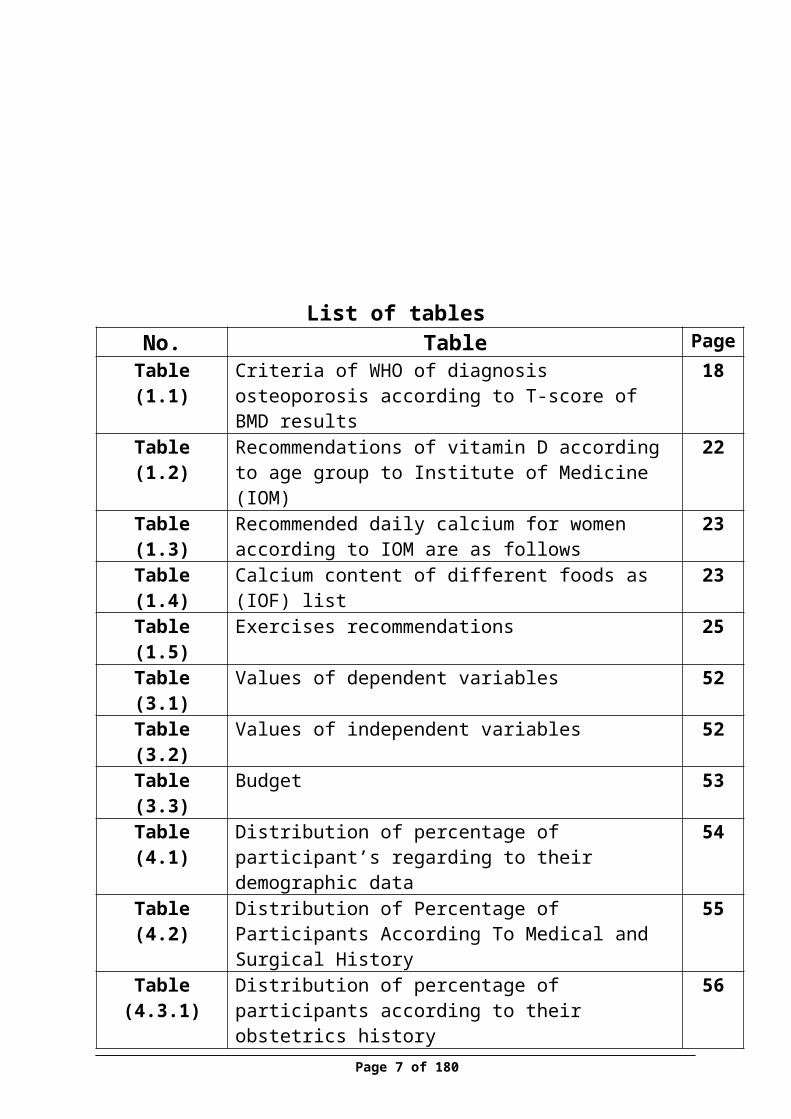
List of tablesPageTableNo.
18Criteria of WHO of diagnosis osteoporosis according to T-score of BMD results
Table (1.1)
22Recommendations of vitamin D according to age group to Institute of Medicine (IOM)
Table (1.2)
23Recommended daily calcium for women according to IOM are as follows
Table (1.3)
23Calcium content of different foods as (IOF) listTable (1.4)25Exercises recommendationsTable (1.5)52Values of dependent variablesTable (3.1)52Values of independent variablesTable (3.2)53BudgetTable (3.3)54Distribution of percentage of participant’s regarding to
their demographic dataTable (4.1)
55Distribution of Percentage of Participants According To Medical and Surgical History
Table (4.2)
56Distribution of percentage of participants according to their obstetrics history
Table (4.3.1)
57Distribution of percentage of participants according to their breast feeding history
Table(4.3.2)
58Distribution of percentage of participants according to their life style and nutrition
Table (4.4)
60Distribution of percentage of participants according to their physical activity
Table (4.5)
61Distribution of percentage of participants according to sun exposure
Table (4.6)
62Distribution of percentage of participants BMD of femoral and lumber results
Table (4.7)
65Distribution of participants’ percentage according to their age and BMD
Table (4.8)
66Distribution of Participants according to BMI and BMDTable(4.8)68Distribution of Participants Percentage according to
Calcium Consumption and BMDTable(4.10)
69Distribution of Participant’s Percentage according to Table (4.11)
Page 6 of 129
amount of Milk Consumption /Week and BMD71Distribution of Participants Percentage according to Dose
of Sun Exposure/min and BMDTable (4.12)
72Distribution of Participants Percentage according to Duration of Sun Exposure and BMD
Table (4.13)
73Distribution of Participants Percentage according to Number of Parity and BMD
Table(4.14)
74Distribution of participants percentage according to amount of cheese consumption per week and BMD
Table (4.15)
75Distribution of Participants Percentage according to Amount of Soft Drinks per Week and BMD
Table (4.16)
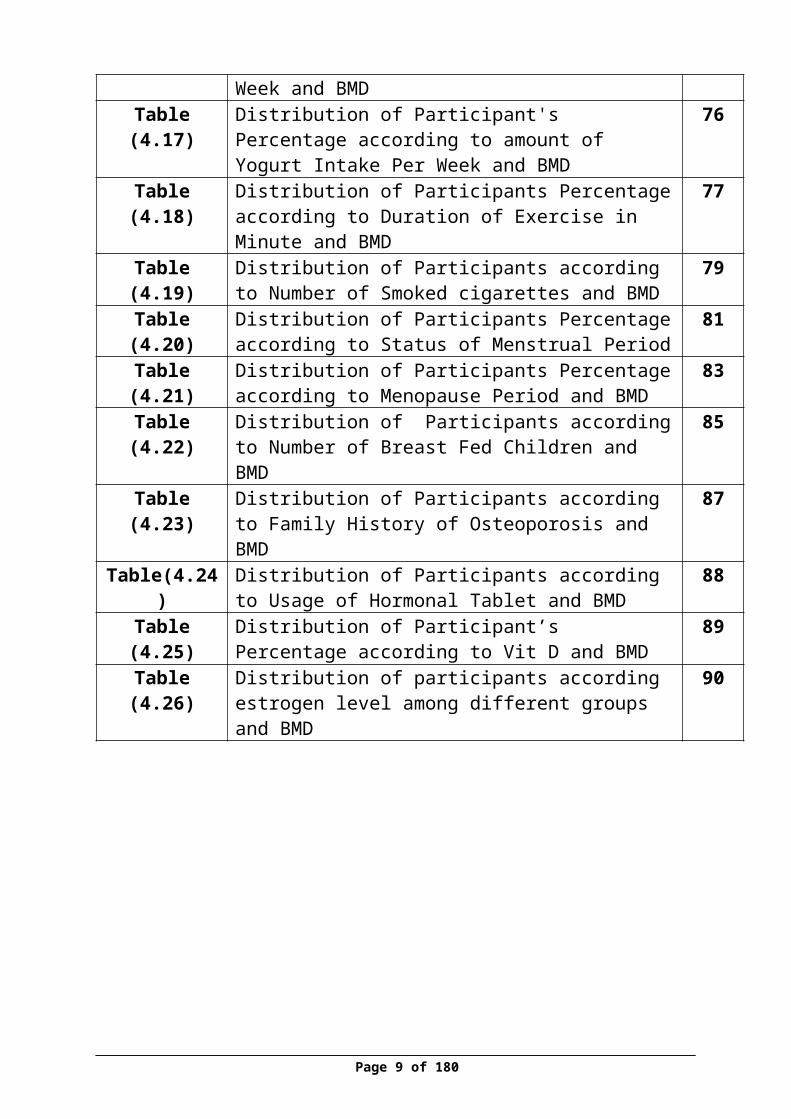
76Distribution of Participant's Percentage according to amount of Yogurt Intake Per Week and BMD
Table (4.17)
77Distribution of Participants Percentage according to Duration of Exercise in Minute and BMD
Table (4.18)
79Distribution of Participants according to Number of Smoked cigarettes and BMD
Table (4.19)
81Distribution of Participants Percentage according to Status of Menstrual Period
Table (4.20)
83Distribution of Participants Percentage according to Menopause Period and BMD
Table (4.21)
85Distribution of Participants according to Number of Breast Fed Children and BMD
Table (4.22)
87Distribution of Participants according to Family History of Osteoporosis and BMD
Table (4.23)
88Distribution of Participants according to Usage of Hormonal Tablet and BMD
Table(4.24)
89Distribution of Participant’s Percentage according to Vit D and BMD
Table (4.25)
90Distribution of participants according estrogen level among different groups and BMD
Table (4.26)
Page 7 of 129
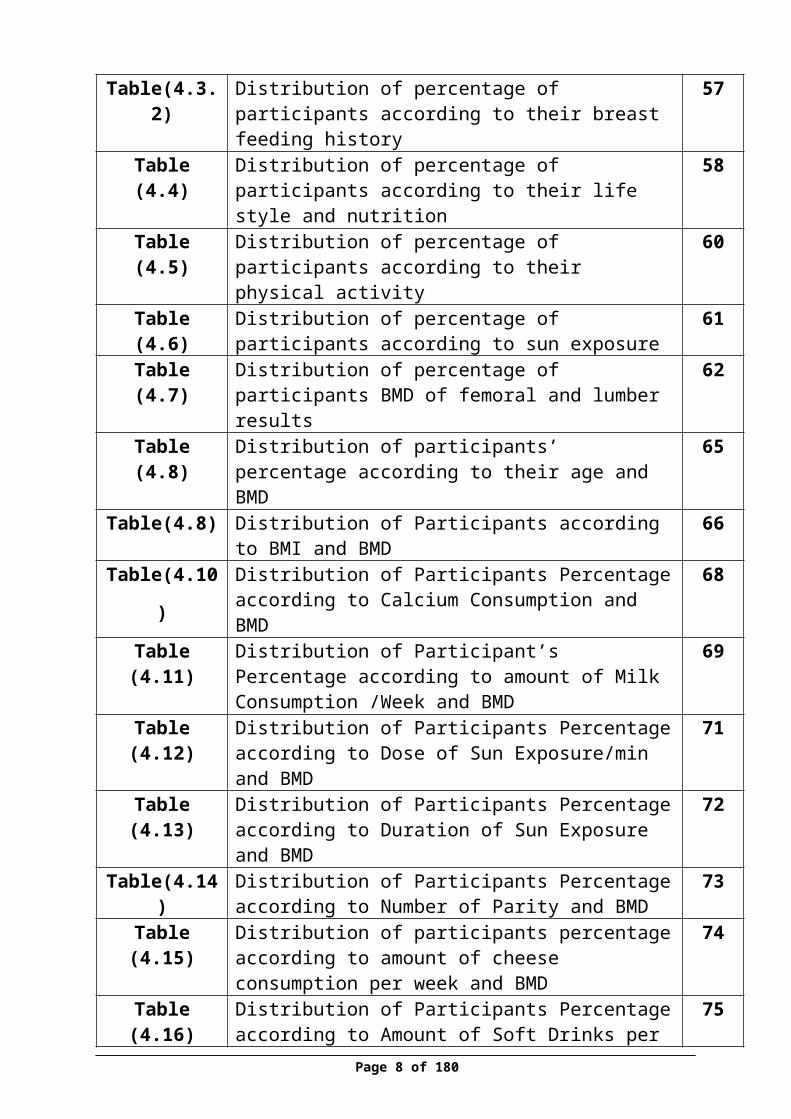
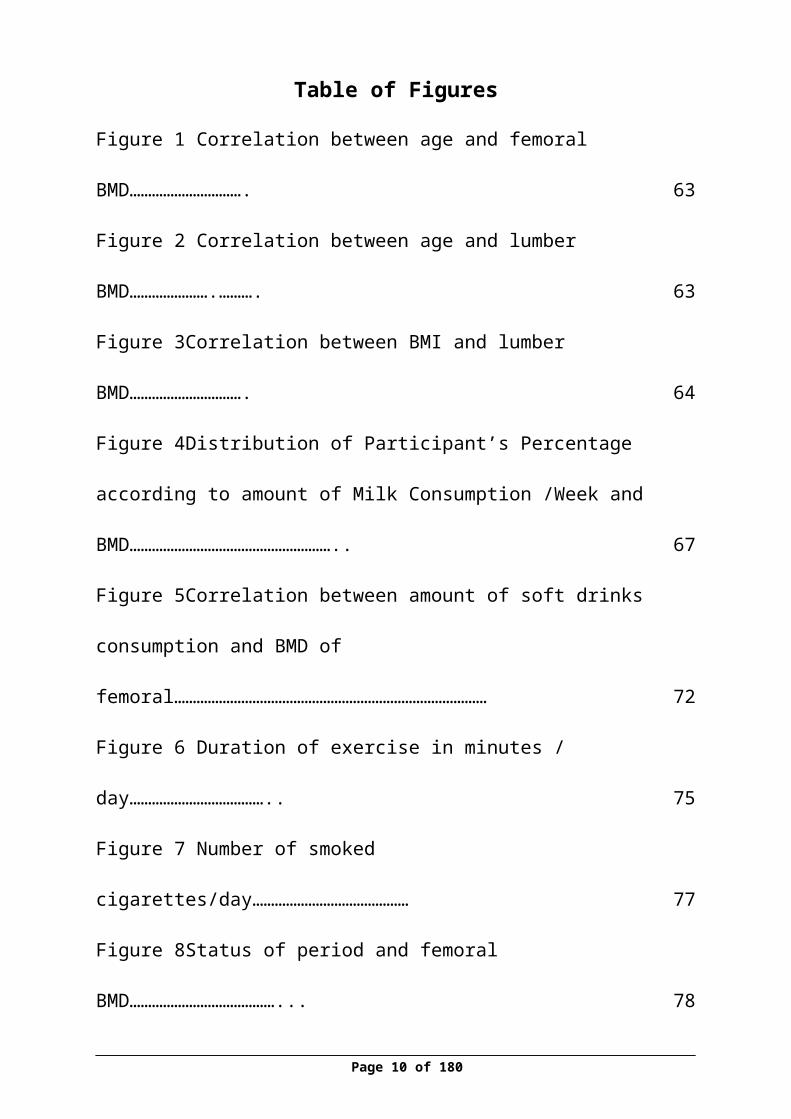
Table of Figures
Figure 1 Correlation between age and femoral BMD………………………….63
Figure 2 Correlation between age and lumber BMD………………….……….63
Figure 3Correlation between BMI and lumber BMD………………………….64
Figure 4Distribution of Participant’s Percentage according to amount of Milk
Consumption /Week and BMD……………………………………………….. 67
Figure 5Correlation between amount of soft drinks consumption and BMD of
femoral…………………………………………………………………………72
Figure 6 Duration of exercise in minutes / day……………………………….. 75
Figure 7 Number of smoked cigarettes/day……………………………………77
Figure 8Status of period and femoral BMD…………………………………... 78
Figure 9 Status of period and lumber BMD…………………………………... 79
Figure 10Correlation between menopause period and femoral BMD…………81
Figure 11 Correlation between menopause period and BMD………………… 81
Figure 12No. of breast fed children and BMD of femoral……………………. 82
Figure 13No. of breast fed children and BMD of lumber…………………….. 83
Figure 14 Correlation between estrogen and femoral BMD…………………. 88
Figure 15correlation between estrogen and lumber BMD……………………..88
Page 8 of 129
Acknowledgment
First of all, praise and gratitude to the Almighty Allah for giving us strength and patience for finishing this project.
We would like to express our sincere gratitude for all who supported us in this project. Many thanks to our supervisor, Dr. Mariam Al-Tell for her continuous assistance and advice before and during the work. Without her guidance this study would not have been possible.
We also would like to thank Palestinian Bible Society for generous sponsorship of the project that was a success key in conducting this research. In addition, we are grateful to Little Hands Society and all the working team for their help in data collection.
Our thanks and appreciation to Dr. Eman Elshawish for her efforts in providing the necessary knowledge to conduct this research, Dean of the nursing department Dr-Aidah Alkaissi for all her continuous effort during the four years and to An-Najah National University in general.
Page 9 of 129
At the end, we are very thankful to our families and friends, who always motivate us to reach our goals
Abstract
Osteoporosis is an important health problem which affected the density and quality of
bone, characterized that the bones become fragile, brittle and more susceptible to get
fracture, also osteoporosis called as a "silent disease” without symptoms so people they
don't know that they have disease.
In addition, it was found that the prognosis of osteoporosis will increased in the
Palestine, especially among women .So, the aim of the study was to determine the
relationship between estrogen level, vitamin D and BMD and to find out other factors
affecting BMD results in Nablus city.
A descriptive quantitative design was used to achieve the aim of the study utilizing
convenience quota sampling method to select 300 women for those who attend to the Little
Hand Society in Nablus city.
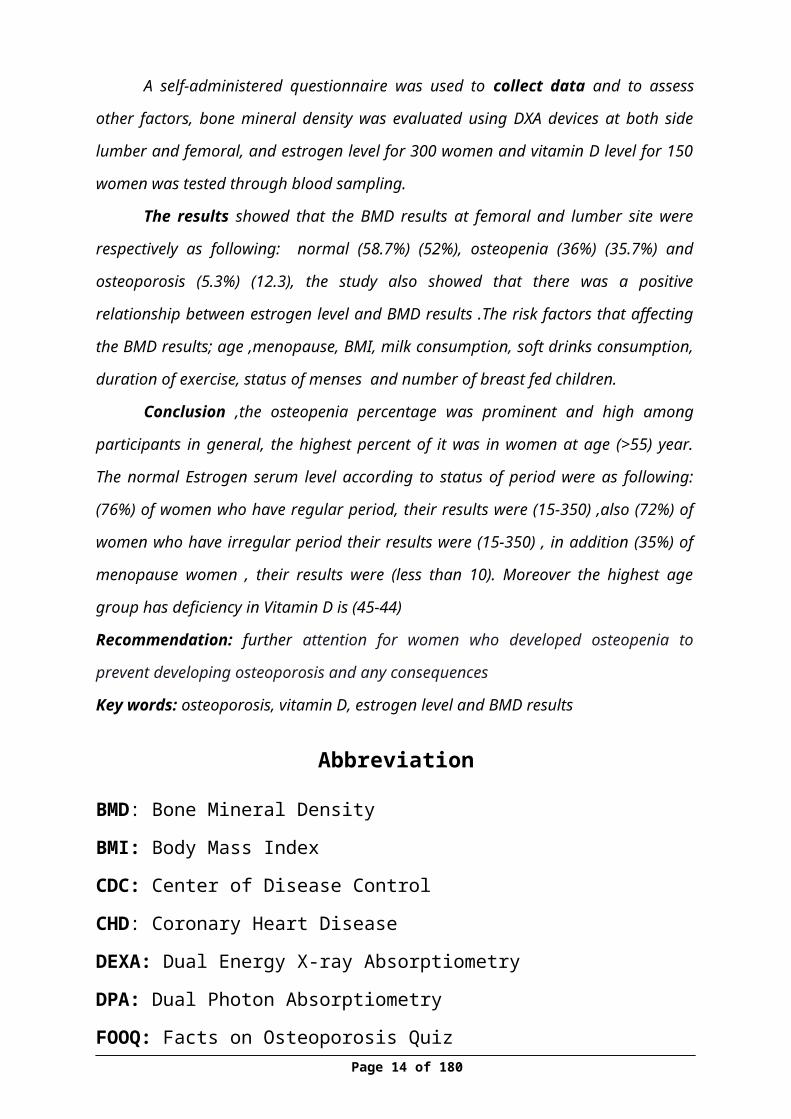
A self-administered questionnaire was used to collect data and to assess other
factors, bone mineral density was evaluated using DXA devices at both side lumber and
femoral, and estrogen level for 300 women and vitamin D level for 150 women was tested
through blood sampling.
The results showed that the BMD results at femoral and lumber site were
respectively as following: normal (58.7%) (52%), osteopenia (36%) (35.7%) and
osteoporosis (5.3%) (12.3), the study also showed that there was a positive relationship
between estrogen level and BMD results .The risk factors that affecting the BMD results; age
,menopause, BMI, milk consumption, soft drinks consumption, duration of exercise, status of
menses and number of breast fed children.
Conclusion ,the osteopenia percentage was prominent and high among participants
in general, the highest percent of it was in women at age (>55) year. The normal Estrogen
serum level according to status of period were as following: (76%) of women who have
regular period, their results were (15-350) ,also (72%) of women who have irregular period
Page 10 of 129

their results were (15-350) , in addition (35%) of menopause women , their results were (less
than 10). Moreover the highest age group has deficiency in Vitamin D is (45-44)
Recommendation: further attention for women who developed osteopenia to prevent
developing osteoporosis and any consequences
Key words: osteoporosis, vitamin D, estrogen level and BMD results
Abbreviation
BMD: Bone Mineral Density
BMI: Body Mass Index
CDC: Center of Disease Control
CHD: Coronary Heart Disease
DEXA: Dual Energy X-ray Absorptiometry
DPA: Dual Photon Absorptiometry
FOOQ: Facts on Osteoporosis Quiz
HRT: Hormone Replacement Therapy
IOF: Internationals Osteoporosis Foundation
LHS: Little Hand Society
NIH: National Institute Health
NOF: National Osteoporosis Foundation
OCs: Oral Contraceptives
OHD : Hydroxyvitamin D
OP: Osteoporosis
PDEXA: Peripheral or portable Dual Energy X-ray Absorptiometry
PQCT: Peripheral Quantitative Computed Tomography
QC: Quality control
QCT: Quantitative Computed Tomography
QUS: Quantitative Ultrasound
RA: Radiographic Absorptiometry
RCT: Randomized Controlled Trials
SPA: Single Photon Absorptiometry
SXA: Single Energy X-ray Absorptiometry Page 11 of 129
WHO: World Health Organization
Definitions
Body Mass Index (BMI): a simple index of measure body fat tissue, defined as
the weight in kilograms divided by the square of the height in meters (kg/m2).
Bone Mineral Density (BMD): a test used to evaluate the density of the bone
or how tightly the bone is packed, as represented by the amount of mineral
(calcium content).
DEXA: Dual Energy X-ray Absorptiometry, is an enhanced form of x-ray
technology that is used to measure bone loss, it characterized that a quick,
painless, noninvasive and emits less radiation than a tooth x-ray test.
Estrogen level for female (not menopausal): normal value for estrogen level
in blood located between 15-350 pg/mL ,(Mayo Foundation for Medical
Education and Research,2015) .
Estrogen level for menopausal female: normal value for estrogen level in
blood <10 pg/mL, (Mayo Foundation for Medical Education and
Research,2015) .
Estrogen: is a hormone produced by the ovaries, adrenal cortex, placenta, and
male testes, it control physical changes associated with puberty.
Gravida: the number of times the woman has been pregnant.
Menopause: is a normal physiological process in women that happened when a
menstrual periods stop for 12 months between 45-55 ages
Osteopenia: Bone mineral density value located between 1 to 2.5 SD below the
young adult reference range (-1 to -2.5), (WHO, 2012).
Osteoporosis: Bone mineral density More than 2.5 SDs below the young adult
reference range (-2.5 or less) , (WHO, 2012).
Parity: the number of children previously borne
Page 12 of 129

Perimenopause: the period of a woman’s life, that makes women prepared for
transition toward permanent infertility (menopause), it can begin 8 to 10 years
before menopause
Postmenopausal: woman has experienced 12 consecutive months without
period
Vitamin D deficiency: vitamin D serum level in blood less than 19 ng/mL ,
(Mayo Foundation for Medical Education and Research. 2013) .
vitamin D Normal level : vitamin D serum level in blood located between 20-
50 ng/mL, (Mayo Foundation for Medical Education and Research. 2013) .
Vitamin D: a steroid vitamin, which promotes the intestinal absorption and
metabolism of calcium and phosphorus and plays an important role in bone
health to keep it strong. It obtained from sun exposure, food, and supplements.
Page 13 of 129
Introduction
History of osteoporosis
The history has recorded a series of discovering, developments and the
appearance of osteoporosis over the years in the majority of countries of the
world, in ancient Egyptian before 4000 years ago, "hump back" was discovered
in the most mummies due to insufficient diagnostic tool to detect early the
skeletal problems, arthritis and osteoporosis, (Osteoporosis, 2007).
Before 150 years ago, it was found a relationship between bone loss and
decrease in bone mineral density with a risk of developing hip fracture by
Astley Cooper .However, in the 1830s, the term osteoporosis "porous bone" was
pathological deemed to describe a break down human bones which were have a
large bores by the French pathologist Jean Lobstein (Grob, 1931).
In 1940, it was considered by Fuller Albright, that the woman as
consequence of postmenopausal period her bone become more fragile and low
mineral contents that make her highly risk to develop osteoporosis in this state
particularly, but the researchers were being discussed whenever that the process
of bone lose it consider to be an aging process as relation of hormonal changes
due to menopause consequences or an a pathological condition (Manring, and
Calhoun, 2011)
Page 14 of 129
Background
Bone modeling and remodeling
Bones are dynamic, growing and living tissue that supports the muscles,
protects vital internal and stores most of the body’s calcium .The bone made up
of three major components that make them flexible and strong. It consists
mainly of a protein that gives bones a flexible framework called collagen and
complex of calcium phosphate mineral that harden and strengthen the bones.
Bone also contains living cells that remove and replace weakened sections of
bone, called osteoblasts and osteoclasts, (NOF, 2014).
At 18 century, John Hunter discovered the remolding bone process,
which mean the old bone, has been destroyed and replaced by new bones of the
skeleton.(Osteoporosis, 2007).Modeling bone process indicated that the body in
the period of growing in childhood frequently build and form new bones in
every sites of the skeleton, rather than a remolding process, which continue
remove and replacement the old bones (osteoclasts)in all life periods with
format new bone (osteoblasts).
During the childhood and adolescent periods, the body continuously
grow and become strong and tall due to a continuous process of building and
form a new bone more than destroying and breakdown the bone until it reaches
the peak bone mass or maximum amount of bone which mean bone at the end
level of maturation and usually happened at 20 year, around the third decade of
life the bone strength and tissue bone contents effected by his /her sex ,genetic
factors ,environmental factors, lifestyle including physical activity, nutrition and
health status. So before discovering the remodeling process it was difficult to
Page 15 of 129
recognize the osteoporosis, as this process play a critical role in determine the
bone changes in adults and abnormalities in bone mineral density,(Henry,1918).
Definition of osteoporosis
Osteoporosis is an important health problem which affected the density
and quality of bone, characterized that the bone become fragile, brittle and more
susceptible to get fracture due to abnormal loss in bone minerals which lead to
decrease the density in the bone thickness so the bone become thinner which
known as “fragile bone” and more porous,(IOF,2015). In 1994, the
Osteoporosis is defined by World health organization (WHO) as “A disease
characterized by bone density 2.5 standard deviations below the mean for young
white adult women at lumbar spine, femoral neck or forearm a consequent
increase in fracture risk” (WHO, 1994), also the osteoporosis was defined as
“skeletal disorder with process of micro architecture weakening of the bone
which lead to increase the fracture onset”, (Copenhagen Consensus Conference,
1990).
Osteoporosis Symptoms
Unfortunately, people don't aware that they have osteoporosis due to the
bone loss does not reflect by symptoms until he/she suffer from a serious
fracture in hip, back, wrist or vertebrae due to sudden accident or fall, so, the
osteoporosis called as a " silent disease”. The most symptoms is a fractures,
according to the location of the fracture it cause neck and muscle pain also bone
tenderness in more than place and back pain in the lower and upper regions of
the back is common symptoms of osteoporosis individuals .In addition, may
developed spinal deformities like kyphosis or loss of height about two inches
because of compression on the spine cord due to the fractures. Therefore, the
doctors and Professional if any one comes of these symptoms it would evaluate
them of osteoporosis, (Krucik, 2014).
Page 16 of 129
Diagnosis of osteoporosis
During the 1960s, it was developed a diagnostic devices for detecting
bone loss and the status of the bone, including densitometers, which can
determine bone density by measuring changes in the absorption of energy
passing through bones in the hand, spine, hip, or other body part to help
detecting early the osteoporosis,(Osteoporosis, 2007).
Osteoporosis is diagnosed by taking information about medical history
about risk factor include age, gender, menopause age, any past or current
fracture, family history of osteoporosis, smoking, nutrition and diet habits
include calcium and vitamin D intake level, physical activity or having irregular
periods for premenopausal women with a physical examination like make X-ray
or measure height and some specific tests for bone lose like Vitamin D and
estrogen, (Wilkins, 2007).
Bone mineral density
Is a test used to evaluate the density of the bone or how tightly the bone is
packed in the spine, hip, wrist, finger or heel but the bones in the lower spine
and hip is often measured because there are highest suspected to get fracture . In
addition, it used to measure the amounts of minerals like calcium in an area of
bone to determine the strength of bone and the risk of developing osteoporosis
or fractures. Many techniques are available to assess BMD at multiple sites
including (Health wise, 2014):
Dual Energy X-ray Absorptiometry (DEXA)
Peripheral or portable Dual Energy X-ray Absorptiometry(pDEXA)
Single Energy X-ray Absorptiometry(SXA)
Peripheral Quantitative Computed Tomography(pQCT)
Radiographic Absorptiometry(RA)
Page 17 of 129

Quantitative Computed Tomography(QCT)
Quantitative Ultrasound (QUS)
The most common method of measuring bone density in the spine and
hip is a ‘Dual-energy X-ray Absorptiometry’ (DXA) scan to study the
effectiveness of treatment or any change in bone density happened overall
times. It characterized that a quick, painless, noninvasive and emits less
radiation than a tooth x-ray test to measure the bone density. DEXA it described
as "the gold standard diagnostic tool for osteoporosis" (Hernlund et al, 2013),
but because of limited availability of BMD technology in some communities
and cost considerations, it has been focused on the specific group who are high
risk for low BMD.
Table 1Criteria of WHO of diagnosis osteoporosis according to T-score of BMD results
Bone DensityT-score
Normal Less than 1 standard deviation (SD) below the young adult reference range (more than -1)
Osteopenia 1 to 2.5 SD below the young adult reference range (-1 to -2.5)Osteoporosis More than 2.5 SDs below the young adult reference range (-2.5 or less)
(WHO, 2012)
Laboratory tests
It was discovered before recent year’s biochemical markers of bone
turnover. Some of these tests can be used to detect the loss of bone and monitor
the effectiveness of DXA devices for hormone replacement therapy (HRT) like
Vitamin D and Estradiol tests, (NOF, 2014).
Risk factors of osteoporosis
As well-known previously that the risk factor is as a variable that is
related to an increased possibility of occurrence of a disease. Therefore, there Page 18 of 129
are certain risk factors associated in development of osteoporosis and contribute
to an individual's risk of developing the disease. some of these factors cannot be
changed but others risk factors are capable to be changed, so identified these
risk factors it's important to detect and understanding the pathophysiology of the
disorder and contribute in treatment and in preventive strategies of develop
osteoporosis, the main risk factors are:
Risk factors of osteoporosis that cannot be changed or influenced
1. Gender
The women are much more likely to develop osteoporosis than the men
due to changes that happen with menopause that make the bone lose faster than
men and there is no period of rapid hormonal change and accompanying rapid
bone loss in the men, in addition, differences in bone geometry and remodeling
also contribute to the lower rate of fractures in men .However, the statics show
in America that about 80% of 10 million Americans with osteoporosis were
women,(NOF,2012).
2. Age
The risk of osteoporosis increased when the age exceed 40 year old or
more comparing with younger one ,because the bone mass density declines due
to bone breakdown exceeding bone building at aging period (reached peak pone
pass as mentioned above), (Zimmerman and Snow, 2012).
3. Heredity (family history)
Any family history of osteoporosis, brittle bones, Kyphosis, fractures,
Dowager’s hump, all of this condition has sensitive predictor of osteoporosis
risk. Also having a parent or sibling, sisters and mothers who had osteoporosis,
Page 19 of 129
have positive correlation of developing osteoporosis (Soroko et al 1994).In
addition, studies identified over 60 genetic markers associated with bone
density and susceptibility to fractures due to osteoporosis,(CDC, 2015).
4. Menopause
Menopause is a normal physiological process in women that happened
when a menstrual periods stop for 12 months between 45-55 ages which the
ovaries slow down their functions and reduce production of estrogen and
progesterone much less amounts . When the women entered this period it will
potential start lose bone, which will make her at greater risk of developing
osteoporosis. It was conducted in UK that premature menopause (before 50
year) is risk factor for osteoporosis in the future, (Family health guide, 2012).
5. Null parity, pregnancy and lactation
The changes that occur in women during pregnancy and breastfeeding
have effects on her bones, which change the level of hormones of progesterone
and estrogen and decrease calcium absorption in the bone if the women did not
received enough calcium during pregnancy, she will developed osteoporosis. In
addition, women at risk about 3-5% of lose her bone during breastfeeding due to
growing of baby which depends on women calcium, this influenced by the
periods of breastfeeding, (NIH, 2015).
Regardless of these changes, the pregnancy and lactation may have
protective effect on bone by enhance the strength of bone bearing in women
bones, (Salari and Abdollahi, 2014).About the null parity, the studies showed
that null parity is an established risk factor for osteoporosis, which is correlated
with increased risk of fracture and decreased BMD,(Hillier et al, 2003).
Page 20 of 129
Risk factors of osteoporosis that can be changed or influenced
1. Smoking
For previous decades, smoking was identified as a significant risk factor
for osteoporosis due to the relationship between cigarette smoking and decrease
in BMD results .As nicotine and free radicals that release from cigarette, it
damage the osteoblasts, (Davis, 2009).
Smoking effects is influenced by several factors in women, in smoked
woman who their aged between 40-50 are prone to develop osteoporosis more
quickly than other women due to rapid loss in bone as a result of decrease in
estrogen level in this period and decrease in calcium absorption in the bone
which lead to fragile bone then become susceptible to be fractured, (Whitcomb,
2010).
2. Weight
The facts indicate that people with low body weight are more susceptible
to have less BMD and increased risk of have osteoporosis than heavier people
weight as a result of more mass of bone make the bone more strong, so, body
mass index (BMI) is an important indicator for bone mineral density, In 1999 by
Ravan, it showed that people with low BMI (under 18.5 kg/m2) have a two-fold
greater risk of bone loss comparing with those people with normal or highest
BMI,(Ravan et al, 1999) .
3. Vitamin D
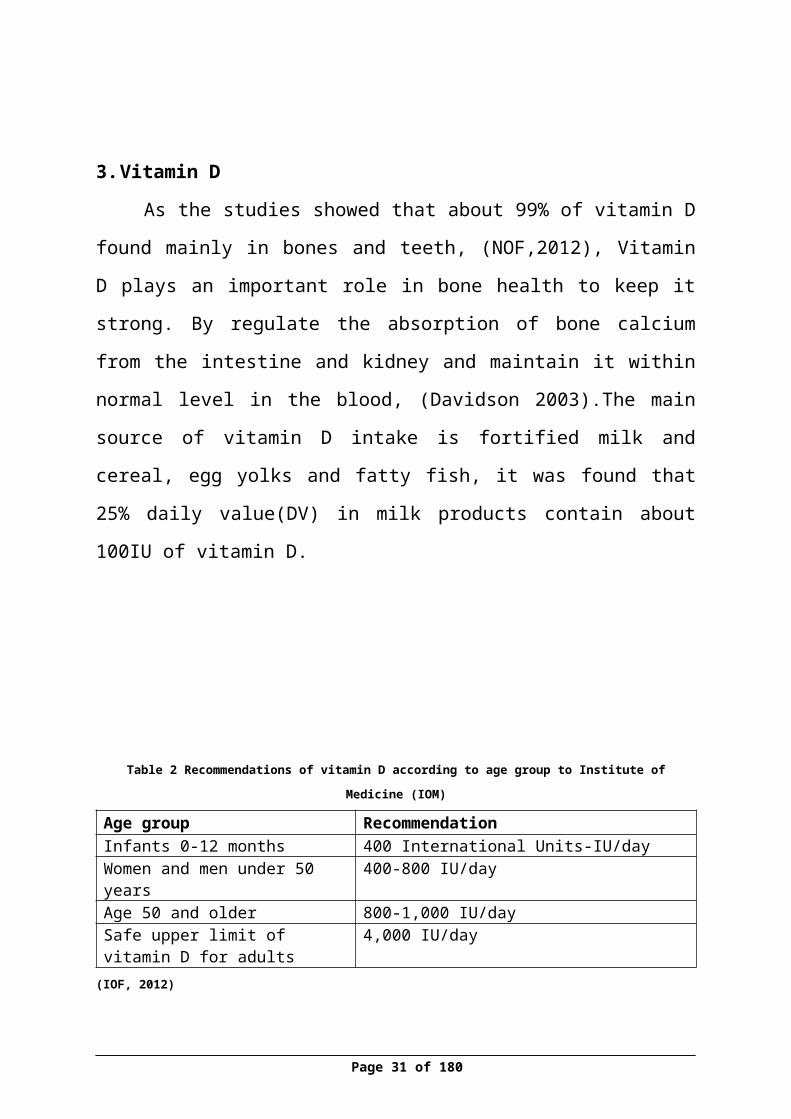
As the studies showed that about 99% of vitamin D found mainly in
bones and teeth, (NOF,2012), Vitamin D plays an important role in bone health
to keep it strong. By regulate the absorption of bone calcium from the intestine Page 21 of 129
and kidney and maintain it within normal level in the blood, (Davidson
2003).The main source of vitamin D intake is fortified milk and cereal, egg
yolks and fatty fish, it was found that 25% daily value(DV) in milk products
contain about 100IU of vitamin D.
Table 2 Recommendations of vitamin D according to age group to Institute of Medicine (IOM)
Age group RecommendationInfants 0-12 months 400 International Units-IU/dayWomen and men under 50 years 400-800 IU/dayAge 50 and older 800-1,000 IU/daySafe upper limit of vitamin D for adults
4,000 IU/day
(IOF, 2012)
It was found that Serum 25-hydroxyvitamin D levels dropped as age
increased in both male and female (CDC, 2012) and about 3% of women who
had hip fracture have vitamin D deficiency, (American College of
Rheumatology Task Force on Osteoporosis Guidelines 1996).So, it considered
that people who have high level of vitamin D in their blood their bone are
strong and have less chance to get fracture or to develop osteoporosis
comparing with those with low level of vitamin D, (Bischoff, 2012).
Also about the association between sunshine and vitamin D, the
researcher found that people in the winter months have less level of vitamin D
in relation to other times of the year, so low amounts of vitamin d in the blood
with other risk factors of osteoporosis make those people prone to get a fragile
bone and developed osteoporosis, (Avenell, Gillespie, Gillespie LD and
O’connell, 2005).
Page 22 of 129
4. Supplements of vitamin D
The benefit of vitamin D supplements is not clear yet because the
researcher's results are based on several factors like:
The form of vitamin d supplements type (tablets or injection).
Amount of vitamin D, which take by people.
The duration of vitamin d taken (every day, day other day).
Age of the people who take the supplements.
Taken the supplements along with other like calcium or not.
Therefore, some people the effect of these supplements on them decrease
risk of get fragile bone, but in some groups their effects does not appear. The
people who consider to be important one of get these supplements who are low
body weight and those who live in nursing home, in addition, some studies
showed that to relief osteoporosis and avoid destroyed bones, it may be most
benefit to take both calcium and vitamin D supplements together ,(Avenell, et
al.,2005).
5. Calcium intake
Calcium is mineral that associated with vitamin D and other minerals to form
the hard crystals that give the bones their strength and structure and to prevent
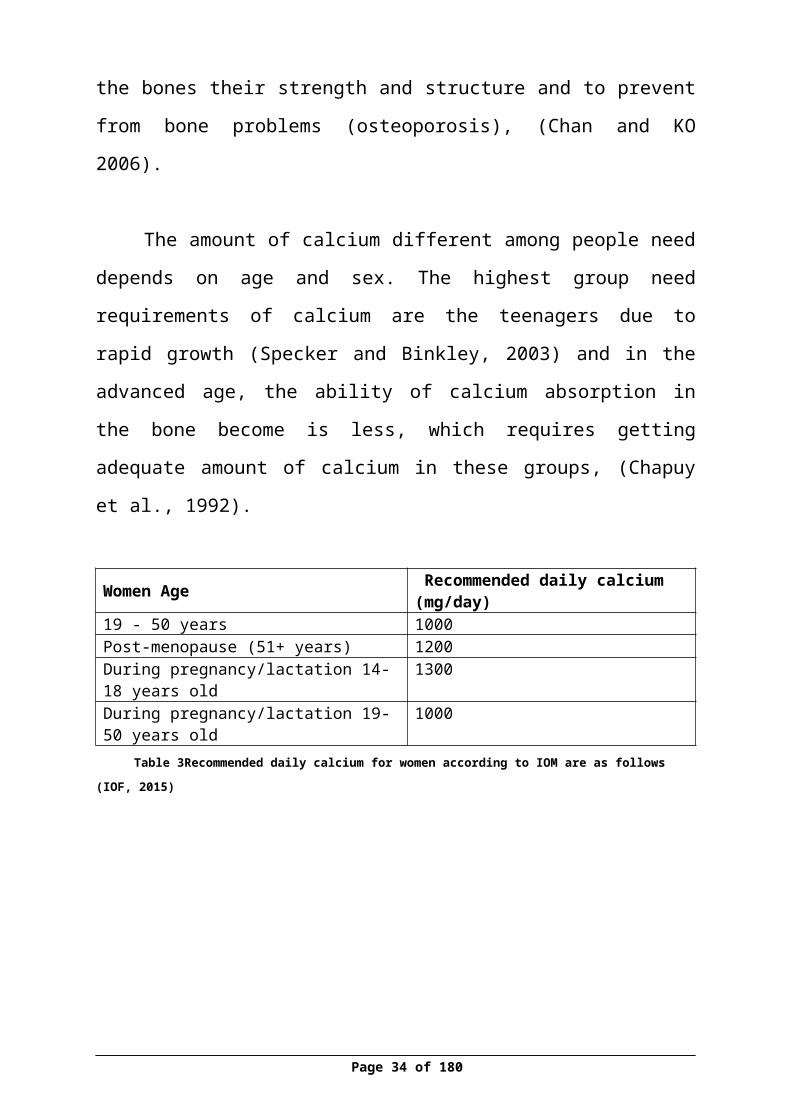
from bone problems (osteoporosis), (Chan and KO 2006).
The amount of calcium different among people need depends on age and
sex. The highest group need requirements of calcium are the teenagers due to
rapid growth (Specker and Binkley, 2003) and in the advanced age, the ability
of calcium absorption in the bone become is less, which requires getting
adequate amount of calcium in these groups, (Chapuy et al., 1992).
Page 23 of 129
Women Age Recommended daily calcium (mg/day)19 - 50 years 1000Post-menopause (51+ years) 1200During pregnancy/lactation 14-18 years old 1300During pregnancy/lactation 19-50 years old 1000
Table 3Recommended daily calcium for women according to IOM are as follows
(IOF, 2015)
Table 4Calcium content of different foods as (IOF) list
Food Serving size Calcium (mg)Sheep milk 200 ml 380Milk, whole 200m 236Milk, semi-skimmed 200ml 240Milk skimmed 20ml 244Yoghurt, natural 150g 207Hard white cheese 30g 240
(IOF, 2015)
6. Exposure to sunlight
From the past, it was found that sunshine is the main source of vitamin D
which is made by exposed to ultraviolet B light emitted by the sunshine and
then transported to the liver and converted to 25-hydroxyvitamin D, (CDC,
2012). For children and adults, the exposure of the hands and face to the sun for
10 to 15 minutes per day is usually sufficient to get optimal Vitamin
D(IOF,2015) ,but it differs among people based on : (vitamin D council,2010) .
The amount of skin exposed, the most of vitamin D would be achieved
when expose a large area of the skin, such as the back or if exposed the
all skin body to the sun it produce more of vitamin D .
Page 24 of 129

Time of the day, it preferably to expose to the sun during the middle of
the day for optimal vitamin D .
The place of living, people who lived closed to the equator it easier for
them to produce vitamin D from sunlight all year round.
Current season , in the summer a large amount of vitamin D will produce
in the skin more than the sunlight’s in winter
The type and color of the skin, it was found that whitish skins make
vitamin D more quickly than darker skins.
Page 25 of 129
7. Exercises
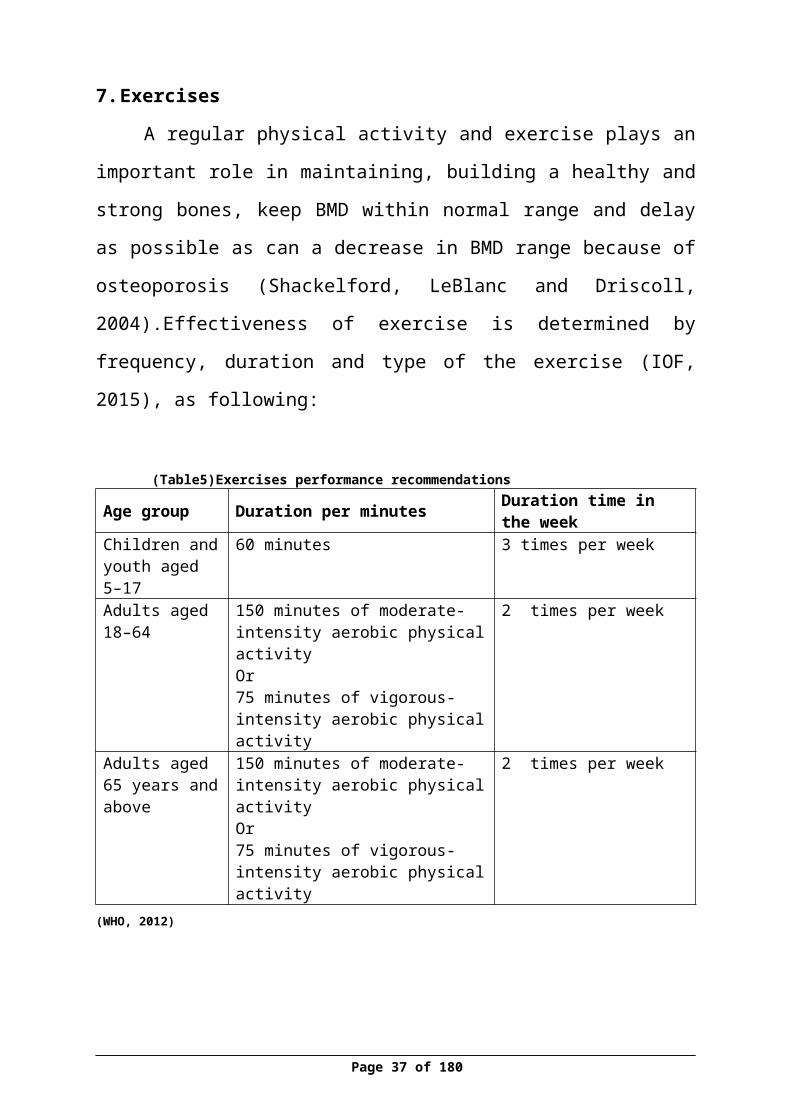
A regular physical activity and exercise plays an important role in
maintaining, building a healthy and strong bones, keep BMD within normal
range and delay as possible as can a decrease in BMD range because of
osteoporosis (Shackelford, LeBlanc and Driscoll, 2004).Effectiveness of
exercise is determined by frequency, duration and type of the exercise (IOF,
2015), as following:
(Table5)Exercises performance recommendationsAge group Duration per minutes Duration time in the weekChildren and youth aged 5–17
60 minutes 3 times per week
Adults aged 18–64
150 minutes of moderate-intensity aerobic physical activityOr75 minutes of vigorous-intensity aerobic physical activity
2 times per week
Adults aged 65 years and above
150 minutes of moderate-intensity aerobic physical activityOr75 minutes of vigorous-intensity aerobic physical activity
2 times per week
(WHO, 2012)
Page 26 of 129
Aims of the study
The overall aim of the study is to determine the relationship between
estrogen level, vitamin D and BMD and others factors among female in Nablus
city. The specific objectives are:
1. To find out estrogen serum level in blood
2. To fund out vitamin D serum level in blood
3. To determine different results of BMD by device (DXA) among different
age groups.
4. To find the relationship between estrogen level, Vitamin D and the BMD
results in relation to their groups and other variables
5. To determine the risk factors that associated in developed osteoporosis in
theses ages
6. To estimate the incidence rate of osteoporosis
Study Questions
1- Is there a relationship between estrogen level and BMD results among
women?
2- Is there a relationship between vitamin D and BMD results among
women?
3- What are the factors affecting the BMD results?
Hypothesis
There is a relationship between estrogen level and BMD results.
There is a relationship between vitamin D and BMD results.
Page 27 of 129
Problem Statement
As mention in the previous studies that the osteoporosis considered as
'silent disease' without symptoms so people they don't know that they have the
disease and it was found that the prognosis of osteoporosis will increased in the
Palestine (PSBC,2012) especially among women. Therefore, this study focused
on measuring the BMD among women, which consider as stronger predictor of
osteoporosis, also determine the major risk factors that affect the heath of bone
for them, and find if there is a relationship between the vitamin D, estrogen and
BMD, all these aims will help in increasing the awareness of the consequence of
osteoporosis ,and improve the health strategies in the primary health care in
Palestine by provide the main diagnostic tool (DEXA) for early detecting for
osteoporosis
The significance of the study
People used to think that the osteoporosis was part of aging, today, by
knowing the risk factors of osteoporosis in woman, it is very important to detect
early who are at high risk for developing it. Early detection will help in
prevention related complication and the risk of fractures.
Scientifically, there is never too young or too old to take care of bones,
good lifestyle habits and good consumption of food can help to protect the
bones and decrease the chance of getting osteoporosis.
.
Page 28 of 129
Literature Review
There are many researches and studies conducted to evaluate the BMD
vitamin D, estrogen and other factors among women, regarding the results, there
is a variation between it according to the participant’s age, gender, and life
styles in theirs countries.
Osteoporosis and Risk Factors
In the period from 2000 to 2010, a retrospective population-based cohort
study was conducted to explore the risk of coronary heart disease (CHD) within
an Asian population in relation to osteoporosis. The sample consisted of 19,456
patients aged 45 years and older with no history of CHD and had a diagnosis of
osteoporosis were identified as the osteoporosis cohort. Moreover, the
comparison cohort group was randomly selected. The findings revealed that the
incidence of CHD was 23.5 per 1000 person-years for the osteoporosis cohort,
while it was 16.7 for the comparison cohort with a significant relationship
between osteoporosis and coronary heart disease in Asian population, (Chen,
Lin & Kao, 2015).
Another quantitative study conducted in Brazil as a transversal
retrospective approach between the period March 2013 and June 2013 with total
of 107 women. The purpose of the research was to recognize the risk factors
that associated with osteoporosis ,the results considered that smoking, low
physical activity and caffeine intake as a risk factors, while the absence of
alcoholism and soda intake were categorized under protective factors for the
disease ,(Costa et al ., 2015 ).
In Poland, a research study analyzed the consumption of dairy products
and dietary calcium in a sample of 712 polish women who divided into two
groups of women. In the 1st group, the result showed that ages older than 49
Page 29 of 129

years and lack of menstrual cycle is associated with low BMD (below −1 SD);
the dietary calcium intake by women in this group was 459 mg/day. In the 2nd
group, the analysis showed that the regular BMD (over/equal to −1 SD) was
related to women who were younger than 50 years, presence of menstrual cycle
and a higher consumption of dairy products , the results also showed that 67%
amount in the calcium was found in milk, cheese and yogurt, (Wadolowska et
al., 2013) .
A cross-sectional study in Jordan was conducted in 2003 for Jordanian
women in Amman city to assess the association of obstetric issues (pregnancy
and lactation), and other menstrual history factors with low (BMD). According
to WHO criteria, the findings showed that 119 woman (29.6%) were having
osteoporosis, 176 (43.8%) having osteopenia, and 107 (26.6%) with normal
BMD. However, it was found that years of menstruation, age at menopause,
days of menstrual cycle, number of pregnancies, and duration of hormone
replacement therapy (HRT) were positively correlated with BMD, but there was
no correlation with number of children (live births) and frequency of lactations
was only evident at femoral neck. Moreover, the independent risk factors after
adjustment for age and BMI were the smoked woman for more 25
cigarettes/day, postmenopausal women irrespective of HRT use, menopausal
years of ≥5 year intervals, natural early menopause, rheumatoid arthritis,
osteoarthritis, hypertension, and thyroid replacement therapy. In addition, ever -
lactation, frequent lactation of 4 or more times, duration of lactation for 1–6
months and clinical hyperthyroidism were significant protective factors.
Although a gravidity, menstrual flow pattern, family history of osteoporosis,
clinical hypothyroidism, and corticosteroids therapy were not independent
predictors of osteoporosis was found among this population. Therefore, the
finding was showed that the prevalence of osteoporosis among the Jordanian
female population is extremely high, and is even found in younger age,
(Shilbayeh, 2003).
Page 30 of 129
In Davao, Philippines, Cross-sectional study was used among 905 women
to assess the occurrence of osteoporosis among post-menopausal women
dwelling in an urban community of the Philippines and to explore the risk
factors for osteoporosis using a quantitative ultrasonic bone densitometer. The
statics showed that 19.8% of osteoporosis was in postmenopausal women. In
addition, it showed that the body weight could be considered as changeable risk
factor for osteoporosis in postmenopausal women group, (Miura, Saavedra and
Yamamoto,2008).
In Korea, a study conducted in period 2008-2011to assess and detect
gender differences in factors associated with prevalence, awareness, and
treatment of osteoporosis of 3,071 men and 3,635 women. The osteoporosis
rates was 7.0% in men while 40.1% in women. Higher incidence of
osteoporosis was found among participants who were older, at lower
socioeconomic levels, with lower body mass index and shorter height in both
genders, and among women with non-hormonal replacement therapy. In
addition, it found that the osteoporosis occur more in female rather male, (Kim,
Kim & Cho, 2015).
In Sweden, randomized controlled trials (RCT) study was used
to evaluate the significance of exercise as a strategy to improve peak bone mass,
including some parts of nutrition. The study showed that “exercise during
growth seems to enhance the building of a stronger skeleton through a higher
peak bone mass and a larger bone size”, (Karlsson, Nordqvist and Karlsson C,
2008).
A cross sectional study of bone density dimensions was carried out in
British women to asses possible risk factors for bone density in these women by
DXA for 284 women aged between 21 to 68 years. The results showed that the
Page 31 of 129
bone density was affected by increasing age related to menopause series. Other
factors affected diminishing bone density, and hence increasing risk for
osteoporosis, such as low body weight, alcohol and cigarette consumption, null
parity, lack of preceding use of oral contraceptives, and lack of regular exercise.
In addition, the study suggested for continuous measuring the bone mineral
density by DXA to detect early women who have high risk of developing
osteoporosis, (Stevenson et al., 1989).
In New York USA, a study conducted in 1985 to compare between 58
women with postmenopausal osteoporosis with 58 age matched normal women.
The finding showed that women who had diagnosis with osteoporosis have
lower total body calcium levels and BMD, and those who had an earlier
menopause, smoked cigarettes more, and had breast-fed less often developed
osteoporosis ,they also had lower levels of estrogen, estradiol, and testosterone
and reduced levels of 25-hydroxyvitamin D . That suggest these factors
considered modifiable risk factor for developing osteoporosis, (John et al.,
1985).
In Finland, epidemiologic study conducted in 1994 to assess the special
effects of menopause and certain behavioral risk factors on (BMD) by
measuring the BMD by DXA for Spinal and femoral neck for 1600
premenopausal women aged 48–59 years. The result was considered that the
menopause had a main effect on BMD. Postmenopausal women had pointedly
lower BMD in both spine and femoral neck as related with premenopausal
women. Multiple factors also contributed in decreasing the BMD like weight,
menopausal status and age, moreover, physical activity was found to be an
important predictor of lowering the BMD, (Kröger et al., 1994).
A study was conducted in 2001 to measure the relation between use of
oral contraceptives (OCs) and effects on bone mineral density (BMD) for
Page 32 of 129
women who aged 25–45 years. The women have been join up to two groups
one group included women who have been use OC (≥ 3 months) and other
group were women who have certainly not used OC (0 to < 3 months). The
findings showed that women who had ever and those who had never used OCs
showed no variances in age, age at menarche, parity, present calcium intake,
exercise, body mass index (BMI), education and past irregular cycles or
amenorrhea. Moreover, BMD values showed lower in OC group and the mean
length of use was 6.8 years, (Prior et al, 2001).
A cross sectional retrospective epidemiologic study was conducted in
1991 to determine risk factors for low bone mineral density (BMD) for 2297
women 76% of whom were postmenopausal. The women were classified into a
BMD category based on the range of BMD measurements and other data
(history of oral contraceptive use).The finding indicated that menopause,
increasing age and years since menopause, and decreasing body mass index
were associated with low BMD. In addition, the history of oral contraceptive
use was protective against low BMD and increasing duration of use was more
protective. The most important point indicated by the results that, the use of use
of oral contraceptive agents, was found to be associated with higher levels of
BMD and that the degree of protection from lower BMD is related to duration
of exposure”, ( Kleerekoper et al., 1991).
In United Kingdom, a study conducted in 1994 to define the relationship
between parity and bone mineral density in middle-aged women. 825 women
were chosen to participate. It was establish that the mean of BMD was
significantly higher at all sites (the spine, hip and Ward's triangle) among the
parous women, it was indicated that there was an increase by 1% in BMD per
each live birth, which revealed a positive between parity and bone mass,
( Murphy et al.,1994 ).
Page 33 of 129
A cross sectional study conducted in United Kingdom in 1994 to study
the effects of milk intake on recent bone mineral density at the hip and spine for
284 women aged 44-74 year. The women were categorized their average milk
consumption to their age into up to age 25, from age 25-44, and from age 44 to
the present time. The finding showed that the average of milk consumption
wasa significant independent predictor of bone mineral density at both hip and
spine in woman who their age was up to 25. Nevertheless, the women who was
their age 25-44 year and from age 44 year has not statistically important,
(Murphy et al., 1994).
In turkey 2013, a study explored the effects of parity and age at first
pregnancy and breast-feeding and the interval of BF for total and per child on
postmenopausal osteoporosis among 542 women who were divided to 2 groups
based on the presence (osteoporosis group) or absence of osteoporosis (non-
osteoporotic group).The finding showed that the osteoporosis group had
pointedly lower parity compared to non-osteoporosis group. Prolonged breast-
feeding period per child > 1 year is the greatest risk factor for osteoporosis
independent of first breast-feeding age. However, high parity has a defensive
effect, (Okyaya et al., 2013).
In Asian countries, a study conducted in 2008 to evaluate the risk factors
for osteoporosis in postmenopausal women from selected BMD centers in Iran
and India. The sample sizes from Iran was 363 subjects (178) of them
osteoporosis and the rest of them (185) normal, and from India a total of 354
subjects (203) osteoporotic and (151) normal. They separated into two groups;
case group (postmenopausal osteoporotic women bone density higher than 2.5)
and control group (postmenopausal women with normal bone density). The
results showed the risk factors in Iran and India respectively by odds ratio were
as duration of menopause greater than 5 years: (2.2) (1.4), menarche age (after
14 years): (1.9) (1.6), menopause age (before 45 years): (1.1) (2), parity more
than 3: (1.1) (1), bone and joint problem (2.3) (2.2).However, calcium
Page 34 of 129

supplementation more than 1 year, exercises, regular consumption of cheese,
milk and HRT were shown as defending factors in India, (Keramat et al., 2008).
In India, a study was conducted in 2013 to monitor the bone status
osteopenia and osteoporosis for whom their age were more than 35 years, of158
women .The results showed that there was statistically important connection
between age group and the incidence of osteopenia and osteoporosis. There was
a negative association between age of the women and BMD. As well age,
gravida status and menopausal status have negative correlation with BMD while
there was a positive association with physically active lifestyle, (Agrawala and
Vermab, 2013).
Osteoporosis and estrogen
In USA California, study conducted in November 1990 to examine the
prevalence and determinants of estrogen replacement therapy in 9704 non-black
women, age ≥65 years. The finding indicated that the prevalence of estrogen
hormone uses among woman who have been diagnosed osteoporosis was 24%
of participants, and the uses of estrogen hormone replacement therapy was
common among women who had higher levels of education and who were less
obese,(Cauley et al., 1990).
In USA, a study conducted during 1988-1994 to estimate osteoporosis
prevalence based on BMD. The findings indicated that most estrogen-deficient
women in the United States who had femoral osteoporosis were ignorant of
having this condition, (CDC, 1998).
In Japan, other study published in 2013 to determine the effect of
estrogens on the development of immobilization osteoporosis by measurement
of cortical thickness of the femurs. The findings showed that administration of
Page 35 of 129

conjugated estrogens significantly protected against the decrease in the bone
density and the cortical wideness of the femurs, (Orimo et al., 1970).
In United States, a double blind, randomized study conducted in 1992 to
estimate the acceptance and efficiency of transdermal estrogen for women with
established postmenopausal osteoporosis and vertebral fractures. 75women
were chosen, their age was between 47 to 75 years. After the measurement, the
results showed that the group who took the estrogen had an increased or steady-
state bone mineral density at the lumbar spine, femoral trochanter and mid
radius compared with placebo groups, which mean that the estrogen therapy
have the effectiveness treatment in postmenopausal women with well-known of
osteoporosis ,( Lufkin et al., 1992) .
In Romania, a cross-sectional study conducted in 2012 to define the
association between (BMD) in pre and postmenopausal women and estrogen
levels. The women divided for six groups composed of 8- 15 pre and
postmenopausal fit volunteers with dissimilar weights. The result foundthat the
BMD in postmenopausal women were lower than in premenopausal women
regardless of body weight. Estradiol and estrogen were positively associated
with bone mass in premenopausal women, but not in postmenopausal women,
(Corina, Vulpoi and Branisteanu, 2012).
In morocco, a study conducted from period between October 2012 to
April 2013 among menopausal women aged 50 years old and over. 207 women
who had no previous diagnosis of osteoporosis joined the study to define the
relationship of sex hormones, bone remodeling indicators and vitamin D levels
with (BMD). The result showed the significance of postmenopausal estrogen in
the bone loss and the pathogenesis of osteoporosis in old women,(El Maataoui
et al., 2015).
Page 36 of 129
Osteoporosis and Vitamin D
In Australia, a random sample of women (n=861) aged 20-92 was select
for cross sectional study to evaluate vitamin D intake and casual exposure to
sunshine. The result showed that the participant’s intake of vitamin D was 1.2
micro g/day. However, the intake of vitamin D supplements by participants
have been increased from 7.9% to 8.1%, also it was observed that there was
relationship between serum 25 OH D levels and the seasons, they found that
prevalence of low concentrations of serum 25 OH D were most common in
winter, (Pasco et al., 2001).
In Poland, a cross-sectional study based on the regional urban non-
institutionalized sample of 107 postmenopausal women in the age range of 51-
83 years to evaluate the seasonal occurrence of inadequate (insufficient or
deficient) serum vitamin D levels in women who screened for osteoporosis. The
prevalence of vitamin D deficiency and insufficiency were shown in spring
(54%) and (32%), in summer (46%) and (46%), in autumn (67%) and (27%),
and in winter (61%) and (22%), respectively, (Stolarczyk et al., 2014).
In China, a study occurred to define the prevalence of vitamin D
insufficiency and its risk factors in addition to its association with osteoporosis
in a Chinese people. Random method was used to select 2942 participants of
both gender with the age group of 40-75. The analysis showed that vitamin D
deficiency(25(OH)D levels < 20 ng/mL) prevalence was 75.2% in the
participants with more occurrence in women (79.7%) than men (64%) .The
analysis also indicated that the significant predictors of vitamin D deficiency
included coronary heart disease, obesity, dyslipidemia, older age, female sex,
and smoking. However, tea intake, moderate physical activity, milk intake,
vitamin D supplementation and sun exposure were considering protective
factors. The major point in this study indicated that reduced in 25(OH) D levels
were not primary related with an increased osteoporosis risk,(Zhen et al., 2015).
Page 37 of 129

In Japan, a study conducted in 2003 to assess the effectiveness of sunlight
exposure in increasing serum 25-OH D, in dropping the severity of osteoporosis
in (BMD) for 258 participants which divided to 2 groups, 129 received regular
sunlight exposure for 12 months and the remaining 129 (sunlight-deprived) did
not. The results showed that in the sunlight-exposed group the BMD increased
by 3.1% and decreased by 3.3% in the sunlight-deprived group. Moreover, 25-
OH D level increased by fourfold in the sunlight-exposed group which mean
that the sunlight exposure can increase the BMD of vitamin D-deficient bone by
increasing 25-OH D concentration, (Sato et al., 2003).
Bone density scan (DXA)
In Pakistan, observational study was designed to measure efficacy of
DEXA procedure in early detection of osteoporosis with age group 30-60 years
among female and male. The study conducted from November 2010 to October
2013. The DEXA results were normal among male about (39.10%) and among
women (23.50%) and about (45.60%) of female there DEXA result indicated
for osteopenia and (47.80%) in male, however, the results of osteoporosis
showed a significant increase in women (30.90%) and (13%) in male who have
osteoporosis, in addition, it showed that In urban areas the normal results were
(23%), osteopenia (46.50%) and osteoporosis (30.50%) In rural areas, normal
(28.70%), osteopenia (43.70%) and osteoporosis (27.60%), (Makhdoom et al.,
2014).
A study conducted in the department of family medicine to screen BMD
testing interval which indicated for estimated time for women who make the
transition to osteoporosis before have any clinical risk factors, among 4957
women who were with normal BMD or osteopenia and with no history of hip or
clinical vertebral fracture or treatment for osteoporosis their ages was 65 years
or older were would be followed prospectively for up to 15 years .The finding
Page 38 of 129

indicated according to interval test ,that osteoporosis would develop in less than
10% of older women (more than 65 years) and for postmenopausal women it
would develop osteoporosis approximately in 15 years, in 5 years for women
with moderate osteopenia, and in 1 year for women with advanced osteopenia,
(Gourlay et al., 2012 ).
A prospective study conducted in 2010 to compare the measurements of
osteoporosis in patients with femoral neck fractures by using the histological
method of diagnosis to the same patients with DEXA, The results showed that
the DEXA detected 88.2% of possible cases of osteoporosis, but the specificity
of this diagnostic tool was 62.5% .However, The parameters of osteoporosis by
histological histomorphometric were 68% of patients with the femoral neck
fracture ,the important point that covering in this study was indicated that the
DEXA could be used as diagnostic tool for osteoporosis but less efficient than
the histological histomorphometric method and the DEXA is enough as a
diagnostic tool to detect osteoporosis in one place (lumber femoral) because
there is no difference in the mean between the femoral DEXA and lumber
DEXA (mean=zero), (Humadi, Alhadithi and Alkudiari SI, 2010 ).
Other study conducted in 2002 to assess the precision, sensitivity, and
specificity of dual-energy X-ray absorptiometry (DXA) scanner applied to 202
women there aged was 55 by using World Health Organization (WHO) criterion
for defining osteoporosis. The result showed that the specificity of DEXA to
identify patients with osteoporosis at total hip, femoral neck, spine, or any of
these axial sites was excellent (97.0%, 97.0%, 96.5%, and 97.1%, respectively);
but the sensitivity was poor (58.8%, 36.4%, 21.8%, and 20.3%, respectively).
So The WHO criterion is not appropriate for DXA, (Pacheco et al., 2002).
Awareness of osteoporosis
In Nanjing, People’s Republic of China, study conducted to evaluate the
level of awareness of osteoporosis. Questionnaire, was given to 9983 men and
Page 39 of 129
women, their aged was 40 years. The results showed that Osteoporosis was
“silent disease” and was not widely recognized in the community, which would
account for why only 30.7% of their study population had heard of osteoporosis.
In addition, they found that 52.9% of the subjects drink milk, 16.0% took
calcium, 7.1% took vitamin D, and 47.2% were performing regular physical
activity, (Xu et al., 2011).
In Egypt, a study conducted to assess knowledge about osteoporosis (OP)
among 532 women aged more than 40 years, by answering the questionnaire.
The results showed the majority of women (95.1%) reported that were familiar
with osteoporosis and this knowledge of osteoporosis was associated with the
level of education and employment status of the participant woman, (Eltawab et
al., 2015).
In southeastern Poland, a group of 300 women aged 45-65 have been
selected to assess their level of knowledge in the pre- and
postmenopausal period about the prevention of osteoporosis. The results
showed that the women have an average level of knowledge about the role of
physical activity in the prevention of osteoporosis. Also it showed a low level of
knowledge of these women about well-balanced diet rich in calcium, and also it
showed that the socio-demographic factors and lifestyle influenced the level of
this knowledge, (Janiszewska et al., 2015).
In USA, a study focused on the level of awareness and knowledge of
osteoporosis but in the adolescent (209 =n) in high school, the mean of
knowledge was 33.1615 and about 75% of participants said that the information
was received from their family and the school role in providing information
about osteoporosis was slight ,(Khorsandi, Hasanzadeh and Ghobadzadeh,
2012).
Page 40 of 129
In USA, a study with a convenience sample of 162 undergraduate
students’ in two groups conducted in 2015 to describe awareness of
osteoporosis- risk factors and preventative behaviors (calcium intake and
exercise) among undergraduate students’ and determine differences in responses
between gender, and student athletes vs. non-athletes. The result showed that
the participant did not have enough experience or knowledge about osteoporosis
risk factors, (Babatunde, Brinkley and Brenda, 2015).
In Israel, a cross-sectional research design study was used to assess
knowledge and attitudes regarding osteoporosis among nurses (n=158)by using
Facts on Osteoporosis Quiz (FOOQ).The results showed that the nursing
knowledge about osteoporosis, prevention and treatment it considered to be
moderate according to score of(FOOQ) which was the average 17 out of 24
scales,(Vered et al., 2008).
In the North West of Ireland, quantitative, descriptive survey was used to
assess the current knowledge of osteoporosis between 128 nurse and midwife.
The finding showed that the nurses and midwife have high level of knowledge
about risk factors .However; the midwives have the highest level of knowledge,
(Hannon and Murphy, 2007).
Page 41 of 129
Methodology
Study design
A quantitative study have been used to assess the relation between BMD,
vitamin D and estrogen hormone among women in Nablus city , started in
August and end in November 2015 .
Setting
The study was conducted in LHS (Little Hand Society)in Nablus, it was
bullied in 1996 in to contribute in improvement of health conditions of
populations under the principle of health for all Palestinian women , it provide
many services for women include gynecological and obstetric mini clinic, also it
have a pediatric clinic, orthopedic doctor and DXA (dual energy X-ray
absorptiometry) device that use to measure the bone mineral density. A
laboratory services also was provide there. In addition, the funder suggested
working with them according to their services and due to financial issues. That
is why this association is very suitable for this study.
Population
The population of the study was all women who live in Nablus city that
composed about (52%) of all population (PCBS, 2013).
Sample method and sample size
A quota convenience method was used, 300 women were included
according to previous studies.
Participants were divided into three groups each group consisted of 100 women
start with age 35 as following:
1. Women who their ages between (35-44) year.
2. Women who their ages between (45-54) year.
3. Women who their ages above than 55 year.
Page 42 of 129

The sample has been collected conveniently according to the inclusion
criteria, after reaching the participant in the society.
It was proposed to use simple random method (every other woman) to
select the women, but it was noted during piloting that it was unethical to
return woman who came to the society to do the tests that was advertised
through face book of the society and students.
Inclusion criteria
1) Women participants
2) The age above 35 years
Exclusion criteria
1) Woman who were lactated
2) Women who were pregnant
Data collection tools
It consisted of three tools, as following:
The first tool was self-administrative questionnaire (Questioner: Annex I) which
was developed based on previous studies and some questions in obstetric and
history part , obtained from free questionnaire (Clinic DA, 2010). It consisted of
five parts, which combined multiple-choice questions and yes/no responses was
used:
First part (Q1-Q8): the demographic data included name, age, job,
weight, height, marital status, financial status and place of residency.
Second part (Q9-Q13): of the questionnaire consisted of five questions to
assess medical and surgical history include the presence of certain
diseases, back pain, joint pain and family history osteoporosis.
Page 43 of 129
Third part (Q14-Q27): of the questionnaire involved thirteen questions
about gynecological and obstetric history include pregnancies and
abortion number, menarche age, menopause age, number of breastfeeding
children and duration of breastfeeding and hormone replacement history
include the duration of using it.
Fourth part (Q28-Q36): of the questionnaire consisted of nine questions
to assess nutrition pattern history, which focused on Calcium intake
(milk, yogurt and white cheese intake), soft drink, cola, vitamin D
supplement and smoking.
Fifth part (Q37-Q43): of the questionnaire contained seven questions to
assess the life style of participant as exercises include the duration, type
of exercise and period that spent. Also some questions were told about
the exposure of sun (time and body surface area).
The second tool included blood-sampling test to measure the estrogen
Level and sent to Al-Najah Laboratory and Vitamin level and sent to
Al-Masri Laboratory
The third tool was the DXA device to scan the bone mineral density
(BMD) on two places at lumber site between (L1-L4) and femoral site (hip and
knee ).
Validity and Reliability of the questionnaire
The questionnaire was reviewed to assess the words and effectiveness
that included in it by five instructors based on their experts and their opinions,
some framing of demographic questions was done to be more understandable
for the participants also it was tested by:
Page 44 of 129
Pilot study
It was accomplished after developing of questionnaire on 10% of the
sample aiming to ensure women understanding of the questionnaire, time
needed for fulfilling it and the time for each procedure and as a results about 8-
10 minutes was taken to fulfill the questionnaire by the participants ,some
questions changed to be more accurate and more specific in data analysis and
understood for the women amount of milk intake(Q28) was changed from
(never ,sometimes ,always ) to (Never , (1-3 ) Glass , Week , (4-6) Glass ,Week
and (1 Glass) Every Day( , the procedure (blood sample and DXA device ) for
each women was taken about 30 minutes , and it was included in the sample
size .
Cronbach's (alpha) test
It was done to measure the reliability of the questionnaire by SPSS,
which was (0.607) for 28 items.
Validity and reliability for DXA
History of dual energy X-ray absorptiometry (DXA)
The first technique of BMD measurement was introduced in 1963, as a
single photon absorptiometry (SPA) of the forearm. The limitation of SPA is
make a check for the peripheral skeletal sites only, after that the dual photon
absorptiometry (DPA) was developed 1987. DXA become a gold standard for
BMD measurement at that year because of its high image quality, accuracy and
fast scanning times. According to a 1997 National Osteoporosis Foundation
(NOF) survey, 89% of bone density tests performed in the United States in one
year used DXA. There are three commercial manufacturers of DXA
instruments: Hologic, Lunar, and Norland. The fundamental principle behind
DXA measurement is the use of transmission X-ray through the body by two
Page 45 of 129
different photon energy levels, which are absorbed mineral and soft tissue,
(Zack, 2002).
The Reliability and validity of bone mineral density (BMD) measurement
were examined by QDR-4500A dual energy X-ray absorptiometry (DXA,
Hologic Inc., Bedford, MA) at Virginia Tech on a group of young-adult males
and females. Scanting of the lumbar spine total forearm, total proximal femur
twice, without significant differences between repeated measures. (Zack, 2002),
the use of DXA at hip and lumbar spine is recommended by the WHO in many
studies that referred to the organization, (WHO, 2004).
DXA scanners the lumbar vertebrae and the hip throw an x-ray beam that
measure the shadow cast by the bones. The result is expressed as a number of
grams per square centimeter. DXA scans are two-dimensional, like a plain X-
ray.
The world health association (WHO) classifies T scores in the DXA results as
follows:
* Above -1 SD is normal
* Between -1 and -2.5 SD is defined as decreased bone mineral density
osteopenia
* Below -2.5 SD is defined as osteoporosis
(El Maghraoui, 2012)
BMD test in little hand association
The DEXA in LHS was bring form USA in 2013 , this device model was
Discovery QSR series; operator manual is used to measure the BMD which
synthesized at Hologic for Osteoporosis Assessment in USA.
The Hologic whole body DXA references database software used on
hologic QDR bone densitometers measure the regional and whole body bone
Page 46 of 129
mineral density, the values can be displayed in user defined statically formats
and trends with color image mapping and compared to reference populations at
the sole discretion of the criteria of WHO and health care professional.
Software used in the QDR series was developed using ICE 60601-1-4 as
a guide, the classification of the QDR series X-ray bone demonstration under
this specifications in class 1 type B.
Lumbar spine examination, at first the AP lumbar spine selected from
scan type, after that the patient has been set on their back with their head at the
right end of the table. For femoral examination the patient set by place his foot
positioner under his leg and align its center with the table and the patient
midline, after that the entire leg was rotated 25 degree inward and place the
medial edge of the foot against the petitioner.
Quality control (QC) procedure is daily checked by using phantom, when
auto QS passes, the users click “OK” to start scanning patients .If auto QC fails,
the user follow the instructions to resolve problems . Also check on paper and
ink is daily, and before started working on, the user leave it 15 minutes to start
software and get ready for scanning. Daily it can scan for 30 patients.
Vitamin D test validity and reliability
Test ID: 25 OH vitamin D Two bioequivalent forms of vitamin D:
Vitamin D2: obtained from vegetable sources.
Vitamin D3: synthesized from cholesterol through sun exposure.
Vitamin D deficiency is more common than previously believed,
especially among adolescents, women, and the elderly. The total 25-
hydroxyvitamin D (25-OH-VitD) level (the sum of 25-OH-vitamin D2 and 25-
Page 47 of 129
OH-vitamin D3) is the appropriate indicator of vitamin D body stores.(Mayo
Medical, 2013)
Specimen Type
Serum (blood sample)
Reference Values
Total 25-hydroxyvitamin D2 and D3 (25-OH-vit D)
<19 ng/mL (vitamin D deficiency)
20-50 ng/mL (normal levels)
>51ng/mL (toxicity )
(Mayo Foundation for Medical Education and Research. 2013)
Maximum Laboratory Time
5 days
25-OH vitamin D ELISA for the quantitative measurement of 25-OH
vitamin D in human serum
A kit that was used with references 55500 and contain 96 tests, produced
by HUMAN company in German used for the determination of 25-hydroxy
vitamin D2 and D3, it is stored in the dark at -20 C until the procedure done
within 3 days, all the procedure done according to the procedural note that
attached with the kit, every kit contain:
Microtiter strips 12 MTP.
Vitamin D Calibrator CAL0 2 ml, CAL1 1 ml, CAL5 1 ml.
Vitamin D control 1 Control 2 1 ml
Incubation buffer (INC BUF) 20 ml
Vitamin D conjugate solution (CON 100x) 100µl ,
Conjugate buffer 30 ml ,
HRP solution 200µl ,
Page 48 of 129
Washing buffer 10 ml
Substrate 12 ml
Validation of the vitamin D is based on control 1 and control 2 should be
within the range specified in the vial label if it showed high concentration above
the highest calibrator , should be assayed in dilution by CAL 0.
Quality control samples, should be run according to local regulations, the
results should be within the established ranges.
Validity and reliability of estrogen (Estradiol (E2))
Estrogen is a hormone produced by ovaries and involved in development
of female cell maturation, pregnancy and growth. There are two major type of
estrogens Estriol (E1) and estradiol (E2). E1 is usually used to measure the
estrogen level during pregnancy, E2 used to evaluate the estrogen level in non-
pregnant women and in menopause women because of that the E2 test is
estimated in the study .Estradiol have varies amount during the menstrual cycle
and it is decline to a very low level after menopause and there is vary ranges
from lab to lab (WebMD, 2014).
The kit (Elecsys Estradiol 1370 II reagent kit Cat .No.03000079122-100
test) which contain M 6.5 mL, R1 9 mL , R2 9mL , have been assembled into a
ready-for-use unit that cannot be separated .The sample stored at 2-8 C upright
in the kit to ensure complete availability of the micro particles during automatic
mixing prior to use.
For quality control, use ElecsysPreciControl Universal 1 and 2, controls
for the various concentration ranges should be run as single determination at
least once every 24 hours when the test is in use, once per regent kit, and after
every calibration
The analyzer automatically calculates the analytic concentration of each sample.
Page 49 of 129
Conversion factors: pmol/L x 0.273 = pg/mL
pg/mL x 3.67 = pmol/L
Normal Results
Female (not menopausal ): 15 to 350 pg/mL
Female (menopausal ): < 10 pg/mL
(Mayo Foundation for Medical Education and Research, 2015)
Normal value ranges may vary slightly among different laboratories.
Filed work
Data was collected during August 25 to September 7. Study was
conducted in LHS, the participants were the society reviewers and who saw the
posting event in the Facebook (Annex II). The purpose of the study was
explained to the participant, and then woman answered the questionnaire
themselves. For those women who have some difficulty in reading the
questions, the researcher assisted them. And if it was found missing questions,
participants have been asked to refill the questions, but if the missing data was
found this because the researcher was not available in that time. The blood
sample was taken while the participant waiting their turn in the DXA room, then
the tubes were labeling with women name and coding by numbers, after twice
cheeked then sent to the Al-Masri and Al-Najah laboratory.
In the DXA rooms the work done as the following:
1. Provide the required explanation and instruction to the participant about
the procedure.
2. Took the demographic data (age , name ,weight , height , social status ) ,
gynecologic and reproductive data ( number of children , menopause ,
status of period ) medication (corticosteroids ) calcium intake ,smoking
and other questions and enter it to the software of DXA .
Page 50 of 129
3. Prepare the women for the examination (place and positioning )
4. The participant took a hard copy for her result of DXA , and the results of
vitamin d and estrogen , women have been called by LHS to get their
results and the abnormal results were reviewed by obstetric and
orthopedic doctors .
Page 51 of 129
Data Analysis
Coding and data entry was done using Statistical Package for Social
Science (SPSS).The Statistical analysis tests used in the study were:
Frequency distribution and percentage were used for categorized
variables
Chi square test was used to approve the hypothesis and compare variable
and their distribution.
The dependent variable
Table 1 Values of dependent variables
Dependent variable Operational meaning The level of estrogen (E2)
Female (not menopausal ): 15-350 pg/mL Female (menopausal): <10 pg/mL
Vitamin D <19 ng/mL (vitamin D deficiency) 20-50 ng/mL (normal levels) >51ng/mL (toxicity )
BMD (DXA results) Category T-score rangeNormal T-score ≥ −1.0Osteopenia −2.5 < T-score < −1.0Osteoporosis T-score ≤ −2.5
Independent variable
Table 2 Values of independent variables
Independent variable Value
Age This has three options (35-45, 45-55 and 55< years old).
Marital status This has four options (single, married, divorced, and widowed).
Family history of Osteoporosis Positive or negativeAge at Menarche Numeric valueAge at Menopause Numeric valueamount of milk consumption in glass /week Numeric valuePerforming physical Activities/Exercise Yes/no , amount Usage of hormonal tablet yes/no
Page 52 of 129
Ethical Considerations
The study approved from institutional review board (IRB) (Annex III)
from An-Najah National University in Nablus. After that approval, data
collection started after agreement with the LHS, and the consent form (Annex
IV) was provided to the participant within the second paper of the formed
questioner. In addition, data was kept confidential with the researchers and
supervisor after data collection process, and it was kept privacy and security of
participants.
Financial issues:
The fund was obtained from Palestinian Bible Society (Annex V).
Budget
Table 3 Budget
Tool / TestName
Cost for single participant
Number for Participants
Number of participants * cost of single participant
Total
Estrogen test 50-70 NIS 300 300 *60 18,000 NIS
Vitamin D50-70 NIS 150 150*60
DXA 100 NIS 300 300*100 30,000 NISOthers; Copying,Transportation.
50 4 50 * 40 200 NIS
48,200 NIS
Page 53 of 129
Results
Table (1) Distribution of percentage of participant’s regarding to their demographic data
Item No. %
Place of residency
City 251 83.7Camp 9 3.0Village 40 13.3Total 300 100.0
Age(35-44) 100 33.3(45-55) 100 33.3≥ 55 100 33.3Total 300 100.0
Work Status of the employee
Employee 62 20.7House wife 226 75.3Other 12 4.0Total 300 100.0
Monthly Income
≤ 1000 NIS 76 25.3(1000-1999) NIS 99 33.0(2000-2999) NIS 89 29.7More than 3000 NIS 36 12.0Total 300 100.0
Marital statusSingle 42 14.0Married 221 73.7Divorced 6 2.0Widow 31 10.3Total 300 100.0
BMI CAT
< 18 (underweight) 3 1(18-24.9) normal 65 21.7(25-30)over weight 106 35.3> 30 (obesity) 126 42.0Total 300 100.0
Table (1) showed that (83.7%) of participants reported that they live in
city. And (75.3%) of them, are housewife. Regarding to marital status (73.7%)
of them reported that they are married. Moreover there were (33%) of
participants reported that their income was (1000-1999) NIS
Page 54 of 129
Table (2) Distribution of participants according to medical and surgical history
Item No. %
Previous Surgical history
Yes 164 54.7No 136 45.3Total 300 100
History of any disease
Hypertension 85 28.3Diabetes 42 14Thyroid disease 6 2Rheumatoid arthritis 70 23.3Have no Disease 163 54.3
Complain of Back pain
Yes 200 66.7No 98 32.7Total 298 99.3Missing 2 0.7Total 300 100
Complain of joint pain
Walking on flat land 56 26.3Raise a stairs 173 57.7Raise a high place 99 33Kneeling when praying 130 43Have no pain 73 24.3
Family history of Osteoporosis
Yes 83 27.7No 211 70.3Missing 6 2Total 300 100
Table (2) showed that (54.7%) of participants reported that they have
previous surgical history, (28.3%) of them have Hypertension, while (54.3%) of
them they have no disease. According to joint pain (57.7%) of participants
reported that they have a joint pain during raise a stairs and (43%) of them
reported that they have a joint pain during kneeling when praying. In addition
there was (70.3%) of them they have no family history of osteoporosis.
Table (3.1) Distribution of participants according to their obstetrics history
Page 55 of 129

Item No. %Number of Gravida No Pregnancies 53 17.7
≤ 2 24 8.0(3-5) 119 39.6 ≥ 5 104 34.7Total 300 100.0
Number of Parity Not Giving Birth 55 18.3≤ 2 23 7.73-5 134 44.7>5 88 29.3Total 300 100.0
number of Abortion No Abortion 190 63.3≤ 2 99 33.03-5 7 2.3>5 3 1.0Total 299 99.7Missing 1 .3Total 300 100.0
Length of Period <18 99 33.0(18-24) 102 34.0(24-28) 80 26.7>28 15 5.0Missing 4 1.3Total 300 100.0
Status of period Regular 104 34.7Irregular 46 15.3Menopause 150 50.0Total 300 100.0
Menopause period / since
<1 Year 23 7.7(1-3) Year 30 10>3 Year 103 34.3It’s Not Menopause 142 47.3Missing 2 .7Total 300 100.0
Table (3.1) showed that (39.6%) of participants reported that they have
(3-5) pregnancies. According to number of parity (44.7%) of participants they
have (3-5) children. In addition (34%) of participants reported that the length of
their menstrual period was (18-24) day. According to status of period, (34.7%)
of them reported that they have regular period, also (34.3%) of participants
reported that they have been menopause more than 3 years ago.
Table (3.2) Distribution of participants according to their breast feeding history
Item No. %
Page 56 of 129
History of Breast feeding
Yes 228 76.0No 16 5.3Have No Children 56 18.7Total 300 100.0
No. of Breast Fed Children
1-3 65 21.7(4-6) 127 42.3>6 Months 37 12.3Have No Children 56 18.7Did Not Breast Fed 14 4.7Total 299 99.7Missing 1 .3Total 300 100.0
Period of Breast Feeding
<6 Months 29 9.76 Months To 1 Year 86 28.7>1 Year 114 38.0Have No Children 55 18.3Did Not Breast Fed 14 4.7Total 298 99.3Missing 2 .7Total 300 100.0
Usage of hormonal tablet
Yes 88 29.3No 212 70.7Total 300 100.0
Reason of hormonal Usage
Contraception 78 26Hormone Replacement 11 3.7Did Not Use 211 70.3Total 300 100.0
Period of hormonal
<1 Year 31 10.3(1-3) 29 9.7>3 Year 25 8.3Did Not Use 211 70.3Total 296 98.7Missing 4 1.3Total 300 100.0
Table (3.2) showed that (76%) of participants reported that they have a
history of breast feeding, (42.3%) of them reported that a number of breast fed
children was between (4-6) children. According to period of breast feeding,
(38%) of them reported that they fed their children for more than 1 year. In
addition (70.7%) of participants reported that they did not use hormonal tablet.
While (26%) of them reported that they use hormonal tablet for contraception.
Table (4) Distribution of percentage of participants according to their life style and nutrition
Item No. %
Page 57 of 129
Amount of milk consumption in glass /week
Never 99 33.0(1-3 )Glass / Week 126 42.0(4-6) Glass /Week 10 3.3(1 Glass) Every Day 65 21.7Total 300 100.0
Amount Of Cheese Consumption In piece /week
Never 7 2.3(1-3) Piece /Week 121 40.3(4-6) Piece / Week 52 17.3(1 Piece Every Day) 120 40.0Total 300 100.0
Amount of yogurt consumption in glass /week
Never 15 5.0(1-3 )Glass / Week 155 51.7(4-6) Glass /Week 30 10.0(1 Glass )Every Day 100 33.3Total 300 100.0
Amount of soft drinks consumption in glass / week
Never 78 26.0(1-3 )Glass / Week 158 52.7( 4-6 )Glass / Week 23 7.7(1 Glass Every Day 39 13.0Total 298 99.3Missing 2 .7Total 300 100.0
Taking calcium supplements per day
Always 30 10.0Sometimes 97 32.3Never 173 57.7Total 300 100.0
Taking vitamin D per day
Always 26 8.7Sometimes 83 27.7Never 188 62.7Total 297 99.0Missing 3 1.0
Total 300 100
SmokingYes 97 32.3No 203 67.7Total 300 100.0
Table (4) showed that (42%) of participants reported that they used to
consume (1-3) glasses of milk per week. In addition (2.3%) of them reported
that they never ate cheese. Also it showed (51.7%) of them that they consumed
(1-3) Glass of yogurt /week. Regarding to the amount of soft drinks
consumption, (52.7%) of them consumed (1-3) glass /week. Also it showed
(57.7%) of the participants reported that they have never taken calcium
supplement, and (8.7%) of them reported that they always take vitamin D every
Page 58 of 129
day. Regarding to the smoking status, (32.3%) of participants reported that they
smoke.
Table (5) Distribution of percentage of participants according to their physical activity
Item No. %
Performing physical Activities/Exercise
Yes 83 27.7No 187 62.3Sometimes 30 10.0Total 300 100.0
Type of ExerciseWalking 102 34Running 16 3.6Another Exercises 10 5.3Don’t Do Any Exercise 188 62.7Total 300 100.0
Duration of exercise in minuets /day
<30 Minute 49 16.3(30 Minute) 36 12.0>30 Minute 27 9.0Don’t Do Any Exercise 188 62.7Total 300 100.0
Days number of exercise performing /week
1-3 Days / Week 56 18.7( 4-6) Day / Week 15 5.0Daily 28 9.3Don’t Do Any Exercise 188 62.7Total 287 95.7Missing 13 4.3
Total 300 100
Table (5) showed that (27.7%) of the participants reported that they
perform physical activity, and (34%) of them perform walking exercise.
According to duration of exercise in minute per day, (9%) of the participants
reported that they spent more than 30 minutes doing Exercises and (5%) of
them were performing exercises from (4-6) day per week.
Table (6) Distribution of percentage of participants according to sun exposure
Page 59 of 129
Item No. %
Sun exposureYes 227 75.7No Exposure 73 24.3Total 300 100.0
Body parts to sun Exposure
Hands 5 1.6Legs 7 2.4Face 18 6.0Hands and Face 112 37.3Hands, Legs and Face 21 6.9All Body 44 14.7Hands, Legs 13 4.3Back ,Hand, Legs 4 1.3Don’t Exposed 72 24.0Missing 4 1.2Total 300 100.0
Duration of Sun Exposure in mint
<30 Min 129 43.0(30 Min) 50 16.7>30 Min 49 16.3Don’t Exposed 72 24.0Total 300 100.0
Table (6) showed that (24.4%) of participants reported that they haven’t
exposed to the sun. While (37.3%) of them reported that the body parts which
were exposed to sun were hands and face, and (16.3%) of them were spent more
than 30 minutes to exposure of sun.
Table (7) Distribution of percentage of participants BMD of femoral and lumber results
Item No. %
Page 60 of 129
BMD of femoral Normal 176 58.7Osteopenia 108 36.0Osteoporosis 16 5.3Total 300 100.0
BMD of lumberNormal 156 52.0Osteopenia 107 35.7Osteoporosis 37 12.3Total 300 100.0
Vit D serum
<19 37 23.120-50 122 76.3>51 1 .6Total 160 100.0
Estrogen serum(15-350) 111 37.0(<15) 39 13.0Menopause.(>10) 98 32.7Menopause.(<10) 52 17.3
Total 300 100.0
Estrogen serum at age 35-44
15-350 75 75.0Less than 15 20 20.0Menopause.(>10) 4 4.0Menopause.(<10) 1 1.0Total 100 100.0
Estrogen serum at age 45-55
15-350 35 35.0Less than 15 17 17.0Menopause.(>10) 34 34.0Menopause.(<10) 14 14.0Total 100 100.0
Estrogen serum at age >55
15-350 2 2.0Less than 15 1 1.0Menopause.(>10) 60 60.0Menopause.(<10) 37 37.0Total 100 100.0
Estrogen serum for women have regularPeriod
15-350 76 76.0Less than 15 24 24.0
Total 100 100.0
Estrogen serum for women have irregular period
15-350 72 72.0Less than 15 28 28.0Total 100 100.0
Estrogen serum for women who were menopause
Menopause.(>10) 65 65.0Menopause.(<10) 35 35.0Total 100 100.0
Table (7) showed that (5.3%) of participants have femoral osteoporosis,
(12.3%) of them have lumber osteoporosis. Also it showed that there were
(76.3%) of them have normal results of Vit D (20-50). Moreover (37%) non–
Page 61 of 129
menopausal participant their results of estrogen were (15-350) and(17.3%) of
menopausal women their results were less than (10).
Estrogen serum level according to age
75%
20%
4%1%
Estrogen level at age 35-44
(15-350)
(less than 15)
35%
17%
34%
14%
Estrogen level at age 45-55
(15-350)(less than 15)menopause.(more than 10 )menopause.(less than 10)
2% 1%
60%
37%
Estrogen level at age >55
(15-350)
(less than 15)
menopause.(more than 10 )
menopause.(less than 10)
Page 62 of 129
Estrogen serum level according status of period
76%
24%
women have reguler period(15-350) (less than 15)
72%
28%
women have ir-regular period
(15-350) (less than 15)
65%
35%
women were menopause
(more than 10 )(less than 10)
Table 6Distribution of participants’ percentage according to their age and BMD
Page 63 of 129
Age
BMD of Femoral BMD of Lumber
Normal Osteopenia
Osteoporosis Normal osteopeni
aosteoporosi
sN % N % N % N % N % N %
(35-44) 74 74.0 25 25.0 1 1.0 75 26.
0 24 8.0 1 0.3
(45-55) 63 63.0 34 34.0 3 3.0 49 16.
3 40 13.3 11 3.7
> 55 39 39.0 49 49.0 12 12.0 32 10.
7 43 14.3 25 8.3
Total 176
58.7 108 36.0 16 5.0 15
652.0 107 35.7 37 12.3
Chi- Square 31.96 47.4
P value .000 0.00
Pearson Correlation
0.315 .392
Table (8) showed that (1%) of participants who were at age group (35-45)
year have a femoral osteoporosis and (0.3%) of them have lumber osteoporosis.
While (12%) of participants who were more than 55 year old have femoral
osteoporosis and (12.3%) of them have lumber osteoporosis. The table also
showed that there was positive relationship between age and BMD, as P value
(0.000) < (0.05).
Page 64 of 129
Figure 1 Correlation between age and femoral BMD
Figure 2 Correlation between age and lumber BMD
Table (9) Distribution of participants according to BMI and BMD
BMI
BMD of femoral BMD of lumberNormal Osteopenia Osteoporosis Normal Osteopenia OsteoporosisN % N % N % N % N % N %
<18(Under Wt) 1 0.3 2 0.7 0 0 3 1 0 0 0 0
(18-24.9)Normal 26 8.7 31 10.3 8 2.7 31 10.
3 23 7.7 11 3.7
(25-30)Over Wt 61 20.3 41 13.7 4 1.3 54 18 38 12.7 14 4.7
>30(Obesity) 88 29.3 34 11.3 4 1.3 68 22.
7 46 15.3 12 4
Total 176 58.7 108 36 16 5.3 156 52 107 35.7 37 12.3
Chi-Square 20.8 5.1
P value .02 0.52
Pearson -.242 -.049
Page 65 of 129
Correlation
Table (9) showed that nobody (0%) of participants who were under
weight (BMI less than 18) have an osteoporosis .While (1.3%) of them who
were obese have femoral osteoporosis and (4%) of them have lumber
osteoporosis. it was showed that there was negative relationship between BMI
and BMD, as P value (0.02) < (0.05).
Figure 3Correlation between BMI and lumber BMD
Table (10) Distribution of participants percentage according to calcium consumption and BMD
Calcium
BMD of Femoral BMD of Lumber
Normal Osteopenia
Osteoporosis Normal Osteopeni
aOsteoporosi
sN % N % N % N % N % N %
low 7 2.3 6 2.0 1 0.3 8 2.7 5 1.7 1 0.3
Moderate
5418.0
31 10.3 6 2.0 5117.0
31 10.3 9 3.0
High 105
38.3
71 23.7 9 3.0 9732.3
71 23.7 27 9.0
Total176
58.7
108 36.0 16 5.3156
52.0
107 35.7 37 12.3
Chi-square 1.02 1.75
P value 0.907 .78
Page 66 of 129
Table (10) showed that (2.3%) of participants who consumed low amount
of dietary calcium, have normal result of femoral BMD, and (1.7%) of them
have normal result of lumber BMD. While (38.3%) of them who consume high
amount of dietary calcium have normal result of femoral BMD and (52%) of
them have normal result of lumber BMD. Also it was showed that there was no
relationship between calcium consumption and BMD, as P value (0.907) >
(0.05).
Table (11) Distribution of participant’s percentage according to amount of milk consumption /Week and BMD
Amount of milk consumption in glass /week
BMD of Femoral BMD of Lumber
Normal Osteopenia
Osteoporosis Normal Osteopeni
aOsteoporosi
s
N % N % N % N % N % N %
Never 58 19.3 34 11.
3 7 2.3 58 19.3 31 10.3 10 3.3
(1_3)glass /week 78 26.
0 42 14.0 6 2.0 79 23.
0 45 15.0 12 4.0
(4_6) glass/week 5 1.7 5 1.7 0 0.0 1 0.3 4 1.3 5 1.7
1 glass/day 35 11.7 27 9.0 3 1.0 28 9.3 27 9.0 10 3.3
Page 67 of 129

Total 176
58.7 108 36.
0 16 5.3 156
52.0 107 35.7 37 12.3
Chi-Square 3.26 19.806
P value .77 .003
Pearson Correlation No test because P value more than 0.05 .140
Table (11) showed that (2.3%) of participants who never drank milk have
femoral osteoporosis and (3.3%) of them have lumber osteoporosis, while (1%) of
participants who drank one glass daily have femoral osteoporosis and (3.3%) of
them have lumber osteoporosis. It was also showed that there was positive
relationship between milk consumption and BMD, as P value showed (0.003) <
(0.05).
Page 68 of 129
Figure 4Distribution of Participant’s Percentage according to amount of Milk Consumption /Week and BMD
Table (12) Distributionof participants percentage according to dose of sun exposure/min and BMD
Page 69 of 129

Dose of Sun Exposure
BMD of Femoral BMD of Lumber
Normal Osteopenia Osteoporosis Normal Osteopeni
aOsteoporosi
sN % N % N % N % N % N %
Don’t Expose 76 25.3 45 15.
0 8 2.7 36
12.0 28 9.4 9 3.0
One Part (Minimal Exposure)
27 9.0 21 7.0 2 0.7 15 5.0 10 3.3 6 2.0
Two Parts or More (recommended)
32 10.7 16 5.3 1 0.3 8
327.8 51 17.
1 17 5.7
All Body 41 13.7 26 8.7 5 1.7 2
1 7.0 18 6.0 5 1.7
Total 176
58.7
108
36.0 16 5.3
155
51.8
107
35.8 37 12.4
Chi-Square 7.53 2.7
P value .27 .84
Table (12) showed that (2.7%) of participants who did not exposed to sun
have femoral osteoporosis and (3%) of them have lumber osteoporosis. While
(1.7%) of participants who exposed their body to sun have femoral osteoporosis
also (1.7%) of them have lumber osteoporosis.it was also showed that there was
no relationship between dose of sun exposure and BMD, asP value (.27),(.84) >
(0.05).
Table (13) Distribution of participant’s percentage according to duration of sun exposure and BMD
BMD of Femoral BMD Of Lumber
Page 70 of 129
Duration Of Sun Exposure
Normal Osteopenia Osteoporosis Normal Osteopenia Osteoporosis
N % N % N % N % N % N %
<30 Min 76 25.3 45 15.0 8 2.7 69 23.0 44 14.7 16 5.3
30 Min 27 9.0 21 7.0 2 0,7 23 7.7 18 6.0 9 3.0
>30 Min 32 10.7 16 5.3 1 0.3 27 9.0 18 6.0 4 1.3
Don't Expose
41 13.7 26 8.7 5 1.7 37 12.3 27 9.0 8 2.7
Total 176 58.7 108 36.0 16 5.3 156 50.0 107 35.7 37 12.3
Chi-Square 2.98 2.7
P value .81 .83
Table (13) showed that (2.7%) of participants who exposed to sun less
than 30 min have a femoral osteoporosis and (5.3%) of them have lumber
osteoporosis, while (1.7 %) of participants who don’t expose to sun have
femoral osteoporosis and (2.7%) of them have lumber osteoporosis, also it was
showed that it was no relationship between duration of sun exposure and BMD,
as P Value (0.81), (0.83) > (0.05) .
Table 7Distribution of participant’s percentage according to number of parity and BMD
Page 71 of 129
Number Of Parity
BMD of Femoral BMD of Lumber
Normal Osteopenia Osteoporosis Normal Osteopenia Osteoporosis
N % N % N % N % N % N %
Nothing 27 9.0 23 7.7 5 1.7 27 9.0 20 6.7 8 2.7
≤ 2 15 5.0 8 2.7 0 0.0 13 4.3 9 3.0 1 0.3
(3-5) 87 29.0 39 13.0 8 2.7 81 27.0 36 12.0 17 5.7
>5 47 15.7 38 12.7 3 1.0 35 11.7 42 14.0 11 3.7
Total 176 58.7 108 36.0 16 5.3 156 52.0 107 35.7 37 12.3
Chi-Square 9.290 12.556
P value .158 .051
Table (14) showed that (29%) of participants who reported that number
of parity for them is (3-5) children, have normal result of femoral BMD and
(27%) of them have normal result of lumber BMD. However (9%) of
Participants who reported that they have no children, have normal result of
femoral and lumber BMD. It was also showed there was no relationship
between number of parity and BMD, as P value (0.158), (0.051) > (0.05).
Table (15) Distribution of participants percentage according to amount of cheese consumption per week and BMD
Page 72 of 129
Amount of Cheese consumption
BMD of Femoral BMD of Lumber
Normal Osteopenia
Osteoporosis Normal Osteopeni
aOsteoporosi
sN % N % N % N % N % N %
Never 4 1.3 3 1.0 0 0.0 3 1.0 4 1.3 0 0.0
(1-3) /Week 77 25.
7 39 13.0 5 1.7 74 24.7 34 11.3 13 4.3
(4 -6)/Week 27 9.0 21 7.0 4 1.3 23 7.7 22 7.3 7 2.3
(1 Piece Every Day) 68 22.
7 45 15.0 7 2.3 56 18.7 47 15.7 17 5.7
Total 176
58.7 108 36.0 16 5.3 15
652.0 107 35.7 37 12.3
Chi-Square
3.218 8.719
P value .781 .190
Table (15) showed that (25.7%) of participants who consumed (1-3) piece
per week have normal results of femoral BMD and (24.7%) of them have
normal results of lumber BMD. While (1.3%) of participants did not consume
cheese have normal result of femoral BMD and (1%) of them have normal
result of femoral BMD .It was also showed that was no relationship between
amount of cheese consumption and BMD, as P value (0.781), (0.190) > (0.05).
Page 73 of 129
Table (16) Distribution of participants percentage according to amount of soft drinks per week and BMD
Amount Of Soft Drinks
BMD of Femoral BMD of Lumber
Normal Osteopenia
Osteoporosis Normal Osteopeni
aOsteoporosi
sN % N % N % N % N % N %
Never 48 16.1 26 8.7 4 1.3 38 12.
8 25 8.4 15 5
(1-3) /Week 98 32.
9 48 16.1 12 4.0 87 29.
2 53 17.8 18 6
(4 -6)/Week 13 4.4 10 3.4 0 0.0 11 3.7 10 3.4 2 .7
(1 Glass Every Day) 16 5.4 23 7.7 0 0.0 19 6.4 18 6 2 .7
Total 175
58.7 107 35.
9 16 5.4 155 52.0 106 35.
6 37 12.4
Chi-Square 14.9 7.666
P value .021 .264
Pearson Correlation .068 **
Table (16) showed that (1.3%) of participants did not drink soft drink have
femoral osteoporosis and (5 %) of them have lumber osteoporosis. In addition
(7.7%) of participants drank one glass daily have femoral osteopenia and (6%) of
them have lumber osteopenia. Also it showed that there was positive relationship
between of amount of soft drink and BMD, as P value (0.021) < (0.05)
Figure 5Correlation between amount of soft drinks consumption and BMD of femoral
Page 74 of 129
Table (17) Distribution of participant's percentage according to amount of yogurt intake per week and BMD
Amount Of Yogurt
BMD of lumber BMD of femoral
Normal Osteopenia Osteoporosis Normal Osteopenia Osteoporosis
N % N % N % N % N % N %
Never 8 2.7 5 1.7 2 .7 8 2.7 6 2 1 .3
(1-3) /Week 86 28.7 52 17.3 17 5.7 96 32 52 17.3 7 2.3
(4 -6)/Week 16 5.3 11 3.7 3 1 18 6 11 3.7 1 .3
(1 Glass Every Day)
46 15.3 39 13 15 5 54 18 39 13 7 2.3
Total 156 52 107 35.7 37 12.3 176 58.7 108 36 16 5.3
Chi-Square 2.5 2.3
P value .86 .89
Table (17) showed that (28.7%) of participants who consumed (1-3) glass
per week have normal results of lumber BMD and (32%) of them have normal
results of femoral BMD. While (2.7%) of participants who don't consume
yogurt have normal result of femoral and lumber BMD. Also it was showed that
there was no relationship between amount of yogurt and BMD, as P value
(0.86),(0.89) > (0.05).
Page 75 of 129
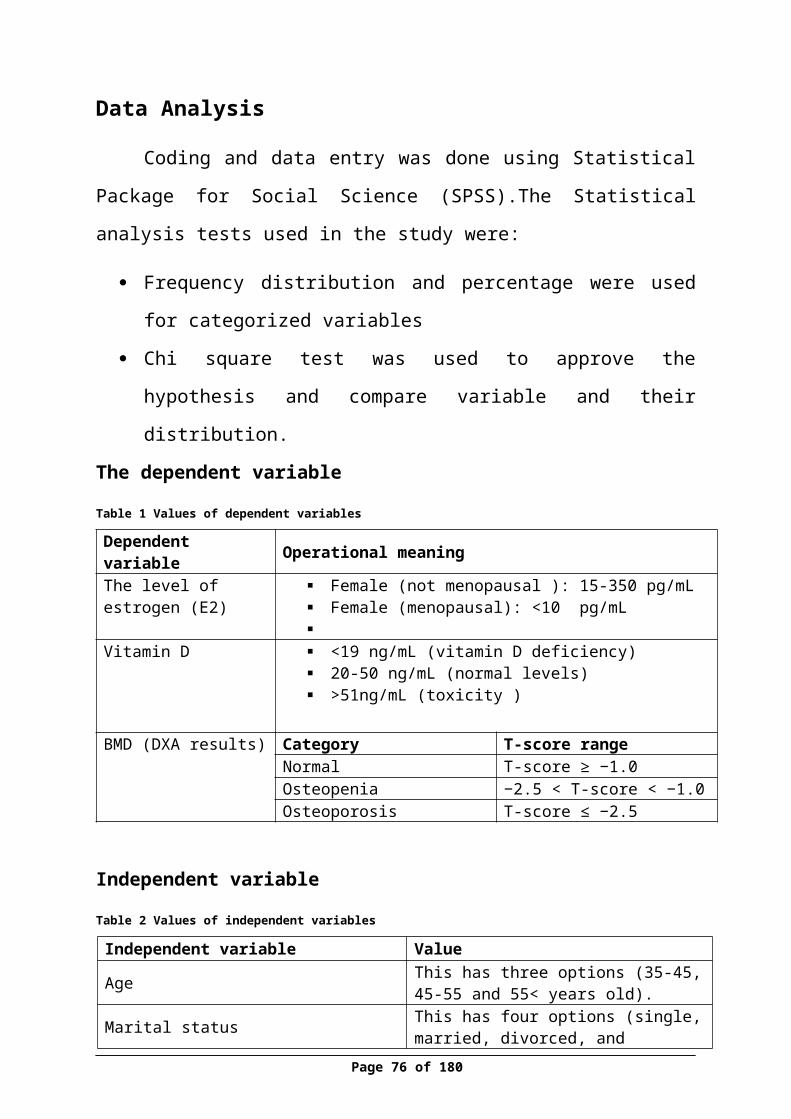
Table 8Distribution of participants percentage according to duration of exercise in minute and BMD
Duration of exercise in minute
BMD of Femoral BMD of Lumber
Normal Osteopenia Osteoporosis Normal Osteopenia Osteoporosis
N % N % N % N % N % N %
<30 M 13 11 14 4.7 2 .7 37 12.3 9 3.0 3 1.0
30 Min 25 8.3 10 3.3 1 .3 19 6.3 13 4.3 4 1.3
>30 M 18 6 7 2.3 2 .7 13 4.3 13 4.3 1 0.3
Don't Do Exercise 100 33.33 77 25.7 11 3.7 87 29.0 72 24.0 29 9.7
Total 167 58.7 108 36 16 5.3 156 52.0 107 35.7 37 12.3
Chi-Square 6.9 16.7
P value 0.32 0.01
Pearson Correlation ** 0.19
Table (18) showed that (3.7%) of participants who did not do exercise
have femoral osteoporosis and (9.7%) of them have lumber osteoporosis. In
addition, (14%) of participants who performed exercise less than 30 minute
have normal result of femoral BMD and (12.3%) of them have normal result of
lumber BMD. It was also showed that there was positive relationship between
duration of exercise and BMD, as P value (0.01) < (0.05).
Page 76 of 129

Figure 6 Duration of exercise in minutes / day
Page 77 of 129

Table (19) Distribution of participants according to number of smoked cigarettes and BMD
Number Of Smoked Cigarettes
BMD Of Femoral BMD Of Lumber
Normal Osteopenia Osteoporosis Normal Osteopenia Osteoporosis
N % N % N % N % N % N %(1-10) 9 3.0 9 3.0 0 0.0 9 3.0 8 2.7 1 0.0
(11-20) 1 0.3 2 0.7 2 0.7 1 0.3 2 0.7 2 0.7
> 20 3 1.0 2 0.7 0 0.0 4 1.3 1 0.3 0 0.0
Don’t Smoke 163 54.3 95 31.7 14 4.7 142 47.3 96 32.0 34 11.3
Total 176 58.7 108 36.0 16 5.3 156 52.0 107 35.7 37 12.3
Chi-Square 15.202 6.921
P value .019 .328
Pearson correlation 0.030 **
Table (19) showed that (54.3%) of participants who don't smoke, has
normal result of femoral BMD and (47.3%) of them have normal result of
lumber BMD. While (3%) of participants who smoke one to ten cigarettes have
normal result of femoral and lumber BMD. Also it was showed that there was
positive relationship between number of smoked cigarettes and BMD, as P
value (.019) < (0.05).
Page 78 of 129
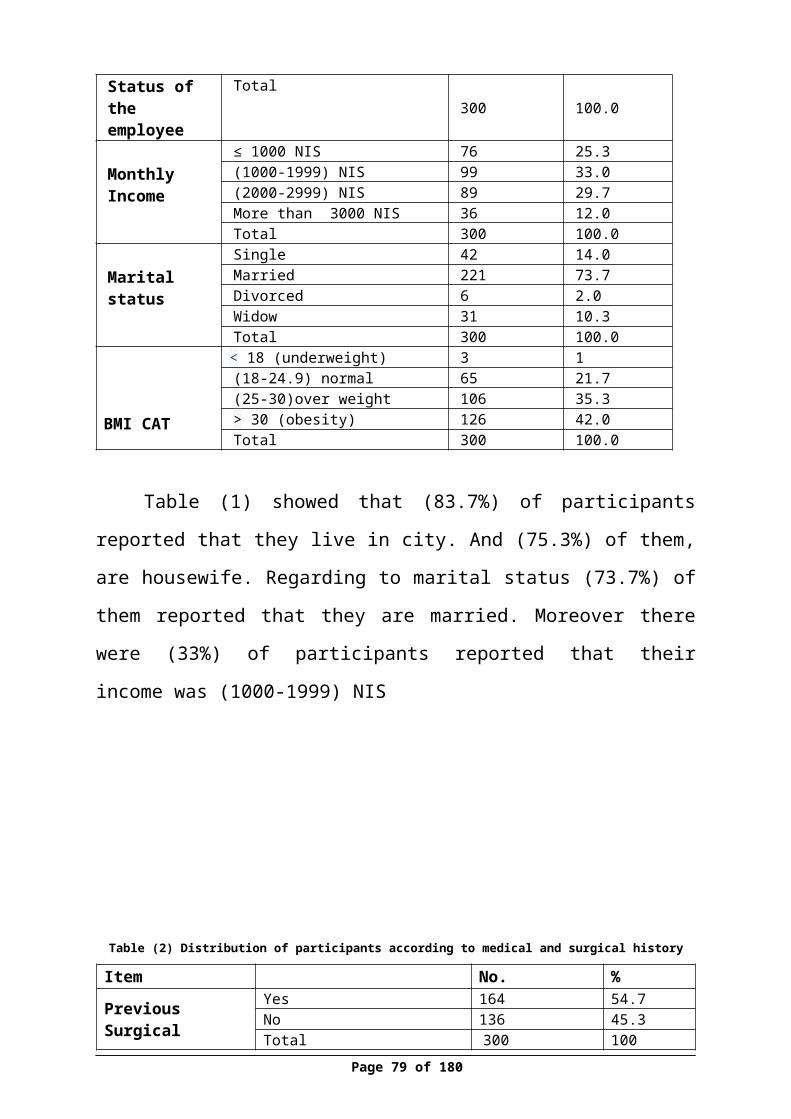
Figure 7 Number of smoked cigarettes/day
Page 79 of 129
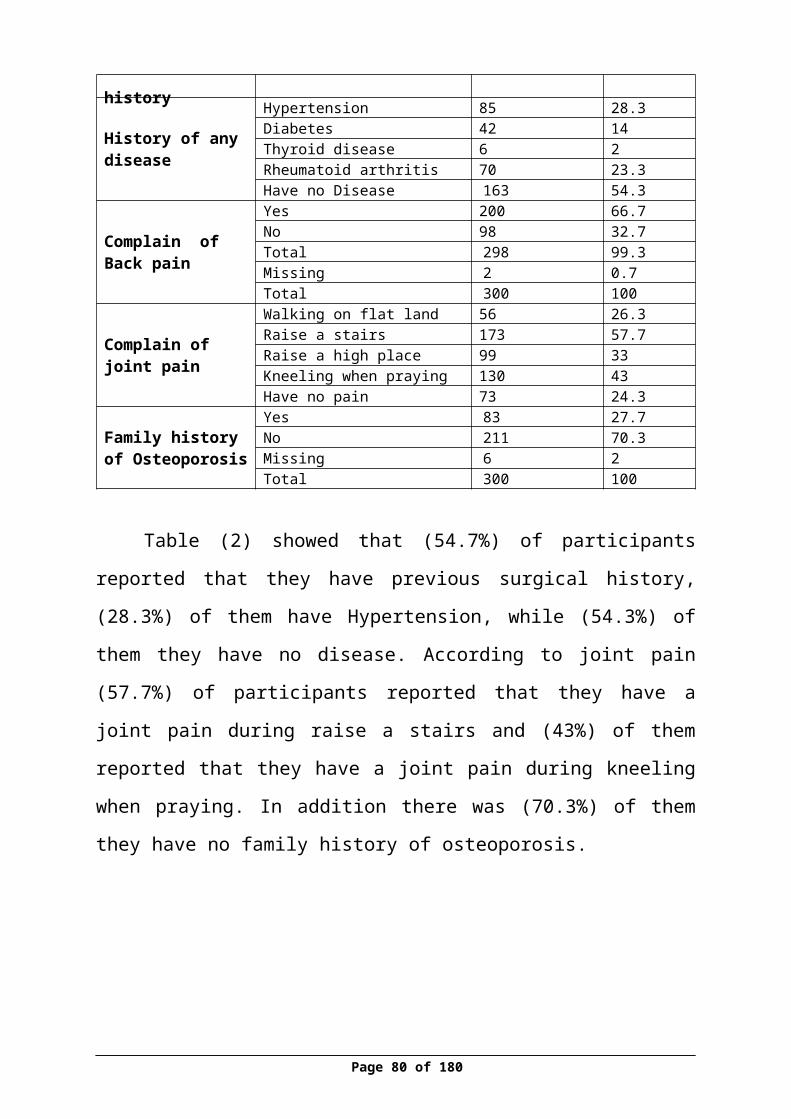
Table (20) Distribution of participants percentage according to status of menstrual period
Status of period
BMD of femoral BMD of lumber
Normal Osteopenia Osteoporosis Normal Osteopenia Osteoporosis
N % N % N % N % N % N %
Regular 77 25.7 26 8.7 1 .3 74 24 30 10 0 0
Irregular 35 11.7 11 3.7 0 0.0 30 10 13 4.3 3 1
Menopause 64 21.3 71 23.7 15 5 52 21.3 64 11.3 34 11.3
Total 176 58.7 108 36 16 5.3 156 52 107 35.7 37 12.3
Chi-square 36.13 48.74
P value 0.000 0.000
Pearson correlation .318 .391
Table (20) showed that (25.7%) of participants who have regular
menstrual period, have normal results of femoral BMD and (24%) of them have
normal results of lumber BMD. While (21.3%) of participants who were
menopause have normal result of femoral and lumber BMD. Also it was
showed that there was positive relationship between status of period and BMD,
P value (0.000) < (0.05).
Figure 8Status of period and femoral BMD
Page 80 of 129
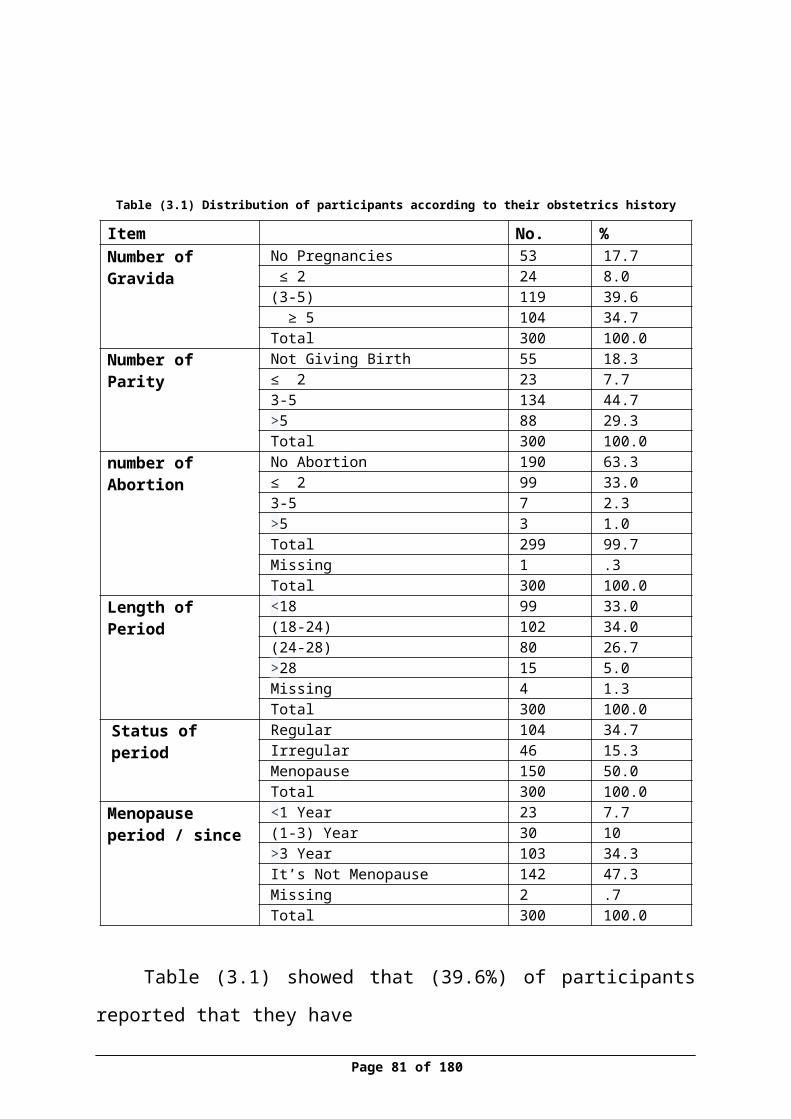
Figure 9 Status of period and lumber BMD
Page 81 of 129
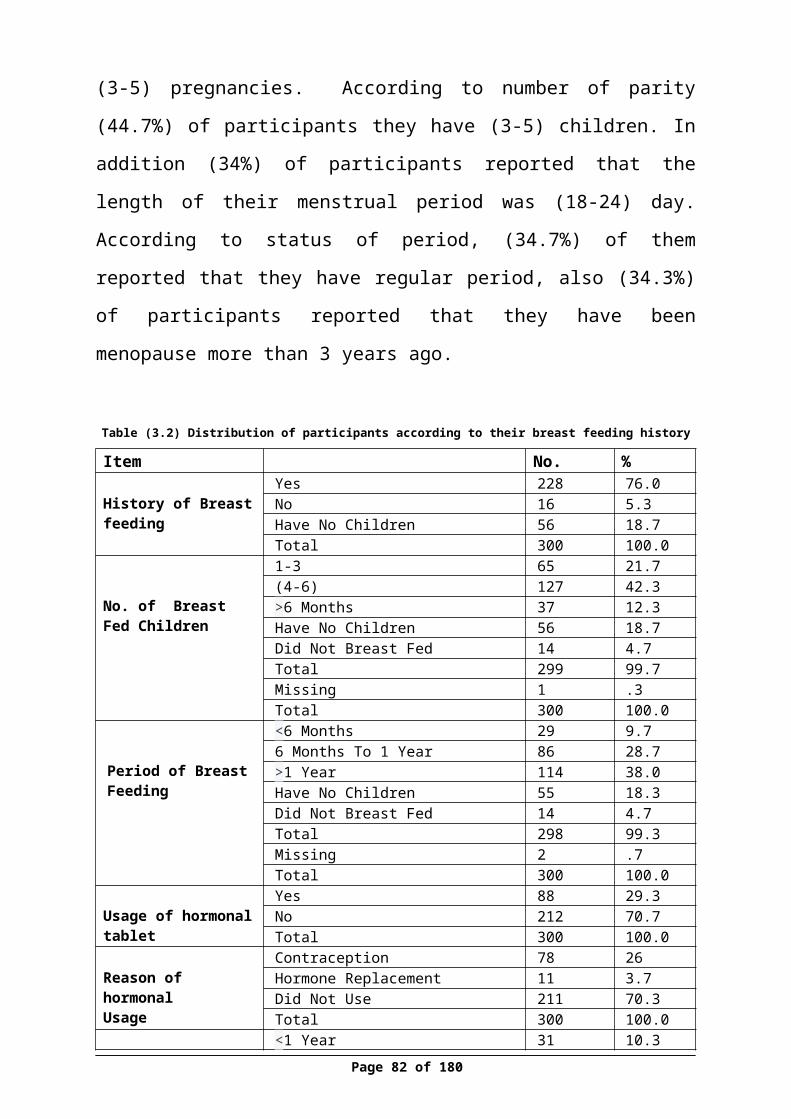
Table (21) Distribution of participants percentage according to menopause period and BMD
Menopause period/since
BMD of femoral BMD of lumber
Normal Osteopenia
Osteoporosis Normal Osteopeni
aOsteoporos
isN % N % N % N % N % N %
<year 13 4.4 9 3 1 .3 10 3.4 10 3.4 3 1
(1-3) 16 5.4 13 4.4 1 .3 14 4.7 9 3 7 2.3
>3 year 39 13.1 51 17.
1 13 4.4 31 10.4 46 15.4 26 8.7
It's not menopause 106 35.
6 35 11.7 1 0.3 10
033.6 41 13.8 1 0.3
Total 174 58.4 108 36.
2 16 5.4 155 52 106 35.6 37 12.4
Chi-square 40.86 56.3
P value 0.00 0.00
Pearson correlation .362 .420
Table (21) showed that (0.3%) of participants who were less than one
year menopauses have femoral osteoporosis and (1%) of them have lumber
osteoporosis. While (4.4%) of participants who were more 3 year menopause
have femoral osteoporosis and (8.7%) of them have lumber osteoporosis. Also it
was showed that there was positive relationship between menopause period and
BMD, as P value (0.00) < (0.05).
Page 82 of 129
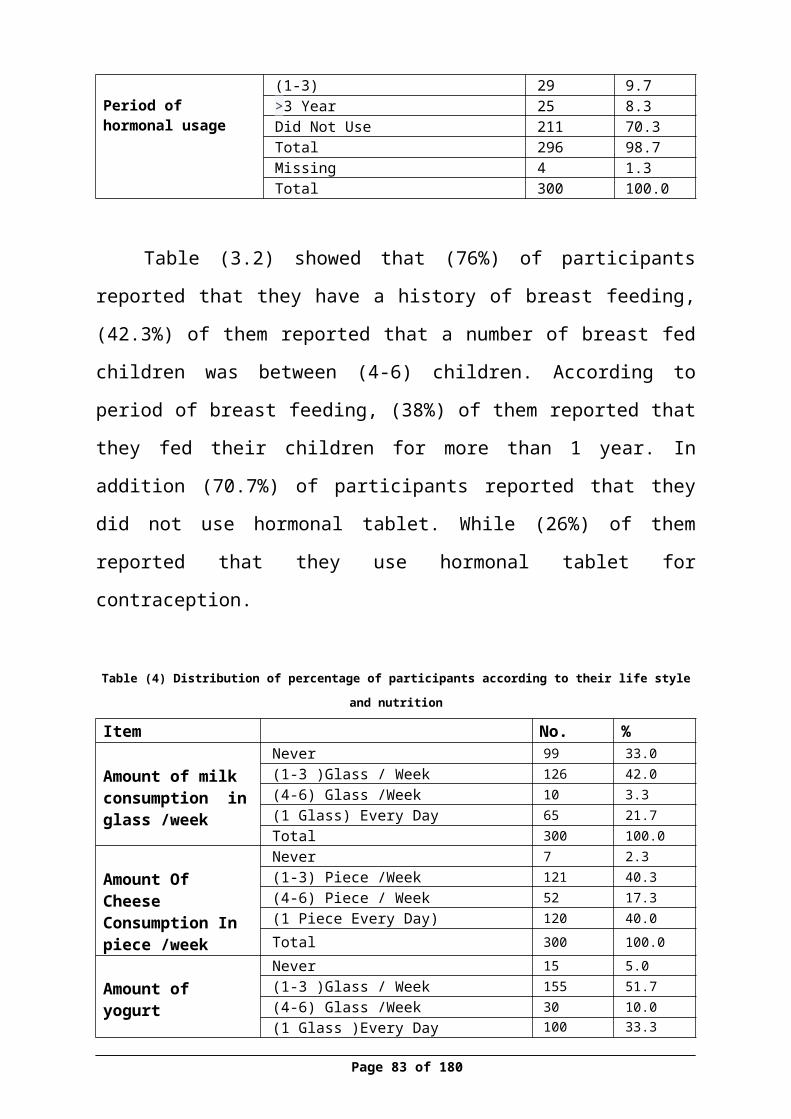
Figure 10Correlation between menopause period and femoral BMD
Figure 11 Correlation between menopause period and BMD
Page 83 of 129
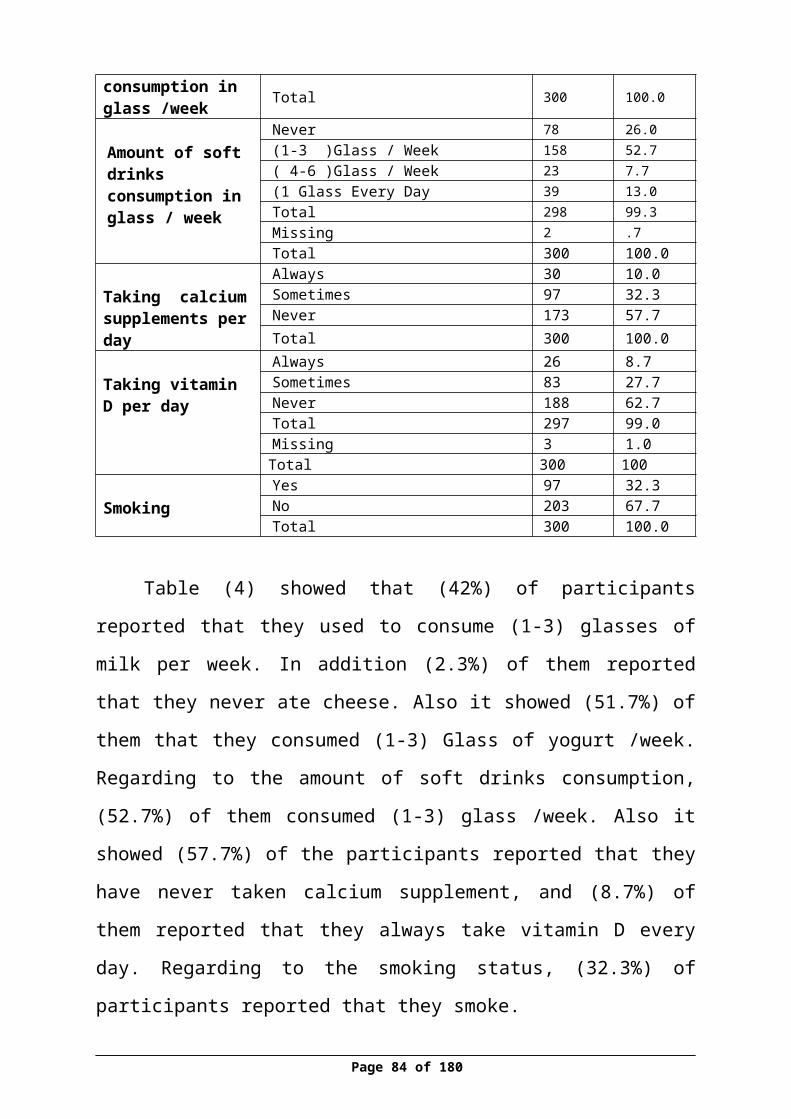
Table (22)Distribution of participants according to number of breast fed children and BMD
No.of Breast Fed Children
BMD of Femoral BMD of Lumber
Normal Osteopenia Osteoporosis Normal Osteopeni
a Osteoporosis
N % N % N % N % N % N %
1-3 36 12 24 8 5 1.7 34 11.4 21 7 10 3.3
4-6 90 30.1 34 11.4 3 1 75 25.1 41 13.7 11 3.7
More Than 6 12 4 22 7.4 3 1 9 3 22 7.4 6 2
Have No Children 28 9.4 23 7.7 5 1.7 29 9.7 19 6.4 8 2.7
Didn't Breast Fed 9 3 5 1.7 0 0 8 2.7 4 1.3 2 .7
Chi-square 22.9 16.04
P value 0.003 0.042
Pearson correlation 0.078 0.045
Table (22) showed that (4%) of participants who did breastfed to more
than 6 children have normal result of femoral BMD and (3%) of them has
normal result of lumber BMD. While (12%) of participants who did breast fed
to (1-3) children have normal result of femoral BMD and (11.4%) of them have
normal result of lumber BMD. Also it was showed that there was positive
relationship between numbers of breast fed children and BMD, P value (.003),
(0.042) < (0.05).
Page 84 of 129
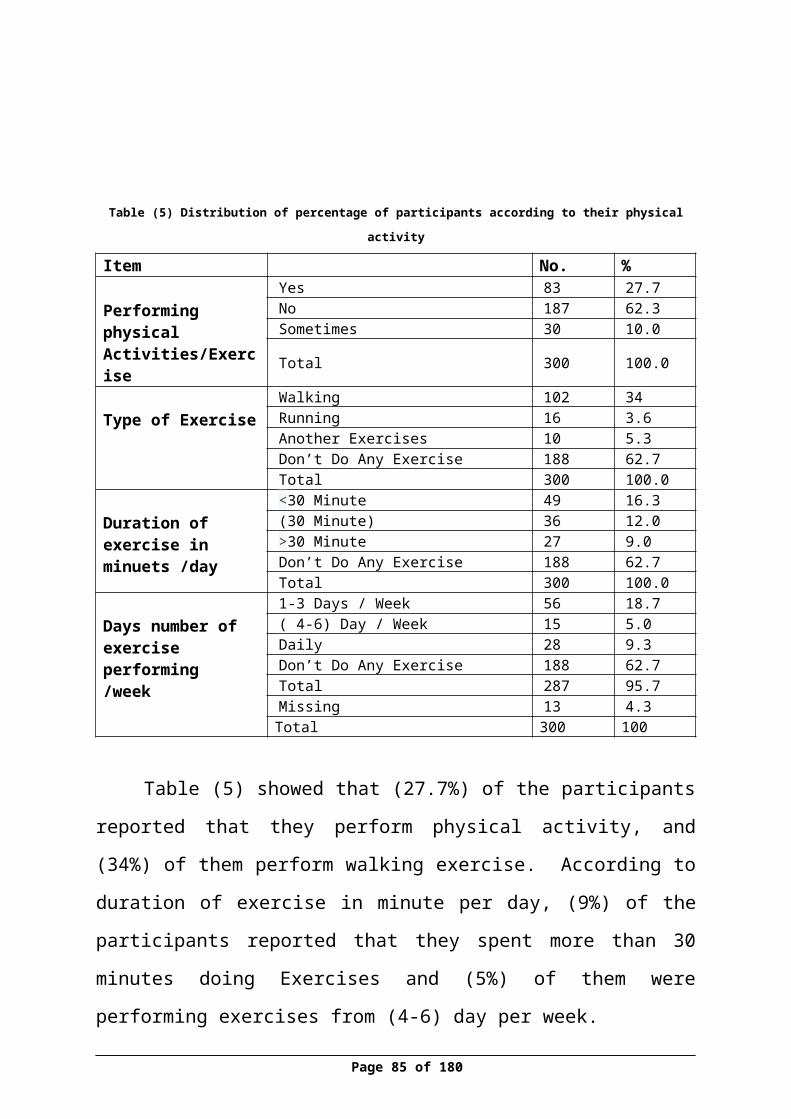
Figure 12No. of breast fed children and BMD of femoral
Figure 13No. of breast fed children and BMD of lumber
Page 85 of 129
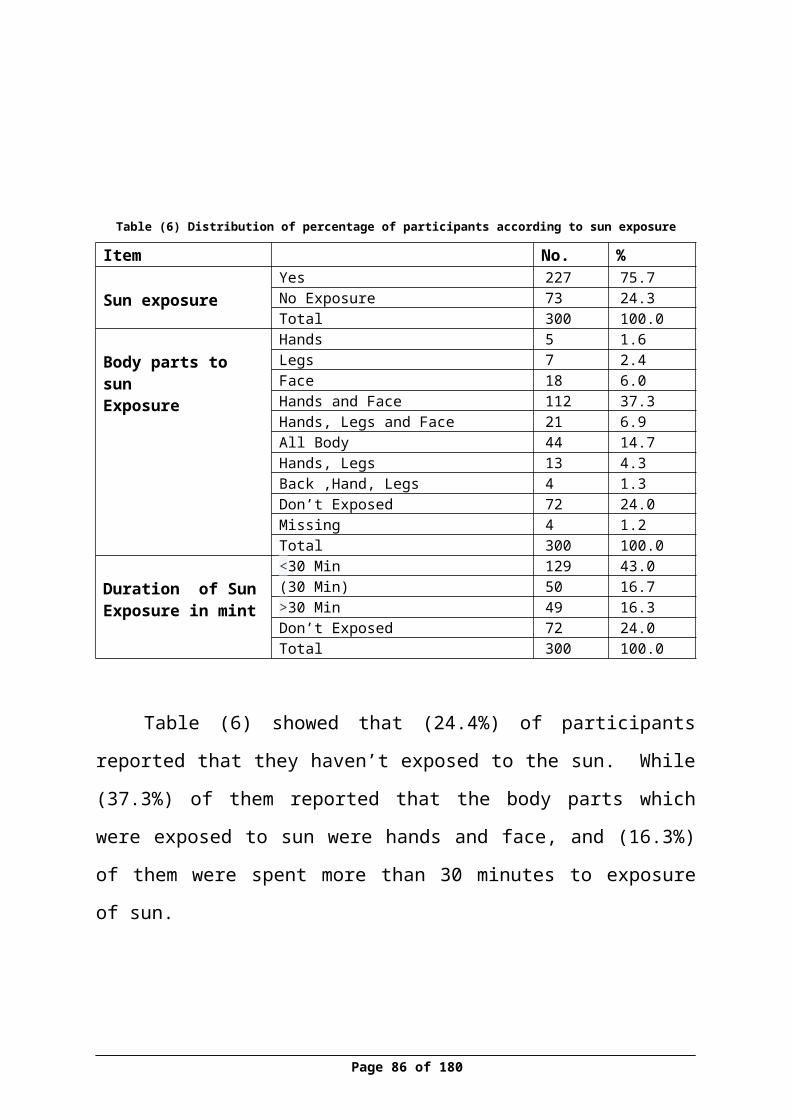
Table (23) Distribution of participants according to family history of osteoporosis and BMD
Family history of osteoporosis
BMD of femoral BMD of lumber
Normal Osteopenia Osteoporosis Normal Osteopenia Osteoporosis
N % N % N % N % N % N %
Yes 47 16.0 29 9.9 7 2.4 36 12.2 37 12.6 10 3.4
No 125 42.5 77 26.2 9 3.1 117 39.8 68 23.1 26 8.8
Total 172 58.5 106 36.1 16 5.4 153 52.0 105 35.7 36 12.2
Chi-Square 2.011 4.217
P value .366 .121
Table (23) showed that (16%) of participants who have a family history
of osteoporosis, has normal result of femoral BMD and (12.2%) of them have
normal result of lumber BMD. While (42.5%) of participants who have not
family history of osteoporosis, have normal result of femoral BMD and (39.8%)
of them have normal result of lumber BMD. Also it was showed that there is no
relationship between family history of osteoporosis and BMD, as P value (.366),
(.121) > (0.05).
Page 86 of 129
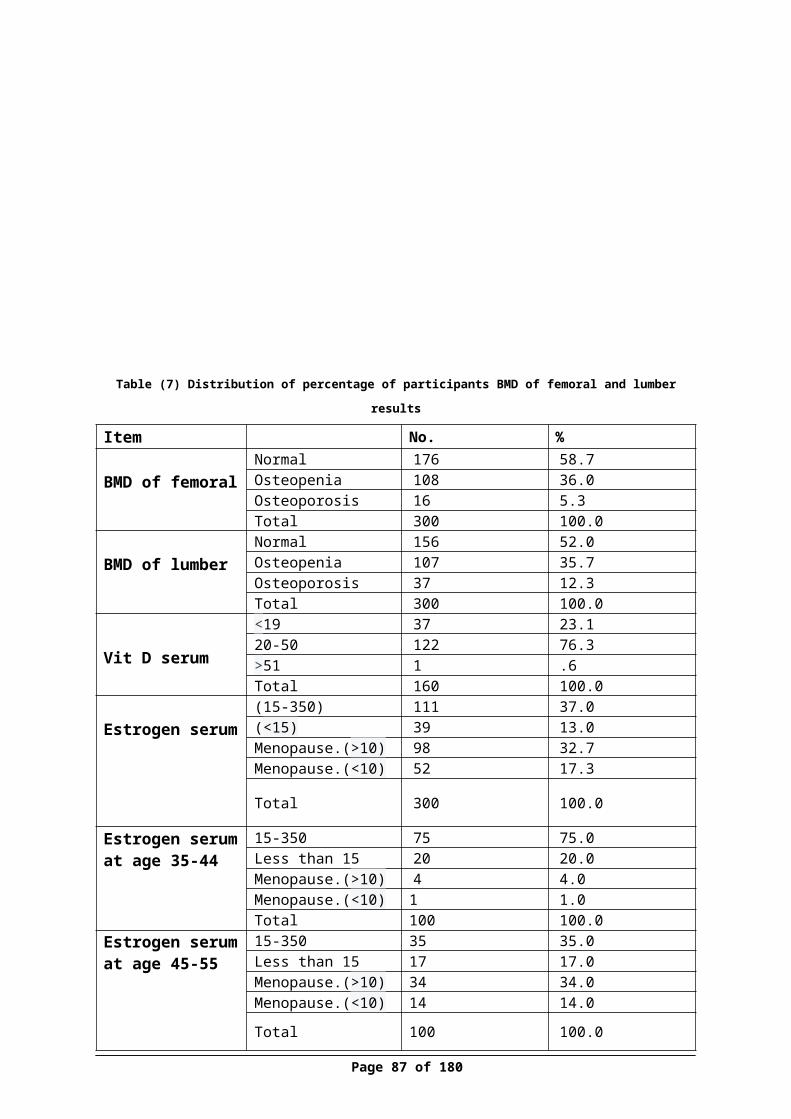
Table 9Distribution of participants according to usage of hormonal tablet and BMD
Using of hormonal tablet
BMD of femoral BMD of lumber
Normal Osteopenia Osteoporosis Normal Osteopenia Osteoporosis
N % N % N % N % N % N %
Yes 52 17.3 34 11.3 2 0.7 54 18.0 27 9.0 7 2.3
No 124 41.3 74 24.7 14 4.7 102 34.0 80 26.7 30 10.0
Total 176 58.7 108 36.0 16 5.3 156 52.0 107 35.7 37 12.3
Chi-Square 2.431 4.903
P value .296 .086
Table (24) showed that (0.7%) of participants who used hormonal tablet
have femoral osteoporosis and (2.3%) of them have lumber osteoporosis. While
(4.7%) of participants who did not use hormonal tablet, have femoral
osteoporosis and (10%) of them have normal lumber osteoporosis. Also it was
showed that it was no relationship between using of hormonal tablet and BMD,
as P value (.296), (.086) > (0.05).
Page 87 of 129
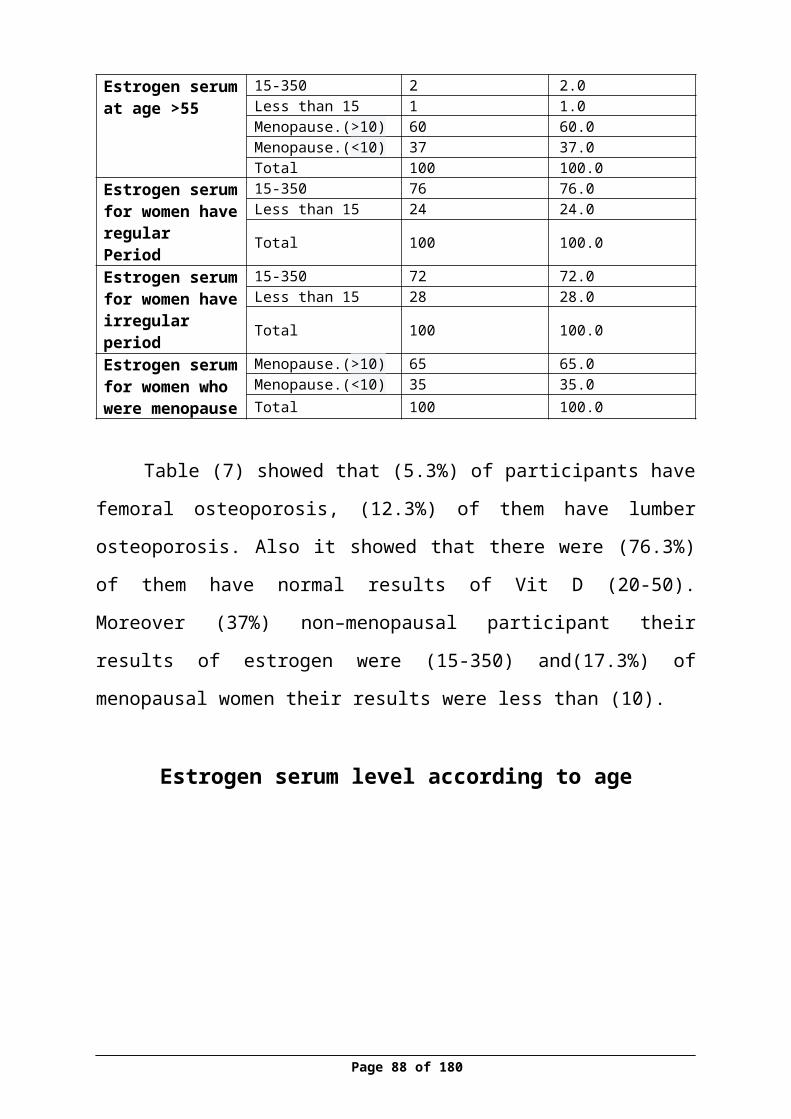
Table (25) Distribution of participant’s percentage according to Vit D and BMD
Vit D Range BMD of Femoral BMD of Lumber
Normal Osteopenia Osteoporosis Normal Osteopenia Osteoporosis
N % N % N % N % N % N %<19 (Deficiency) 22 13.8 10 6.3 0 0 18 11.4 11 7 3 1.9
20-50( Normal Level )
82 51.6 35 22 9 5.7 61 38.6 46 29.1 18 11.4
>50 (Increased ) 1 0.6 0 0 0 0 1 0.6 0 0 0 0
Total 105 66 45 28.3 9 5.7 80 50.6 57 36.1 21 13.3
Chi-Square 2.978 1.786
P Value .561 .775
Table (25) showed that (51.6%) of participant who have normal level
ofVit D (20-50), have normal result of femoral BMD, while (38.6%) of them
have normal result of lumber BMD. (13.8%) of participants who have
deficiency in Vit D (less than 19), they have normal result of femoral BMD and
(11.4%) of them have normal result of lumber BMD. Also it was showed that
there was no relationship between Vit D and BMD, as P value (2.978), (1.786)
> (0.05).
Page 88 of 129
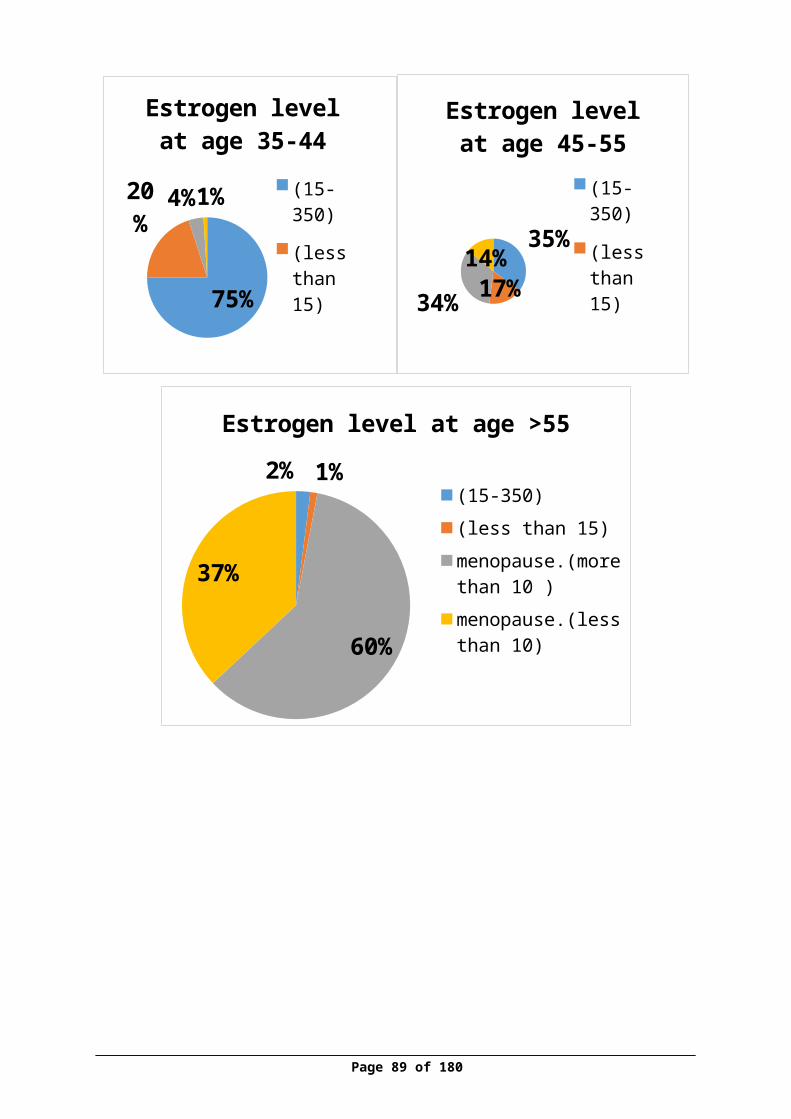
Table 10Distribution of participants according estrogen level among different groups and BMD
Estrogen level BMD of Femoral BMD of Lumber
Normal Osteopenia
Osteoporosis Normal Osteopeni
aOsteoporosi
s
N % N % N % N % N % N %
(15-350) 83 27.7 27 9 1 0.3 75 2
5 34 11.3 2 0.7
(<15) 31 10.3 8 2.7 0 0 30 1
0 8 2.7 1 0.3
Menopause.(>10) 45 15 43 14.
3 10 3.3 36 12 41 13.
7 21 7
Menopause.(<10) 17 5.7 30 10 5 1.7 15 5 24 8 13 4.3
Total 176
58.7
108 36 16 5.3 15
652
107
35.7 37 12.3
Chi-Square 44.090 51.872
P value 0.000 0.000
Pearson Correlation -.133 -.122
Table (26) showed that (0.3%) of participants who were pre-menopause
and have normal level of estrogen hormone (15-350), have femoral
osteoporosis, while (0.7) of them has lumber osteoporosis. There was (3.3%) of
participants who were post-menopause and who have abnormal result of
estrogen hormone, have femoral osteoporosis, while (7%) of them have lumber
osteoporosis. Also it was showed that there was negative relationship between
estrogen level and BMD, as P value (0.000) < (0.05).
Page 89 of 129
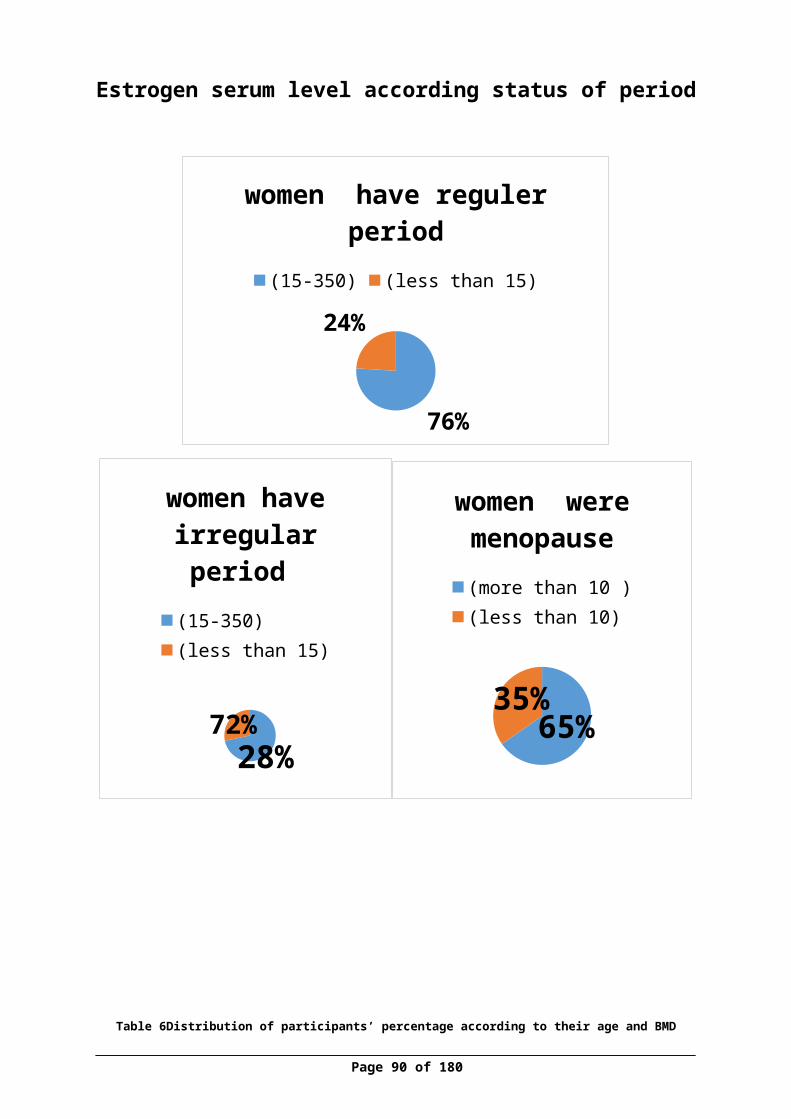
Figure 14 Correlation between estrogen and femoral BMD
Figure 15correlation between estrogen and lumber BMD
Page 90 of 129

Discussion
The results of the study in (Table1) showed that more than two quarter
(73.7%) of the participants were married, also two third of them (75.3%) were
housewife and a third (33%) of them their income was (1000-1999) NIS, this
results was reflect with Palestinian Central Bureau of Statistics (PCBS) , which
found that (56%) of women in Nablus in 2010 were married and the percentages
are continually increases , while (36.1%) of Palestinian women were single ,
and the average of income in Palestinian family in 2011 was 1058.4 ,
(PCBS,2011). Also the table showed that less than half of participants (42%)
were obese (more than 30 kg/m2).
According to medical and surgical history, the study finding in (Table 2)
showed that one third of them (27.7%) have history of family osteoporosis and
less than of one third of them (28.3%) were have Hypertension which was
reflect with PCBS in 2010 , which found that (16%) of women were have
Hypertension.
Study findings in (Table 3.1) showed that nearly more than one-third of
participants (44.7%) have( 3-5) children and this reflect with PCBS in 2009
which found that the average of fertility in Palestine was 4.4 and this mean that
the Palestinian women have high parity , (PCBS,2009) . According to status of
period of participants, the results showed that half (50%) of them were
menopause and only (15.3%) were with irregular period. In addition, (25.7%) of
them with regular menstrual period, have normal result of femoral BMD.
According to breast feeding history of participants, the study finding in
(Table 3.2) that three quarter of the participants (76%) have a history of breast-
feeding which reflect with PCBS in 2011 that found (98.5%) of women were
fed their children and less than half of them (42.3%) have breast fed (4-6) child
of their children. Also (38%) of them have breast fed their children for more
Page 91 of 129
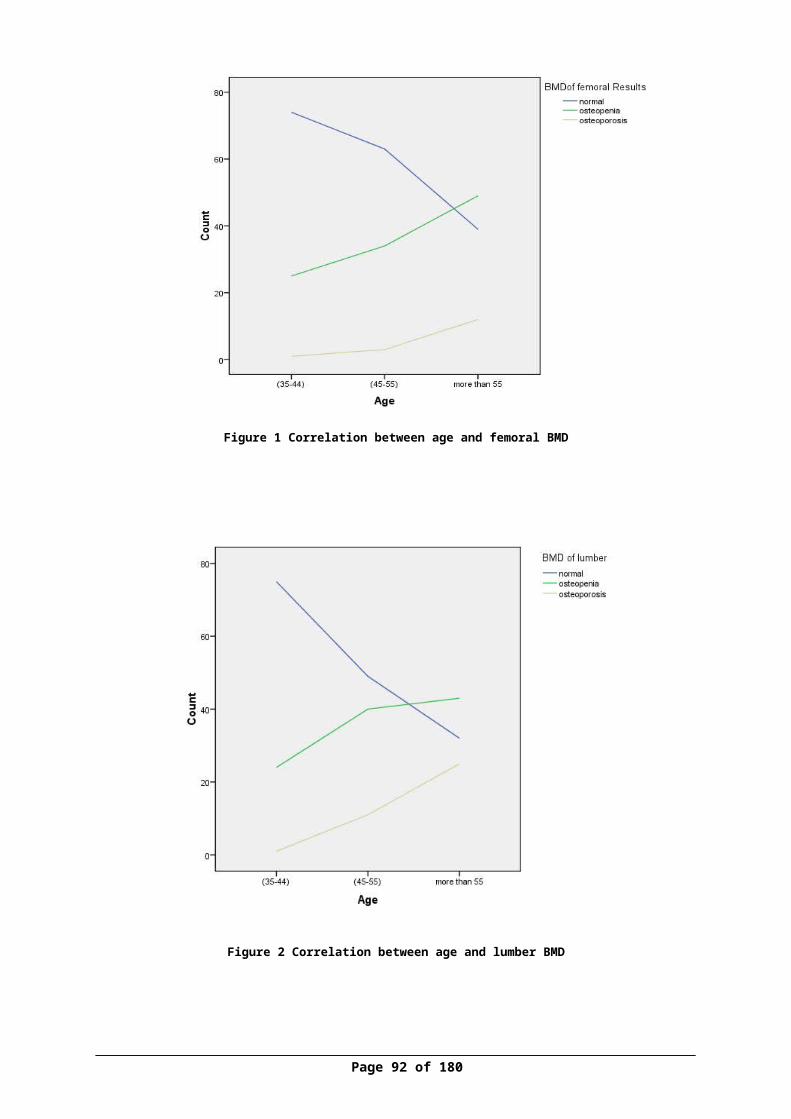
than one year. Also the results showed that (70.7%) of participants didn’t used
hormonal tablet, only (8.3%) of them used hormonal tablet for more than 3
years which was reflect with PCBS in 2011 that found that (26.3%) of women
were used tablet hormone .
Table (4) indicated that almost of the participants, more than third of
them (42%) were consumed 1-3 glass of milk /week, while it showed that just
(1%) of them who drank one glass daily have femoral osteoporosis. Also less
than half of them (40%) were consumed (1-3) piece of cheese per week. And
half of them (51.7%) were consumed (1-3) glasses of yogurt per week. In
addition more than half (52.7%) of them consumed (1-3) glass of soft drink per
week. Regarding to smoking status, (32.3%) reported that they smoked which
was not reflect with PCBS in 2010 that found (2.4%) of women were smoked.
The study results in Table (5) showed that more than two third (62.3%) of
the participants did not perform physical activity which was reflect with PCBS
in 2011 who found that (33.1%) of women perform physical activity and only
(9%) of them were exercise for more than thirty minutes.
The study results in Table (6) Indicated that more than two quarter
(75.7%) of participant have exposed to sun, more than one third (37.3%) of
them they exposed their hands and face to sun , and (16.3%) of them were spent
more than 30 minutes to exposure of sun.
The study results in Table (7) showed that just (5.3%) of participants
have femoral osteoporosis and this reflect with PCBS in 2012 which found that
the incidence of osteoporosis on women (0.5%). Also the table showed that
more than two quarter (76.3%) of participants have normal results of Vit D (20-
50) Moreover, more than one third (37%) of pre –menopausal participants,
Page 92 of 129
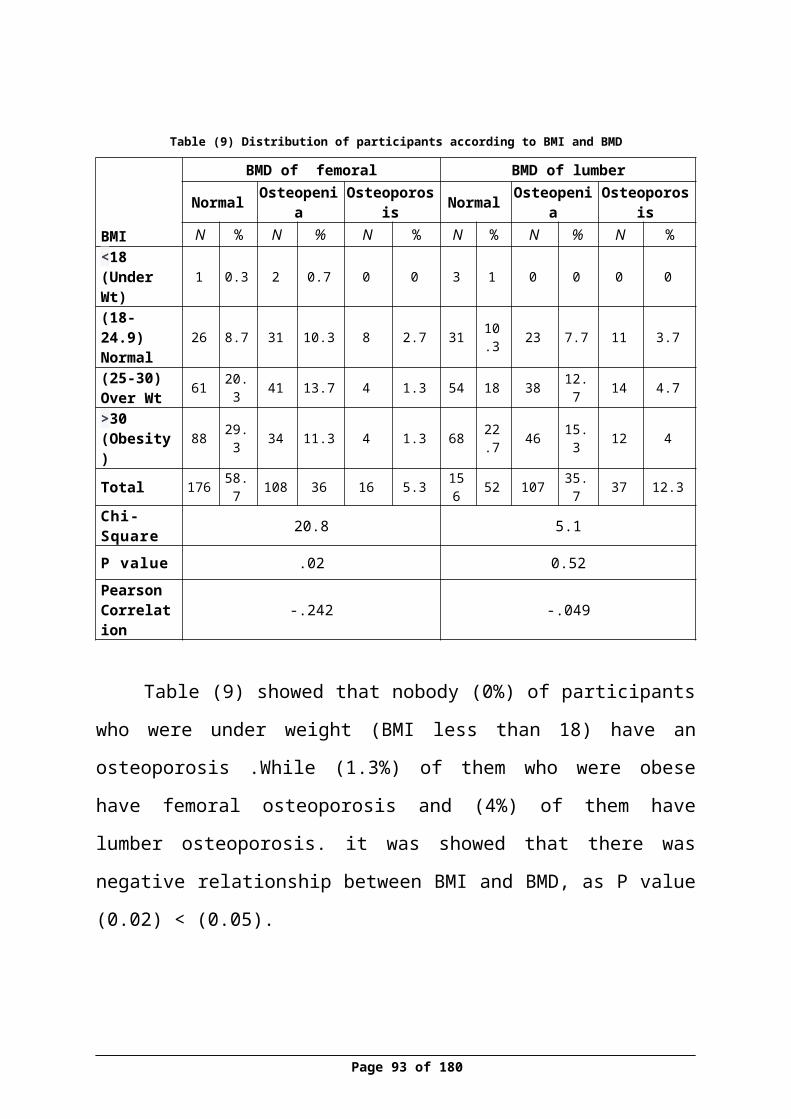
their results of estrogen were (15-350) and (17.3%) of post-menopausal
participants, their results were less than (10 pg /mL).
According to the relationship between participants age and their BMD,
table (8) showed that only (1%) of participants who were at age group (35-45)
year have a femoral osteoporosis ,while (12%) of the them who were more than
55 years old have femoral osteoporosis. Also it was showed that there was a
positive relationship between ageing and decreasing BMD results (p.0.000),
this was consistent with (Wadolowska et al, 2013) who found that women in
Poland ,who were older than 49 years was with low BMD , while women who
were younger than 49 years their results showed regular and normal BMD.Also
the results were similar with (Stevenson, Lees, Devenport, Cust and Ganger,
1989), (Kröger ,Tuppurainen , Honkanen, Alhava and Saarikoski, 1994) and
( Kleerekoper, Brienza, Schultz & Johnson , 1991 ) they consider that
menopause status and age are risk factors that affect the BMD results as
postmenopausal women had a clearly effect on decreasing the BMD results ,
also(Agrawala &Vermab , 2013) found that there was a negative correlation
between age of the women and BMD.
The relationship between BMI of participants and their BMD by table (9)
showed that nobody (0%) of them were under weight (BMI less than 18kg/m2)
have an osteoporosis. Moreover (1.3%) of them who were obese (BMI more
than 30) have femoral osteoporosis and (4%) of them have lumber osteoporosis.
The study found negative relationship between decreasing BMD of femoral and
BMI (p.0.02), decreasing in BMI, would lead to decrease in BMD results, this
was consistent with (Ravan et al, 1999), who said that people with low BMI
have a two-fold greater risk of bone loss comparing with those people with
normal or highest BMI .also (Shilbayeh , 2003) , she considered that BMI as
independent risk with low (BMD).
Page 93 of 129
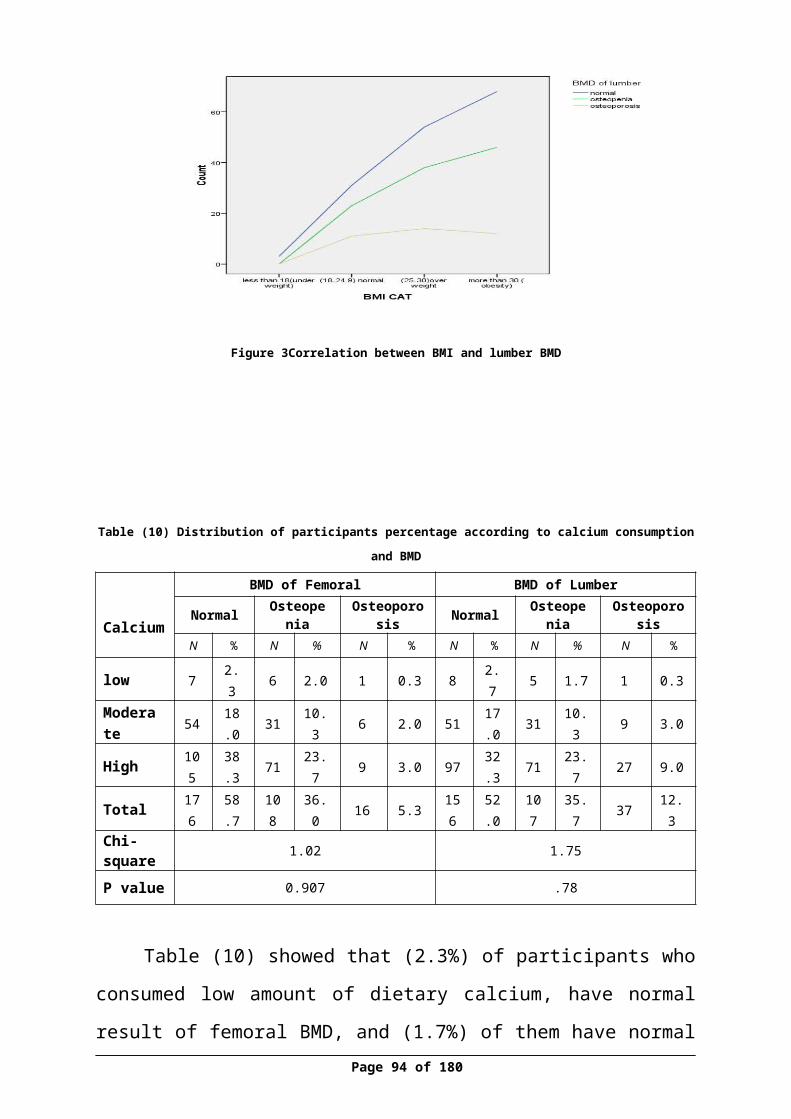
The study results (Table 10) revealed that only (2.3%) of participants who
consumed low amount of dietary calcium, have normal result of femoral BMD,
while more than half of them (38.3%) who consume high amount of dietary
calcium have normal result of femoral BMD and (52%) of them have normal
result of lumber BMD.Also it was showed that there was no relationship
between calcium consumption and BMD as P value. (0.907),(0.78).
While the relationship between milk consumption and BMD in (Table
11), showed that only (2.3%) of participants who never drank milk have femoral
osteoporosis and (3.3%) of them have lumber osteoporosis, while just (1%) of
participants who drank one glass daily have femoral osteoporosis and (3.3%) of
them have lumber osteoporosis, also it was showed that there was a relationship
between milk consumption and BMD in lumber site as P value (0.003) , which
consistent with (Wadolowska et al., 2013) who found in their study that women
with high consumption of dairy products include milk have regular BMD. Also
(Murphy, Khaw, May & Compston, 1994), found that milk consumption was a
significant independent predictor of BMD at both lumber and femoral in woman
who their age was up to 25.
Regarding the relationship between sun exposure and BMD as showed in
(Table 12) , it showed that only (1.7%) of participants who exposed all body to
sun, have femoral osteoporosis, while just (1.7%) of them have lumber
osteoporosis, the results also showed that there was no relationship between sun
exposure and BMD (P.0.27) ,(P.0.84) . which was disagree with,(Zhen, Liu,
Guang, Zhao and Tang, 2015), who found that sun exposure was considering
protective factors for osteoporosis , also, (Sato , Metoki , Iwamoto , and Satoh ,
2003) showed that the participants in their study who were exposed to sun light
their BMD increased by (3.1%) . These results came different of other studies
might be affected by factors such as different culture, religious , most of
Page 94 of 129
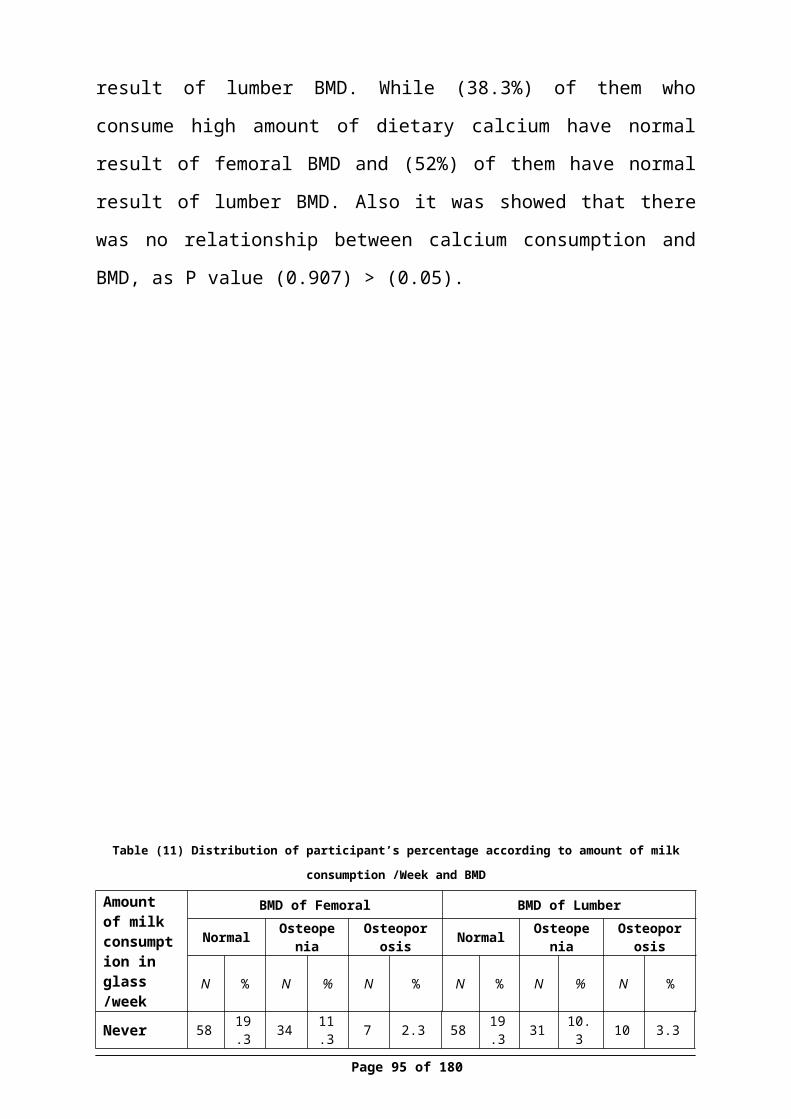
participants reported that they exposed just hands and face and little of them
reported that they exposed all body, also there was no specific tool to measure
amount of sun exposure might be affected on result .
The study results (Table 13) showed that (2.7%) of participants who
exposed to sun less than 30 min have a femoral osteoporosis and (5.3%) of them
have lumber osteoporosis, while (1.7 %) of participants who don’t expose to sun
have femoral osteoporosis and (2.7%) of them have lumber osteoporosis, it was
showed that it was no relationship between duration of sun exposure and BMD,
as P value (0.81), (0.83).
According to the number of parity and BMD relationship (Table 14)
results showed that less than of one third of the participants (29%) of
participants who have (3-5) children, have normal result of femoral BMD and
only (9%) of them who have no children, have normal result of femoral and
lumber BMD , while it was showed that there was no relationship between
number of parity and BMD results on both side femoral and lumber (P.158)
(P.051) which it variance with (Stevenson, Lees, Devenport, Cust and Ganger,
1989) ,those who found that null parity women had high risk for osteoporosis in
relation to decrease in BMD. Also (Murphy, Khaw, May and Compston ,1994)
indicated that there was a positive between parity and BMD by each parity live
increased the BMD by 1% . The study results might be affected due to small
number of study sample.
According to cheese consumption and BMD , (Table 15) showed that just
(1.3%) of them did not consume cheese have normal result of femoral BMD,
and (2.3%) of them who consumed one piece daily have femoral osteoporosis
and there was no significant relationship between amount cheese consumption
and BMD. which it not consistent with (Wadolowska et al., 2013) who found in
their study that women with high consumption of dairy products include cheese
Page 95 of 129
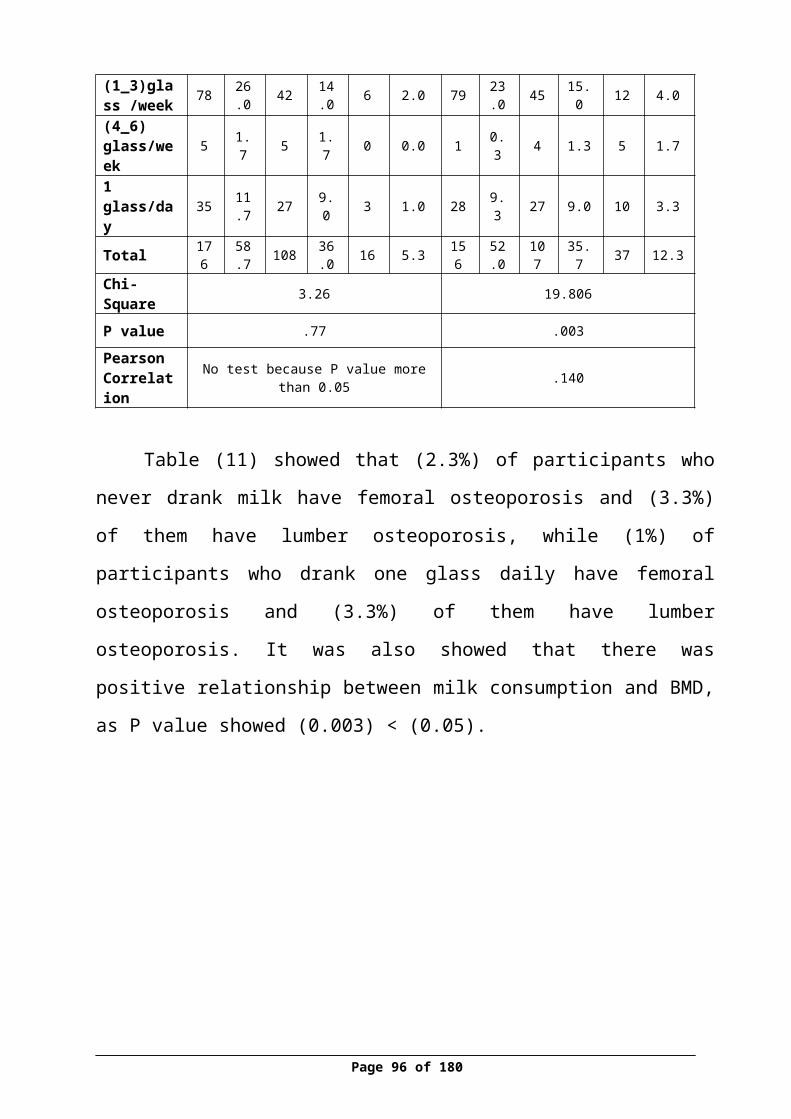
have normal BMD results also not similar with (Keramat et al, 2008) in India,
who found that regular consumption of cheese was categorized as protective
factors for osteoporosis in postmenopausal women , the results may vary due to
the amounts of cheese in piece not specific in grams, also due to the number of
sample .
Regarding amount of soft drink consumption and BMD, (Table 16)
showed that only (1.3 %) of them did not drank soft drink have femoral
osteoporosis and it found that there was a positive relationship between soft
drink and decreasing femoral BMD results (p.021), this consistent with
(Costa et al , 2015 ), who found that the absence of soda intake were
categorized under protective factors for osteoporosis.
Moreover about yogurt consumption and BMD (Table 17) showed that
(28.7%) of participants who consumed (1-3) glass per week have a normal
result of femoral BMD, also the results found that there was no significant
relationship between amount yogurt consumption and BMD (P.0.86),(P.0.89).
This results were not similar with , (Wadolowska et al., 2013) who found in
their study that women with high consumption of yogurt have normal BMD ,
may due to variation between amount in yogurt in milliliter and the small
number of sample, also there was not specific measurement tool to measure
amount of yogurt.
According to physical exercise and BMD, (Table 18) showed that just
(9.7%) of them who did not perform exercise have lumber osteoporosis, also it
was indicated that there was a significant relationship between duration of
exercise in minute and BMD of lumber (P 0.01), and this consistent was with (.
Kröger ,Tuppurainen , Honkanen, Alhava and Saarikoski, 1994), Who found
that low physical activity was contributed in lowering BMD results, and
(Keramat et al, 2008) were considered that exercise as protective factor for
Page 96 of 129

osteoporosis in postmenopausal women in India. Also in British women,
(Stevenson, Lees, Devenport, Cust and Ganger, 1989) they found lack of
regular exercise affect BMD results.
Moreover about smoking status and BMD, (Table 19) showed that more
than half (54.3%) of participants who don't smoke, have normal result of
femoral BMD and less than half (47.3%) of them have normal result of lumber
BMD. While just (3%) of participants who smoke one to ten cigarettes have
normal result of femoral and lumber BMD. Also it was indicated that there was
a positive relationship between number of smoked cigarettes and decreasing
BMD (P.0.019). This finding was agreed with (Costa et al., 2015) and
(Shilbayeh, 2003), they were considered the smoking as a risk factor of
osteoporosis.
In relation to status of period of participants and their BMD , (Table 20)
showed that quarter (25.7%) of participants who have regular menstrual period,
have normal result of femoral BMD, also (24%) of them have normal result of
lumber BMD. While (21.3%) of them who were menopause have normal result
of femoral and lumber BMD, also It was found that there was a relationship
between status of period and BMD as P value (0.000) .And this result went at
same line with ( Kröger ,Tuppurainen , Honkanen, Alhava and Saarikoski,
1994) who found that menopause status have a major effect on BMD.
The relationship between menopause period of participants and their
BMD as (Table 21) showed that (4.4%) of participants who were more 3 year
menopause have femoral osteoporosis and (8.7%) of them have lumber
osteoporosis. It indicated that there was a positive relationship between
menopause period and decreasing BMD on both side as P value (0.000) which
Page 97 of 129
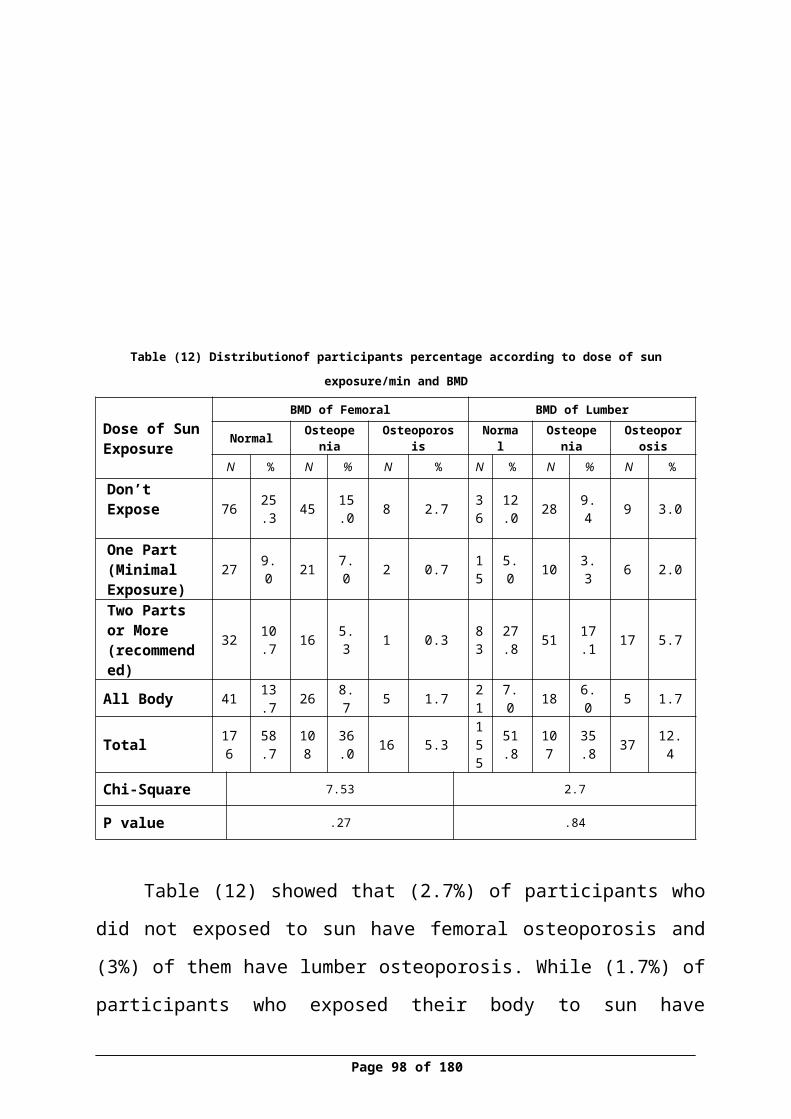
was similar with (Corina, Vulpoi and Branisteanu, 2012) who found that the
BMD in postmenopausal women were lower than in premenopausal women.
The relationship between breast feeding and BMD as (Table 22) showed
that just (4%) of participants who did breastfed to more than 6 children have
normal result of femoral BMD and (3%) of them have normal result of lumber
BMD. While (12%) of participants who did fed to (1-3) children have normal
result of femoral BMD and (11.4%) of them have normal result of lumber
BMD. It was also showed that there was positive relationship between numbers
of breast fed children and decreasing BMD (P.0.003) , (P.0.042). These results
were agreed with (Okyayaet al 2013) who found that Prolonged breast-feeding
period per child > 1 year was the greatest risk factor for osteoporosis.
As (Table 23) results showed that (16%) of participants who have a
family history of osteoporosis, have normal result of femoral BMD and (12.2%)
of them have normal result of lumber BMD. While less than half (42.5%) of
participants who have not family history of osteoporosis, have normal result of
femoral BMD and more than one third (39.8%) of them have normal result of
lumber BMD. It was also showed that there was no correlation between family
history of participants and their BMD results on both side femoral and lumber
(P.366) , (P.121) , this was similar with (Shilbayeh, 2003) results, she was
considered that family of osteoporosis were not independent factors for
osteoporosis among Jordanian women .
According to usage of hormonal tablet and BMD, (Table 24) results
showed that just (0.7%) of participants who used hormonal tablet have femoral
osteoporosis and (2.3%) of them have lumber osteoporoses. While (4.7%) of
participants who did not use hormonal tablet, have femoral osteoporosis and
(10%) of them have normal lumber osteoporosis. It was also showed that there
Page 98 of 129
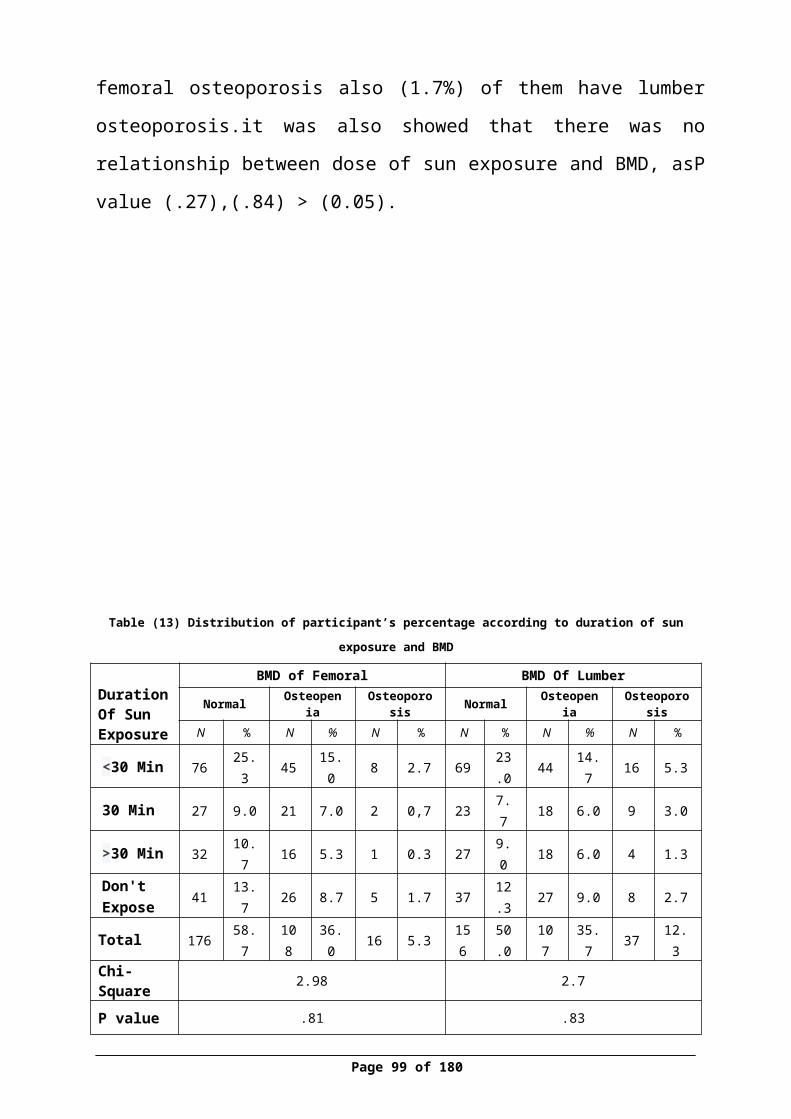
was no relationship between uses of hormonal tablet and BMD on both side,
this results was disagreed with (Stevenson, Lees, Devenport, Cust and Ganger,
1989) who found that uses of oral contraceptives were risk factor for lowering
BMD results, however (Shilbayeh, 2003) considered that duration of hormone
replacement therapy (HRT) were correlated with BMD , the results study may
be affected by small size of sample and lack awareness of benefit usage of
hormonal tablet and different culture .
According to Vit D and BMD ,(Table 25) results showed that that half
(51.6%) of participants who were chosen for Vitamin D test and who have
normal level of Vitamin D (20-50), have normal result of femoral BMD, while
(38.6%) of them have normal result of lumber BMD. On other hand , (13.8%)
of them who have deficiency in Vitamin D ( less than 19) , have normal result
of femoral BMD and (11.4%) of them have normal result of lumber BMD. Also
it was found that there was no relationship between Vit D and BMD on both
side femoral and lumber site , P (.561) (.775). These results was consistent
with study conducted in China (Zhen, Liu, Guang, Zhao and Tang, 2015) their
study indicated that reduced in 25(OH) D levels were not primary related with
an increased osteoporosis risk. And these finding disagree with study conducted
in Japan (Sato, Metoki, Iwamoto, and Satoh, 2003) their study indicate that the
BMD affected by Vit D and sun exposure. There were many factors may affect,
the sun was one of major sources for Vit D and this effect on BMD such as
duration of sun exposure, In this study the most of participants reported that
areas that exposed to sun were hands and face this due to culture and religious
in the Palestinian society, moreover the participants were women and they
wearing long clothes which cover all of body.
According to estrogen and BMD, (Table 26) results showed that just
(0.3%) of participants who were pre-menopause and who have normal level of
estrogen hormone (15-350), they have femoral osteoporosis, while (0.7) of them
Page 99 of 129
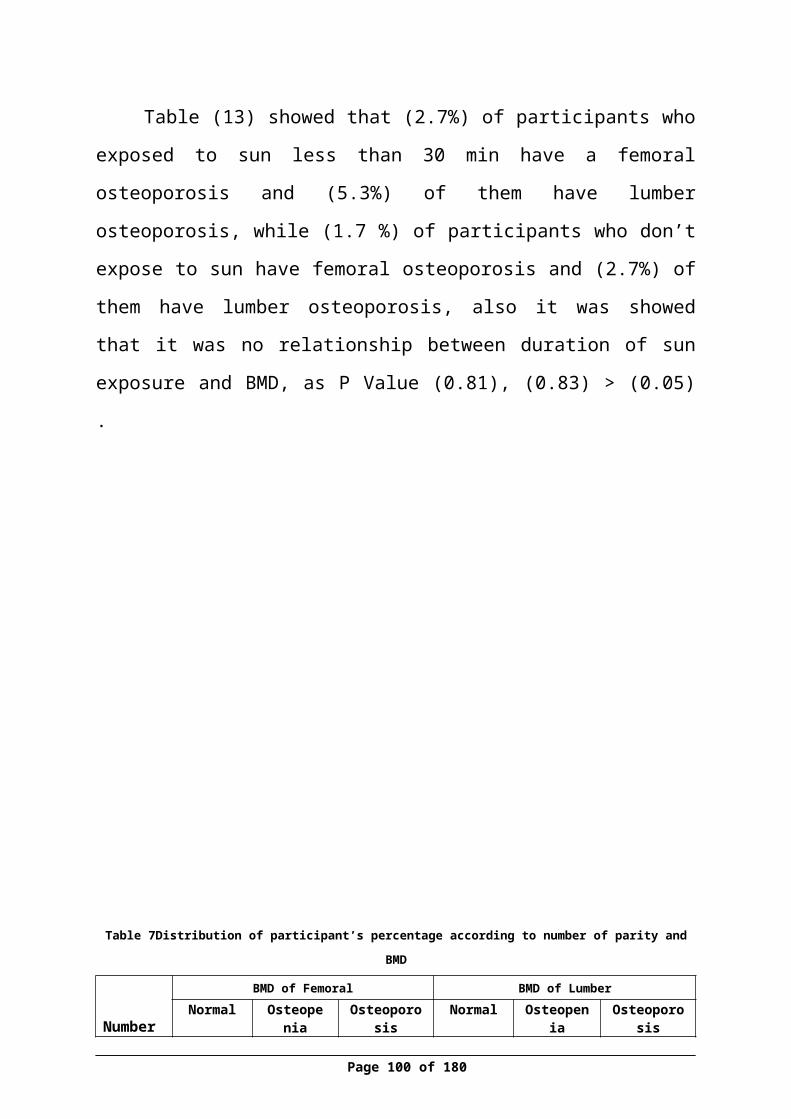
have lumber osteoporosis. In addition, there was just (3.3%) of participants
who were post-menopause and who have abnormal result of estrogen hormone,
they have femoral osteoporosis, while (7%) of them have lumber osteoporosis.
Also it was showed that there was negative relationship between estrogen and
decreasing BMD (P.0.00) , this was consistent with study conducted in USA
(CDC, 1998), which indicated that most estrogen-deficient women in the United
States who had femoral osteoporosis were ignorant of having this condition,
(CDC, 1998). Also this at the same line of study conducted in Japan ( Orimo,
Fujita, Yoshikawa, Hayano , and Sakurada , 1970 ) showed that administration
of conjugated estrogens significantly protected against the decrease in the bone
density and the cortical wideness of the femurs.
Conclusion
This study was designed to investigate the factors that affecting on BMD
including estrogen and vitamin D among women who above 35 years old in
Nablus city, except the women in lactation or pregnancy period. DXA Device,
measured BMD and vitamin D and estrogen were measured by blood serum
analysis and other factors were measured by questionnaire.
After the analysis was done on SPSS and according to WHO criteria, it
showed that (52%) of the participants have normal results of BMD, (35.7%) of
Page 100 of 129
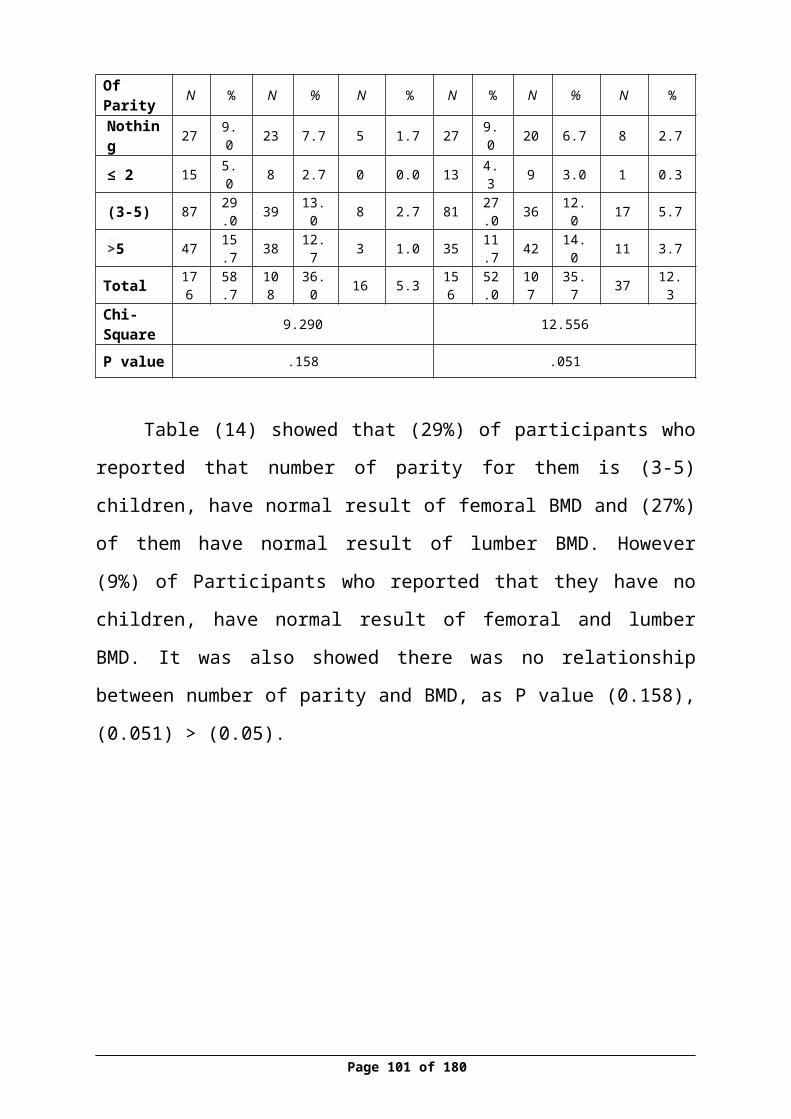
them have osteopenia and (12.3%) have osteoporosis. At femoral site, it showed
that (58.7%) of the women have osteoporosis, (36%) have osteopenia and
(5.3%) have osteoporosis.
The osteopenia percentage was prominent and high among participants in
general, the highest percent of it was in women at age (>55) year. The normal
Estrogen serum level according to status of period was as following: (76%) of
women who have regular period, their results were (15-350), also (72%) of
women who have irregular period their results were (15-350), in addition (35%)
of menopause women, their results were (less than 10). Moreover the highest
age group has deficiency in Vitamin D is (45-44).
The study showed that there were risk factors affecting on BMD, these
factors were elderly women, low BMI, smoking, soft drink, breast-feeding,
menopause and post-menopause. Also showed that there was a relationship
between estrogen level and BMD, however no relationship between vitamin D
and BMD.
Page 101 of 129
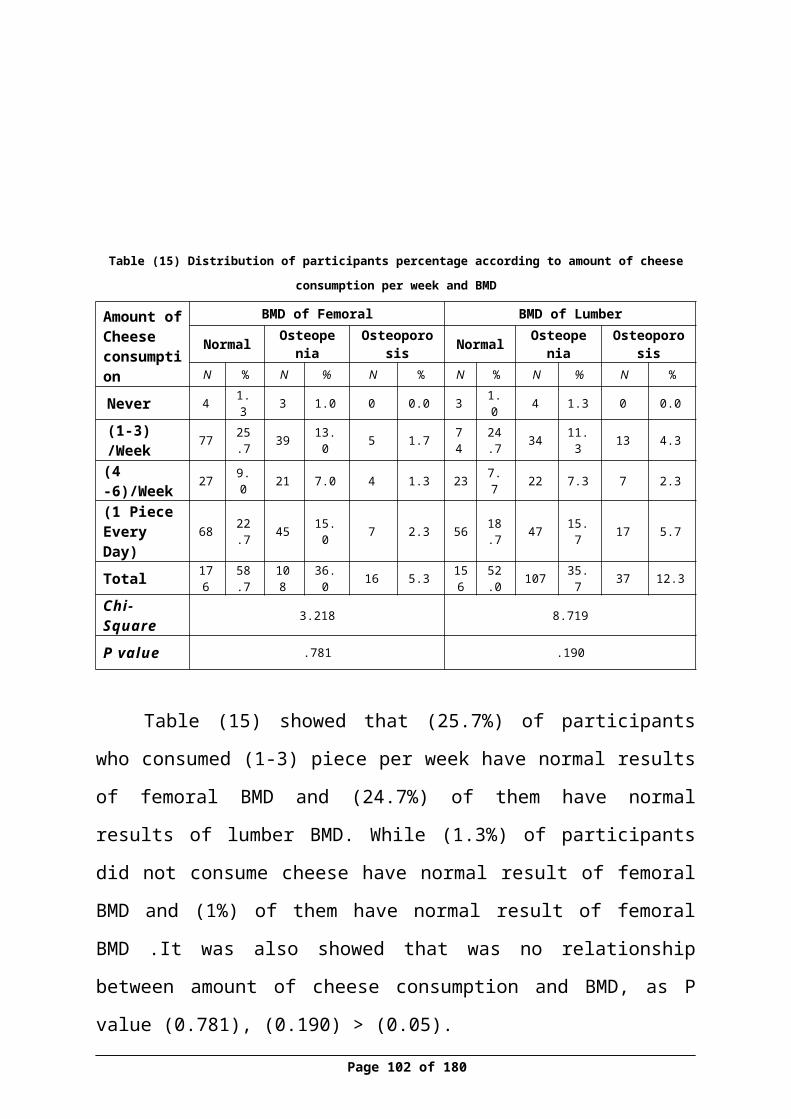
Recommendations
1. Follow up and early screening for non-menopausal women and women
with past family history with osteoporosis to prevent osteoporosis.
2. It is recommended to expose the hands and face to the sun daily for 10 to
15 minutes during the middle of the day to get optimal Vitamin D. Based
on literature review, get attention on vitamin D to prevent consequences
of osteoporosis ,even if it was no relation between calcuim ,vitamin D
and BMD.
3. Exercise 75-150 minutes for 2 or more time per week to keep normal and
healthy bone.
4. Calcium intake for pre-menopause (<50 year) suggested to intake 1000
mg/day and 1200 mg/day for postmenopausal women. Based on literature
review , get attention on calcium to prevent consequences of osteoporosis
,even if it was no relation between calcium, and BMD
5. Increase health education about limitation of soft drink intake and
smoking in primary health care and among schools
6. Increase awareness about the importance for breast-feeding as protective
from osteoporosis.
7. Maintain as possible ideal weight not less and not more BMI (18-24.9).
Page 102 of 129

8. It advised to provide the diagnosis of bone density device DXA in
primary health care clinic in Palestinian society.
9. More studies must investigate the relationship between vitamin d and
BMD.
Limitations
1. Time to conduct the study and collect the data was limited.
2. Small sample size, which may expose the results to bias.
3. Using convenience method rather randomize due to restrictive policies of
the association
Page 103 of 129

References (APA style)
1. Agrawal, T. &Verma, A.K. (2013). Cross sectional study of osteoporosis
among women. Med J Armed Forces India.69(2): 168–171.[Pmc
Articles] .
2. Aloia, J.F., Cohn, S.H., Vaswani, A, Yeh, J.K., Yuen, K. & Ellis, K.
(1985) . Risk factors for postmenopausal osteoporosis. The American
Journal of Medicine. 78, (1) p95–100. [PubMed]
3. Avenell, A.,Gillespie, W.J., Gillespie, L.D,& O’connell,D.(2005).
Vitamin D and vitamin D analogues for preventing fractures associated
with involutional and post-menopausal osteoporosis. Cochrane Database
Syst Rev;(2):CD000227.
4. Babatunde, O., Brinkley,J. &Brenda J. (2015). Too Young to Care -
Gender and Athletic Status Differences in the Knowledge of Osteoporosis
Risk Factors among Undergraduates. Journal of Nutrition Education and
Behavior.47(5), p403-486.[Articles Free]
5. Bischoff, H.A. (2012) .Which vitamin D oral supplement is best for
postmenopausal women. current osteoporosis reports.10(4):251-7
[PubMed]
6. Cauley,J.A. , Cummings,S.R. , Black , D.M. ,Mascioli , S.R.&Seeley DG.
(1990). Prevalence and determinants of estrogen replacement therapy in
elderly women. American Journal of Obstetrics and Gynecology.163(5)
p1438–1444.
Page 104 of 129
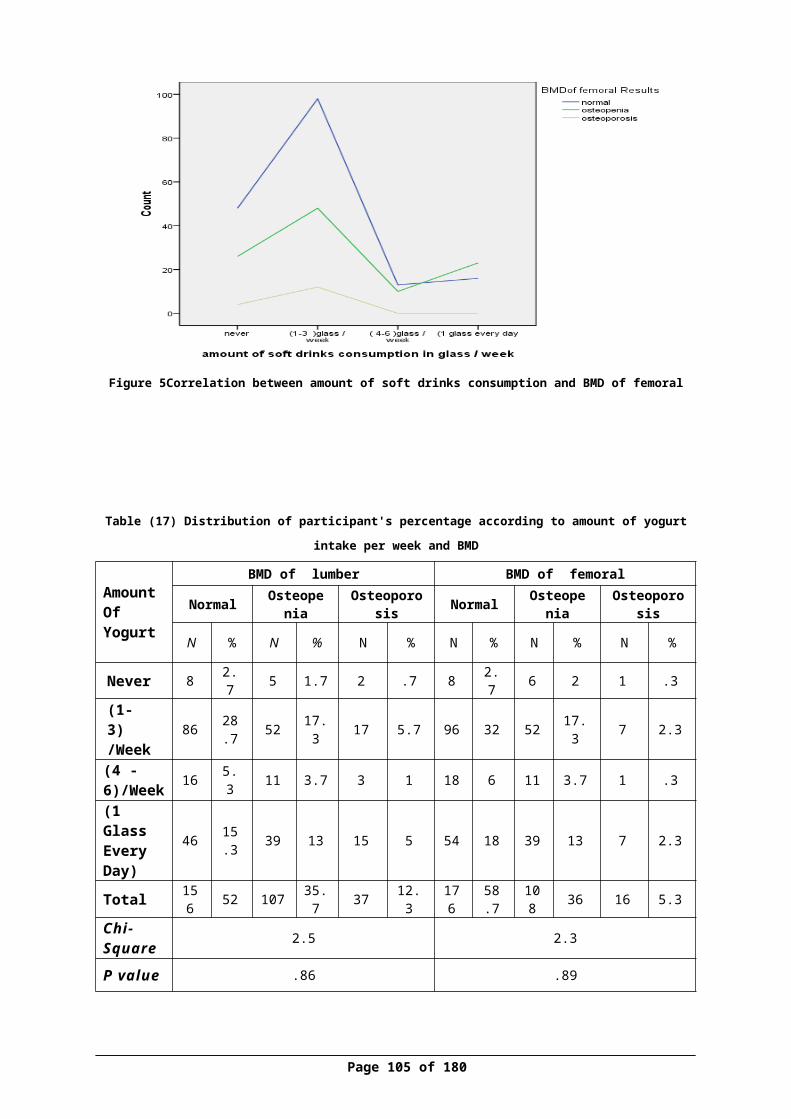
7. CDC.Centers for Disease Control and Prevention. (2012). CDC Second
Nutrition Report Vitamin D deficiency closely related to race/ethnicity.
Retrieved at 9 November at : [CDC]
8. CDC.Centers for Disease Control and Prevention. (2015).Genomics,
Family History & Osteoporosis. Retrieved at 11 Novemver: [CDC]
9. Chan ,M.F.&Ko CY. (2006).Osteoporosis prevention education programs
for women. Advancing nurse .54(2):159-70 [PubMed]
10.Chapuy, M.C. ,Arlot, M.E., Duboeuf, F., Brun ,J. , Crouzet, B. , Arnaud,
S., Delmas ,P.D. &Meunier ,P.J.(1992). Vitamin D3 and calcium to
prevent hip fractures in the elderly women. New England Journal of
Medicine, 327(23):1637-42 [PubMed]
11.Chen ,S.J. ,Lin,C.S. , Lin, C.L. & Kao C.H. (2015). Osteoporosis Is
Associated With High Risk for Coronary Heart Disease. Medicine
(Baltimore). ; 94(27): e1146. [Pubmed]
12. Clinic, D.A. (2010).Denver arthritis clinic. Osteoporosis questionnaire.
available at
http://denverarthritisclinic.com/uploads/images/Resources/FORM-
OSTEOQUESTIONNAIRE_003.pdf
13.Copenhagen Consensus Conference. (1990).What Is Osteoporosis?
Available at: [PubMed]
14.Corina, M.,Vulpoi, C. &Brănişteanu,D. (2012). Relationship between
bone mineral density, weight, and estrogen levels in pre and
postmenopausal women. National Library of MedicineNational Institutes
of Health. 116(4):946-50.[Bio Med Lab]
Page 105 of 129
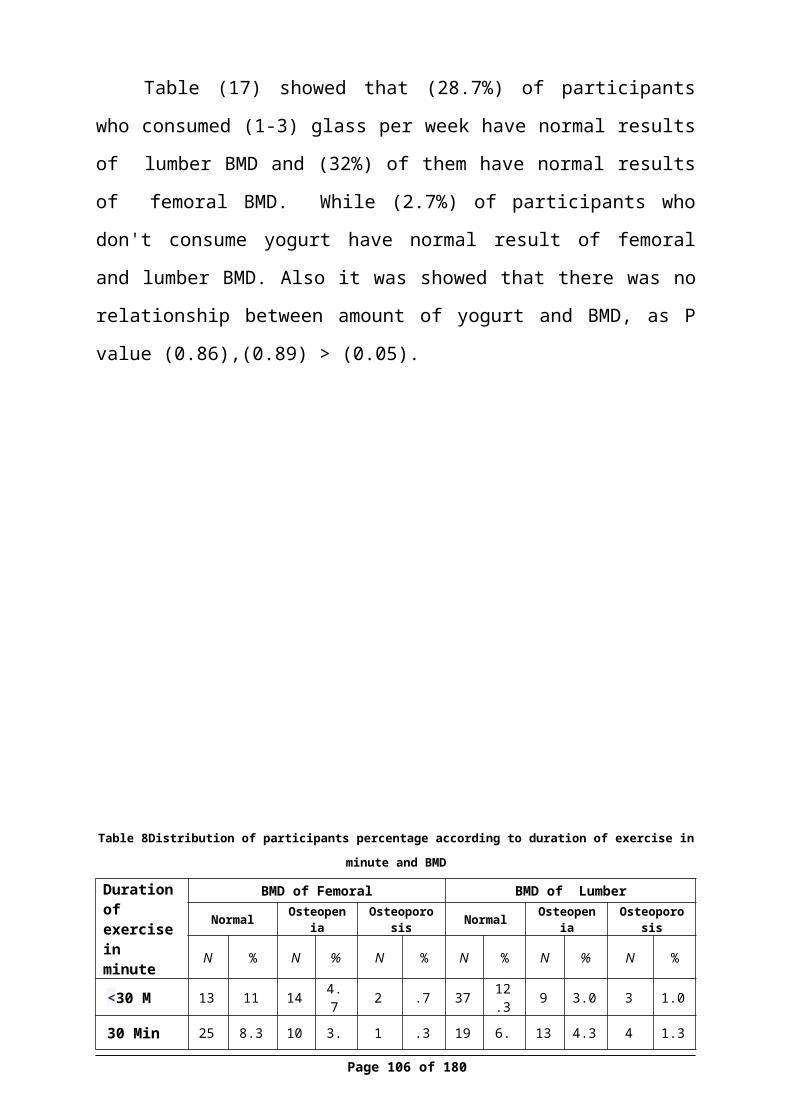
15.Costa ,A.L. , Silva ,M.A . , Brito,L.M. , Nascimento , A.C, Barbosa,
J.E . , Bezerra,G.F. , Viana,G.M. , Muniz ,W.E. ,
Vidal ,F.C .&NascimentoMD . (2015). Osteoporosis in primary care: an
opportunity to approach risk factors. Rev Bras Reumatol. S0482-
5004(15)00070. [Pubmed]
16. Davidson, M.R. (2003) .Pharmacotherapeutics for osteoporosis
prevention and treatment. Journal of Midwifery and Women’s Health.
48(1),39-52.Retrieved at : [medscape]
17. Davis, JL. (2009). the Effects of Smoking on Bone Health; Living with
Osteoporosis. WebMD Home .Retrieved at: [webmed]
18.El Maataoui, A. ,El Maghraoui,A. , Biaz, A. , Elmachtani, S.I. , Dami,
A. ,Bouhsain, S. , Mounach, A. , Chabraoui, L .&OuzzifZ .(2015).
Relationships between vertebral fractures, sex hormones and vitamin D in
Moroccan postmenopausal women. BMC Womens Health. 13;15:41.[Bio
Med Central]
19. El Maghraoui,A .(2012).Interpreting a DEXA Scan in Clinical
Practice .Rheumatology Department, Military Hospital Mohammed V,
Rabat, Morocco .Reviewed at :
http://cdn.intechopen.com/pdfs-wm/26674.pdf
20.El Maghraoui,A., ElMaataoui,A., Biaz, A. , Elmachtani,S.I. , Dami,
A. ,Bouhsain,S. , Mounach,A. , Chabraoui,L .&Ouzzif , Z .(2015).
Relationships between vertebral fractures, sex hormones and vitamin D in
Moroccan postmenopausal women. BMC Women Health. 13;15:41.[Bio
Med Central]
Page 106 of 129
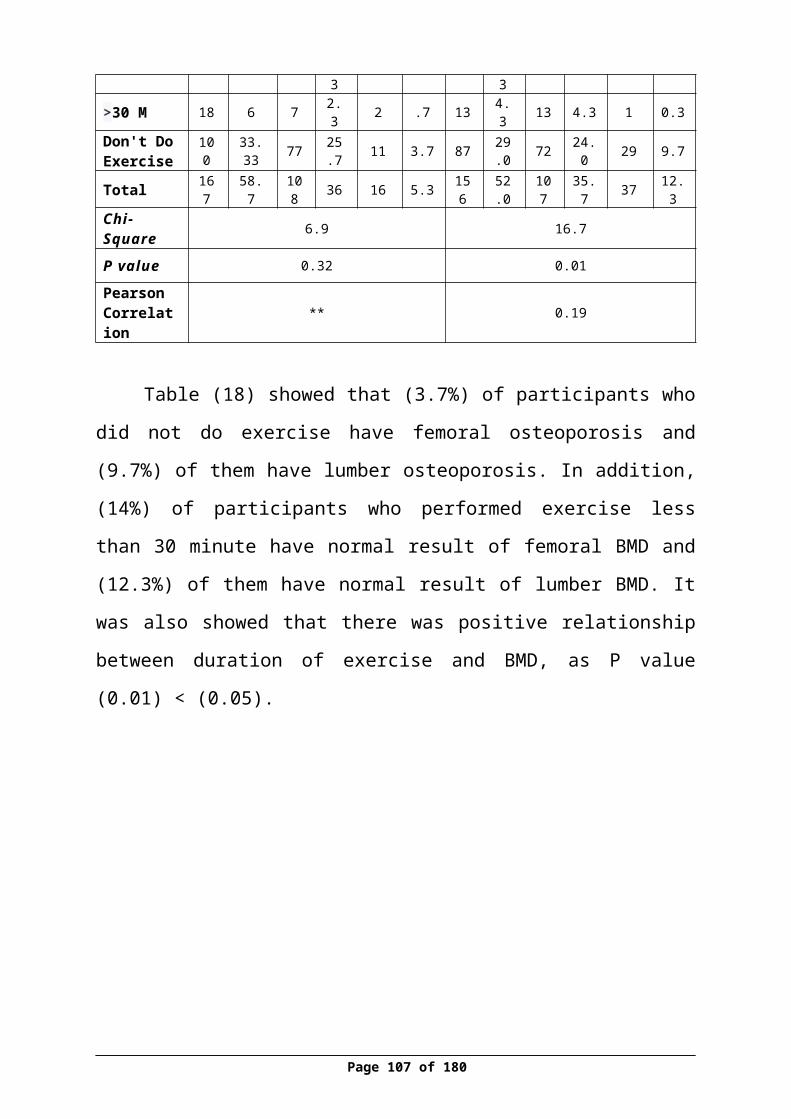
21.El-Tawab, S., Saba, E.,Elweshahi, H.&Ashry, M.(2015). Knowledge of
osteoporosis among women in Alexandria.The Egyptian
Rheumatologist .doi:10.1016/j.ejr.2015.08.001.[Sciencedirect]
22. Family health guide.(2011) .menopause .Available
at:http://www.familyhealthguide.co.uk/menopause.html
23. Gourlay, M.L.,Fine,J.P., Preisser, J, S.,May, R.C.,Chenxi,
L.,Lui,L.Y.,Ransohoff, D.F.,Cauley, J.A. &Ensrud, K. E.(2012). Bone-
Density Testing Interval and Transition to Osteoporosis in Older Women.
New England Journal of Medicine. 366(3): 225–233[PubMed]
24. Grob, G.N. (1931). Aging bones: a short history of osteoporosis.p5. Johns
Hopkins Biographies of Disease.
https://www.goodreads.com/book/show/18639541-aging-bones
25. Health wise.(2014). Bone Density. WebMD Home Osteoporosis Health
Center ,Assessed on 22th October, Retrieved at
http://www.webmd.com/osteoporosis/bone-mineral-density-test
26. Henry, G. (1918). Anatomy of the Human Body. Osteology. available at
http://www.bartleby.com/107/18.html
27. Hillier ,T.A. , Rizzo ,J.H. , Pedula ,K.L. , Stone, K.L. ,
Cauley ,J.A. ,Bauer, D.C .&Cummings, S.R .(2003).Null parity and
Fracture Risk in Older Women: The Study of Osteoporotic
Fractures .Bone and Mineral Research .18(5) ,893–899, [PubMed]
Page 107 of 129
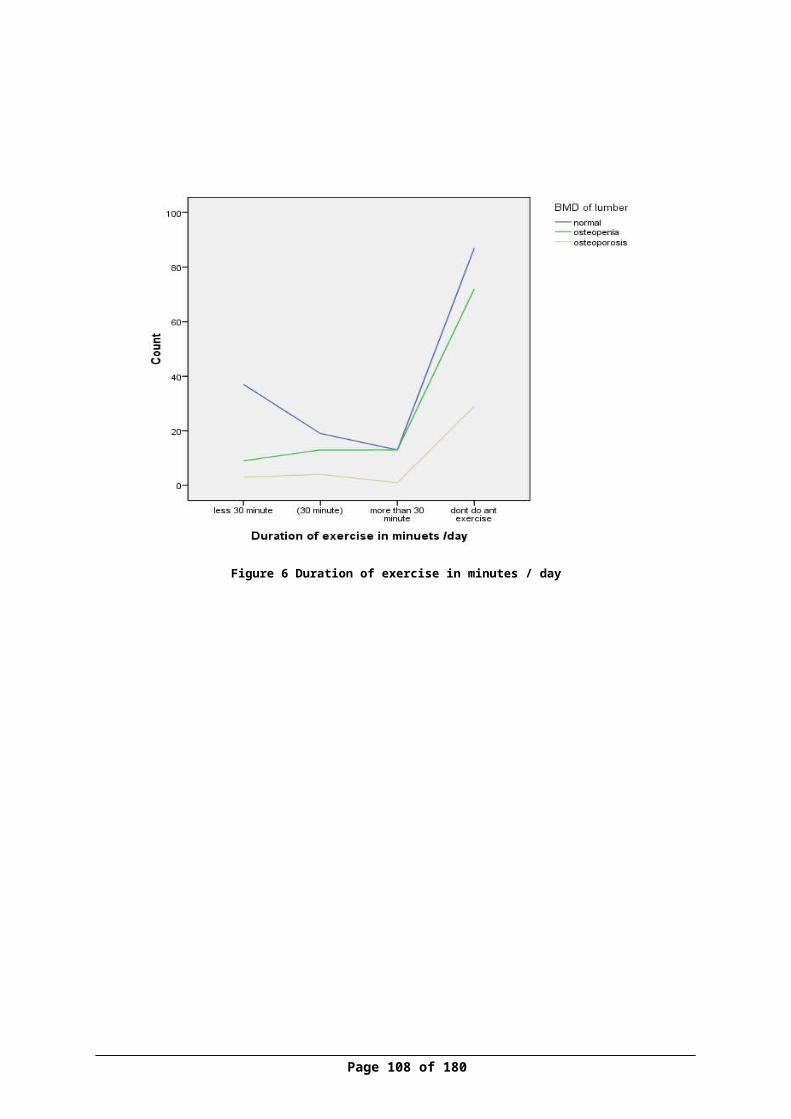
28.Hannon, C.& Murphy, K.(2007). A survey of nurses and midwives’
knowledge of risks and lifestyle factors associated with osteoporosis.
Journal of Orthopedic Nursing. 11(1):30-37.[Article]
29.Hernlund,E.,Svedbom,A. , Ivergård,M. , Compston,J. , Cooper,C. ,
Stenmark ,J. ,McCloskey,E.V. , Jönsson,B. &Kanis, J. A.
(2013).Osteoporosis in the European Union: medical management,
epidemiology and economic burden.Archives of Osteoporos .8(1-2): 136.
[PubMed] .
30.Humadi ,A. , Alhadithi, R.H. & Alkudiari ,S.I. (2010). Validity of the
DEXA diagnosis of involutional osteoporosis in patients with femoral
neck fractures. indian journal of orthopaedics. 44(1):73-8..[Free Articles]
31.IOF.International Osteoporosis Foundation. (2015).Osteoporosis
&Musculoskeletal Disorders - Osteoporosis - Prevention .Retrieved at
12th November at: http://www.iofbonehealth.org/osteoporosis-
musculoskeletal-disorders/osteoporosis/prevention/calcium
32.IOF.International Osteoporosis Foundation. (2015). Osteoporosis &
Musculoskeletal Disorders .Osteoporosis. Retrieved at 21 October. from :
http://www.iofbonehealth.org/
33.IOF.International Osteoporosis Foundation. (2015). Osteoporosis &
Musculoskeletal Disorders; Osteoporosis; Prevention. VITAMIN D.
Retrieved at 8th November From:
http://www.iofbonehealth.org/osteoporosis-musculoskeletal-disorders/
osteoporosis/prevention/vitamin-d
Page 108 of 129
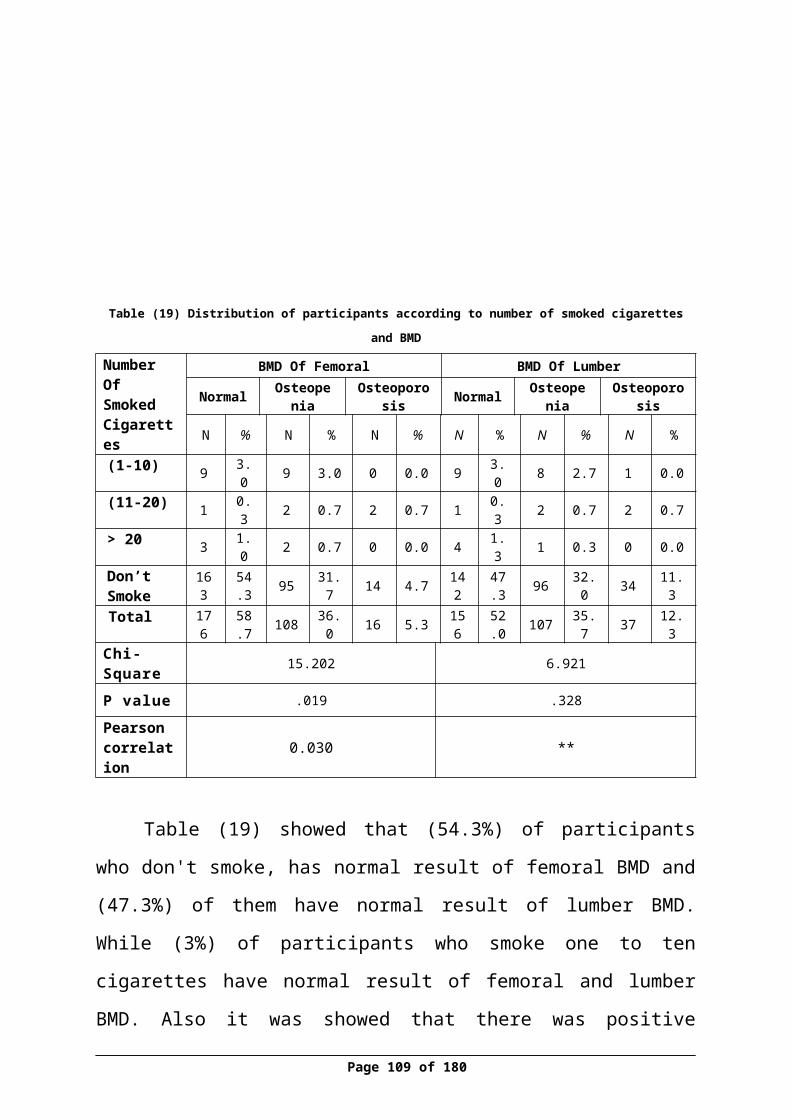
34.Janiszewska, M.,Kulik, T.,Dziedzic, M.A. &Żołnierczuk-Kieliszek D.
(2015). Chosen risk factors for osteoporosis and the level of knowledge
about the disease in peri- and postmenopausal women. Menopause
review. 14(1):27-34.[Pubmed]
35. Karlsson, M.K.,Nordqvist, A.&Karlsson , C. (2008). Physical activity
increases bone mass during growth. Food Nutr Res.; 52: 10.3402 .[Pmc
Articles]
36.Keramat,A., Patwardhan,B. , Larijani, B. , Chopra ,A., Mithal,A.,
Chakravarty,D., Adibi, H .&Khosravi,A .(2008). The assessment of
osteoporosis risk factors in Iranian women compared with Indian
women.BMC Musculoskeletal Disorders.9(28).[BioMed Central Ltd]
37.Khorsandia, M.,Hasanzadehb, L.&Ghobadzadehc, M. (2012).
Assessment of Knowledge and Self-Efficacy in Achieving Osteoporosis
Prevention Behaviors among High School Female Students. Procedia
Social and Behavioral Sciences.46; 4385–4388.[Science Direct]
38. Kim, Y., Kim,J.H. &Cho, D.S. (2015). Gender difference in osteoporosis
prevalence, awareness and treatment: based on the Korea national health
and nutrition examination survey 2008~2011. J Korean Acad Nurse.
(2):293-305.[Pubmed]
39. Kleerekoper,M. , Brienza,R.S. , Schultz, R.L.&Johnson ,C.C. (1991).
Oral Contraceptive Use May Protect Against Low Bone Mass. Jama
Internal Medicine, Arch Intern Med. 151(10):1971-1976 .[Article]
Page 109 of 129
40.KrögerH, M. , Tuppurainen ,M., Honkanen ,R., Alhava ,E .&Saarikoski ,
S .(1994) . Bone mineral density and risk factors for osteoporosis a
population-based study of 1600 peri menopausal women. Calcified
Tissue International . 55, (1) p1-7.[Springer article]
41.Krucik, G. (2014).Osteoporosis; Osteoporosis Symptoms. available
at :Retrieved at http://www.healthline.com/health/osteoporosis-
symptoms#Overview1
42.Lufkin ,E.G. , Heinz ,W. , Wahner, M.D. , O'Fallon, W.M. , Hodgson ,
S.F. , Kotowicz , M.A. , Lane, A.W. ,Judd ,H. L. , Caplan,R.H .& Riggs,
L.B. .(1992). Treatment of Postmenopausal Osteoporosis with
Transdermal Estrogen. Annals of internal medicine.117 (1):1-9[Free
Article]
43. Makhdoom,A.,Rahopoto,M. , Siddiqui, K.A. &Qureshi ,G.A. (2014).
Early Detection of Osteoporosis by Dual Energy X-ray Absorptiometry.
Pakistan Journal of Medical Sciences.30 (6): 1265–1269.[PMC Articles]
44. Manring, M.M.& Calhoun, J.H .(2011) .Biographical Sketch: Fuller
Albright,ClinOrthopRelat Res .469(8): 2092–2095 [PubMed]
45.Mayo Foundation for Medical Education and Research. (2015).
Estrogens, Estrone (E1) and Estradiol (E2), Fractionated,
Serum .available at .http://www.mayomedicallaboratories.com/test-
catalog/Clinical+and+Interpretive/84230]
46.Mayo Medical. (2013).vitamin D testing the Laboratories
Difference.avilableat.http://www.mayomedicallaboratories.com/articles/
vitamind/pfriendly.html
Page 110 of 129
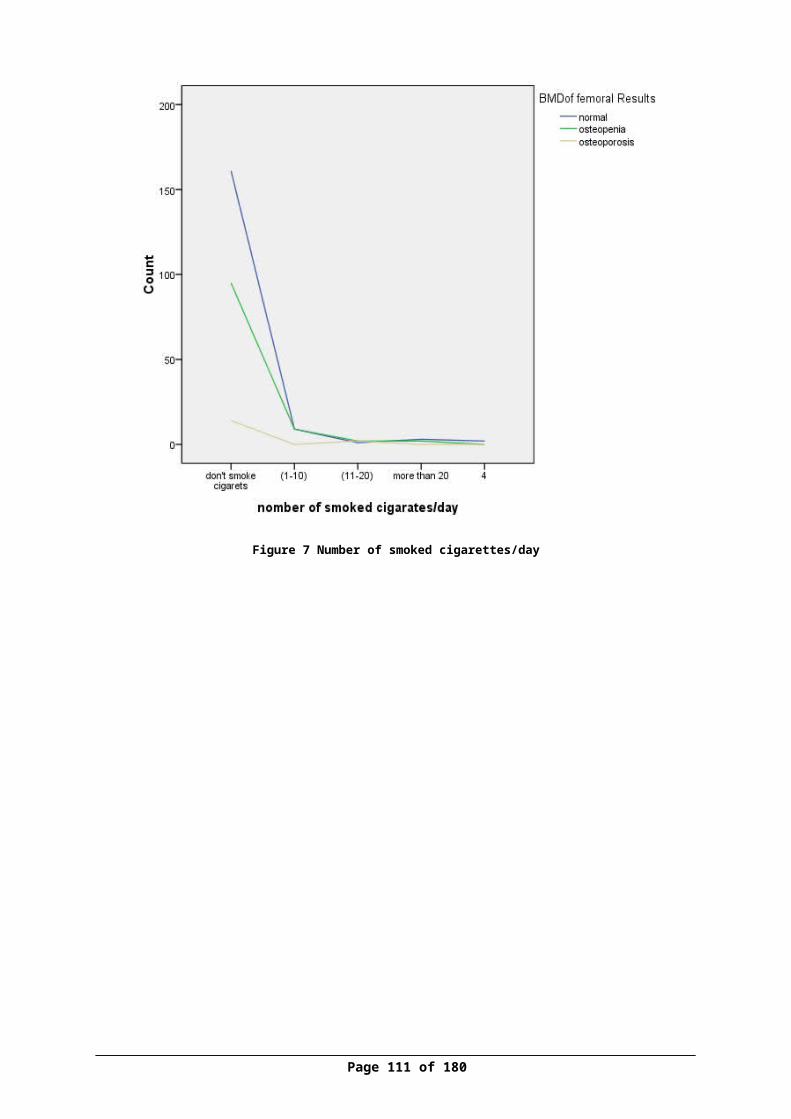
47. Miura, S.,Saavedra, O.L.&Yamamoto .S. (2008). Osteoporosis in urban
post-menopausal women of the Philippines: prevalence and risk factors.
Arch Osteoporosis. 3(1-2): 17–24.[Springer]
48.Murphy ,S. , Khaw,K.T. , May ,H .&Compston, J.E. (1994). Milk
consumption and bone mineral density in middle aged and elderly women
.British Medical Journal .308:939.
49.Murphy,S. ,Khaw, K.M. ,May, H.&Compston ,J.E. (1994) .Parity and
bone mineral density in middle-aged women .Osteoporosis
International.4(3):162-166.[Springer article]
50.Mayo Foundation For Medical Education And Research .(2013).vitamin
D testing; The Mayo Medical Laboratories Difference .
http://www.mayomedicallaboratories.com/articles/vitamind/pfriendly.htm
l
51. NIH. National Institute Health. (2015).Osteoporosis ;Women; Pregnancy,
Breastfeeding, and Bone Health .Retrieved at 6th November:
http://www.niams.nih.gov/health_info/Bone/Bone_Health/Pregnancy/def
ault.asp
52. NOF. National Osteoporosis Foundation. (2013).Learn about
Osteoporosis, Bone Basics. Assessed on 20th October, Retrieved
at :http://nof.org/learn/bonebasics
53. NOF.National Osteoporosis Foundation. (2014).Making a Diagnosis.
Retrieved at 10th November at : http://nof.org/articles/8
Page 111 of 129
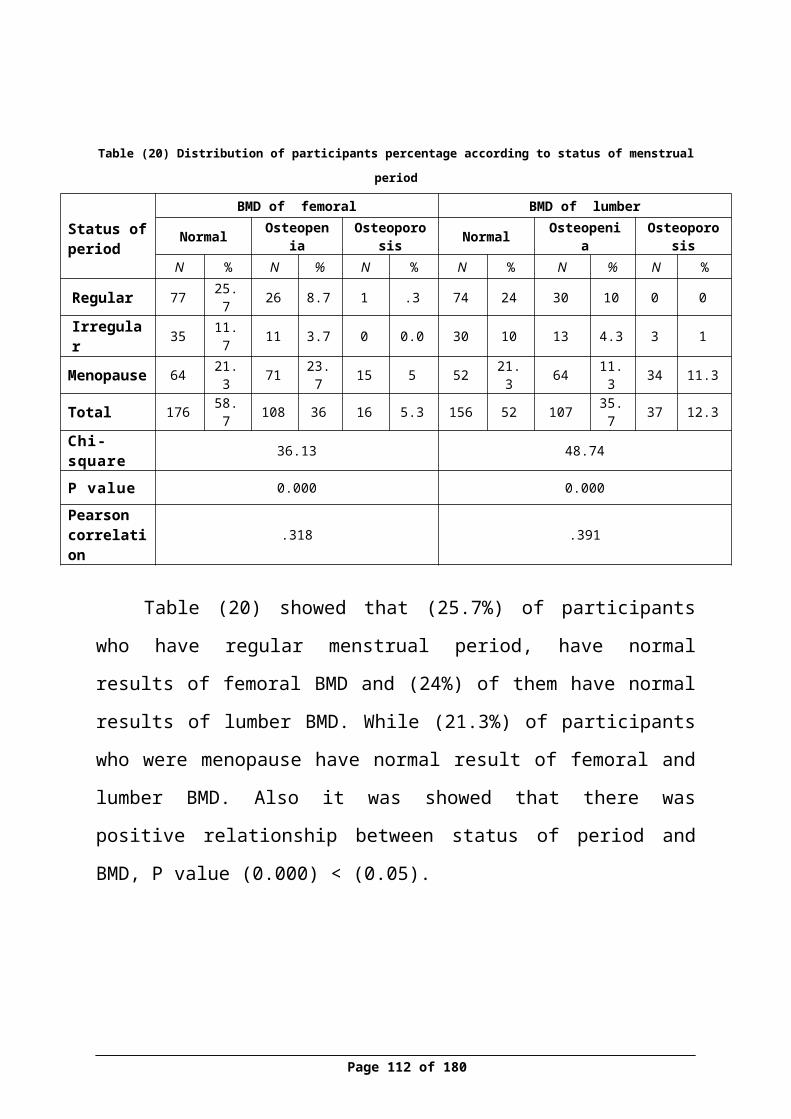
54. NOF.National Osteoporosis Foundation .(2012).Calcium and Vitamin D:
What You Need to Know .Retrieved at 5th November
at :http://nof.org/calcium
55. NOF.National Osteoporosis Foundation. (2014).What is Osteoporosis?
Retrieved at 11thNovemberathttp://www.nof.org/articles/7
56.Okyay, D.O.,Okyay, E.,Dogan,E. , Kurtulmus, S. , Acet, F. , Taner, C.E.
(2013). Prolonged breast-feeding is an independent risk factor for
postmenopausal osteoporosis. National Library of MedicineNational
Institutes of Health. 74(3):270-5 .[Pubmed]
57.Orimo, H.,Fujita, T.,Masaki, Y.,Hayano, K.&Toyozo, S. (1970). Effect of
Estrogen on Immobilization Osteoporosis. Endocrinology.88 (1)
onilne1945-7170. Available at
http://press.endocrine.org/doi/abs/10.1210/endo-88-1- 102?
journalCode=endo
58.Osteoporosis. (2007). Webster’s Timeline History. Retrieved at 24th
October from http://sciencebeta.com/history-osteoporosis/
59.Pacheco ,E.M. , Harrison ,E.J. , Ward, K.A. , Lunt, M . & Adams, J.E.
(2002). Detection of osteoporosis by dual energy X-ray absorptiometry
(DXA) of the calcaneus: is the WHO criterion applicable? .Calcified
tissue international. 70(6):475-82.[PuBmed]
60.Pasco, J,A., Henry, M.J. , Nicholson, G.C. , Sanders, K,M.& Kotowicz,
61.PCBS. (2009) . (2010) .Palestinian Central Bureau of Statistics .Available
at: www.pcbs.gov.ps/default.aspx
Page 112 of 129
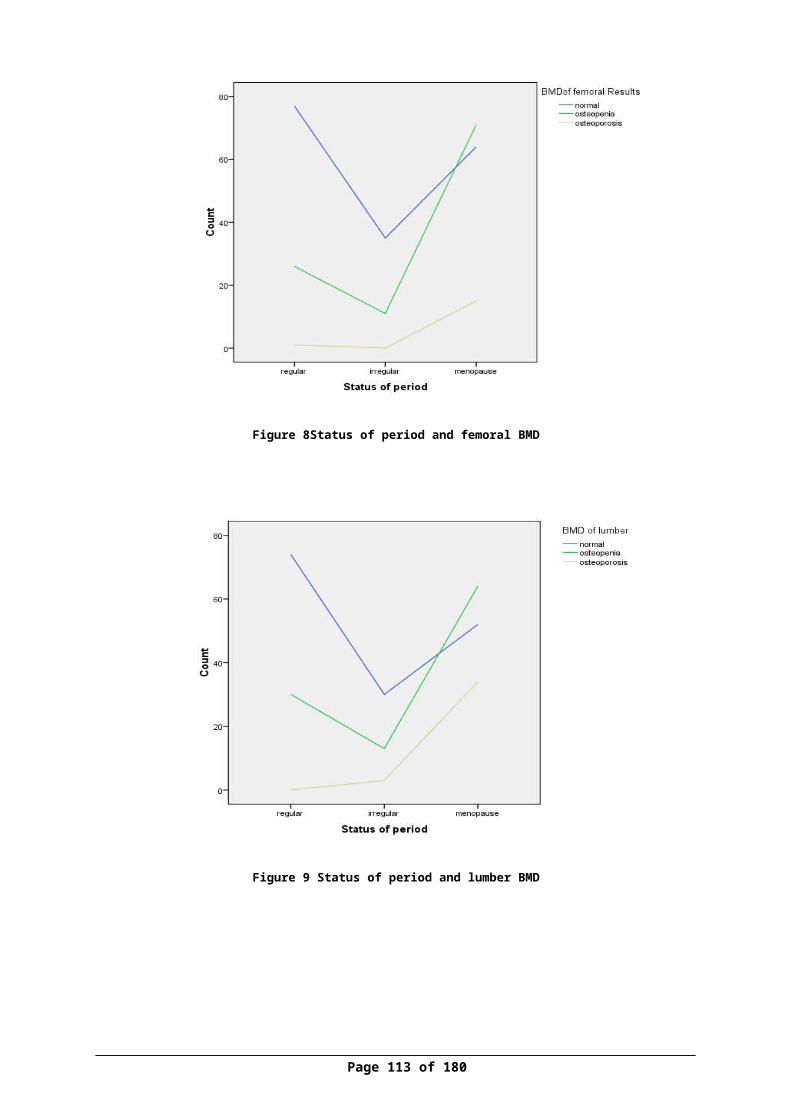
62. PCBS. (2010) .Palestinian Central Bureau of Statistics .Available at:
www.pcbs.gov.ps/default.aspx
63.PCBS. (2011) .Palestinian Central Bureau of Statistics .Available at:
www.pcbs.gov.ps/default.aspx
64. PCBS. (2012) .Palestinian Central Bureau of Statistics .Available at:
www.pcbs.gov.ps/default.aspx
65.PCBS. (2013).Palestinian Central Bureau of Statistics. Statics. Reviewed
at : http://www.pcbs.gov.ps/
66.Prior, J.C., Kirkland, S.A. , Joseph, L. , Kreiger, K. , Murray ,T.M. ,
Hanley, D.A. , Adachi, J.D. , Vigna , Y.M. , Berger, C., Blondeau,L. ,
Jackson, S.A.&Tenenhouse, A. (2001) . Oral Contraceptive Use and
Bone Mineral Density in Premenopausal Women: Cross-sectional,
population-based data from the Canadian Multicenter Osteoporosis
Study. CMAJ 165(8):1023-1029.
67.Ravan,P. , Cizza, G. , Bjarnason ,N.H. , Thompson, D. , Daley, M. ,
Wasnich, R.D. , McClung, M. , Hosking, D. , Yates, A.J .
&Christiansen ,C.(1999).Low body mass index is an important risk factor
for low bone mass and increased bone loss in early postmenopausal
women. Early Postmenopausal Intervention Cohort (EPIC) Study Group.
Journal of Bone and Mineral Research. 14(9),1622-1627.[PubMed]
68.Salari ,P.&Abdollahi, M. (2014).The Influence of Pregnancy and
Lactation on Maternal Bone Health: A Systematic Review. Family and
Reproductive Health, 8(4), 135–148[PubMed]
69.Sato ,Y. , Metoki, N. , Iwamoto, J. & Satoh ,K .(2003) .Amelioration of
osteoporosis and hypovitaminosis D by sunlight exposure in stroke
patients.American academy of neurology.61(3):338-342 .[Free Articles]
Page 113 of 129
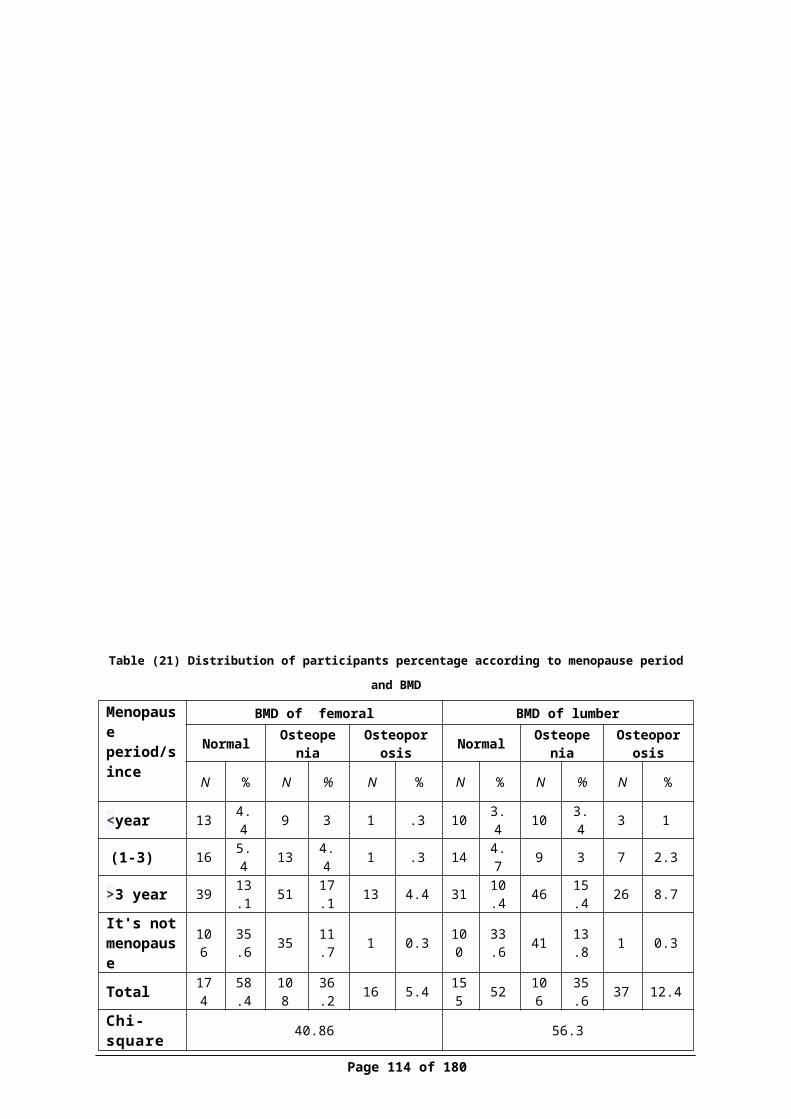
70. Shackelford, L.C., LeBlanc ,A.D. , Driscoll ,T.B. , Evans, H.J. ,
Rianon ,N.J. , Smith ,S.M. , Spector, E. , Feeback ,D.L.&Lai ,D.l .(2004).
Resistance exercise as a countermeasure to disuse-induced bone loss.
Journal of Applied Physiology. 97(1):119-29. [PubMed]
71.Shilbayeh,S .(2003) . Prevalence of osteoporosis and its reproductive risk
factors among Jordanian women: a cross-sectional study. Osteoporosis
International. 14(11):929-40
72. Soroko,S.B. , Barrett,C.E. , Edelstein,S.L.&Kritz,S.D.(1994) .Family
history of osteoporosis and bone mineral density at the axial skeleton: the
Rancho Bernardo Study. Journal of Bone and Mineral Research. 9(6),
761-769[JBMR]
73. Specker, B. &Binkley, T. (2003).Randomized trial of physical activity
and calcium supplementation on bone mineral content in 3- to 5-year-old
children. Bone Miner Res .18(5):885-92. [PubMed]
74. Stevenson, J.C., Lees, B., Devenport,M. ,Cust, M.P.& Ganger, K.F.
(1989).Determinants of bone density in normal women: risk factors for
future osteoporosis? . British Medical Journal.298 doi:
http://dx.doi.org/10.1136/bmj.298.6678.924
75.Stolarczyk A., Horvath, A., Szczechura, M. ,
Kamińska,M .&Dziechciarz,P.(2014). High prevalence of vitamin D
insufficiency in community-dwelling postmenopausal Polish
women .Menopause review. 13(5):289-92.[Journal Article]
Page 114 of 129
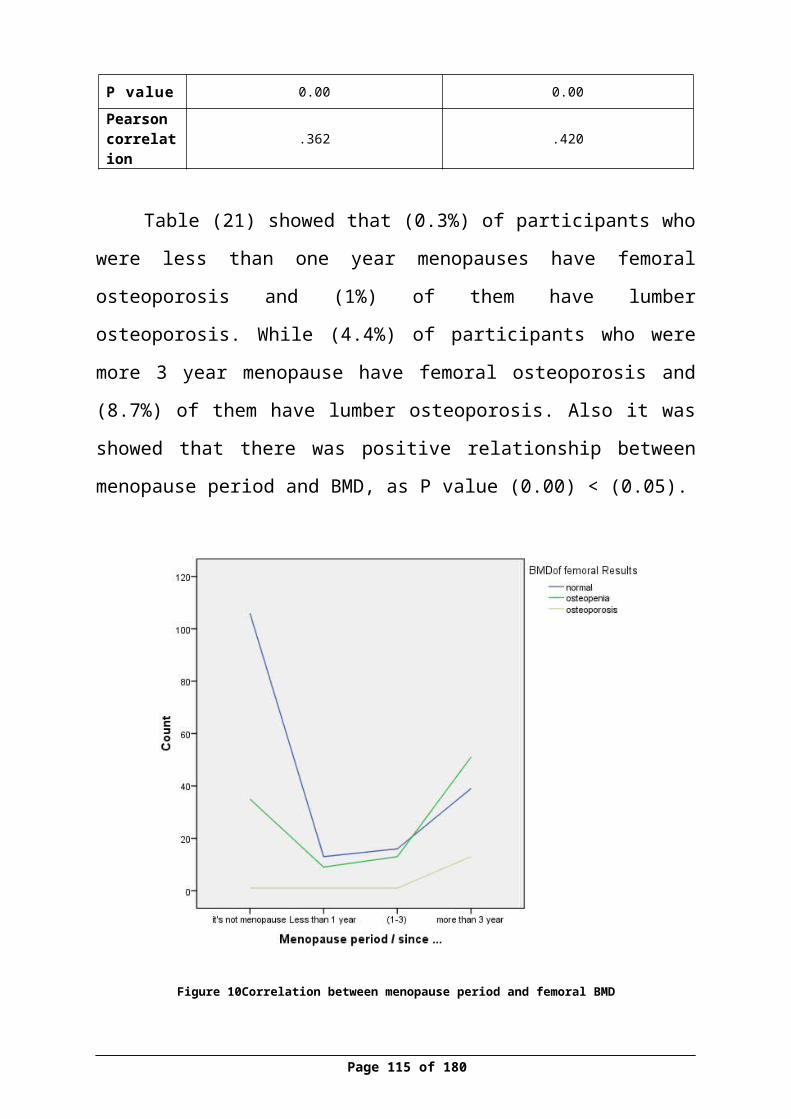
76.Vered, I.,Werner, P. &Shemy, O. (2008). Nurses' knowledge and
perceptions about osteoporosis: a questionnaire survey. International
journal of nursing studies. 45(6):847-54.[PubMed]
77.Vitamin D council.(2010) .How do I get the vitamin D my body needs?
available at :https://www.vitamindcouncil.org/about-vitamin-d/how-do-i-
get-the-vitamin-d-my-body-needs/
78.Wadolowska, L. , Sobas,K. ,Szczepanska,J.W. , Slowinska,M.A. ,
Matyasik,M.C.&Niedzwiedzka ,E .(2013) . Dairy Products, Dietary
Calcium and Bone Health: Possibility of Prevention of Osteoporosis in
Women. Nutrients. 5(7): 2684–2707.[Mdpi]
79.WebMD. (2014).Estrogens. Women's Health. reviewed at 6 November
available at : http://www.webmd.com/women/estrogens
80. Whitcomb,B.W. , Bodach,S.D. , Mumford ,S.L. , Perkins, N.J. , Trevisan,
M. , Wende,J.W. , Liu,A. &Schisterman ,E.F .(2010) .Ovarian function
and cigarette smoking in the Bio Cycle Study. HHS Author Manuscripts.
24(5): 433–440.[PubMed]
81. WHO. World health organization. (1994). Assessment of Fracture Risk
and its Application to Screening for Postmenopausal Osteoporosis.
Report of a WHO study Group. World Health Organ Technical Report
Series. 1994; 843:1-129. [PubMed]
82.WHO. World health organization. (2004). Scientific group on the
assessment of osteoporosis at primary health care level
[http://www.who.int/chp/topics/Osteoporosis.pdf ]
Page 115 of 129
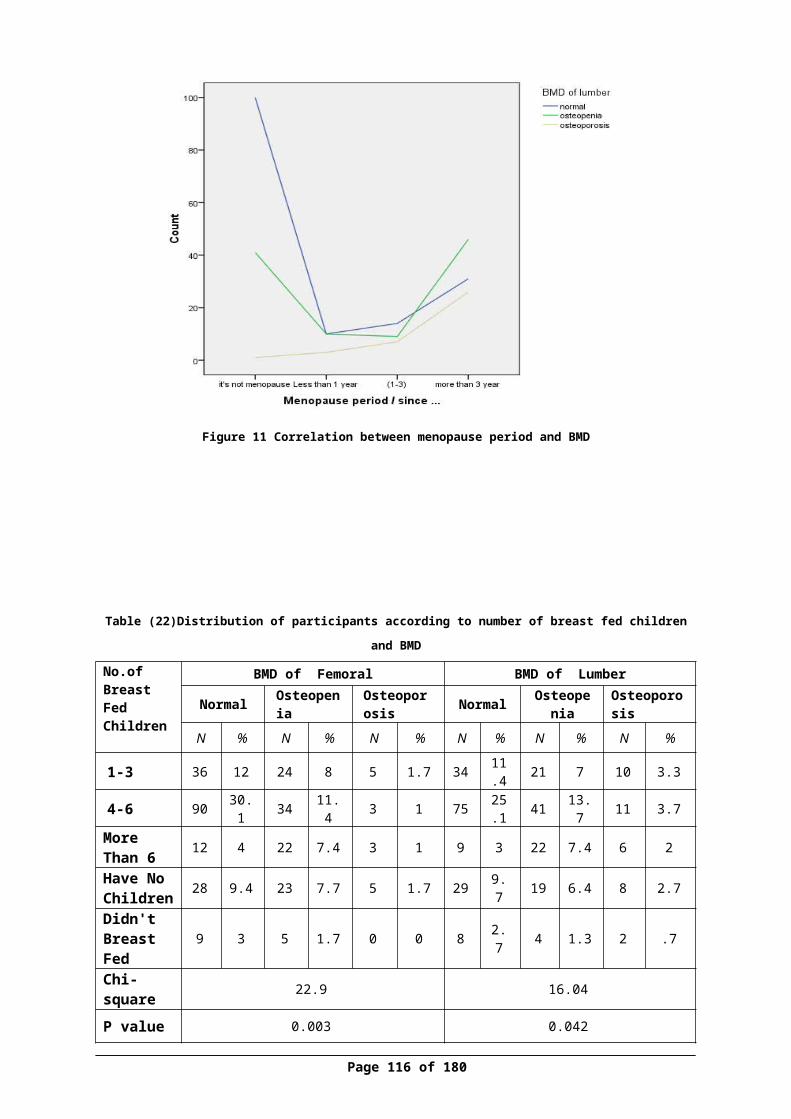
83. WHO. (2010).World Health Organization. Global recommendations on
physical activity for health.
Retrieve
dhttp://apps.who.int/iris/bitstream/10665/44399/1/9789241599979_eng.p
df
84.WHO. (2012). WHO Criteria for Diagnosis of Osteoporosis. World
Health Organization available
at:http://www.4bonehealth.org/education/world-health-organization-
criteria-diagnosis-osteoporosis/
85. Wilkins, C.H. (2007). Osteoporosis screening and risk management.
Clinical Intervention in Aging 2(3):389-39[PubMed]
86.Xu, J. , Sun, M. , Wang ,Z. , Fu, Q. , Cao ,M. , Zhu, Z. , Meng, C. , Yan,
Y. , Mao, J. , Tao ,H. , Huang, X. , Lin, Z. , Yang, T.& He, W.(2013).
Awareness of osteoporosis and its relationship with calcaneus
quantitative ultrasound in a large Chinese community population. Clinical
Intervention Aging. 8:789-96.[Pubmed]
87.Zack,M.k. (2002). Reliability and Validity of Body Composition and
Bone Mineral Density Measurements by Dxa .p 9-10. Available at
[Http://Scholar.Lib.Vt.Edu/Theses/Available/Etd-04172002-123509/Unre
stricted/Thesis.Pdf]
88. Zhen, D. , Liu ,L. , Guan ,C. , Zhao, N . Tang,X .(2015). High prevalence
of vitamin D deficiency among middle-aged and elderly individuals in
northwestern China. Europe.71:1-6.[Pubmed]
Page 116 of 129
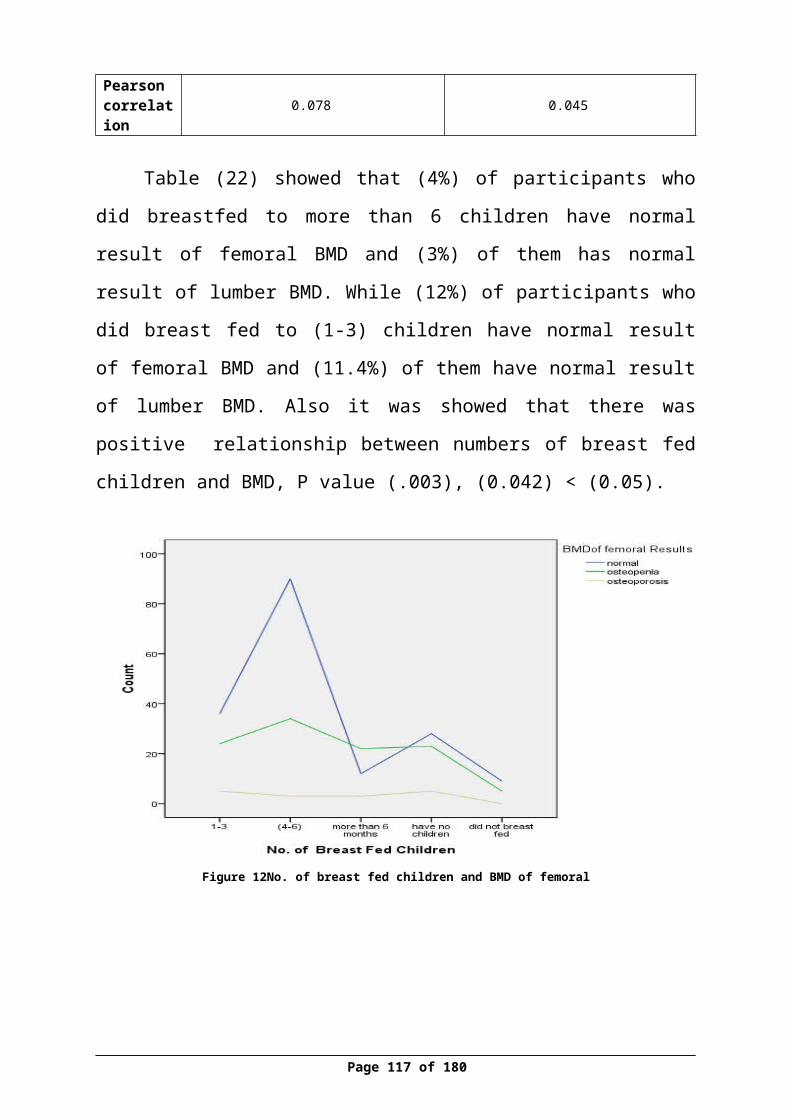
89.Zimmerman, M. &Snow, B. (2012) .An Introduction to Nutrition; Risk
Factors for Osteoporosis .Chapter 9: Nutrients Important for Bone Health.
Retrieved at http://2012books.lardbucket.org/books/an-introduction-to-
nutrition/index.html
Page 117 of 129
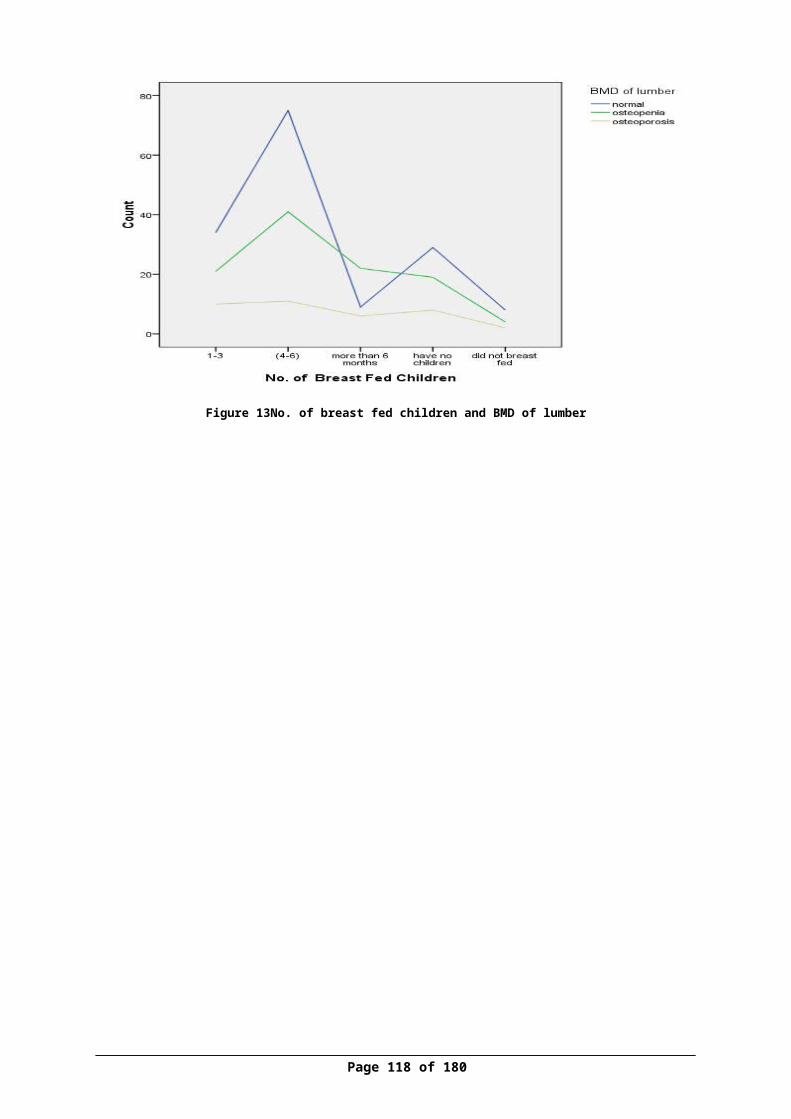
Annex I (questionnaire)
الوطنية النجاح جامعةالصحية والعلوم الطب كلية
والقبالة التمريض دائرة
المشاركة :عزيزتيالنجاح جامعة في والقبالة التمريض كلية في تجرى سوف بحثية دراسة في للمشاركة مدعوة أنت
بعنوان تخرج كمشروع لتقديمه : الوطنية
في " النساء بين دال وفيتامين العظام كثافة نسبة وقياس االستروجين فحص مستوى بين العالقة
نابلس مدينة في االعمار " مختلففقراتها عن اإلجابة منك يرجى الدراسة، موضوع حول المعلومات لجمع االستبانة هذه صممت وقد
فقط العلمي للبحث إال تستخدم ال لنا ستقدمينها التي المعلومات بأن لك ومؤكدين تعاونك، لك . شاكرين
ة/ :الباحث
.........................
وأهدافه البحث :وصففي تساعد سوف شأنها من التي األعمار، مختلف في النساء على استبيان توزيع إلى الدراسة تهدفوفقا العظام بهشاشة لإلصابة معرضة عمرية فئة أكثر النساء تجعل بدورها التي الخطر عوامل تحديد , لفحص دم عينة أخذ يتم سوف كما عمرية مرحلة كل في لها تتعرض التي وهرمونية جسدية لتغيرات
( الهرمونات ( نسبة لتحديد الظهر ألسفل أو الورك للحوض أشعة وصورة دال وفيتامين االستروجينهذه بين العالقة وتحديد العظام هشاشة مرض تشخيص في تساعد سوف التي العظام كثافة ونسبة
نابلس مدينة في النساء بين ومقارنتها االختباراتالدراسة هذه عن الناتجة :الفوائد
االعمار مختلف في النساء بين العظام وكثافة دال وفيتامين االستروجين هرمون نسبة قياس النساء بين العظام هشاشة حدوث في المساعدة الخطر عوامل وتحديد كشف
Page 118 of 129
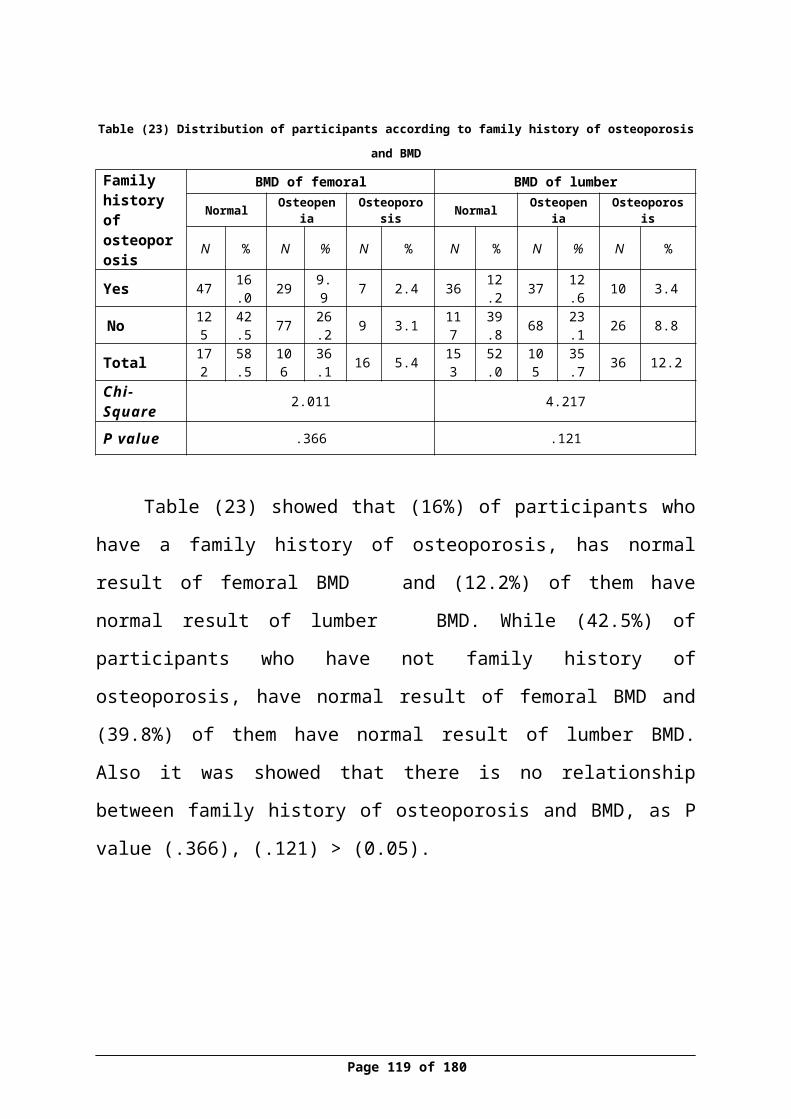
عظام دكتور الى أحالتها يتم سوف العظام بهشاشة المشاركات أحد اصابة الى تشير نتائج اي
والفيتامين , االستروجين لفحص بالنسبة وكذلك الصغيرة االيدي جمعية في العالج لتلقي مختص
الجمعية في نسائية دكتورة الى تحويلها يتم سوف دال الدراسة في المشاركة في يرغب من لكل مجانا مؤمنة االشعة وصورة الدم عينة فحص تكاليف
, النساء من عينةاخرى اخذ يتم فسوف االنسحاب قررت او البحث هذا اإلشراكفي رفضك حالة في
المشتركة : موافقة
اسئلتي على االجابة تمت البحث،ولقد هذا من والغرض المحتوى وفهمت هذااالستبيان قرأت . لقد , , الباحثين , ان اعلم وأني العلمي البحث هذا في المشاركة على اوافق مختارة حرة فأني لذلك وفقا
, شئت متى البحث هذا من االنسحاب في الحق ولي وقت اي في اسئلتي عن باإلجابة يقومون سوفالتاريخ المشتركة توقيع
________________ ________________
Page 119 of 129
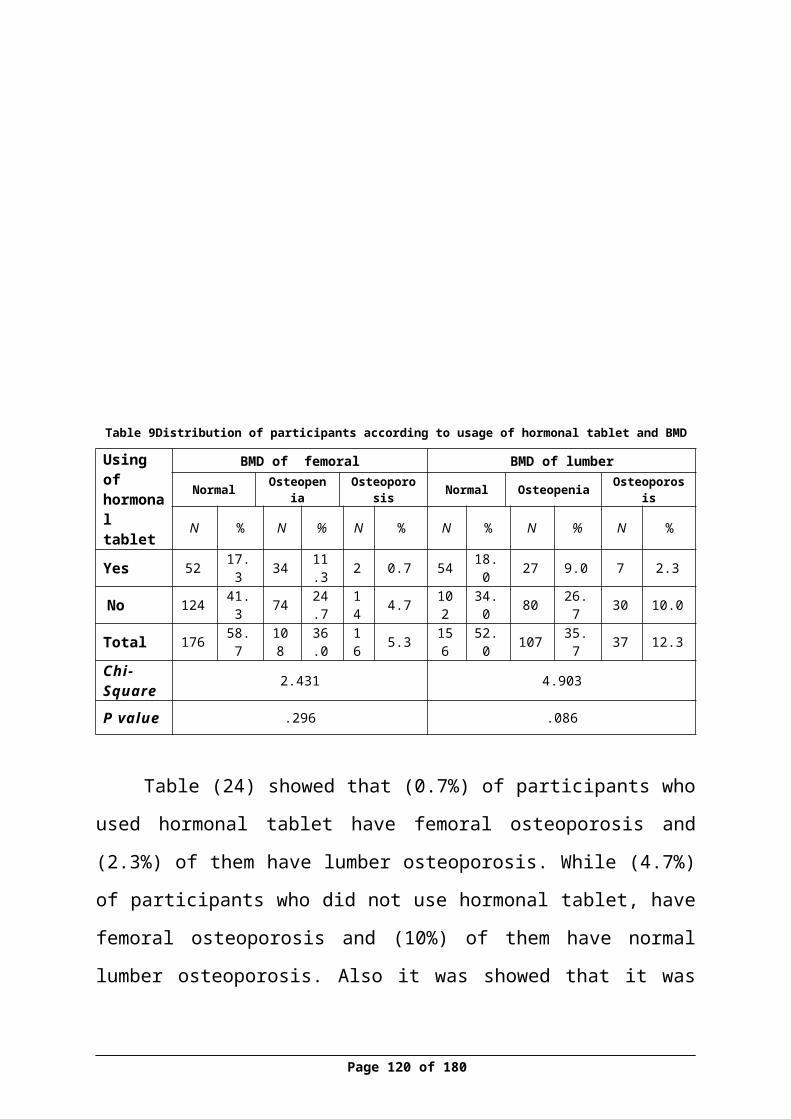
)1 ________ : االسم) كغم) : ____ 2 ( الوزنسم) : ___ 3( الطول
فوق )55. ( 3سنة ) 54-45 .( 2سنة ) 44-35.( 1العمر) : 4 ( فما سنة) 5 : السكن) قرية. 3مخيم. 2مدينة. 1مكانمنزل. 2موظفة. 1المهنة) : 6 ( ذلك. 3ربة غيروالمعيشي) :7 ( االقتصادي من. 1الوضع شهريا 1000أقل شيكل
شهريا 1000-1999. 2 شيكلشهري 2000-2999. 3 شيكل
شهريا 3000اكثرمن. 4 شيكلاالجتماعية) : 8 ( الحالة
ارملة. 4مطلقة. 3متزوجة. 2عزباء. 1
؟) 9( جراحية عملية باجراء قمت ال. 2نعم. 1هلالتالية) :10( االمراض من مرض اي من تعاني هلالدم. 1 ضغطالسكري. 2 الدرقية. 3 الغدد امراضالروماتويدي. 4 المفاصل التهاب
ذلك. 5 غيرامراض. 6 يوجد ال؟) 11( التاليه المواضع أحد في الظهر في بألم تشعرين هلمسطحة. 1 أرض على الدرج. 2المشي مرتفع. 3صعود مكان الركوع. 4صعود اثناء
ألم. 5بالصالة يوجد ال؟) 12( التالية االوضاع أحد في المفاصل في بألم تشعرين هلمسطحة. 1 أرض على الدرج. 2المشي مرتفع. 3صعود مكان الركوع. 4صعود اثناء
ألم. 5بالصالة يوجد ال؟) 13( العظام هشاشة مرض من يعاني العائلة افراد من أحد لديك ال. 2نعم. 1هل
Page 120 of 129
المعلومات : األول القسم الشخصية
الوضع : عن معلومات الثاني القسموالجراحي الصحي
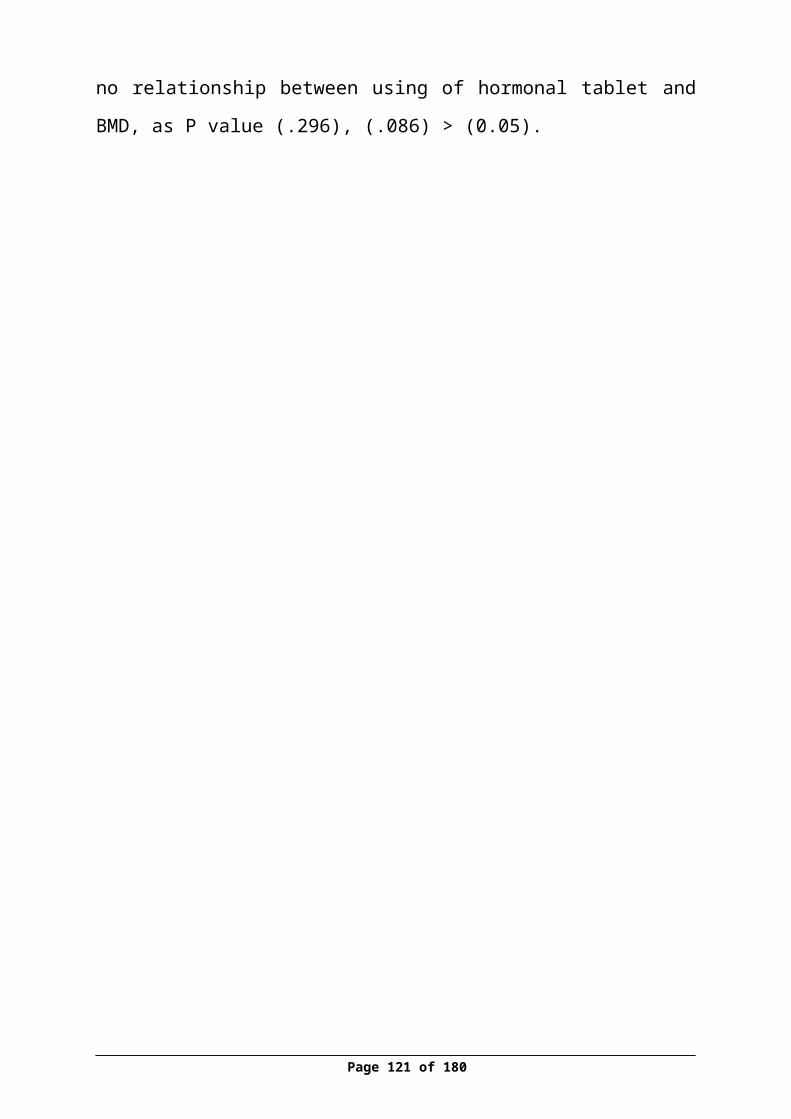
الحموالت) : 14( يوجد. 1عدد يساوي. 2ال أو من. 4 5-3. 3 2اقل 5اكثر
)15 : الوالدات) يوجد. 1عدد يساوي. 2ال أو من. 4 5-3. 3 2اقل 5اكثر
)16 : االجهاضات) يوجد. 1عدد يساوي. 2ال أو من. 4 5-3. 3 2اقل 5اكثر
سنة) :_____________ 17( الحيض بدء عند العمرعام) : 18( بشكل الشهرية الدورة من. 1طول .4يوم 28-24. 3يوم 24 -18. 2يوم 18اقل
من يوم 28اكثرالحالي) :19( الوقت في الشهرية الدورة تصفي كيف
منتظمة. 2منتظمة منقطعة. 3غير
)20: , منذ) كانت الشهرية الدورة انقطاع فترة منقطعة كانت اذاسنة. 1 من من. 3سنوات 3-1. 2اقل سنوات 3اكثرسنة) :______ 21 ( الدورة انقطاع عن عمرك كان كم
؟) 22( طبيعية رضاعة أطفالك بأرضاع قمت أطفال. 3ال. 2نعم. 1هل يوجد ال
)23 : أرضاعهم) تم الذي االطفال من. 3 ) 6-4. (2 ) 3-1. ( 1عدد أطفال. 4 6اكثر يوجد أرضع. 5ال لم
بها) : 24( باالرضاع قمت التي الفترة هي مامن. 1 سن - 6من. 2اشهر 6أقل سنة. 3اشهر من أطفال. 4اكثر يوجد الارضع. 5 لمالهرمونات) : 25( اقراص استخدمتي ال. 2نعم. 1هل
استخدامها) : 26( من الحمل. 1الغاية هرمونات. 2منع قط. 3استبدال استخدمها لم
الهرمونات) 27 ( استبدال الستخدام الزمنية المدة هي ما هرمونات استبدال باستخدام قمت اذاسنة. 1 من من. 3 3_1من. 2اقل قط. 4 3اكثر استخدمها لم
Page 121 of 129
واالمور : واالمراض االنجاب الثالث القسمبالنساء المتعلقة
الغذائي : النمط الرابع القسم
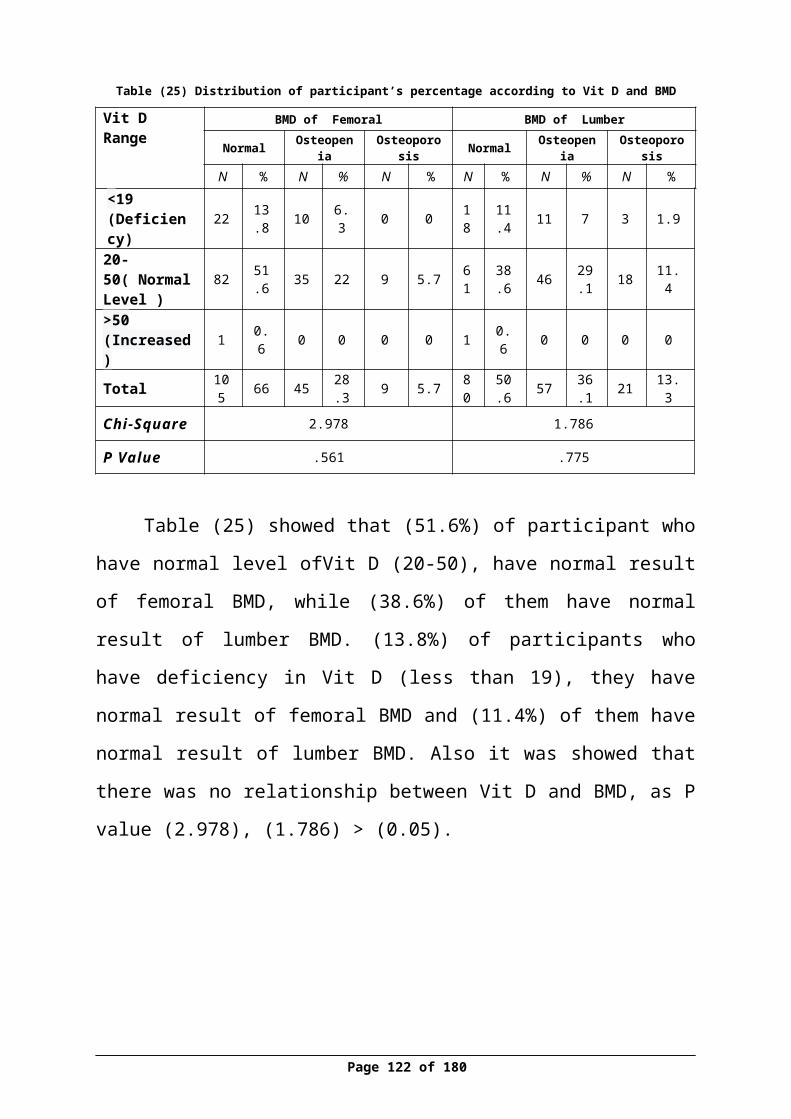
باالسبوع) : 28( للحليب تناولي ابدا. 1معدل الحليب أتناول باالسبوع) 3-1. ( 2ال . (3كأس
باألسبوع ) 6 - 4 يوم. 4كأس كل واحد كأس
الجبن) : 29( أبدا. 1أتناول الجبن أتناول باالسبوع) 3-1. (2ال باالسبوع ) 6-4. ( 3قطع قطع
يوم. 4 كل واحده قطعة
اللبن) : 30( ابدا. 1أتناول الحليب أتناول باالسبوع) 3-1. ( 2ال -4. ( 3كأس
باألسبوع ) 6 يوم. 4كأس كل واحد كأس
الغازية) : 31( المشروبات ابدا. 1أتناول الحليب أتناول باالسبوع) 3-1. ( 2ال كأس
باألسبوع ) 6 - 4. ( 3 يوم. 4كأس كل واحد كأس
غذائيا) : 32( مكمال الكالسيوم حبوب أبدا. 3أحيانا. 2دائما. 1أتناول
)33) د) فيتامين أبدا. 3أحيانا. 2دائما. Vitamin D :( 1أتناول
تدخنين) : 34( ال. 2نعم. 1هل
)35 : , التدخنين) نوع هو ما نعم االجابة كانت عادي. 1ان أدخن. 4كالهما. 3أرجيلة. 2دخان ال
باليوم) : 36( السجائر من. 3) 20- 10. ( 2) 10- 1. (1عدد أدخن. 4 20اكثر ال
Page 122 of 129
الرياضة : الخامسالقسم والحركة
)37 : يوميا) الرياضة بممارسة ال. 2نعم . 1اقوم
تمارسينها) : 38( التي الرياضة اخرى. 3ركض. 2مشي. 1نوع الرياضة. 4رياضة امارس ال
اليوم) : 39( خالل الرياضة من. 1مدة من. 3دقيقة 30. 2دقيقة 30اقل ال. 4دقيقة 30اكثرالرياضة امارس
باالسبوع) : 40( الرياضه بها أمارس التي االيام باالسبوع ) 3-1. (1عدد أيامباالسبوع) 6- 4. (2 يوم. 3ايام أبدا . 4كل الرياضة أمارس ال؟) 41( للشمس تتعرضين ال. 2نعم . 1هل
نعم , االجابة كانت اذالمدة) : 42 ( يوميا للشمس من. 1أتعرض من. 3دقيقة) 30. (2دقيقة 30أقل دقيقة 30اكثر
الشمس. 4 الشعة أتعرض ال؟) _______43 ( للشمس تتعرض التي الجسم مناطق هي وما
الطبية الفحوصات النتيجةاسماءاالستروجين( 44( فحص
العظام) ((45( كثافة DXAفحصدال) 46( فيتامين فحص
Page 123 of 129
: السادسالقسم
المخبرية الفحوصات
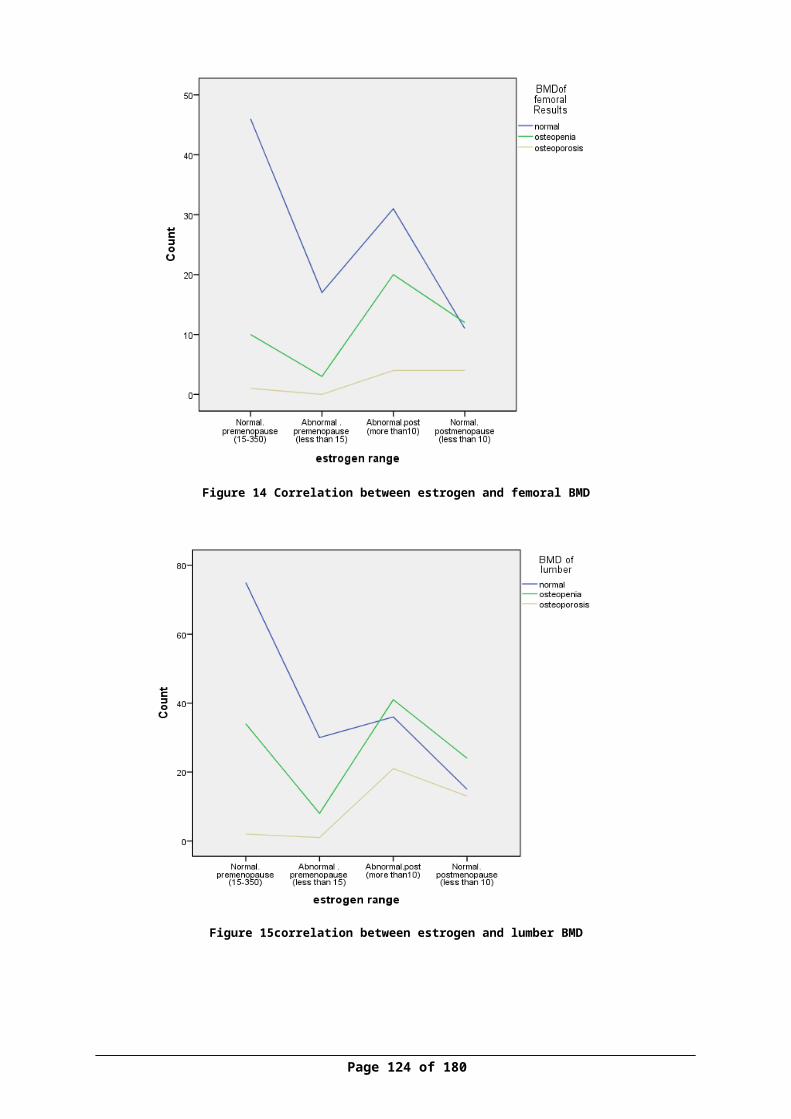
Page 124 of 129
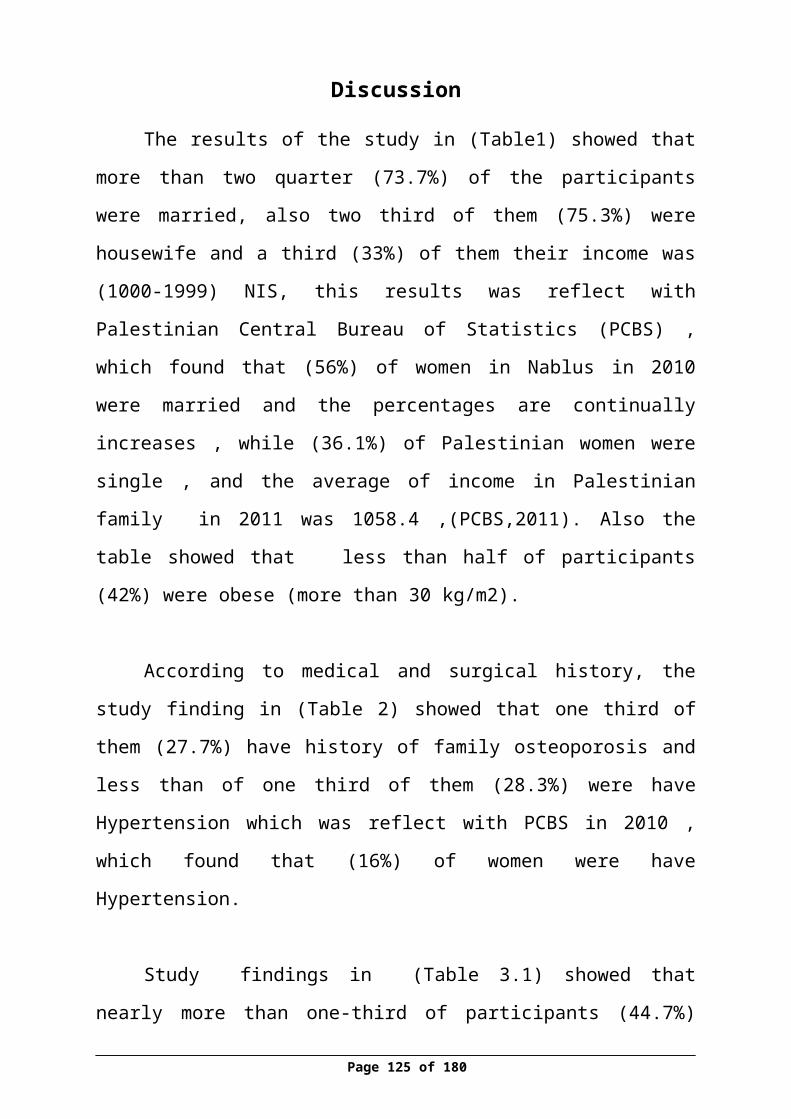
Annex II Facebook event
Page 125 of 129
Annex III IRB approval latter
Page 126 of 129
Annex IV (consent form)
الوطنية النجاح جامعةالصحية والعلوم الطب كلية
والقبالة التمريض دائرةالمشاركة :عزيزتي
النجاح جامعة في والقبالة التمريض كلية في تجرى سوف بحثية دراسة في للمشاركة مدعوة أنت
بعنوان تخرج كمشروع لتقديمه : الوطنية
في " النساء بين دال وفيتامين العظام كثافة نسبة وقياس االستروجين فحص مستوى بين العالقة
نابلس مدينة في االعمار " مختلففقراتها عن اإلجابة منك يرجى الدراسة، موضوع حول المعلومات لجمع االستبانة هذه صممت وقد
فقط العلمي للبحث إال تستخدم ال لنا ستقدمينها التي المعلومات بأن لك ومؤكدين تعاونك، لك . شاكرين
ة/ :الباحث
.........................
وأهدافه البحث :وصففي تساعد سوف شأنها من التي األعمار، مختلف في النساء على استبيان توزيع إلى الدراسة تهدفوفقا العظام بهشاشة لإلصابة معرضة عمرية فئة أكثر النساء تجعل بدورها التي الخطر عوامل تحديد , لفحص دم عينة أخذ يتم سوف كما عمرية مرحلة كل في لها تتعرض التي وهرمونية جسدية لتغيرات
( الهرمونات ( نسبة لتحديد الظهر ألسفل أو الورك للحوض أشعة وصورة دال وفيتامين االستروجينهذه بين العالقة وتحديد العظام هشاشة مرض تشخيص في تساعد سوف التي العظام كثافة ونسبة
نابلس مدينة في النساء بين ومقارنتها االختباراتالدراسة هذه عن الناتجة :الفوائد
االعمار مختلف في النساء بين العظام وكثافة دال وفيتامين االستروجين هرمون نسبة قياس النساء بين العظام هشاشة حدوث في المساعدة الخطر عوامل وتحديد كشف عظام دكتور الى أحالتها يتم سوف العظام بهشاشة المشاركات أحد اصابة الى تشير نتائج اي
والفيتامين , االستروجين لفحص بالنسبة وكذلك الصغيرة االيدي جمعية في العالج لتلقي مختص
الجمعية في نسائية دكتورة الى تحويلها يتم سوف دال الدراسة في المشاركة في يرغب من لكل مجانا مؤمنة االشعة وصورة الدم عينة فحص تكاليف
, النساء من عينةاخرى اخذ يتم فسوف االنسحاب قررت او البحث هذا اإلشراكفي رفضك حالة فيالمشتركة : موافقة
اسئلتي على االجابة تمت البحث،ولقد هذا من والغرض المحتوى وفهمت هذااالستبيان قرأت . لقدPage 127 of 129

, , الباحثين , ان اعلم وأني العلمي البحث هذا في المشاركة على اوافق مختارة حرة فأني لذلك وفقا
, شئت متى البحث هذا من االنسحاب في الحق ولي وقت اي في اسئلتي عن باإلجابة يقومون سوفالتاريخ المشتركة توقيع
Page 128 of 129
Annex V (Approval of funding)
Page 129 of 129