Embed Size (px)
Citation preview
The organizers of this symposium express our deepest thanks toProf. Alec Marantz and MIT Department of Linguistics andPhilosophy for offering to use this lecture room for this symposium and for helping us to make various arrangements for this symposium.
We also thank VMS medtech for their courtesy in providing lunch and refreshments.
Acknowledgements
Comparison between adaptive and non-adaptive spatial filter performances
Kensuke Sekihara1, Maneesh Sahani2, Srikantan S. Nagarajan3
1Department of Engineering, Tokyo Metropolitan Institute of Technology2Keck Center for Integrative Neuroscience, University of California, San Francisco
3Department of Radiology, University of California, San Francisco
Spatial filtering in BiomagnetismSatellite Symposium of Biomag 2004Boston, August, 2004
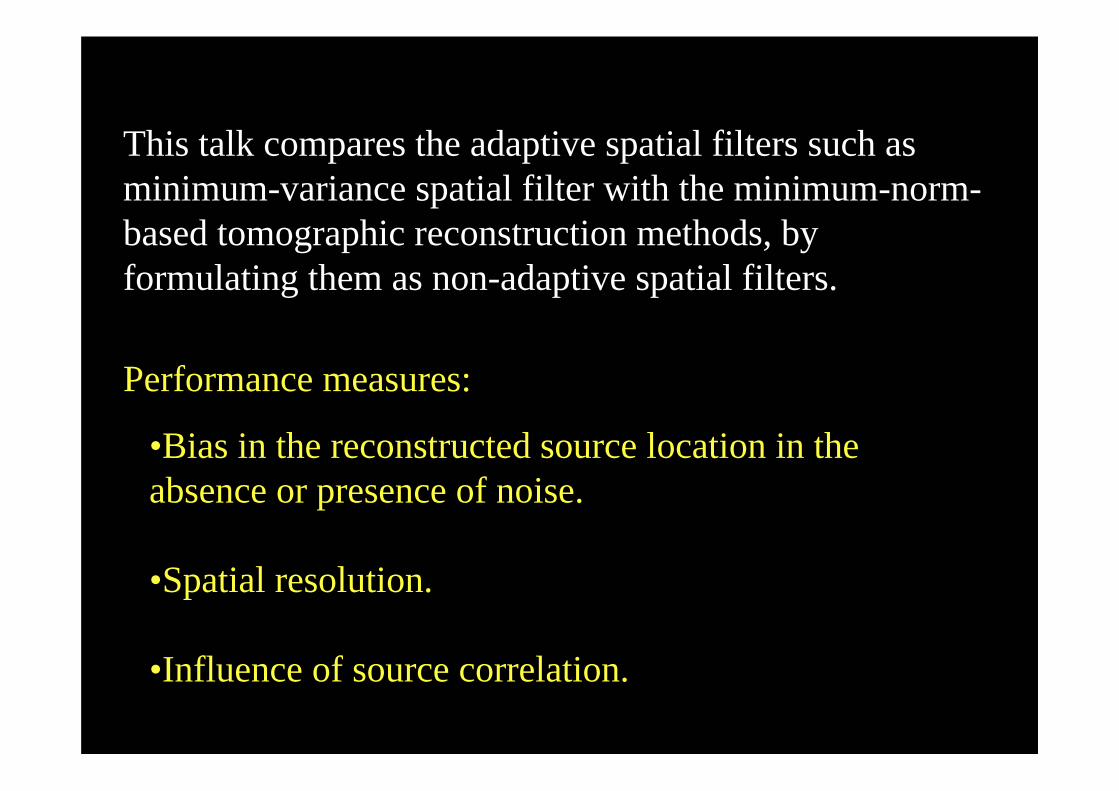
This talk compares the adaptive spatial filters such as minimum-variance spatial filter with the minimum-norm-based tomographic reconstruction methods, by formulating them as non-adaptive spatial filters.
•Bias in the reconstructed source location in the absence or presence of noise.
•Spatial resolution.
•Influence of source correlation.
Performance measures:
( )
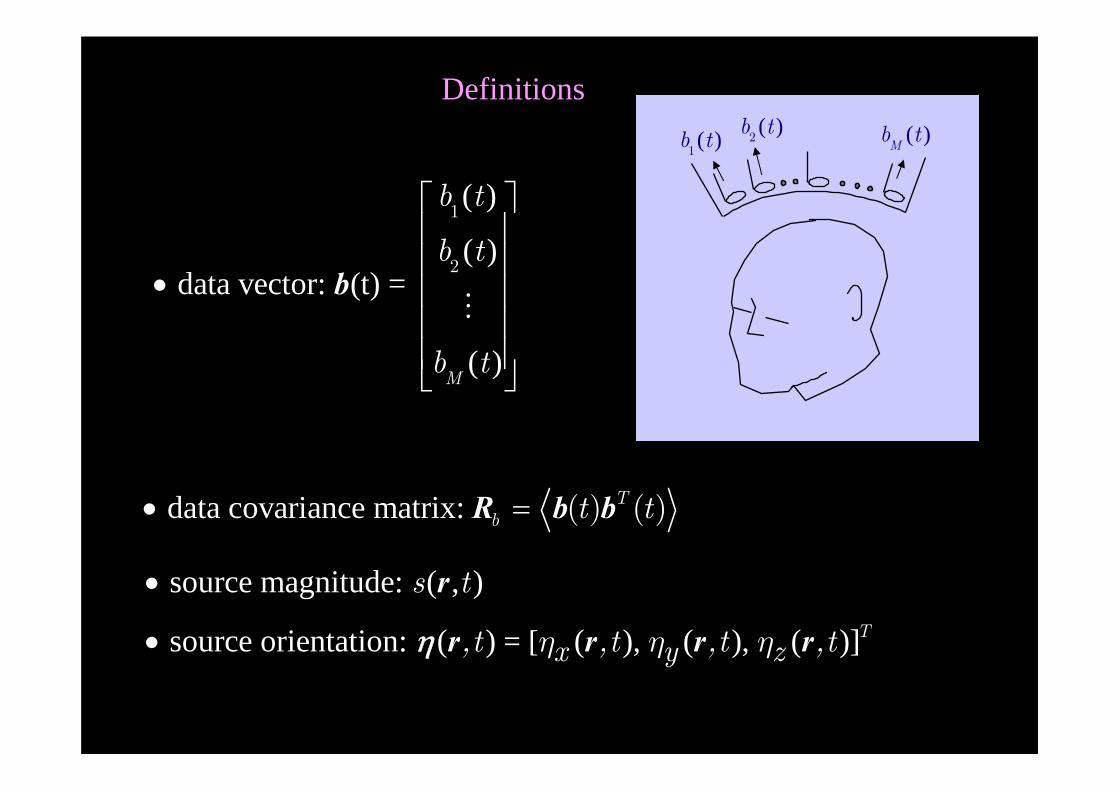
( ) data vector: (t) =
( )
1
2
M
b t
b t
b t
⎡ ⎤⎢ ⎥⎢ ⎥
• ⎢ ⎥⎢ ⎥⎢ ⎥⎣ ⎦
b
Definitions
data covariance matrix: ( ) ( )Tb t t• =R b b
= [ , ,
source magnitude: ( , )
source orientation: ( ) ( ) ( ) ( )]
•
• Tx y z
s t
,t ,t ,t ,t
r
r r r rη η ηη
( ) 1b t( ) 2b t ( ) Mb t
y
x
sx
l1x l2
x l3x
lMx
z
y
x
l1z l2
z l3z lM
z
z sz
y
x
l1y l2
y l3y lM
y
z sy
|sx|=|sy|=|sz|=1
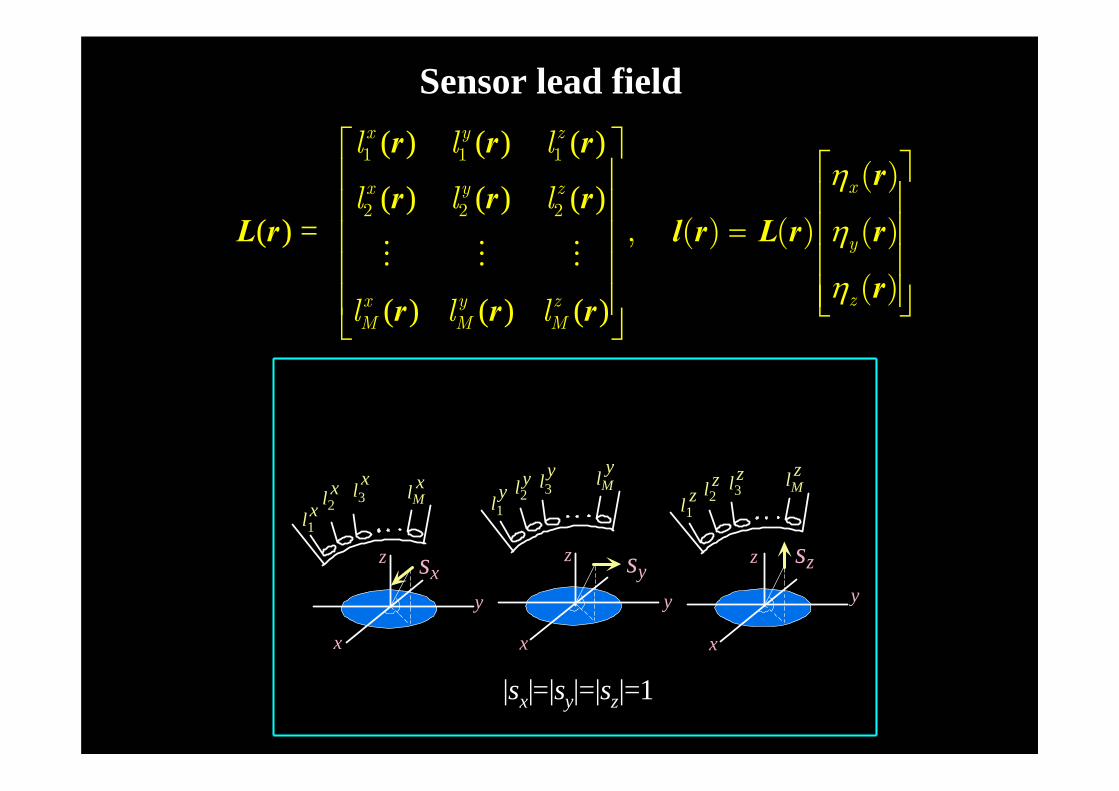
( ) ( ) ( )
( ) ( ) ( )( ) =
( ) ( ) ( )
1 1 1
2 2 2
( )
, ( ) ( ) ( )
( )
x y z
xx y z
y
zx y zM M M
l l l
l l l
l l l
η
η
η
⎡ ⎤⎡ ⎤⎢ ⎥⎢ ⎥⎢ ⎥
= ⎢ ⎥⎢ ⎥⎢ ⎥⎢ ⎥⎢ ⎥⎢ ⎥ ⎣ ⎦
⎣ ⎦
r r rr
r r rL r l r L r r
rr r r
Sensor lead field
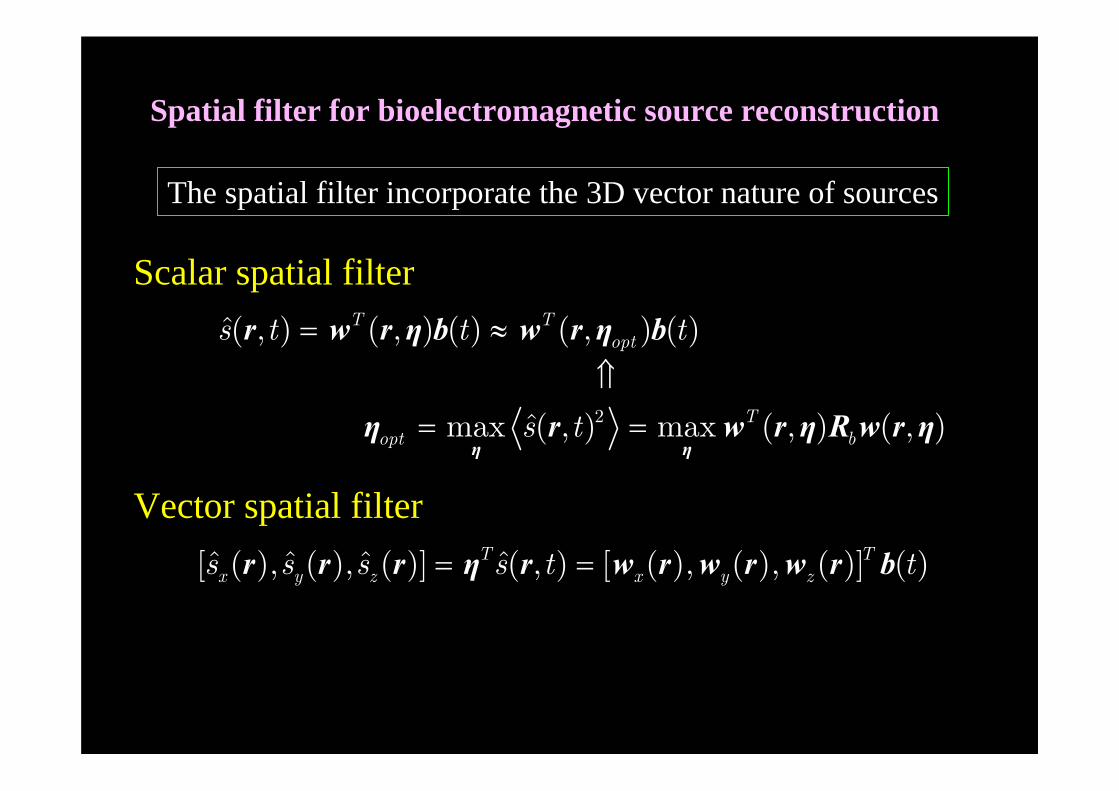
Spatial filter for bioelectromagnetic source reconstruction
2
( , ) ( , ) ( ) ( , ) ( )
ˆmax ( , ) max ( , ) ( , )
= ≈⇑
= =η η
r w r η b w r η b
η r w r η R w r η
T Topt
Topt b
s t t t
s t
Scalar spatial filter
ˆ ˆ ˆ ˆ[ ( ), ( ), ( )] ( , ) [ ( ), ( ), ( )] ( )T Tx y z x y zs s s s t t= =r r r η r w r w r w r b
Vector spatial filter
The spatial filter incorporate the 3D vector nature of sources
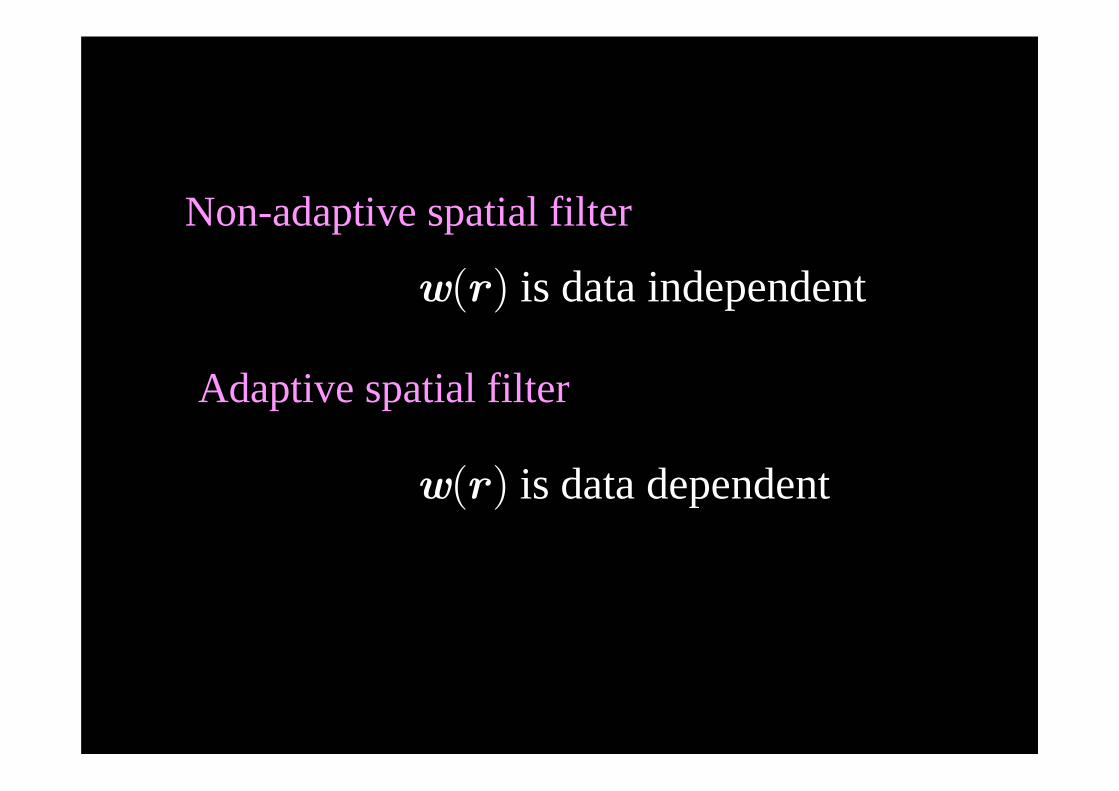
Adaptive spatial filter
Non-adaptive spatial filter
is data independent( )w r
is data dependent( )w r
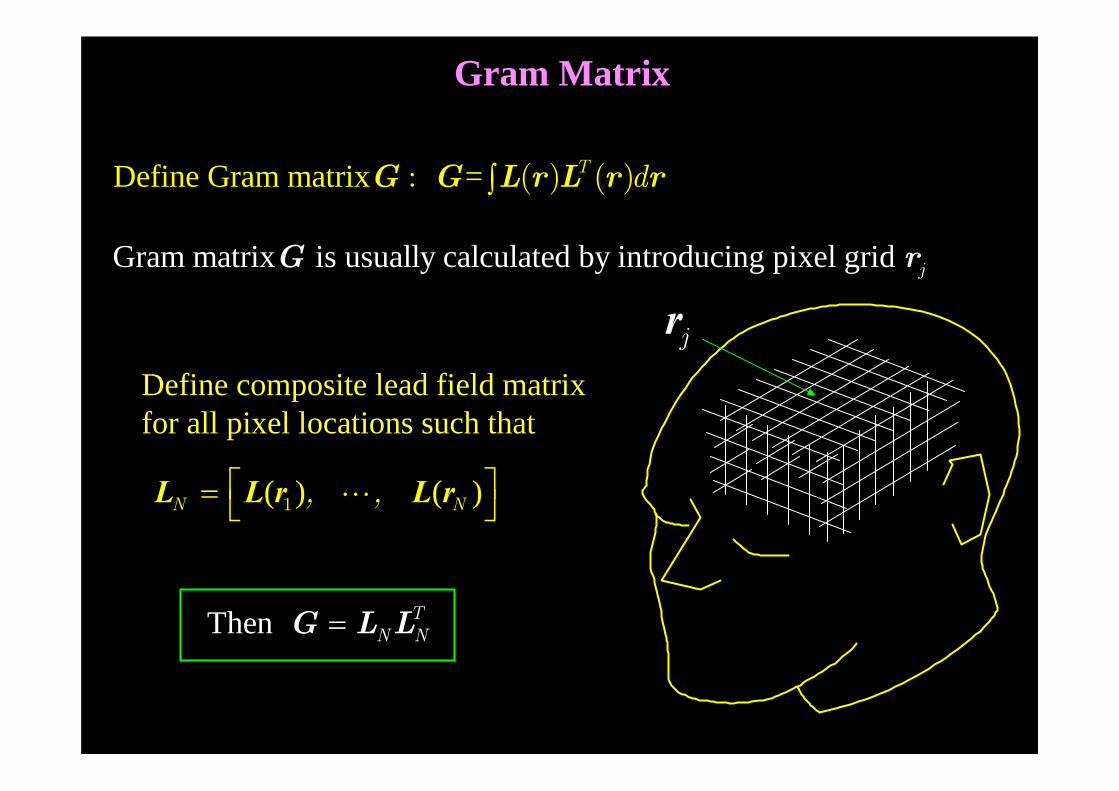
( ) ( )1N N, ,⎡ ⎤= ⎣ ⎦L L r L r
Then TN N=G L L
Gram matrix is usually calculated by introducing pixel grid jG r
jr
Define Gram matrix =: ( ) ( )T d∫G G L r L r r
Define composite lead field matrixfor all pixel locations such that
Gram Matrix
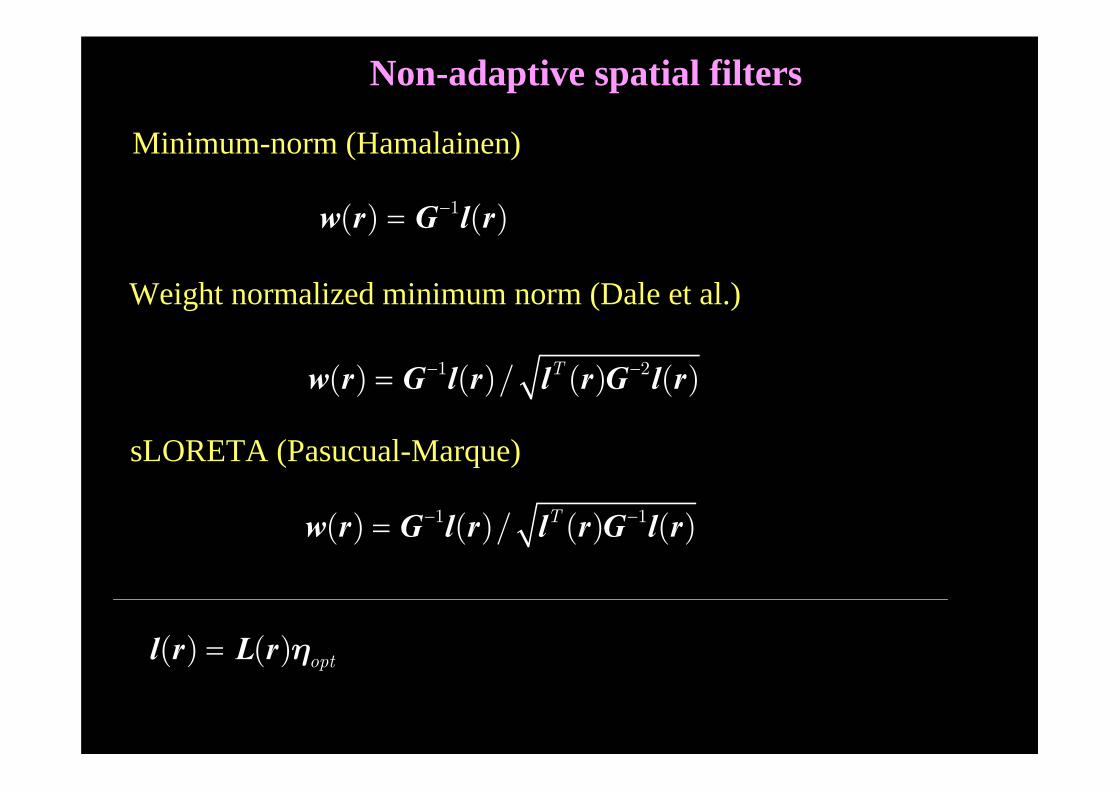
Non-adaptive spatial filters
1( ) ( )−=w r G l r
Minimum-norm (Hamalainen)
Weight normalized minimum norm (Dale et al.)
1 2( ) ( )/ ( ) ( )T− −=w r G l r l r G l r
sLORETA (Pasucual-Marque)
1 1( ) ( )/ ( ) ( )T− −=w r G l r l r G l r
( ) ( ) opt=l r L r η
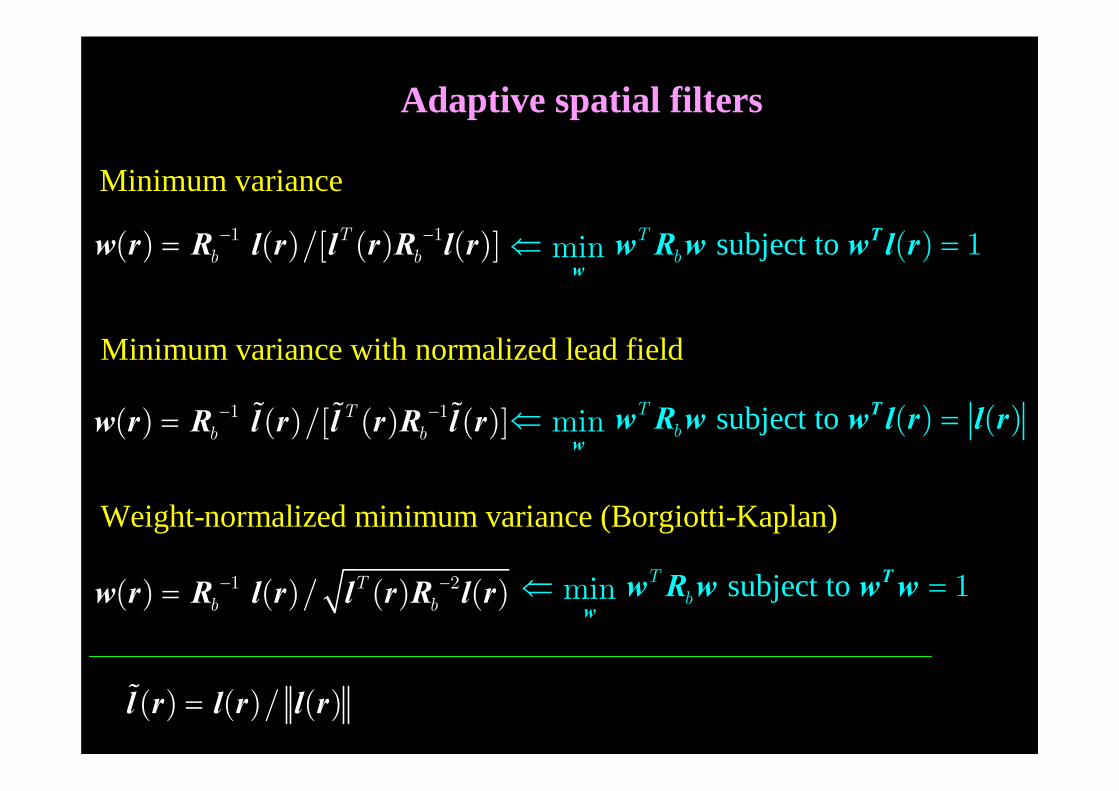
1 1( ) ( )/[ ( ) ( )]Tb b− −=w r R l r l r R l r subject to ( ) 1min T
b =⇐ T
ww R w w l r
Adaptive spatial filters
Minimum variance
Minimum variance with normalized lead field
1 1( ) ( )/[ ( ) ( )]Tb b− −=w r R l r l r R l r subject to ( ) ( )min T
b⇐ =T
ww R w w l r l r
Weight-normalized minimum variance (Borgiotti-Kaplan)
1 2( ) ( )/ ( ) ( )Tb b− −=w r R l r l r R l r subject to 1min T
b =⇐ T
ww R w w w
( ) ( )/ ( )=l r l r l r
Bias of estimated source locations
We first take a look at the bias of reconstructed source locations for these adaptive and non-adaptive spatial filters.
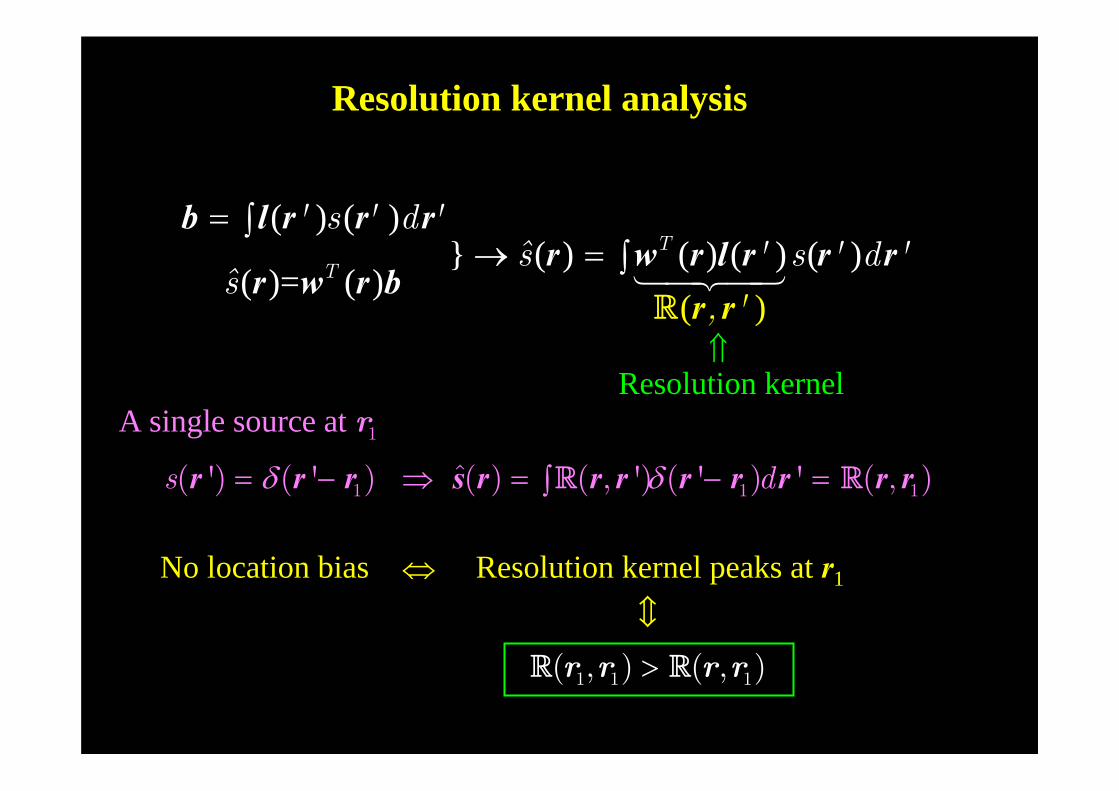
Resolution kernel
( ) ( ) ( ) ( ) ( ) ( )
( )= (( )
)T
T
' s ' d 's ' s ' d '
ˆ'
s,
= ∫→ = ∫
b l r r rr w r l r r r
r w br
rrR⇑
Resolution kernel analysis
1 1 1ˆ( ') ( ' ) ( ) ( , ') ( ' ) ' ( , )δ δ= − ⇒ = − =∫r r r s r r r r r r r rs dR R
No location bias Resolution kernel peaks at r1
1 1 1( , ) ( , )>R Rr r r r
⇔
A single source at 1r
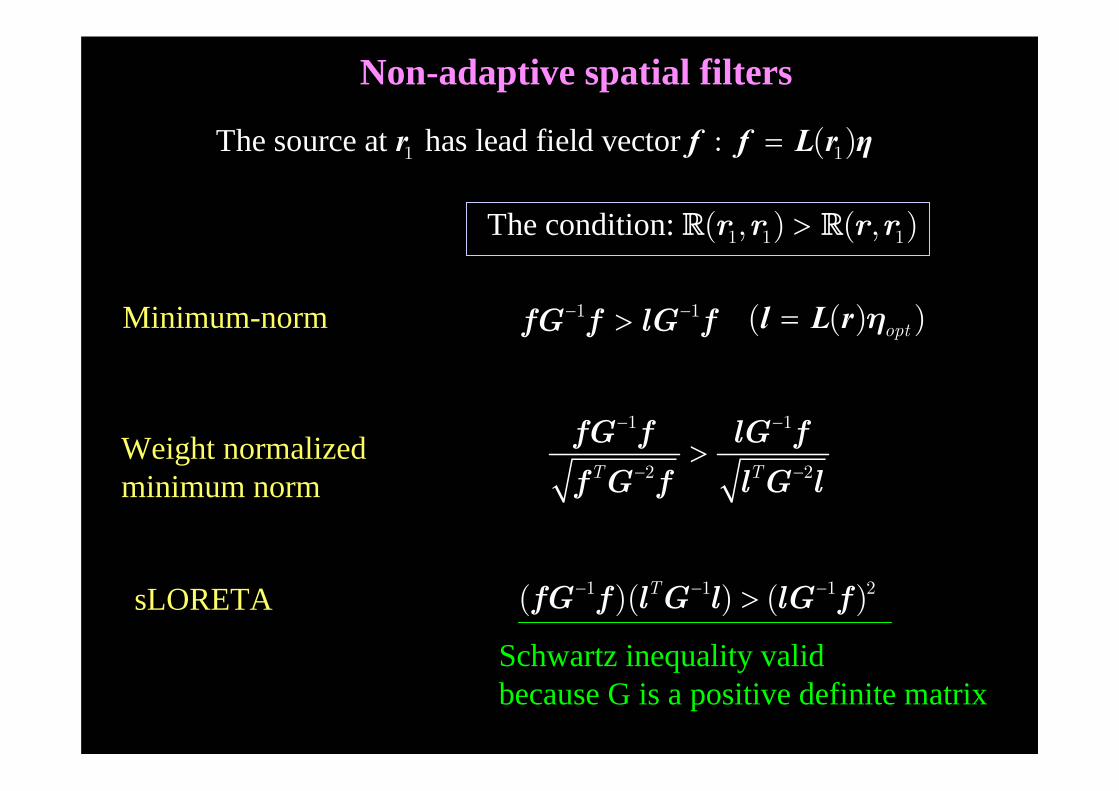
The condition: 1 1 1( , ) ( , )>R Rr r r r
The source at has lead field vector 1 1: ( )=r f f L r η
Minimum-norm
Weight normalized minimum norm
sLORETA
1 1− −>fG f lG f ( ( ) )=l L r ηopt
1 1
2 2T T
− −
− −>
fG f lG ff G f l G l
1 1 1 2( )( ) ( )T− − −>fG f l G l lG f
Schwartz inequality valid because G is a positive definite matrix
Non-adaptive spatial filters
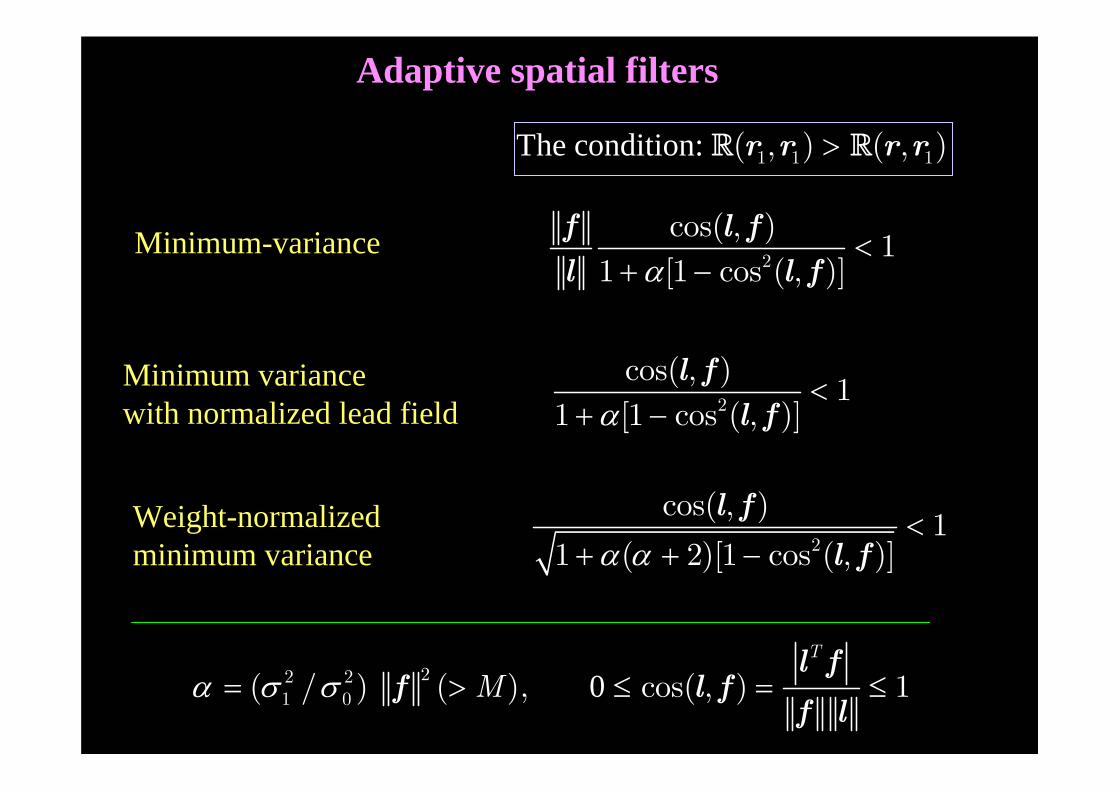
The condition: 1 1 1( , ) ( , )>R Rr r r r
Minimum-variance
Minimum variancewith normalized lead field
Weight-normalizedminimum variance
2
cos( , ) 11 [1 cos ( , )]α
<+ −
f l fl l f
Adaptive spatial filters
2
cos( , ) 11 [1 cos ( , )]α
<+ −
l fl f
2
cos( , ) 11 ( 2)[1 cos ( , )]α α
<+ + −
l fl f
022 21 0( / ) ( ), cos( , ) 1
T
Mα σ σ= > ≤ = ≤l f
f l ff l
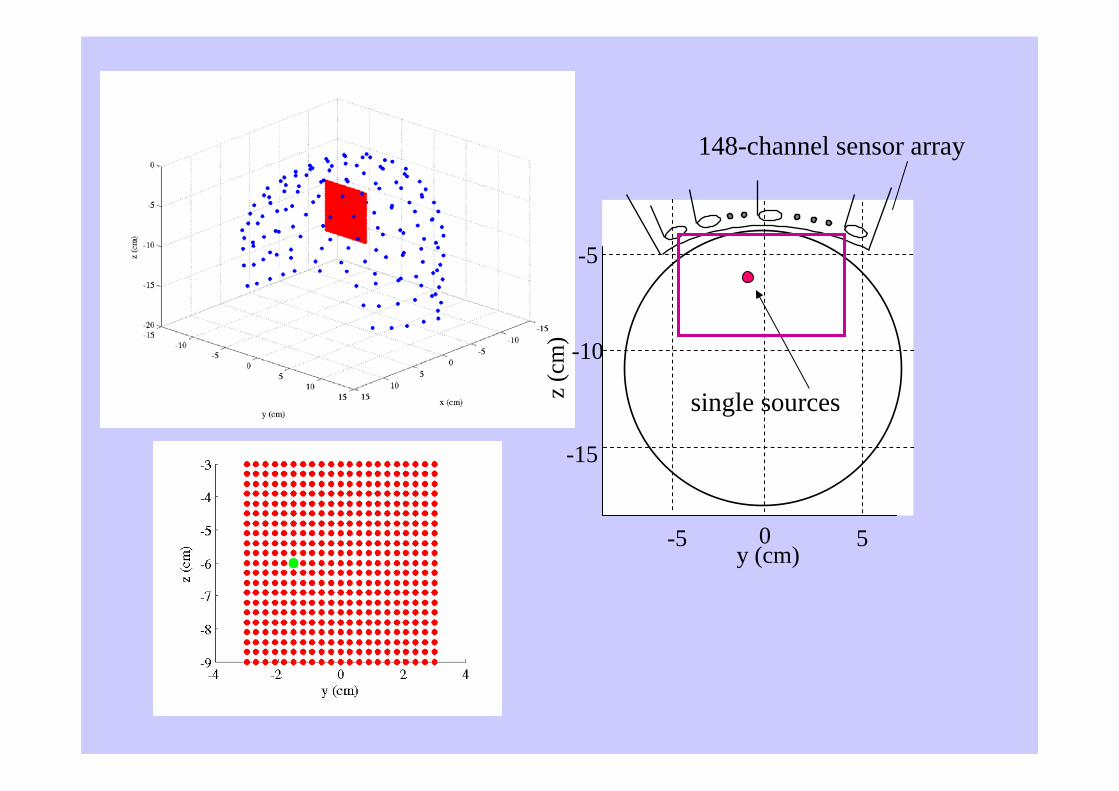
148-channel sensor array
single sources
y (cm)z
(cm
)0-5 5
-5
-10
-15
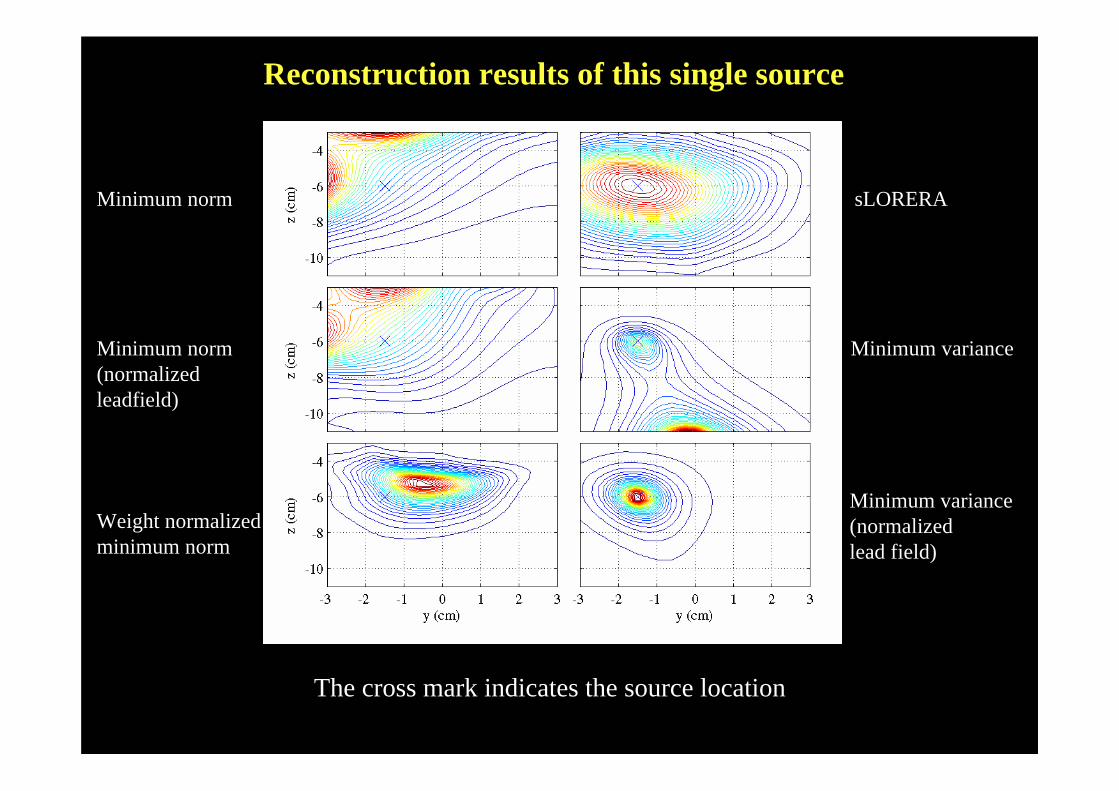
Minimum norm(normalized leadfield)
Minimum norm
Weight normalized minimum norm
sLORERA
Minimum variance
Minimum variance(normalized lead field)
Reconstruction results of this single source
The cross mark indicates the source location
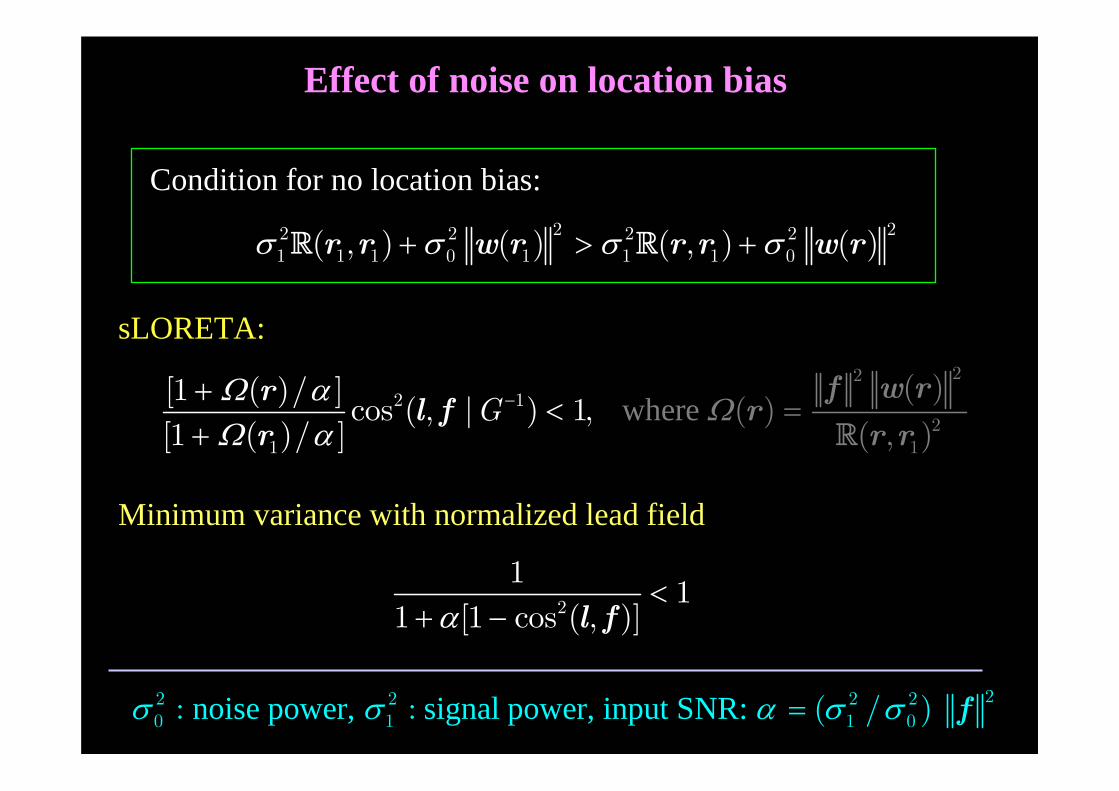
Effect of noise on location bias
Condition for no location bias:
2 22 2 2 21 1 1 0 1 1 1 0( , ) ( ) ( , ) ( )σ σ σ σ+ > +R Rr r w r r r w r
noise power, signal power, input SNR: 22 2 2 20 1 1 0: : ( / )σ σ α σ σ= f
sLORETA:
wh ere 2
1
2 1
1
2
2
[1 ( )/ ] cos ( , | )( )
( )1,[1 ( )/ ( , )]
r lf w r
rr
r rf ΩΩ α
Ω α−+
< =+
GR
Minimum variance with normalized lead field
2
1 11 [1 cos ( , )]α
<+ − l f
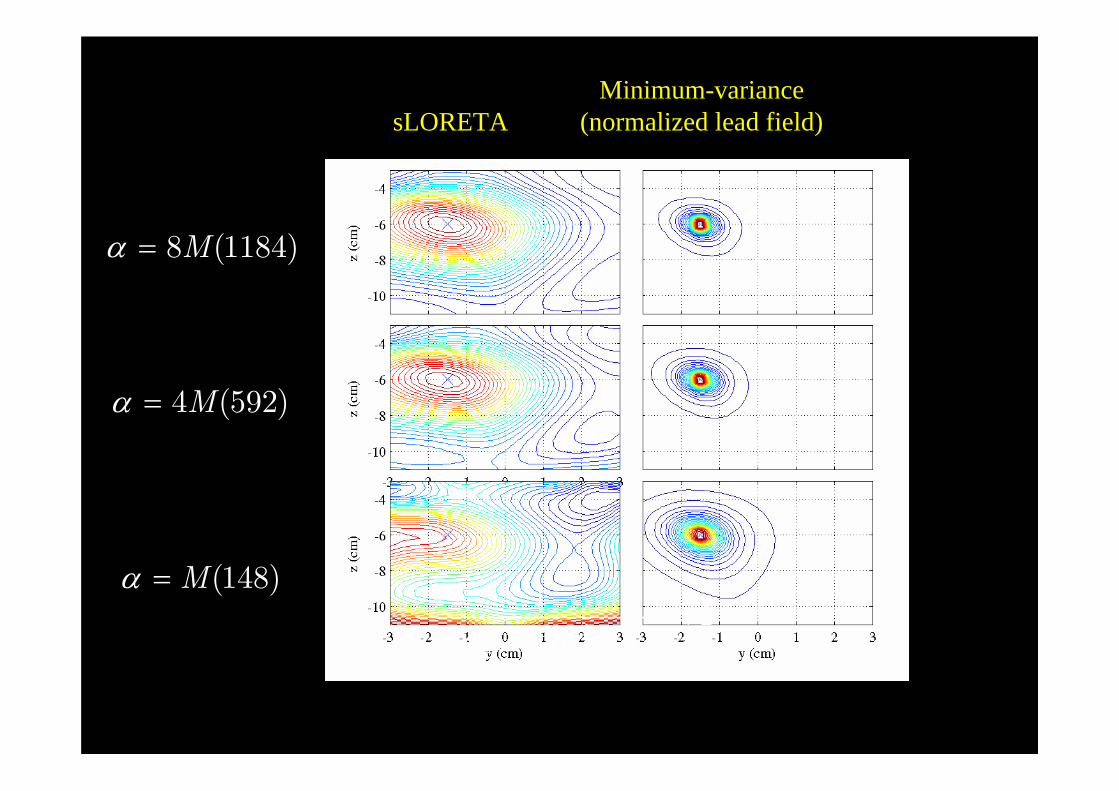
sLORETAMinimum-variance
(normalized lead field)
2
1 11 [1 cos ( , )]α
<+ − l f
(148)Mα =
4 (592)Mα =
8 (1184)Mα =
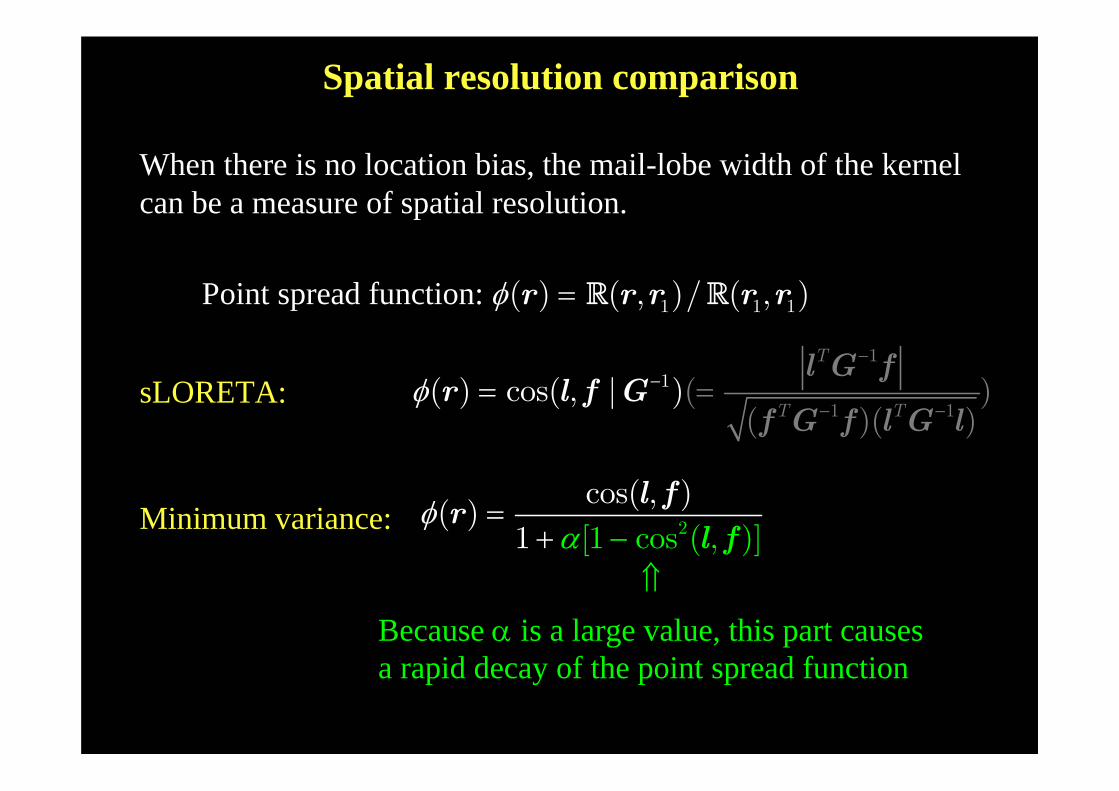
Spatial resolution comparison
When there is no location bias, the mail-lobe width of the kernelcan be a measure of spatial resolution.
Point spread function: 1 1 1( ) ( , )/ ( , )φ = R Rr r r r r
sLORETA: 11
1 1( ) cos( , | )( )
( )( )
T
T Tφ
−
− −
− ==l G f
f G f l Gf G
lr l
Minimum variance: 2[1 cos ( ,cos( , )( )
1 )]αφ =
+ − lff
lr
Because α is a large value, this part causes a rapid decay of the point spread function
⇑
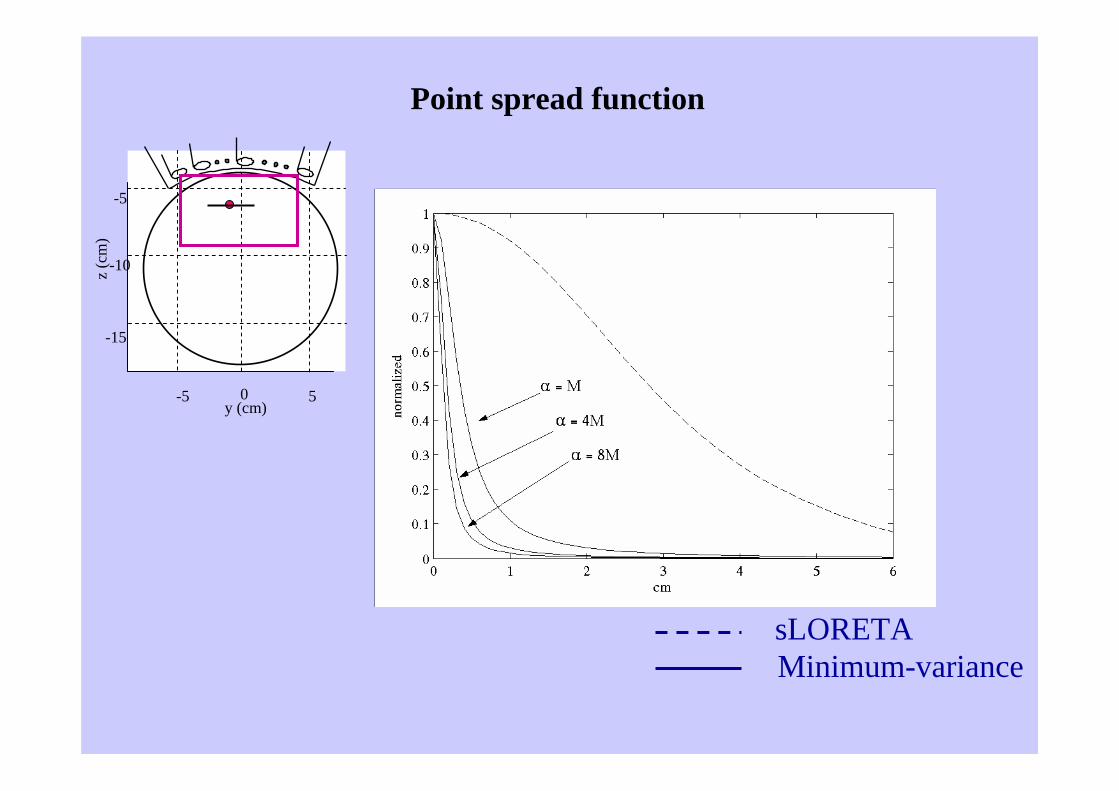
sLORETAMinimum-variance
Point spread functionz
(cm
)
y (cm)0-5 5
-5
-10
-15
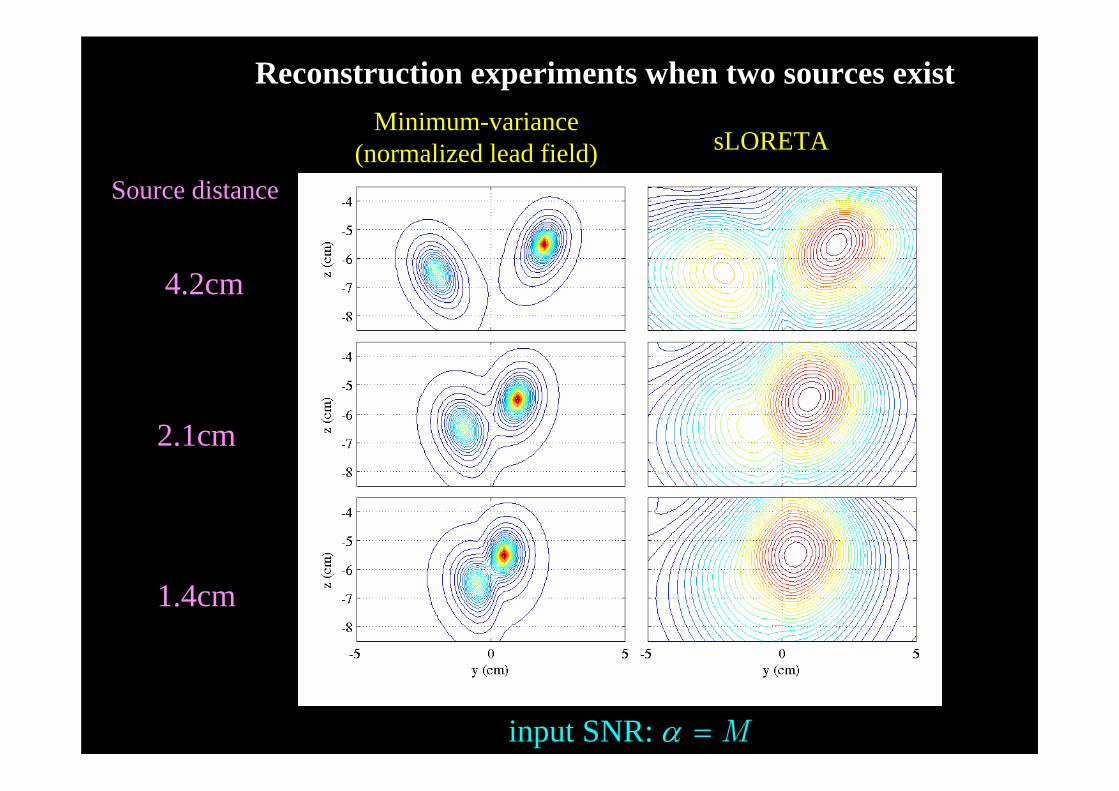
Reconstruction experiments when two sources exist
sLORETAMinimum-variance
(normalized lead field)Source distance
4.2cm
2.1cm
1.4cm
input SNR: Mα =
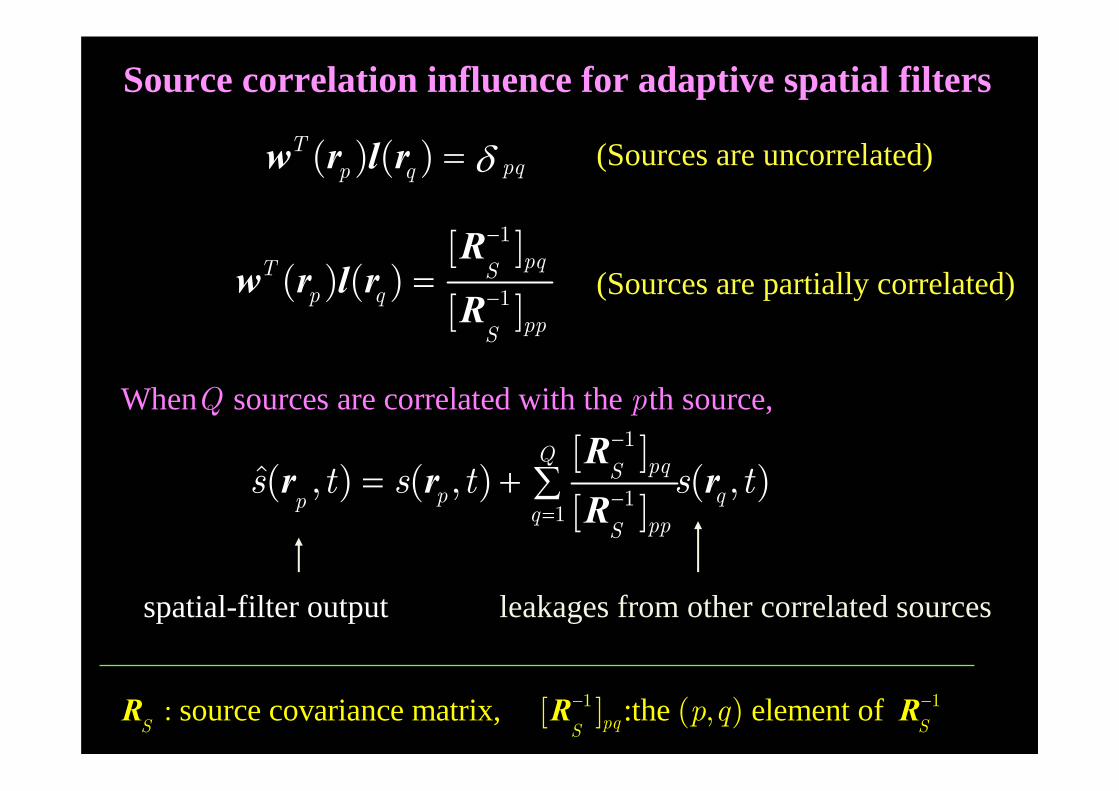
Source correlation influence for adaptive spatial filters
1
1
[ ]( ) ( )
[ ]pqT S
p qppS
−
−=R
w r l rR
source covariance matrix, :the element of 1 1: [ ] ( , )pqS SSp q− −R R R
( ) ( )Tpqp q δ=w r l r
When sources are correlated with the th source,Q p1
11
[ ]( , ) ( , ) ( , )
[ ]
Q pqSp qp q ppS
s t s t s t−
−=
= + ∑R
r r rR
spatial-filter output leakages from other correlated sources
(Sources are uncorrelated)
(Sources are partially correlated)

Signal cancellation
11 1 2
2
22 1 2
1
( , ) ( , ) ( ) ( , )
( , ) ( ) ( , ) ( , )
s t s t s t
s t s t s t
α µα
α µα
= −
= − +
r r r
r r r
⇓2 2 2
1 1
2 2 22 2
( , ) (1 ) ( , )
( , ) (1 ) ( , )
s t s t
s t s t
µ
µ
= −
= −
r r
r r
Source power decreases by a factor of 2(1 )µ−⇑
When two correlated sources exist
source correlation coefficient
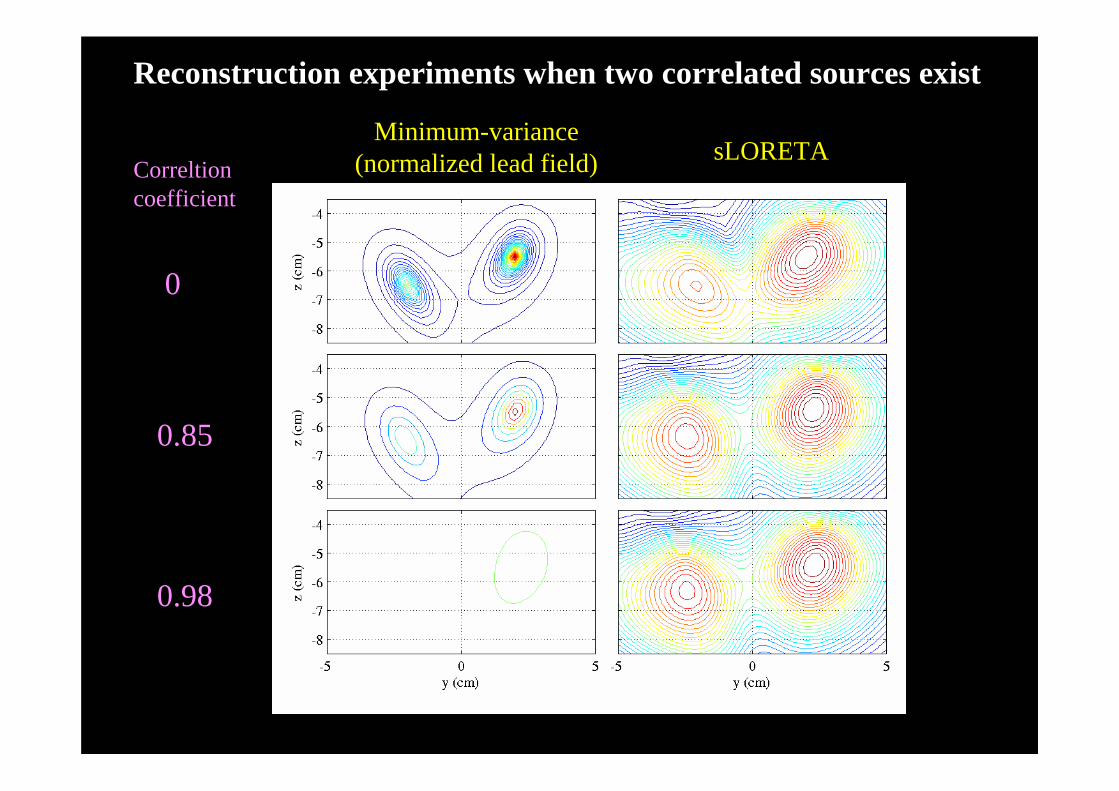
Reconstruction experiments when two correlated sources exist
sLORETAMinimum-variance
(normalized lead field)Correltioncoefficient
0
0.85
0.98
sLORETAMinimum-variance (normalized lead field)
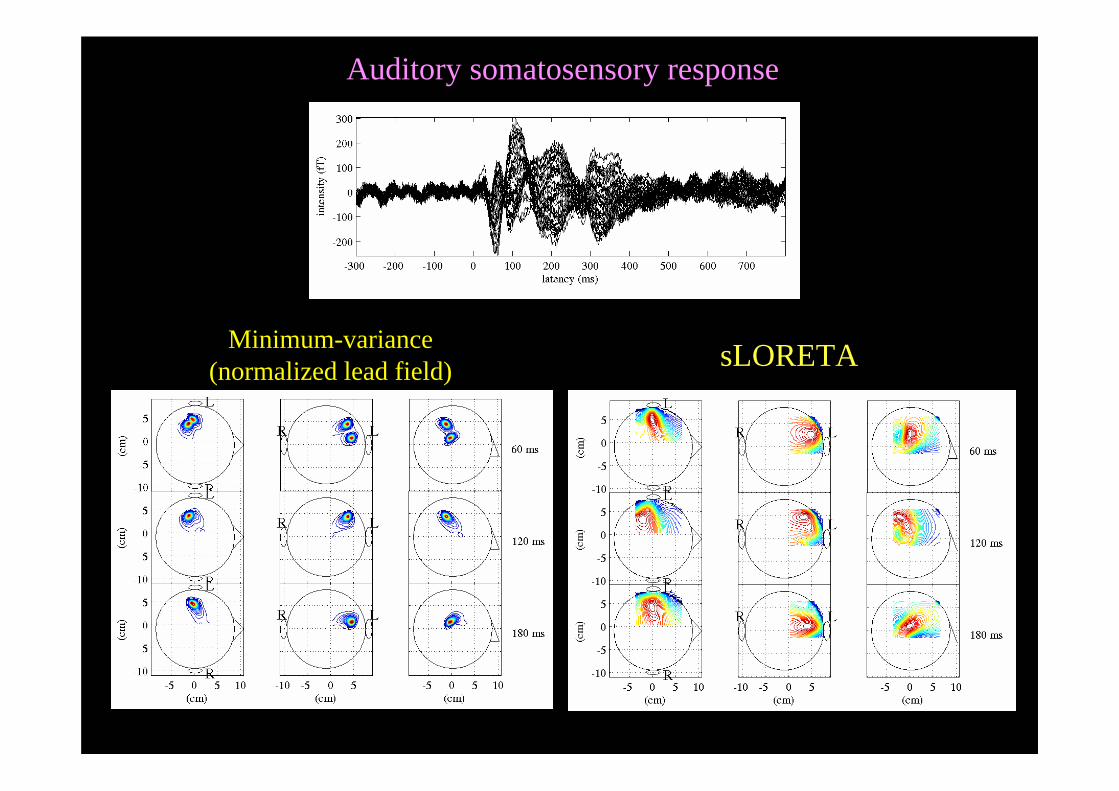
Auditory somatosensory response
sLORETAMinimum-variance (normalized lead field)
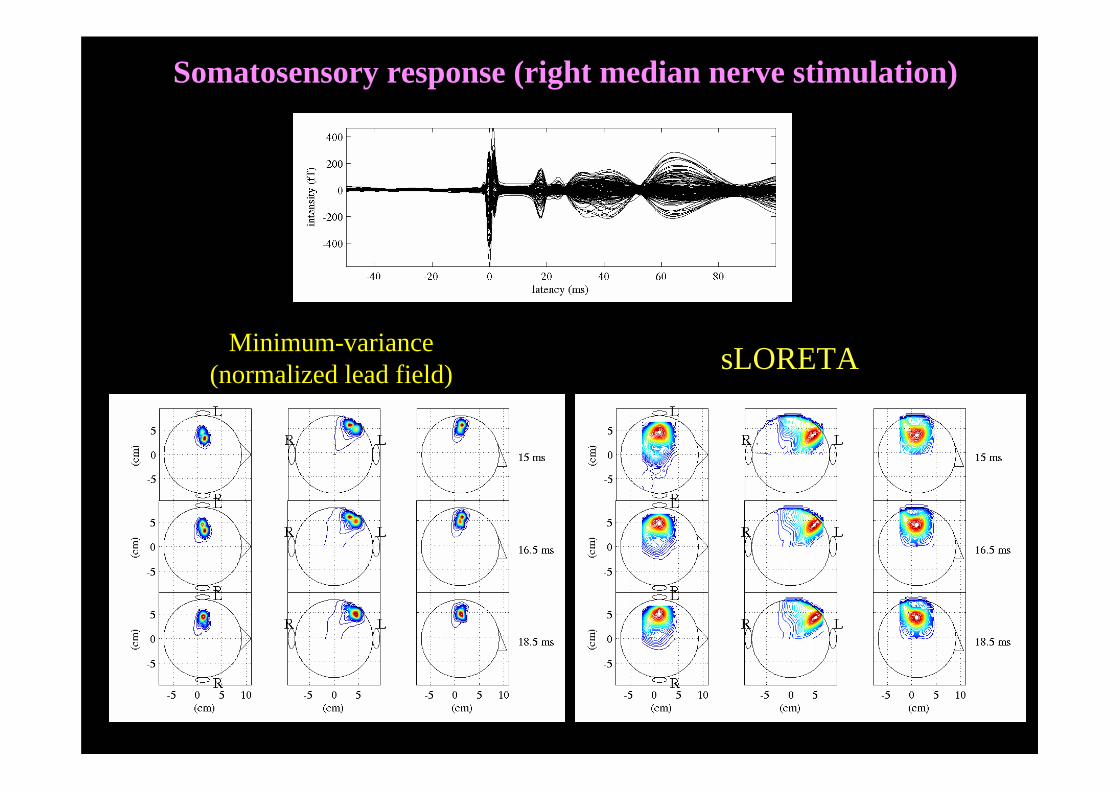
Somatosensory response (right median nerve stimulation)
Summary•The resolution kernel analysis validates the previous findings that sLORETA has no location bias. Minimum-variance filter has no location bias, if it is used with normalized lead field.
•Noise may cause the location bias for sLORETA. Minimum-variance spatial filter with normalized lead field has no location bias even in the presence of noise.
•Minimum-variance filter generally has significantly higher spatial resolution than sLORETA.
•Performance of sLORETA is not affected by source correlation.
•High spatial resolution of the minimum-variance filter is demonstrated by the somatosensory and somatosensory-auditory applications.

Collaborators
Kanazawa Institute of TechnologyHuman Science Laboratory
Dr. Isao Hashimoto
University of MarylandLinguistics and Cognitive Neuroscience Laboratory
Dr. David Poeppel
Massachusetts Institute of Technology,Department of Linguistics and Philosophy
Dr. Alec Marantz

http://www.tmit.ac.jp/~sekihara/
Visit
The PDF version of this power-point presentation as well as PDFs of my recent publications are available.
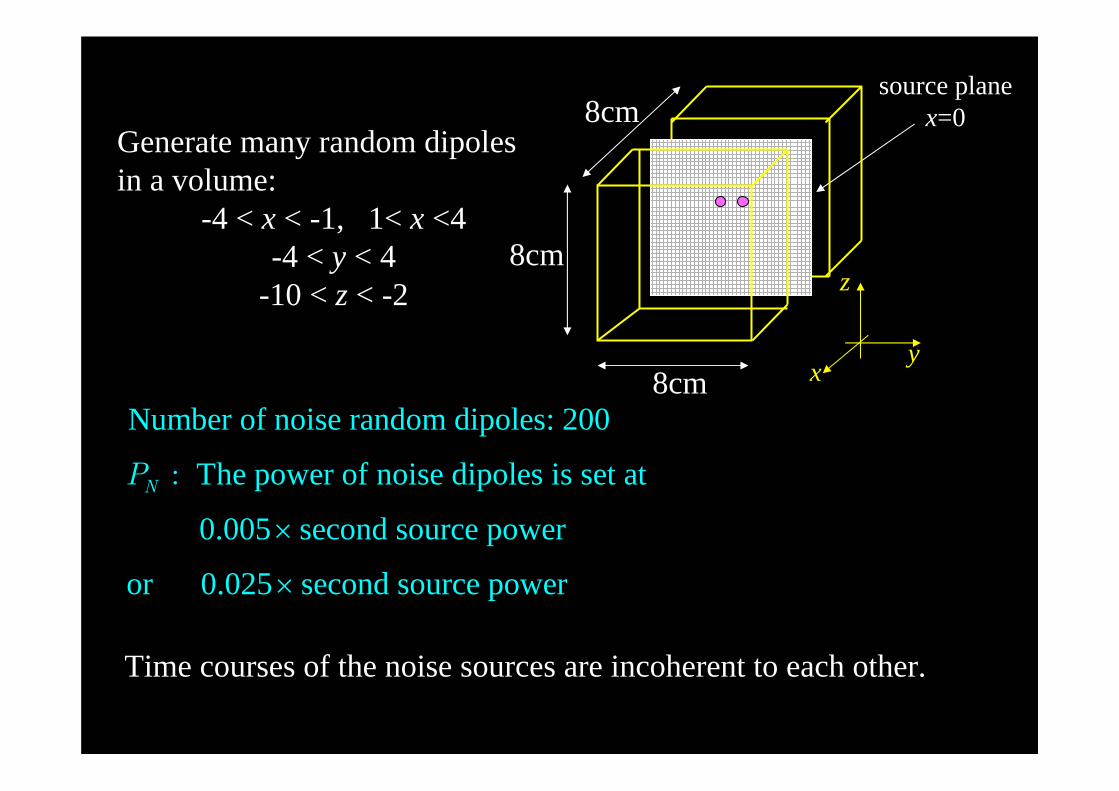
Generate many random dipoles in a volume:
-4 < x < -1, 1< x <4-4 < y < 4
-10 < z < -2
Number of noise random dipoles: 200
The power of noise dipoles is set at
0.005 second source power
or 0.025 second source power
:NP
×
×
Time courses of the noise sources are incoherent to each other.
source planex=0
z
yx8cm
8cm
8cm
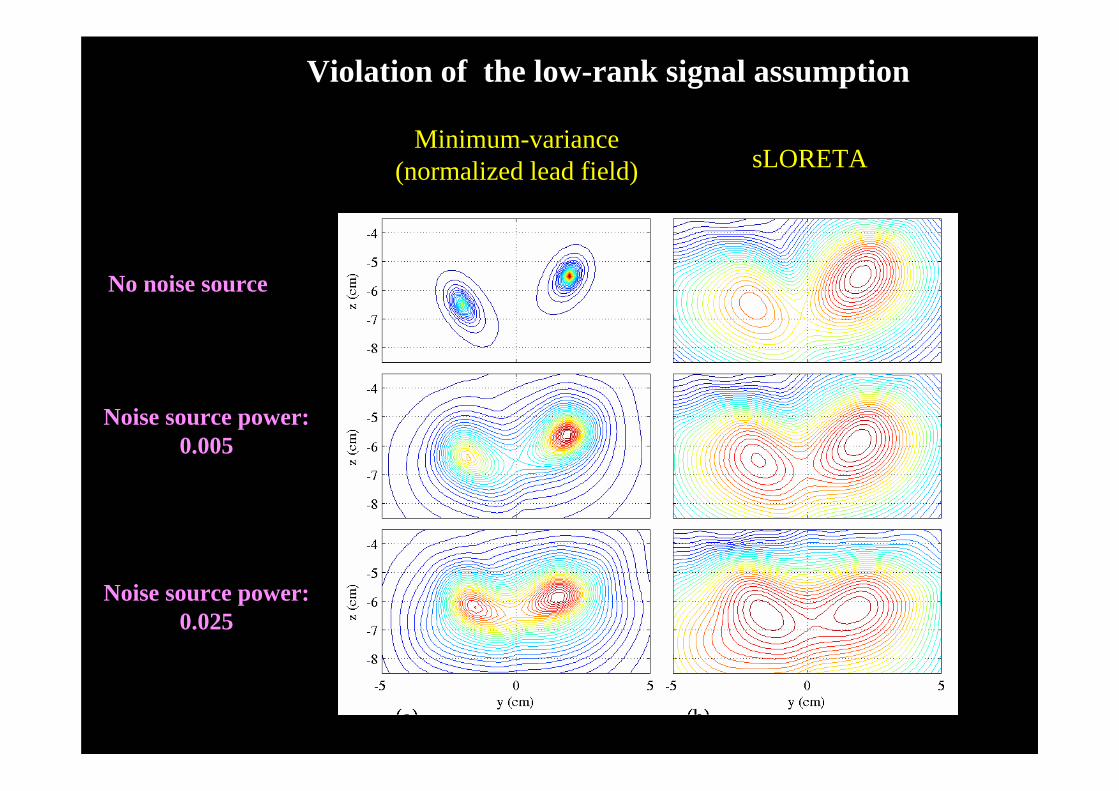
sLORETAMinimum-variance
(normalized lead field)
No noise source
Noise source power:0.005
Noise source power:0.025
Violation of the low-rank signal assumption