Embed Size (px)
Citation preview
i
Acknowledgements
This report is a collaborative effort of the Republic of South Sudan ministries, UN agencies and development partners. These include: Food Security Technical Secretariat (FSTS), National Bureau of Statistics (NBS), Ministry of Agriculture and Forestry (MoAF), Ministry of Animal Resources and Fisheries (MoARF), Relief and Rehabilitation Commission (RRC) and Ministry of Health (MoH). The activity was funded by the World Food Programme (WFP). The UN agencies included: Food and Agriculture Organization (FAO), World Food Programme, United Nations Children’s Fund (UNICEF) and United Nations Office for the Coordination of Humanitarian Affairs (UNOCHA). We gratefully acknowledge support provided by Famine Early Warning Systems Network (FEWS NET) and all partners of the Food Security and Livelihoods and Nutrition clusters for their invaluable inputs and the ANLA Technical Working Group (chaired by FSTS) that dedicated their time to contribute different chapters of the report. We especially thank Manase Yanga Laki, Elijah Luak (MoAF), Bernard Owadi, Idiku Michael, Hersi Mohamud, Gummat Abdallatif, Yomo Lawrence (WFP VAM Team), Elijah Mukhala (FAO), Mtendere Mphatso (FSL Cluster), Gloria Kusemererwa of WFP Nutrition Unit who prepared specific chapters of the report. Overall technical editing and layout of the report was done by WFP VAM Unit. Last but not least we thank all the men and women who braved difficult terrain and long travel hours to provide the empirical data used for this report.
For questions or comments concerning any aspect of the food security and vulnerability analysis please
contact:
Andrew Odero Head of VAM, WFP [email protected]
Manase Yanga Laki Coordinator FSTS [email protected]
ii
Abbreviations
ANLA Annual Needs and Livelihoods Analysis
ARI Acute Respiratory Infection(s)
ATWG ANLA Technical Working Group
BCC Behavioural Change Communications
BSFP Blanket Supplementary Feeding Programme
CES Central Equatoria State
CFSAM Crop and Food Security Assessment Mission
CPA Comprehensive Peace Agreement
CPI Consumer Price Index
CSI Coping Strategies Index EES Eastern Equatoria State FAO Food and Agriculture Organization of the United Nations FCG Food Consumption Group
FCS Food Consumption Score FEWS NET Famine Early Warning System Network FMD Foot and Mouth Disease FSLC Food Security and Livelihoods Cluster FSMS Food Security Monitoring System FSNWG (Regional) Food Security and Nutrition Working Group FSTS Food Security Technical Secretariat GAM Global Acute Malnutrition
GDP Gross Domestic Product
GoSS Government of South Sudan
HIV Human Immunodeficiency Virus
HH Household
IDPs Internally Displaced Persons ICPAC IGAD Climate Prediction and Applications Centre IGAD Inter-governmental Authority on Development IOM International Organization for Migration IPC Integrated Phase Classification IYCF Infant and Young Child Feeding
KAP Knowledge Attitude and Practice
LAF Livelihood Analysis Forum
MAM Moderate Acute Malnutrition
M&E Monitoring and Evaluation
MDG(s) Millennium Development Goal(s)
MOAF Ministry of Agriculture and Forestry MOARF Ministry of Animal Resources and Fisheries MOCII Ministry of Commerce, Industry and Investment MOH Ministry of Health
MT Metric Ton
MUAC Mid-Upper Arm Circumference
NBS National Bureau of Statistics
NBS Northern Bahr el Ghazal State
NHBS National Household Baseline Survey
NGOs Non-Governmental Organizations
NSFR National Strategic Food Reserve
OTP Out-patient Therapeutic Programme
P4P Purchase For Progress
RCA Rapid Crop and Livestock Assessment
SAM Severe Acute Malnutrition
iii
SHAP State Humanitarian Action Plan
SSP South Sudanese Pounds
SHHS South Household Health Survey
SFP Supplementary Feeding Programme
SSRRC South Sudan Relief and Rehabilitation Commission
TB Tuberculosis
TFP Therapeutic Feeding Programme
TSFP Targeted Supplementary Feeding Programme
UNHCR United Nations High Commission for Refugees
UNICEF United Nations Children’s Fund
UNOCHA United Nations Office for Coordination of Humanitarian Affairs
UNS Upper Nile State
VAM Vulnerability Analysis and Mapping Unit WASH Water, Sanitation and Hygiene WBS Western Bahr el Ghazal State WES Western Equatoria State WHZ Weight-for-height WFP World Food Programme
iv
Table of Contents
Acknowledgements ................................................................................................................................................. i
Abbreviations .......................................................................................................................................................... ii
Table of Contents .................................................................................................................................................. iv
List of Figures ........................................................................................................................................................ vii
List of Maps .......................................................................................................................................................... vii
List of Tables ......................................................................................................................................................... vii
Executive summary .............................................................................................................................................. viii
1 Background ............................................................................................................................................ 9
1.1 General Introduction ............................................................................................................................. 9
1.2 Objectives .............................................................................................................................................. 9
1.3 Methodology ......................................................................................................................................... 9
2 Overview of seasonal rainfall performance in 2012 ............................................................................ 11
3 Results of the food security monitoring .............................................................................................. 13
3.1 Current food security situation and past trends .................................................................................. 13
3.2 What is the evolution of food insecurity in South Sudan since 2008? ................................................ 14
3.3 State-level changes in food security situation ..................................................................................... 15
3.4 Overall changes in selected food security indicators .......................................................................... 15
3.5 Which groups have the highest vulnerability to food insecurity? ....................................................... 16
3.6 Household shocks and effect on food insecurity in 2012 .................................................................... 18
3.7 Coping strategies used ......................................................................................................................... 19
3.8 Programmatic implications of the profiles of food insecure households ............................................ 19
4 Agriculture ........................................................................................................................................... 21
4.1 Potential .............................................................................................................................................. 21
4.2 Trends in agriculture production ......................................................................................................... 21
4.3 Agricultural constraints........................................................................................................................ 23
4.4 Government Public Cereal Reserves and the Agricultural Master Plan .............................................. 23
4.5 Programmatic implications .................................................................................................................. 23
5. Livestock .............................................................................................................................................. 25
5.1 Livestock Potential ............................................................................................................................... 25
5.1.1 Cattle population ................................................................................................................................. 25
5.1.2 Current animal condition ..................................................................................................................... 25
5.2 Factors affecting Livestock................................................................................................................... 26
5.2.1 Contribution of livestock in household’s income and food ................................................................. 26
5.3 Livestock value chain in South Sudan .................................................................................................. 26
5.4 Programmatic implications .................................................................................................................. 27
6. Fisheries Resources........................................................................................................................................... 28
6.1 Fishing potential in South Sudan ......................................................................................................... 28
6.2 Challenges to the fishing sector ........................................................................................................... 28
v
6.3 Programmatic implications .................................................................................................................. 28
7 Market and food prices in South Sudan .............................................................................................. 29
7.1 Overview of market conditions ........................................................................................................... 29
7.1.1 Reliance on imports of food from neighbouring countries ................................................................. 29
7.1.2 Trade balance and foreign exchange ................................................................................................... 29
7.1.3 Dependency on markets and cereal price stability.............................................................................. 30
7.1.4 Performance e of Livestock market ..................................................................................................... 32
7.2 Cross border trade ............................................................................................................................... 33
7.3 Market outlook .................................................................................................................................... 34
7.4 Programme implications ...................................................................................................................... 34
8. Nutrition .............................................................................................................................................. 35
8.1 Prevalence of malnutrition using SMART Surveys ............................................................................... 35
8.2 Seasonal nutrition trends from regular screening during FSMS .......................................................... 35
8.4 Childhood morbidity ............................................................................................................................ 36
8.5 Measles Immunization and Vitamin A supplementation..................................................................... 37
8.6 Summary of malnutrition causes ......................................................................................................... 37
9 Water and sanitation ........................................................................................................................... 40
9.1 Water ................................................................................................................................................... 40
9.2 Waste disposal ..................................................................................................................................... 40
9.3 Programmatic implications .................................................................................................................. 40
10. Conflict and Insecurity ......................................................................................................................... 41
10.1 Introduction ......................................................................................................................................... 41
10.1.1 Types of current conflicts .................................................................................................................... 41
10.1.2 Effect of conflict and insecurity on livelihoods .................................................................................... 42
10.2 Returnee resettlement and reintegration ........................................................................................... 42
10.3 Internal displacements ........................................................................................................................ 43
10.4 Refugees .............................................................................................................................................. 43
10.5 Other emerging humanitarian issues .................................................................................................. 44
10.6 Programmatic implications .................................................................................................................. 44
11 Food security outlook: December 2012 to March 2013 ...................................................................... 46
11.1 Overview of food security outlook ...................................................................................................... 46
11.2. Expected scenarios and estimation of food and non-food assistance requirements in 2013 ............. 47
Best case scenario ................................................................................................................................ 47
Worst Case scenario ............................................................................................................................ 48
12. Government priorities and Plans ......................................................................................................... 49
12.1 National challenges and priorities ....................................................................................................... 49
12.2 State level priorities ............................................................................................................................. 49
12.3 Community priorities ........................................................................................................................... 53
12.4 Priority areas for interventions ............................................................................................................ 54
13 Conclusions and Recommendations .................................................................................................... 54
13.1 Recommendations ............................................................................................................................... 55
vi
14 State level Analysis and matrix ............................................................................................................ 56
Western Equatoria ................................................................................................................................................ 56
Eastern Equatoria ................................................................................................................................................. 59
Jonglei ................................................................................................................................................................... 62
Lakes ..................................................................................................................................................................... 66
Upper Nile ............................................................................................................................................................. 69
Western Bahr el Ghazal ........................................................................................................................................ 72
Northern Bahr el Ghazal ....................................................................................................................................... 75
Warrap .................................................................................................................................................................. 78
Central Equatoria .................................................................................................................................................. 81
Unity ..................................................................................................................................................................... 84
vii
List of Figures
Figure 1: Food Security trends: 2008-2012 .......................................................................................................... 14
Figure 2: State level changes in the food security situation between 2010 and 2012 ......................................... 15
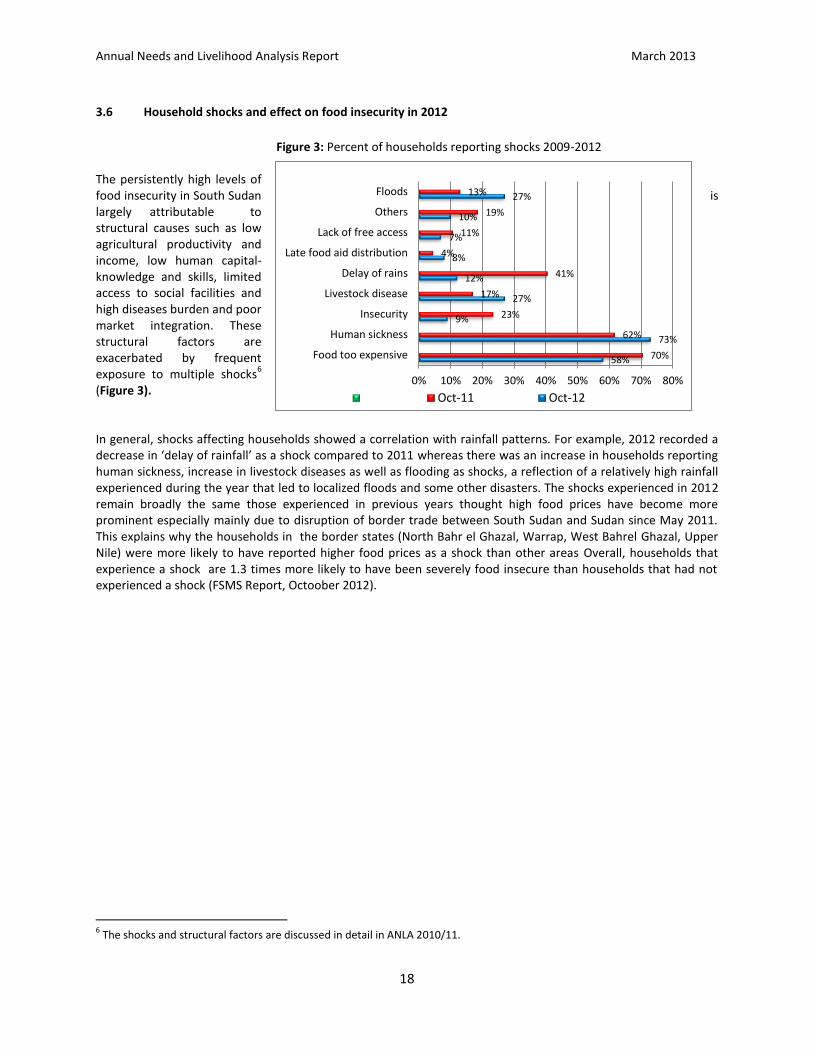
Figure 3: Percent of households reporting shocks 2009-2012 ............................................................................. 18
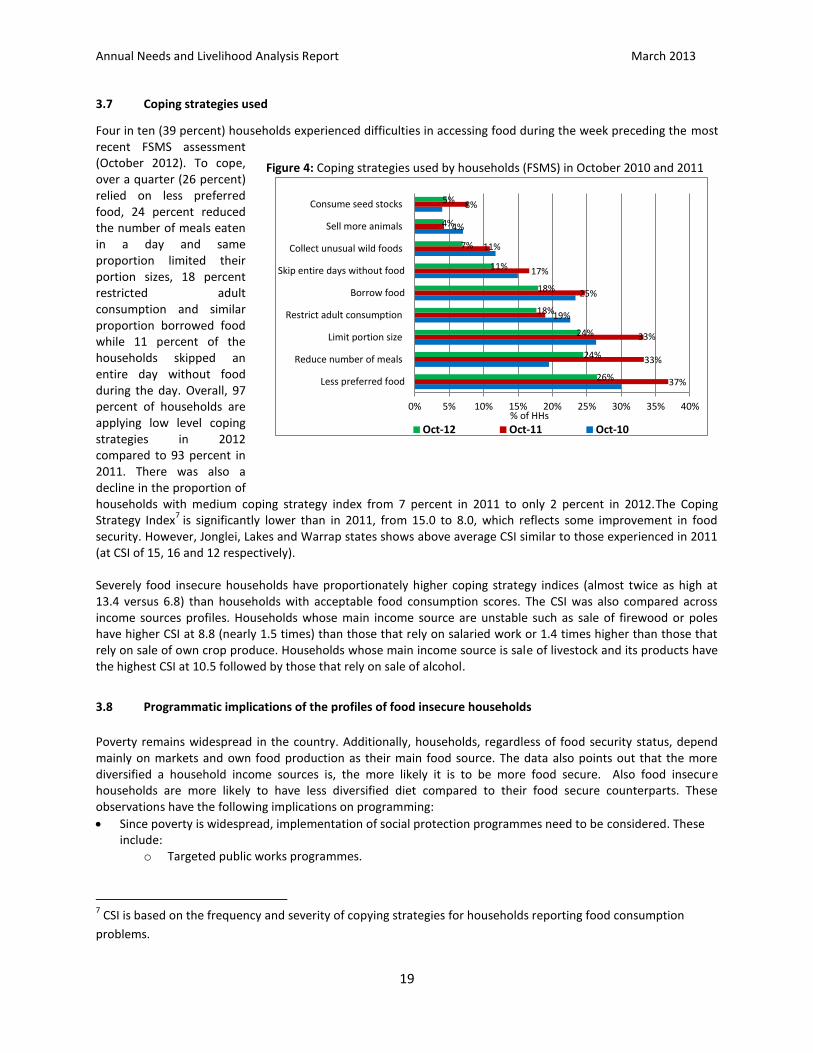
Figure 4: Coping strategies used by households (FSMS) in October 2010 and 2011 ........................................... 19
Figure 5: Trend in cereal Production and acreage under production (2001-2013) .............................................. 22
Figure 6: Current cereal Production and consumption requirements in 2013 ..................................................... 23
Figure 7: Evolution of consumer price indices 2010 -2012 ................................................................................... 30
Figures 8: Evolution of staple food prices in South Sudan (Nominal retail prices) ............................................... 30
Figure 9: Evolution of goats prices between 2011 and 2012 by area ................................................................... 32
Figure 10: Acute malnutrition rates in October 2012 by County and seasonal trends from 2010
(based on FSMS MUAC) ....................................................................................................................... 35
Figure 11: Child Morbidity in October 2012 and seasonal trends over 1 year ..................................................... 37
Figure 12: Percentage of Incidences in 2012 by Month ...................................................................................... 42
Figure 13: Returns to South Sudan from 2007 to 2012 ........................................................................................ 42
Figure 14: Main community priorities by year ..................................................................................................... 54
List of Maps
Map 1: Rainfall Performance (%) during 2012 compared to Normal season ....................................................... 12
Map 2: Incidences of conflicts by type (January to November 2012) .................................................................. 41
Map 3: Displaced populations in 2012 at State level ........................................................................................... 43
Map 4: Food security outlook (December 2012 to March 2013) ......................................................................... 47
List of Tables
Table 1: Seasonal agricultural calendar in South Sudan ....................................................................................... 11
Table 2: Food security Status by State in 2012/13 ............................................................................................... 13
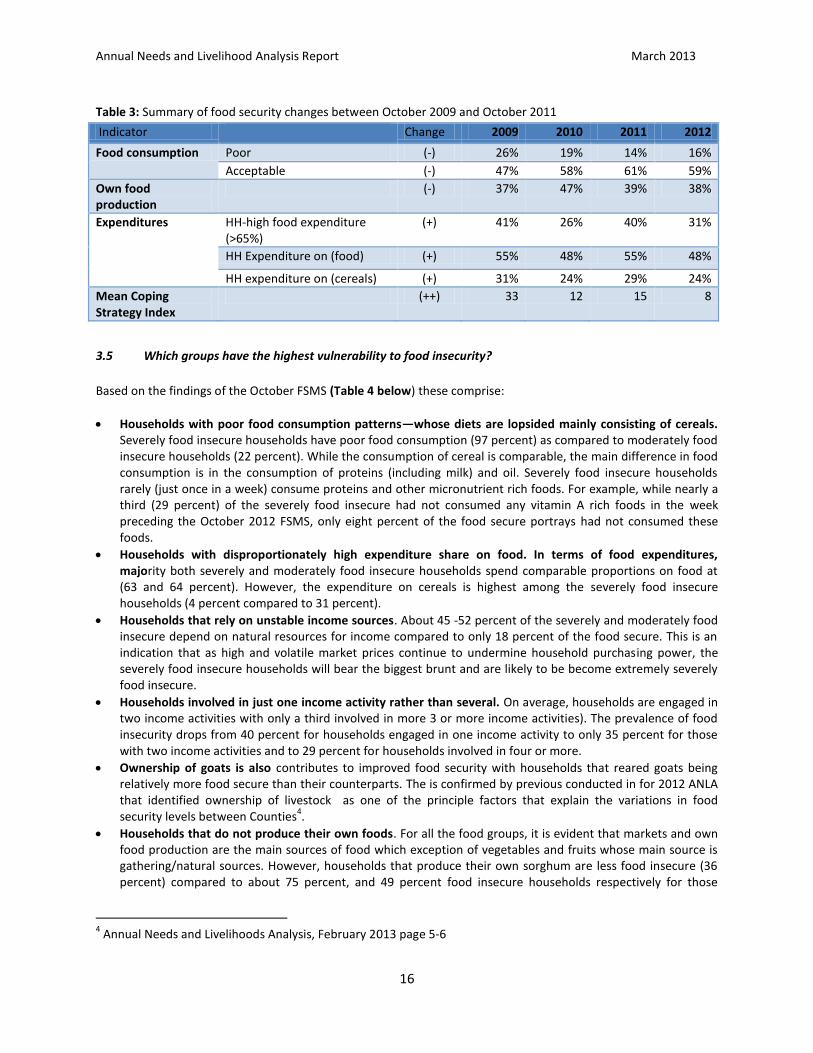
Table 3: Summary of food security changes between October 2009 and October 2011 ..................................... 16
Table 4: Summary of the characteristics of food insecure and food secure households (FSMS October 2011) .. 17
Table 5: Revised cattle numbers (thousands) by state (2009-2012 ..................................................................... 25
Table 6: Underlying factors that correlate to undernutrition in South Sudan ..................................................... 38
Table 7: Refugee statistics in 2012 ....................................................................................................................... 43
Table 8: Estimated food assistance requirements in 2013 ................................................................................... 48
Table 9: State level challenges, opportunities and priorities ............................................................................... 49
Table 10: Counties for priority food security and livelihood interventions .......................................................... 54
Table 11: County summary for Western Equatoria State ..................................................................................... 58
Table 12: County summary for Eastern Equatoria State ...................................................................................... 61
Table 13: County summary for Jonglei State ........................................................................................................ 65
Table 14: County summary for Lakes State .......................................................................................................... 68
Table 15: County summary for Upper Nile State .................................................................................................. 71
Table 16: County summary for Western Bahr el Ghazal....................................................................................... 74
Table 17: County summary for Northern Bahr el Ghazal ..................................................................................... 77
Table 18: County summary for Warrap State ....................................................................................................... 80
Table 19: County summary for Central Equatoria State ....................................................................................... 83
Table 20: County summary for Unity State .......................................................................................................... 86
viii
Executive summary
South Sudan continues to face enormous developmental challenges as it embarks on socio-economic
transformation after the protracted civil war. Some 4.1 million people are estimated to be at risk of food
insecurity—with some 10 percent of the population (about 1 million) being severely food insecure and find it
difficult to meet the daily food needs especially during the lean season. A further 30 percent of the population
(3.1 million) are moderately food insecure—a decline from 37 percent recorded in 2011, although still quite
high. This marginal improvement in food security in 2012 is attributed to: good harvest prospects; increased
market availability as a result of normal harvest in Uganda (currently a major exporter of food commodities to
South Sudan) and improved household resilience to shocks (as revealed by declining coping strategy indices).
Nutrition surveys in 2012 also shows poor nutrition situation in South Sudan in all states (except WES), having
global acute malnutrition rates ranging from 17.5 percent to 30.2 percent, above the WHO emergency
threshold of 15 percent.
Overall, the structural factors such as low agricultural production and productivity, erratic climatic patterns
characterized by droughts and floods, poor road connections, low dietary diversity; poor access to basic social
services (such as basic health services, immunisation, poor sanitary practices) undermine people’s purchasing
power and their ability to adequately feed their families and attain adequate nutrition. These are compounded
by displacement, loss of assets, high food prices compared to five-year average and 2012 border closure with
Sudan and precarious economic conditions associated with the austerity measures adopted after the oil
shutdown.
Households still allocate nearly half (48 percent) of their expenditures on food, usually at the expense of
essential services like health, education and water. Furthermore similar proportions depend on markets as a
source of food making households particularly vulnerable to market price volatilities. Over two-thirds of all
households indicate price hikes as the leading shock during the year. Strengthening income and livelihood base
and increasing household food production and productivity is critical in mitigating the impacts of these price
shocks.
Even though households applying medium to high coping strategies has reduced from 7 percent in 2011 to 2 percent in 2012, it is still noticeable that approximately one-third of the households that engage in low coping strategies use dietary adjustments such as reducing meal sizes, switching to less preferred food sources. This, among other factors, makes households vulnerable to malnutrition. The current rate expansion of cultivated area and productivity cannot keep pace with the population growth
and the existing food gap is likely to continue increasing unless the structural problems of agriculture are
addressed. Interventions like expanding irrigation schemes, high quality seed and efficient tools are essential
for the growth of the agricultural sector. The proportion of households that engage in cultivation increased
from 80 percent in 2011 to 88 percent, which partly explains the increase in net production from 545,000 Mt
in 2011 to a current 761,000 MT to 2012. However, per capita yields still remains low (at less than 1mt/ha)
partly accounting to annual cereal deficits, which in 2013 is estimated at 371,000 Mt.
South Sudan has huge potential for livestock production. Livestock needs to be transformed to a more productive enterprise from its current predominant socio-cultural orientation. Increased investment in water points, introducing better range management interventions and general increased investment in the sector would boost the food security of pastoral households. The FSMS MUAC-based nutrition monitoring shows high risk of malnutrition peaking during the ‘lean’ season, when food availability is at its lowest, childhood illnesses are prevalent and there is increased demand on care takers to attend to farming activities. Programmes and strategies to reduce the risk of malnutrition such as blanket Supplementary feeding (BSFP) should be integrated with context-specific innovative programmes that maximise carer’s time for child care during the critical periods of the year and expanded health care services.
Annual Needs and Livelihood Analysis Report March 2013
9
1 Background
1.1 General Introduction
South Sudan continues to face enormous developmental challenges as it embarks on socio-economic
transformation after the protracted civil war. In recognition of the tasks ahead, the government has undertaken
several pragmatic changes in the policy environment. This has seen the formulation of South Sudan Development
Plan 2011-13 which forms the basis for sectoral and state level plans and strategies. For example, several states
have formulated their strategic agricultural plans and have set priorities for addressing key food security and
livelihood challenges. But while the steps are laudable, South Sudan has experienced severe budgetary constraints
following the oil shutdown. This has hampered faster economic transformation which has impeded progress
towards food security and sustainable livelihoods.
The rapidly evolving situation in South Sudan calls for re-examination of the analytical tools and approaches to
provide relevant information that responds to the needs of programming. This has seen the transformation of the
Annual Needs and Livelihood Analysis (ANLA) to a holistic analytical document that captures the breadth of
livelihoods, challenges and priorities both nationally and at state level. The 2013 ANLA strives to deepen the
analytical approach and produce a self-contained document that identifies food security and livelihood needs,
their underlying causes and articulates government policies and priorities both at national and state level to
address the needs.
The 2012/13 ANLA builds on the gains from last year’s shift to state level analysis and focuses on:
Strengthened articulation of government priorities and plans at national and state levels;
Increased level of government participation in food security and livelihoods analysis both at national and
state level and promote the ANLA as platform for developing national capacity in food security and
livelihood analysis;
Broader analysis of emerging humanitarian issues and geographical disparities in needs and priorities.
1.2 Objectives
The overall goal is to generate the 2012/2013 ANLA that is “self-contained” to support needs identification,
livelihood opportunities and simple and practical solutions to address the needs. The report puts more emphasis
on geographical distribution and seasonality of needs and specific causes of those needs. Specifically, the report
aims to:
• Update/track on changes and improvements in food security and livelihoods at the national and state
level with key county highlights;
• Present state level policies and plans related to food security and livelihoods;
• Identify of programmatic implications of prevailing food security and livelihood needs with special
attention cross-sectoral linkages such as between food security and nutrition.
1.3 Methodology
Approach: Broad consultations were done with the Government, partners of the Food Security and Livelihood cluster (FSLC), other clusters to agree on the ANLA process, objectives, timeline as well as constitute an ANLA 2012/2013 Technical Working Group (ATWG). This was followed by secondary data analysis, triangulated through focus group discussions at the state-level during the FSMS and CFSAM field data collection. The technical working group was formed based on four thematic areas as follows:
Annual Needs and Livelihood Analysis Report March 2013
10
1. Humanitarian issues—conflicts, refugees, IDPs, returnees, floods whose participants were the Ministry of Humanitarian Affairs and Disaster Management (MHADM), Relief and Rehabilitation Commission (RRC), United Nations Office for the Coordination of Humanitarian Affairs (UNOCHA, United Nations High Commission for refugees (UNHCR), International organization for Migration (IOM), USAID’s Famine Early Warning Systems Network (FEWSNET) and World Food Programme (WFP)
2. Health and nutrition issues. Participants included Ministry of Health, Nutrition Cluster, United Nations Children’s Fund (UNICEF) and WFP.
3. Agriculture, livestock and fishing. Participants included Ministry of Agriculture and Forestry (MAF), Ministry of Animal Resources and Fisheries (MARF), Food and Agriculture Organization (FAO)
4. Vulnerability analysis—food security, market & trade. Participants were the National Bureau of Statistics (NBS), Ministry of Commerce, Industry and Investment (MCII), WFP and FEWSNET.
The analytical process included consultations with various groups mainly members of the ATWG and FSLC, which
took place between November 2012 and January 2013 and final report produced in early March 2013. The key
milestones of the ANLA process (namely the process, discussion of findings from the draft report and the final
document) were presented for endorsement by the FSLC.
Analysis and data interpretation: The ANLA strives to help identify needs at the county level. The Food Security
Monitoring System (FSMS) generates food security information that is representative at the state-level but also
contribute to enrich sentinel site-level data which generate information at the county-level. A convergence of
evidence from quantitative analysis based on primary data (from FSMS, SHAP and national surveys, M&E data) and
qualitative analysis based on secondary data, key informant focus group discussions (some of which were collected
during the FSMS exercise) was used to rank counties according to vulnerability to food and livelihood insecurity.
Furthermore, the 2013 ANLA is enriched by the findings of WFP’s consultation for the country strategy document
in 2012 that highlighted state level plans, priorities and plans as well as challenges and opportunities.
The 2012/13 ANLA analysis uses primary data from FSMS, the Crop and Food Security Assessment Mission
(CFSAM), and assessment report generated during the year1. Other data sources for situational analysis include:
Quarterly Livelihood Analysis Forum (LAF) Integrated Phase Classification (IPC)--based food security
outlook
Secondary data from National Bureau of Statistics: SHHS 2006 & 2010, National Household Baseline
Survey-(NHBS 2010) and Census (2009)
SMART surveys from the nutrition cluster
FSLC report on Nutrition food security linkages (workshop report-November 2012)
State Humanitarian Action Plan (SHAP) data compiled by OCHA in 2010
The Report on Food Security and Nutrition in South Sudan by WFP in 2012
Ad hoc food security and livelihood assessments including flood risk analysis
1 For more details see Annual Needs and Livelihoods Analysis 2011/12, South Sudan, February 2012
Annual Needs and Livelihood Analysis Report March 2013
11
2. Overview of seasonal rainfall performance in 2012
In April 2012, the Intergovernmental Authority on Development (IGAD) Climate Prediction and Applications Centre
(ICPAC) predicted a likelihood of normal to above normal rainfall over South Sudan during May 2012 except for the
border areas between Sudan and South Sudan. This was seen as a good prospect for increased agricultural
production. ICPAC also predicted occurrence of crop diseases outbreak inflicted by weather parameters and
flooding of homesteads in flood prone areas of South Sudan. By June 2012, the seasonal rainfall in South Sudan
had mixed trend. Generally, rainfall had started by June in Greater Equatoria and most parts of Western Bahr el
Ghazal, Lakes and Warrap while states like Jonglei, Unity and Upper Nile only received some showers in the last
dekad of April and first dekad of May. However, By September 2012, heavy rains had caused destructions in the
northern Bahr el Ghazal, Warrap, and Jonglei states of South Sudan.
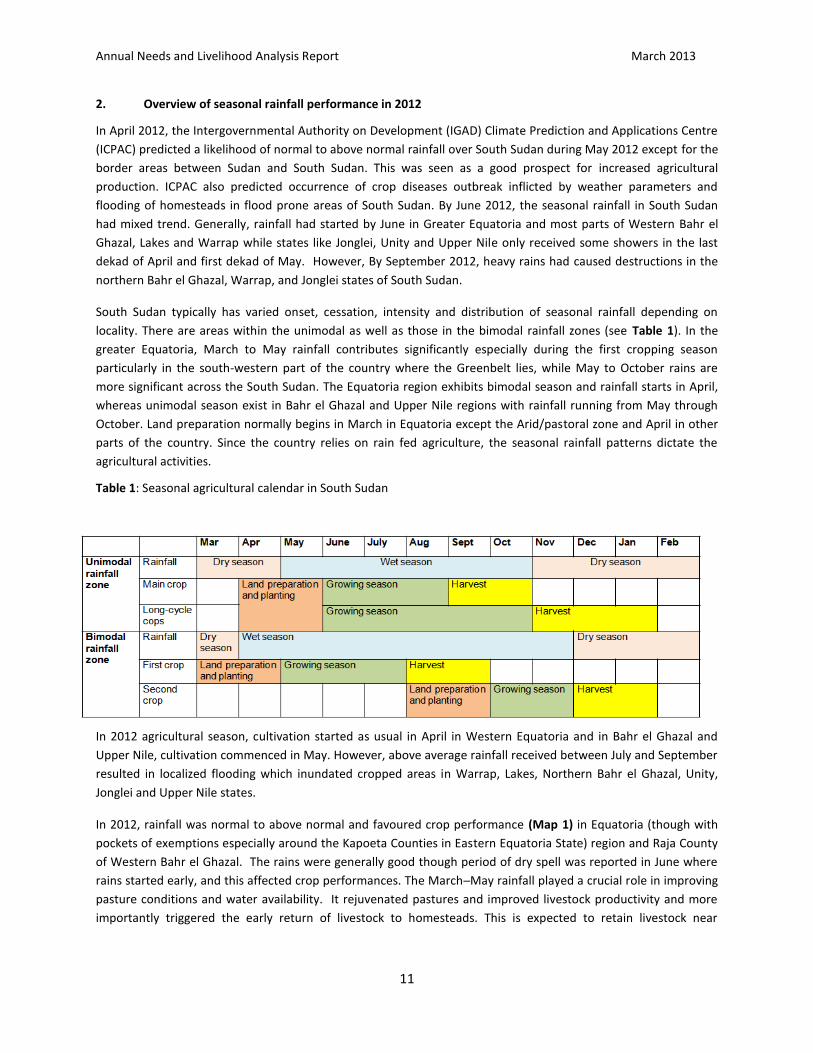
South Sudan typically has varied onset, cessation, intensity and distribution of seasonal rainfall depending on
locality. There are areas within the unimodal as well as those in the bimodal rainfall zones (see Table 1). In the
greater Equatoria, March to May rainfall contributes significantly especially during the first cropping season
particularly in the south-western part of the country where the Greenbelt lies, while May to October rains are
more significant across the South Sudan. The Equatoria region exhibits bimodal season and rainfall starts in April,
whereas unimodal season exist in Bahr el Ghazal and Upper Nile regions with rainfall running from May through
October. Land preparation normally begins in March in Equatoria except the Arid/pastoral zone and April in other
parts of the country. Since the country relies on rain fed agriculture, the seasonal rainfall patterns dictate the
agricultural activities.
Table 1: Seasonal agricultural calendar in South Sudan
In 2012 agricultural season, cultivation started as usual in April in Western Equatoria and in Bahr el Ghazal and
Upper Nile, cultivation commenced in May. However, above average rainfall received between July and September
resulted in localized flooding which inundated cropped areas in Warrap, Lakes, Northern Bahr el Ghazal, Unity,
Jonglei and Upper Nile states.
In 2012, rainfall was normal to above normal and favoured crop performance (Map 1) in Equatoria (though with
pockets of exemptions especially around the Kapoeta Counties in Eastern Equatoria State) region and Raja County
of Western Bahr el Ghazal. The rains were generally good though period of dry spell was reported in June where
rains started early, and this affected crop performances. The March─May rainfall played a crucial role in improving
pasture conditions and water availability. It rejuvenated pastures and improved livestock productivity and more
importantly triggered the early return of livestock to homesteads. This is expected to retain livestock near
Annual Needs and Livelihood Analysis Report March 2013
12
homesteads for a longer period enabling access to livestock products such as meat and milk at least during the
January/February period.
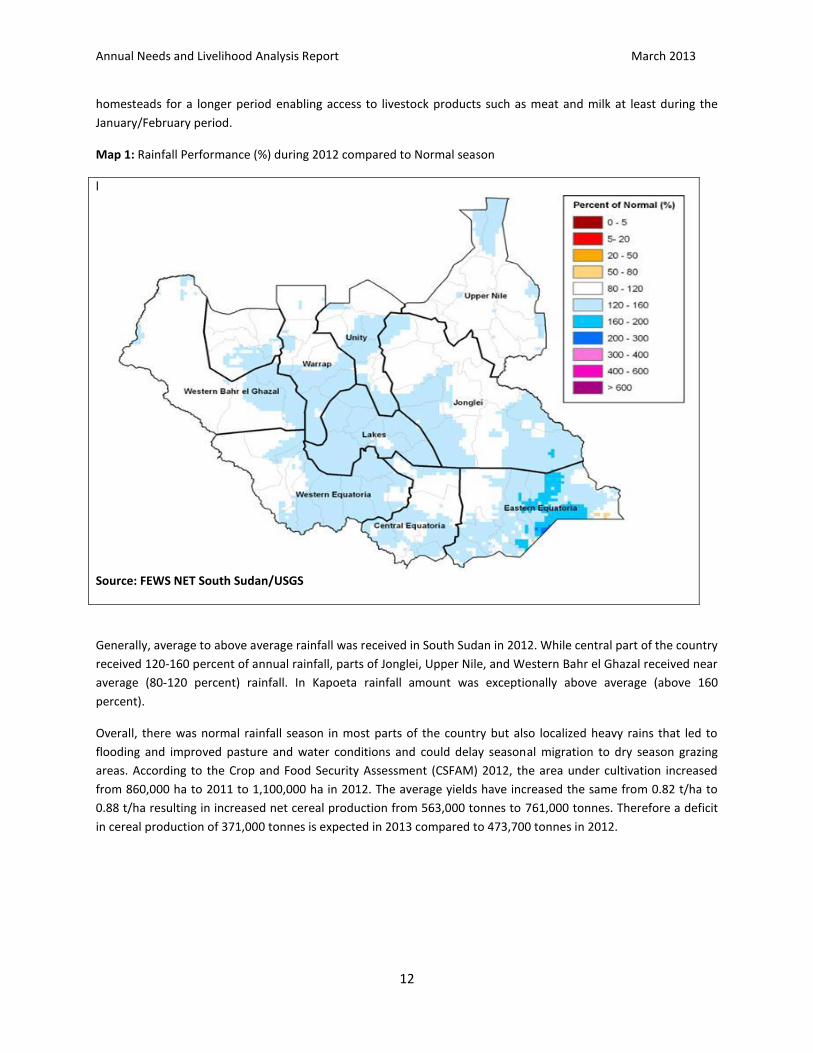
Map 1: Rainfall Performance (%) during 2012 compared to Normal season
Generally, average to above average rainfall was received in South Sudan in 2012. While central part of the country
received 120-160 percent of annual rainfall, parts of Jonglei, Upper Nile, and Western Bahr el Ghazal received near
average (80-120 percent) rainfall. In Kapoeta rainfall amount was exceptionally above average (above 160
percent).
Overall, there was normal rainfall season in most parts of the country but also localized heavy rains that led to
flooding and improved pasture and water conditions and could delay seasonal migration to dry season grazing
areas. According to the Crop and Food Security Assessment (CSFAM) 2012, the area under cultivation increased
from 860,000 ha to 2011 to 1,100,000 ha in 2012. The average yields have increased the same from 0.82 t/ha to
0.88 t/ha resulting in increased net cereal production from 563,000 tonnes to 761,000 tonnes. Therefore a deficit
in cereal production of 371,000 tonnes is expected in 2013 compared to 473,700 tonnes in 2012.
l
Source: FEWS NET South Sudan/USGS
Annual Needs and Livelihood Analysis Report March 2013
13
3 Results of the food security monitoring
3.1 Current food security situation and past trends
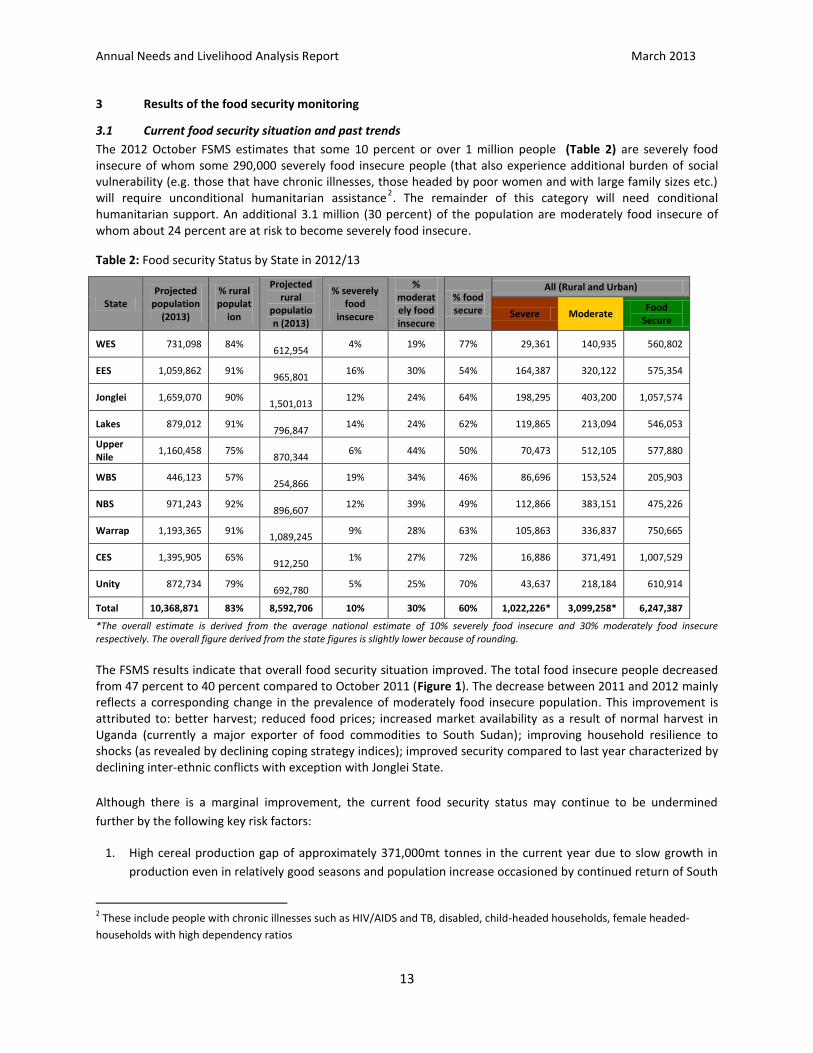
The 2012 October FSMS estimates that some 10 percent or over 1 million people (Table 2) are severely food insecure of whom some 290,000 severely food insecure people (that also experience additional burden of social vulnerability (e.g. those that have chronic illnesses, those headed by poor women and with large family sizes etc.) will require unconditional humanitarian assistance
2. The remainder of this category will need conditional
humanitarian support. An additional 3.1 million (30 percent) of the population are moderately food insecure of whom about 24 percent are at risk to become severely food insecure.
Table 2: Food security Status by State in 2012/13
*The overall estimate is derived from the average national estimate of 10% severely food insecure and 30% moderately food insecure respectively. The overall figure derived from the state figures is slightly lower because of rounding.
The FSMS results indicate that overall food security situation improved. The total food insecure people decreased from 47 percent to 40 percent compared to October 2011 (Figure 1). The decrease between 2011 and 2012 mainly reflects a corresponding change in the prevalence of moderately food insecure population. This improvement is attributed to: better harvest; reduced food prices; increased market availability as a result of normal harvest in Uganda (currently a major exporter of food commodities to South Sudan); improving household resilience to shocks (as revealed by declining coping strategy indices); improved security compared to last year characterized by declining inter-ethnic conflicts with exception with Jonglei State.
Although there is a marginal improvement, the current food security status may continue to be undermined
further by the following key risk factors:
1. High cereal production gap of approximately 371,000mt tonnes in the current year due to slow growth in
production even in relatively good seasons and population increase occasioned by continued return of South
2 These include people with chronic illnesses such as HIV/AIDS and TB, disabled, child-headed households, female headed-
households with high dependency ratios
State Projected
population (2013)
% rural populat
ion
Projected rural
population (2013)
% severely food
insecure
% moderately food insecure
% food secure
All (Rural and Urban)
Severe Moderate Food
Secure
WES 731,098 84%
612,954 4% 19% 77% 29,361 140,935 560,802
EES 1,059,862 91%
965,801 16% 30% 54% 164,387 320,122 575,354
Jonglei 1,659,070 90%
1,501,013 12% 24% 64% 198,295 403,200 1,057,574
Lakes 879,012 91%
796,847 14% 24% 62% 119,865 213,094 546,053
Upper Nile
1,160,458 75%
870,344 6% 44% 50% 70,473 512,105 577,880
WBS 446,123 57%
254,866 19% 34% 46% 86,696 153,524 205,903
NBS 971,243 92%
896,607 12% 39% 49% 112,866 383,151 475,226
Warrap 1,193,365 91%
1,089,245 9% 28% 63% 105,863 336,837 750,665
CES 1,395,905 65%
912,250 1% 27% 72% 16,886 371,491 1,007,529
Unity 872,734 79%
692,780 5% 25% 70% 43,637 218,184 610,914
Total 10,368,871 83% 8,592,706 10% 30% 60% 1,022,226* 3,099,258* 6,247,387
Annual Needs and Livelihood Analysis Report March 2013
14
Sudanese populations from Diaspora (over 150,00 returnees in 2012) that have to rely on markets to meet
their food needs in 2012. Some 125,000 are expected in the country by 2013. Additionally, an estimated
171,000 refugee3s from Sudan (mainly located in Upper Nile and Unity States) are heightening pressure on
basic services including food. UNHCR estimates that the refugees will more than double and reach about
350,000 in 2013.
2. High food prices which were mainly triggered from May 2011 due to trade restrictions between Sudan and
South Sudan and reduced the presence of Sudan traders. This has culminated price upsurge in 2012 with
levels still significantly higher than the long-term average.
3. Fuel prices increased in 2012 affecting transportation costs resulting in cost-push inflation.
4. Insecurity and inter-communal conflicts resulting to huge displacement of populations especially in Jonglei
and Unity States. Nearly 173,000 people were displaced between January and November 2012 with Jonglei
experiencing more than 2/3 of the displacements.
5. Fears of disruptions of livelihoods around the borders on Northern Bahr el Ghazal earmarked for
demilitarization resulted to tensions.
6. Shortage of hard currencies in domestic market to support continued importation of basic foods. Despite the
country being cereal import dependent, there has been growing shortage of foreign exchange to meet the
import requirements.
7. Continued trade blockade between Sudan and South Sudan.
The scenarios are discussed in detail in Chapter 11.
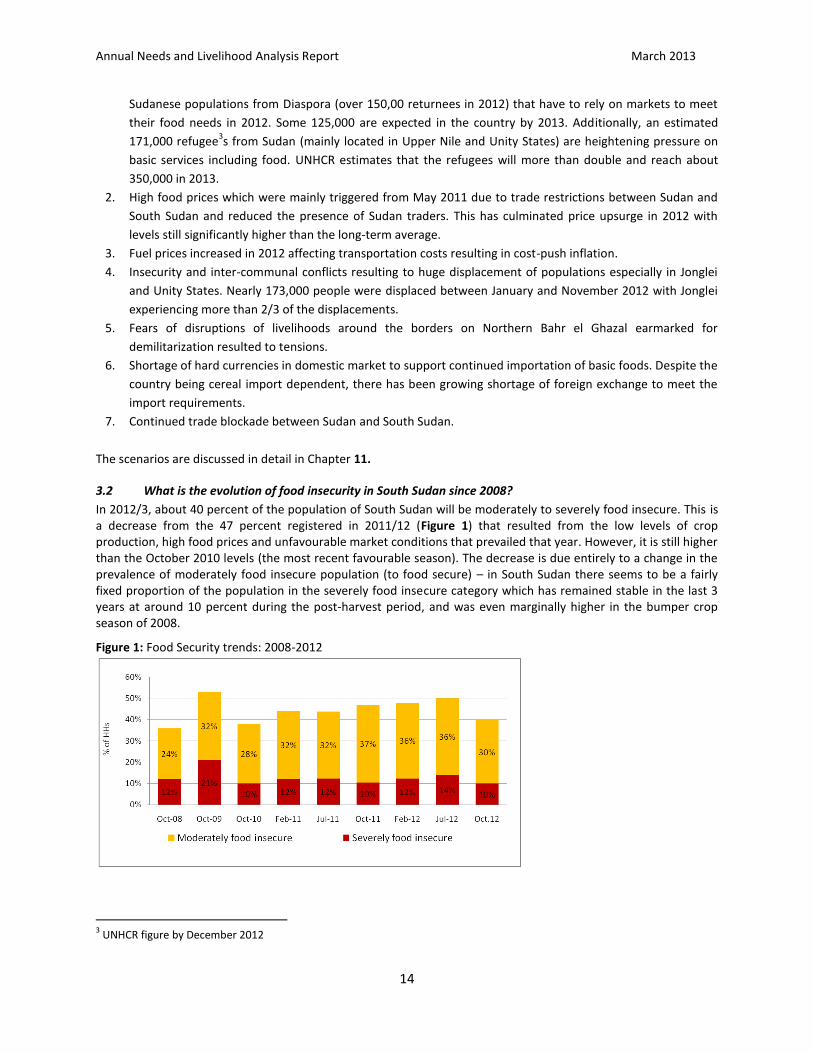
3.2 What is the evolution of food insecurity in South Sudan since 2008?
In 2012/3, about 40 percent of the population of South Sudan will be moderately to severely food insecure. This is a decrease from the 47 percent registered in 2011/12 (Figure 1) that resulted from the low levels of crop production, high food prices and unfavourable market conditions that prevailed that year. However, it is still higher than the October 2010 levels (the most recent favourable season). The decrease is due entirely to a change in the prevalence of moderately food insecure population (to food secure) – in South Sudan there seems to be a fairly fixed proportion of the population in the severely food insecure category which has remained stable in the last 3 years at around 10 percent during the post-harvest period, and was even marginally higher in the bumper crop season of 2008.
Figure 1: Food Security trends: 2008-2012
3 UNHCR figure by December 2012
Annual Needs and Livelihood Analysis Report March 2013
15
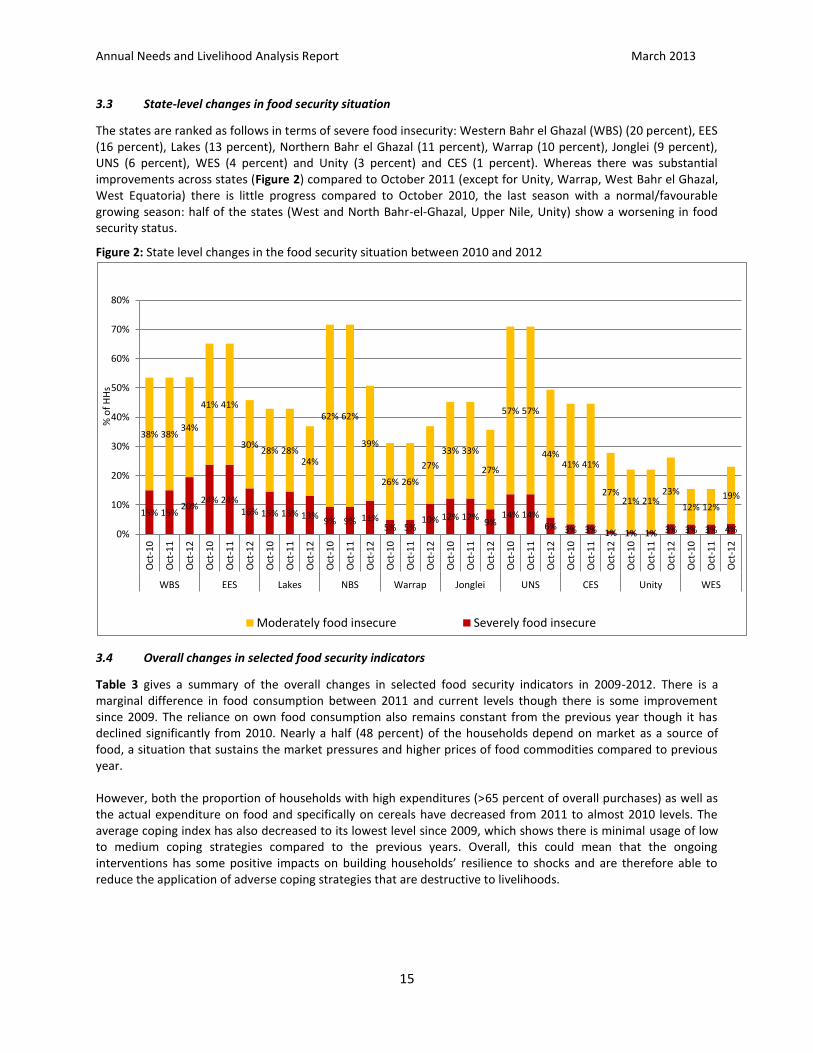
3.3 State-level changes in food security situation
The states are ranked as follows in terms of severe food insecurity: Western Bahr el Ghazal (WBS) (20 percent), EES (16 percent), Lakes (13 percent), Northern Bahr el Ghazal (11 percent), Warrap (10 percent), Jonglei (9 percent), UNS (6 percent), WES (4 percent) and Unity (3 percent) and CES (1 percent). Whereas there was substantial improvements across states (Figure 2) compared to October 2011 (except for Unity, Warrap, West Bahr el Ghazal, West Equatoria) there is little progress compared to October 2010, the last season with a normal/favourable growing season: half of the states (West and North Bahr-el-Ghazal, Upper Nile, Unity) show a worsening in food security status.
Figure 2: State level changes in the food security situation between 2010 and 2012
3.4 Overall changes in selected food security indicators
Table 3 gives a summary of the overall changes in selected food security indicators in 2009-2012. There is a marginal difference in food consumption between 2011 and current levels though there is some improvement since 2009. The reliance on own food consumption also remains constant from the previous year though it has declined significantly from 2010. Nearly a half (48 percent) of the households depend on market as a source of food, a situation that sustains the market pressures and higher prices of food commodities compared to previous year. However, both the proportion of households with high expenditures (>65 percent of overall purchases) as well as the actual expenditure on food and specifically on cereals have decreased from 2011 to almost 2010 levels. The average coping index has also decreased to its lowest level since 2009, which shows there is minimal usage of low to medium coping strategies compared to the previous years. Overall, this could mean that the ongoing interventions has some positive impacts on building households’ resilience to shocks and are therefore able to reduce the application of adverse coping strategies that are destructive to livelihoods.
15% 15% 20%
24% 24% 16% 15% 15% 13%
9% 9% 11% 5% 5%
10% 12% 12% 9%
14% 14% 6% 3% 3% 1% 1% 1% 3% 3% 3% 4%
38% 38% 34%
41% 41%
30% 28% 28%
24%
62% 62%
39%
26% 26%
27%
33% 33%
27%
57% 57%
44% 41% 41%
27% 21% 21%
23%
12% 12% 19%
0%
10%
20%
30%
40%
50%
60%
70%
80%
Oct
-10
Oct
-11
Oct
-12
Oct
-10
Oct
-11
Oct
-12
Oct
-10
Oct
-11
Oct
-12
Oct
-10
Oct
-11
Oct
-12
Oct
-10
Oct
-11
Oct
-12
Oct
-10
Oct
-11
Oct
-12
Oct
-10
Oct
-11
Oct
-12
Oct
-10
Oct
-11
Oct
-12
Oct
-10
Oct
-11
Oct
-12
Oct
-10
Oct
-11
Oct
-12
WBS EES Lakes NBS Warrap Jonglei UNS CES Unity WES
% o
f H
Hs
Moderately food insecure Severely food insecure
Annual Needs and Livelihood Analysis Report March 2013
16
Table 3: Summary of food security changes between October 2009 and October 2011
Indicator Change 2009 2010 2011 2012
Food consumption Poor (-) 26% 19% 14% 16%
Acceptable (-) 47% 58% 61% 59%
Own food production
(-) 37% 47% 39% 38%
Expenditures HH-high food expenditure (>65%)
(+) 41% 26% 40% 31%
HH Expenditure on (food) (+) 55% 48% 55% 48%
HH expenditure on (cereals) (+) 31% 24% 29% 24%
Mean Coping Strategy Index
(++) 33 12 15 8
3.5 Which groups have the highest vulnerability to food insecurity?
Based on the findings of the October FSMS (Table 4 below) these comprise:
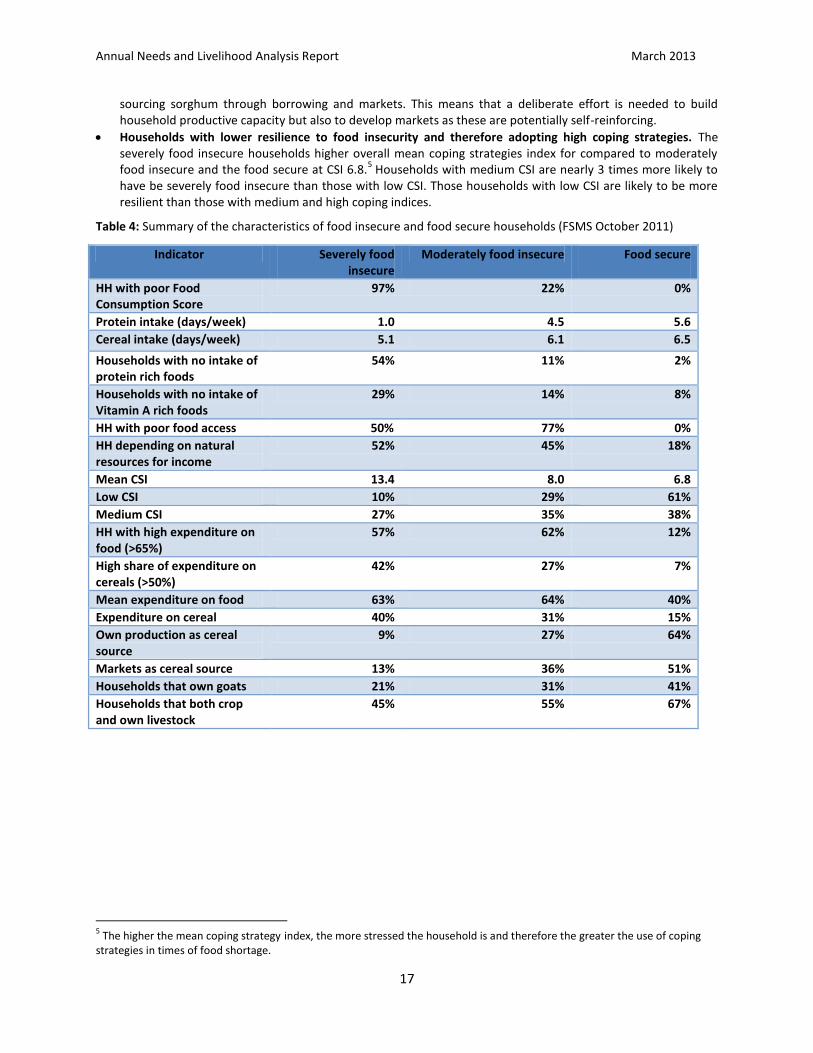
Households with poor food consumption patterns—whose diets are lopsided mainly consisting of cereals. Severely food insecure households have poor food consumption (97 percent) as compared to moderately food insecure households (22 percent). While the consumption of cereal is comparable, the main difference in food consumption is in the consumption of proteins (including milk) and oil. Severely food insecure households rarely (just once in a week) consume proteins and other micronutrient rich foods. For example, while nearly a third (29 percent) of the severely food insecure had not consumed any vitamin A rich foods in the week preceding the October 2012 FSMS, only eight percent of the food secure portrays had not consumed these foods.
Households with disproportionately high expenditure share on food. In terms of food expenditures, majority both severely and moderately food insecure households spend comparable proportions on food at (63 and 64 percent). However, the expenditure on cereals is highest among the severely food insecure households (4 percent compared to 31 percent).
Households that rely on unstable income sources. About 45 -52 percent of the severely and moderately food insecure depend on natural resources for income compared to only 18 percent of the food secure. This is an indication that as high and volatile market prices continue to undermine household purchasing power, the severely food insecure households will bear the biggest brunt and are likely to be become extremely severely food insecure.
Households involved in just one income activity rather than several. On average, households are engaged in two income activities with only a third involved in more 3 or more income activities). The prevalence of food insecurity drops from 40 percent for households engaged in one income activity to only 35 percent for those with two income activities and to 29 percent for households involved in four or more.
Ownership of goats is also contributes to improved food security with households that reared goats being relatively more food secure than their counterparts. The is confirmed by previous conducted in for 2012 ANLA that identified ownership of livestock as one of the principle factors that explain the variations in food security levels between Counties
4.
Households that do not produce their own foods. For all the food groups, it is evident that markets and own food production are the main sources of food which exception of vegetables and fruits whose main source is gathering/natural sources. However, households that produce their own sorghum are less food insecure (36 percent) compared to about 75 percent, and 49 percent food insecure households respectively for those
4 Annual Needs and Livelihoods Analysis, February 2013 page 5-6
Annual Needs and Livelihood Analysis Report March 2013
17
sourcing sorghum through borrowing and markets. This means that a deliberate effort is needed to build household productive capacity but also to develop markets as these are potentially self-reinforcing.
Households with lower resilience to food insecurity and therefore adopting high coping strategies. The severely food insecure households higher overall mean coping strategies index for compared to moderately food insecure and the food secure at CSI 6.8.
5 Households with medium CSI are nearly 3 times more likely to
have be severely food insecure than those with low CSI. Those households with low CSI are likely to be more resilient than those with medium and high coping indices.
Table 4: Summary of the characteristics of food insecure and food secure households (FSMS October 2011)
Indicator Severely food insecure
Moderately food insecure Food secure
HH with poor Food Consumption Score
97% 22% 0%
Protein intake (days/week) 1.0 4.5 5.6
Cereal intake (days/week) 5.1 6.1 6.5
Households with no intake of protein rich foods
54% 11% 2%
Households with no intake of Vitamin A rich foods
29% 14% 8%
HH with poor food access 50% 77% 0%
HH depending on natural resources for income
52% 45% 18%
Mean CSI 13.4 8.0 6.8
Low CSI 10% 29% 61%
Medium CSI 27% 35% 38%
HH with high expenditure on food (>65%)
57% 62% 12%
High share of expenditure on cereals (>50%)
42% 27% 7%
Mean expenditure on food 63% 64% 40%
Expenditure on cereal 40% 31% 15%
Own production as cereal source
9% 27% 64%
Markets as cereal source 13% 36% 51%
Households that own goats 21% 31% 41%
Households that both crop and own livestock
45% 55% 67%
5 The higher the mean coping strategy index, the more stressed the household is and therefore the greater the use of coping
strategies in times of food shortage.
Annual Needs and Livelihood Analysis Report March 2013
18
58%
73%
9%
27%
12%
8%
7%
10%
27%
70%
62%
23%
17%
41%
4%
11%
19%
13%
0% 10% 20% 30% 40% 50% 60% 70% 80%
Food too expensive
Human sickness
Insecurity
Livestock disease
Delay of rains
Late food aid distribution
Lack of free access
Others
Floods
Oct-11 Oct-12
3.6 Household shocks and effect on food insecurity in 2012
Figure 3: Percent of households reporting shocks 2009-2012 The persistently high levels of food insecurity in South Sudan is largely attributable to structural causes such as low agricultural productivity and income, low human capital-knowledge and skills, limited access to social facilities and high diseases burden and poor market integration. These structural factors are exacerbated by frequent exposure to multiple shocks
6
(Figure 3). In general, shocks affecting households showed a correlation with rainfall patterns. For example, 2012 recorded a decrease in ‘delay of rainfall’ as a shock compared to 2011 whereas there was an increase in households reporting human sickness, increase in livestock diseases as well as flooding as shocks, a reflection of a relatively high rainfall experienced during the year that led to localized floods and some other disasters. The shocks experienced in 2012 remain broadly the same those experienced in previous years thought high food prices have become more prominent especially mainly due to disruption of border trade between South Sudan and Sudan since May 2011. This explains why the households in the border states (North Bahr el Ghazal, Warrap, West Bahrel Ghazal, Upper Nile) were more likely to have reported higher food prices as a shock than other areas Overall, households that experience a shock are 1.3 times more likely to have been severely food insecure than households that had not experienced a shock (FSMS Report, Octoober 2012).
6 The shocks and structural factors are discussed in detail in ANLA 2010/11.
Annual Needs and Livelihood Analysis Report March 2013
19
37%
33%
33%
19%
25%
17%
11%
4%
8%
26%
24%
24%
18%
18%
11%
7%
4%
5%
0% 5% 10% 15% 20% 25% 30% 35% 40%
Less preferred food
Reduce number of meals
Limit portion size
Restrict adult consumption
Borrow food
Skip entire days without food
Collect unusual wild foods
Sell more animals
Consume seed stocks
% of HHs
Oct-12 Oct-11 Oct-10
3.7 Coping strategies used
Four in ten (39 percent) households experienced difficulties in accessing food during the week preceding the most recent FSMS assessment (October 2012). To cope, over a quarter (26 percent) relied on less preferred food, 24 percent reduced the number of meals eaten in a day and same proportion limited their portion sizes, 18 percent restricted adult consumption and similar proportion borrowed food while 11 percent of the households skipped an entire day without food during the day. Overall, 97 percent of households are applying low level coping strategies in 2012 compared to 93 percent in 2011. There was also a decline in the proportion of households with medium coping strategy index from 7 percent in 2011 to only 2 percent in 2012.The Coping Strategy Index
7 is significantly lower than in 2011, from 15.0 to 8.0, which reflects some improvement in food
security. However, Jonglei, Lakes and Warrap states shows above average CSI similar to those experienced in 2011 (at CSI of 15, 16 and 12 respectively). Severely food insecure households have proportionately higher coping strategy indices (almost twice as high at 13.4 versus 6.8) than households with acceptable food consumption scores. The CSI was also compared across income sources profiles. Households whose main income source are unstable such as sale of firewood or poles have higher CSI at 8.8 (nearly 1.5 times) than those that rely on salaried work or 1.4 times higher than those that rely on sale of own crop produce. Households whose main income source is sale of livestock and its products have the highest CSI at 10.5 followed by those that rely on sale of alcohol.
3.8 Programmatic implications of the profiles of food insecure households
Poverty remains widespread in the country. Additionally, households, regardless of food security status, depend mainly on markets and own food production as their main food source. The data also points out that the more diversified a household income sources is, the more likely it is to be more food secure. Also food insecure households are more likely to have less diversified diet compared to their food secure counterparts. These observations have the following implications on programming:
Since poverty is widespread, implementation of social protection programmes need to be considered. These include:
o Targeted public works programmes.
7 CSI is based on the frequency and severity of copying strategies for households reporting food consumption
problems.
Figure 4: Coping strategies used by households (FSMS) in October 2010 and 2011
Annual Needs and Livelihood Analysis Report March 2013
20
o Generating employment opportunities and diversified income sources for the poor through public works.
o Improving road infrastructure and market access. o Seasonal income support activities specifically targeting areas affected by seasonal shocks. o Specific agricultural approaches to improve crop diversity accompanied by community awareness to
increase intake of diversified diets
Strengthening access to markets through road linkages with producing areas: Markets and own food productions are the primary sources of food at household level. Markets are not well developed in South Sudan. The high prices prevalent in the country are mainly a consequence of poor road connectivity. Moreover, understanding of the market functioning is still relatively poor in most areas of the country.
o There is an urgent need to engage partners on construction of rural access roads especially the community managed access roads and well as feeder roads that link markets with the farming communities
o There is also need for a deliberate study aimed at in-depth understanding of market functioning in South Sudan.
A long term strategy towards the eradication of poverty and food insecurity in South Sudan must focus on improving primary and secondary education as well as providing vocational training opportunities. This should include programmes such as:
o Skills development of young people. o Encourage enrolment in primary education, with particular focus on girls in order for them to
develop as mothers with better knowledge on dietary practices. o Re‐invigorate adult literacy classes especially targeting women in the reproductive ages.
Food diversification programmes: Poor dietary diversity is prevalent in most communities within the Country. Even in post harvest seasons, the households diets is always lopsided—dominated by cereal intake while consumption of micronutrient rich foods remain low. Thus,
o There is need to encourage crop diversification programmes including kitchen gardening o Initiate programmes that encourage and sensitize community on benefits of appropriate and
adequate diet.
Annual Needs and Livelihood Analysis Report March 2013
21
4 Agriculture
4.1 Potential
The potential for agricultural growth remains very huge, with about half of the total 82 million hectares of
agricultural land being suitable for agricultural production. The remaining half is composed of marginal arable land,
forests and wetlands. Thus, the country has potential to produce surpluses of cereal and legume crops, and other
valuable cash crops. The potential for irrigated agriculture is also huge with the presence of the river Nile, the
world’s most extensive wetlands. The Sudd that includes several swamps and a number of river tributaries
provides an expansive irrigation capacity in six states (EES, CES, Lakes, Jonglei, Unity and Upper Nile). However, the
cultivation is still mainly rain-fed8, and irrigation would increase arable land and extend growing seasons.
Moreover, despite having vast agricultural land, only 4.5 percent is cultivated9.
A large proportion of the economically active population of South Sudan is engaged either directly or indirectly in
smallholder subsistence agriculture or fisheries. According to the South Sudan National Census-200910
, about two-
thirds (61.8 percent) of South Sudanese are dependent on agricultural production for their livelihoods.
For sustainable food security, the country has to ensure that sufficient quantities of food are available through
agricultural production and commercial imports. For most rural areas, low and/or variable agricultural production
is still a key limiting factor in food and nutrition security. This has been characterized by varying but generally low
cereal production due to several factors including limited inputs, unfavorable weather conditions (erratic rainfall
and dry spells and floods; poor physical infrastructure for connectivity to markets, low agricultural extension
services; skills and knowledge development) as well as ethnic conflicts which have in most cases disrupted the
farming activities among others.
Production of South Sudan’s main staple crops—sorghum, maize and cassava—is mainly a subsistence activity.
Sorghum is usually harvested between July and December depending on the region. In most cases, subsistence
farmers tend to sell their surplus produce immediately after the harvest in order to settle accumulated debts.
However, in South Sudan, this is hindered by poor road connectivity to markets.
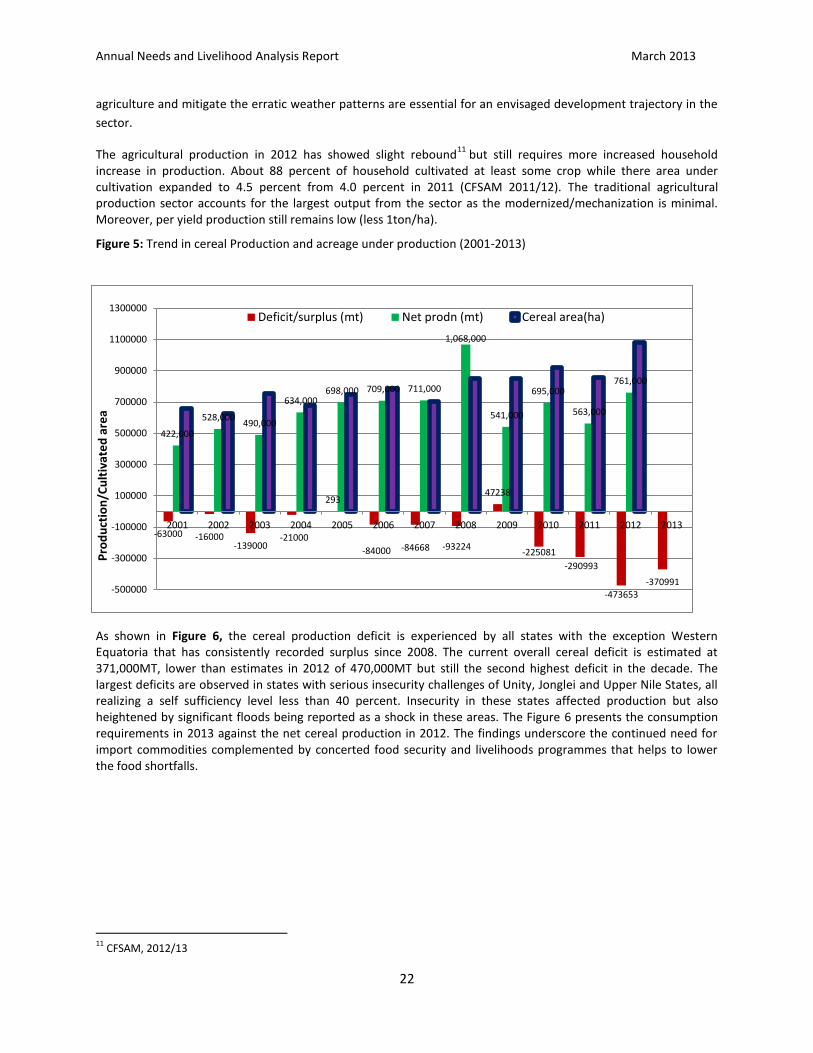
4.2 Trends in agriculture production
Over the last decade, with exception of 2004 and 2008 when a cereal production surplus was recorded, all the
years have witnessed a deficit (Figure 5) that has to be met by either commercial imports or humanitarian
assistance. South Sudan has witnessed significant increase in population from 6.4 million people in 2001 to about
10 million in 2012–largely due to the influx of returnees and refugees. On the other hand, growth in cereal
production has somewhat stagnated. Thus, the deficit hit a record deficit of 475,000MT in 2012. Due to erratic
weather conditions characterized by drought and floods, a relatively good production year has been immediately
followed by poor production. For instance, whereas net production was positive in 2009 and eliminated any deficit
during that year, in 2009/10 the country suffered severe drought and production declined to almost half of what
was realized in the previous year (just about 540 000 MT) leading to a huge deficit in 2010. Although the CFSAM
2013 reveals an improvement to a net production of about 761,000 MT, it is by far below the current consumption
requirements. These trends reveal that expansion of agriculture in scale and productivity cannot keep pace with
the population growth and the existing food gap is likely to continue increasing unless the structural problems to
agriculture are resolved. Interventions like expanding irrigation schemes to reduce dependence on rain-fed
8 Annual Needs and Livelihood Analysis (ANLA) Report, 2011/12.
9 FAO Land Cover Database, 2010.
10 Cited in the Report on Food Security and Nutrition in South Sudan, 2012
Annual Needs and Livelihood Analysis Report March 2013
22
-63000 -16000 -139000
-21000
293
-84000 -84668 -93224
47238
-225081
-290993
-473653
-370991
422,000
528,000 490,000
634,000 698,000 709,000 711,000
1,068,000
541,000
695,000
563,000
761,000
-500000
-300000
-100000
100000
300000
500000
700000
900000
1100000
1300000
2001 2002 2003 2004 2005 2006 2007 2008 2009 2010 2011 2012 2013
Pro
du
ctio
n/C
ult
ivat
ed
are
a
Deficit/surplus (mt) Net prodn (mt) Cereal area(ha)
agriculture and mitigate the erratic weather patterns are essential for an envisaged development trajectory in the
sector.
The agricultural production in 2012 has showed slight rebound11
but still requires more increased household increase in production. About 88 percent of household cultivated at least some crop while there area under cultivation expanded to 4.5 percent from 4.0 percent in 2011 (CFSAM 2011/12). The traditional agricultural production sector accounts for the largest output from the sector as the modernized/mechanization is minimal. Moreover, per yield production still remains low (less 1ton/ha).
Figure 5: Trend in cereal Production and acreage under production (2001-2013)
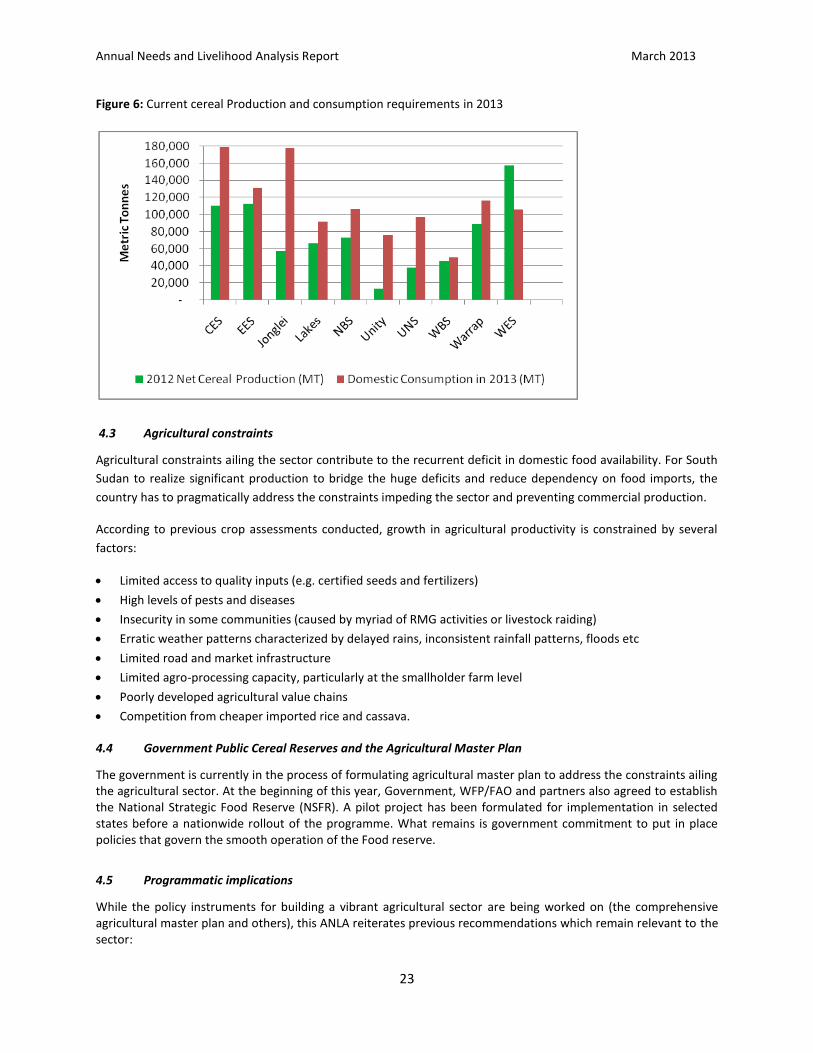
As shown in Figure 6, the cereal production deficit is experienced by all states with the exception Western Equatoria that has consistently recorded surplus since 2008. The current overall cereal deficit is estimated at 371,000MT, lower than estimates in 2012 of 470,000MT but still the second highest deficit in the decade. The largest deficits are observed in states with serious insecurity challenges of Unity, Jonglei and Upper Nile States, all realizing a self sufficiency level less than 40 percent. Insecurity in these states affected production but also heightened by significant floods being reported as a shock in these areas. The Figure 6 presents the consumption requirements in 2013 against the net cereal production in 2012. The findings underscore the continued need for import commodities complemented by concerted food security and livelihoods programmes that helps to lower the food shortfalls.
11
CFSAM, 2012/13
Annual Needs and Livelihood Analysis Report March 2013
23
Figure 6: Current cereal Production and consumption requirements in 2013
4.3 Agricultural constraints
Agricultural constraints ailing the sector contribute to the recurrent deficit in domestic food availability. For South
Sudan to realize significant production to bridge the huge deficits and reduce dependency on food imports, the
country has to pragmatically address the constraints impeding the sector and preventing commercial production.
According to previous crop assessments conducted, growth in agricultural productivity is constrained by several
factors:
Limited access to quality inputs (e.g. certified seeds and fertilizers)
High levels of pests and diseases
Insecurity in some communities (caused by myriad of RMG activities or livestock raiding)
Erratic weather patterns characterized by delayed rains, inconsistent rainfall patterns, floods etc
Limited road and market infrastructure
Limited agro-processing capacity, particularly at the smallholder farm level
Poorly developed agricultural value chains
Competition from cheaper imported rice and cassava.
4.4 Government Public Cereal Reserves and the Agricultural Master Plan
The government is currently in the process of formulating agricultural master plan to address the constraints ailing the agricultural sector. At the beginning of this year, Government, WFP/FAO and partners also agreed to establish the National Strategic Food Reserve (NSFR). A pilot project has been formulated for implementation in selected states before a nationwide rollout of the programme. What remains is government commitment to put in place policies that govern the smooth operation of the Food reserve.
4.5 Programmatic implications
While the policy instruments for building a vibrant agricultural sector are being worked on (the comprehensive agricultural master plan and others), this ANLA reiterates previous recommendations which remain relevant to the sector:
Annual Needs and Livelihood Analysis Report March 2013
24
To improve performance in the agricultural sector clearly requires addressing the structural problems of
agriculture. This will require combination of improved agricultural technologies and inputs, skills and
training, infrastructure and policy. The irrigation sector needs to be expanded to cover many areas along
the vast water resources available. This will increase the cropping season.
Evaluate the mechanization programme with the aim of increasing its benefits for south Sudan.
There is need to strengthen research and development for seed improvement and other agricultural technologies that would mitigate against drought and floods (such as drought resistant varieties and increased use of recessional agriculture in flood-prone areas and small-scale irrigation systems). This should also be accompanied by improved extension service to increase agricultural skills.
Establish the national cereal reserve to boost preparedness of GoSS, provide incentives to increase household food production, incomes and enhance domestic food availability. The process of establishing the NFSR needs to be expedited.
There is need to strengthen cross-border trade monitoring to provide information on decision-making for market-based interventions.
Establish and continue supporting rural micro-finance programmes to support small-scale farmers who would like to increase production of food surpluses for purchase programs either by Government or other initiatives such as the WFP’s Purchase for Progress (P4P). Co-operatives and farmer associations would provide entry points for micro-finance and extension programs.
Annual Needs and Livelihood Analysis Report March 2013
25
5. Livestock
5.1 Livestock Potential
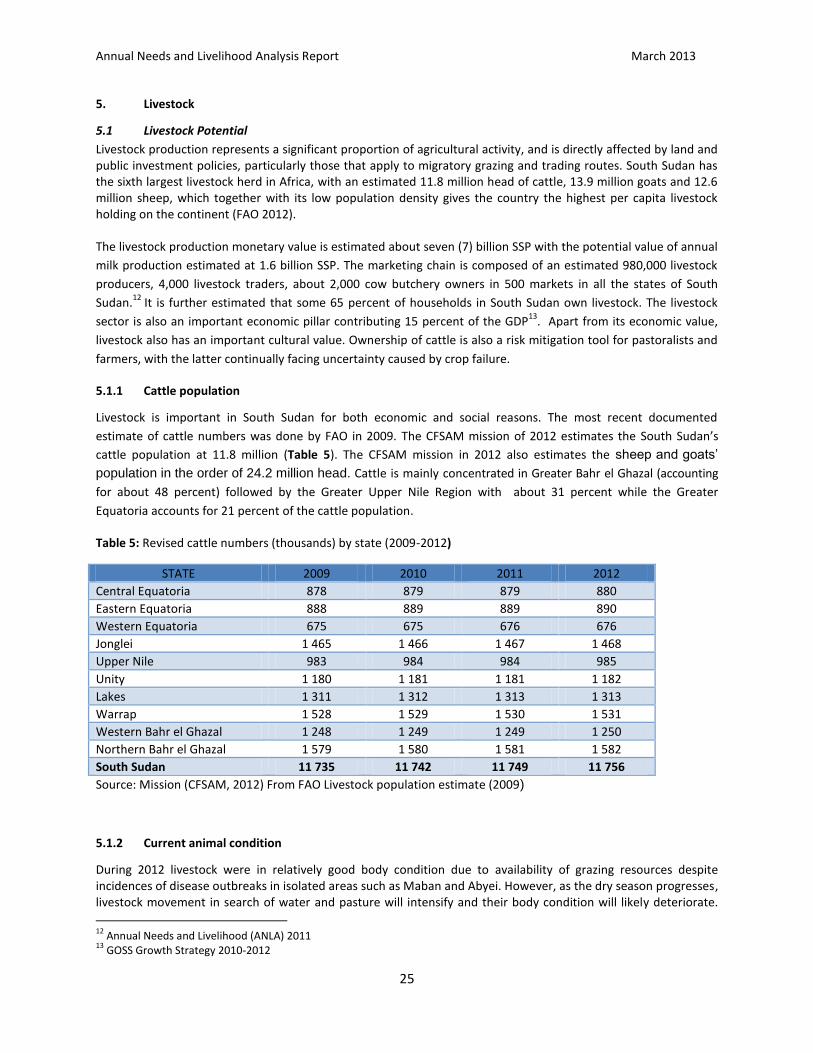
Livestock production represents a significant proportion of agricultural activity, and is directly affected by land and public investment policies, particularly those that apply to migratory grazing and trading routes. South Sudan has the sixth largest livestock herd in Africa, with an estimated 11.8 million head of cattle, 13.9 million goats and 12.6 million sheep, which together with its low population density gives the country the highest per capita livestock holding on the continent (FAO 2012). The livestock production monetary value is estimated about seven (7) billion SSP with the potential value of annual
milk production estimated at 1.6 billion SSP. The marketing chain is composed of an estimated 980,000 livestock
producers, 4,000 livestock traders, about 2,000 cow butchery owners in 500 markets in all the states of South
Sudan.12
It is further estimated that some 65 percent of households in South Sudan own livestock. The livestock
sector is also an important economic pillar contributing 15 percent of the GDP13
. Apart from its economic value,
livestock also has an important cultural value. Ownership of cattle is also a risk mitigation tool for pastoralists and
farmers, with the latter continually facing uncertainty caused by crop failure.
5.1.1 Cattle population
Livestock is important in South Sudan for both economic and social reasons. The most recent documented
estimate of cattle numbers was done by FAO in 2009. The CFSAM mission of 2012 estimates the South Sudan’s
cattle population at 11.8 million (Table 5). The CFSAM mission in 2012 also estimates the sheep and goats’
population in the order of 24.2 million head. Cattle is mainly concentrated in Greater Bahr el Ghazal (accounting
for about 48 percent) followed by the Greater Upper Nile Region with about 31 percent while the Greater
Equatoria accounts for 21 percent of the cattle population.
Table 5: Revised cattle numbers (thousands) by state (2009-2012)
STATE 2009 2010 2011 2012
Central Equatoria 878 879 879 880
Eastern Equatoria 888 889 889 890
Western Equatoria 675 675 676 676
Jonglei 1 465 1 466 1 467 1 468
Upper Nile 983 984 984 985
Unity 1 180 1 181 1 181 1 182
Lakes 1 311 1 312 1 313 1 313
Warrap 1 528 1 529 1 530 1 531
Western Bahr el Ghazal 1 248 1 249 1 249 1 250
Northern Bahr el Ghazal 1 579 1 580 1 581 1 582
South Sudan 11 735 11 742 11 749 11 756
Source: Mission (CFSAM, 2012) From FAO Livestock population estimate (2009)
5.1.2 Current animal condition
During 2012 livestock were in relatively good body condition due to availability of grazing resources despite incidences of disease outbreaks in isolated areas such as Maban and Abyei. However, as the dry season progresses, livestock movement in search of water and pasture will intensify and their body condition will likely deteriorate.
12
Annual Needs and Livelihood (ANLA) 2011 13
GOSS Growth Strategy 2010-2012
Annual Needs and Livelihood Analysis Report March 2013
26
Coupled with disease outbreaks in areas of livestock concentration for grazing resources, households may lose their productive assets through deaths. Livestock out-migration far from homesteads in search of pastures and water will also limit households’ access to regular milk just as conflicts over resources and cattle rustling are likely to increase. This will likely lead to negative consequences on food security especially in areas around Lakes, Warrap, Unity, NBS and Jonglei states.
5.2 Factors affecting Livestock
Some of the main factors affecting the livestock sector are:
Limited government and private sector investments,
Climatic change conditions causing shrinking and degradation of pasture and water resources for livestock production,
Insecurity manifested in cattle rustling, and;
Poor marketing infrastructure and information.
Endemic livestock diseases affecting animal health especially East Coast Fever Foot and Mouth Disease (FMD), contagious bovine pleura‐pneumonia, all lead to poor animal productivity and diminishes the prospects for livestock product exports (FAO/MARF Livestock Assessment Report of 2011).
Other structural challenges affecting livestock include:-
Inadequate veterinary and advisory services,
Low breed potential, traditional husbandry practices,
Seasonal feed and water availability and quality, and
5.2.1 Contribution of livestock in household’s income and food
Livestock plays a vital role in household livelihood. It represents household savings, assets and sources of income.
The average household income from estimated livestock sale per annum is estimated at SSP 1,500. Goats and
other ruminants provide a very important source of protein for majority of households.
5.3 Livestock value chain in South Sudan
The concept of value chain is mainly centred on the series of activities that have been performed by chain actors to
transform the products from raw material to products which can be consumed by consumers. This involves input
supplying, producing, assembling or collection, trading, processing, whole selling, retailing and consuming.
Livestock value chain is broad value and can be analysed along livestock subsector such as poultry, dairy and meat
value chain.
Whereas livestock value chain is broad based and can be analyzed along livestock subsectors such as poultry, diary
and meat value chain, however, all of these subsectors in the context of South Sudan still remain largely under
developed across the Country. Perhaps, the biggest most used yet unattended to sub sector is that of (meat value
chain/slaughtering process). This needs more urgent redress in the following areas if quality and human safety
measure to the production and consumption of meat across the country is to be achieved14
. These constrains
include:-
Poor infrastructure (roads and slaughter slabs).
Cattle rustling and insecurity.
14
Report on value chain study for livestock sector in five States of South Sudan-MARF/MDTF with focus on Red
meat-November 2010.
Annual Needs and Livelihood Analysis Report March 2013
27
Poor management of livestock system.
Poor livestock marketing infrastructure and market information system.
Multiple clearance checkpoints and roadblocks.
Inadequate meat inspection services and low knowledge and skill level of meat inspectors.
Poor enforcement of quality standards in both processing and retailing functions in meat value chain.
5.4 Programmatic implications
The following are some immediate response options in the livestock sector to support resilience of pastoral communities. These responses include: • Improving milk production and promoting marketing of milk and dairy products including milk hygiene and
safety. • Livestock marketing and meat handling and hygiene. • Improving animal disease monitoring and surveillance and to ensure effective disease prevention and control
measures. • Promotion of pastoralist field schools to build critical mass of change agents. • Develop pastoralist early warning system indicators as precursors for destocking. • There is need to enact policies that promote local entrepreneurs in the fields of local poultry farming • Need to establish demonstration farms in major urban areas to provided technical skills in this sector. • Deliberately provide measures to address livestock value chain in their various sub sectors.
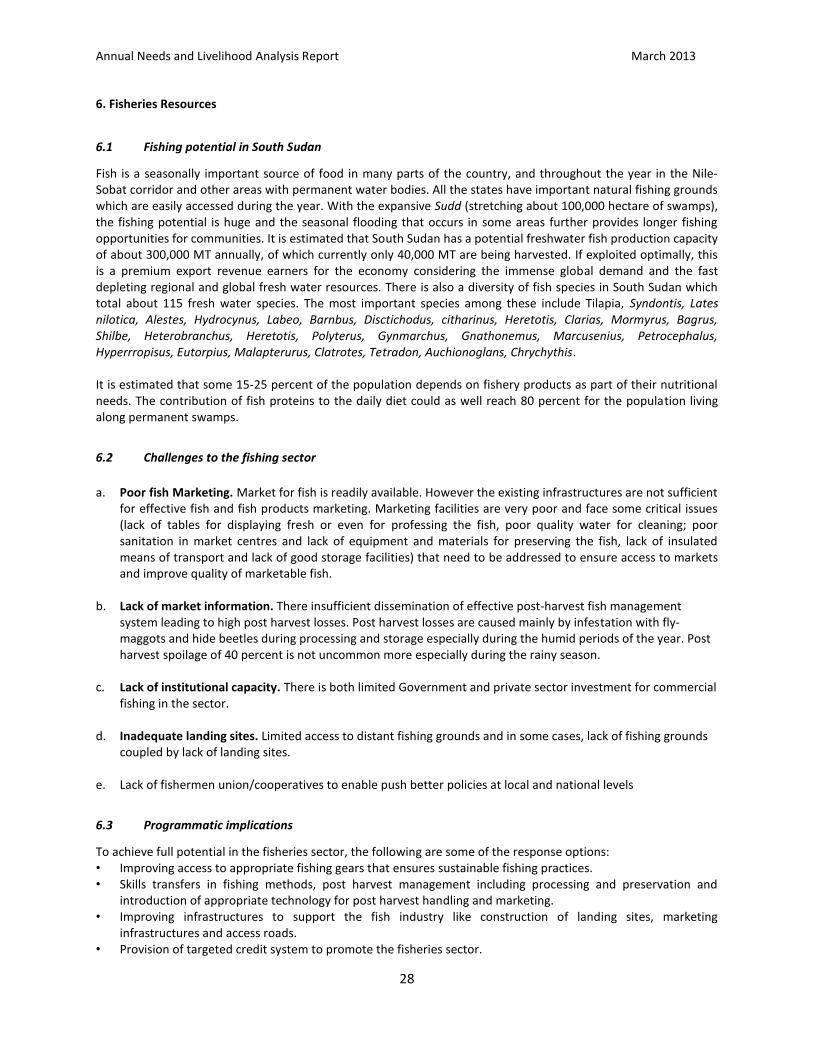
Annual Needs and Livelihood Analysis Report March 2013
28
6. Fisheries Resources
6.1 Fishing potential in South Sudan
Fish is a seasonally important source of food in many parts of the country, and throughout the year in the Nile‐Sobat corridor and other areas with permanent water bodies. All the states have important natural fishing grounds which are easily accessed during the year. With the expansive Sudd (stretching about 100,000 hectare of swamps), the fishing potential is huge and the seasonal flooding that occurs in some areas further provides longer fishing opportunities for communities. It is estimated that South Sudan has a potential freshwater fish production capacity of about 300,000 MT annually, of which currently only 40,000 MT are being harvested. If exploited optimally, this is a premium export revenue earners for the economy considering the immense global demand and the fast depleting regional and global fresh water resources. There is also a diversity of fish species in South Sudan which total about 115 fresh water species. The most important species among these include Tilapia, Syndontis, Lates nilotica, Alestes, Hydrocynus, Labeo, Barnbus, Disctichodus, citharinus, Heretotis, Clarias, Mormyrus, Bagrus, Shilbe, Heterobranchus, Heretotis, Polyterus, Gynmarchus, Gnathonemus, Marcusenius, Petrocephalus, Hyperrropisus, Eutorpius, Malapterurus, Clatrotes, Tetradon, Auchionoglans, Chrychythis. It is estimated that some 15-25 percent of the population depends on fishery products as part of their nutritional needs. The contribution of fish proteins to the daily diet could as well reach 80 percent for the population living along permanent swamps.
6.2 Challenges to the fishing sector
a. Poor fish Marketing. Market for fish is readily available. However the existing infrastructures are not sufficient
for effective fish and fish products marketing. Marketing facilities are very poor and face some critical issues (lack of tables for displaying fresh or even for professing the fish, poor quality water for cleaning; poor sanitation in market centres and lack of equipment and materials for preserving the fish, lack of insulated means of transport and lack of good storage facilities) that need to be addressed to ensure access to markets and improve quality of marketable fish.
b. Lack of market information. There insufficient dissemination of effective post‐harvest fish management system leading to high post harvest losses. Post harvest losses are caused mainly by infestation with fly‐maggots and hide beetles during processing and storage especially during the humid periods of the year. Post harvest spoilage of 40 percent is not uncommon more especially during the rainy season.
c. Lack of institutional capacity. There is both limited Government and private sector investment for commercial fishing in the sector.
d. Inadequate landing sites. Limited access to distant fishing grounds and in some cases, lack of fishing grounds coupled by lack of landing sites.
e. Lack of fishermen union/cooperatives to enable push better policies at local and national levels
6.3 Programmatic implications
To achieve full potential in the fisheries sector, the following are some of the response options: • Improving access to appropriate fishing gears that ensures sustainable fishing practices. • Skills transfers in fishing methods, post harvest management including processing and preservation and
introduction of appropriate technology for post harvest handling and marketing. • Improving infrastructures to support the fish industry like construction of landing sites, marketing
infrastructures and access roads. • Provision of targeted credit system to promote the fisheries sector.
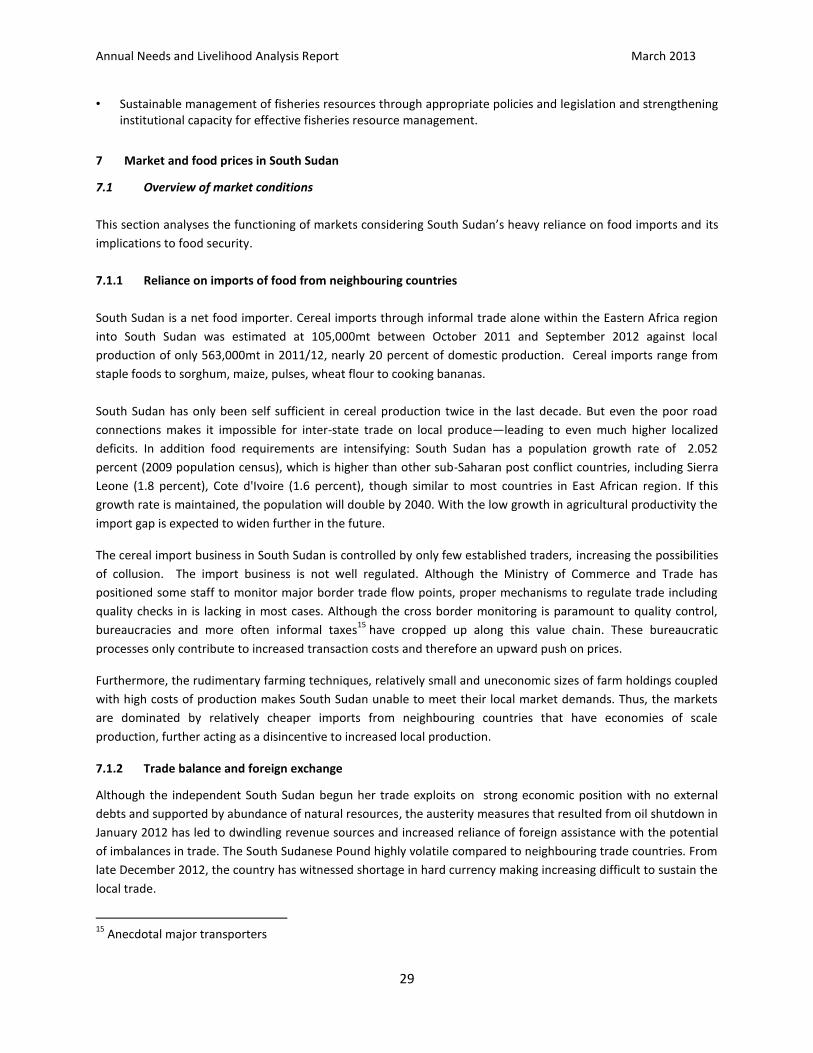
Annual Needs and Livelihood Analysis Report March 2013
29
• Sustainable management of fisheries resources through appropriate policies and legislation and strengthening institutional capacity for effective fisheries resource management.
7 Market and food prices in South Sudan
7.1 Overview of market conditions
This section analyses the functioning of markets considering South Sudan’s heavy reliance on food imports and its
implications to food security.
7.1.1 Reliance on imports of food from neighbouring countries
South Sudan is a net food importer. Cereal imports through informal trade alone within the Eastern Africa region
into South Sudan was estimated at 105,000mt between October 2011 and September 2012 against local
production of only 563,000mt in 2011/12, nearly 20 percent of domestic production. Cereal imports range from
staple foods to sorghum, maize, pulses, wheat flour to cooking bananas.
South Sudan has only been self sufficient in cereal production twice in the last decade. But even the poor road
connections makes it impossible for inter-state trade on local produce—leading to even much higher localized
deficits. In addition food requirements are intensifying: South Sudan has a population growth rate of 2.052
percent (2009 population census), which is higher than other sub-Saharan post conflict countries, including Sierra
Leone (1.8 percent), Cote d'Ivoire (1.6 percent), though similar to most countries in East African region. If this
growth rate is maintained, the population will double by 2040. With the low growth in agricultural productivity the
import gap is expected to widen further in the future.
The cereal import business in South Sudan is controlled by only few established traders, increasing the possibilities
of collusion. The import business is not well regulated. Although the Ministry of Commerce and Trade has
positioned some staff to monitor major border trade flow points, proper mechanisms to regulate trade including
quality checks in is lacking in most cases. Although the cross border monitoring is paramount to quality control,
bureaucracies and more often informal taxes15
have cropped up along this value chain. These bureaucratic
processes only contribute to increased transaction costs and therefore an upward push on prices.
Furthermore, the rudimentary farming techniques, relatively small and uneconomic sizes of farm holdings coupled
with high costs of production makes South Sudan unable to meet their local market demands. Thus, the markets
are dominated by relatively cheaper imports from neighbouring countries that have economies of scale
production, further acting as a disincentive to increased local production.
7.1.2 Trade balance and foreign exchange
Although the independent South Sudan begun her trade exploits on strong economic position with no external
debts and supported by abundance of natural resources, the austerity measures that resulted from oil shutdown in
January 2012 has led to dwindling revenue sources and increased reliance of foreign assistance with the potential
of imbalances in trade. The South Sudanese Pound highly volatile compared to neighbouring trade countries. From
late December 2012, the country has witnessed shortage in hard currency making increasing difficult to sustain the
local trade.
15
Anecdotal major transporters
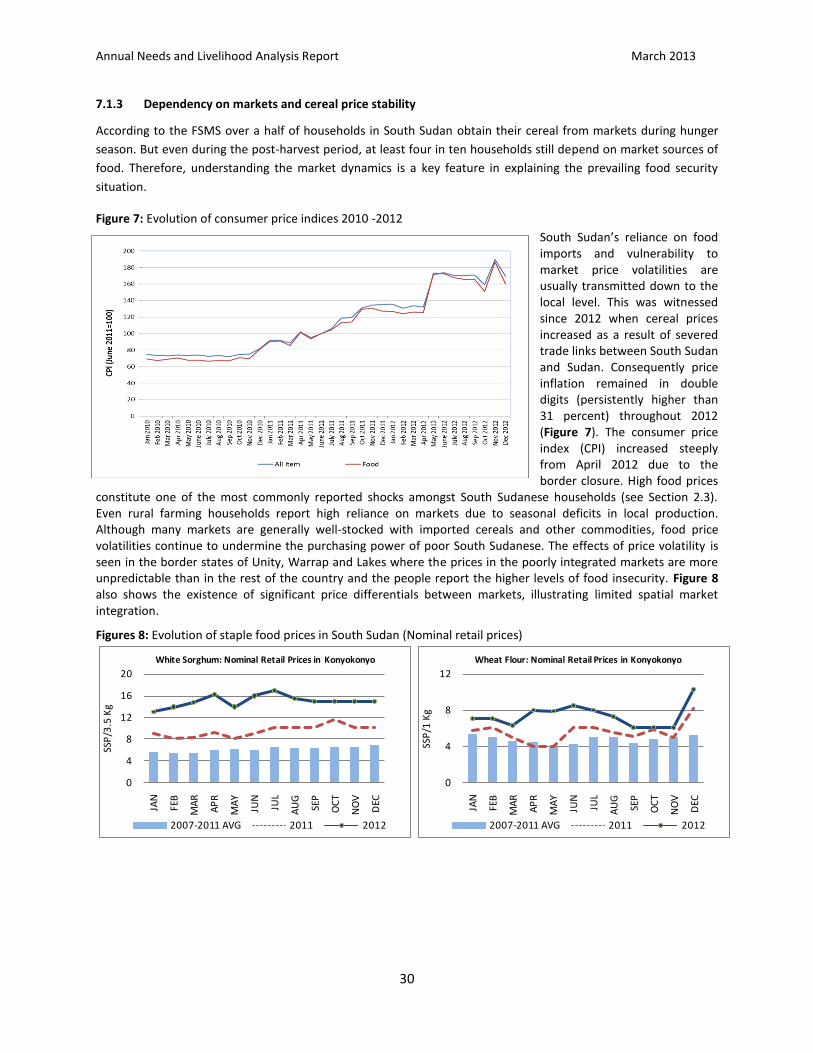
Annual Needs and Livelihood Analysis Report March 2013
30
7.1.3 Dependency on markets and cereal price stability
According to the FSMS over a half of households in South Sudan obtain their cereal from markets during hunger
season. But even during the post-harvest period, at least four in ten households still depend on market sources of
food. Therefore, understanding the market dynamics is a key feature in explaining the prevailing food security
situation.
Figure 7: Evolution of consumer price indices 2010 -2012
South Sudan’s reliance on food imports and vulnerability to market price volatilities are usually transmitted down to the local level. This was witnessed since 2012 when cereal prices increased as a result of severed trade links between South Sudan and Sudan. Consequently price inflation remained in double digits (persistently higher than 31 percent) throughout 2012 (Figure 7). The consumer price index (CPI) increased steeply from April 2012 due to the border closure. High food prices
constitute one of the most commonly reported shocks amongst South Sudanese households (see Section 2.3). Even rural farming households report high reliance on markets due to seasonal deficits in local production. Although many markets are generally well-stocked with imported cereals and other commodities, food price volatilities continue to undermine the purchasing power of poor South Sudanese. The effects of price volatility is seen in the border states of Unity, Warrap and Lakes where the prices in the poorly integrated markets are more unpredictable than in the rest of the country and the people report the higher levels of food insecurity. Figure 8 also shows the existence of significant price differentials between markets, illustrating limited spatial market integration.
Figures 8: Evolution of staple food prices in South Sudan (Nominal retail prices)
0
4
8
12
16
20
JAN
FEB
MA
R
AP
R
MA
Y
JUN
JUL
AU
G
SEP
OC
T
NO
V
DEC
SSP
/3.5
Kg
White Sorghum: Nominal Retail Prices in Konyokonyo
2007-2011 AVG 2011 2012
0
4
8
12
JAN
FEB
MA
R
AP
R
MA
Y
JUN
JUL
AU
G
SEP
OC
T
NO
V
DEC
SSP
/1 K
g
Wheat Flour: Nominal Retail Prices in Konyokonyo
2007-2011 AVG 2011 2012
Annual Needs and Livelihood Analysis Report March 2013
31
0
4
8
12
16
20
24
JAN
FEB
MA
R
AP
R
MA
Y
JUN
JUL
AU
G
SEP
OC
T
NO
V
DEC
SSP
/3.5
Kg
White Sorghum: Nominal Retail Prices in Bor
2007-2011 AVG 2011 2012
0
4
8
12
16
JAN
FEB
MA
R
AP
R
MA
Y
JUN
JUL
AU
G
SEP
OC
T
NO
V
DEC
SSP
/1 K
g
Wheat Flour: Nominal Retail Prices in Bor
2007-2011 AVG 2011 2012
0
4
8
12
16
20
24
JAN
FEB
MA
R
AP
R
MA
Y
JUN
JUL
AU
G
SEP
OC
T
NO
V
DEC
SSP
/3.5
Kg
White Sorghum: Nominal Retail Prices in Aweil Town
2007-2011 AVG 2011 2012
0
4
8
12
16
JAN
FEB
MA
R
AP
R
MA
Y
JUN
JUL
AU
G
SEP
OC
T
NO
V
DEC
SSP
/1 K
g
Wheat Flour: Nominal Retail Prices in Aweil Town
2007-2011 AVG 2011 2012
048
121620242832
JAN
FEB
MA
R
AP
R
MA
Y
JUN
JUL
AU
G
SEP
OC
T
NO
V
DEC
SSP
/3.5
Kg
White Sorghum: Nominal Retail Prices in Malakal
2007-2011 AVG 2011 2012
0
4
8
12
16
JAN
FEB
MA
R
AP
R
MA
Y
JUN
JUL
AU
G
SEP
OC
T
NO
V
DEC
SSP
/1 K
g
Wheat Flour: Nominal Retail Prices in Malakal
2007-2011 AVG 2011 2012
048
12162024283236404448
JAN
FEB
MA
R
AP
R
MA
Y
JUN
JUL
AU
G
SEP
OC
T
NO
V
DEC
SSP
/3.5
Kg
White Sorghum: Nominal Retail Prices in Rumbek
2007-2011 AVG 2011 2012
048
121620242832
JAN
FEB
MA
R
AP
R
MA
Y
JUN
JUL
AU
G
SEP
OC
T
NO
V
DEC
SSP
/1 K
g
Wheat Flour: Nominal Retail Prices in Rumbek
2007-2011 AVG 2011 2012
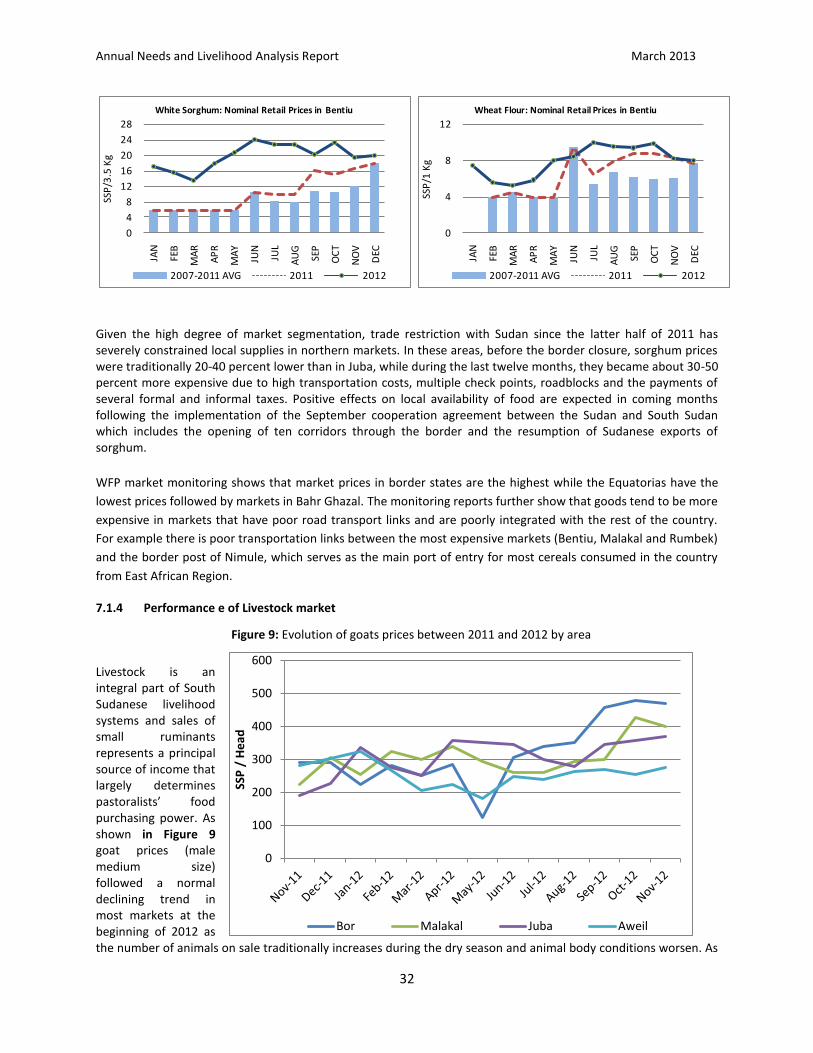
Annual Needs and Livelihood Analysis Report March 2013
32
0
100
200
300
400
500
600
SSP
/ H
ead
Bor Malakal Juba Aweil
Given the high degree of market segmentation, trade restriction with Sudan since the latter half of 2011 has severely constrained local supplies in northern markets. In these areas, before the border closure, sorghum prices were traditionally 20-40 percent lower than in Juba, while during the last twelve months, they became about 30-50 percent more expensive due to high transportation costs, multiple check points, roadblocks and the payments of several formal and informal taxes. Positive effects on local availability of food are expected in coming months following the implementation of the September cooperation agreement between the Sudan and South Sudan which includes the opening of ten corridors through the border and the resumption of Sudanese exports of sorghum.
WFP market monitoring shows that market prices in border states are the highest while the Equatorias have the
lowest prices followed by markets in Bahr Ghazal. The monitoring reports further show that goods tend to be more
expensive in markets that have poor road transport links and are poorly integrated with the rest of the country.
For example there is poor transportation links between the most expensive markets (Bentiu, Malakal and Rumbek)
and the border post of Nimule, which serves as the main port of entry for most cereals consumed in the country
from East African Region.
7.1.4 Performance e of Livestock market
Figure 9: Evolution of goats prices between 2011 and 2012 by area
Livestock is an integral part of South Sudanese livelihood systems and sales of small ruminants represents a principal source of income that largely determines pastoralists’ food purchasing power. As shown in Figure 9 goat prices (male medium size) followed a normal declining trend in most markets at the beginning of 2012 as the number of animals on sale traditionally increases during the dry season and animal body conditions worsen. As
0
4
8
12
16
20
24
28
JAN
FEB
MA
R
AP
R
MA
Y
JUN
JUL
AU
G
SEP
OC
T
NO
V
DEC
SSP
/3.5
Kg
White Sorghum: Nominal Retail Prices in Bentiu
2007-2011 AVG 2011 2012
0
4
8
12
JAN
FEB
MA
R
AP
R
MA
Y
JUN
JUL
AU
G
SEP
OC
T
NO
V
DEC
SSP
/1 K
g
Wheat Flour: Nominal Retail Prices in Bentiu
2007-2011 AVG 2011 2012
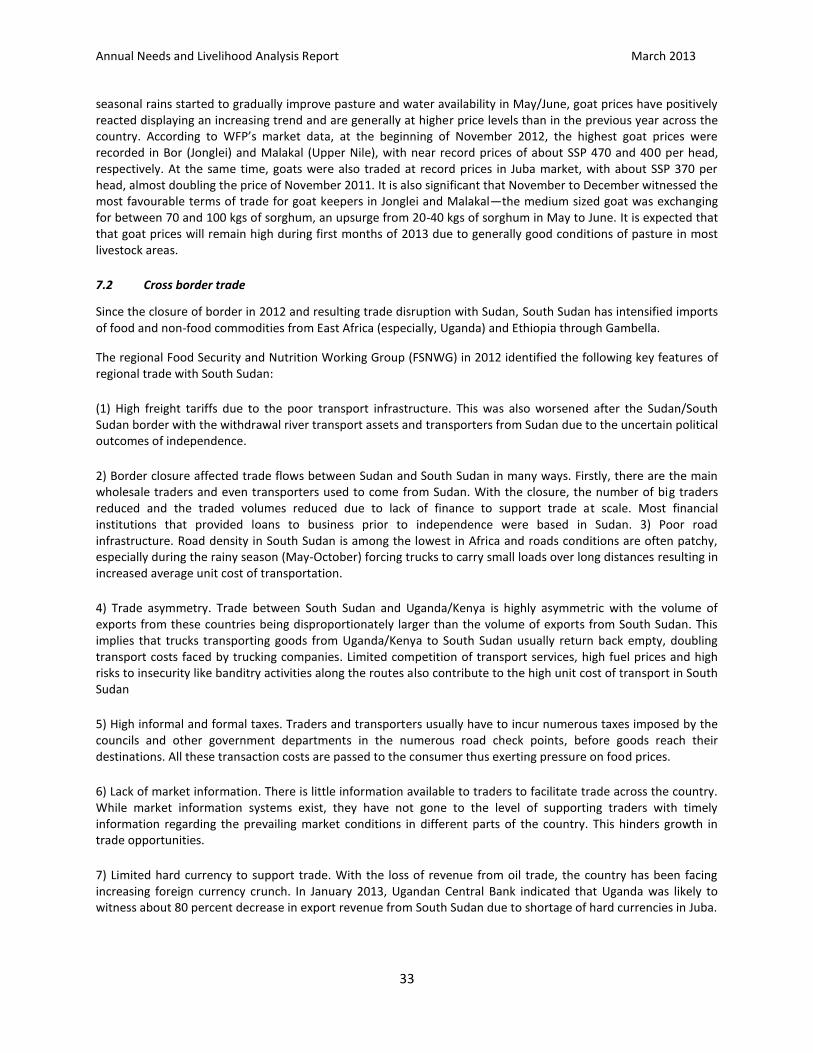
Annual Needs and Livelihood Analysis Report March 2013
33
seasonal rains started to gradually improve pasture and water availability in May/June, goat prices have positively reacted displaying an increasing trend and are generally at higher price levels than in the previous year across the country. According to WFP’s market data, at the beginning of November 2012, the highest goat prices were recorded in Bor (Jonglei) and Malakal (Upper Nile), with near record prices of about SSP 470 and 400 per head, respectively. At the same time, goats were also traded at record prices in Juba market, with about SSP 370 per head, almost doubling the price of November 2011. It is also significant that November to December witnessed the most favourable terms of trade for goat keepers in Jonglei and Malakal—the medium sized goat was exchanging for between 70 and 100 kgs of sorghum, an upsurge from 20-40 kgs of sorghum in May to June. It is expected that that goat prices will remain high during first months of 2013 due to generally good conditions of pasture in most livestock areas.
7.2 Cross border trade
Since the closure of border in 2012 and resulting trade disruption with Sudan, South Sudan has intensified imports of food and non-food commodities from East Africa (especially, Uganda) and Ethiopia through Gambella.
The regional Food Security and Nutrition Working Group (FSNWG) in 2012 identified the following key features of regional trade with South Sudan:
(1) High freight tariffs due to the poor transport infrastructure. This was also worsened after the Sudan/South Sudan border with the withdrawal river transport assets and transporters from Sudan due to the uncertain political outcomes of independence.
2) Border closure affected trade flows between Sudan and South Sudan in many ways. Firstly, there are the main wholesale traders and even transporters used to come from Sudan. With the closure, the number of big traders reduced and the traded volumes reduced due to lack of finance to support trade at scale. Most financial institutions that provided loans to business prior to independence were based in Sudan. 3) Poor road infrastructure. Road density in South Sudan is among the lowest in Africa and roads conditions are often patchy, especially during the rainy season (May-October) forcing trucks to carry small loads over long distances resulting in increased average unit cost of transportation.
4) Trade asymmetry. Trade between South Sudan and Uganda/Kenya is highly asymmetric with the volume of exports from these countries being disproportionately larger than the volume of exports from South Sudan. This implies that trucks transporting goods from Uganda/Kenya to South Sudan usually return back empty, doubling transport costs faced by trucking companies. Limited competition of transport services, high fuel prices and high risks to insecurity like banditry activities along the routes also contribute to the high unit cost of transport in South Sudan
5) High informal and formal taxes. Traders and transporters usually have to incur numerous taxes imposed by the councils and other government departments in the numerous road check points, before goods reach their destinations. All these transaction costs are passed to the consumer thus exerting pressure on food prices.
6) Lack of market information. There is little information available to traders to facilitate trade across the country. While market information systems exist, they have not gone to the level of supporting traders with timely information regarding the prevailing market conditions in different parts of the country. This hinders growth in trade opportunities.
7) Limited hard currency to support trade. With the loss of revenue from oil trade, the country has been facing increasing foreign currency crunch. In January 2013, Ugandan Central Bank indicated that Uganda was likely to witness about 80 percent decrease in export revenue from South Sudan due to shortage of hard currencies in Juba.
Annual Needs and Livelihood Analysis Report March 2013
34
7.3 Market outlook
• Food commodity prices (especially white sorghum and wheat flour) will remain higher than the 5yr average
and 2011 in Border States (see price trends in Bentiu and Aweil markets) as imports reduce due to shortage of
hard currency
• The flow food commodities to border states will still be affected since though the border closure is officially
lifted, there is minimal activity between the two countries mainly due to the continued border tensions.
• While accessibility will improve during the dry season to allow for transportation of supplies from East Africa,
prices are likely to remain high as the other impediments like the informal check-points exist, lack of large
organized importers that can source in bulk (compared to the previous situation when major importers from
Sudan used to operate at large scale.
7.4 Programme implications
Given the critical role played by markets in ensuring food availability and accessibility to households, measures
that incrementally enhance market functioning are needed. These could include:
• Provision of working capital to traders by financial institutions. While acknowledging the low development
of financial institutions, organizations could assist by through micro-financing;
• Deliberate advocacy to reduce informal and some formal taxes by the government departments would
greatly assist in lowering the costs of trade. The government may need to instil some discipline within the
local authority and departments to reduce bureaucratic red-tapes and streamline revenue collection to
avoid multiple and illegal taxation.
• Programmes to increase physical access through trunk and feeder roads to improve the flow of food
commodities as well as lower average unit cost of transportation.
• Strengthening market information systems including a detailed study to understand the market
functioning and linkages in different parts of the country.
• Market-based interventions such as voucher for work scheme, support to women groups as local market
actors or cash for work activities depending on seasonality and market functioning in a given location.
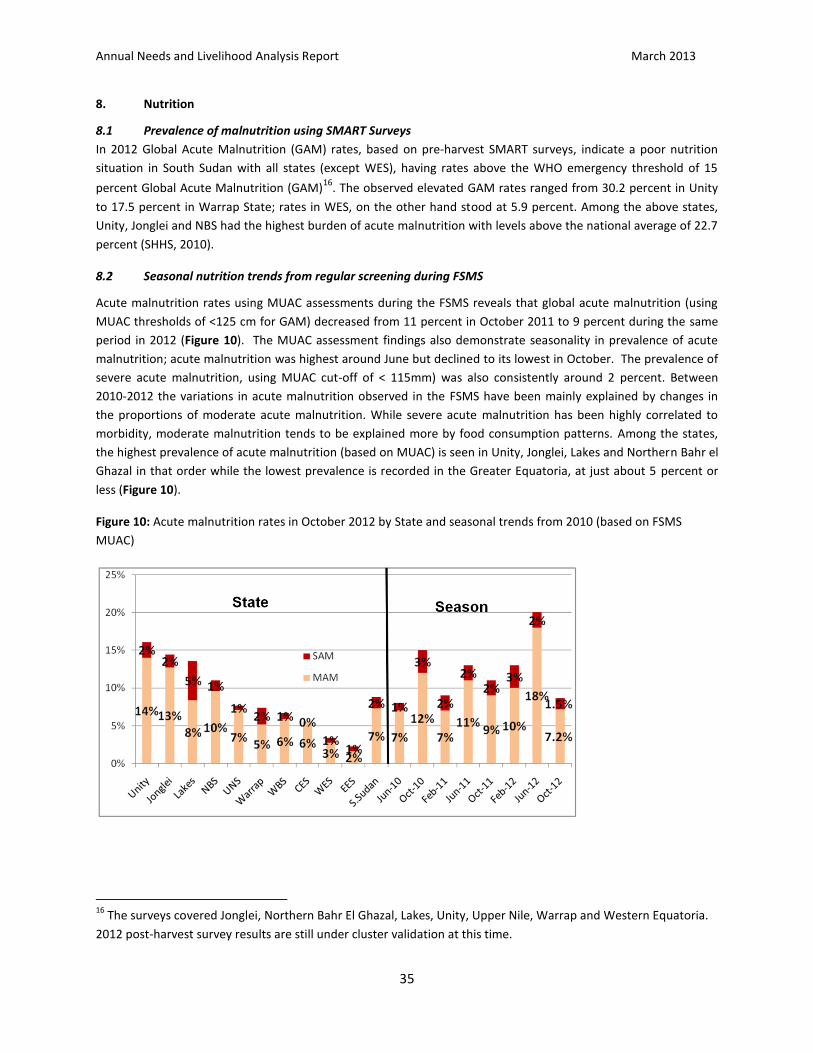
Annual Needs and Livelihood Analysis Report March 2013
35
8. Nutrition
8.1 Prevalence of malnutrition using SMART Surveys
In 2012 Global Acute Malnutrition (GAM) rates, based on pre-harvest SMART surveys, indicate a poor nutrition
situation in South Sudan with all states (except WES), having rates above the WHO emergency threshold of 15
percent Global Acute Malnutrition (GAM)16
. The observed elevated GAM rates ranged from 30.2 percent in Unity
to 17.5 percent in Warrap State; rates in WES, on the other hand stood at 5.9 percent. Among the above states,
Unity, Jonglei and NBS had the highest burden of acute malnutrition with levels above the national average of 22.7
percent (SHHS, 2010).
8.2 Seasonal nutrition trends from regular screening during FSMS
Acute malnutrition rates using MUAC assessments during the FSMS reveals that global acute malnutrition (using
MUAC thresholds of <125 cm for GAM) decreased from 11 percent in October 2011 to 9 percent during the same
period in 2012 (Figure 10). The MUAC assessment findings also demonstrate seasonality in prevalence of acute
malnutrition; acute malnutrition was highest around June but declined to its lowest in October. The prevalence of
severe acute malnutrition, using MUAC cut-off of < 115mm) was also consistently around 2 percent. Between
2010-2012 the variations in acute malnutrition observed in the FSMS have been mainly explained by changes in
the proportions of moderate acute malnutrition. While severe acute malnutrition has been highly correlated to
morbidity, moderate malnutrition tends to be explained more by food consumption patterns. Among the states,
the highest prevalence of acute malnutrition (based on MUAC) is seen in Unity, Jonglei, Lakes and Northern Bahr el
Ghazal in that order while the lowest prevalence is recorded in the Greater Equatoria, at just about 5 percent or
less (Figure 10).
Figure 10: Acute malnutrition rates in October 2012 by State and seasonal trends from 2010 (based on FSMS
MUAC)
16
The surveys covered Jonglei, Northern Bahr El Ghazal, Lakes, Unity, Upper Nile, Warrap and Western Equatoria.
2012 post-harvest survey results are still under cluster validation at this time.
Annual Needs and Livelihood Analysis Report March 2013
36
8.3 Child feeding practices
Infant and Young Child Feeding (IYCF)17
practices in 2012 remain sub-optimal as indicated by exclusive breast
feeding, complementary feeding and dietary diversity (6-24months). Dietary diversity for young children is key to
countering micronutrient malnutrition, sustaining immunity and growth. The 12 pre-harvest SMART surveys that
collected data on Exclusive Breast-Feeding (EBF) in a comparable manner, showed that EBF rates range from 8
percent (Nyirol in Lakes State) to 72 percent (Twic East in Jonglei State). Only four of the surveys present rates
above an already very low national average of 45 percent (SHHS, 2010). The timely introduction of complementary
foods among infants aged 6-8 months is also predominantly poorly practiced with rates ranging from 27 percent
(Nyirol, Lakes State) to 87 percent (Agok in Warrap State). It is worth noting that the national average stands at
only 21 percent (SHHS, 2010).
In 2012, proportion of under 2s that had adequate dietary diversity (consumed 4 or more food groups) ranged
from 19 percent in June 2012 to 29 percent by October due to increased food availability in the post-harvest
period. Throughout all rounds of FSMS assessments in 2012, states with the highest proportion of children aged 6-
24 months with adequate dietary diversity (especially the greater Equatoria) also had relatively lower prevalence
of acute malnutrition using MUAC and vice versa. Throughout 2012, Unity and Jonglei states showed the lowest
prevalence of adequate dietary diversity amongst under 2s—an observation consistent with the relatively high
prevalence of acute malnutrition in the two states. These findings also reinforce the critical role of dietary intake in
explaining malnutrition. The under 2s with adequate dietary diversity are at least 1.3 times less likely to have been
acutely malnourished than those with inadequate dietary intake. The 2012 assessments further show that the
consumption of fruits and vegetables as well proteins is relatively low—just about 10 to 20 percent of the under 2s
were fed on these food items within the 24 hours preceding the assessments while over three-quarters of the
children were fed on cereals and tubers. This poor consumption of proteins and other micronutrient rich-foods
raises the possibility of children suffering from micronutrient deficiencies at this early stage. Micronutrient
deficiencies also negatively affect the absorption of the macronutrients which contributes to the persistent high
malnutrition rates in the country.
8.4 Childhood morbidity
A high disease burden among children was apparent throughout 2012 (FSMS findings) and as expected, there are
indications of deterioration in nutritional status attributed to diseases. About a half of the children aged under 2
years suffered from illness in the two weeks preceding any of the seasonal assessments18
. For example, some 52-
80 percent of the children under 2 years old suffered from at least an illness in the two weeks preceding the June
assessment, presumably the period with highest incidences of childhood illnesses due to unfavourable weather
conditions during the wet season while it was 46 percent in October 2012. There was minimal variation across
states.
17
17
WHO/UNICEF recommendations for optimal infant and young child feeding include that infants should be
exclusively breastfed for the first 6 months of life to achieve optimal growth, development and health, and
thereafter, they should receive nutritionally adequate and safe complementary foods while breastfeeding
continues up to 2 years or beyond
18 FSMS is conducted seasonality three times in a year (February, June and October)
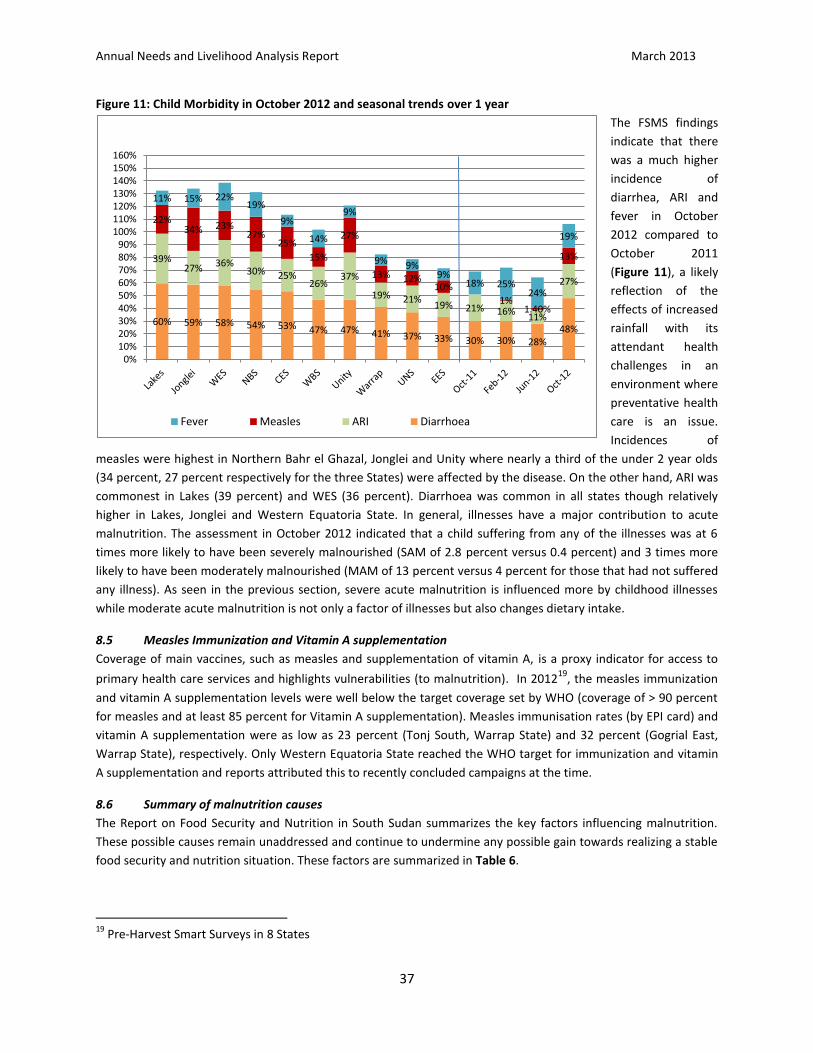
Annual Needs and Livelihood Analysis Report March 2013
37
60% 59% 58% 54% 53% 47% 47% 41% 37% 33% 30% 30% 28% 48%
39% 27% 36%
30% 25% 26%
37%
19% 21% 19% 21% 16%
11%
27%
22% 34% 23%
27% 25%
15%
27%
13% 12% 10%
1% 1.40%
13%
11% 15% 22% 19%
9%
14%
9%
9% 9% 9%
18% 25% 24%
19%
0%10%20%30%40%50%60%70%80%90%
100%110%120%130%140%150%160%
Fever Measles ARI Diarrhoea
Figure 11: Child Morbidity in October 2012 and seasonal trends over 1 year
The FSMS findings
indicate that there
was a much higher
incidence of
diarrhea, ARI and
fever in October
2012 compared to
October 2011
(Figure 11), a likely
reflection of the
effects of increased
rainfall with its
attendant health
challenges in an
environment where
preventative health
care is an issue.
Incidences of
measles were highest in Northern Bahr el Ghazal, Jonglei and Unity where nearly a third of the under 2 year olds
(34 percent, 27 percent respectively for the three States) were affected by the disease. On the other hand, ARI was
commonest in Lakes (39 percent) and WES (36 percent). Diarrhoea was common in all states though relatively
higher in Lakes, Jonglei and Western Equatoria State. In general, illnesses have a major contribution to acute
malnutrition. The assessment in October 2012 indicated that a child suffering from any of the illnesses was at 6
times more likely to have been severely malnourished (SAM of 2.8 percent versus 0.4 percent) and 3 times more
likely to have been moderately malnourished (MAM of 13 percent versus 4 percent for those that had not suffered
any illness). As seen in the previous section, severe acute malnutrition is influenced more by childhood illnesses
while moderate acute malnutrition is not only a factor of illnesses but also changes dietary intake.
8.5 Measles Immunization and Vitamin A supplementation
Coverage of main vaccines, such as measles and supplementation of vitamin A, is a proxy indicator for access to
primary health care services and highlights vulnerabilities (to malnutrition). In 201219
, the measles immunization
and vitamin A supplementation levels were well below the target coverage set by WHO (coverage of > 90 percent
for measles and at least 85 percent for Vitamin A supplementation). Measles immunisation rates (by EPI card) and
vitamin A supplementation were as low as 23 percent (Tonj South, Warrap State) and 32 percent (Gogrial East,
Warrap State), respectively. Only Western Equatoria State reached the WHO target for immunization and vitamin
A supplementation and reports attributed this to recently concluded campaigns at the time.
8.6 Summary of malnutrition causes
The Report on Food Security and Nutrition in South Sudan summarizes the key factors influencing malnutrition.
These possible causes remain unaddressed and continue to undermine any possible gain towards realizing a stable
food security and nutrition situation. These factors are summarized in Table 6.
19
Pre-Harvest Smart Surveys in 8 States
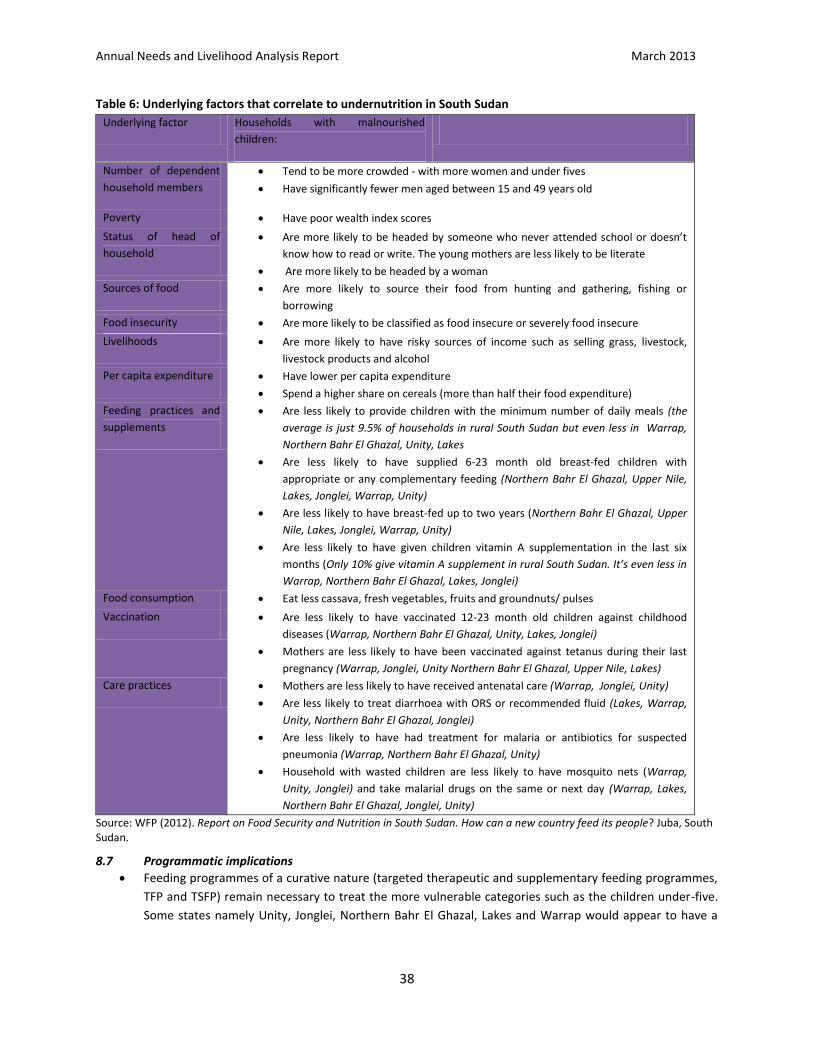
Annual Needs and Livelihood Analysis Report March 2013
38
Table 6: Underlying factors that correlate to undernutrition in South Sudan
Underlying factor Households with malnourished
children:
Number of dependent
household members
Tend to be more crowded - with more women and under fives
Have significantly fewer men aged between 15 and 49 years old
Poverty Have poor wealth index scores
Status of head of
household
Are more likely to be headed by someone who never attended school or doesn’t
know how to read or write. The young mothers are less likely to be literate
Are more likely to be headed by a woman
Sources of food Are more likely to source their food from hunting and gathering, fishing or
borrowing
Food insecurity Are more likely to be classified as food insecure or severely food insecure
Livelihoods Are more likely to have risky sources of income such as selling grass, livestock,
livestock products and alcohol
Per capita expenditure Have lower per capita expenditure
Spend a higher share on cereals (more than half their food expenditure)
Feeding practices and
supplements
Are less likely to provide children with the minimum number of daily meals (the
average is just 9.5% of households in rural South Sudan but even less in Warrap,
Northern Bahr El Ghazal, Unity, Lakes
Are less likely to have supplied 6-23 month old breast-fed children with
appropriate or any complementary feeding (Northern Bahr El Ghazal, Upper Nile,
Lakes, Jonglei, Warrap, Unity)
Are less likely to have breast-fed up to two years (Northern Bahr El Ghazal, Upper
Nile, Lakes, Jonglei, Warrap, Unity)
Are less likely to have given children vitamin A supplementation in the last six
months (Only 10% give vitamin A supplement in rural South Sudan. It’s even less in
Warrap, Northern Bahr El Ghazal, Lakes, Jonglei)
Food consumption Eat less cassava, fresh vegetables, fruits and groundnuts/ pulses
Vaccination Are less likely to have vaccinated 12-23 month old children against childhood
diseases (Warrap, Northern Bahr El Ghazal, Unity, Lakes, Jonglei)
Mothers are less likely to have been vaccinated against tetanus during their last
pregnancy (Warrap, Jonglei, Unity Northern Bahr El Ghazal, Upper Nile, Lakes)
Care practices Mothers are less likely to have received antenatal care (Warrap, Jonglei, Unity)
Are less likely to treat diarrhoea with ORS or recommended fluid (Lakes, Warrap,
Unity, Northern Bahr El Ghazal, Jonglei)
Are less likely to have had treatment for malaria or antibiotics for suspected
pneumonia (Warrap, Northern Bahr El Ghazal, Unity)
Household with wasted children are less likely to have mosquito nets (Warrap,
Unity, Jonglei) and take malarial drugs on the same or next day (Warrap, Lakes,
Northern Bahr El Ghazal, Jonglei, Unity)
Source: WFP (2012). Report on Food Security and Nutrition in South Sudan. How can a new country feed its people? Juba, South Sudan.
8.7 Programmatic implications
Feeding programmes of a curative nature (targeted therapeutic and supplementary feeding programmes,
TFP and TSFP) remain necessary to treat the more vulnerable categories such as the children under-five.
Some states namely Unity, Jonglei, Northern Bahr El Ghazal, Lakes and Warrap would appear to have a
Annual Needs and Livelihood Analysis Report March 2013
39
greater burden of acute malnutrition. Consequently treatment programmatic response should be
prioritised in these states.
TFP and TSFP are however, not new programmatic responses in South Sudan; in fact out of all the SMART
surveys conducted in 2012, 90 percent were in areas covered by long-standing nutrition (and health
programmes) and among these, 80 percent had TFP and TSFP. More specifically, while NBS and Warrap
states have a relatively high coverage and overlap of both TFP and TSFP services, GAM rates still manifest
at very high levels. This necessitates a review of coverage preventative measures as the indicators for
dietary diversify and breast feeling/complementary feeding are poor there. There is a need to focus and
strengthen the preventative services alongside continuing the treatment programs. Similarly the TSFP
coverage is quite low across the country and there is a need for expansion.
Mapping of OTP and TSFP service distribution (from the Nutrition Cluster) indicates that the spread of the
nutrition sites is mostly based on needs and capacity of partners. There are huge geographical gaps in
Unity, Upper Nile, WBS and Lakes. Therefore, there is need to expand programming based on need and
vulnerability so that apparent hotspot states are better covered by these services.
As expected acute malnutrition is seasonal (FSMS trends), with wasting peaking during the ‘lean’ season,
when food availability is reduced, childhood illnesses associated with the rainy season are prevalent and
there is increased demand on carers to attend to farming activities. Programmes and strategies to
cushion, especially the vulnerable categories from the effects of the interplay among these factors remain
necessary in South Sudan. Predominantly, these consist of blanket Supplementary feeding (BSFP) for the
younger children. There is need to identify context-specific (community level) innovative programme
strategies aimed at reducing the negative impacts on mothers/carer’s time for child care during these
more critical periods o f the year.
Improvements in IYCF require long-term attention to not just knowledge building but also individual
attitude change and access to enabling environment for practices to change. There are indications that
nutrition and health education – often times informed by Knowledge Attitude and Practice (KAP) survey –
activities are a component of nutrition programmes (scope is undetermined), but it may be timely to
invest in formative research so that behavioural change communication (BCC) strategies are informed by
and adapted to the communities in question.
A social safety net approach through food or cash modalities is required to support communities
(population segments) lacking physical or economic access to the right foods. At a broader level, it is
necessary to ensure that agricultural/livestock policies and programmes are nutrition sensitive to ensure
that the food available to populations in general is nutritionally diverse.
Along-side investments in health service sector, there is need to maintain campaigns – including mop-up –
to achieve and sustain optimum coverage of measles and vitamin A supplementation to guarantee
protection for the children. Considering that building skilled health workers will take time, the use of
community resource persons (provided with minimal training) to routinely deliver a basic package of
interventions at the community should be explored by government and non-government actors alike.
Finally, a strategy for more robust nutrition surveillance is needed for South Sudan. In 2012, SMART surveys were conducted only in locations where cluster partners had nutrition programs. Also, considering that implementation and release of final SMART survey reports by the partners as well as validation at times takes longer due to the non availability of the survey Technical Working Group members. The surveys need to be validated by the cluster and the survey TWG before they can be released by the cluster partners as final report. The 2012 post-harvest survey reports are still unavailable at the time of writing this report due to the above mentioned reasons. On the other hand, the FSMS yields timely data, from a cross-section of sentinel sites; however, anthropometry is limited to MUAC measurement. A hybrid of the two systems could go a long way in providing accurate, timely and more representative picture of the overall nutrition situation in South Sudan.
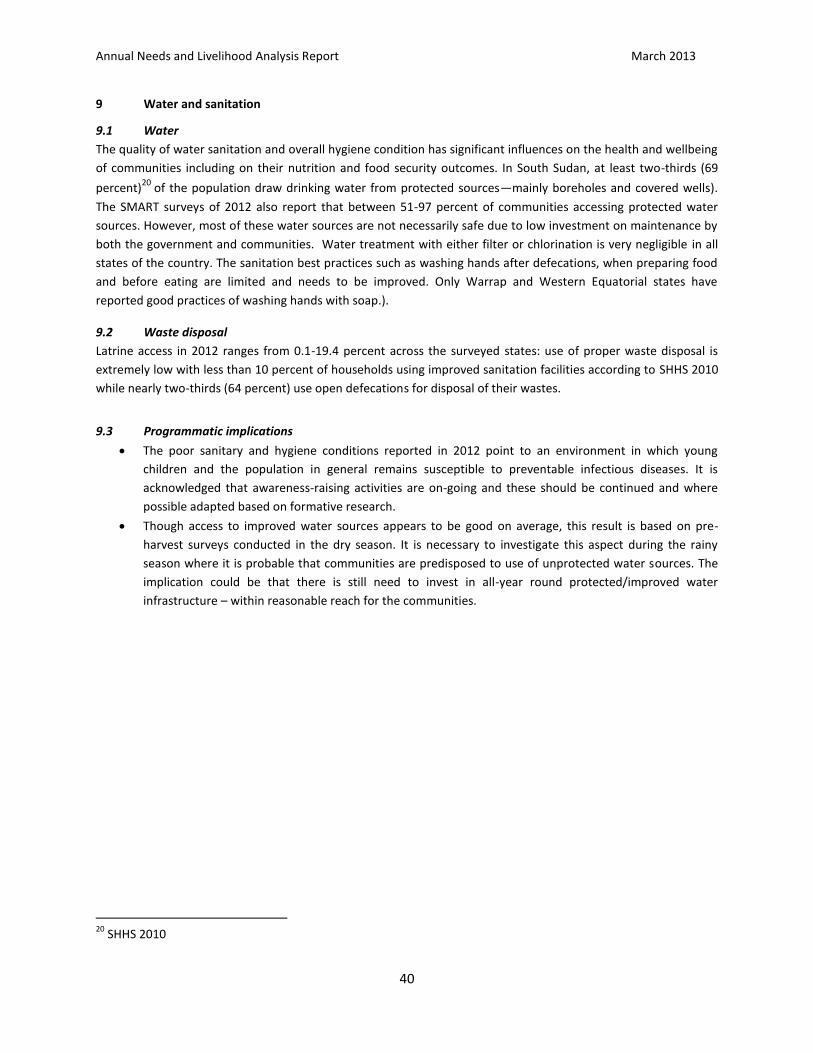
Annual Needs and Livelihood Analysis Report March 2013
40
9 Water and sanitation
9.1 Water
The quality of water sanitation and overall hygiene condition has significant influences on the health and wellbeing
of communities including on their nutrition and food security outcomes. In South Sudan, at least two-thirds (69
percent)20
of the population draw drinking water from protected sources—mainly boreholes and covered wells).
The SMART surveys of 2012 also report that between 51-97 percent of communities accessing protected water
sources. However, most of these water sources are not necessarily safe due to low investment on maintenance by
both the government and communities. Water treatment with either filter or chlorination is very negligible in all
states of the country. The sanitation best practices such as washing hands after defecations, when preparing food
and before eating are limited and needs to be improved. Only Warrap and Western Equatorial states have
reported good practices of washing hands with soap.).
9.2 Waste disposal
Latrine access in 2012 ranges from 0.1-19.4 percent across the surveyed states: use of proper waste disposal is
extremely low with less than 10 percent of households using improved sanitation facilities according to SHHS 2010
while nearly two-thirds (64 percent) use open defecations for disposal of their wastes.
9.3 Programmatic implications
The poor sanitary and hygiene conditions reported in 2012 point to an environment in which young
children and the population in general remains susceptible to preventable infectious diseases. It is
acknowledged that awareness-raising activities are on-going and these should be continued and where
possible adapted based on formative research.
Though access to improved water sources appears to be good on average, this result is based on pre-
harvest surveys conducted in the dry season. It is necessary to investigate this aspect during the rainy
season where it is probable that communities are predisposed to use of unprotected water sources. The
implication could be that there is still need to invest in all-year round protected/improved water
infrastructure – within reasonable reach for the communities.
20
SHHS 2010
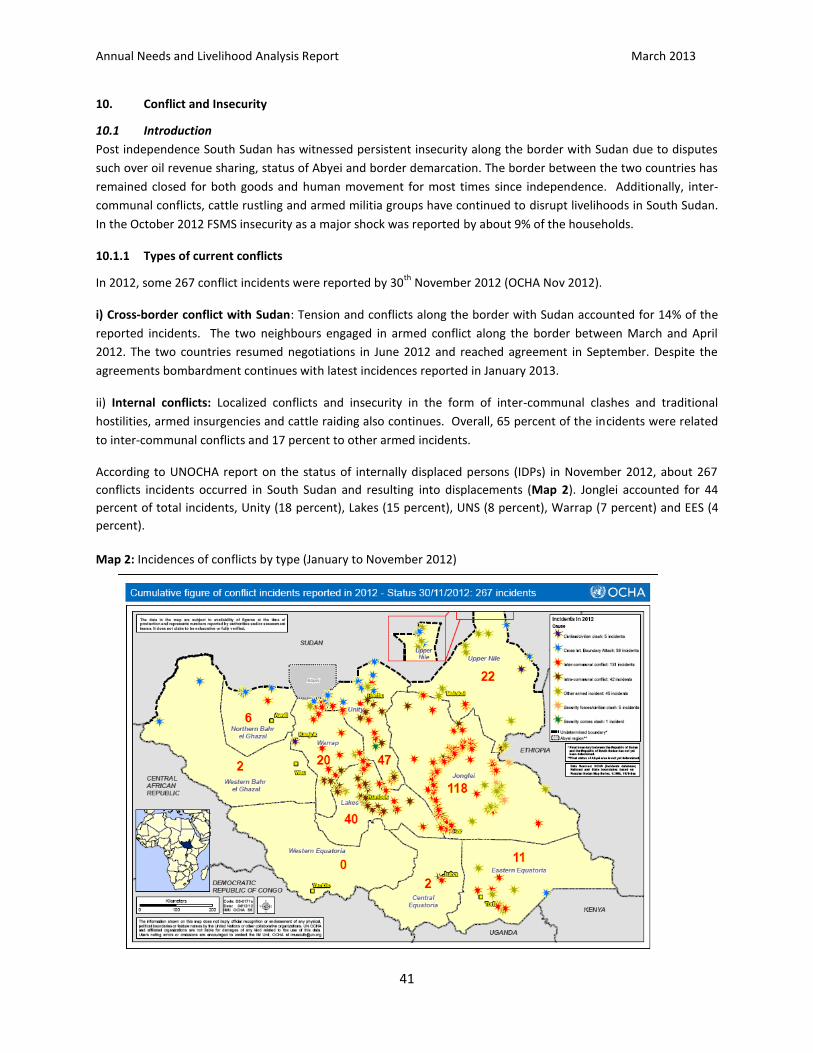
Annual Needs and Livelihood Analysis Report March 2013
41
10. Conflict and Insecurity
10.1 Introduction
Post independence South Sudan has witnessed persistent insecurity along the border with Sudan due to disputes
such over oil revenue sharing, status of Abyei and border demarcation. The border between the two countries has
remained closed for both goods and human movement for most times since independence. Additionally, inter-
communal conflicts, cattle rustling and armed militia groups have continued to disrupt livelihoods in South Sudan.
In the October 2012 FSMS insecurity as a major shock was reported by about 9% of the households.
10.1.1 Types of current conflicts
In 2012, some 267 conflict incidents were reported by 30th
November 2012 (OCHA Nov 2012).
i) Cross-border conflict with Sudan: Tension and conflicts along the border with Sudan accounted for 14% of the
reported incidents. The two neighbours engaged in armed conflict along the border between March and April
2012. The two countries resumed negotiations in June 2012 and reached agreement in September. Despite the
agreements bombardment continues with latest incidences reported in January 2013.
ii) Internal conflicts: Localized conflicts and insecurity in the form of inter-communal clashes and traditional
hostilities, armed insurgencies and cattle raiding also continues. Overall, 65 percent of the incidents were related
to inter-communal conflicts and 17 percent to other armed incidents.
According to UNOCHA report on the status of internally displaced persons (IDPs) in November 2012, about 267
conflicts incidents occurred in South Sudan and resulting into displacements (Map 2). Jonglei accounted for 44
percent of total incidents, Unity (18 percent), Lakes (15 percent), UNS (8 percent), Warrap (7 percent) and EES (4
percent).
Map 2: Incidences of conflicts by type (January to November 2012)
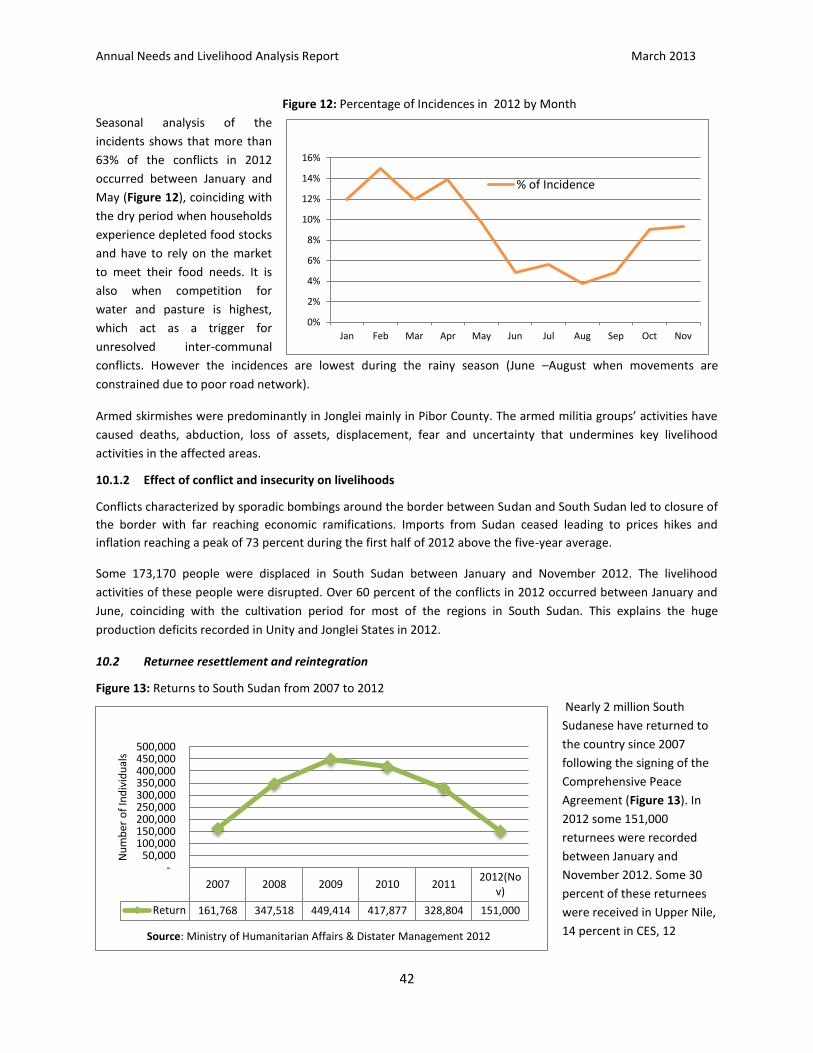
Annual Needs and Livelihood Analysis Report March 2013
42
0%
2%
4%
6%
8%
10%
12%
14%
16%
Jan Feb Mar Apr May Jun Jul Aug Sep Oct Nov
% of Incidence
2007 2008 2009 2010 20112012(No
v)
Return 161,768 347,518 449,414 417,877 328,804 151,000
- 50,000
100,000 150,000 200,000 250,000 300,000 350,000 400,000 450,000 500,000
Nu
mb
er o
f In
div
idu
als
Source: Ministry of Humanitarian Affairs & Distater Management 2012
Figure 12: Percentage of Incidences in 2012 by Month
Seasonal analysis of the
incidents shows that more than
63% of the conflicts in 2012
occurred between January and
May (Figure 12), coinciding with
the dry period when households
experience depleted food stocks
and have to rely on the market
to meet their food needs. It is
also when competition for
water and pasture is highest,
which act as a trigger for
unresolved inter-communal
conflicts. However the incidences are lowest during the rainy season (June –August when movements are
constrained due to poor road network).
Armed skirmishes were predominantly in Jonglei mainly in Pibor County. The armed militia groups’ activities have
caused deaths, abduction, loss of assets, displacement, fear and uncertainty that undermines key livelihood
activities in the affected areas.
10.1.2 Effect of conflict and insecurity on livelihoods
Conflicts characterized by sporadic bombings around the border between Sudan and South Sudan led to closure of
the border with far reaching economic ramifications. Imports from Sudan ceased leading to prices hikes and
inflation reaching a peak of 73 percent during the first half of 2012 above the five-year average.
Some 173,170 people were displaced in South Sudan between January and November 2012. The livelihood
activities of these people were disrupted. Over 60 percent of the conflicts in 2012 occurred between January and
June, coinciding with the cultivation period for most of the regions in South Sudan. This explains the huge
production deficits recorded in Unity and Jonglei States in 2012.
10.2 Returnee resettlement and reintegration
Figure 13: Returns to South Sudan from 2007 to 2012
Nearly 2 million South
Sudanese have returned to
the country since 2007
following the signing of the
Comprehensive Peace
Agreement (Figure 13). In
2012 some 151,000
returnees were recorded
between January and
November 2012. Some 30
percent of these returnees
were received in Upper Nile,
14 percent in CES, 12
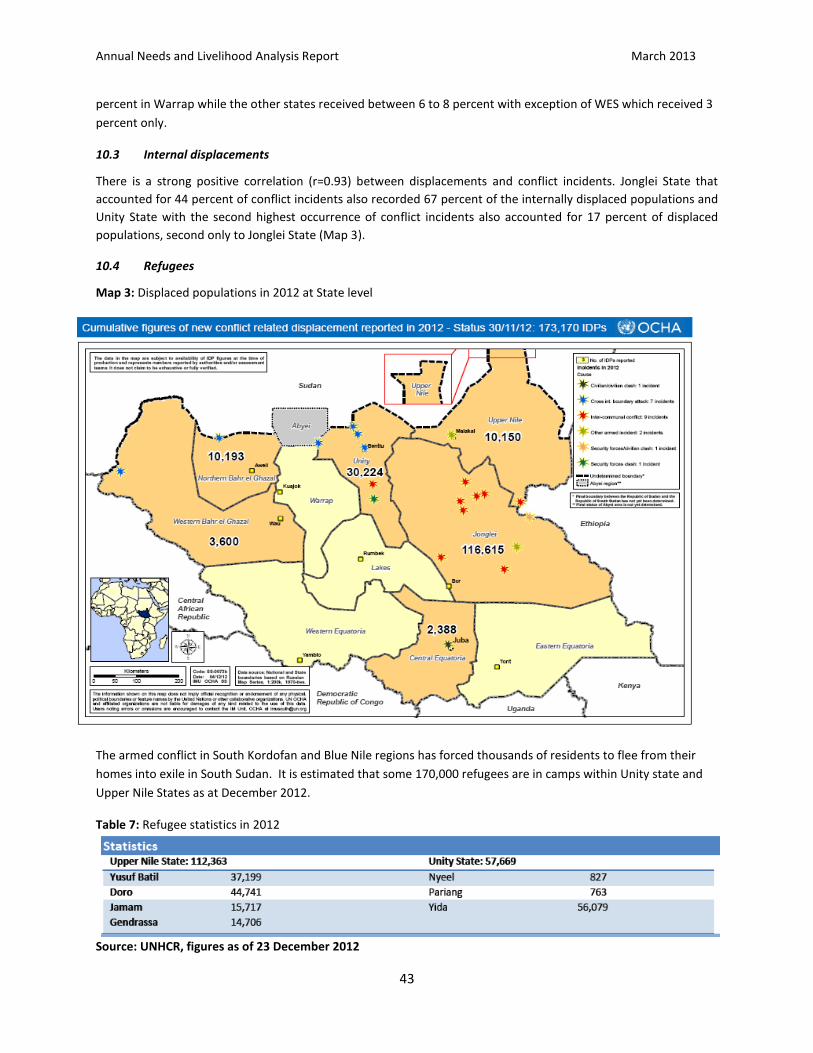
Annual Needs and Livelihood Analysis Report March 2013
43
percent in Warrap while the other states received between 6 to 8 percent with exception of WES which received 3
percent only.
10.3 Internal displacements
There is a strong positive correlation (r=0.93) between displacements and conflict incidents. Jonglei State that
accounted for 44 percent of conflict incidents also recorded 67 percent of the internally displaced populations and
Unity State with the second highest occurrence of conflict incidents also accounted for 17 percent of displaced
populations, second only to Jonglei State (Map 3).
10.4 Refugees
Map 3: Displaced populations in 2012 at State level
The armed conflict in South Kordofan and Blue Nile regions has forced thousands of residents to flee from their
homes into exile in South Sudan. It is estimated that some 170,000 refugees are in camps within Unity state and
Upper Nile States as at December 2012.
Table 7: Refugee statistics in 2012
Source: UNHCR, figures as of 23 December 2012
Annual Needs and Livelihood Analysis Report March 2013
44
The UNHCR and partners provide accommodation (shelter), food, non food items, water, health services and protection to the Sudanese refugees camped in the 7 camps in South Sudan. There is growing tension because the perception that the refugees seem to be getting more support from humanitarian actors compared to the host communities yet they share the same natural resources like pasture and water points.
Most refugees in both Maban and Yida originate from pastoral backgrounds. In fact the livestock influx in Maban
alone is estimated at over 200,000 herds of cattle. It is also notable that the ratio of refugees to resident
population in both Maban and Pariang (for Yida refugees) counties is 2.3:1 and 0.8: 1, respectively. Potentially, it
implies that the refugees might have come with more livestock than the local residents. The refugees rely on
common natural resources like water for fishing and livestock, forests for firewood, construction materials, wild
foods and rangeland for grazing of livestock, which has the potential to create resource-based conflicts with the
host communities. This continues to exert considerable pressure on the water and pasture resources within the
host communities. Box 1 summarizes the livestock issues within one the big camps in the country.
10.5 Other emerging humanitarian issues
Land and returnee challenge: Land is the basis of livelihoods. It provides the base for agriculture, pastoralism,
fishing and collection of wild foods. With the arrival of refugees, it is expected that the refugees will also need land
resources for their livelihoods, such as farming, herding, fishing and collection of wild foods.
Returnees in many areas are yet to be allocated land in areas of return and due to lack of social services many others opt to stay in the urban and peri-urban areas where they are contributing to a new dynamic of urban food insecurity. This also results in land tenure challenges around urban areas that may culminate into tensions as observed in Wau and other areas. Moreover, most returnees lack skills relevant to their new areas of residence but also exacerbated by lack of opportunities to absorb them.
Boundary demarcations: The continuing tensions of the boundary between South and South Sudan remain a
major concern. In 2012, both the Juba and Khartoum government agreed on demilitarization of 14 miles along the
border. This created tensions especially in Northern el Bahr Ghazal leading to some bombardments. Such tensions
are likely to disrupt livelihood activities for families residing along these borders.
10.6 Programmatic implications
• There is evidence of an increasing caseload of returnees and IDPs. Most of these categories of the population
are food insecure compared to resident households owing to poor access to land, lack of tangible income
sources and high vulnerability to shocks.
• Returnees should be supported to settle down and re-enter the production cycle.
BOX 1 MABAN COUNTY, South Sudan, November 29 (UNHCR) – John Gay is tired and angry after spending yet another sleepless night chasing grazing cattle from his sorghum field in South Sudan's Maban County.
It's a problem affecting most locals living in the vicinity of the Yusuf Batil and Gendrassa refugee camps, which were set up earlier this year and together host about 52,000 people and, according to Veterinarians Without Borders-Germany (VSF-G), 44,000 cattle, sheep and goats.
All those animals need food and that means many are heading into the nearby fields and eating the crops – mainly sorghum, but also pumpkins and green vegetables – planted by villagers. But this is posing a serious threat to the food security of people like John Gay, who wields influence in the area as an umda, or senior local chief. UNHCR is trying to help resolve the problem.
UNHCR helps mediate South Sudan cattle grazing dispute News Stories, 29 November 2012
Annual Needs and Livelihood Analysis Report March 2013
45
• Access to land should be enhanced at state level for returnee households. The lack of access to land would
hinder household engagement into meaning farming activities for own crop production.
• Training in agricultural production and vocational skills would hasten the re-integration process of returnees.
• Provision of security and peace building programmes is required to make it attractive for IDPs to return to
areas of origin. This should be extended also to the provision of initial inputs and basic services in the areas of
origin.
Annual Needs and Livelihood Analysis Report March 2013
46
11 Food security outlook: December 2012 to March 2013
11.1 Overview of food security outlook
The analysis of the food security outlook for December 2012 to March 2013 took place in Nimule Eastern Equatoria
State from 14-18 November 2012 at the Livelihood Analysis Forum (LAF). The forum applies the Integrated Phase
Classification (IPC) methodology21
to project food security situation shown in the Map 4.
Whereas food security situation is projected to remain stable in most regions of Greater Equatoria, in most parts of
Western and Northern Bahr el Ghazal, localized deterioration is foreseen. Eastern Equatoria especially in the
Kapoetas and parts of Western Equatoria around Ezo, Mundri West, Mvolo and Nzara counties in addition to
Terekeka in Central Equatoria will move to Stressed phase of the food insecurity scale. Conflicts over water and
pasture resources due to drier than normal conditions in Kapoetas and higher market prices fuelled by shortage of
hard currency and impeded import flows in the rest of Equatorias will be the key drivers.
Food security situation is expected to decline in most parts of Greater Upper Nile and Jonglei mainly crisis phase
according to IPC classification while emergency levels are expected to prevail Pibor County of Jonglei State.
Potential factors expected to heighten food insecurity in the country include continued border tensions resulting
to sporadic wars, incursion in Upper Nile and other border areas leading to refugee influx, and conflicts over water
and pasture resources among the pastoralists due to drier than normal conditions. This will be exacerbated by
higher market prices fuelled by shortage of hard currency, inadequate local production and transport bottlenecks
for inflow of commodities from East African Countries due to poor road network.
In Northern El Bahr Ghazal, specifically Aweil East and North as well as parts of Warrap around Twic and Lakes
especially Yirol East, Awerial and Cueibet will also deteriorate into crisis levels, mainly due expected higher prices
as import flows from east Africa is affected but also the uncertainties around political outcomes along the border
with Sudan.
21 The Phase Classification is divided into five Phases - Generally Food Secure, moderately/Borderline Food Insecure, Acute Food and Livelihood Crisis, Humanitarian Emergency, and Famine/Humanitarian Catastrophe. The five phases are general enough to accommodate a wide range of causes, livelihood systems, and political/economic contexts - yet their distinction captures essential differences in implications for action (including strategic design, urgency, and ethical imperative).
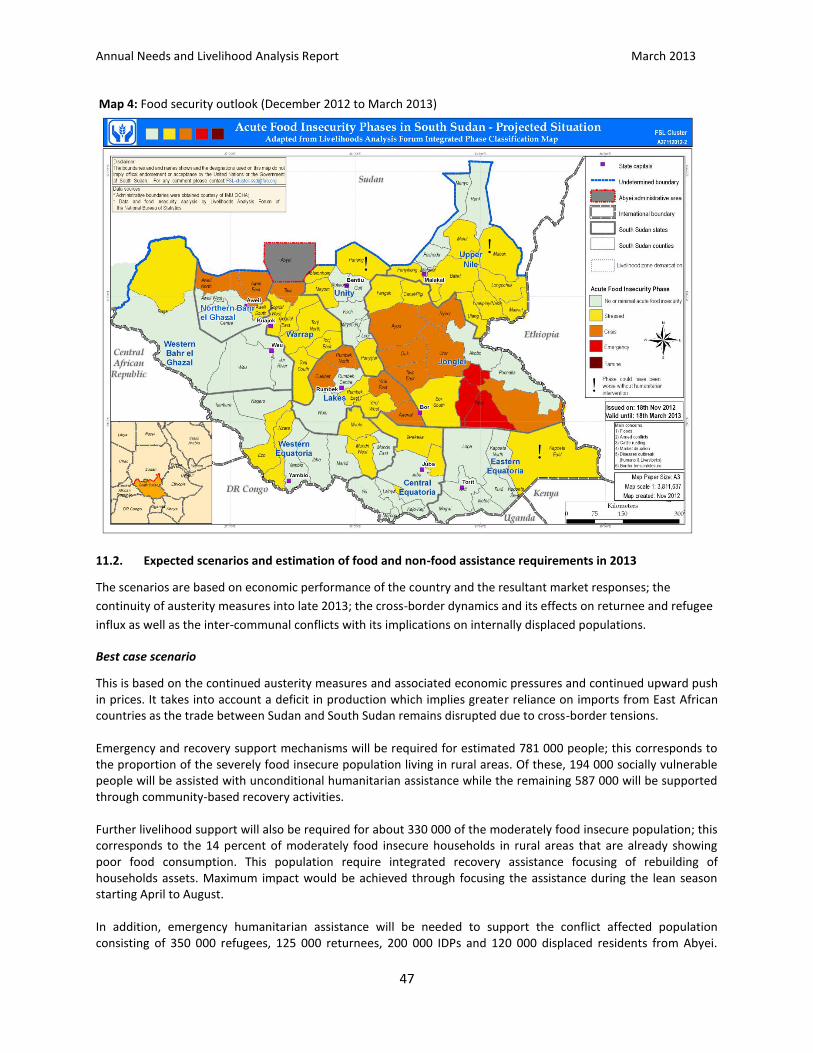
Annual Needs and Livelihood Analysis Report March 2013
47
Map 4: Food security outlook (December 2012 to March 2013)
11.2. Expected scenarios and estimation of food and non-food assistance requirements in 2013
The scenarios are based on economic performance of the country and the resultant market responses; the
continuity of austerity measures into late 2013; the cross-border dynamics and its effects on returnee and refugee
influx as well as the inter-communal conflicts with its implications on internally displaced populations.
Best case scenario
This is based on the continued austerity measures and associated economic pressures and continued upward push in prices. It takes into account a deficit in production which implies greater reliance on imports from East African countries as the trade between Sudan and South Sudan remains disrupted due to cross-border tensions. Emergency and recovery support mechanisms will be required for estimated 781 000 people; this corresponds to the proportion of the severely food insecure population living in rural areas. Of these, 194 000 socially vulnerable people will be assisted with unconditional humanitarian assistance while the remaining 587 000 will be supported through community-based recovery activities. Further livelihood support will also be required for about 330 000 of the moderately food insecure population; this corresponds to the 14 percent of moderately food insecure households in rural areas that are already showing poor food consumption. This population require integrated recovery assistance focusing of rebuilding of households assets. Maximum impact would be achieved through focusing the assistance during the lean season starting April to August. In addition, emergency humanitarian assistance will be needed to support the conflict affected population consisting of 350 000 refugees, 125 000 returnees, 200 000 IDPs and 120 000 displaced residents from Abyei.
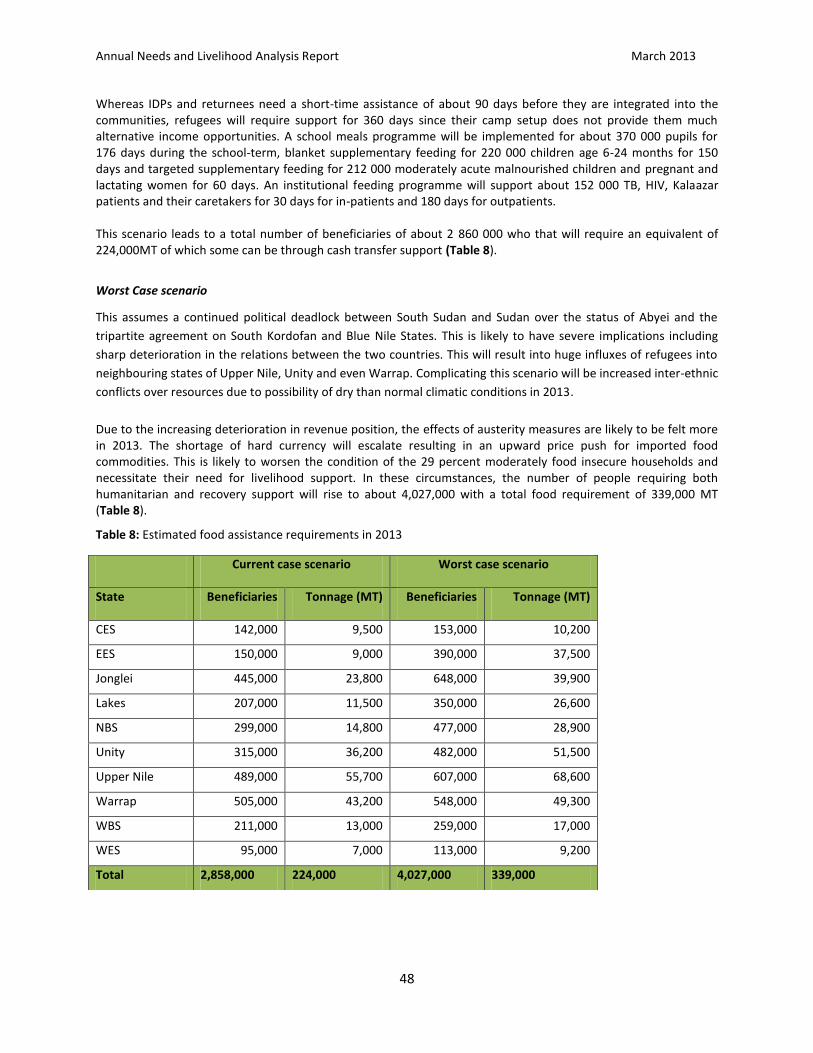
Annual Needs and Livelihood Analysis Report March 2013
48
Whereas IDPs and returnees need a short-time assistance of about 90 days before they are integrated into the communities, refugees will require support for 360 days since their camp setup does not provide them much alternative income opportunities. A school meals programme will be implemented for about 370 000 pupils for 176 days during the school-term, blanket supplementary feeding for 220 000 children age 6-24 months for 150 days and targeted supplementary feeding for 212 000 moderately acute malnourished children and pregnant and lactating women for 60 days. An institutional feeding programme will support about 152 000 TB, HIV, Kalaazar patients and their caretakers for 30 days for in-patients and 180 days for outpatients. This scenario leads to a total number of beneficiaries of about 2 860 000 who that will require an equivalent of 224,000MT of which some can be through cash transfer support (Table 8).
Worst Case scenario
This assumes a continued political deadlock between South Sudan and Sudan over the status of Abyei and the
tripartite agreement on South Kordofan and Blue Nile States. This is likely to have severe implications including
sharp deterioration in the relations between the two countries. This will result into huge influxes of refugees into
neighbouring states of Upper Nile, Unity and even Warrap. Complicating this scenario will be increased inter-ethnic
conflicts over resources due to possibility of dry than normal climatic conditions in 2013.
Due to the increasing deterioration in revenue position, the effects of austerity measures are likely to be felt more in 2013. The shortage of hard currency will escalate resulting in an upward price push for imported food commodities. This is likely to worsen the condition of the 29 percent moderately food insecure households and necessitate their need for livelihood support. In these circumstances, the number of people requiring both humanitarian and recovery support will rise to about 4,027,000 with a total food requirement of 339,000 MT (Table 8).
Table 8: Estimated food assistance requirements in 2013
Current case scenario Worst case scenario
State Beneficiaries Tonnage (MT) Beneficiaries Tonnage (MT)
CES 142,000 9,500 153,000 10,200
EES 150,000 9,000 390,000 37,500
Jonglei 445,000 23,800 648,000 39,900
Lakes 207,000 11,500 350,000 26,600
NBS 299,000 14,800 477,000 28,900
Unity 315,000 36,200 482,000 51,500
Upper Nile 489,000 55,700 607,000 68,600
Warrap 505,000 43,200 548,000 49,300
WBS 211,000 13,000 259,000 17,000
WES 95,000 7,000 113,000 9,200
Total 2,858,000 224,000 4,027,000 339,000
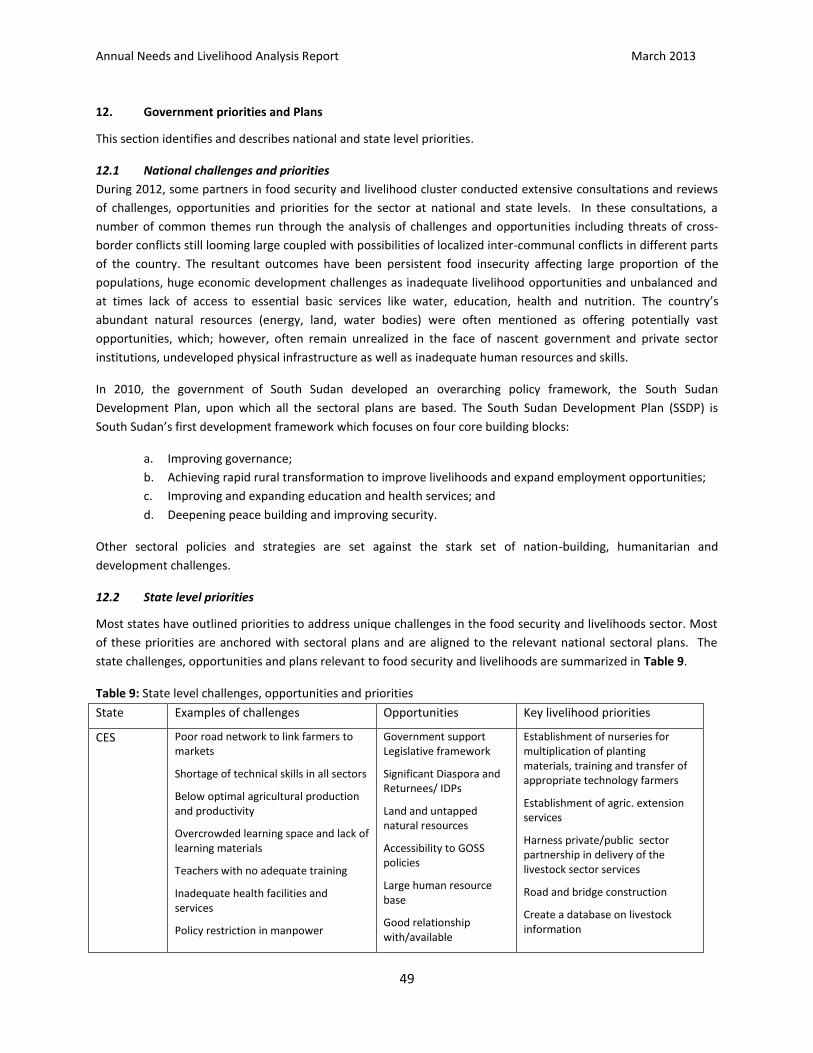
Annual Needs and Livelihood Analysis Report March 2013
49
12. Government priorities and Plans
This section identifies and describes national and state level priorities.
12.1 National challenges and priorities
During 2012, some partners in food security and livelihood cluster conducted extensive consultations and reviews
of challenges, opportunities and priorities for the sector at national and state levels. In these consultations, a
number of common themes run through the analysis of challenges and opportunities including threats of cross-
border conflicts still looming large coupled with possibilities of localized inter-communal conflicts in different parts
of the country. The resultant outcomes have been persistent food insecurity affecting large proportion of the
populations, huge economic development challenges as inadequate livelihood opportunities and unbalanced and
at times lack of access to essential basic services like water, education, health and nutrition. The country’s
abundant natural resources (energy, land, water bodies) were often mentioned as offering potentially vast
opportunities, which; however, often remain unrealized in the face of nascent government and private sector
institutions, undeveloped physical infrastructure as well as inadequate human resources and skills.
In 2010, the government of South Sudan developed an overarching policy framework, the South Sudan
Development Plan, upon which all the sectoral plans are based. The South Sudan Development Plan (SSDP) is
South Sudan’s first development framework which focuses on four core building blocks:
a. Improving governance;
b. Achieving rapid rural transformation to improve livelihoods and expand employment opportunities;
c. Improving and expanding education and health services; and
d. Deepening peace building and improving security.
Other sectoral policies and strategies are set against the stark set of nation-building, humanitarian and
development challenges.
12.2 State level priorities
Most states have outlined priorities to address unique challenges in the food security and livelihoods sector. Most
of these priorities are anchored with sectoral plans and are aligned to the relevant national sectoral plans. The
state challenges, opportunities and plans relevant to food security and livelihoods are summarized in Table 9.
Table 9: State level challenges, opportunities and priorities
State Examples of challenges Opportunities Key livelihood priorities
CES Poor road network to link farmers to markets
Shortage of technical skills in all sectors
Below optimal agricultural production and productivity
Overcrowded learning space and lack of learning materials
Teachers with no adequate training
Inadequate health facilities and services
Policy restriction in manpower
Government support Legislative framework
Significant Diaspora and Returnees/ IDPs
Land and untapped natural resources
Accessibility to GOSS policies
Large human resource base
Good relationship with/available
Establishment of nurseries for multiplication of planting materials, training and transfer of appropriate technology farmers
Establishment of agric. extension services
Harness private/public sector partnership in delivery of the livestock sector services
Road and bridge construction
Create a database on livestock information
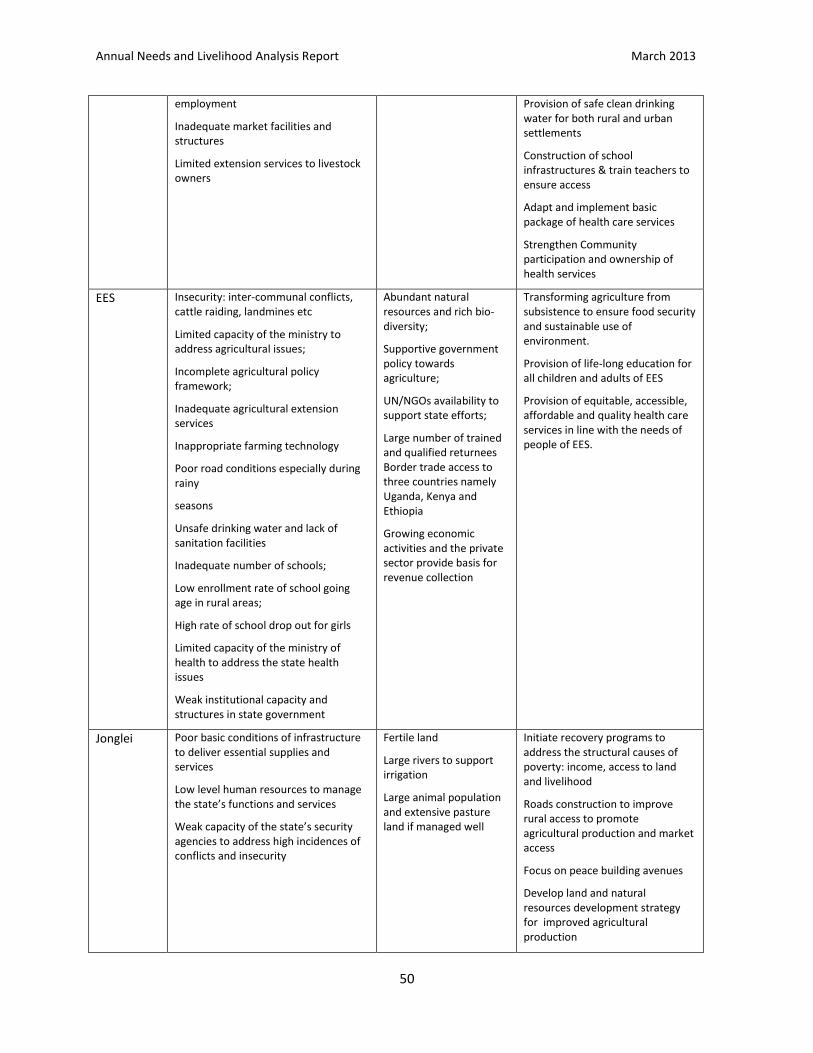
Annual Needs and Livelihood Analysis Report March 2013
50
employment
Inadequate market facilities and structures
Limited extension services to livestock owners
Provision of safe clean drinking water for both rural and urban settlements
Construction of school infrastructures & train teachers to ensure access
Adapt and implement basic package of health care services
Strengthen Community participation and ownership of health services
EES Insecurity: inter-communal conflicts, cattle raiding, landmines etc
Limited capacity of the ministry to address agricultural issues;
Incomplete agricultural policy framework;
Inadequate agricultural extension services
Inappropriate farming technology
Poor road conditions especially during rainy
seasons
Unsafe drinking water and lack of sanitation facilities
Inadequate number of schools;
Low enrollment rate of school going age in rural areas;
High rate of school drop out for girls
Limited capacity of the ministry of health to address the state health issues
Weak institutional capacity and structures in state government
Abundant natural resources and rich bio-diversity;
Supportive government policy towards agriculture;
UN/NGOs availability to support state efforts;
Large number of trained and qualified returnees Border trade access to three countries namely Uganda, Kenya and Ethiopia
Growing economic activities and the private sector provide basis for revenue collection
Transforming agriculture from subsistence to ensure food security and sustainable use of environment.
Provision of life-long education for all children and adults of EES
Provision of equitable, accessible, affordable and quality health care services in line with the needs of people of EES.
Jonglei Poor basic conditions of infrastructure to deliver essential supplies and services
Low level human resources to manage the state’s functions and services
Weak capacity of the state’s security agencies to address high incidences of conflicts and insecurity
Fertile land
Large rivers to support irrigation
Large animal population and extensive pasture land if managed well
Initiate recovery programs to address the structural causes of poverty: income, access to land and livelihood
Roads construction to improve rural access to promote agricultural production and market access
Focus on peace building avenues
Develop land and natural resources development strategy for improved agricultural production
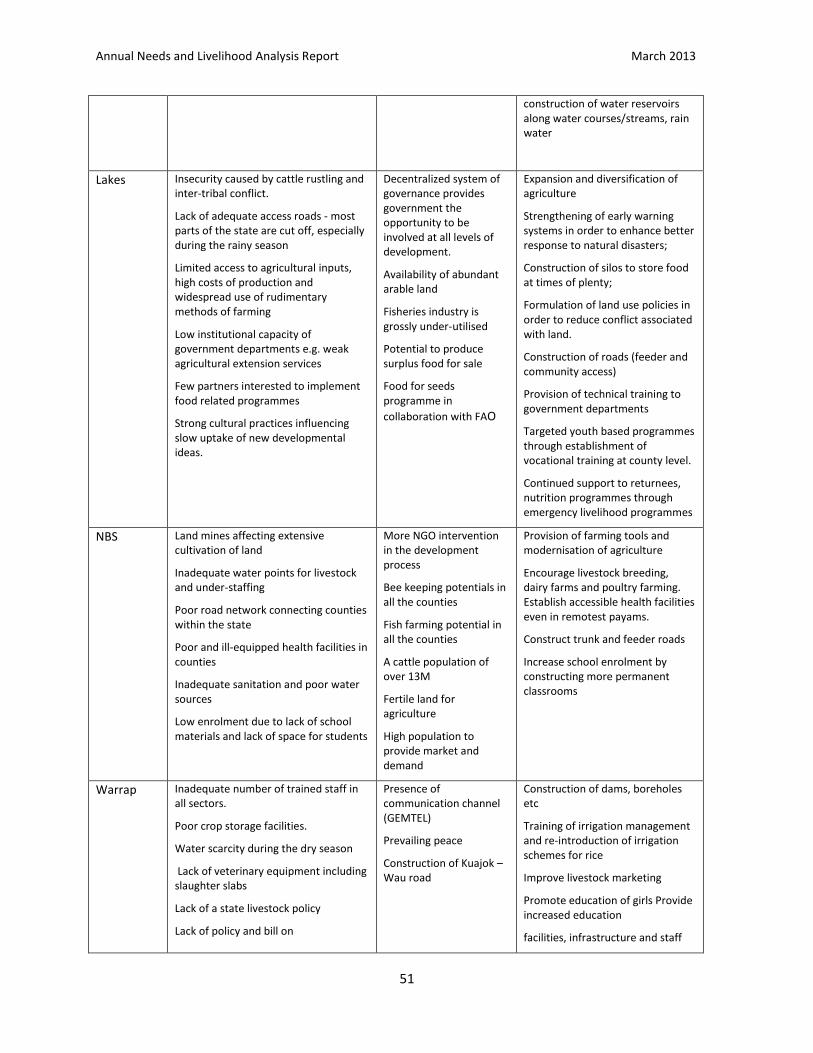
Annual Needs and Livelihood Analysis Report March 2013
51
construction of water reservoirs along water courses/streams, rain water
Lakes Insecurity caused by cattle rustling and inter-tribal conflict.
Lack of adequate access roads - most parts of the state are cut off, especially during the rainy season
Limited access to agricultural inputs, high costs of production and widespread use of rudimentary methods of farming
Low institutional capacity of government departments e.g. weak agricultural extension services
Few partners interested to implement food related programmes
Strong cultural practices influencing slow uptake of new developmental ideas.
Decentralized system of governance provides government the opportunity to be involved at all levels of development.
Availability of abundant arable land
Fisheries industry is grossly under-utilised
Potential to produce surplus food for sale
Food for seeds programme in
collaboration with FAO
Expansion and diversification of agriculture
Strengthening of early warning systems in order to enhance better response to natural disasters;
Construction of silos to store food at times of plenty;
Formulation of land use policies in order to reduce conflict associated with land.
Construction of roads (feeder and community access)
Provision of technical training to government departments
Targeted youth based programmes through establishment of vocational training at county level.
Continued support to returnees, nutrition programmes through emergency livelihood programmes
NBS Land mines affecting extensive cultivation of land
Inadequate water points for livestock and under-staffing
Poor road network connecting counties within the state
Poor and ill-equipped health facilities in counties
Inadequate sanitation and poor water sources
Low enrolment due to lack of school materials and lack of space for students
More NGO intervention in the development process
Bee keeping potentials in all the counties
Fish farming potential in all the counties
A cattle population of over 13M
Fertile land for agriculture
High population to provide market and demand
Provision of farming tools and modernisation of agriculture
Encourage livestock breeding, dairy farms and poultry farming. Establish accessible health facilities even in remotest payams.
Construct trunk and feeder roads
Increase school enrolment by constructing more permanent classrooms
Warrap Inadequate number of trained staff in all sectors.
Poor crop storage facilities.
Water scarcity during the dry season
Lack of veterinary equipment including slaughter slabs
Lack of a state livestock policy
Lack of policy and bill on
Presence of communication channel (GEMTEL)
Prevailing peace
Construction of Kuajok – Wau road
Construction of dams, boreholes etc
Training of irrigation management and re-introduction of irrigation schemes for rice
Improve livestock marketing
Promote education of girls Provide increased education
facilities, infrastructure and staff
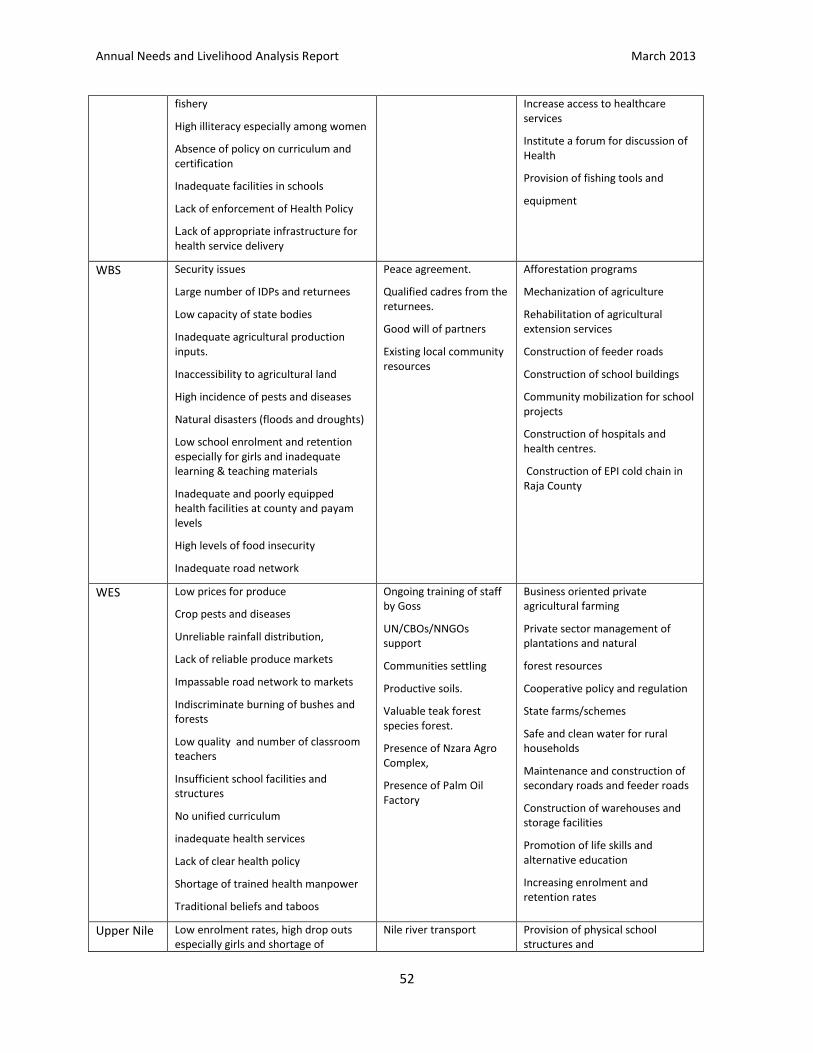
Annual Needs and Livelihood Analysis Report March 2013
52
fishery
High illiteracy especially among women
Absence of policy on curriculum and certification
Inadequate facilities in schools
Lack of enforcement of Health Policy
Lack of appropriate infrastructure for health service delivery
Increase access to healthcare services
Institute a forum for discussion of Health
Provision of fishing tools and
equipment
WBS Security issues
Large number of IDPs and returnees
Low capacity of state bodies
Inadequate agricultural production inputs.
Inaccessibility to agricultural land
High incidence of pests and diseases
Natural disasters (floods and droughts)
Low school enrolment and retention especially for girls and inadequate learning & teaching materials
Inadequate and poorly equipped health facilities at county and payam levels
High levels of food insecurity
Inadequate road network
Peace agreement.
Qualified cadres from the returnees.
Good will of partners
Existing local community resources
Afforestation programs
Mechanization of agriculture
Rehabilitation of agricultural extension services
Construction of feeder roads
Construction of school buildings
Community mobilization for school projects
Construction of hospitals and health centres.
Construction of EPI cold chain in Raja County
WES Low prices for produce
Crop pests and diseases
Unreliable rainfall distribution,
Lack of reliable produce markets
Impassable road network to markets
Indiscriminate burning of bushes and forests
Low quality and number of classroom teachers
Insufficient school facilities and structures
No unified curriculum
inadequate health services
Lack of clear health policy
Shortage of trained health manpower
Traditional beliefs and taboos
Ongoing training of staff by Goss
UN/CBOs/NNGOs support
Communities settling
Productive soils.
Valuable teak forest species forest.
Presence of Nzara Agro Complex,
Presence of Palm Oil Factory
Business oriented private agricultural farming
Private sector management of plantations and natural
forest resources
Cooperative policy and regulation
State farms/schemes
Safe and clean water for rural households
Maintenance and construction of secondary roads and feeder roads
Construction of warehouses and storage facilities
Promotion of life skills and alternative education
Increasing enrolment and retention rates
Upper Nile Low enrolment rates, high drop outs especially girls and shortage of
Nile river transport Provision of physical school structures and
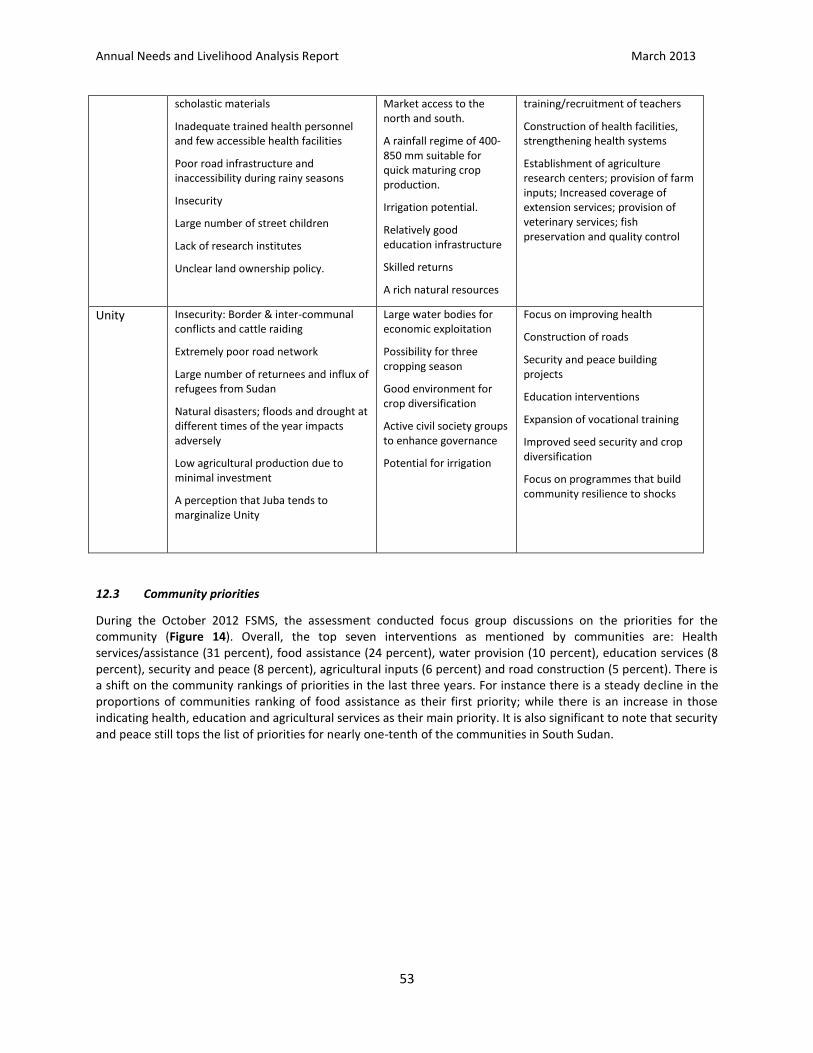
Annual Needs and Livelihood Analysis Report March 2013
53
scholastic materials
Inadequate trained health personnel and few accessible health facilities
Poor road infrastructure and inaccessibility during rainy seasons
Insecurity
Large number of street children
Lack of research institutes
Unclear land ownership policy.
Market access to the north and south.
A rainfall regime of 400-850 mm suitable for quick maturing crop production.
Irrigation potential.
Relatively good education infrastructure
Skilled returns
A rich natural resources
training/recruitment of teachers
Construction of health facilities, strengthening health systems
Establishment of agriculture research centers; provision of farm inputs; Increased coverage of extension services; provision of veterinary services; fish preservation and quality control
Unity Insecurity: Border & inter-communal conflicts and cattle raiding
Extremely poor road network
Large number of returnees and influx of refugees from Sudan
Natural disasters; floods and drought at different times of the year impacts adversely
Low agricultural production due to minimal investment
A perception that Juba tends to marginalize Unity
Large water bodies for economic exploitation
Possibility for three cropping season
Good environment for crop diversification
Active civil society groups to enhance governance
Potential for irrigation
Focus on improving health
Construction of roads
Security and peace building projects
Education interventions
Expansion of vocational training
Improved seed security and crop diversification
Focus on programmes that build community resilience to shocks
12.3 Community priorities
During the October 2012 FSMS, the assessment conducted focus group discussions on the priorities for the community (Figure 14). Overall, the top seven interventions as mentioned by communities are: Health services/assistance (31 percent), food assistance (24 percent), water provision (10 percent), education services (8 percent), security and peace (8 percent), agricultural inputs (6 percent) and road construction (5 percent). There is a shift on the community rankings of priorities in the last three years. For instance there is a steady decline in the proportions of communities ranking of food assistance as their first priority; while there is an increase in those indicating health, education and agricultural services as their main priority. It is also significant to note that security and peace still tops the list of priorities for nearly one-tenth of the communities in South Sudan.
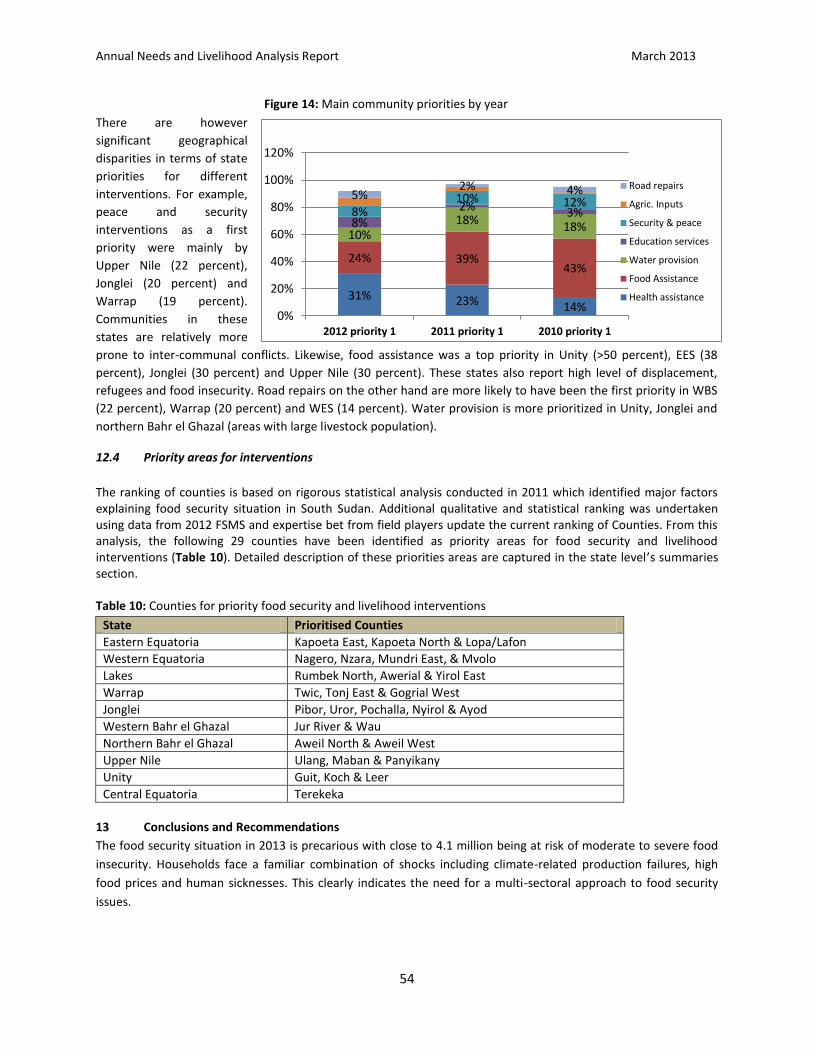
Annual Needs and Livelihood Analysis Report March 2013
54
31% 23% 14%
24% 39% 43%
10% 18%
18% 8% 2% 3% 8%
10% 12% 5%
2% 4%
0%
20%
40%
60%
80%
100%
120%
2012 priority 1 2011 priority 1 2010 priority 1
Road repairs
Agric. Inputs
Security & peace
Education services
Water provision
Food Assistance
Health assistance
Figure 14: Main community priorities by year
There are however
significant geographical
disparities in terms of state
priorities for different
interventions. For example,
peace and security
interventions as a first
priority were mainly by
Upper Nile (22 percent),
Jonglei (20 percent) and
Warrap (19 percent).
Communities in these
states are relatively more
prone to inter-communal conflicts. Likewise, food assistance was a top priority in Unity (>50 percent), EES (38
percent), Jonglei (30 percent) and Upper Nile (30 percent). These states also report high level of displacement,
refugees and food insecurity. Road repairs on the other hand are more likely to have been the first priority in WBS
(22 percent), Warrap (20 percent) and WES (14 percent). Water provision is more prioritized in Unity, Jonglei and
northern Bahr el Ghazal (areas with large livestock population).
12.4 Priority areas for interventions
The ranking of counties is based on rigorous statistical analysis conducted in 2011 which identified major factors explaining food security situation in South Sudan. Additional qualitative and statistical ranking was undertaken using data from 2012 FSMS and expertise bet from field players update the current ranking of Counties. From this analysis, the following 29 counties have been identified as priority areas for food security and livelihood interventions (Table 10). Detailed description of these priorities areas are captured in the state level’s summaries section.
Table 10: Counties for priority food security and livelihood interventions
State Prioritised Counties
Eastern Equatoria Kapoeta East, Kapoeta North & Lopa/Lafon
Western Equatoria Nagero, Nzara, Mundri East, & Mvolo
Lakes Rumbek North, Awerial & Yirol East
Warrap Twic, Tonj East & Gogrial West
Jonglei Pibor, Uror, Pochalla, Nyirol & Ayod
Western Bahr el Ghazal Jur River & Wau
Northern Bahr el Ghazal Aweil North & Aweil West
Upper Nile Ulang, Maban & Panyikany
Unity Guit, Koch & Leer
Central Equatoria Terekeka
13 Conclusions and Recommendations
The food security situation in 2013 is precarious with close to 4.1 million being at risk of moderate to severe food
insecurity. Households face a familiar combination of shocks including climate-related production failures, high
food prices and human sicknesses. This clearly indicates the need for a multi-sectoral approach to food security
issues.
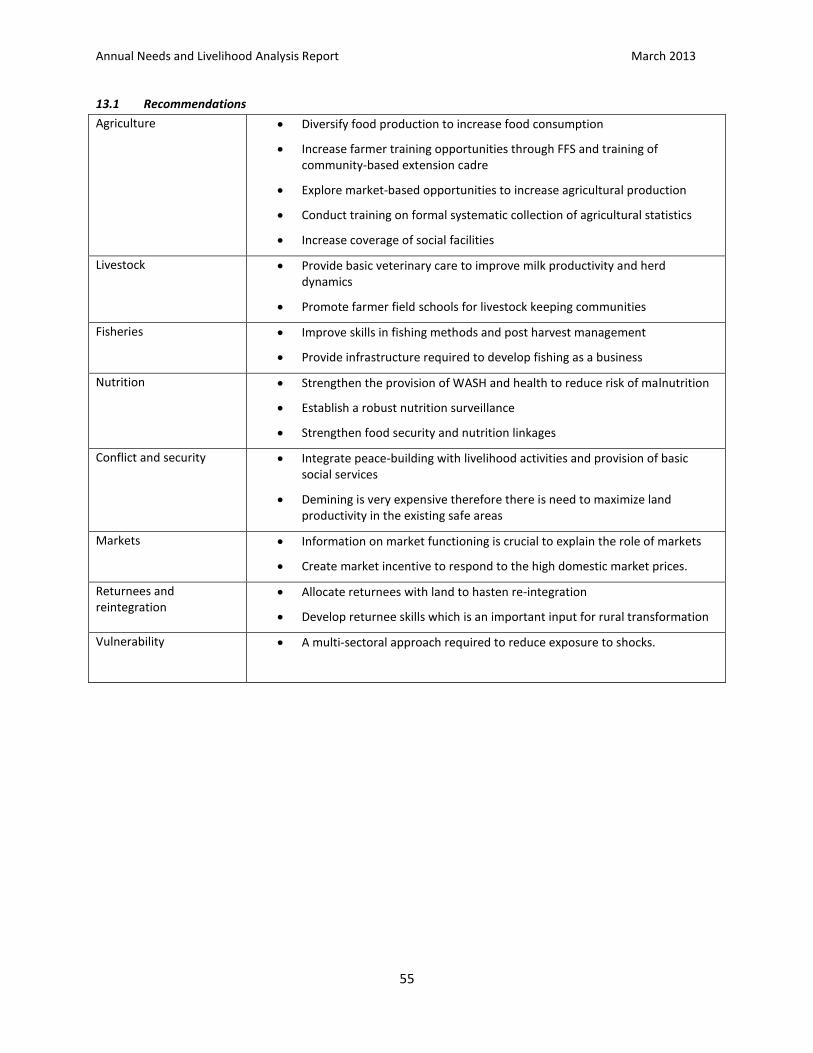
Annual Needs and Livelihood Analysis Report March 2013
55
13.1 Recommendations
Agriculture Diversify food production to increase food consumption
Increase farmer training opportunities through FFS and training of community-based extension cadre
Explore market-based opportunities to increase agricultural production
Conduct training on formal systematic collection of agricultural statistics
Increase coverage of social facilities
Livestock Provide basic veterinary care to improve milk productivity and herd dynamics
Promote farmer field schools for livestock keeping communities
Fisheries Improve skills in fishing methods and post harvest management
Provide infrastructure required to develop fishing as a business
Nutrition Strengthen the provision of WASH and health to reduce risk of malnutrition
Establish a robust nutrition surveillance
Strengthen food security and nutrition linkages
Conflict and security Integrate peace-building with livelihood activities and provision of basic social services
Demining is very expensive therefore there is need to maximize land productivity in the existing safe areas
Markets Information on market functioning is crucial to explain the role of markets
Create market incentive to respond to the high domestic market prices.
Returnees and reintegration
Allocate returnees with land to hasten re-integration
Develop returnee skills which is an important input for rural transformation
Vulnerability A multi-sectoral approach required to reduce exposure to shocks.
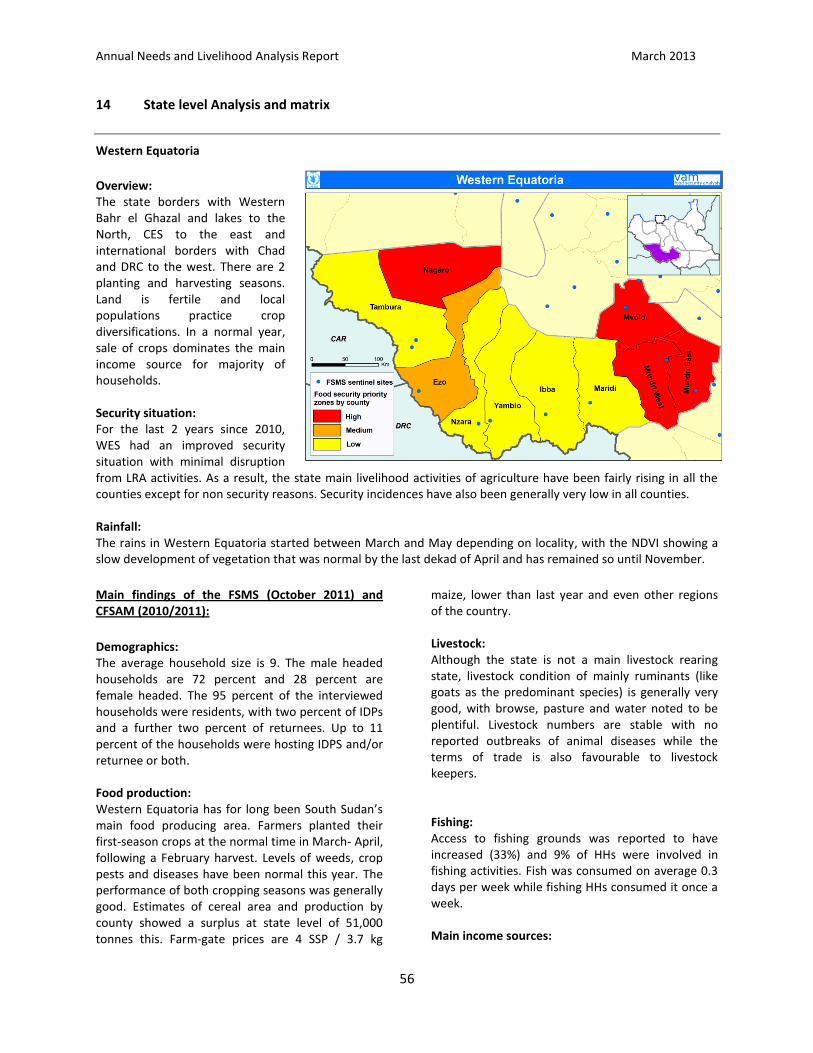
Annual Needs and Livelihood Analysis Report March 2013
56
14 State level Analysis and matrix
Western Equatoria
Overview: The state borders with Western Bahr el Ghazal and lakes to the North, CES to the east and international borders with Chad and DRC to the west. There are 2 planting and harvesting seasons. Land is fertile and local populations practice crop diversifications. In a normal year, sale of crops dominates the main income source for majority of households. Security situation: For the last 2 years since 2010, WES had an improved security situation with minimal disruption from LRA activities. As a result, the state main livelihood activities of agriculture have been fairly rising in all the counties except for non security reasons. Security incidences have also been generally very low in all counties. Rainfall: The rains in Western Equatoria started between March and May depending on locality, with the NDVI showing a slow development of vegetation that was normal by the last dekad of April and has remained so until November.
Main findings of the FSMS (October 2011) and CFSAM (2010/2011):
Demographics: The average household size is 9. The male headed households are 72 percent and 28 percent are female headed. The 95 percent of the interviewed households were residents, with two percent of IDPs and a further two percent of returnees. Up to 11 percent of the households were hosting IDPS and/or returnee or both. Food production: Western Equatoria has for long been South Sudan’s main food producing area. Farmers planted their first-season crops at the normal time in March- April, following a February harvest. Levels of weeds, crop pests and diseases have been normal this year. The performance of both cropping seasons was generally good. Estimates of cereal area and production by county showed a surplus at state level of 51,000 tonnes this. Farm-gate prices are 4 SSP / 3.7 kg
maize, lower than last year and even other regions of the country. Livestock: Although the state is not a main livestock rearing state, livestock condition of mainly ruminants (like goats as the predominant species) is generally very good, with browse, pasture and water noted to be plentiful. Livestock numbers are stable with no reported outbreaks of animal diseases while the terms of trade is also favourable to livestock keepers. Fishing: Access to fishing grounds was reported to have increased (33%) and 9% of HHs were involved in fishing activities. Fish was consumed on average 0.3 days per week while fishing HHs consumed it once a week. Main income sources:
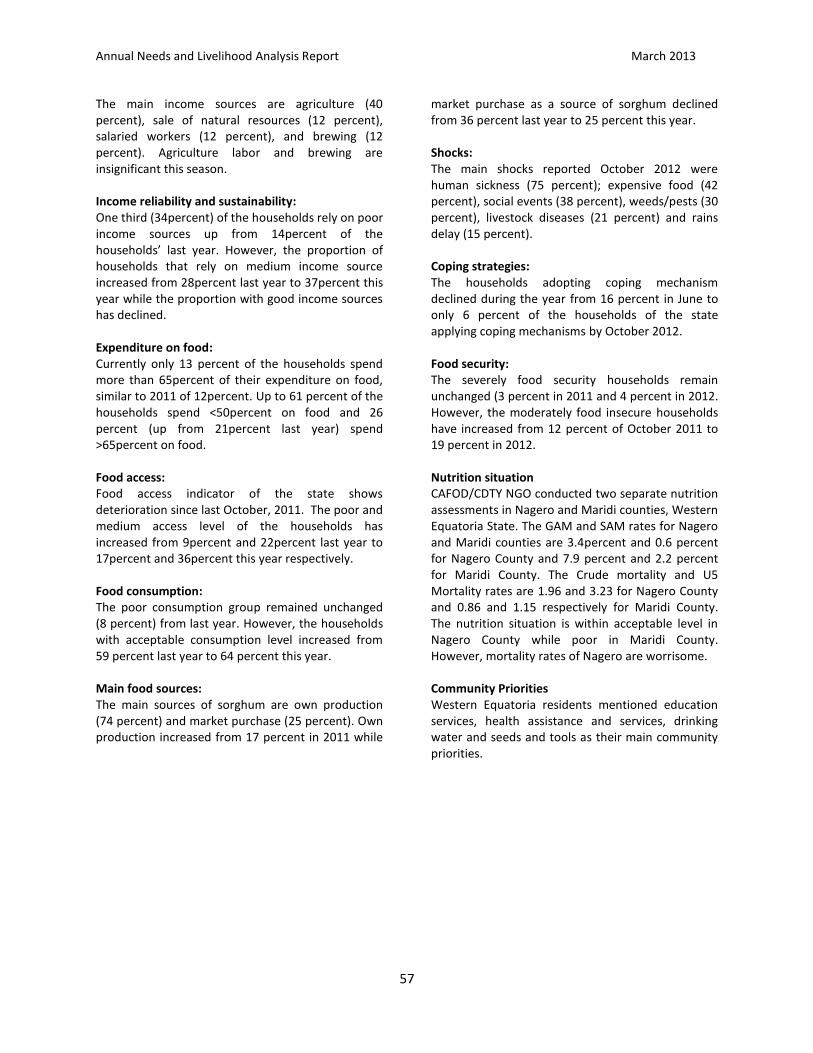
Annual Needs and Livelihood Analysis Report March 2013
57
The main income sources are agriculture (40 percent), sale of natural resources (12 percent), salaried workers (12 percent), and brewing (12 percent). Agriculture labor and brewing are insignificant this season. Income reliability and sustainability: One third (34percent) of the households rely on poor income sources up from 14percent of the households’ last year. However, the proportion of households that rely on medium income source increased from 28percent last year to 37percent this year while the proportion with good income sources has declined. Expenditure on food: Currently only 13 percent of the households spend more than 65percent of their expenditure on food, similar to 2011 of 12percent. Up to 61 percent of the households spend <50percent on food and 26 percent (up from 21percent last year) spend >65percent on food. Food access: Food access indicator of the state shows deterioration since last October, 2011. The poor and medium access level of the households has increased from 9percent and 22percent last year to 17percent and 36percent this year respectively. Food consumption: The poor consumption group remained unchanged (8 percent) from last year. However, the households with acceptable consumption level increased from 59 percent last year to 64 percent this year. Main food sources: The main sources of sorghum are own production (74 percent) and market purchase (25 percent). Own production increased from 17 percent in 2011 while
market purchase as a source of sorghum declined from 36 percent last year to 25 percent this year. Shocks: The main shocks reported October 2012 were human sickness (75 percent); expensive food (42 percent), social events (38 percent), weeds/pests (30 percent), livestock diseases (21 percent) and rains delay (15 percent). Coping strategies: The households adopting coping mechanism declined during the year from 16 percent in June to only 6 percent of the households of the state applying coping mechanisms by October 2012. Food security: The severely food security households remain unchanged (3 percent in 2011 and 4 percent in 2012. However, the moderately food insecure households have increased from 12 percent of October 2011 to 19 percent in 2012. Nutrition situation CAFOD/CDTY NGO conducted two separate nutrition assessments in Nagero and Maridi counties, Western Equatoria State. The GAM and SAM rates for Nagero and Maridi counties are 3.4percent and 0.6 percent for Nagero County and 7.9 percent and 2.2 percent for Maridi County. The Crude mortality and U5 Mortality rates are 1.96 and 3.23 for Nagero County and 0.86 and 1.15 respectively for Maridi County. The nutrition situation is within acceptable level in Nagero County while poor in Maridi County. However, mortality rates of Nagero are worrisome. Community Priorities Western Equatoria residents mentioned education services, health assistance and services, drinking water and seeds and tools as their main community priorities.

Annual Needs and Livelihood Analysis Report March 2013
58
Table 11: County summary for Western Equatoria State
Priority County Population numbers Trends Other information
Estimated population in 2013*
Estimated Food insecure in 2013
IDP/refugee/ returnee
Food security (annual) % of cereal consumption covered by production***
Severe Moderate 2011/2012 2012/13
Low Mundri West 47,893 2,120 12,780 Ret: 90 Stable 71% 70% Cereal deficit (1,686 t)
Low Mundri East 92,495 - 20,568 Ret: 0 Stable 85% 76% Cereal deficit (1,909t)
Medium Mvolo 94,325 8,350 20,975 Ret: 36 Stable 102% 100% Cereal surplus (58t)
High Nagero
55,269 2,680 7,988 Ret: 154 Stable 152% 1552% Cereal surplus (930 t)
Low Ezo
88,863 1,720 10,370 Ret: 0 Ref: 4,112
Stable 191% 194% Cereal surplus (12,697 t)
High Tambura
63,331 11,213 19,716 Ret: 36 Ref: 704
Deteriorated 143% 211% Cereal surplus (10,195 t)
High Nzara 75,166 3,327 20,057 Ret: 0 Ref: 966
Deteriorated 163% 215% Cereal surplus (12,586 t)
Low Yambio 174,163 - 15,491 Ret: 175 Stable 135% 144% Cereal surplus (11,115 t)
Low Ibba 55,059 - 11,325 Ret: 0 Ref: 5,754
Stable 195% 197% Cereal surplus (6,775 t)
Medium Maridi 92,173 - 1,666 Ret: 0 324
Stable 99% 121% Cereal surplus (2,969 t)
*based on2.052% growth rate **FSMS Round 8 data disaggregated by counties ***CFSAM 2012 production coverage for the state with trend compared to 2011 production
Annual Needs and Livelihood Analysis Report March 2013
59
Eastern Equatoria
Overview: Eastern Equatoria has varied livelihood zones depending on the agro-climatic characteristics which include hills and mountains covering parts of Magwi, Ikwoto, Budi, Lafon/Lopa and Torit. The greenbelt covers some parts of Magwi only. In Lafon/Lopa, there is also a stripe of Iron Stone Plateau, while pastoral livelihood zone covers the Greater Kapoeta Counties. The State is bordered by Central Equatoria to the North West and Jonglei to the North and enjoys common international borders with Ethiopia and Kenya to the East and Uganda to the South East. The State’s proximity to Ethiopia, Kenya and Uganda play greater roles in influencing food access and availability through markets. The cross border trade had significantly contributed to improving food security and livelihoods of the people. Security situation: The security situation in the State is generally stable except for a few incidences of cattle raiding between Greater Kapoeta and Budi County. There had been few cases of armed criminals along Torit-Kapoeta road with incidents of killing people that inflicted fears among the community and affected business activities in the State. Some 36 percent of the households reported insecurity comprising cattle raiding (31 percent) while the rest was inter-communal fighting and armed skirmishes. Rainfall performance The rainfall performance in 2012 was slightly better than in 2011.The start of the rains was delayed until mid- April, which is noted to have caused some replanting in Kapoeta for early sown crops. After that blip, the NDVI graph showed a better than average vegetation development due to normal rains for the remainder of the season. Main findings of the FSMS and CFSAM:
Demographics: The average HH size was 7.3 people and about 76% of the HHs were female-headed. Majority (98%) of the population were residents and 3% were
returnees. 5% of the resident HHs were hosting IDP and/or returnee. Food production: 92% of the HHs cultivated in 2010 and the main crops cultivated were sorghum (86%), groundnuts (26%) and sesame (26%). There was a slight increase in overall HHs who cultivated and among those who cultivated sorghum and groundnuts. The CFSAM 2011 estimated the state net cereal production at 99,277mt, a 25% increase from 2010. The production equals to 26,701mt deficit and covers 79% of the state’s needs. Livestock: FAO estimates that the state has 915,000 cattle in 2011. CFSAM observed livestock body condition being very good and the numbers are expected to increase with increasing security. Also, pasture and water availability is expected to be satisfactory. Based on FSMS, 56% of HH own some kind of livestock; 41% goats, 36% own cattle, 27% sheep, and 19% own poultry. Fishing: Access to fishing grounds was reported to have increased (33%) but only 2% of HHs were involved in fishing activities. On average fish was consumed only
Annual Needs and Livelihood Analysis Report March 2013
60
0.2 days per week and the consumption was only slightly higher among those who go fishing (0.8 days per week). Main income sources: The main income sources were sale of natural resources (37%), brewing (19%), livestock (17%) and agriculture (11%). Income reliability and sustainability: The proportion of HHs grouped based on their income sources changed slightly from 2010 with the proportion of HHs with poor income sources increasing by 5 and medium sources by 9 percent points. Currently 36% rely in poor, 44% in medium and 20% in good main income sources. Expenditure on food: On average, HHs allocated 65% of their expenditures on food; more specifically 49% was for cereals alone. The proportion of HHs spending highly (>65% of expenditures) on food has increased from 39% to 55% whereas the proportion of HHs allocating 50-65% on food has remained somewhat stable at 21%. Only 23% allocate less than 50% of expenditures for food. Food access: Over half of the HHs (58%) have poor access, 18% medium access while 24% have good access. This shows a sharp deterioration from 2010 where 42% had poor access, 23% medium access and 35% good access. Food access is a composite indicator derived from HH expenditure on food and reliability of income sources. Food consumption: Food consumption deteriorated in 2011 as compared to 2010. Poor food consumption increased from 15% to 25% while borderline consumption decreased slightly from 38% to 33%. As a result acceptable food consumption declined from 56% to 42%. On average HHs consume staple cereals
6.5 days and protein sources 2.5 days per week. Adults consume 1.5 and children 1.9 meals per day. Main food sources: Market was the main food source in the state; 71% of sorghum, 95% of maize and 70% of pulses were bought from the market while the rest relied on own produce. Compared to 2010, currently some 10 percent points more of HHs rely on markets instead of own production. Shocks: The main shocks reported in the state were delay of rains (75%), expensive food (63%), and human sickness (60%). Compared to 2010, delay of rains was a serious shock as then only 18% reported that a shock. Coping strategies: Currently 53% of the HHs had adopted coping strategies to bridge the gap to access food. This is over 20 percent point higher compared to the situation a year ago. The main coping strategies used were reducing number of meals eaten (43%), eating less preferred and less expensive foods (41%), limiting portion size at meals (34%) and borrowing (31%). Food security: HH food insecurity levels in the state have increased. The percentage of severe food insecurity has increased from 15% to 24%, and moderate food insecurity from 34% to 41%. Currently 35% are food insecure compared to 51% in 2010. When looking at the prevalence, the situation is almost at ANLA 2009 levels. The CFSAM 2011 predicts HH food security to deteriorate from the first quarter of 2012 due to reduced food access because of low food stocks from own production and high food prices. Community priorities The main community priorities identified are food assistance, water, health, and education services.
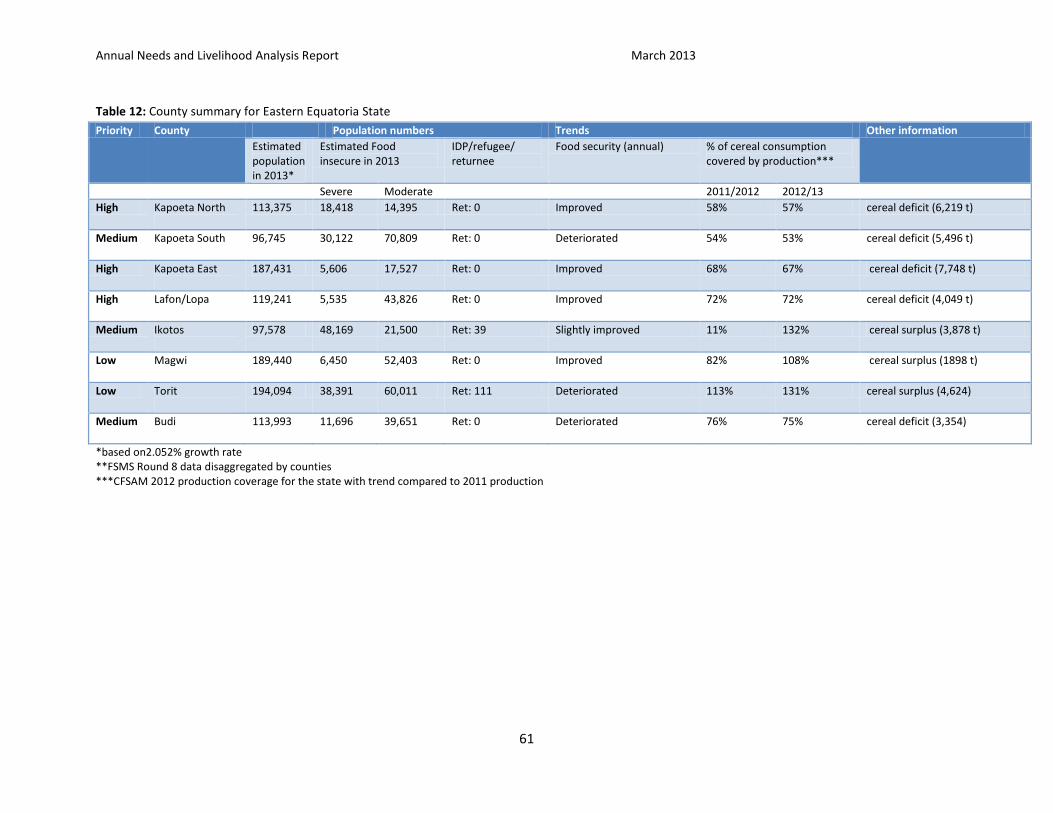
Annual Needs and Livelihood Analysis Report March 2013
61
Table 12: County summary for Eastern Equatoria State
Priority County Population numbers Trends Other information
Estimated population in 2013*
Estimated Food insecure in 2013
IDP/refugee/ returnee
Food security (annual) % of cereal consumption covered by production***
Severe Moderate 2011/2012 2012/13
High Kapoeta North
113,375 18,418 14,395 Ret: 0 Improved 58% 57% cereal deficit (6,219 t)
Medium Kapoeta South
96,745 30,122 70,809 Ret: 0 Deteriorated 54% 53% cereal deficit (5,496 t)
High Kapoeta East
187,431 5,606 17,527 Ret: 0 Improved 68% 67% cereal deficit (7,748 t)
High Lafon/Lopa
119,241 5,535 43,826 Ret: 0 Improved 72% 72% cereal deficit (4,049 t)
Medium Ikotos
97,578 48,169 21,500 Ret: 39 Slightly improved 11% 132% cereal surplus (3,878 t)
Low Magwi
189,440 6,450 52,403 Ret: 0 Improved 82% 108% cereal surplus (1898 t)
Low Torit
194,094 38,391 60,011 Ret: 111 Deteriorated 113% 131% cereal surplus (4,624)
Medium Budi
113,993 11,696 39,651 Ret: 0 Deteriorated 76% 75% cereal deficit (3,354)
*based on2.052% growth rate **FSMS Round 8 data disaggregated by counties ***CFSAM 2012 production coverage for the state with trend compared to 2011 production
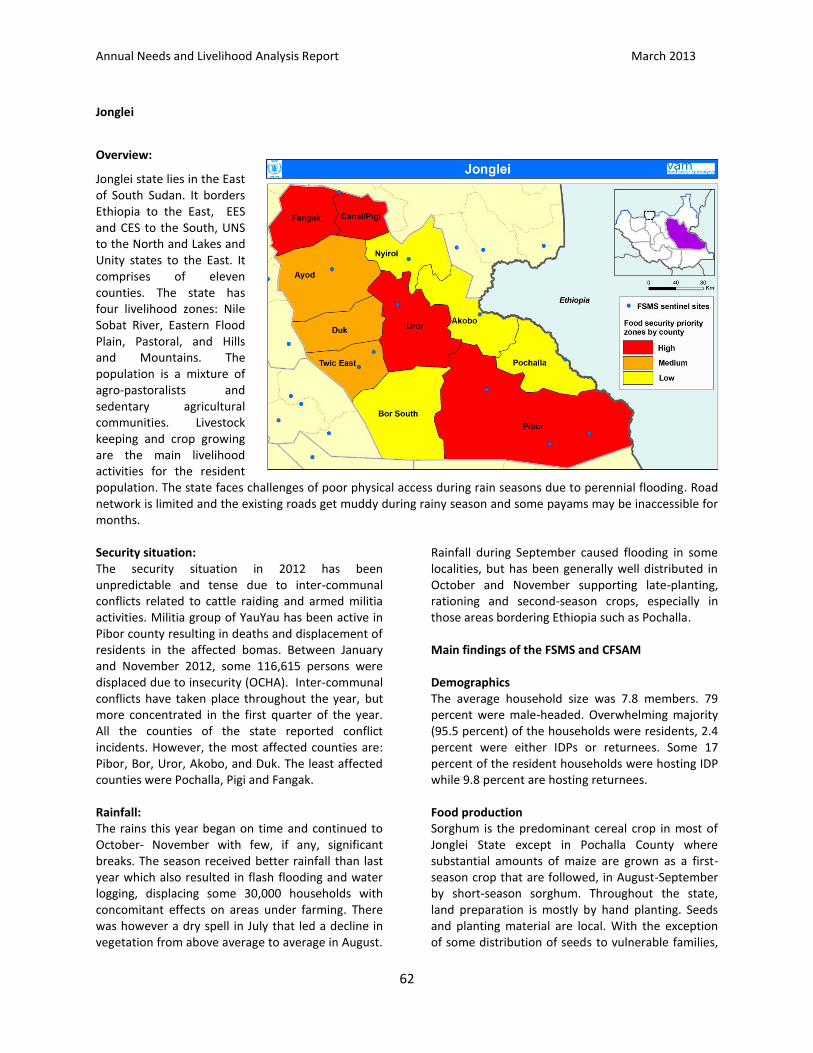
Annual Needs and Livelihood Analysis Report March 2013
62
Jonglei
Overview:
Jonglei state lies in the East of South Sudan. It borders Ethiopia to the East, EES and CES to the South, UNS to the North and Lakes and Unity states to the East. It comprises of eleven counties. The state has four livelihood zones: Nile Sobat River, Eastern Flood Plain, Pastoral, and Hills and Mountains. The population is a mixture of agro-pastoralists and sedentary agricultural communities. Livestock keeping and crop growing are the main livelihood activities for the resident population. The state faces challenges of poor physical access during rain seasons due to perennial flooding. Road network is limited and the existing roads get muddy during rainy season and some payams may be inaccessible for months. Security situation: The security situation in 2012 has been unpredictable and tense due to inter-communal conflicts related to cattle raiding and armed militia activities. Militia group of YauYau has been active in Pibor county resulting in deaths and displacement of residents in the affected bomas. Between January and November 2012, some 116,615 persons were displaced due to insecurity (OCHA). Inter-communal conflicts have taken place throughout the year, but more concentrated in the first quarter of the year. All the counties of the state reported conflict incidents. However, the most affected counties are: Pibor, Bor, Uror, Akobo, and Duk. The least affected counties were Pochalla, Pigi and Fangak. Rainfall: The rains this year began on time and continued to October- November with few, if any, significant breaks. The season received better rainfall than last year which also resulted in flash flooding and water logging, displacing some 30,000 households with concomitant effects on areas under farming. There was however a dry spell in July that led a decline in vegetation from above average to average in August.
Rainfall during September caused flooding in some localities, but has been generally well distributed in October and November supporting late-planting, rationing and second-season crops, especially in those areas bordering Ethiopia such as Pochalla. Main findings of the FSMS and CFSAM Demographics The average household size was 7.8 members. 79 percent were male-headed. Overwhelming majority (95.5 percent) of the households were residents, 2.4 percent were either IDPs or returnees. Some 17 percent of the resident households were hosting IDP while 9.8 percent are hosting returnees. Food production Sorghum is the predominant cereal crop in most of Jonglei State except in Pochalla County where substantial amounts of maize are grown as a first-season crop that are followed, in August-September by short-season sorghum. Throughout the state, land preparation is mostly by hand planting. Seeds and planting material are local. With the exception of some distribution of seeds to vulnerable families,
Annual Needs and Livelihood Analysis Report March 2013
63
inputs, and animal dung supplied by livestock grazing over farmers’ fields on request/ payment, there is minimal application of modern equipment and inputs such as high breed seeds. Fortunately, this year, the level of crop pests - mainly birds, rats and stalk-borers, has not been considered as serious. As per the FSMS findings, 81 percent of the households cultivated during 2012; 78 percent cultivated sorghum, 64percent maize and 8 percent groundnuts. According to CFSAM 2012, the net cereal production in the state is 57,025 tonnes yet the estimated cereal requirement for 2013 is 177,751 tonnes. This thus puts Jonglei to a cereal deficit of 120,726 tonnes. Livestock According to the CFSAM 2012, livestock condition is generally good (PET Body Condition 4-predominant score). There are adequate pasture and water reserves for the coming dry season. However, continuing cattle raiding and inter-communal conflict have led to the movement of cattle closer to urban centres for security considerations, and this has caused heavy grazing and a general deterioration of pasture quality in those areas. Veterinary services such as vaccination programmes are disrupted by access and the closure of the border with Sudan. Fishing Fishing is being conducted as normal and given the vast water resources surrounding Jonglei, the potential to improve both household income and consumption is huge. About 10 percent of the households were involved in fishing activity. Some two percent of the households reported fishing as a main source of income. On average, residents of Jonglei consume fish some 1.9 days per week. Main income sources The main income sources were sale of natural resources firewood—mainly grass and charcoal (26percent), agriculture through sale of cereals and other crops (19 percent), livestock and livestock products (16 percent) and salaried labour (13 percent). Income reliability and sustainability Currently, 24 percent of the households rely on poor income sources compared 27 percent in 2011, mainly sale of nature resources. The medium and
good reliable income sources each account for 37 percent and 39 percent respectively. Expenditure on food About 36 percent of the households allocate more than 65 percent of its monthly expenditure on food; this is lower compared to 44percent in 2011, while 48 percent and 17 percent have low and medium expenditures on food i.e. less than 50 percent and 50 to 65 percent on food respectively. Food access Some 25 percent of the households had poor food access, down from 35 percent in 2011. About 31 percent had medium access to food while 43 percent had good food access. Food access is a combination of income reliability and food expenditure indicators. Food consumption Some 13 percent of the households had poor food consumption and a further 22 percent had borderline consumption which is a decline compared to the 2011 findings (18 percent and 30 percent, respectively in 2011). Approximately 65 percent of the households had acceptable food consumption. On average consumption of stable foods (mainly cereals) is at least 6 days a week, protein is 5 days a week while oil is consumed only 3 days in a week. Main food sources Generally, the main food source was own production and market. 44percent of sorghum and 69percent of maize was from own production while 32percent of Sorghum and 14percent of maize was purchased. 58percent of pulses were from the market, 20percent from food aid and 17percent own stocks. 40percent of vegetables from own production, 30percent from gathering and 26percent from market. Coping strategies About 63 percent of the households adopted coping mechanisms to secure food, higher than in 2011 at 54percent. The most often adopted strategies were reducing the numbers of meals consumed (43 percent), limiting portion size (41 percent), borrowing (40 percent), relying on less preferred food (35 percent), and reducing adults’ consumption for children to eat (26 percent). Food security An estimated nine percent of the households were severely food insecure down from 12 percent in
Annual Needs and Livelihood Analysis Report March 2013
64
2011. The proportion of moderately food insecure has also decreased from 33 percent in 2011 to the current 27 percent. Shocks experienced The main shocks reported were floods (59 percent), expensive food (50 percent), human sickness (46
percent), insecurity (33 percent), and lack of free access/movement and livestock disease (16 percent each) Community priorities Community priorities identified were security and peace, food and drinking water.
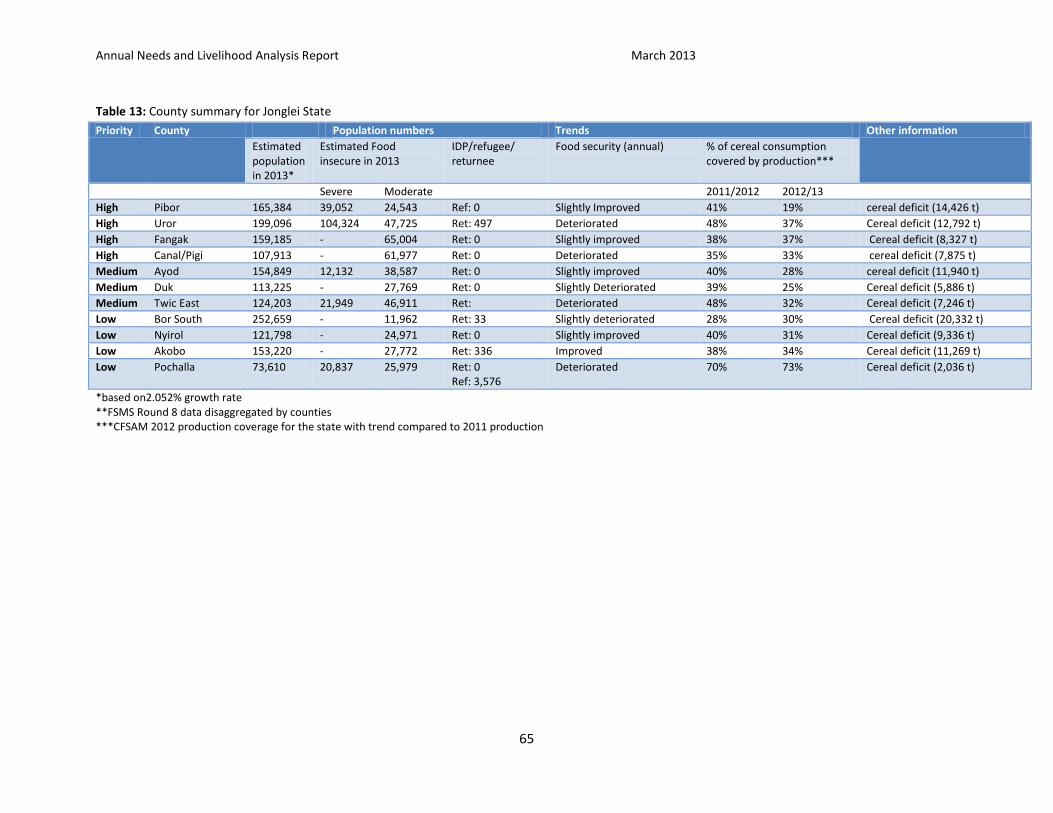
Annual Needs and Livelihood Analysis Report March 2013
65
Table 13: County summary for Jonglei State
Priority County Population numbers Trends Other information
Estimated population in 2013*
Estimated Food insecure in 2013
IDP/refugee/ returnee
Food security (annual) % of cereal consumption covered by production***
Severe Moderate 2011/2012 2012/13
High Pibor 165,384 39,052 24,543 Ref: 0 Slightly Improved 41% 19% cereal deficit (14,426 t)
High Uror 199,096 104,324 47,725 Ret: 497 Deteriorated 48% 37% Cereal deficit (12,792 t)
High Fangak 159,185 - 65,004 Ret: 0 Slightly improved 38% 37% Cereal deficit (8,327 t)
High Canal/Pigi 107,913 - 61,977 Ret: 0 Deteriorated 35% 33% cereal deficit (7,875 t)
Medium Ayod 154,849 12,132 38,587 Ret: 0 Slightly improved 40% 28% cereal deficit (11,940 t)
Medium Duk 113,225 - 27,769 Ret: 0 Slightly Deteriorated 39% 25% Cereal deficit (5,886 t)
Medium Twic East 124,203 21,949 46,911 Ret: Deteriorated 48% 32% Cereal deficit (7,246 t)
Low Bor South 252,659 - 11,962 Ret: 33 Slightly deteriorated 28% 30% Cereal deficit (20,332 t)
Low Nyirol 121,798 - 24,971 Ret: 0 Slightly improved 40% 31% Cereal deficit (9,336 t)
Low Akobo 153,220 - 27,772 Ret: 336 Improved 38% 34% Cereal deficit (11,269 t)
Low Pochalla 73,610 20,837 25,979 Ret: 0 Ref: 3,576
Deteriorated 70% 73% Cereal deficit (2,036 t)
*based on2.052% growth rate **FSMS Round 8 data disaggregated by counties ***CFSAM 2012 production coverage for the state with trend compared to 2011 production
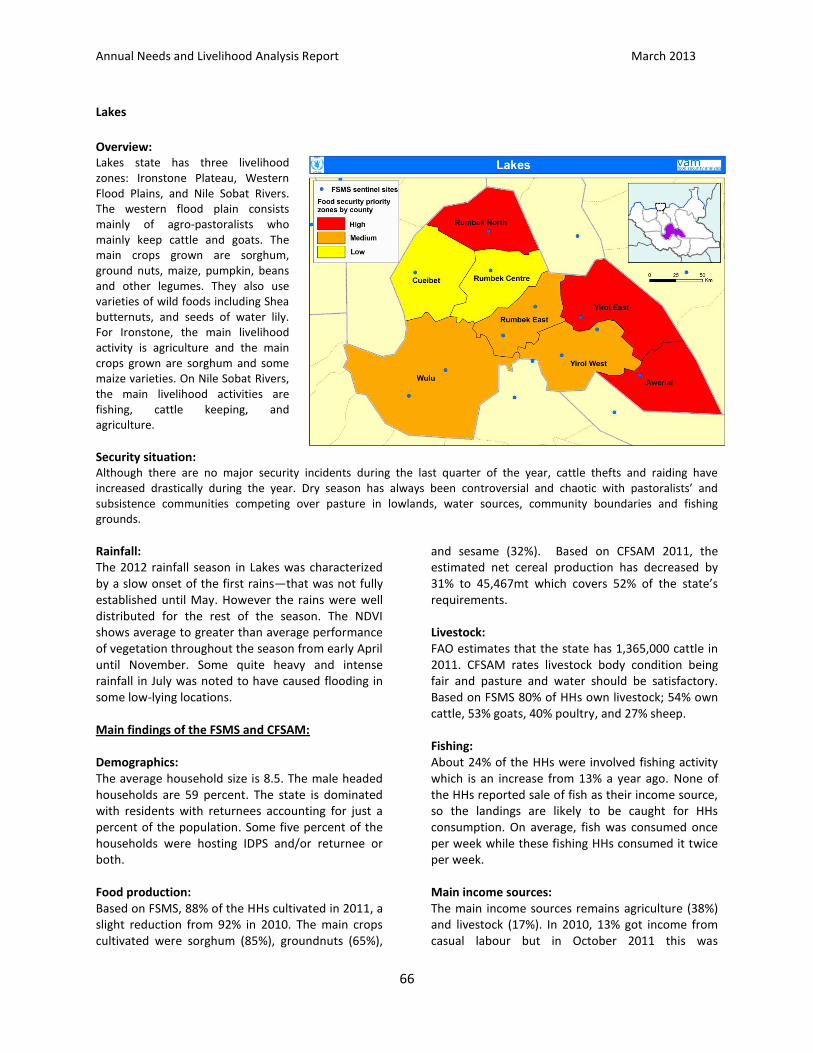
Annual Needs and Livelihood Analysis Report March 2013
66
Lakes
Overview: Lakes state has three livelihood zones: Ironstone Plateau, Western Flood Plains, and Nile Sobat Rivers. The western flood plain consists mainly of agro-pastoralists who mainly keep cattle and goats. The main crops grown are sorghum, ground nuts, maize, pumpkin, beans and other legumes. They also use varieties of wild foods including Shea butternuts, and seeds of water lily. For Ironstone, the main livelihood activity is agriculture and the main crops grown are sorghum and some maize varieties. On Nile Sobat Rivers, the main livelihood activities are fishing, cattle keeping, and agriculture.
Security situation: Although there are no major security incidents during the last quarter of the year, cattle thefts and raiding have increased drastically during the year. Dry season has always been controversial and chaotic with pastoralists’ and subsistence communities competing over pasture in lowlands, water sources, community boundaries and fishing grounds.
Rainfall: The 2012 rainfall season in Lakes was characterized by a slow onset of the first rains—that was not fully established until May. However the rains were well distributed for the rest of the season. The NDVI shows average to greater than average performance of vegetation throughout the season from early April until November. Some quite heavy and intense rainfall in July was noted to have caused flooding in some low-lying locations. Main findings of the FSMS and CFSAM: Demographics: The average household size is 8.5. The male headed households are 59 percent. The state is dominated with residents with returnees accounting for just a percent of the population. Some five percent of the households were hosting IDPS and/or returnee or both. Food production: Based on FSMS, 88% of the HHs cultivated in 2011, a slight reduction from 92% in 2010. The main crops cultivated were sorghum (85%), groundnuts (65%),
and sesame (32%). Based on CFSAM 2011, the estimated net cereal production has decreased by 31% to 45,467mt which covers 52% of the state’s requirements. Livestock: FAO estimates that the state has 1,365,000 cattle in 2011. CFSAM rates livestock body condition being fair and pasture and water should be satisfactory. Based on FSMS 80% of HHs own livestock; 54% own cattle, 53% goats, 40% poultry, and 27% sheep. Fishing: About 24% of the HHs were involved fishing activity which is an increase from 13% a year ago. None of the HHs reported sale of fish as their income source, so the landings are likely to be caught for HHs consumption. On average, fish was consumed once per week while these fishing HHs consumed it twice per week. Main income sources: The main income sources remains agriculture (38%) and livestock (17%). In 2010, 13% got income from casual labour but in October 2011 this was
Annual Needs and Livelihood Analysis Report March 2013
67
practically nill whereas 12% got income from salaried work. Income reliability and sustainability: 11% of the HHs continue to rely on poor income sources, such as sale of natural resources. The proportion of HHs relying on medium income sources has increased 20 % point to 37% and the proportion of those with good income sources has reduced from 72% to 52%. Expenditure on food: Food expenditure has remained somewhat stable for last year. 38% of the HHs allocate more than 65% of their expenditures on food, 44% spend <50% and 18% 50-65% on food. The percentage spent on cereals has decreased from 40% to 33%. Food access: The number of HHs with poor food access has doubled over the year; currently 24% had poor access compared to 12% a year ago. Good food access was constant at 51% whereas the HHs with medium access had reduced from 38% to 25%. Food access is a combination of income reliability and food expenditure indicators. Food consumption: Lakes state saw improvement in food consumption in 2011. In October, 27% had poor food consumption compared to 31% a year ago. Also, the proportion of HHs with borderline consumption has reduced from 36% to 23% indicating that 50% had acceptable consumption. The 2011 measured consumption levels have remained stable in June and now in October. Cereals were consumed on average 4.9 days per week while the average protein (meat, fish, eggs,
pulses) consumption was 4.5 days per week. Adults had 1.7 and children 2.3 meals per day. Main food sources: The main food sources for sorghum were own production (53%) and market (42%); an opposite finding from 2010. Like in 2010, maize was mostly bought from the market (80%) and pulses came from own production (88%). Coping strategies: 47% of the HHs have adopted coping mechanisms to secure food; unchanged from 50% a year ago. The proportion of HHs using coping strategies was the highest in June (86%) in 2011. The most often adopted strategies were skipping days without eating (41%), reducing the number of meals (40%), reducing meal serving size (36%), consumption of cheaper, less preferred food (32%), and limiting adults’ consumption for children to eat (32%). Food security: 15% of the HHs were severely food insecure which is slightly increased from October 2010 (13%). 28% were moderately food insecure and 57% were food secure. Shocks experienced: The main shocks reported in October 2011 were human sickness (71%), expensive food (54%) and floods (35%). There was some 10 percent point increase on the first two shocks while less people felt insecurity as a shock (76% in 2010). Community priorities: The main community priorities identified were food, health and drinking water.
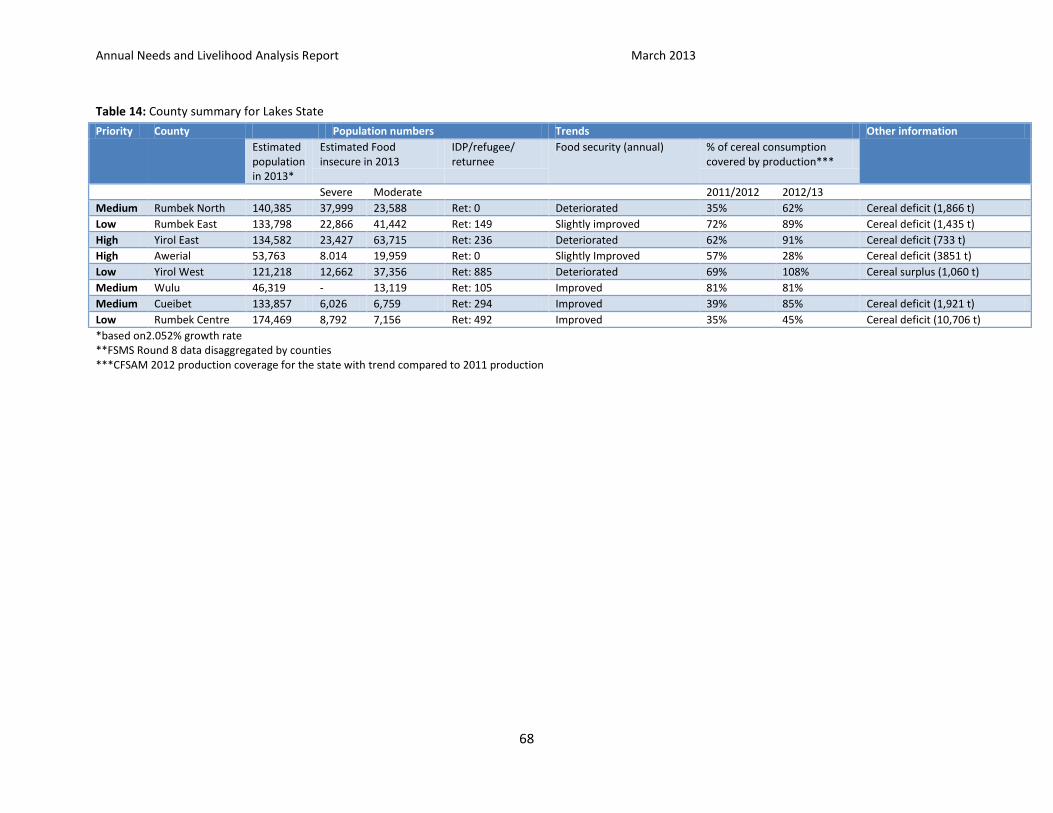
Annual Needs and Livelihood Analysis Report March 2013
68
Table 14: County summary for Lakes State
*based on2.052% growth rate **FSMS Round 8 data disaggregated by counties ***CFSAM 2012 production coverage for the state with trend compared to 2011 production
Priority County Population numbers Trends Other information
Estimated population in 2013*
Estimated Food insecure in 2013
IDP/refugee/ returnee
Food security (annual) % of cereal consumption covered by production***
Severe Moderate 2011/2012 2012/13
Medium Rumbek North 140,385 37,999 23,588 Ret: 0 Deteriorated 35% 62% Cereal deficit (1,866 t)
Low Rumbek East 133,798 22,866 41,442 Ret: 149 Slightly improved 72% 89% Cereal deficit (1,435 t)
High Yirol East 134,582 23,427 63,715 Ret: 236 Deteriorated 62% 91% Cereal deficit (733 t)
High Awerial 53,763 8.014 19,959 Ret: 0 Slightly Improved 57% 28% Cereal deficit (3851 t)
Low Yirol West 121,218 12,662 37,356 Ret: 885 Deteriorated 69% 108% Cereal surplus (1,060 t)
Medium Wulu 46,319 - 13,119 Ret: 105 Improved 81% 81%
Medium Cueibet 133,857 6,026 6,759 Ret: 294 Improved 39% 85% Cereal deficit (1,921 t)
Low Rumbek Centre 174,469 8,792 7,156 Ret: 492 Improved 35% 45% Cereal deficit (10,706 t)
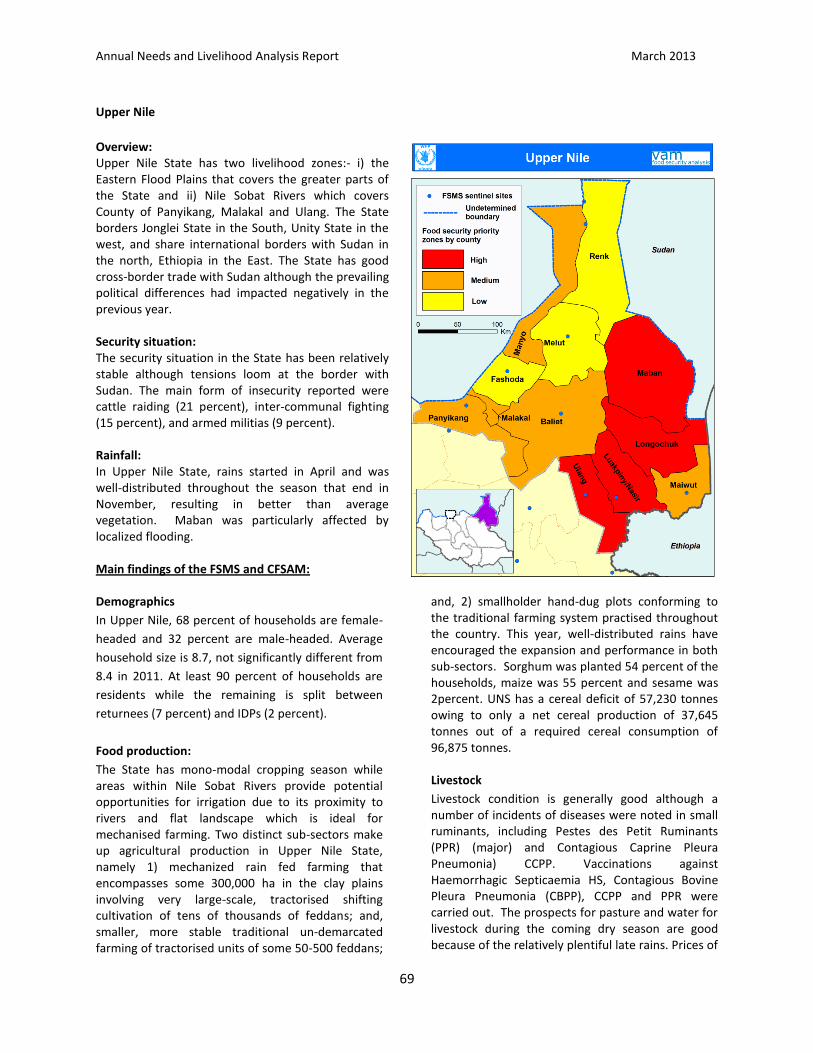
Annual Needs and Livelihood Analysis Report March 2013
69
Upper Nile
Overview: Upper Nile State has two livelihood zones:- i) the Eastern Flood Plains that covers the greater parts of the State and ii) Nile Sobat Rivers which covers County of Panyikang, Malakal and Ulang. The State borders Jonglei State in the South, Unity State in the west, and share international borders with Sudan in the north, Ethiopia in the East. The State has good cross-border trade with Sudan although the prevailing political differences had impacted negatively in the previous year. Security situation: The security situation in the State has been relatively stable although tensions loom at the border with Sudan. The main form of insecurity reported were cattle raiding (21 percent), inter-communal fighting (15 percent), and armed militias (9 percent). Rainfall: In Upper Nile State, rains started in April and was well-distributed throughout the season that end in November, resulting in better than average vegetation. Maban was particularly affected by localized flooding. Main findings of the FSMS and CFSAM: Demographics
In Upper Nile, 68 percent of households are female-
headed and 32 percent are male-headed. Average
household size is 8.7, not significantly different from
8.4 in 2011. At least 90 percent of households are
residents while the remaining is split between
returnees (7 percent) and IDPs (2 percent).
Food production:
The State has mono-modal cropping season while areas within Nile Sobat Rivers provide potential opportunities for irrigation due to its proximity to rivers and flat landscape which is ideal for mechanised farming. Two distinct sub-sectors make up agricultural production in Upper Nile State, namely 1) mechanized rain fed farming that encompasses some 300,000 ha in the clay plains involving very large-scale, tractorised shifting cultivation of tens of thousands of feddans; and, smaller, more stable traditional un-demarcated farming of tractorised units of some 50-500 feddans;
and, 2) smallholder hand-dug plots conforming to the traditional farming system practised throughout the country. This year, well-distributed rains have encouraged the expansion and performance in both sub-sectors. Sorghum was planted 54 percent of the households, maize was 55 percent and sesame was 2percent. UNS has a cereal deficit of 57,230 tonnes owing to only a net cereal production of 37,645 tonnes out of a required cereal consumption of 96,875 tonnes. Livestock
Livestock condition is generally good although a number of incidents of diseases were noted in small ruminants, including Pestes des Petit Ruminants (PPR) (major) and Contagious Caprine Pleura Pneumonia) CCPP. Vaccinations against Haemorrhagic Septicaemia HS, Contagious Bovine Pleura Pneumonia (CBPP), CCPP and PPR were carried out. The prospects for pasture and water for livestock during the coming dry season are good because of the relatively plentiful late rains. Prices of
Annual Needs and Livelihood Analysis Report March 2013
70
animals are firm or increasing. Livestock numbers are not expected to increase as sales match increases. Fishing
The fishing sector is huge but largely unexploited. Main income sources The main income sources in the State are salaried work (26 percent), sale of crop (24 percent), sale of natural resources (11 percent), causal labour in agriculture (9 percent), brewing (6 percent) and sale of livestock (2 percent). Income reliability and sustainability:
There was an improvement in the number of
households using reliable and sustainable income
sources to 31 percent compared to only 16 percent
in 2011. Income sources of medium reliability had
also improved from 27 percent in 2011 to 33 percent
in 2012.
Expenditure on food Generally relative expenditure on food was 61 percent and the expenditure on cereals constituted 29 percent of the overall food expenditure, compared to 63 percent and 13 percent respectively in 2011. Food access An estimated 46 percent of the households had poor food access, 28 percent had medium food access while 26 percent had good food access. This shows a marked decline in households with poor food access from a high of 59 percent in 2011 with equally a corresponding increase on households with good food access from 17 percent in 2011 to the current 26 percent. Food consumption Generally food consumption improved in 2012. The proportion of households with poor food consumption reduced from 21 percent in 2011 to only seven percent in 2012 and those in the borderline also marginally reduced from 15 percent in 2011 to 14 percent in 2012. Main food sources
Market and own productions are the main food sources for households. An estimated 70 percent of the households depend on markets as their main source of food while 21 percent relied on own production. About 85 percent of sorghum was acquired through the markets and 13 percent from own production. Some 72 percent of maize was obtained from own production and 24 percent was sourced from the markets. Even other cereals and tubers were mainly acquired from markets (by 89 percent of the households). Shocks The main shocks reported were: expensive food commodities, human sickness, floods, livestock diseases and delayed rains. Expensive food was reported by 73 percent of the households, human sickness (52 percent), floods (26 percent) and livestock diseases (21 percent). Other shocks reported include weeds/pests (nine percent), delayed rains (eight percent), lack of free movement (eight percent), social event (seven percent), and hosting returnees/IDPs (five percent) while insecurity was reported at two percent. Coping strategies used While some 36 percent households use coping strategies, all are ranked to have low coping strategy indices. The most often used coping strategies were relying on less preferred and less expensive food (17 percent), restricting food consumption by adults (16 percent), relying on relatives (15 percent), reducing number of meals (14 percent), and limiting portion sizes (11 percent). Other coping strategies adopted were sale of animals (4 percent), collection of wild foods (3 percent) and consumption of seed stocks held for next season (2 percent). Food security situation The proportion of severely food insecure households had significantly reduced from 14 percent in 2011 to only six percent in 2012. Moderately food insecure households had also reduced from 57 percent in 2011 to 4 4percent in 2012 whereas food secure households increased 29 percent in 2011 to 50 percent in 2012. Community priorities They main community priorities identified were food aid, health assistance and tools and seeds.
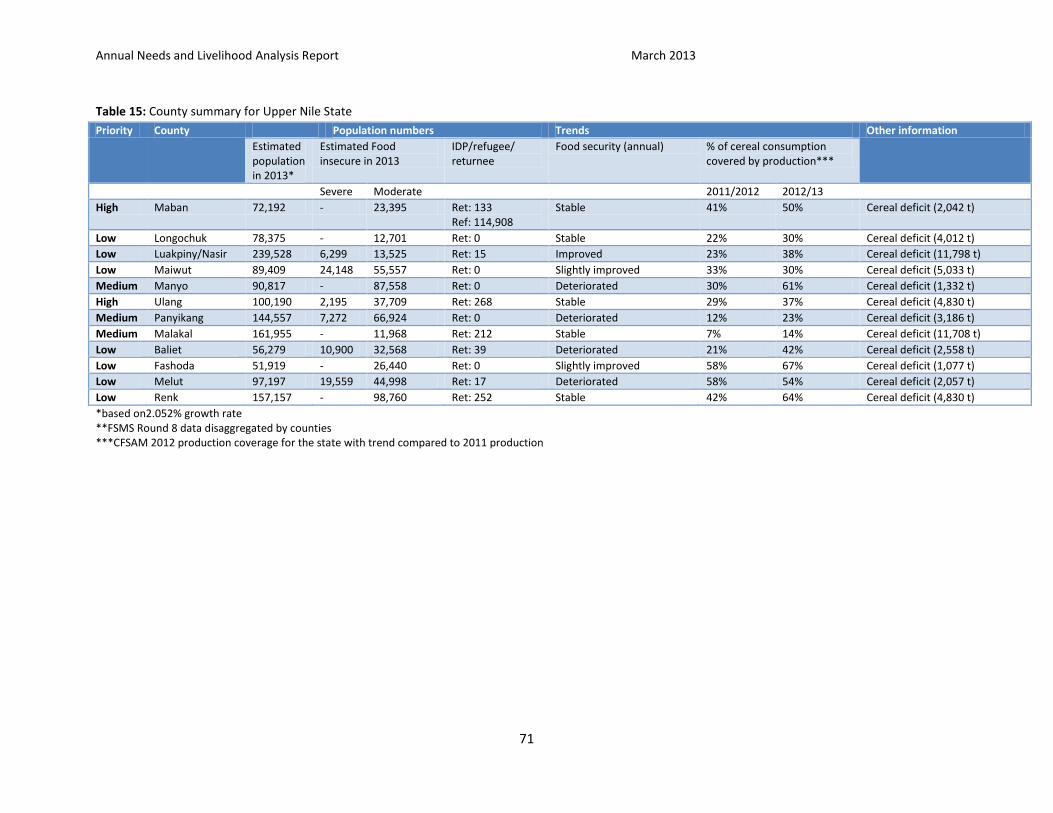
Annual Needs and Livelihood Analysis Report March 2013
71
Table 15: County summary for Upper Nile State
Priority County Population numbers Trends Other information
Estimated population in 2013*
Estimated Food insecure in 2013
IDP/refugee/ returnee
Food security (annual) % of cereal consumption covered by production***
Severe Moderate 2011/2012 2012/13
High Maban 72,192 - 23,395 Ret: 133 Ref: 114,908
Stable 41% 50% Cereal deficit (2,042 t)
Low Longochuk 78,375 - 12,701 Ret: 0 Stable 22% 30% Cereal deficit (4,012 t)
Low Luakpiny/Nasir 239,528 6,299 13,525 Ret: 15 Improved 23% 38% Cereal deficit (11,798 t)
Low Maiwut 89,409 24,148 55,557 Ret: 0 Slightly improved 33% 30% Cereal deficit (5,033 t)
Medium Manyo 90,817 - 87,558 Ret: 0 Deteriorated 30% 61% Cereal deficit (1,332 t)
High Ulang 100,190 2,195 37,709 Ret: 268 Stable 29% 37% Cereal deficit (4,830 t)
Medium Panyikang 144,557 7,272 66,924 Ret: 0 Deteriorated 12% 23% Cereal deficit (3,186 t)
Medium Malakal 161,955 - 11,968 Ret: 212 Stable 7% 14% Cereal deficit (11,708 t)
Low Baliet 56,279 10,900 32,568 Ret: 39 Deteriorated 21% 42% Cereal deficit (2,558 t)
Low Fashoda 51,919 - 26,440 Ret: 0 Slightly improved 58% 67% Cereal deficit (1,077 t)
Low Melut 97,197 19,559 44,998 Ret: 17 Deteriorated 58% 54% Cereal deficit (2,057 t)
Low Renk 157,157 - 98,760 Ret: 252 Stable 42% 64% Cereal deficit (4,830 t)
*based on2.052% growth rate **FSMS Round 8 data disaggregated by counties ***CFSAM 2012 production coverage for the state with trend compared to 2011 production
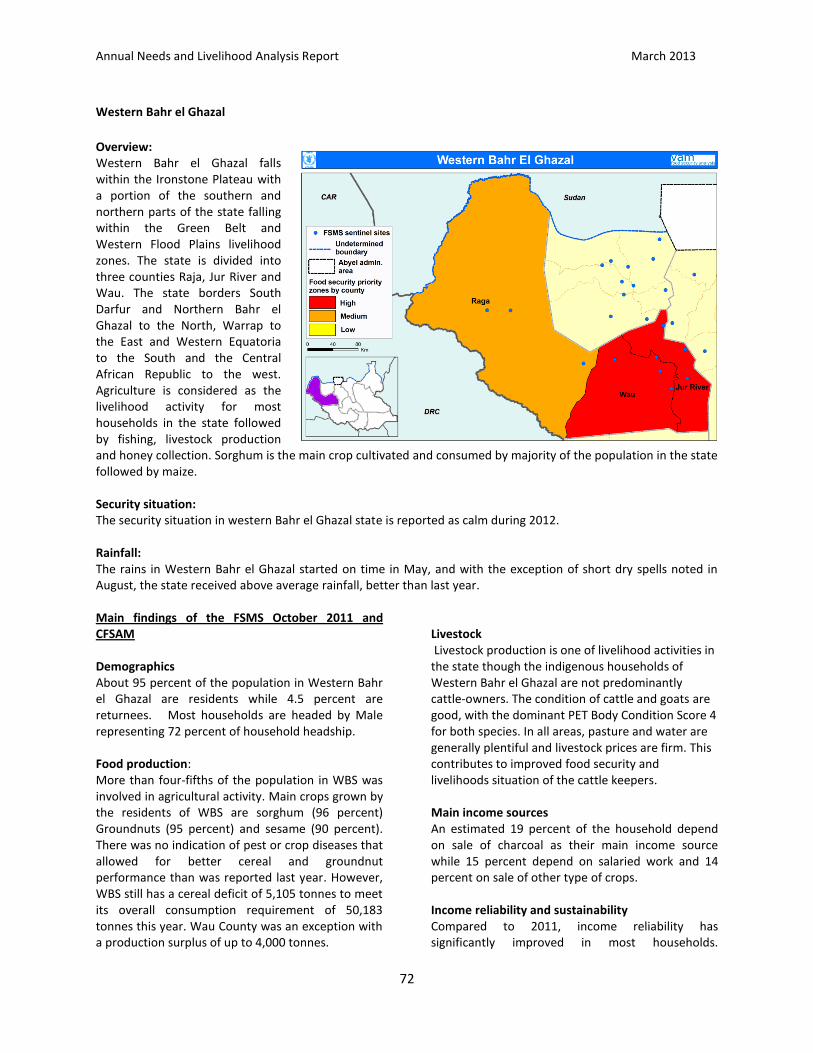
Annual Needs and Livelihood Analysis Report March 2013
72
Western Bahr el Ghazal
Overview: Western Bahr el Ghazal falls within the Ironstone Plateau with a portion of the southern and northern parts of the state falling within the Green Belt and Western Flood Plains livelihood zones. The state is divided into three counties Raja, Jur River and Wau. The state borders South Darfur and Northern Bahr el Ghazal to the North, Warrap to the East and Western Equatoria to the South and the Central African Republic to the west. Agriculture is considered as the livelihood activity for most households in the state followed by fishing, livestock production and honey collection. Sorghum is the main crop cultivated and consumed by majority of the population in the state followed by maize. Security situation: The security situation in western Bahr el Ghazal state is reported as calm during 2012. Rainfall: The rains in Western Bahr el Ghazal started on time in May, and with the exception of short dry spells noted in August, the state received above average rainfall, better than last year. Main findings of the FSMS October 2011 and CFSAM Demographics About 95 percent of the population in Western Bahr el Ghazal are residents while 4.5 percent are returnees. Most households are headed by Male representing 72 percent of household headship. Food production: More than four-fifths of the population in WBS was involved in agricultural activity. Main crops grown by the residents of WBS are sorghum (96 percent) Groundnuts (95 percent) and sesame (90 percent). There was no indication of pest or crop diseases that allowed for better cereal and groundnut performance than was reported last year. However, WBS still has a cereal deficit of 5,105 tonnes to meet its overall consumption requirement of 50,183 tonnes this year. Wau County was an exception with a production surplus of up to 4,000 tonnes.
Livestock Livestock production is one of livelihood activities in the state though the indigenous households of Western Bahr el Ghazal are not predominantly cattle-owners. The condition of cattle and goats are good, with the dominant PET Body Condition Score 4 for both species. In all areas, pasture and water are generally plentiful and livestock prices are firm. This contributes to improved food security and livelihoods situation of the cattle keepers.
Main income sources An estimated 19 percent of the household depend on sale of charcoal as their main income source while 15 percent depend on salaried work and 14 percent on sale of other type of crops.
Income reliability and sustainability Compared to 2011, income reliability has significantly improved in most households.
Annual Needs and Livelihood Analysis Report March 2013
73
Households that rely on income sources of poor reliability decreased from 36 percent in 2011 to 18 percent in 2012 while there was an increase in those with income sources that are reliable form 35 percent in 2011 to 47 percent in 2012. Expenditure on food On averaged households share of expenditure on food was estimated at 39 percent compared to 41 percent in October 2011. This was also reflected in improved food access and availability. Some 39 percent of households allocate more than 65 percent of expenditure on food. Food access Food access improved in 2012 within WBS. Thirty nine percent of households have good food access, an increase from the 29 percent recorded in the 2011 ANLA. About 28 percent had medium food access while 33 percent had poor access to food. Food consumption Food consumption was poorer compared to 2011. An estimated 31 percent had poor food consumption compared to 21percent a year ago. The proportion of borderline food consumption however decreased from 38 percent in 2011 to 35 percent in 2012. Staples were consumed by majority of people in the state—on average cereals are consumed at least 5.2 days in a week while vegetables and proteins consumed 4 days each per week.
Main food sources Markets are the main sources of food for 49 percent of the households in WBS while 38 percent are relying on their own production as sources of sorghum, groundnuts, sesame and other crops production.
Shocks Majority (81 percent) of the households reported high food prices as a main shock in the state followed by human sickness at 79 percent.
Coping strategies Many households adopted coping strategies in order to cope with the food insecurity. Mechanisms adopted include consuming less expensive food (29 percent), consuming limited or reduced number of meals per day (28 percent) and relying on borrowed food (19 percent).
Food security About one-fifth (19.5 percent) of poor households were severely food insecure, an increase from 15.1percent in 2011. The moderate food insecure are 34.1percent, lower than a year ago at 38.5percent while some 46 percent were food secure.
Community priorities Based on the community priorities identified in Western Bahr el Ghazal include: health assistance, road repaired and drinking water.
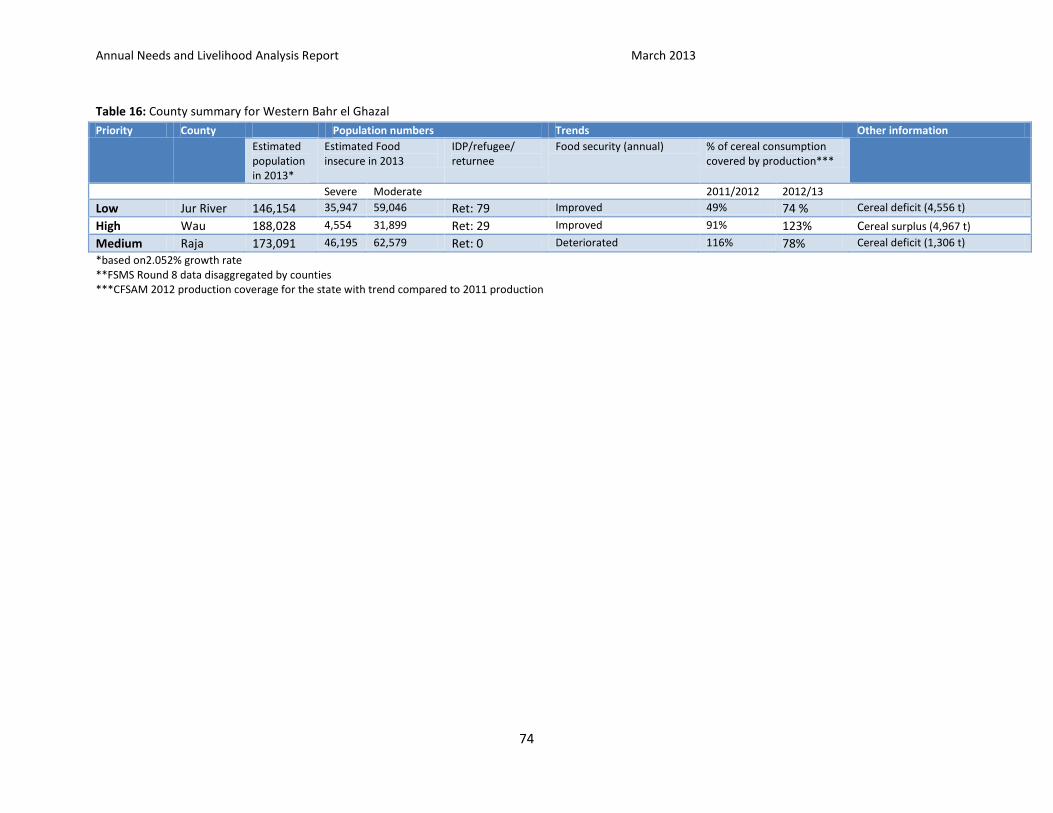
Annual Needs and Livelihood Analysis Report March 2013
74
Table 16: County summary for Western Bahr el Ghazal
Priority County Population numbers Trends Other information
Estimated population in 2013*
Estimated Food insecure in 2013
IDP/refugee/ returnee
Food security (annual) % of cereal consumption covered by production***
Severe Moderate 2011/2012 2012/13
Low Jur River 146,154 35,947 59,046 Ret: 79 Improved 49% 74 % Cereal deficit (4,556 t)
High Wau 188,028 4,554 31,899 Ret: 29 Improved 91% 123% Cereal surplus (4,967 t)
Medium Raja 173,091 46,195 62,579 Ret: 0 Deteriorated 116% 78% Cereal deficit (1,306 t)
*based on2.052% growth rate **FSMS Round 8 data disaggregated by counties ***CFSAM 2012 production coverage for the state with trend compared to 2011 production
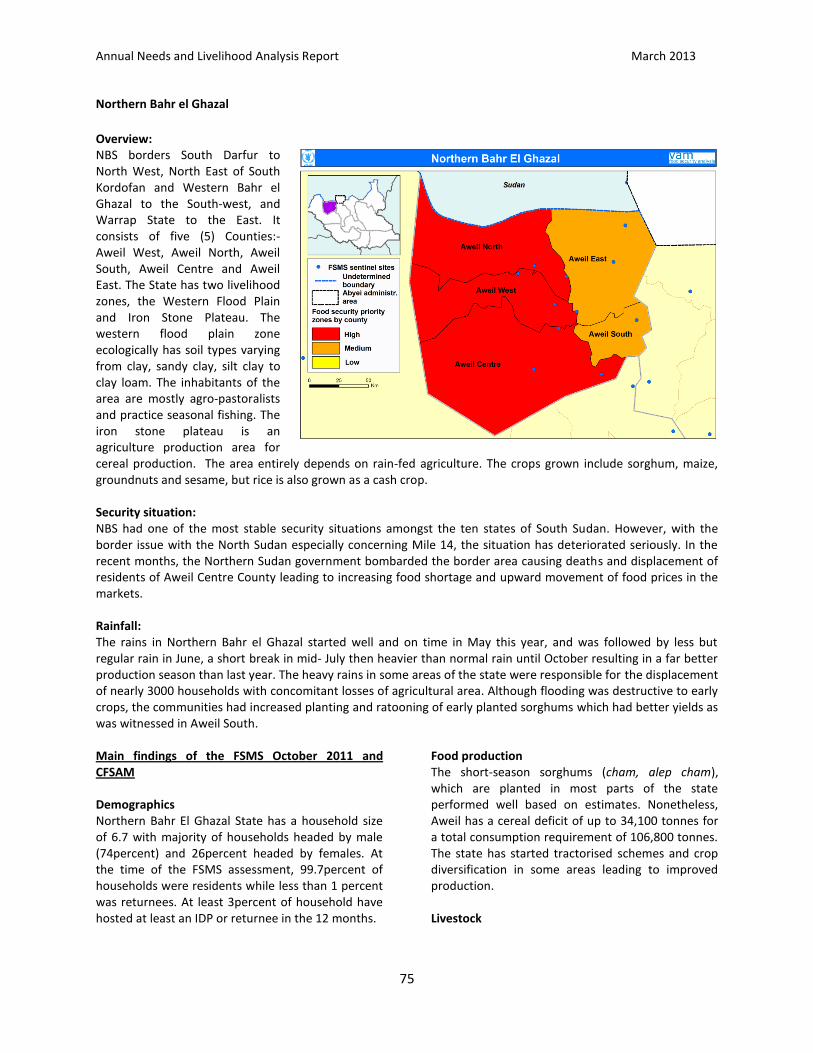
Annual Needs and Livelihood Analysis Report March 2013
75
Northern Bahr el Ghazal
Overview: NBS borders South Darfur to North West, North East of South Kordofan and Western Bahr el Ghazal to the South-west, and Warrap State to the East. It consists of five (5) Counties:-Aweil West, Aweil North, Aweil South, Aweil Centre and Aweil East. The State has two livelihood zones, the Western Flood Plain and Iron Stone Plateau. The western flood plain zone ecologically has soil types varying from clay, sandy clay, silt clay to clay loam. The inhabitants of the area are mostly agro-pastoralists and practice seasonal fishing. The iron stone plateau is an agriculture production area for cereal production. The area entirely depends on rain-fed agriculture. The crops grown include sorghum, maize, groundnuts and sesame, but rice is also grown as a cash crop. Security situation: NBS had one of the most stable security situations amongst the ten states of South Sudan. However, with the border issue with the North Sudan especially concerning Mile 14, the situation has deteriorated seriously. In the recent months, the Northern Sudan government bombarded the border area causing deaths and displacement of residents of Aweil Centre County leading to increasing food shortage and upward movement of food prices in the markets. Rainfall: The rains in Northern Bahr el Ghazal started well and on time in May this year, and was followed by less but regular rain in June, a short break in mid- July then heavier than normal rain until October resulting in a far better production season than last year. The heavy rains in some areas of the state were responsible for the displacement of nearly 3000 households with concomitant losses of agricultural area. Although flooding was destructive to early crops, the communities had increased planting and ratooning of early planted sorghums which had better yields as was witnessed in Aweil South. Main findings of the FSMS October 2011 and CFSAM Demographics Northern Bahr El Ghazal State has a household size of 6.7 with majority of households headed by male (74percent) and 26percent headed by females. At the time of the FSMS assessment, 99.7percent of households were residents while less than 1 percent was returnees. At least 3percent of household have hosted at least an IDP or returnee in the 12 months.
Food production The short-season sorghums (cham, alep cham), which are planted in most parts of the state performed well based on estimates. Nonetheless, Aweil has a cereal deficit of up to 34,100 tonnes for a total consumption requirement of 106,800 tonnes. The state has started tractorised schemes and crop diversification in some areas leading to improved production. Livestock
Annual Needs and Livelihood Analysis Report March 2013
76
Northern Bahr el Ghazal is estimated to have a cattle population of 1.58 million in 2010. Cattle condition is generally excellent. Similar scores are noted for sheep and goats. Due to the good rains, pasture and water are abundant and livestock prices are high and firm throughout the state, despite the border closure. However, border closure has affected trade with the north as manifested in Warwarra, one of the most important cross-border markets for the past 20 years channelling goods from Sudan into South Sudan. There hardly a vehicle along the roads leading to border points while commodities commonly traded on in local markets originate from Uganda. Main income sources The state’s main income sources are: sale of natural resources such as charcoals, fire woods and grass (30 percent), livestock (9 percent), alcohol (19 percent), casual labour (5 percent), skilled labour (4 percent) and fish (one percent). Other important income sources are salaried work (14 percent) and petty trade/small business (6 percent). Income reliability and Sustainability The reliable income sources of the communities in the NBGS are petty trade/small business (14 percent), salaried work (9 percent) and sale of crops (7 percent). The unreliable income sources include sale of natural resources (24 percent), sale of livestock (6 percent) and casual labour (5 percent). Expenditure on food Most of the households in the state spent their meagre income on food with an average expenditure on food at 77 percent, indicating a decline from 80 percent in 2011. Food Access Majority of the population had poor food access (77 percent), medium food access (18 percent) and 5 percent had good food access. In this state, returnees had poor access to food (54 percent) than the residence (40 percent) and IDPs (29 percent) respectively.
Food consumption In NBS food consumption had slightly improved compared to last year the same time. The proportion of households with poor food consumption marginally reduced from 10 percent to 8 percent while those in the borderline food consumption category reduced from 19 percent to 18 percent. Main food sources Own production and markets were the main sources of food for households. Nearly a half (49 percent) of households relied on markets as their main source of food while 38 percent of households relied on own production. Shocks The shocks experienced by the households in the state include human sickness (89 percent), too expensive food (70 percent), weeds and pests (37 percent) and livestock diseases (21 percent). Other shocks reported in the state are insecurity (2 percent), lack of free access to markets (2 percent), delay in rains (2 percent) and late food aid (4 percent). Copying strategies used Households used varied coping strategies such as limiting portion size of food (24 percent), reducing number of meals (24 percent), restricting consumption of food by adults (18 percent), borrowing food (18percent), unusual collection of wild foods (7 percent) and skipping entire days without food (11 percent). Other distress coping strategies used include: unusual sale of more animals (4 percent) and consumption of seed stock (5 percent). Food Security The proportion severely food insecure households were 12 percent, moderately food insecure at 39 percent while the food secure were 49 percent. Community priorities In Northern Bahr El Ghazal, health services, drinking water and food aid were the main community priorities identified.
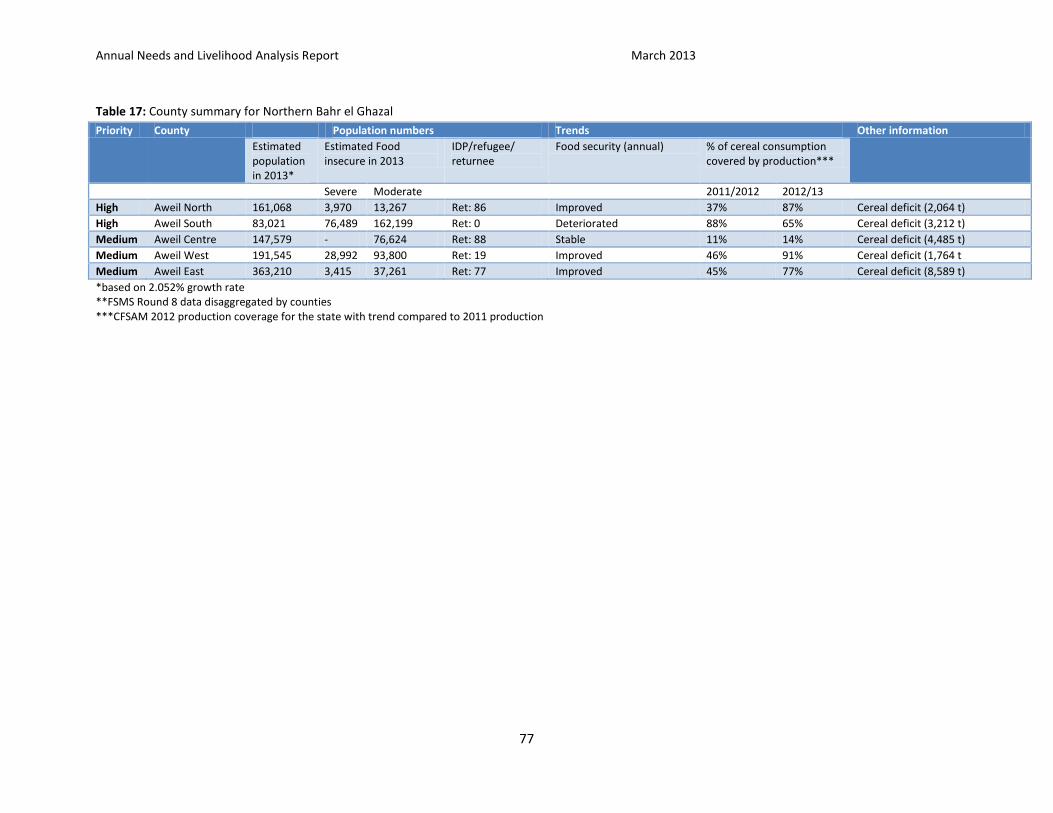
Annual Needs and Livelihood Analysis Report March 2013
77
Table 17: County summary for Northern Bahr el Ghazal
Priority County Population numbers Trends Other information
Estimated population in 2013*
Estimated Food insecure in 2013
IDP/refugee/ returnee
Food security (annual) % of cereal consumption covered by production***
Severe Moderate 2011/2012 2012/13
High Aweil North 161,068 3,970 13,267 Ret: 86 Improved 37% 87% Cereal deficit (2,064 t)
High Aweil South 83,021 76,489 162,199 Ret: 0 Deteriorated 88% 65% Cereal deficit (3,212 t)
Medium Aweil Centre 147,579 - 76,624 Ret: 88 Stable 11% 14% Cereal deficit (4,485 t)
Medium Aweil West 191,545 28,992 93,800 Ret: 19 Improved 46% 91% Cereal deficit (1,764 t
Medium Aweil East 363,210 3,415 37,261 Ret: 77 Improved 45% 77% Cereal deficit (8,589 t)
*based on 2.052% growth rate **FSMS Round 8 data disaggregated by counties ***CFSAM 2012 production coverage for the state with trend compared to 2011 production
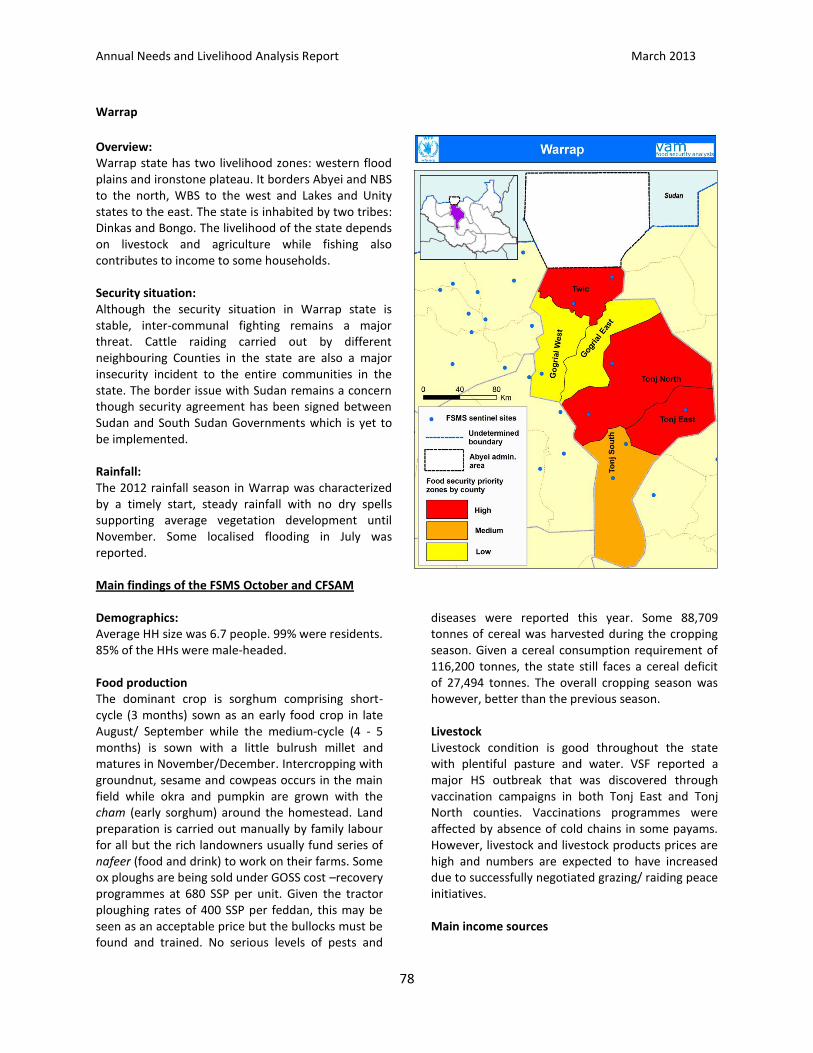
Annual Needs and Livelihood Analysis Report March 2013
78
Warrap
Overview: Warrap state has two livelihood zones: western flood plains and ironstone plateau. It borders Abyei and NBS to the north, WBS to the west and Lakes and Unity states to the east. The state is inhabited by two tribes: Dinkas and Bongo. The livelihood of the state depends on livestock and agriculture while fishing also contributes to income to some households. Security situation: Although the security situation in Warrap state is stable, inter-communal fighting remains a major threat. Cattle raiding carried out by different neighbouring Counties in the state are also a major insecurity incident to the entire communities in the state. The border issue with Sudan remains a concern though security agreement has been signed between Sudan and South Sudan Governments which is yet to be implemented. Rainfall: The 2012 rainfall season in Warrap was characterized by a timely start, steady rainfall with no dry spells supporting average vegetation development until November. Some localised flooding in July was reported. Main findings of the FSMS October and CFSAM Demographics: Average HH size was 6.7 people. 99% were residents. 85% of the HHs were male-headed. Food production The dominant crop is sorghum comprising short-cycle (3 months) sown as an early food crop in late August/ September while the medium-cycle (4 - 5 months) is sown with a little bulrush millet and matures in November/December. Intercropping with groundnut, sesame and cowpeas occurs in the main field while okra and pumpkin are grown with the cham (early sorghum) around the homestead. Land preparation is carried out manually by family labour for all but the rich landowners usually fund series of nafeer (food and drink) to work on their farms. Some ox ploughs are being sold under GOSS cost –recovery programmes at 680 SSP per unit. Given the tractor ploughing rates of 400 SSP per feddan, this may be seen as an acceptable price but the bullocks must be found and trained. No serious levels of pests and
diseases were reported this year. Some 88,709 tonnes of cereal was harvested during the cropping season. Given a cereal consumption requirement of 116,200 tonnes, the state still faces a cereal deficit of 27,494 tonnes. The overall cropping season was however, better than the previous season. Livestock Livestock condition is good throughout the state with plentiful pasture and water. VSF reported a major HS outbreak that was discovered through vaccination campaigns in both Tonj East and Tonj North counties. Vaccinations programmes were affected by absence of cold chains in some payams. However, livestock and livestock products prices are high and numbers are expected to have increased due to successfully negotiated grazing/ raiding peace initiatives. Main income sources
Annual Needs and Livelihood Analysis Report March 2013
79
The main income sources of households were: sale of crops (25 percent), sale of livestock (20 percent), salaried work (11 percent) and brewing (15 percent). Other income sources include sale of natural resources (6 percent) and agriculture labour (3 percent). Income reliability and sustainability The main reliable income source was sale of cereals (15 percent), salaried work (14 percent) and sale of alcohol (12 percent). Other income sources include: sale of natural resources i.e. fire wood, charcoals, grass (18 percent) and petty trade/small business (4 percent). Expenditure on food Majority (64 percent) of households had low expenditure on food (< 50percent), 15 percent had medium expenditure on food (50-65percent) while 21 percent had high expenditure (>65percent). An estimated 88 percent of households also had low expenditure share (less than 25 percent) on cereals. Food access The proportion of households with poor food access was 21 percent, medium (37 percent) while those with good food access were 42 percent. Compared to last year, there was a decline in households with poor food access from 26 percent to 21 percent while those with medium food access increased from 25 percent to 37 percent. Food consumption Warrap state had witnessed a deteriorating condition in food consumption. The households with poor food consumption have increased from 7percent last year to 19percent this year, and those laying in the borderline increased from 15percent to 25percent. Main food sources
Own production and markets were the main food sources for households, with 45 percent of households relying on own production as their main source of food while 26 percent relied on markets as a means of acquiring food. Food aid accounted for 19 percent of food sources while gifts from friends/relatives and gathering of wild foods each accounting for two percent. Shocks The main shocks reported in the state were: too expensive food (74 percent), human sicknesses (72 percent), livestock diseases (39 percent), pests/weeds (22 percent) and flooding (24 percent). Other shocks reported include: delayed in rains (14 percent), lack of free access to movement (9 percent) and insecurity (6 percent). Coping strategies used Households used low coping strategies generally 99percent and only 1percent used medium coping strategy. The most common used strategies in the state were rely on less preferred food 27percent, reduction in number of meals 24percent, borrow food or rely on help from friends/relatives 25percent, limiting portion size of food 18percent and restricting adults from food consumption 18percent. Food security The proportion of severely food insecure households increased from 5 percent in 2011 to 10 percent in 2012 while the proportion of moderately food insecure households also slightly increased from 26 percent to 27 percent this year. Community priorities Health services, food assistance and security were the main community priorities identified in the Warrap state for 2013.
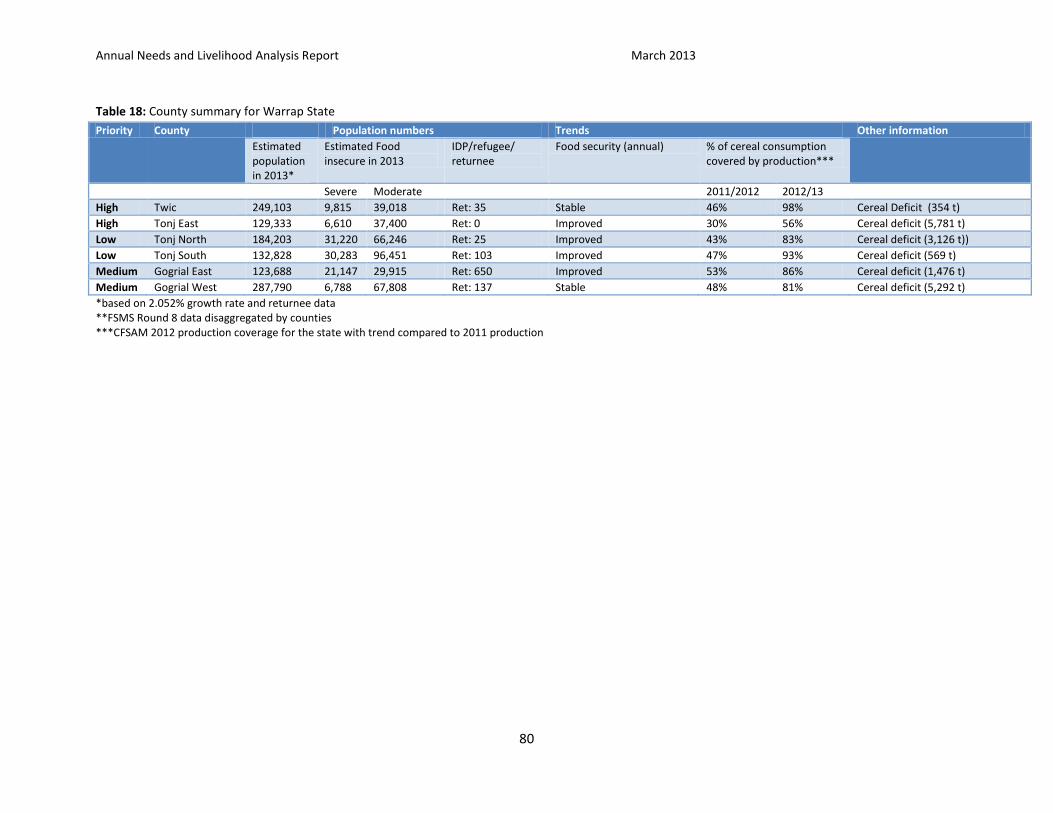
Annual Needs and Livelihood Analysis Report March 2013
80
Table 18: County summary for Warrap State
Priority County Population numbers Trends Other information
Estimated population in 2013*
Estimated Food insecure in 2013
IDP/refugee/ returnee
Food security (annual) % of cereal consumption covered by production***
Severe Moderate 2011/2012 2012/13
High Twic 249,103 9,815 39,018 Ret: 35 Stable 46% 98% Cereal Deficit (354 t)
High Tonj East 129,333 6,610 37,400 Ret: 0 Improved 30% 56% Cereal deficit (5,781 t)
Low Tonj North 184,203 31,220 66,246 Ret: 25 Improved 43% 83% Cereal deficit (3,126 t))
Low Tonj South 132,828 30,283 96,451 Ret: 103 Improved 47% 93% Cereal deficit (569 t)
Medium Gogrial East 123,688 21,147 29,915 Ret: 650 Improved 53% 86% Cereal deficit (1,476 t)
Medium Gogrial West 287,790 6,788 67,808 Ret: 137 Stable 48% 81% Cereal deficit (5,292 t)
*based on 2.052% growth rate and returnee data **FSMS Round 8 data disaggregated by counties ***CFSAM 2012 production coverage for the state with trend compared to 2011 production
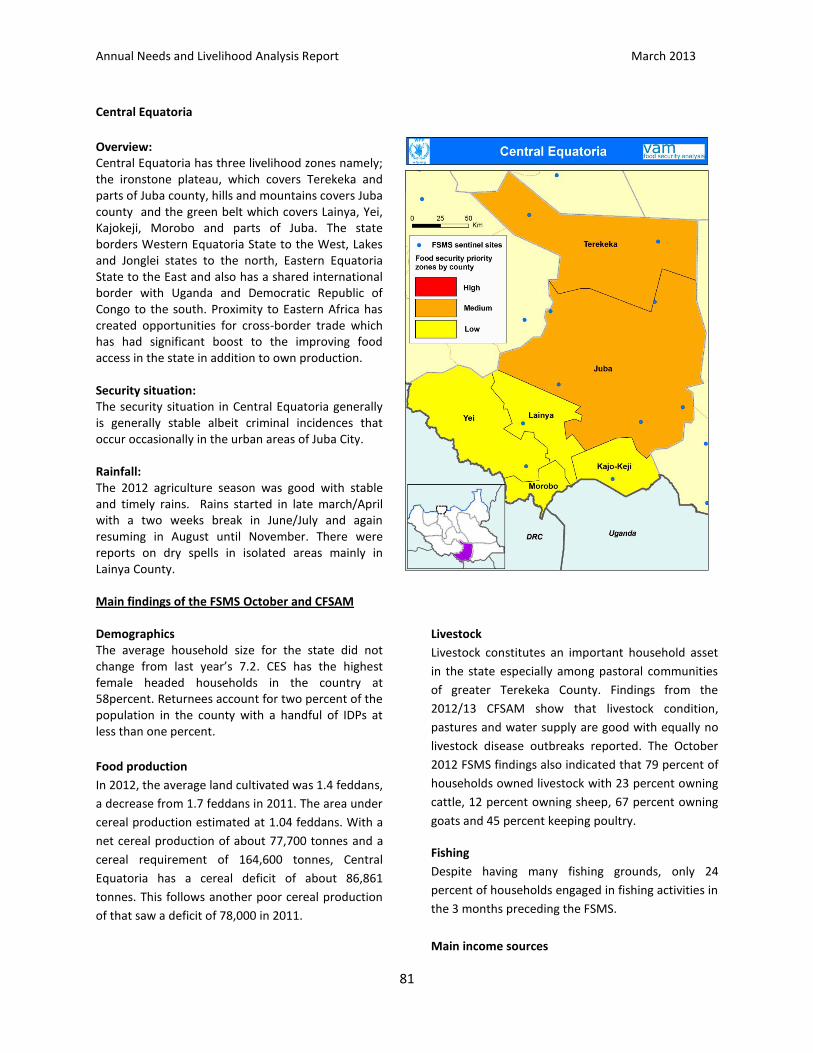
Annual Needs and Livelihood Analysis Report March 2013
81
Central Equatoria
Overview: Central Equatoria has three livelihood zones namely; the ironstone plateau, which covers Terekeka and parts of Juba county, hills and mountains covers Juba county and the green belt which covers Lainya, Yei, Kajokeji, Morobo and parts of Juba. The state borders Western Equatoria State to the West, Lakes and Jonglei states to the north, Eastern Equatoria State to the East and also has a shared international border with Uganda and Democratic Republic of Congo to the south. Proximity to Eastern Africa has created opportunities for cross-border trade which has had significant boost to the improving food access in the state in addition to own production. Security situation: The security situation in Central Equatoria generally is generally stable albeit criminal incidences that occur occasionally in the urban areas of Juba City. Rainfall: The 2012 agriculture season was good with stable and timely rains. Rains started in late march/April with a two weeks break in June/July and again resuming in August until November. There were reports on dry spells in isolated areas mainly in Lainya County. Main findings of the FSMS October and CFSAM Demographics The average household size for the state did not change from last year’s 7.2. CES has the highest female headed households in the country at 58percent. Returnees account for two percent of the population in the county with a handful of IDPs at less than one percent.
Food production
In 2012, the average land cultivated was 1.4 feddans,
a decrease from 1.7 feddans in 2011. The area under
cereal production estimated at 1.04 feddans. With a
net cereal production of about 77,700 tonnes and a
cereal requirement of 164,600 tonnes, Central
Equatoria has a cereal deficit of about 86,861
tonnes. This follows another poor cereal production
of that saw a deficit of 78,000 in 2011.
Livestock
Livestock constitutes an important household asset
in the state especially among pastoral communities
of greater Terekeka County. Findings from the
2012/13 CFSAM show that livestock condition,
pastures and water supply are good with equally no
livestock disease outbreaks reported. The October
2012 FSMS findings also indicated that 79 percent of
households owned livestock with 23 percent owning
cattle, 12 percent owning sheep, 67 percent owning
goats and 45 percent keeping poultry.
Fishing
Despite having many fishing grounds, only 24
percent of households engaged in fishing activities in
the 3 months preceding the FSMS.
Main income sources
Annual Needs and Livelihood Analysis Report March 2013
82
Casual labour in the agriculture sector (accounting
for 22 percent of income activities) provided a
significant income source for most rural households
in the state. Other important income sources
include: sale of crops (25 percent), salaried work (14
percent), Sale of livestock (8 percent) and sale of
charcoal (7 percent).
Income reliability and sustainability
Some 29 percent of households had poorly reliable
income sources, 43 percent had income sources of
medium reliability while 29 percent income sources
of good reliability. There is significant reduction of
the number of households in category of poor
reliability from 50 percent in 2011 versus 29 percent
in 2012.
Expenditure on food
Majority (57 percent) of households had low relative
expenditure on food (less than 50 percent), higher
than in 2011 at 53 percent. The share of expenditure
on food was 46 percent while the share of
expenditure on cereal was 18 percent.
Food access Some 25 percent of households had poor food access to food, 28 percent medium access while 47 percent had good food access. Compared to 2011, there was a reduction of the proportion of households in the poor access category from 41 percent in 2011 to the current 25 percent while that of good food access increased from 25 percent in 2011 to 47 percent in 2012. Food access is a composite indicator derived from food expenditures and income reliability. Food consumption The proportion of households in the poor consumption category remained similar to 2011 at 4 percent. The borderline category was 28 percent while those in the acceptable food consumption group were 68 percent. On average, Individual food types consumed did not change much compared to 2011 season. Households consumed cereals 6.5 days
a week, proteins (5.2 days), Vegetable/fruits (5.8 days), Iron rich foods (2.3 days), Vitamin A rich foods (6.1 days) and oils/fats (3.3 days a week). Main food sources The main food sources are market (49 percent) and own production (46 percent). Fifty six percent of sorghum, 70 percent of maize, 6 5percent of cassava and 75 percent of vegetables are sourced from markets. Shocks The main shocks reported were: Human sickness (82 percent), expensive food (35 percent), livestock diseases (29 percent), weeds/pests (23 percent), social events (13 percent) and flooding mainly in the Terekeka and Mangalla areas was reported 11 percent of the households. Coping strategies used Only 8 percent of households were using coping strategies to bridge the food gap. The most used coping strategies were: relying on less preferred foods (11 percent), borrowing food at (6 percent), limiting portion size at meals and restricting adults from eating meals (5 percent each), reducing the number of meals (4.9 percent) , skipping the entire day without meals (2 percent) ,collecting wilds food and distress sale of livestock at (1 percent each). Nearly all households had low coping strategy index. Food security Food security status of households is calculated by using food availability and access indicators. The proportion of severely food insecure households improved from 3 percent in 2011 to 1 percent this year. The proportion of moderately food insecure households also reduced from 41 percent to 27 percent this year while the food secure increased to 72 percent from 55 percent last year. Community priorities The main community priorities identified were agricultural extension trainings (30 percent), food assistance (20 percent), health assistance (20 percent) and education services (20 percent).
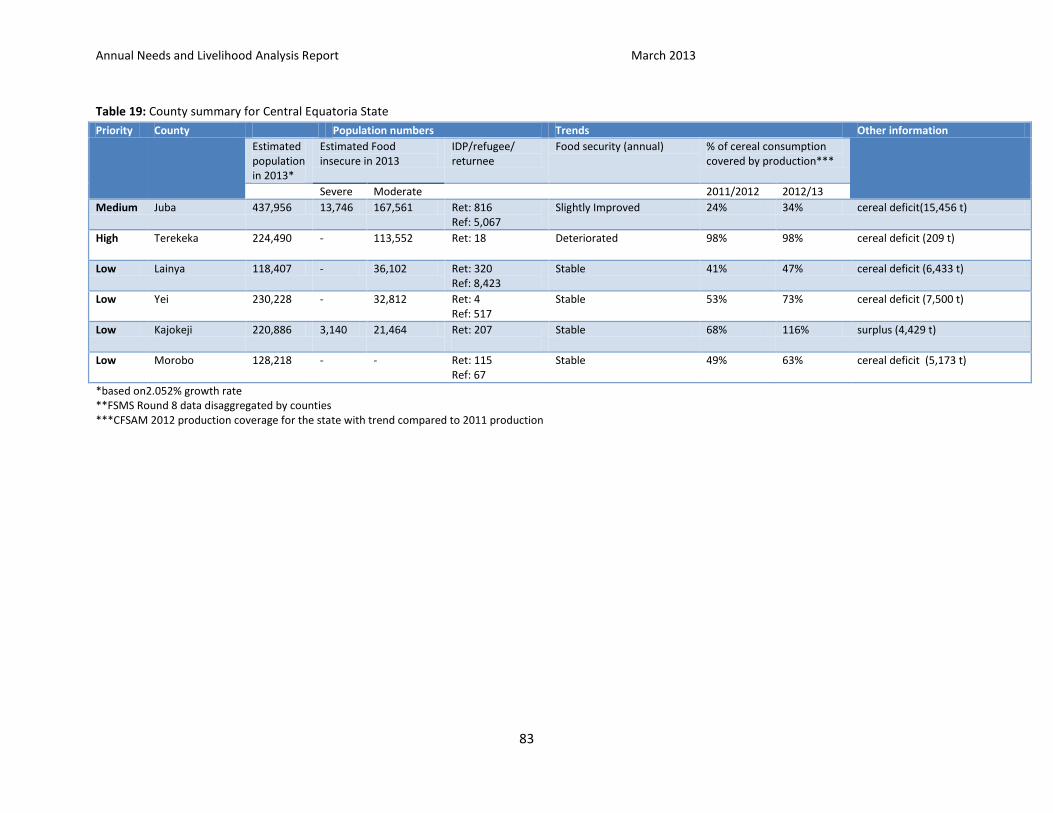
Annual Needs and Livelihood Analysis Report March 2013
83
Table 19: County summary for Central Equatoria State
Priority County Population numbers Trends Other information
Estimated population in 2013*
Estimated Food insecure in 2013
IDP/refugee/ returnee
Food security (annual) % of cereal consumption covered by production***
Severe Moderate 2011/2012 2012/13
Medium Juba 437,956 13,746 167,561 Ret: 816 Ref: 5,067
Slightly Improved 24% 34% cereal deficit(15,456 t)
High Terekeka 224,490 - 113,552 Ret: 18
Deteriorated 98% 98% cereal deficit (209 t)
Low Lainya 118,407 - 36,102 Ret: 320 Ref: 8,423
Stable 41% 47% cereal deficit (6,433 t)
Low Yei 230,228 - 32,812 Ret: 4 Ref: 517
Stable 53% 73% cereal deficit (7,500 t)
Low Kajokeji 220,886 3,140 21,464 Ret: 207
Stable 68% 116% surplus (4,429 t)
Low Morobo 128,218 - - Ret: 115 Ref: 67
Stable 49% 63% cereal deficit (5,173 t)
*based on2.052% growth rate **FSMS Round 8 data disaggregated by counties ***CFSAM 2012 production coverage for the state with trend compared to 2011 production
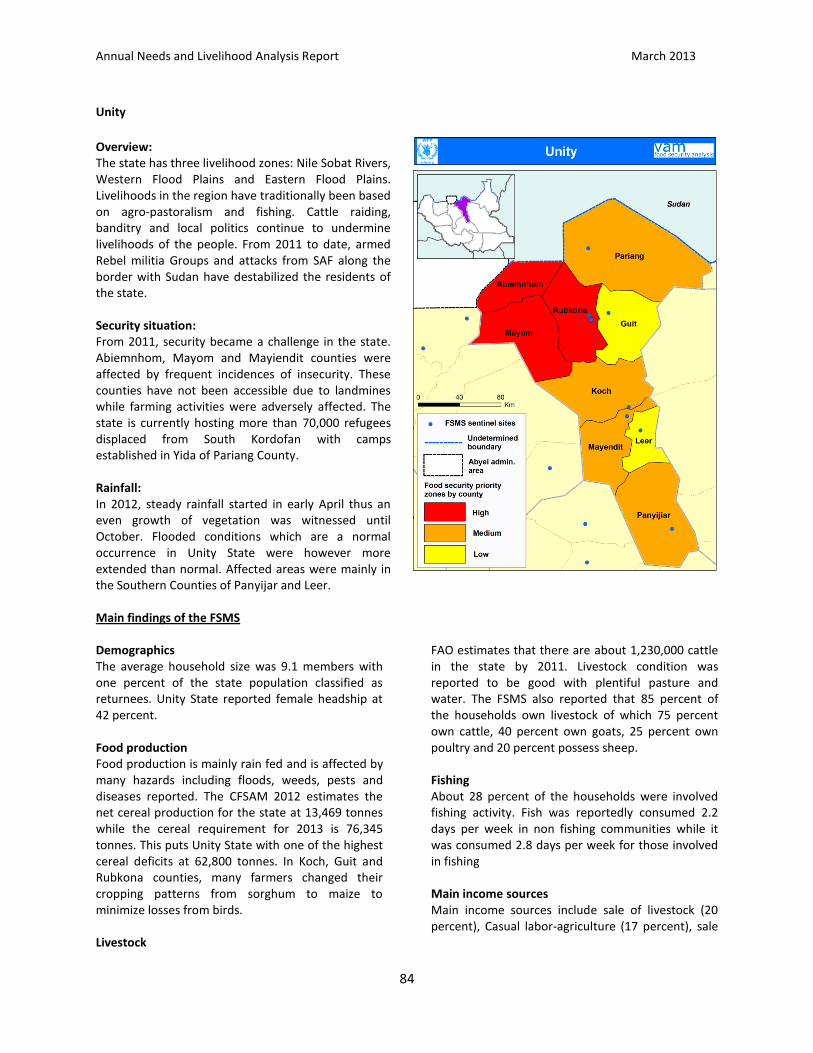
Annual Needs and Livelihood Analysis Report March 2013
84
Unity
Overview: The state has three livelihood zones: Nile Sobat Rivers, Western Flood Plains and Eastern Flood Plains. Livelihoods in the region have traditionally been based on agro‐pastoralism and fishing. Cattle raiding, banditry and local politics continue to undermine livelihoods of the people. From 2011 to date, armed Rebel militia Groups and attacks from SAF along the border with Sudan have destabilized the residents of the state. Security situation: From 2011, security became a challenge in the state. Abiemnhom, Mayom and Mayiendit counties were affected by frequent incidences of insecurity. These counties have not been accessible due to landmines while farming activities were adversely affected. The state is currently hosting more than 70,000 refugees displaced from South Kordofan with camps established in Yida of Pariang County. Rainfall: In 2012, steady rainfall started in early April thus an even growth of vegetation was witnessed until October. Flooded conditions which are a normal occurrence in Unity State were however more extended than normal. Affected areas were mainly in the Southern Counties of Panyijar and Leer. Main findings of the FSMS Demographics The average household size was 9.1 members with one percent of the state population classified as returnees. Unity State reported female headship at 42 percent. Food production Food production is mainly rain fed and is affected by many hazards including floods, weeds, pests and diseases reported. The CFSAM 2012 estimates the net cereal production for the state at 13,469 tonnes while the cereal requirement for 2013 is 76,345 tonnes. This puts Unity State with one of the highest cereal deficits at 62,800 tonnes. In Koch, Guit and Rubkona counties, many farmers changed their cropping patterns from sorghum to maize to minimize losses from birds. Livestock
FAO estimates that there are about 1,230,000 cattle in the state by 2011. Livestock condition was reported to be good with plentiful pasture and water. The FSMS also reported that 85 percent of the households own livestock of which 75 percent own cattle, 40 percent own goats, 25 percent own poultry and 20 percent possess sheep. Fishing About 28 percent of the households were involved fishing activity. Fish was reportedly consumed 2.2 days per week in non fishing communities while it was consumed 2.8 days per week for those involved in fishing Main income sources Main income sources include sale of livestock (20 percent), Casual labor-agriculture (17 percent), sale
Annual Needs and Livelihood Analysis Report March 2013
85
of firewood (14 percent), sale of alcoholic beverages (10 percent) and sale of crops (7 percent). Income reliability and sustainability The FSMS findings showed that 13 percent of the households relied on poor income sources such as sale of natural resources. Slightly more than a half (51 percent) of the households rely on income sources of medium reliability and sustainability while 17 percent have income sources of good reliability. Expenditure on food The proportion of households that spend highly (>65percent of total expenditures) on food increased from 29 percent in 2011 to 70 percent in 2012.Aditionally, 8 percent on the households spend between 50‐65 percent on food and 22 percent spend < 50percent of expenditure on food. Food access Household’s food access did not see any significant changes from 2011. In 2012, 21 percent of households had poor food access, 21 percent medium food access while 58 percent had good food access, an increase from 52 percent in 2011. Food access is a combination of income reliability and food expenditure indicators. Food consumption The proportion of households with poor food consumption increased from two percent in 2011 to 11 percent in 2012 and nearly similar to 2010 findings of 10percent. Borderline food consumption also increased from 12 percent in 2011 to 24 percent in 2012 while the proportion of households with acceptable food consumption reduced from 87 percent in 2011 to 65 percent in 2012. On average, cereals were consumed 6.6 days per week while protein (meat, fish, eggs, pulses) are consumed for 4.5 days per week. Young children consume food
slightly more frequently than adults (2.2 meals per day for children against 2 meals for adults). Main food sources The main staples, sorghum and maize were mostly obtained from own production (67 percent and 89 percent respectively) while market was the main source for the other households food items. Some 53 percent of the households bought pulses from the market while 45 percent used own produce. Shocks experienced The main shocks reported by households were: floods (84 percent), human diseases (83 percent), livestock diseases (55 percent) and too expensive food (48 percent).Other shocks reported were: lack of free access (14 percent) and weeds and pests (7 percent). Coping strategies Generally, 99 percent of households used low coping in 2012. The main coping strategies adopted include: consuming less preferred foods (26 percent), reducing the number of meals eaten per day (24 percent), borrowing food or relying on less expensive foods (24 percent), restricting adults from eating (18 percent) and limiting portion size of food (18 percent). Food security Food security situation has slightly deteriorated in Unity state compared to October 2011. Currently about 4 percent of households are severely food insecure while 23 percent are moderately food insecure with 73 percent food secure. In 2011, one percent were severely and 21 percent moderately food insecure. Community priority Water, health service/assistance and education were the main priorities identified in the Unity State.
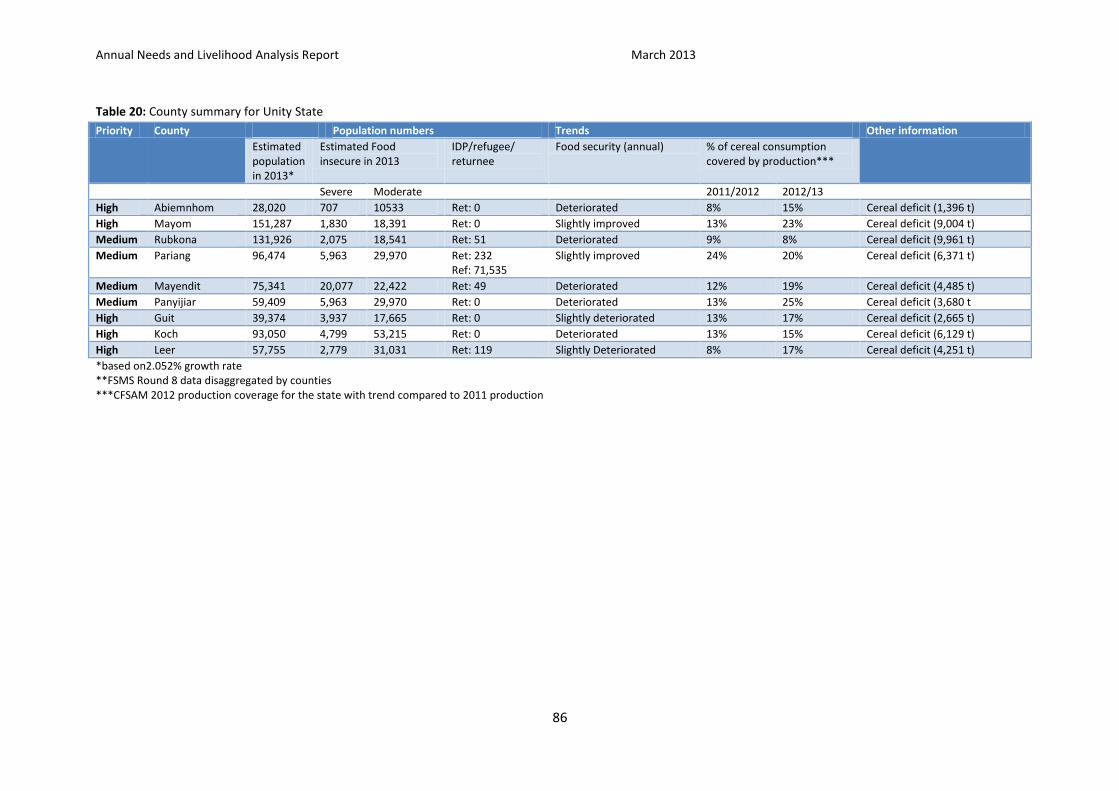
Annual Needs and Livelihood Analysis Report March 2013
86
Table 20: County summary for Unity State
Priority County Population numbers Trends Other information
Estimated population in 2013*
Estimated Food insecure in 2013
IDP/refugee/ returnee
Food security (annual) % of cereal consumption covered by production***
Severe Moderate 2011/2012 2012/13
High Abiemnhom 28,020 707 10533 Ret: 0 Deteriorated 8% 15% Cereal deficit (1,396 t)
High Mayom 151,287 1,830 18,391 Ret: 0 Slightly improved 13% 23% Cereal deficit (9,004 t)
Medium Rubkona 131,926 2,075 18,541 Ret: 51 Deteriorated 9% 8% Cereal deficit (9,961 t)
Medium Pariang 96,474 5,963 29,970 Ret: 232 Ref: 71,535
Slightly improved 24% 20% Cereal deficit (6,371 t)
Medium Mayendit 75,341 20,077 22,422 Ret: 49 Deteriorated 12% 19% Cereal deficit (4,485 t)
Medium Panyijiar 59,409 5,963 29,970 Ret: 0 Deteriorated 13% 25% Cereal deficit (3,680 t
High Guit 39,374 3,937 17,665 Ret: 0 Slightly deteriorated 13% 17% Cereal deficit (2,665 t)
High Koch 93,050 4,799 53,215 Ret: 0 Deteriorated 13% 15% Cereal deficit (6,129 t)
High Leer 57,755 2,779 31,031 Ret: 119 Slightly Deteriorated 8% 17% Cereal deficit (4,251 t)
*based on2.052% growth rate **FSMS Round 8 data disaggregated by counties ***CFSAM 2012 production coverage for the state with trend compared to 2011 production