Embed Size (px)
Citation preview
ACHIEVEMENT GAP DATA SESSIONWashtenaw and Livingston Counties
Achievement Initiatives Team
November 2012
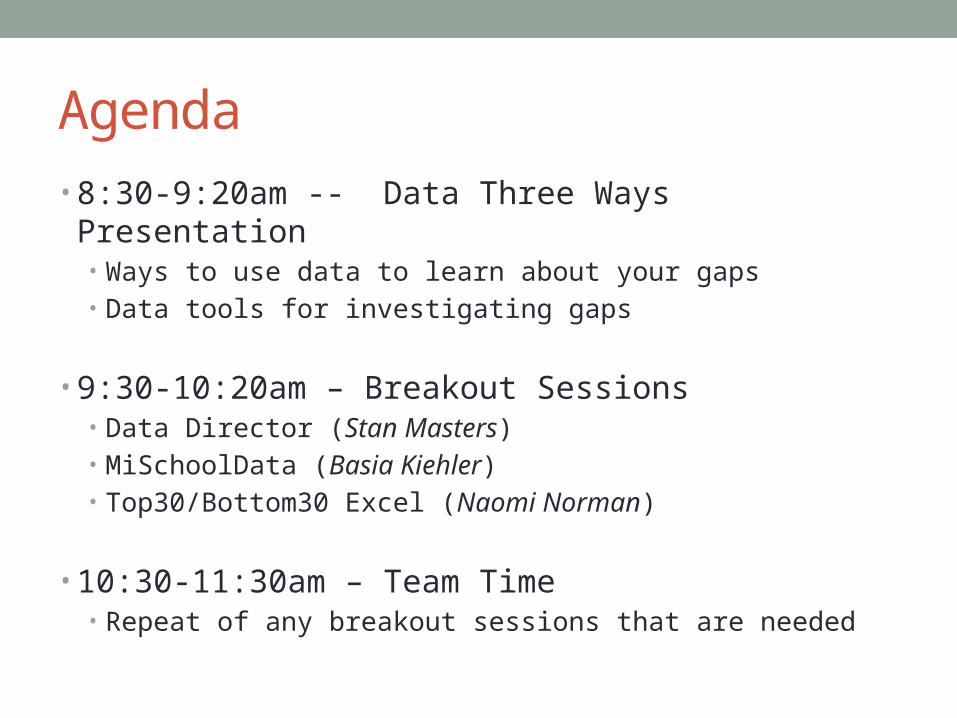
Agenda• 8:30-9:20am -- Data Three Ways Presentation
• Ways to use data to learn about your gaps• Data tools for investigating gaps
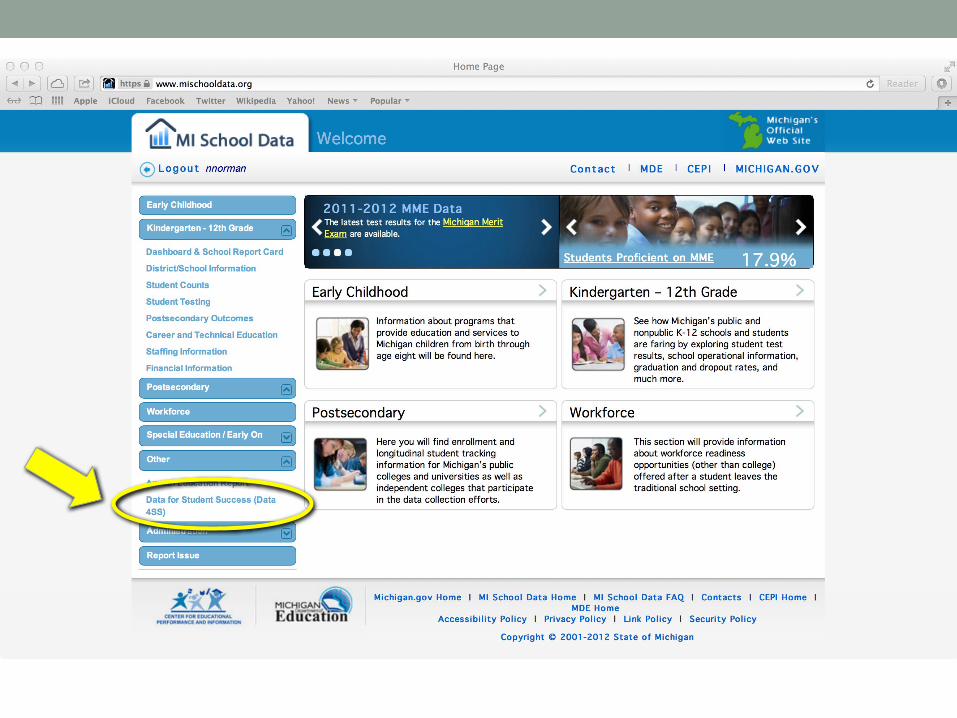
• 9:30-10:20am – Breakout Sessions• Data Director (Stan Masters)• MiSchoolData (Basia Kiehler)• Top30/Bottom30 Excel (Naomi Norman)
• 10:30-11:30am – Team Time• Repeat of any breakout sessions that are needed
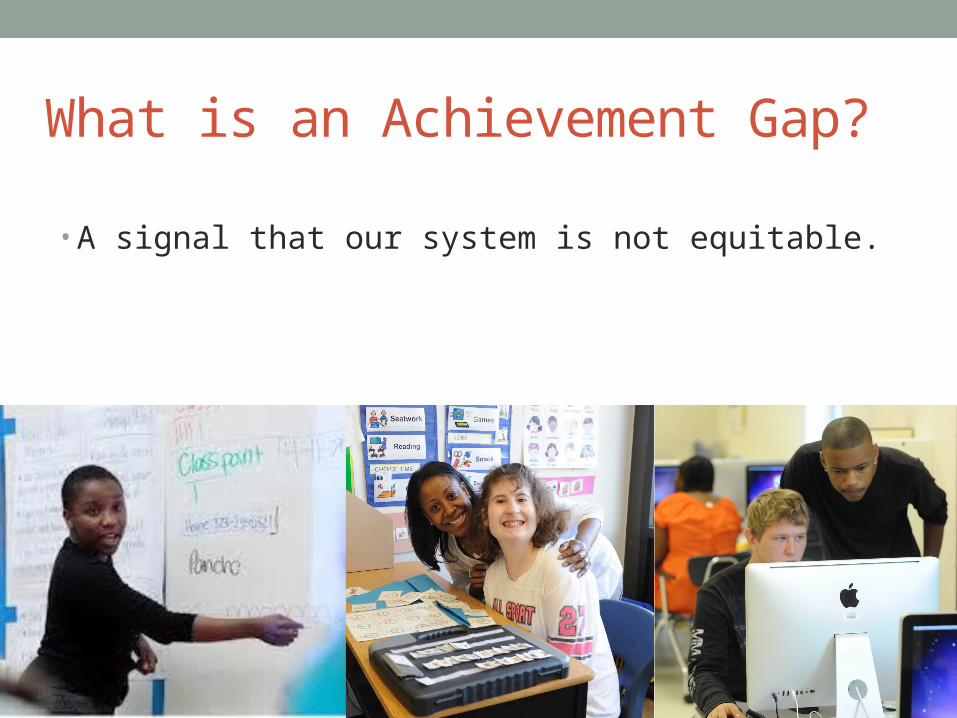
What is an Achievement Gap?
• A signal that our system is not equitable.

Equity
An operational principle for shaping policies and practice which provide
high expectations and appropriate resources so that all students achieve at the same
rigorous standard—with minimal variation due to race, income, language or gender.
(Hart & Germaine-Watts, 1996)
Ruth S. Johnson Using Data to Close the Achievement Gap
If I had 60 minutes to solve a problem, I’d spend 55 minutes defining it, and 5 minutes solving it.
Albert Einstein
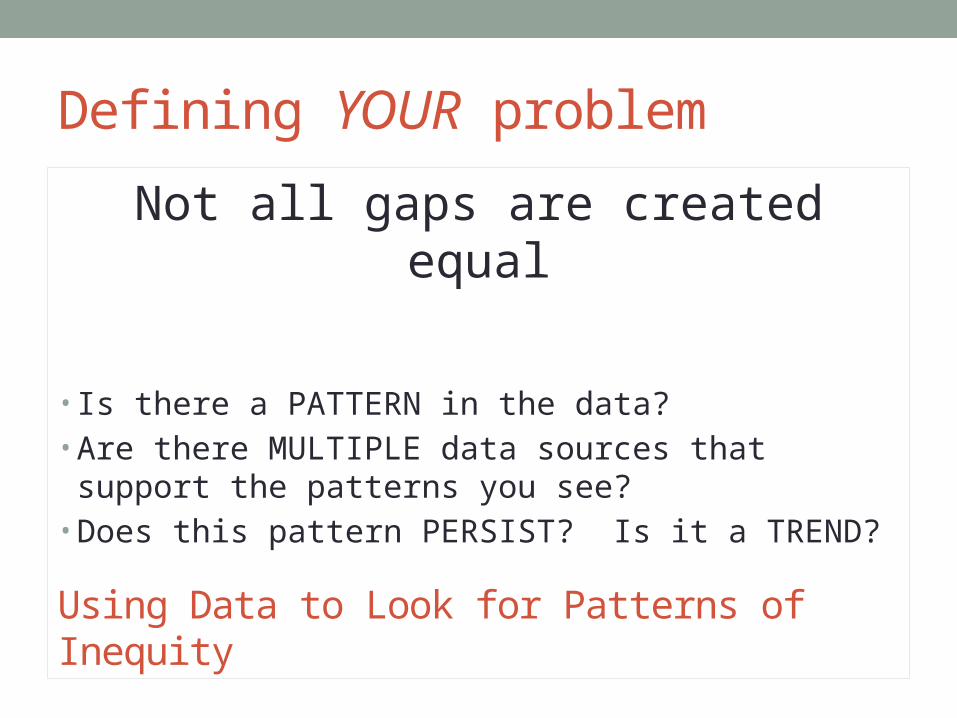
Defining YOUR problem
Not all gaps are created equal
• Is there a PATTERN in the data?• Are there MULTIPLE data sources that support the
patterns you see?• Does this pattern PERSIST? Is it a TREND?
Using Data to Look for Patterns of Inequity
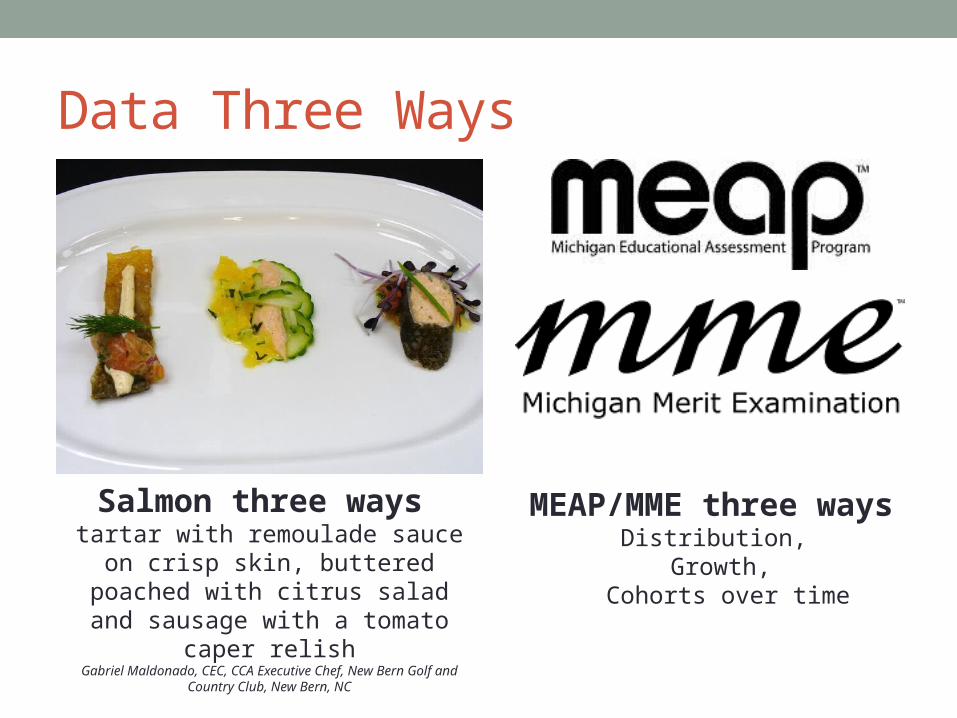
Data Three Ways
Salmon three ways tartar with remoulade sauce on crisp
skin, buttered poached with citrus salad and sausage with a tomato
caper relishGabriel Maldonado, CEC, CCA Executive Chef, New Bern Golf and
Country Club, New Bern, NC
MEAP/MME three ways Distribution,
Growth, Cohorts over time
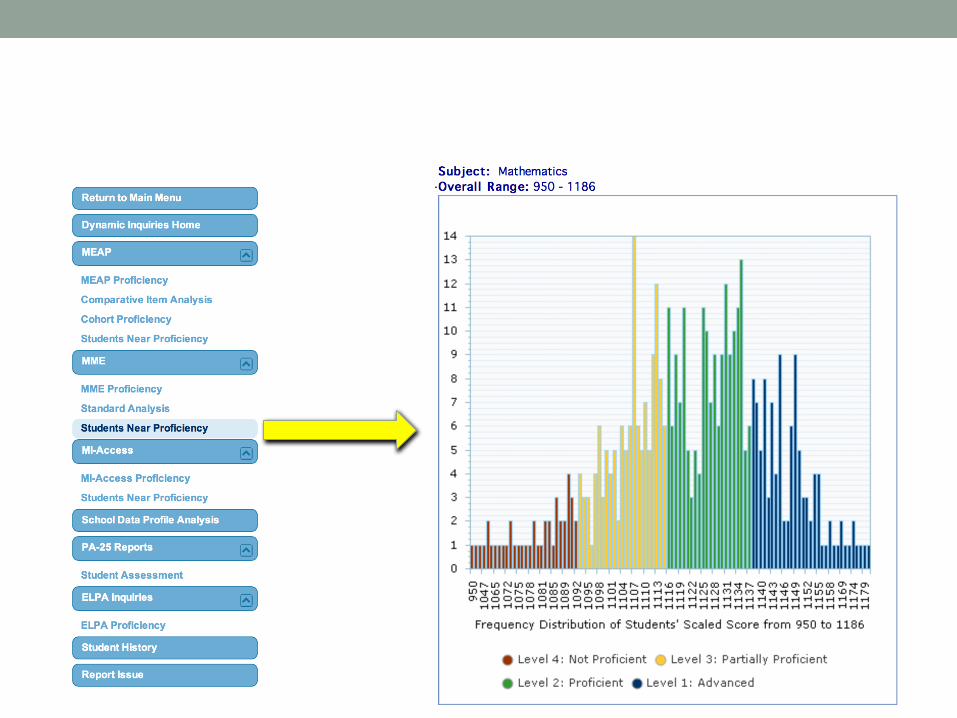
DISTRIBUTIONHow are our scores distributed? Are there patterns of performance?

Small Gap
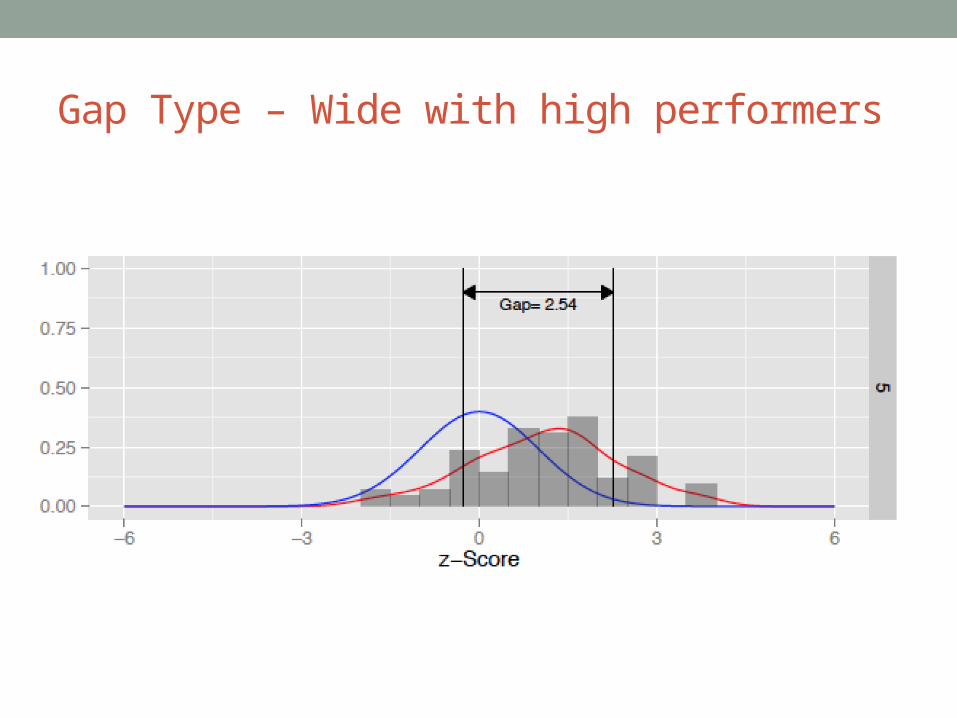
Gap Type – Wide with high performers

Gap Type – Bimodal

Gap Movement Over Time
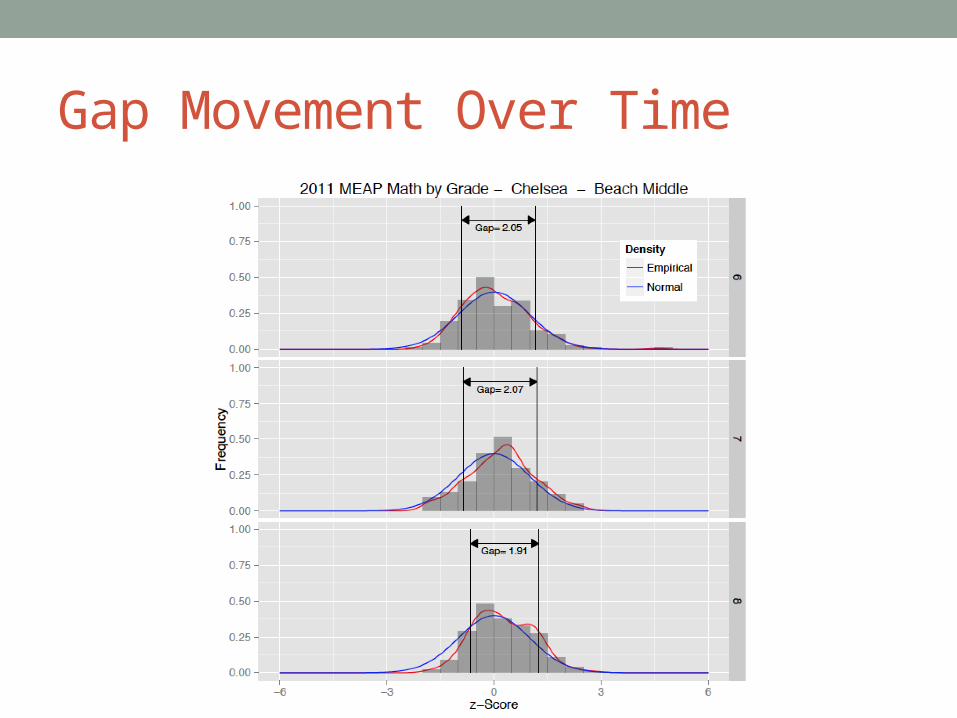
Gap Movement Over Time

Shifting Bottom 30% Upward
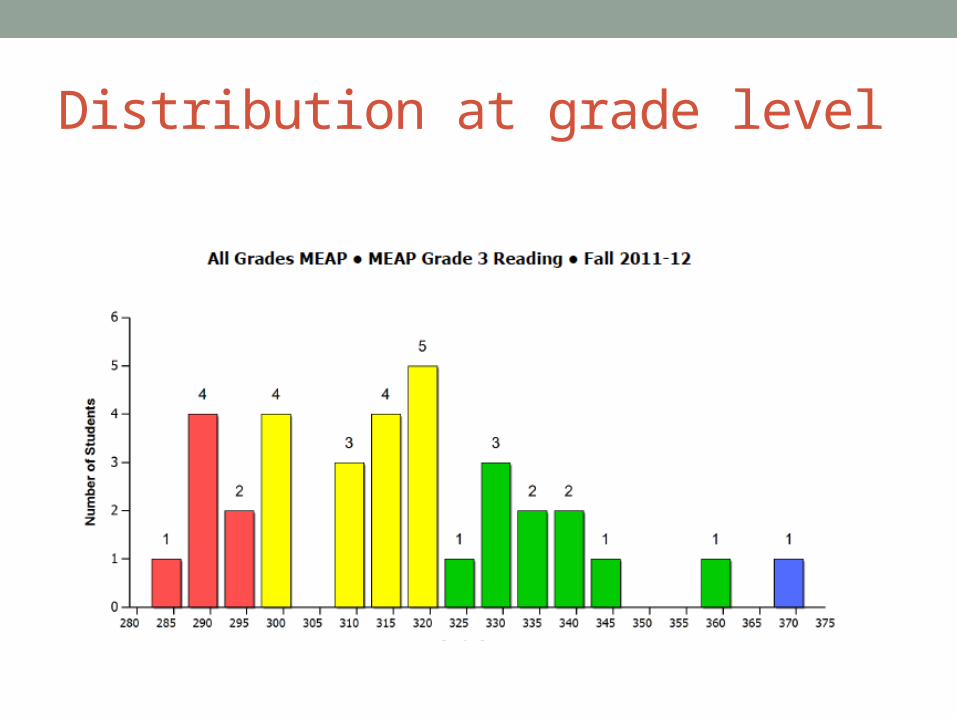
Distribution at grade level
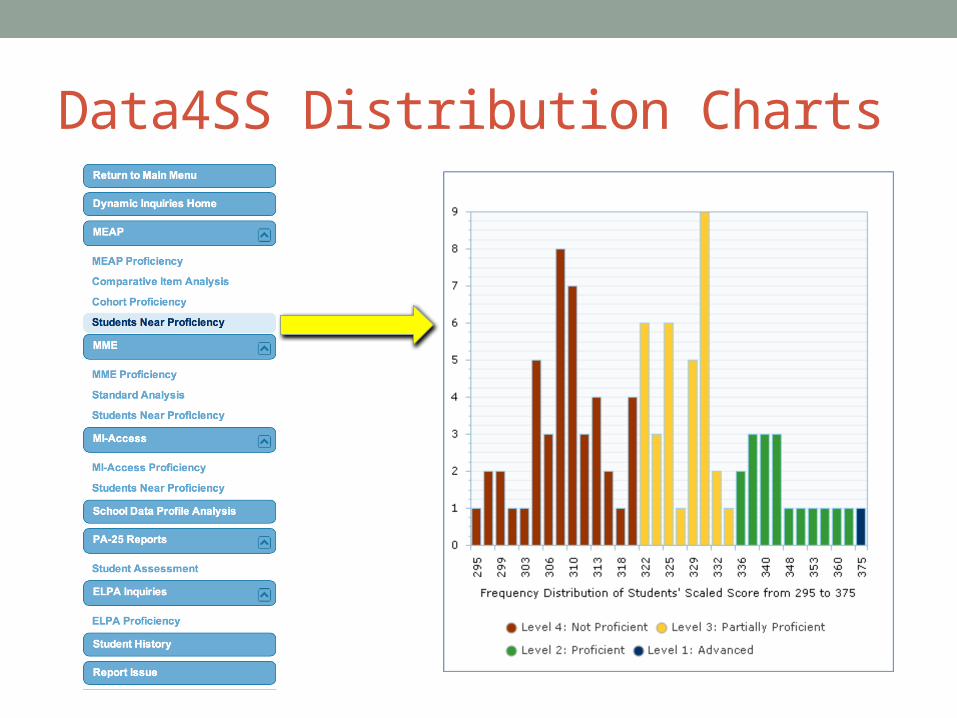
Data4SS Distribution Charts
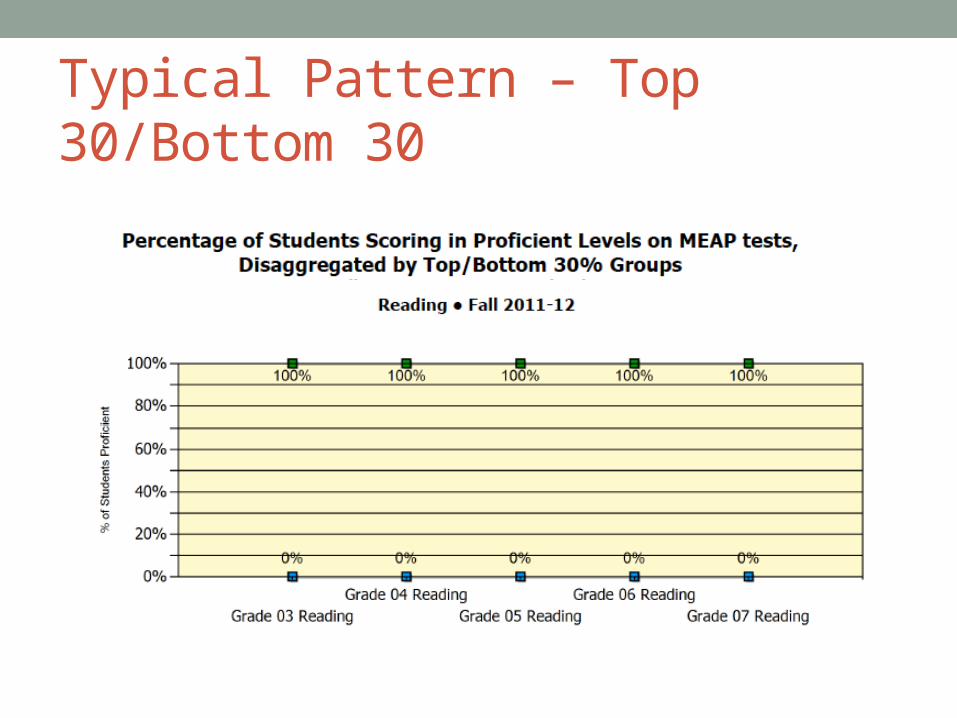
Typical Pattern – Top 30/Bottom 30
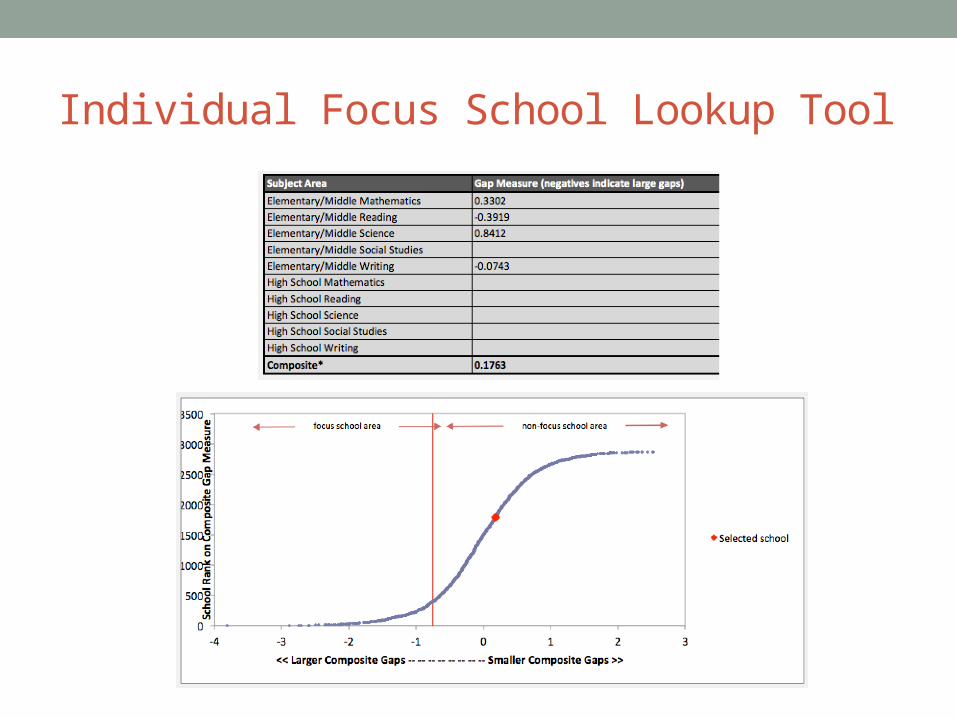
Individual Focus School Lookup Tool
GROWTHAre our students making growth over time? Does it look different for our subgroups and bottom 30%?

MEAPProficiency Proficiency Range
Level 1 Medium
Level 2 High
Medium
Low
Level 3 High
Medium
Low
Level 4 High
Medium
Low
Improve
Significantly Improve
Decline
SignificantlyDecline
Maintain

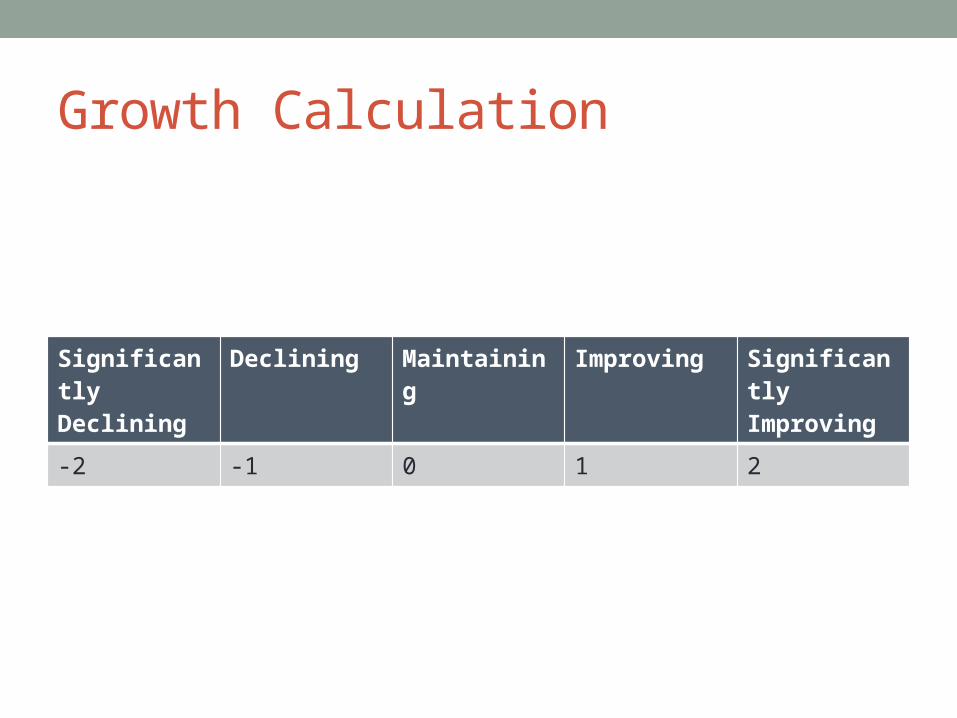
Growth Calculation
Significantly Declining
Declining Maintaining Improving Significantly Improving
-2 -1 0 1 2
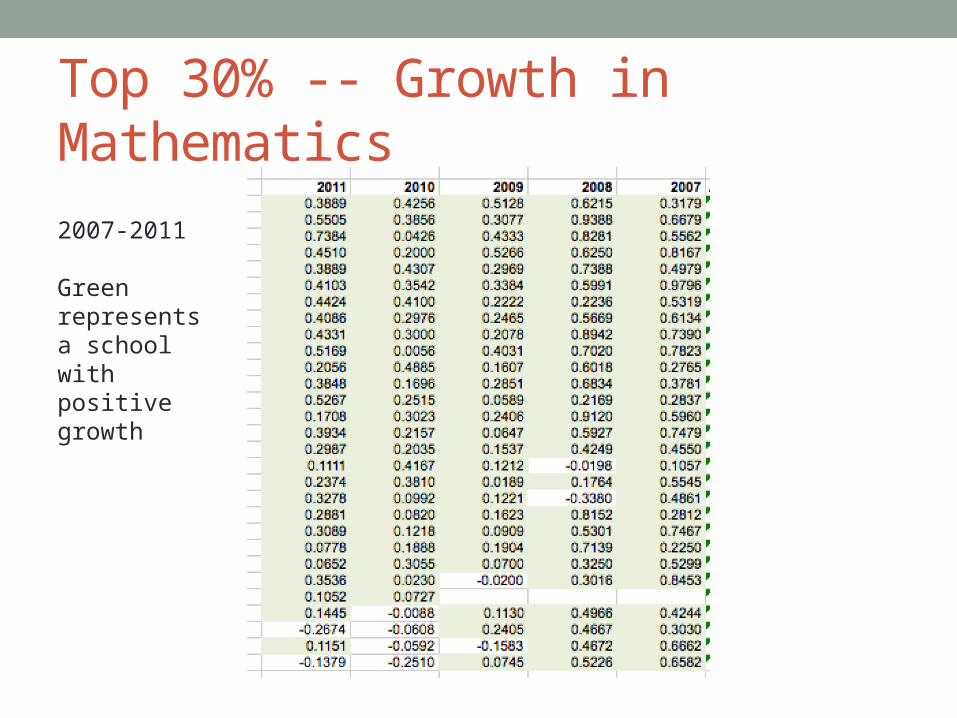
Top 30% -- Growth in Mathematics
2007-2011
Green represents a school with positive growth
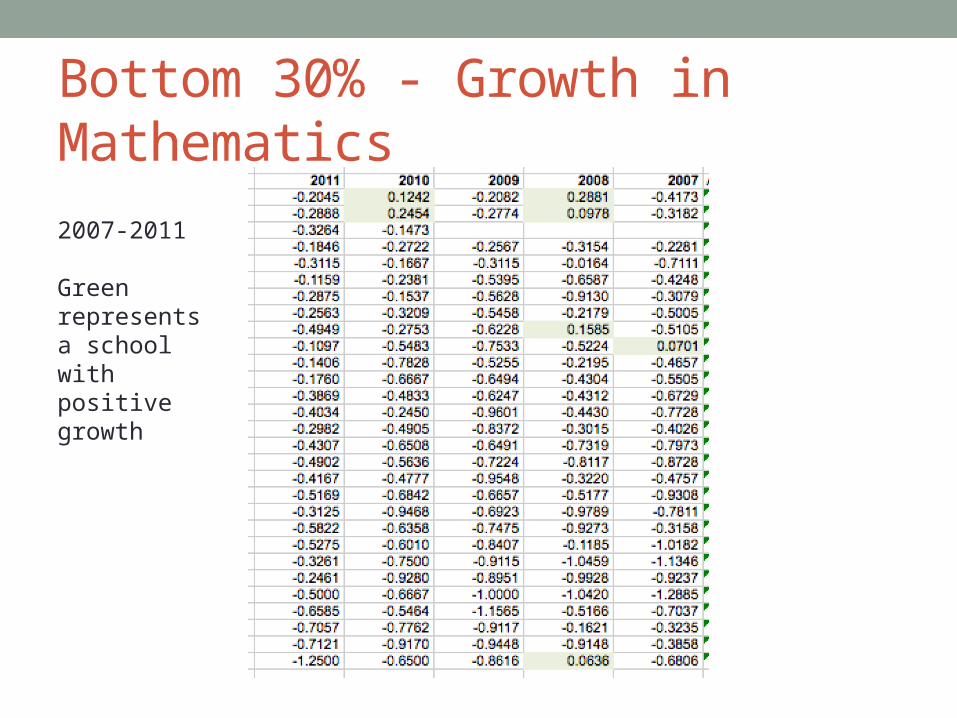
Bottom 30% - Growth in Mathematics
2007-2011
Green represents a school with positive growth
COHORTS OVER TIMEDo students who stay in our schools improve over time?

Cohort Growth Over Time
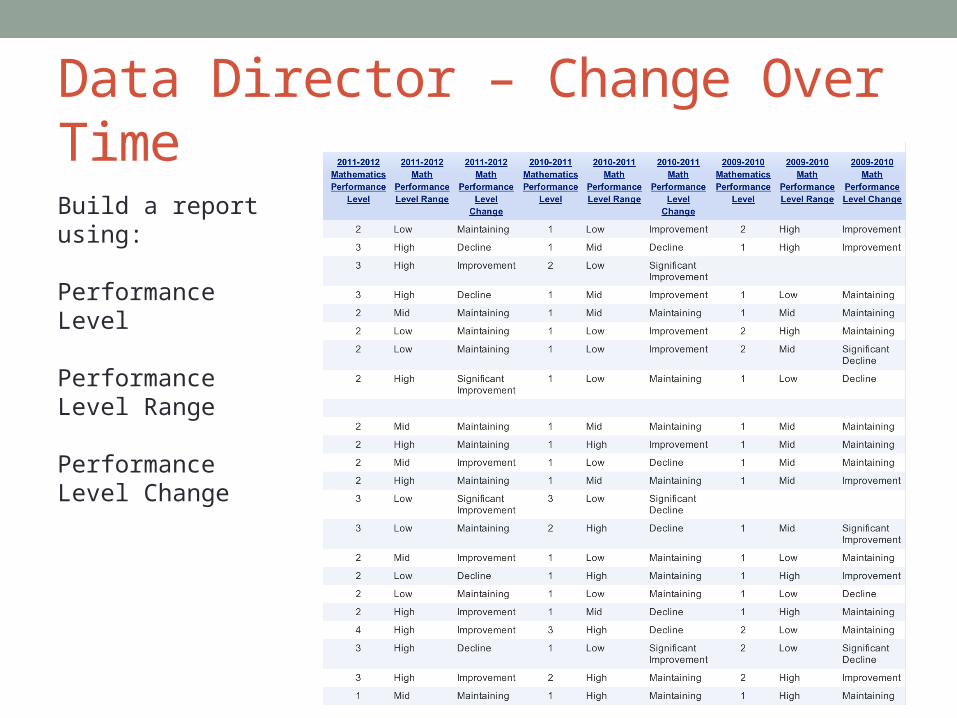
Data Director – Change Over Time
Build a report using:
Performance Level
Performance Level Range
Performance Level Change
Data Director – Additional Cohort Reports
• Create a program of your Bottom 30% • track the students over time• Look at other data trends (NWEA, EXPLORE, SRI, local
assessments)
• Create summary reports• Summarize MEAP or other test scores by subgroups• Summarize by demographics that matter in your district (zip code?)
• Create reports that follow student scores over time• One group of students with all their scores for last 5 years

For More Information:
• Naomi Norman, Director • [email protected]
• Basia Kiehler, Assessment Coordinator • [email protected]
• Sarah Devaney, Research Assistant • [email protected]
• Stan Masters, Consultant

Visit Our Website:
MIteacher.weebly.com
Also, ask to be added to our Achievement Gap Dropbox for
access to reports, powerpoints, and excel spreadsheets