Embed Size (px)
Citation preview
DISCLAIMER
The work reflected in this publication was performed under Contract NumberHHSP23320052905YC awarded by the US Department of Health and Human Services to Mathematica Policy Research Inc The content of this publication does notnecessarily reflect the views or policies of the US Department of Health and Human Services nor does mention of trade names commercial practices or organizationsimply endorsement by the US government
ACKNOWLEDGMENTS
The authors would like to express their appreciation our Project Officer MariaWoolverton and other federal staff at OPRE and the Office of Head Start We thank the Mathematica team including Cassandra Meagher Annalee Kelly Barbara Carlson Anne Bloomenthal Jennifer McNulty Susan Sprachman Brian Takei Erin Slyne Barbara Kennen Kristina Rall Ama Takyi Miriam Lowenberg Rita Zota Daryl Hall August Pittas well as Francene Barbour Joan Gutierrez and Thidian Diallo at the SurveyOperations Center and all of the Mathematica field and telephone staff who collectedthe data We are also grateful for the contributions of our partners at Juarez andAssociates and the Educational Testing Service Most of all we offer our gratitude tothe staff families and children of the 60 FACES 2006 programs across the countrywho once again opened their doors and shared their time with us
INTRODUCTION
Head Start is a national program that aims to promote school readiness by enhancing the social and cognitive development of children through the provision of educational health nutritional social and other services to enrolled children and families The Head Start program provides grants to local public and private non-profit and for-profit agencies to provide comprehensive child development services to economically disadvantaged children and families the Office of Head Start emphasizes a special focus on helping preschoolers develop the reading and mathematics skills they need to be successful in school The program also seeks to engage parents in their childrenrsquos learning and to promote their progress toward their own educational literacy and employment goals (Administration for Children and Families [ACF] 2009)
The Head Start Family and Child Experiences Survey (FACES) was first launched in 1997 as a periodic longitudinal study of program performance Successive nationally representative samples of Head Start children their families classrooms and programs provide descriptive information on the population served staff qualifications credentials beliefs and opinions classroom practices and quality measures and child and family outcomes FACES includes a battery of direct child assessments across multiple domains It also comprises interviews with the childrsquos parents teachers and program managers as well as direct observations of classroom quality (For background information on FACES 2006 see West et al 2007 Tarullo et al 2008 and West et al 2008)
FACES is a tool for measuring Head Start program performance at the national level This recurring data collection provides the means to assess how the program is performing currently and over time Figure 1 offers the conceptual framework for the FACES study The child is located at the center surrounded by parents and family and located within the context of a given Head Start classroom and program The model
posits that it is through the provision of high quality comprehensive educational services (in interaction with their home and classroom contexts) that children make progress towards the goal of physical wellbeing and cognitive and social-emotional school readiness
This brief profiles the 3- and 4-year-old Head Start children and families who were newly enrolled in the program in fall 2006 (see Tarullo et al 2008) and are still attending in spring 2007 The first section of the report provides background on the study methodology and sample The next offers information on the childrenrsquos characteristics family demographics and home life including language background educational environment of the home family routines and socioeconomic risk status It includes information on parent involvement in Head Start and level of satisfaction with their own and their childrenrsquos Head Start experiences The following section chronicles childrenrsquos developmental progress over the Head Start year considering whether these outcomes vary by age gender raceethnicity or risk status Changes in childrenrsquos skills and development during the program year reflect a range of influences including maturation program and family influences and other influences in childrenrsquos lives Presented next are the characteristics of their teachers and classrooms including measures of observed quality Finally the last section examines the relationships among child family and classroom factors and childrenrsquos outcomes
METHODS
The FACES 2006 sample provides information at the national level about Head Start programs centers classrooms and the children and families they serve A sample of Head Start programs was selected from the 2004-2005 Head Start Program Information Report (PIR)1
and approximately two centers per program and three classrooms per center were selected for participation Within each classroom an average of nine newly enrolled 3- and 4-year-old children were randomly selected for the study2 Sixty
1
Head Start ProgramPopulation ServedPrimary CurriculumTeacher SalariesManagement Climate
Community State and National
Services and ResourcesBenchmarksIndicatorsPublic PolicyCommunity amp Neighborhood
Head Start Classroom and Teachers
Global QualityTeacher SensitivityInstructional PracticeTeacher Experience amp
EducationTeacher Attitudes
Knowledge and Beliefs Childrsquos School
Readiness
Parent and Family CharacteristicsPhysical Mental Nutritional HealthPersonal Resources and CompetenciesMarital or Partner RelationshipChildrearing Behavior and AttitudesHome Environment and TeachingFamily ProcessesOrganizationChild Care Arrangements and ResourcesPrimary Language and Ethnicity
ChildCharacteristicsHealthGenderRaceEthnicityDisability Status
Community State amp National
Head Start Program
Head Start Classroomamp Teachers
Parent amp Family
Child
Child Growth andDevelopment
Physical HealthPhysical ActivityNutritionPhysical GrowthGross and Fine Motor SkillsCognitionLanguageCommunicationSocial-emotional Approaches
to Learning
Figure 1 Conceptual Framework
programs 135 centers 410 classrooms 365 teachers and 3 315 children participated in the study in the fall of 2006 Children in the study were administered a battery of direct child assessments their parents and teachers were interviewed and interviews were conducted with the directors of the programs and centers in the sample and with education coordinators
In spring 2007 data were collected again from the group of children who were completing their
3 first year of the Head Start program Data were collected over a four-month period in spring 2007 (March ndash June) Mathematica data collection teams assessed the children at their Head Start centers interviewed the childrenrsquos lead teachers observed their classrooms and interviewed childrenrsquos parents during week-long
4 site visits Teachers were asked to complete a set of ratings for each sampled child in their
classroom using either a Web-based or a paper 5instrument
A total of 3296 children were eligible for the 6 spring 2007 follow up and 88 percent of the
7 eligible children participated Child assessments were completed for 98 percent of these children and 92 percent of their parents were interviewed A Head Start teacher completed a set of teacher ratings for 96 percent of the children An interview was completed with
8 99 percent of childrenrsquos lead teachers In spring 2007 Mathematica s taff also completed
9 observations in 335 Head Start classrooms Data from the direct child assessments are used here to report on childrenrsquos cognitive and physical outcomes at the beginning and end of their first year in Head Start Parent and teacher ratings provide information about childrenrsquos social skills approaches to learning problem
2
behaviors and academic and non-academic accomplishments during the Head Start year Assessor ratings are another source of information about childrenrsquos social-emotional outcomes We use parent interview data to describe childrenrsquos backgrounds and home environments teacher interview data to describe childrenrsquos first Head Start classroom experiences and classroom observation data to describe Head Start classroom quality
Direct child assessments The spring battery of direct child assessments like the fall battery included a set of standardized preschool assessments designed to measure childrenrsquos cognitive outcomes (language literacy and mathematics) and physical outcomes (height and weight) through an untimed one-on-one assessment of each child The actual measures used are described below where we report on childrenrsquos cognitive scores at the end of the Head Start year and changes in scores over childrenrsquos first year in the program
Except for a few differences the procedures used to administer the direct child assessments were the same as those used in the fall The direct assessment began with a language screening to determine whether children from households where English was not the primary spoken language should be assessed in English assessed in Spanish or not assessed at all10 However if a child had been assessed in English in the fall he or she was assessed in English in the spring The assessments themselves used the same standard materials that were used in the fall (for example stimulus and response pages from the PPVT-4 and Woodcock-Johnson measures) Computer-assisted personal interviewing (CAPI) was used again when administering the assessments to facilitate the movement from one measure to the next without the assessorrsquos having to calculate stopping or starting points (that is basals and ceilings) Assessors read the questions and instructions from a computer screen The child responded by pointing to the correct answers on the assessment easel or by giving a verbal response Assessors entered the childrsquos responses into a laptop computer using software
that ensured that all basal and ceiling rules were followed
Parent interviews FACES 2006 used a computer-assisted interview to collect information from Head Start parents in a variety of areas including the characteristics of households (such as household income number of adult household members languages spoken in the home) and household members (including age raceethnicity and relationship to study
11 child) Information was also collected on aspects of the childrsquos home life childrenrsquos childcare arrangements and parentsrsquo ratings of their childrenrsquos social skills problem behaviors and language literacy and mathematics accomplishments New to the spring interview were questions that asked parents about (1) their involvement and satisfaction with Head Start (2) access to and use of community services and sources of social support (3) outdoor spaces near their home where their child could play and (4) household membersrsquo use of alcohol tobacco and drugs
-
Teacher interviews and teacher child reports In spring 2007 FACES 2006 again conducted computer-assisted personal interviews with lead teachers about their educational backgrounds professional experience and credentials Teachers reported on the learning activities that are scheduled in their classrooms They were asked to estimate the amount of time they spend on both teacher-directed activities and child-selected activities in a typical day as well as frequency of various language and literacy development and mathematics activities Teachers were asked whether they have a principal curriculum guiding the classroom activities and if so whether they received training in how to use it They were also asked how they assess the childrenrsquos level of achievement and progress over the Head Start year In the spring interview teachers were asked about the management climate the policies and procedures in their Head Start program They were also asked about the strengths and weaknesses of the main curriculum whether they have a regular mentor their experiences with their mentor and their
3
involvement in training or technical assistance during this program year
As in the fall using a Teacher Child Report form teachers were asked to rate each FACES child in their classroom on a set of items that assess the childrsquos accomplishments cooperative classroom behavior behavior problems and approaches to learning Teachers also provided reports of childrenrsquos health developmental conditions and absences during the program year
Interviewer ratings At the end of the one-onone testing sessions with children in the fall and spring the assessor completed a set of rating scales evaluating the childrsquos behavior in the assessment situation including the childrsquos approaches to learning and any problem behaviors Four subscales from the Leiter-R Examiner Rating Scales were used in FACES 2006 (1) attention (2) organizationimpulse control (3) activity level and (4) sociability The 27 items and four subscales make up the cognitivesocial scale
-
Classroom observations In FACES 2006 measures of the classroom environment were obtained from a four-hour observation in the spring The observation protocols included the Early Childhood Environment Rating Scale-Revised (ECERS-R Harms Clifford and Cryer 1998) the Instructional Support domain from the Classroom Assessment Scoring System (CLASS Pianta et al 2008) and the Arnett Caregiver Interaction Scale (Arnett 1989) Classroom observations also provided information on child-adult ratios and group sizes Observer ratings are used to produce a set of scores that capture global characteristics of Head Start classrooms as well as indicators of classroom resources and teacher-child interactions More information on the three measures is found in the section on classroom quality
Twenty-four observers were trained to rate key characteristics of childrenrsquos classrooms using the ECERS-R CLASS Instructional Support and Arnett Observers participated in an 8-day
training that included lectures and discussion classroom practice and videotaped certification practice in early childhood classrooms and field certification
Population estimates The statistics found in this report are estimates of key characteristics of the population of newly entering Head Start children who were still enrolled in the program in spring 2007 and their parents and families as well as the population of their Head Start
12teachers and classrooms The data used to report on child and family characteristics and child outcomes are weighted to represent all children entering Head Start for the first time in
13 fall 2006 who were still enrolled in spring 2007 Teacher data are weighted to represent all teachers serving children who entered Head Start for the first time in fall 2006 and who were still enrolled in their classrooms in spring 2007 Classroom observation data are weighted to represent all classrooms in spring 2007 that were serving children who entered Head Start for the first time in fall 2006
CHILD AND FAMILY DEMOGRAPHICS PARENTING AND THE HOME ENVIRONMENT
Head Start serves a diverse population of low-income children and their families Because families play such an important role in a childrsquos development Head Start has made the family a cornerstone in its framework Data from the FACES 2006 Parent Interview offer information on the family and household environment of entering Head Start children and the neighborhoods and communities where they live This section presents key findings on household demographic characteristics the home learning environment and parenting practices family health care and health status and neighborhood characteristics for the population of children who entered Head Start in fall 2006 and are still enrolled in the program in spring 2007 Changes in parenting practices and childrenrsquos activities are described along with parentsrsquo perceptions of their and their childrenrsquos Head Start experiences
4
Characteristics of Children
In fall 2006 approximately 458000 children were newly enrolled in Head Start programs across the US About 88 percent of these children were still enrolled in spring 2007 and completing their first year of Head Start The demographic characteristics of the group of children still enrolled in spring look very much like those of the group of children who entered the program in the fall14
About 63 percent of children completing a year of Head Start were 3 years old when they first entered the program in the fall and the others were 4 years old or older Boys slightly outnumber girls a pattern that is more pronounced among 4-year-olds (53 percent versus 47 percent respectively) Just over a third of children are HispanicLatino and another third are African American Three-year-olds are more likely to be African American than 4-year-olds while 4-year-olds are more likely to be White or HispanicLatino than are 3-year-olds
Family Environment
Children entering Head Start for the first time in fall 2006 had diverse family lives (Tarullo et al 2008) While most lived with a parent a little more than half lived apart from their fathers Although a majority of their mothers and more than half of their fathers had at least a high school education many parents had not completed high school15 More than half of childrenrsquos mothers and a much higher percentage of their fathers were employed with many working full-time A large majority (89 percent) lived in households where the income was less than or equal to 185 percent of the federal poverty threshold16 A little more than a quartermdash27 percentmdashlived in households where English was not the primary language spoken to them For most of this group of children Spanish was the home language Many entering children lived in households with multiple risks (low parent education single-parent and income below the federal poverty threshold)The remainder of this section focuses on children who entered Head Start in fall 2006 and are still enrolled in the program in spring 2007
Household composition Overall the family structure of children completing a year of Head Start looks the same as the group of children who entered the program in the fall Most children completing a year of Head Start live with at least one of their parents17 (96 percent) and 46 percent live with both parents Thirty-one percent of children live with two married parents Very few children live apart from their mother (6 percent) but half do not live with their father (52 percent)
Parent education employment and income
Sixty-three percent of childrenrsquos mothers and 55 percent of their fathers have at least a high school education Thus roughly a third of Head Start childrenrsquos mothers and 45 percent of their fathers did not complete high school or earn a GED
More than half of the mothers whose children are finishing a year of Head Start are employed (53 percent) with about a third working full-time (35 or more hours per week) and another 21 percent working part-time A majority of childrenrsquos fathers are employed (86 percent) and most work full-time hours (72 percent) More than three quarters of children live in households with at least one employed parent and 59 percent have at least one parent who works full-time
The median household income for children completing a year of Head Start was $19191 based on parent report in fall 2006 Slightly less than 9 in 10 children live in households where the income is less than or equal to 185 percent of the federal poverty threshold About 57 percent live in households where income is less than or equal to 100 percent of the federal poverty threshold White children are less likely to live in households with incomes at or below the poverty threshold than African American or HispanicLatino children
Many Head Start children live in households that receive federal assistance The most common type of assistance is from the US Department of Agriculturersquos Women Infants and Children (WIC) program In spring 2007 55 percent of
5
childrenrsquos families received WIC compared to about 61 percent in fall 2006 The percentage of childrenrsquos families that received food stamps in the spring was also down slightly from the fall (48 percent and 51 percent respectively) The percentage of children whose families received welfare assistance was relatively stable from fall to spring (21 percent and 19 percent respectively) In spring 2007 3-year-olds are more likely to live in households that receive WIC than are 4-year-olds and the decline in WIC participation is smaller for families of 3year-olds compared to 4-year-olds
-
Home language and immigrant status About 28 percent of children completing a year of Head Start live in households where English is not the primary language spoken to them18 Spanish is by far the most prevalent non-English primary language and is spoken to children in 23 percent of households Of children who are spoken to in a non-English language 83 percent have Spanish as the home language
Overall most Head Start children were born in the US (98 percent) and a majority of their mothers (71 percent) and fathers (70 percent) also were born in the US This is also true among children who live in households where a language other than English is spoken to them most often 92 percent of those children were born in the US However for this group of children a small percentage of their mothers (11 percent) and fathers (9 percent) were born in the United States Most often these childrenrsquos mothers (67 percent) and fathers (68 percent) were born in Mexico followed by Central America South America Asia and Africa Over 70 percent of these mothers and fathers had been in the US for at least 6 years
Figure 2 shows the immigrant status of Head Start parents Twenty-six percent of all children completing a year of Head Start had two parents who were born outside of the US Among the group of children who live in households where a non-English language is spoken to them 84
percent have two parents who were born outside of the US
Cumulative socioeconomic risk Coming from a low-income family or single-parent household and having parents who did not complete high school are identified as risk factors for poor
19 developmental and educational outcomes Children with one of these risk factors are more likely to have others and research has shown that having more than one risk factor can have negative consequences for childrenrsquos
20 development and school readiness skills In FACES 2006 an index was created as a measure of cumulative family risk The number of risks is based on three characteristics of childrenrsquos living circumstances whether the child resides in a single-parent household whether the household income is below the federal poverty threshold and whether the childrsquos mother has less than a high school diploma About 17 percent of children completing a year of Head Start had none of the three risks and 12 percent had all three Most had either one (36 percent) or two (35 percent) of the risks African American and HispanicLatino children were more likely to have two or more risks than White children a pattern that is also found among the general population of children entering school for the first time (Zill and West 2001)
Parenting Approaches and Attitudes
Child-rearing practices Parenting practices and parentsrsquo attitudes toward child-rearing can affect their relationships and interactions with their children Earlier cohorts of FACES found that parenting styles were correlated with child behavior and that family engagement in activities together (for example telling stories or playing games) was correlated with child cognitive skills (ACF 2003) In spring 2007 the parents of FACES children were asked a series of questions that were designed to capture information about parenting practices including parenting style disciplinary approaches and
21routines
6
Figure 2 Immigrant Status of Head Start Parents
412
84
Percent of Children Spoken to in Language Other Than English
669
26
Percent of All Children
Both Parents Born in US One Parent Born in US Both Parents Born Outside US
Source FACES Fall 2006 Parent Interview
Parents were asked to indicate to what extent each of 13 items from The Child-Rearing Practices Report (Block 1965) describes them From these four subscales were created in earlier rounds of FACES
The Parental Warmth scale reflects a warm supportive parenting style i n which the parent encourages curiosity Items contributing to this scale include ―My child and I have warm intimate moments together and ―I make sure my child knows that I appreciate what (heshe) tries to accomplish
The Parental Energy scale indicates the parentrsquos energy and consistency in enforcing rules This scale includes statements such as ―I have little or no difficulty sticking with my rules for my child
and ―Once I decide how to deal with a misbehavior of my child I follow through
The Authoritative scale reflects a less harsh parenting style with greater use of rationales for discipline Statements in this scale include ―I control my child by warning (himher) about the bad things that can happen and ―I teach my child that misbehavior or breaking the rules will always be punished
The Authoritarian scale indicates a stricter more directive parenting style This scale includes items such as ―I do not allow my child to get angry with me and ―I believe that a child should be seen and not heard
Possible scores on each subscale range from 1 indicating the statements included in the scale are ―not at all like the parent to 5 indicating that the statements describe the parent ―exactly On average parents scored higher on the parental warmth scale (43) and lower on the authoritarian scale (22) Scores on the parental energy (39) and authoritative (34) scales fell between these extremes Parents in households with multiple socioeconomic risk factors scored lower on the warmth subscale than did parents with fewer risk factors and parents in households with no socioeconomic risk factors scored lower on the authoritative subscale Scores also varied by raceethnicity with African American childrenrsquos parents scoring higher on both the authoritative and authoritarian subscales compared to other parents while White childrenrsquos parents had higher warmth scores and lower authoritarian scores on average compared to both African American and HispanicLatino parents HispanicLatino childrenrsquos parents had lower scores on the
7
energy subscale than did childrenrsquos parents in other ethnic groups
Discipline FACES also asked about specific disciplinary practices and routines in the home The percentage of children whose parents had spanked them in the week prior to the interview decreased significantly from 37 percent to 32 percent between fall 2006 and spring 2007 Almost twice as many parents (68 percent in spring 2007) had used time out but the percentage using that discipline approach did not change significantly between fall and spring
Household routines Parentsrsquo interactions with their children at home including the rules and routines that parents establish for their children set the stage for socialization at school Studies have found time spent eating meals together as a family to be associated with fewer behavior problems (Hofferth and Sandberg 2001) and that dinner table conversation supports literacy development (Beals and Snow 2006) The percentage of Head Start children whose families eat dinner together every day decreased significantly from 55 percent to 46 percent between fall and spring The percentage of children with a regular bedtime (85 percent in spring 2007) did not change between fall and spring
Home learning activities Head Start children participate in a variety of learning activities with their families both in and outside of the home One common activity is being read to by a parent or family member The percentage of children who are read to three or more times a week (about three-quarters of Head Start children overall) did not change significantly between fall and spring This level of reading did increase for some subgroups however The percentage of HispanicLatino children read to three or more times a week increased significantly from 65 percent in the fall to 71 percent in the spring and the percentage of children who live in primarily non-English households who are read to three or more times a week rose from 61 to 70 percent
For most other home learning activities the percentages of children who had engaged in the activity with a family member increased between fall 2006 and spring 2007 As shown in Figure 3 the largest increases were in the percentages who were told a story talked about TV programs with family members were taught songs or played games sports or exercised The only activities whose prevalence did not increase significantly were the three reported by the highest percentages of parents in both fall and spring playing with toys or games indoors (98 percent) taking child along on errands (96 percent) and talking about what happened in Head Start (96 percent) (not shown)
The percentages of children who had engaged in activities with their family members outside the home also increased between the fall and spring for most types of activities As shown in Figure 4 the largest increases were in the percentages of children who talked about family history or ethnic heritage went to a movie library or community event visited a museum or attended a play or concert with family members
Physical activity and nutrition Parental encouragement of physical activity and good nutritional choices at home can contribute to childrenrsquos developing healthy habits and help combat childhood obesity FACES measured physical activity through questions about frequency of outdoor play The percentage of children who spend more than two hours playing outside on a typical weekday increased significantly from 28 percent in the fall to 38 percent in the spring This change was accompanied by a decrease in the percentage spending no time playing outside (from 20 percent to 9 percent) between fall and spring Of course it is possible that these changes may reflect seasonal variation in the weather between the fall and spring surveys The increase in the percentage of children spending more than two hours playing outside was particularly notable for 4-year-olds (27 percent in the fall to 40 percent in the spring) while the decrease in the percentage spending no time
8
735
940808
646
866730
95
2757
38
49
67
0
20
40
60
80
100
Told a story Taught letters words or numbers
Taught songs or music
Worked on arts and crafts
Played a game sport or
exercised together
Talked about TV programs or
videos
Perc
enta
ge o
f Par
ents
Fall 2006 Increase in Spring 2007
Source FACES Fall 2006 and Spring 2007 Parent Interview
Note All fall-spring differences shown are statistically significant
= plt 05 = plt01 = plt 001
Figure 3 Family Membersrsquo Activities with Child in Past Week
outside was largest among 3-year-olds (22 percent in the fall and 10 percent in the spring)
In spring 2007 94 percent of parents reported that their Head Start child had access to a yard and two-thirds reported that there is a park or playground within walking distance22
The American Academy of Pediatricsrsquo guidelines recommend that children should watch no more than two hours of television a day (American Academy of Pediatrics 2001) The percentage of 4-year-olds exceeding this guideline on a typical weekday decreased from 20 percent in fall 2006 to 15 percent in spring 2007 The percentage of 3-year-olds watching more than two hours of television remained at 21 percent at both time periods however
Many children also spend time using computers The percentage of children who have access to a computer at home increased from 54 percent to 59 percent between fall and spring Among
those with computer access the percentage who played computer games on a typical weekday increased from 47 percent to 57 percent between fall and spring and the percentage using a computer for a purpose other than games increased from 20 percent to 28 percent
In addition to physical activity FACES also asked parents to report on food their child consumed over the past week concentrating on types of foods that are particularly salient for young children such as milk soda salty snacks sweets and fast food Analyses compared their reports to thresholds of consumption that indicate more healthy nutritional choices Consumption of milk decreased and consumption of fast food increased between fall and spring The percentage of children who drank milk at least twice a day decreased from 72 percent to 66 percent between fall and spring The decrease was larger for 4-year-olds than for 3-year-olds The percentage of 4-year-
9
Figure 4 Family Membersrsquo Activities with Child in Past Month
265 329134
747
118
854
416 392539
99109
67
40
74
40
112 8237
0
20
40
60
80
100Pe
rcen
tage
of P
aren
ts
Fall 2006 Increase in Spring 2007
Source FACES Fall 2006 and Spring 2007 Parent Interview
Note All fall-spring differences shown are statistically significant
= plt 05 = plt01 = plt 001
olds who ate no fast food in the prior week decreased from 25 percent in the fall to 21 percent in the spring the change was not significant for 3-year-olds
Child health care The inclusion of health and wellness services in Heads Startrsquos comprehensive mission reflects the recognition that health care practices influence a childrsquos development The percentage of children who had had a dental checkup within the past year increased from 89 percent in the fall to 94 percent in the spring The percentage of children who had had a medical checkup during the same period did not change significantly but remains high (98 percent in spring 2007)
Although the percentage of children with any type of health insurance coverage did not change significantly between fall 2006 and spring 2007 the types of coverage did Most
notably the percentage of children covered by SCHIP increased from 9 percent to 24 percent between fall and spring The percentage of children covered by Medicaid decreased somewhat from 71 percent to 67 percent Although SCHIP coverage increased across all racialethnic groups the decrease in Medicaid coverage was concentrated among White and African American children
Parent health behaviors and mental health
Family health behaviors and the health status of childrenrsquos caregivers can affect a childrsquos health well-being and development In spring 2007 almost a quarter (24 percent) of Head Start children have a parent who smokes tobacco and about a third (32 percent) live in households where someone smokes In addition two percent of children live in households where someone has gotten into trouble with family
10
friends or the police or missed work or school due to alcohol or drugs in the past year
In spring 2007 parents were once again asked a set of questions from the CES-D Depression Scale (short form Radloff 1977) While the majority of parents do not report symptoms of depression the percentage of parents reporting symptoms of moderate or severe depression remained at 19 percent in both fall and spring
Parent Involvement in Head Start
Parents are involved in their childrenrsquos Head Start programs in a wide variety of ways As shown in Figure 5 and consistent with FACES 2000 (ACF 2003) the most common types of involvement in spring 2007are attending parentteacher conferences (85 percent) observing their childrsquos classroom (72 percent) and visiting with a Head Start staff member at the parentrsquos home (70 percent) Half of parents attended Head Start social events such as fairs for children and families and 49 percent attended parent education meetings or workshops These numbers are higher than in FACES 2000 when 42 percent and 43 percent of parents respectively reported these types of involvement Sixty percent of parents volunteered in their childrsquos Head Start classroom in spring 2007 and somewhat lower percentages volunteered in other ways One-quarter participated in a Policy Council program monitoring-related activities or other Head Start planning group
Satisfaction with Head Start
Parents report high levels of satisfaction with Head Start consistent with findings for earlier FACES cohorts (ACF 2003) Also consistent with previous cohorts satisfaction with child-related aspects of Head Start (such as helping the child to grow and develop or identifying and providing services for the child) is greater than with family-related aspects (for example being open to parents ideas and participation and identifying or providing services for the family) While each of the four child-related aspects was reported as very satisfactory by over 80 percent of parents as shown in Figure 6 only one of the
four family-related facets of the program (respecting familys culture and background) was rated that highly Still even the least satisfactory aspectmdashhelping parents to become more involved in community groupsmdashwas reported as very satisfactory by more than half (59 percent) of parents
The parent interview included a list of childrenrsquos and parentrsquos positive experiences with Head Start and asked parents whether each item described their and their childrsquos experiences with the program never sometimes often or always As shown in Figure 7 for each item a majority of parents reported that this was ―always their own and their childrsquos experience The lowest rating was for ―child gets lots of individual attention (55 percent) For each of the other items at least 79 percent of parents reported always having a positive experience
Social Support
FACES asked parents about the types of social support they receive from various sources including Head Start As shown in Figure 8 the majority of parents (75 percent) report always being able to find someone to talk to when they need advice but fewer (45 percent) said that it was always easy to find someone to watch their child while they run an errand
Family members are most often reported as ―very helpful (88 percent) to the parent in terms of raising the child Head Start staff members are the next most commonly reported source of support (60 percent) followed by friends (47 percent) Professionals other than Head Start staff are reported to be very helpful by 29 percent of parents
Service Receipt
FACES asked parents about different community or government services that household members may be receiving including assistance with school or job training English as a Second Language (ESL) classes and various types of counseling The services most commonly reported were dental or orthodontic care (reported by 12 percent of parents) help
11
601
246
719
845
695
503 489
0
20
40
60
80
100
Volunteered in classroom
Participated in policy council
Observed classroom
Met with teacher
Head Start staff visited
home
Attended Head Start
social events
Attended parent
education
Perc
enta
ge o
f Par
ents
Source FACES Spring 2007 Parent Interview
Figure 5 Parent Involvement in Head Start
with housing (9 percent) and child care (8 percent)
About 37 percent of households receiving any of the services (12 percent of households overall) reported that Head Start had made them aware of or had helped them to obtain at least one of the services they were receiving In response to a separate question 7 percent of parents reported that Head Start had helped them find a regular health care provider for their child most often by providing information on available providers Four percent reported that Head Start had helped the childrsquos mother take or locate programs courses classes or workshops
Child Attendance at Head Start
The average amount of time children spend in Head Start did not change significantly between the fall and spring On average parents reported children spending about 24 hours per week in Head Start programs at both points in time Almost half of children (49 percent) are enrolled in full-day Head Start programs while others
attend Head Start only in the morning (38 percent) or afternoon (13 percent)
In addition to the programsrsquo scheduled hours individual attendance patterns can result in variation in childrenrsquos Head Start experience According to teacher reports almost half of children (43 percent) missed fewer than 5 days of Head Start during the program year with 3 percent missing no days One-third missed between 6 and 10 days and another 16 percent missed between 11 and 20 days Teachers report that about 6 percent of children missed more than 20 days of class during the year Frequent absenteeism could indicate a chronic health problem or some instability in the family that prevents the parent from taking the child to the program every day
Child Care Outside of Head Start
The percentage of children in child care before or after Head Start increased from 36 to 40 percent between fall 2006 and spring 2007 The average amount of time spent in child care outside of Head Start (19 hours per week
12
13
844 824 857 832765
843
641 591
0
20
40
60
80
100Pe
rcen
tage
Ver
y Sa
tisfie
d
Source FACES Spring 2007 Parent Interview
Figure 6 Parent Satisfaction with Head Start
Figure 7 Positive Experiences with Head Start
866
554
841 834887
833790
869 894
0
20
40
60
80
100
Child feels safe
Lots of individual attention
Child happy
Teacher warm
Child respected
Discipline handled
easily
Teacher open to
new info
Teacher supports parent
Parent feels
welcomed
Perc
enta
ge R
epor
ting
Alw
ays
Expe
rienc
e
Source FACES Spring 2007 Parent Interview
453
682639
699
598
742
0
20
40
60
80
100
Watch child briefly
Take child to doctor
Help if child sick Talk to about Head Start
Loan emergency
cash
Give advice
Source FACES Spring 2007 Parent Interview
Perc
enta
ge R
epor
ting
Alw
ays
Hav
e Su
ppor
t to
Figure 8 Social Support Parents Receive
among those in care) did not change significantly between the fall and spring however The average child spends about 30 hours per week in the care of someone other than his or her parents including Head Start
The changes in child care usage between the fall and spring differed depending on the type of primary care arrangement parents used for their children The largest increase was in the percentage in relative care which increased from 23 to 27 percent from fall to spring The percentage of children receiving care in a nonrelativersquos home decreased from 5 to 3 percent The changes in the primary types of care were particularly notable for 3-year-olds
-
HispanicLatino children remain less likely to be in child care than children of other racialethnic backgrounds but their participation patterns changed the most The percentage of HispanicLatino children in any type of child care before or after Head Start increased from 29 percent to 34 percent between fall and spring The primary care arrangement used by parents of HispanicLatino children also changed over
the program year A larger percentage of HispanicLatino children were in relative care and center-based care in the spring than in the fall while the percentage in non-relative home care decreased
CHILD OUTCOMES
In this section we describe the cognitive social-emotional and health and physical development of children who were newly entering the Head Start program in fall 2006 and were still enrolled in spring 200723 In the area of childrenrsquos cognitive development we first describe the skills of children who were assessed in English in the fall and spring followed by those of children assessed in Spanish at both waves24
Throughout this section we first describe the outcomes for all children and then provide descriptive information by important subgroups including age gender raceethnicity and family risk status
Child Cognitive Development
Instruments used To assess childrenrsquos skills and knowledge norm- and criterion-referenced
14
measures of language writing and math development were directly administered to the children To measure childrenrsquos receptive vocabulary in English and Spanish the battery included the Peabody Picture Vocabulary Test Fourth Edition (PPVT-4) (Dunn and Dunn 2006) and the Test de Vocabulario Imagenes Peabody
25 (TVIP) (Dunn Lugo Padilla and Dunn 1986) The battery measured childrenrsquos letter-word knowledge and skills in applied problems and writing using the Letter-Word Identification Applied Problems and DictationSpelling subtests from the Woodcock-Johnson Psycho-Educational Battery Third Edition (Woodcock McGrew and Mather 2001) and the Bateriacutea III
26 Woodcock-Muntildeoz (Woodcock et al 2004) To assess math skills it included a supplemental set of math items from the Early Childhood Longitudinal Study Birth Cohort math assessment Items were also included to tap childrenrsquos story and print concepts Parents and teachers also reported on childrenrsquos acquisition of skills and knowledge in the areas of language writing and math
Language screening In the fall the direct child assessment began with a screening to determine whether children who primarily spoke a language other than English at home should be assessed in English assessed in Spanish or not assessed at all Two subtests from the Pre-LAS 2000 Simon Says and Art Show were used as screening tools Children whose home language27 was English were administered the cognitive assessment battery in English regardless of their scores on the language screener If a child made five consecutive errors on both the Simon Says and the Art Show and primarily spoke Spanish at home he or she was administered the PPVT-4 and then routed to the Spanish-language cognitive assessment A child who made five consecutive errors on both the Simon Says and the Art Show and did not primarily speak English or Spanish was administered only the PPVT-4 and was then routed out of the cognitive assessment and was just weighed and measured Children who passed the screener and whose primary home
language was not English received the cognitive assessment battery in English In the spring an adapted version of the screening procedure was used All children were administered the Simon Says task of the Pre-LAS 2000 Following this task those who primarily spoke English at home and those who had passed the language screener in the fall were routed to the English version of the assessment All other children were administered both Simon Says and Art Show and as in the fall performance on both tasks was used to determine whether these children should be assessed in English assessed in Spanish or administered only the PPVT-4 and weighed and measured
Children assessed in English28 Children
score below national norms on most measures of language literacy and math development in both the fall and spring of their first year of Head Start (see Table 1) However children make statistically significant progress towards norms during the year in the areas of English receptive vocabulary (+22 standard score points) letter-word knowledge (+56 standard score points) and applied problems (+19 standard score points) In fact childrenrsquos gains in the area of letter-word knowledge during this period place their scores at the national average by the spring Standard scores have a mean of 100 and a standard deviation of 15 These scores allow for comparisons of an individuals performance to others of the same age (or grade) Thus relative to same-age peers childrenrsquos letter-word knowledge increased by more than one-third of a standard deviation However in all other areas children remain below norms at the end of the program year
Cross-cohort comparisons show that gains across areas during the first Head Start year are similar across the FACES 2003 and 2006 cohorts29 Children made significant progress towards norms in early literacy skills in FACES 200330 (+49 points) and in FACES 2006 (+56 points) In fact in FACES 2006 by the end of the first program year children have strong letter-word skills Across subgroups most children are near if not at or above the national
15
Table 1 Mean Standard Scores for FACES Child Assessment Measures for Children Taking the Assessment in English at Both Waves Fall 2006 Spring 2007 Fall-Spring Change
Fall-Spring Change Mean
Fall 2006 Mean
Spring 2007 Mean Scales (standard scores) Number of cases
PPVT-4 2266 853 875 22 TVIPa 212 866 837 -29 WJ3 Letter Word Identification 2101 944 1000 56 WJ3 Spelling 2223 951 964 13 WJ3 Applied Problems 2018 897 916 19
plt05 plt01 plt001 a These scores are for children primarily spoken to in Spanish at home who passed the language screener threshold and took the remainder of the assessment in English at both waves
Note Lower Nrsquos for standardized score data on the WJ Applied Problems measure is the result of fewer cases having valid scores on these assessments at both waves
mean (see Figure 9) Head Start has emphasized the importance of early literacy skills such as letter knowledge in recent years Gains towards norms in childrenrsquos vocabulary
31 skills and applied problems were also similar across the two cohorts The gap between Head Start childrenrsquos scores and national norms in early writing did not narrow significantly in FACES 2003 or FACES 2006
On criterion-referenced measures without norms 32 children make progress across developmental areas For example children score on average in the low range on the Story and Print Concepts task in both the fall (37 out of 14) and spring (49 out of 14) but they can answer about one more question correctly in this area by the end of the program year regardless of age gender raceethnicity and number of family risks Both teachers and parents report that children demonstrate one to two more writing language or math skills by the end of the program year regardless of subgroup
On the ECLS-B math items children also make progress during the program year and can correctly answer more items For example while fewer than 30 percent of children in Head Start are able to demonstrate number and shape skills33 at the start of the program year by the spring about half are able to For comparison in the ECLS-B national sample 63 percent of preschool children demonstrated these skills34
Diversity in skills Although children on average score below norms in the fall and spring children demonstrate considerable diversity in their skills For example children in the bottom quartile score on average at least one standard deviation below national norms in many areas in both the fall and spring while children in the top quartile score at or above the national average across areas In the area of receptive vocabulary children in the bottom quartile score more than two standard deviations below norms in the fall (650) and more than one standard deviation below norms in the spring (745) while those in the top quartile score at the national average in the fall (1035) and spring (1004) Across areas children who begin with fewer skills relative to peers make more gains than those who begin with greater skills However these children still have below average skills at the end of the program year
Age Both 3- and 4-year-old children make significant progress towards norms in receptive vocabulary (+10 points versus +41 points respectively) and letter-word knowledge (+67 points versus +39 points respectively) Only 4-year-olds make significant progress towards norms in early writing (+58 points) and applied problems (+38 points) Thus 4-year-olds assessed in English make more progress relative to peers than 3-year-olds across areas except letter-word knowledge where 3-year-olds
16
Figure 9 Childrenrsquos Mean WJ III Letter-Word Scores Comparing Subgroups Assessed in English Spring 2007
97
101
103
101
97
103
99
98
102
97
103
100
85 90 95 100 105
2 to 3 Risks
1 Risk
0 Risk
Other Race
HispanicLatino
Black
White
Boys
Girls
4-year-olds
3-year-olds
Overall
Source FACES Spring 2007 Direct Child Assessment
Note All fall-spring differences shown are statistically significant
= plt05 =plt01 = plt001
Source FACES Spring 2007 Direct Child Assessment
Note Within each category (age gender raceethnicity risk) asterisks indicate subgroups that are significantly different from other subgroups in the category
=plt05 =plt01 =plt 001
make more progress towards norms Notably 3-year-olds who took the assessment in English generally perform closer to their same-age peers nationally than 4-year-olds across measures
On criterion-referenced measures without norms both 3- and 4-year-old children make progress across developmental areas On the ECLS-B math items both 3- and 4-year-old children make progress during the program year and can correctly answer more items For example while less than 20 percent of 3-year-olds are able to demonstrate number and shape skills at the start of the program year by the spring about 40 percent are able to The percentage increases from 41 percent to 67 percent among 4-year-olds Across areas 4-year-olds demonstrate more advanced skills in absolute terms
Gender With the exception of letter-word knowledge and early writing skills girls assessed in English score below national norms across measures of language and math development in both the fall and spring of their first year of Head Start However in the areas of English receptive vocabulary letter-word knowledge early writing and applied problems girls make progress toward these norms during the program year In fact girls assessed in English gain 6 standard score points in the area of letter-word knowledge during this period and score above the national average in this area by the spring (1020 Figure 9) They also score at the national mean in early writing by the spring (994) In contrast boys make progress towards norms in the areas of English receptive vocabulary (+24 points) and letter-word knowledge (+50 points) only Unlike girls they score below norms across measures at both the beginning and end of the year
17
On criterion-referenced measures without norms both boys and girls make progress across developmental areas On the ECLS-B math items both girls and boys can correctly answer more items by the spring For example while less than 30 percent of girls are able to demonstrate number and shape skills at the start of the program year by the spring 51 percent are able to The percentage increases from 24 percent to 46 percent among boys
Raceethnicity With the exception of letter-word knowledge children from all racialethnic backgrounds score below national norms across measures of language literacy and math development in both the fall and spring of their first year of Head Start All children make progress toward norms in the areas of English receptive vocabulary and letter-word knowledge during the year regardless of raceethnicity In fact children from all racialethnic groups score at or near norms in letter word knowledge by the end of the program year (see Figure 9) with African American children making the greatest gains (+74 points) and scoring above norms by spring (1025) Only White and African American children make progress towards norms in applied problems during the program year
On criterion-referenced measures without norms children from all racialethnic backgrounds make progress across developmental areas On the ECLS-B math items all children can correctly answer more items For example while 35 percent of White children are able to demonstrate number and shape skills at the start of the program year by the spring 59 percent are able to The percentage increases from 21 percent to 41 percent among African American children from 23 percent to 48 percent among HispanicLatino children and from 30 percent to 52 percent among Other race children
35 Family risk With the exception of letter-word knowledge regardless of number of family risks children score below national norms across measures of language literacy and math development in both the fall and spring of their first year of Head Start In fact children with no
(+ 44 points) 1 (+ 60 points) and 2 or more risks (+58 points) make statistically significant progress towards norms in the area of letter-word knowledge However by the end of the program year children with no (1029) and 1 family risk (1012) score above norms in this area Children with 2 or more family risks remain below norms in letter-word knowledge in the spring (974) Regardless of number of family risks children also make progress toward norms during the year in the area of English receptive vocabulary During the program year children with no 1 and 2 or more family risks gain 21 26 and 26 standard score points respectively However all groups remain below norms at the end of the program year in this area Only children with 1 family risk make progress towards norms in early writing (+30 points) during the program year Only children with no family risks make progress towards norms in the area of applied problems during the year (+4 points)
On criterion-referenced measures without norms children from all backgrounds make progress across developmental areas On the ECLS-B math items all children can correctly answer more items by the spring While 29 percent of children with no family risks are able to demonstrate number and shape skills at the start of the program year by the spring about 53 percent are able to The percentage increases from 28 percent to 50 percent among children with 1 risk and from 23 percent to 44 percent among children with 2 or more risks
36 Children assessed in Spanish Children who take the assessment in Spanish at the beginning and end of their first Head Start year score below norms across measures of language literacy and math development in both the fall and spring (Table 2) Mean scores are only reported for those with valid scores at both occasions (for example those who established a basal on the PPVT-4 at both waves) Across measures the scores for these children are lower than those who passed the screener and are assessed in English at both waves as well as those who changed assessment language from Spanish in the fall to English in the spring
18
Table 2 Mean Standard Scores for FACES Child Assessment Measures for Children Taking the Assessment in Spanish at Both Waves Fall 2006 Spring 2007 Fall-Spring Change
Fall-Spring Change Mean
Fall 2006 Mean
Spring 2007 Mean Scales (standard scores) Number of cases
PPVT-4 25 616 633 17 TVIP a 132 848 815 -33 WM3 Letter Word Identification 49 765 867 102 WM3 Spelling 131 882 883 01 WM3 Applied Problems 95 825 828 03
plt05 plt01 plt001
Note Lower Nrsquos for standardized score data on the WM Letter Word Identification and PPVT-4 measures are the result of fewer cases having valid scores on these assessments at both waves
a These scores are for children who did not pass the language screener threshold and took the remainder of the assessment in Spanish at both waves
Children assessed in Spanish at both time points make statistically significant progress toward norms only in the area of letter-word knowledge during the year In fact children gain more than 10 standard score points in this area during the year or about two-thirds of a standard deviation However despite these gains and unlike children assessed in English these children still score below norms in letter-
37 word knowledge in the spring Thus it is important to recognize the diversity in childrenrsquos skills in English and their home language and to consider the contextual factors in both home and program settings that may contribute to childrenrsquos learning
Child Social-Emotional Development
FACES 2006 provides multiple perspectives on childrenrsquos positive and challenging behaviors that may affect their ability to learn and interact with peers and adults Teachers reported on childrenrsquos social skills such as making friends easily and waiting hisher turn in games or other activities as well as their problem behaviors in the classroom such as being very restless and unable to sit still or disrupting ongoing activities They also assessed childrenrsquos approaches to learning such as their attitudes toward learning new things motivation to perform well and attentionpersistence on learning activities The approaches to learning measure was the
Preschool Learning Behaviors Scale (PLBS McDermott et al 2000 McDermott et al 2002)
Parents also reported on childrenrsquos social skills and problem behaviors in the home environment Finally using the Leiter-Revised Examiner Rating Scale (Roid and Miller 1997) assessors rated childrenrsquos behaviors during the assessment situation in such areas as attention organization and impulse control activity level and sociability Assessor ratings are the only social-emotional rating data that can be compared with normative data
Both teachers and parents report that children show growth in their social skills during their first Head Start year Consistent with prior FACES cohorts (Zill et al 2006) teachers report that children demonstrate statistically significant gains in social skills and cooperative classroom behavior by the end of the program year They also rate children as having fewer problem behaviors by the spring (see Figure 10) as well as more attention and persistence with tasks
38 (not shown) As in FACES 1997 and 2000 teachers rate children as showing statistically
39 significant declines in hyperactive behaviors by the spring They do not report changes in childrenrsquos aggressive and withdrawn behaviors over the course of the program year This is similar to patterns found in FACES 1997 and
402000
19
156 173
2
4
6
8
10
12
14
16
18
20
69 65
31 28
0 Social Skills Problem Behaviors Hyperactive Behavior
(range = 0 to 24) (range = 0 to 36) (range = 0 to 12)
Fall 2006 Spring 2007
Figure 10 Childrenrsquos Teacher-Reported Social-Emotional Development Scores Fall-Spring Change
Source FACES Fall 2006 and Spring 2007 Teacher Child Report
Note All fall-spring differences shown are statistically significant
= plt05 =plt01 = plt001
Parents report that children demonstrate more social skills and positive approaches to learning and fewer problem behaviors on average in the spring Assessors do not report any statistically significant changes in childrenrsquos behavior during the assessment situation including the childrsquos attention organization and impulse control activity level and sociability
Age Teachers and parents report few differences by age in changes in social-emotional development over the program year They report that both 3- and 4-year-old children demonstrate more social skills cooperative classroom behaviors and positive approaches to learning on average by the end of the program year However although parents report that both groups demonstrate declines in problem behaviors teachers only report that 3-year-old children demonstrate declines in
problem behaviors and gains in attention and persistence with tasks by the spring Teachers report that both age cohorts demonstrate declines in hyperactive behaviors during the program year
Gender Teachers and parents do not report differences in gains or declines in social-emotional development by gender
Raceethnicity Teachers report that all children regardless of raceethnicity demonstrate more social skills on average by the end of the program year However they report differences in changes in other areas of childrenrsquos social-emotional development by raceethnicity For example they report that only HispanicLatino children have significantly fewer problem behaviors overall fewer aggressive behaviors more positive approaches to learning
20
and more positive attitudes toward learning in the spring They also report that both African American and HispanicLatino children demonstrate significantly fewer hyperactive behaviors and greater attention and persistence with tasks in the spring
Family risk Regardless of number of family risks teachers report that children demonstrate more social skills and fewer problem behaviors on average by the end of the program year They also report that children demonstrate fewer hyperactive behaviors in the spring Teachers report that only children with one risk or two or more risks have greater attention and persistence with tasks by spring
Parents report that children with no and 2 or more risks demonstrate more social skills and positive approaches to learning on average in the spring For all risk groups they report fewer problem behaviors by the end of the program year
Subgroup differences in problem behaviors
Looking only at levels of problem behaviors in the spring teachers report marked differences across subgroups in childrenrsquos problem behaviors by the spring For example there are expected developmental differences with 4-year-olds displaying fewer problem behaviors than 3-year-olds (mean = 54 versus 71) Teachers also report that girls have fewer problem behaviors than boys (mean = 52 versus 77) and that HispanicLatino children (mean = 54) have fewer problem behaviors than children from other racialethnic backgrounds including White (mean = 73) African American (mean = 68) and Other race (mean = 73) children Finally they report that children with two or more family risks (mean = 68) have more problem behaviors than children with one (mean = 60) or no family risks (mean = 58)
Child Health and Physical Development
As in the fall approximately three-quarters of children are rated as having ―excellent or ―very good health by their parents in the spring (see Figure 11) Only a small percentage of children
are reported as having ―fair or ―poor general health at the end of the program year This finding is consistent with prior FACES cohorts Parents report differences in general health status by gender raceethnicity and family risk More parents of girls (81 percent) report that their child is in excellent or very good health than do parents of boys (75 percent) Similarly more parents of White children (86 percent) report their child is in excellent or very good health than do parents of African American (80 percent) HispanicHispanicLatino (70 percent) and Other race children (81 percent) Fewer parents of children with no family risks report their child to be in fair or poor health than do parents of children with one or more risks
Approximately 15 percent of children are reported by their teacher as having a disability in the spring Among Head Start children identified by teachers as having a disability speech and language impairments (79 percent) and cognitive impairments (22 percent) are the most common disabilities About a quarter of those identified as having a disability are reported by teachers to have more than one impairment About two-thirds of Head Start children with an identified disability have an Individual Education Plan (IEP) or Individualized Family Service Plan (IFSP) in the spring
Head Start children have an average Body Mass Index (BMI) 41 that is above average for their age range In fact about 19 percent of children are overweight and 17 percent are obese42 A similar percentage (18 percent) of preschoolers in the Early Childhood Longitudinal Study-Birth Cohort (ECLS-B) was obese (Anderson and Whitaker 2009) HispanicLatino children (20 percent) are more likely to be obese than White (15 percent) and African American children (15 percent)
HEAD START TEACHERS AND CLASSROOMS
The FACES conceptual framework envisions a relationship between the provision of quality early care and educational services and childrenrsquos developmental outcomes
21
Figure 11 Child Health Status Spring 2007
77
17
6
Excellent or Very GoodFairPoor
Source FACES Spring 2007 Parent Interview
Accordingly FACES collected information on the characteristics credentials beliefs and reported classroom activities of lead teachers in the classrooms where sample children were enrolled in spring 2007 Statistics are weighted to represent all teachers serving children who entered Head Start for the first time in fall 2006 and who were still enrolled in their classrooms in spring 2007
Teacher Characteristics
Most Head Start teachers are female (98 percent) and more than half are between the ages of 30 and 49 The percentage of teachers who identify themselves as HispanicLatino has increased over time In spring 2007 20 percent of teachers were HispanicLatino compared with 16 percent in FACES 2000 and 17 percent in FACES 2003 (ACF 2008) More than 80 percent of Head Start teachers have an Associatersquos (AA) or Bachelorrsquos (BA) degree (see Figure 12) Compared to FACES 2000 and 2003 a larger percentage of teachers have an AA or higher (82 percent versus 57 and 72 percent respectively) This is consistent with Head Startrsquos mandate to increase the educational levels of its teachers to an AA or higher The percentage of teachers with a BA or higher in spring 2007 (41 percent) is similar to the percentage in FACES 2000 (40 percent) and 2003 (38 percent) In addition to these degrees
many teachers have specific training in child development and teaching more than half of Head Start teachers report having a Child Development Associate (CDA) certificate and about a third have a state-awarded certificate teaching certificate or license or are currently enrolled in teacher training The average Head Start teacher has been in the classroom for nearly 9 years and the average annual salary is just below $23000
Head Start teachers are generally positive about their profession FACES measured teacher beliefs and attitudes towards developmentally appropriate practice (Burts et al 1990) yielding higher scores on child-initiated practice (45 out of 5) than on didactic strictly teacher-initiated practice (25 out of 5) Teachers scoring higher on developmentally appropriate practice are likely to endorse such items as ―Head Start classroom activities should be responsive to individual differences in development and to disagree with such items as ―Children should work silently and alone on seatwork In addition on a measure of management climate (Lambert et al 1999 Lambert 2002) teachers rate their programs relatively positively (on average 36 on a 5-point scale) The scale asks teachers to rate the strength of their agreement with statements about the program such as ―Provides enough assistance to teachers in the
22
Figure 12 Associatersquos Degrees Show Increase Over Time While Bachelorrsquos Degree Percent is Stable
57
72
82
40 3841
0
10
20
30
40
50
60
70
80
90
2000 2003 2006
Perc
enta
ge o
f Tea
cher
s
AA or higherBA or higher
Source FACES Fall 2006 Teacher Interview (and published data)
classroom and ―Promotes teamwork among teachers Further teachers report high levels of satisfaction with their current positions Eighty-eight percent of lead teachers agree or strongly agree with the statement ―I really enjoy my present teaching job while 94 percent agree or strongly agree that ―I am certain I am making a difference in the lives of the children I teach
The average teacher satisfaction score is 45 out of 5 points
FACES measured teachersrsquo mental health status because of its potential effects on their interactions with children in their classrooms As shown in Figure 13 most Head Start teachers do not report elevated symptoms of depression in spring 2007 However six percent of teachers report symptoms of severe depression and nearly ten percent report symptoms of moderate depression In all slightly more than one-third of teachers report some depressive symptoms
Classroom Educational Environment
As a measure of the spring classroom environment FACES asked teachers to report on the types and frequency of learning activities in early literacy and mathematics in their classrooms Overall the majority of reading and language activities are reported to occur daily or almost daily The most common activities reported by at least 80 percent of teachers as occurring daily or almost daily are letter naming writing letters discussing new words listening to the teacher read stories where children can see the print learning about conventions of printed materials and writing their own names Less frequent activities include listening to the teacher read books without seeing the print learning about rhymes retelling stories and learning about prepositions Similarly teachers report frequent math-related activities in their classrooms (see Figure 14) At least 80 percent of teachers report daily or almost daily counting aloud using a calendar
23
Figure 13 One-Third of Head Start Teachers Report Some Depressive Symptoms
63
21
106
Not depressed Mildly depressedModerately depressed Severely depressed
Source FACES Spring 2007 Teacher Interview
and engaging with geometric and counting manipulatives A smaller percentage of teachers report having children frequently play math-related games using creative movement or drama to understand math telling time or working with measuring instruments The most frequent activities were the same as those reported in the fall
Close to two-thirds of Head Start teachers report their primary curriculum is Creative Curriculum whether they use only one or a combination of curricula Next most frequently used is the HighScope Curriculum (16 percent of teachers) with the remaining teachers using other curricula The assessment tools that teachers report using follow the same pattern although only 39 percent of teachers use the Creative Curriculum assessment tool and 9 percent use the HighScope Child Observation Record (COR) The Desired Results Developmental Profile (DRDP) is used by another 9 percent of teachers and the remaining nearly 43 percent use a variety of other tools Using curriculum and assessment tools that are aligned with each other and with program standards is considered advantageous to supporting childrenrsquos learning
(National Research Council 2008) Out of the Head Start teachers who report using Creative Curriculum about 60 percent use the Creative Curriculum assessment tool and about 40 percent use a different tool About 40 percent of teachers overall use both the Creative Curriculum and its assessment tool less than 2 percent of teachers use both the HighScope curriculum and the COR
Classroom Observations
To measure overall classroom quality in FACES 2006 FACES used the Instructional Support domain of the Classroom Assessment Scoring System (CLASS Pianta LaParo and Hamre 2008) in conjunction with the full Early Childhood Environment Rating Scale-Revised (ECERS-R Harms Clifford and Cryer 1998) in spring 2007 Classroom observations also included the Arnett Caregiver Interaction Scale (Arnett 1989) as well as observer counts of child-adult ratios and group sizes Observations were done in a representative sample of 350 classrooms attended by 3- and 4-year-old children in their first year of Head Start Observations lasted for 4 hours on average and were typically completed in the mornings43
24
Figure 14 Teachers Report Frequent Math Activities 98
86 84 82
66
56 54 52
0
10
20
30
40
50
60
70
80
90
100Pe
rcen
tage
of T
each
ers Count aloud
CalendarGeometric shapesCounting objectsMath gamesMovementTelling timeRuler
Percent DailyAlmost Daily
Source FACES Spring 2007 Teacher Interview
The ECERS-R is a global rating of classroom quality based on structural features of the classroom (Harms et al 1998) It has been used historically in FACES ( starting with the earlier version of the ECERS [Harms and Clifford 1980] in the 1997 cohort) and in many other large-scale studies The CLASS measures classroom quality in terms of both instructional and social-emotional aspects of the environment across three domains of interaction Emotional Support Classroom Organization and Instructional Support Instructional Support the domain used in FACES 2006 measures the quality of instructional practices used in the classroom on three dimensions (Concept Development
44 Quality of Feedback and Language Modeling) Both the CLASS and the ECERS-R items are scored from 1 to 7 with higher scores reflecting better quality care The Arnett assesses the quality and content of the teacherrsquos interactions with children The scale measures the emotional tone discipline style and responsiveness of the caregiver in the classroom Total scores range from 0 to 90 with higher scores reflecting greater
caregiver sensitivity and responsiveness and less detachment and punitiveness Together these measures provide information on the educational environment and quality of Head Start classrooms
The National Association for the Education of Young Children (NAEYC) offers professional standards for appropriate child-teacher ratios (9 children per adult in classrooms with 3-year-olds and 10 children per adult in classrooms with 4-year-olds) and group sizes (18 or fewer children in classes with 3-year-olds and 20 or fewer children in classes with 4-year-olds) Head Start Program Performance Standards provide similar guidelines (85 children per adult in classrooms with 3-year-olds and 10 children per adult in classrooms with 4-year-olds and a maximum group size of 17 or 20 respectively see NCCIC 2008) In spring 2007 the average Head Start classroom had 62 children to each adult and the average group size was 145 falling well within professional guidelines and Head Start Program Performance Standards Half of
25
classrooms (50 percent) had observed group sizes of fewer than 15 children and the majority (93 percent) had ratios of 9 to 1 or lower
Average classroom quality in Head Start was within acceptable levels The average ECERS-R total score was 358 and the majority of classrooms fell in the minimal to good range (82 percent see Figure 15)45 Compared with other studies of child care and prekindergarten programs the range of observed quality in Head Start is narrow Few classrooms (13 percent) scored below 3 (considered the threshold for minimal quality) and none scored above a 6 (considered excellent quality) Average total scores were lower than those found in earlier FACES cohorts continuing a decline in scores observed over time (51 in spring 1998 [ACF 2001] 491 in 2001 [ACF 2006] and 423 in spring 2004 [ACF 2008])
Researchers in other large scale studies have derived alternative dimensions of quality using the ECERS-R Two factors reported in the Multi-State Study of Prekindergarten represent the key dimensions of quality tapped by the full ECERS-R (Clifford et al 2005)46 The Provisions for Learning subscale focuses on materials available in the classroom and on the arrangement of the classroom space while the Teaching and Interactions subscale focuses on the quality of teacher-child interactions The two subscales reliably assess the areas of classroom quality most proximal to learning More than half scored between 3 and 4 out of a possible 7 on the Provisions for Learning subscale and an additional 20 percent scored below 3 On the Teaching and Interactions subscale close to half of observed classrooms scored between 4 and 5 These findings suggest that Head Start classrooms were more likely to score higher on emotional and educational aspects of teaching and interactions than on the provision of materials and furnishings for learning (see Figure 15)
While remaining in the minimal to good range across cohorts mean scores on these two subscales have declined over time In spring 2001 the mean Teaching and Interactions
subscale score was 541 (SD = 131) compared to 492 (SD = 123) in 2004 and 408 in 2007 On Provisions for Learning mean scores were 482 (SD = 107) in spring 2001 395 (SD = 098) in 2004 and 357 in 2007 Across cohorts classrooms scored higher on Teaching and Interactions than Provisions for Learning This pattern is similar to that reported in the NCEDL
47 Study of Prekindergarten (Clifford et al 2005)
Teachers scored highly on the measure of quality and content of their interactions with children The average Arnett score for lead teachers in Head Start classrooms was 664 (out of a possible 90) suggesting high levels of teacher sensitivity responsiveness and encouragement of childrenrsquos independence and self-help skills Scores ranged from 23 to 85 and average Arnett scores were close to those reported in earlier FACES cohorts although like the ECERS-R these have also declined over time (730 in spring 1998 [ACF 2001] 722 in spring 2001 [ACF 2006] and 704 in spring 2004 [ACF 2008])
On the Instructional Support domain of the CLASS classrooms scored at the low end of the 7-point scale Average quality was 19 with the majority of classrooms (96 percent) rated in the low range (1 or 2 points see Figure 16) Four percent of classrooms scored in the middle range on the domain (3 4 or 5 points) and none scored in the high range (6 or 7 points) On the dimensions (subscales) of the Instructional Support domain scores on Concept Development (18) were lower than those for Language Modeling (21) and Quality of Feedback (20) Most classrooms scored in the low range on Concept Development (95 percent) and Quality of Feedback (93 percent) although 14 percent of the classrooms had a middle rating on Language Modeling While the CLASS does not have normative data the CLASS Technical Appendix (Pianta et al 2008) reports mean scores from several large-scale studies that used the CLASS or its precursor the Classroom Observation System (COS) The mean scores in Head Start classrooms fall within or below ranges reported in these studies48
26
Figure 15 Percentage Distribution of ECERS-R Scores
0
13
64
20
30 02
9
26
50
11
300
20
56
17
3 30
0
10
20
30
40
50
60
70
10 - 19 Inadequate
20 - 29 30 - 39 Minimal
40 - 49 50 - 59 Good
60 - 69 70 Excellent
Perc
enta
ge o
f Cla
ssro
oms
Total Teaching amp Interactions Provisions for Learning
Source FACES Spring 2007 Classroom Observation
Figure 16 Percentage Distribution of Scores on CLASS Instructional Support Domain and Dimensions
53
44
4029 0 0 0
36
50
13
1 0 0 0
57
38
31 0 0 0
37
56
6
1 0 0 00
10
20
30
40
50
60
10 - 19 20 - 29 30 - 39 40 - 49 50 - 59 60 - 69 70
Perc
enta
ge o
f Cla
ssro
oms
Instructional Support Language Modeling Concept Development Quality of Feedback
Source FACES Spring 2007 Classroom Observation
Low (1 2) Mid (3 4 5) High (6 7)
27
Lower ratings (that is in the 1 to 2 range) on the Instructional Support domain relative to the other CLASS domains are consistent with findings reported in the CLASS appendix In spring 2008 FACES 2006 conducted a study designed to test the feasibility of conducting the full CLASS in a large number of classrooms For this pilot the Emotional Support and Classroom Organization domains were included in addition to Instructional Support In preliminary analyses Instructional Support scores were higher and more similar to those reported by the developer (Pianta et al 2008) when used as part of the full CLASS suggesting that use of the full CLASS may be a more accurate measure of classroom quality than the use of one domain alone49
CORRELATES OF CLASSROOM QUALITY AND TEACHER ATTITUDES
We used two-level hierarchical linear models (HLM) with classrooms nested within programs to examine the teacher and program characteristics associated with classroom quality and teacher attitudes The use of HLM recognizes that teachersclassrooms in the same program are not independent of each other because of shared resource levels policies and program practices
As measures of quality we used the CLASS Instructional Support domain and its subscale the Language Modeling dimension and the ECERS-R Teaching and Interactions and Provisions for Learning subscales We also examined correlates of teacher attitudes including the teacherrsquos level of satisfaction with teaching as a career and the teacherrsquos attitudes toward developmentally appropriate practice as these may be mediators that link education levels or professional development with quality of practice
Program-level covariates in each of these analyses included program SES percentage of English language learners percentage of teachers using a consistent curriculum and assessment package teacher turnover and adjusted program mean salary Covariates at the teacherclassroom level included teacher
education experience reported depressive symptoms frequency of mentoring and perceived management support The analyses of classroom quality also include DAP attitudes and teacher satisfaction with teaching as a career
Although neither teacher education nor experience is directly associated with observed classroom quality there may be an indirect association through teacher satisfaction and attitudes toward developmentally appropriate practice Teacher education at the AA level is related to higher satisfaction (b = 30 ES = 46) and in a separate model higher teacher satisfaction is related to ECERS-R Teaching and Interactions scores (b = 26 ES = 18)50
Similarly having more years of teaching experience is related to higher scores on attitudes toward developmentally appropriate practice (b = 91-148 ES =55-88) and in separate models endorsement of developmentally appropriate practice is related to ECERS-R Provisions for Learning (b = 07 ES = 15) and to CLASS Language Modeling (b = 06 ES = 15)
Teachers who perceived a more positive management climate also reported greater satisfaction with their work (b = 33 ES = 41) but management climate is not associated with observed quality measures Teachers who reported higher depressive symptoms had lower ratings on one measure of quality the Language Modeling dimension of the CLASS (b = -09 ES = -12) Thus teachers who reported more symptoms of depression were less likely to be observed supporting childrenrsquos language development through more and extended conversations open-ended questions and mapping actions with language and description Finally program socioeconomic status which represents the average household poverty ratio within a program is positively related to both ECERS-R Teaching and Interactions (b = 49 ES = 17) and Provisions for Learning subscales (b = 85 ES = 36) as well as to teacher endorsement of developmentally appropriate practice (b = 92 ES = 18)
28
ASSOCIATIONS BETWEEN OBSERVED QUALITY AND CHILDRENrsquoS DEVELOPMENTAL STATUS
We used three-level HLM to examine the relationships between classroom quality and childrenrsquos outcomes controlling for childfamily teacherclassroom and program characteristics These analyses account for the clustering of children within classrooms and classrooms within programs because children in the same classroom and program share a common set of preschool experiences and thus their outcomes
51 are not independent
We estimated models of childrenrsquos developmental status in the spring controlling for their initial status measured in the fall Outcomes include language and literacy (PPVT4 Woodcock-Johnson [WJ] Letter-Word Identification) mathematics (WJ Applied Problems ECLS-B mathematics) and social-emotional development (teacher ratings of childrenrsquos social skills and behavior problems) The language literacy and mathematics outcomes were measured using equal-interval W-scores to facilitate interpretation of variation across scores Then all outcomes were z-scored so that the coefficients may be interpreted as the change in the child outcome in standard deviation units for each 1 point increase in the respective variable
-
The childfamily level covariates included child age gender raceethnicity household language poverty ratio maternal education maternal depressive symptoms fall score and time interval between the fall and spring assessments The teacherclassroom level covariates included the quality measures discussed previously (Instructional Support Language Modeling Teaching and Interactions) teacher education full-day class mean peer abilities variation in peer abilities and teacher DAP attitudes The program level covariates included program socio-economic status (SES) percentage of English language learners percentage of teachers using a consistent
curriculum and assessment package teacher turnover and adjusted program mean salary
We estimated a series of models in the analysis In Model 1 we included childfamily characteristics in level 1 In Model 2 we added classroom quality and teacherclassroom characteristics In Model 3 we added program characteristics In order to test whether there is a non-linear relationship between classroom quality and childrenrsquos outcomes we included both a linear and a quadratic term in the model and dropped the quadratic term if it was not significant
Observed Quality and Childrenrsquos Cognitive Outcomes
As in the descriptive reporting only children with valid assessment scores are included in the analyses (for example children who do not establish a basal on the PPVT-4 are excluded from the appropriate models) The models used z-scored W-scores which are a marker of absolute rather than relative progress The PPVT and WJ W-scores are on different scales
Teacher and classroom level Peer abilities are related to childrenrsquos progress on several measures For example variation in peer abilities within classrooms is positively related to childrenrsquos progress on the PPVT-4 (b = 28 ES = 10) and Letter Word (b = 41 ES = 15) meaning that the more variation in the scores of other children in the classroom on these measures at baseline the greater the progress over the year In contrast on math measures greater progress is related to a higher baseline mean score among classmates (for Applied Problems b = 12 ES = 07 for ECLS-B Math b = 10 ES = 05) Teachersrsquo educational level is related to childrenrsquos progress on ECLS-B math but not on other cognitive measures (b = 11 ES = 11) such that teachers with an AA have children who make greater progress than
52 teachers with high school or less
Observed quality measures Childrenrsquos progress on the PPVT-4 is related to a number of quality measures The higher the ECERS-R
29
Teaching and Interactions score is the greater the progress on the PPVT (b = 05 ES = 05) controlling for other variables in the model However the association between the CLASS Instructional Support or Language Modeling scores and childrenrsquos PPVT-4 scores in the spring is non-linear (b = 05 ES =12 for Instructional Support quadratic term b =-31 ES= -19 and b = 08 ES = 22 for Language Modeling linear and quadratic terms respectively) In other words in the lower score range there is little association with quality but after a threshold of 20-25 spring PPVT-4 scores increase at an increasing rate with higher quality
Approximately 14 percent of classrooms score above 30 on the CLASS Language Modeling dimension Classrooms scoring below 30 on the CLASS Language Modeling dimension are characterized by such observed features as teachers engage in few conversations are more likely to use close-ended questions rarely repeat or extend the childrsquos responses rarely map their own or the childrenrsquos actions with language and do not use advanced language such as a variety of words and clarification of more difficult words in familiar terms
None of the classroom quality measures is significantly associated with childrenrsquos progress on the Letter Word subtest There is a negative relationship between Language Modeling and Applied Problems (b = -31 ES = -20) even after controlling for program characteristics
Observed Quality and Childrenrsquos Social-Emotional Outcomes
Teacher-reported social-emotional outcomes (social skills and behavior problems) were the basis for the dependent variables Since response rates for the teacher-child reports were high nearly all children are included in these analyses
Teacher and classroom level The models of childrenrsquos social-emotional outcomes included two measures of peer abilities (1) average and variance of peer social skills and (2) average
and variance of peer language achievement (PPVT) Both social skills and language ability of peers may influence classroom dynamics in ways that can affect a childrsquos behavior Looking first at childrenrsquos social skills controlling for other variables higher average peer social skills are associated with higher spring ratings on the individual childrsquos social skills (b = 17-18 ES = 10-11) but the variation in social skills in the classroom is not In addition the variation in peer language achievement is positively associated with the individual childrsquos social skills rating (b = 24-26 ES = 08-09) but average language ability in the classroom is not Behavior problem ratings are related only to average peer social skills higher levels of average peer social skills are associated with lower individual child behavior problem ratings (b = -14 to -15 ES = -09) behavior problem ratings are not associated with peer language achievement Teachers rate children as having fewer behavior problems in classrooms in which the average child is rated higher on social skills
Teacher education is associated with ratings of childrenrsquos social skills with more-educated teachers (with an AA or more) rating children lower on social skills than high school-educated teachers (b = -23 to -30 ES = -23 to -30) Teachersrsquo endorsement of developmentally appropriate practice is related to higher ratings of childrenrsquos social skills (b = 08 ES = 13-14)
Observed quality measures None of the classroom quality measures is significantly associated with teachersrsquo spring ratings of social skills or behavior problems
These analyses of classroom quality measures suggest that Head Start classrooms are more likely to score higher on aspects of Teaching and Interactions than on Instructional Support or provision of resources for learning Teacher credentials are improving over time and most teachers feel that they work in a supportive management climate Teacher education and experience may be indirectly related to observed quality through associations with teacher-reported satisfaction and endorsement of developmentally appropriate practice Finally
30
there is a non-linear relationship between scores on the CLASS Language Modeling dimension and childrenrsquos spring PPVT-4 scores such that scores increase more strongly above a threshold of 2 to 25 on the 7 point scale Further analyses of quality thresholds in relation to childrenrsquos outcomes are underway through related projects
REFERENCES
Administration for Children and Families ―About the Office of Head Start Available at [httpwwwacfhhsgovprogramsohsabout indexhtml] Accessed July 31 2009
Administration for Children and Families ―FACES 2003 Fifth Progress Report Technical Appendix Washington DC US Department of Health and Human Services 2008
Administration for Children and Families ―Head Start FACES 2000 A Whole-Child Perspective on Program Performance Fourth Progress Report Washington DC US Department of Health and Human Services 2003
Administration for Children and Families ―Head Start FACES Longitudinal Findings on Program Performance Third Progress Report Washington DC US Department of Health and Human Services 2001
Administration for Children and Families ―Head Start Performance Measures Center Family and Child Experiences Survey (FACES 2000) Technical Report Washington DC US Department of Health and Human Services 2006
American Academy of Pediatrics Committee on Public Education ―Children Adolescents and Television Pediatrics vol 107 no 2 February 2001 pp 423-426
Anderson S E and R C Whitaker ―Prevalence of Obesity Among US Preschool Children in Different Racial and Ethnic Groups Archives of Pediatric and Adolescent Medicine vol 163 no 4 2009 pp 344-348
Arnett Jeffrey ―Caregivers in Day-Care Centers Does Training Matter Journal of Applied Developmental Psychology vol 10 1989 pp 541-552
Beals D E and C E Snow ―Mealtime Talk That Supports Literacy Development New Directions for Child and Adolescent Development vol 111 2006 pp 51-66
Block J H ―The Child-Rearing Practices Report Berkeley CA Institute of Human Development University of California 1965
Burts DC CH Hart R Charlesworth and L Kirk ―A Comparison of the Frequencies of Stress Behaviors Observed in Kindergarten Children in Classrooms with Developmentally Appropriate vs Developmentally Inappropriate Practices Early Childhood Research Quarterly vol 5 1990 pp 407423
-
Chernoff J K Flanagan C McPhee and J Park ―Preschool First Findings from the Preschool Follow-up of the Early Childhood Longitudinal Study Birth Cohort (ECLS-B) Washington DC US Department of Education 2007
Clifford Richard Oscar Barbarin Florence Chang Diane M Early Donna Bryant Carollee Howes Margaret Burchinal and Robert Pianta ―What Is Pre-Kindergarten Characteristics of Public Pre-Kindergarten Programs Applied Developmental Science vol 9 no 3 2005 pp 126-143
Croninger RG and VE Lee ―Social Capital and Dropping Out of High School Benefits to At-Risk Students of Teachersrsquo Support and Guidance Teachers College Record vol 103 no 4 2001 pp 548-581
Downey DB PT von Hippel and B Broh ―Are Schools the Great Equalizer Cognitive Inequality During the Summer Months and the School Year American Sociological Review vol 69 no 5 2004 pp 613-635
Dunn Lloyd and Doug Dunn Peabody Picture Vocabulary Test Fourth Edition Circle Pines MS American Guidance Service 2006
Dunn LM DE Lugo ER Padilla and LM Dunn Test de Vocabulario en Imagenes Peabody Circle Pines MN American Guidance Service 1986
Harms T amp Clifford R M (1980) The Early Childhood Environment Rating Scale New York NY Teachers College Press
Harms Thelma Richard Clifford and Debby Cryer Early Childhood Environment Rating
31
ScalemdashRevised (ECERS-R) New York NY Teachers College Press 1998
Hofferth SL and JF Sandberg ―How American Children Spend Their Time Journal of Marriage and the Family vol 63 no 2 2001 pp 295-308
Hulsey L N Aikens L Tarullo and J West ―ACF-OPRE Report Data Tables for FACES 2006 A Year in Head Start Report Washington DC US Department of Health and Human Services Administration for Children and Families Office of Planning Research and Evaluation 2010
Lambert R ―Evaluating Management Climate in Head Start Programs The Measurement Properties of the Policy and Program Management Inventory NHSA Dialog A Research-to-Practice Journal for the Early Intervention Field vol 6 no 1 2002 pp 3752
-
Lambert RG M Abbott-Shim and C Oxford-Wright ―Policy and Program Management Inventory Teacher Version Charlotte NC The Center for Educational Evaluation and Measurement 1999
McDermott PA LF Green JM Francis and DH Stott ―Preschool Learning Behaviors Scale Philadelphia PA Edumetric and Clinical Science 2000
McDermott PA NM Leigh and MA Perry ―Development and Validation of the Preschool Learning Behaviors Scales Psychology in the Schools vol 39 2002 pp 353-365
National Child Care Information and Technical Assistance Center ―QRS Planning Tool Standards for Early Childhood Education Programs May 2008 Available at [httpnccicacfhhsgovpoptopicsqrs-ptecehtml] Accessed July 30 2009
-
National Research Council Early Childhood Assessment Why What and How edited by CE Snow and SB Van Hemel Washington DC The National Academies Press 2008
Pallas AM G Natriello and EL McDill ―The Changing Nature of the Disadvantaged Population Current Dimensions and Future Trends Educational Researcher vol 18 no 5 1989 pp 16-22
Pianta Robert K LaParo and B Hamre The Classroom Assessment Scoring System Pre-
K Manual Charlottesville VA University of Virginia 2008
Radloff LS ―The CES-D Scale A Self-Report Depression Scale for Research in the General Population Journal of Applied Psychological Measurement vol 1 no 3 1977 pp 385-401
Rathbun A and J West ―From Kindergarten Through Third Grade Childrenrsquos Beginning School Experiences NCES 2004-007 Washington DC National Center for Education Statistics 2004
Roid G H and Miller L J Examiners manual Leiter International Performance Scale-Revised Chicago Stoelting Co 1997
Tarullo L J West N Aikens and L Hulsey ―Beginning Head Start Children Families and Programs in Fall 2006 Washington DC US Department of Health and Human Services 2008
West J K Denton and L Reaney ―The Kindergarten Year NCES 2001-023 Washington DC National Center for Education Statistics 2001
West J LTarullo N Aikens S Sprachman CRoss and B Carlson ―FACES 2006 Study DesignWashington DC US Department of Health and Human Services 2007
West J L Tarullo N Aikens and L Hulsey ―Study Design and Data Tables for FACES 2006 Baseline Report Washington DC US Department of Health and Human Services 2008
Woodcock RW AF Muntildeoz-Sandoval K McGrew N Mather and F Schrank Bateria III Woodcock-Munoz Itasca IL Riverside Publishing 2004
Woodcock RW K McGrew and N Mather Woodcock-Johnson III Tests of Achievement Itasca IL Riverside Publishing 2001
Zill N A Sorongon K Kim C Clark and M Woolverton ―FACES 2003 Research Brief Childrenrsquos Outcomes and Program Quality in Head Start Washington DC US Department of Health and Human Services 2006
Zill N and J West ―Findings from the Condition of Education 2000 Entering Kindergarten Children NCES 2001-035
32
Washington DC National Center for Education Statistics 2001
NOTES
1 Migrant and Seasonal Worker programs (MSHS) American Indian and Alaska Native (AIAN) programs programs in Puerto Rico and other US territories and programs not directly providing services to 3- 4- and 5-year-olds (such as Early Head Start) were excluded from the frame The Office of Head Start provided information about any defunded (or soon-to-be defunded) programs before sampling and these programs were then deleted from the sample frame Thirteen programs affected by Hurricanes Katrina and Rita in August 2005 were unable to provide information for the 2004ndash2005 PIR data and thus were not eligible for sample selection
2 Children who were 3 years old and attending their first year of Head Start were sampled at a higher rate to ensure comparable sample sizes between 3-year-olds and 4-year-olds at the end of the kindergarten year given the longer follow-up time for this younger group
3 Children who were no longer enrolled in the program where they were sampled in fall 2006 and who were not enrolled in one of the other FACES 2006 programs were not included in the spring 2007 data collection
4 Parents who were not interviewed in person during the week-long visit were interviewed by phone either before or after site visits About 44 percent of the parent interviews were conducted in person
5 About 80 percent of the teacher rating forms were completed using the Web instrument
6 This total represents 88 percent of the children who were sampled and eligible for the fall 2006 baseline data collection
7 These are all weighted marginal response rates not accounting for prior stages of sampling and participation The cumulative weighted response rates which take into account the response rate for prior stages of the sample (such as program center and child response rates) as well as fall 2006 consent rates are by definition lower The cumulative child response rate through spring 2007 is 81 percent The corresponding response rates associated with completing the child assessments parent interviews and teacher
ratings in spring 2007 are 78 percent 79 percent and 78 percent respectively At the teacher level among participating classes the marginal weighted response rate for the teacher interview was 98 percent At the child level among children whose parents gave consent the rate for child assessments was 96 percent the rate for parent interviews was 96 percent and the rate for teacher-child reports was 95 percent
8 The cumulative teacher interview response rate is 92 percent
9 This represents 100 percent of the classrooms that were selected for observation The cumulative response rate for the observations which takes into account nonresponse at the program level was 92 percent Due to the smaller-than-expected classroom sizes encountered when selecting the FACES 2006 sample in the fall we selected more classrooms than anticipated and decided to subsample classrooms for observation When two of a teacherrsquos classes were in our sample we randomly subsampled either the morning or afternoon session for observation Analysis weights that include classroom observations were adjusted to account for the subsampling of classrooms The classroom observation sample included 350 of the 390 eligible classrooms (90 percent) To be eligible for observation the classroom must meet three criteria (1) it must be a classroom in a center-based program (home-based services were not observed) (2) it must be one of the originally sampled classrooms (classrooms that children moved to in the spring were not eligible) and (3) it must have at least two sampled eligible children whose parents gave consent
10 The screening process and cognitive assessment measures are described in the section of this brief that describes childrenrsquos cognitive outcomes
11 The preferred respondent for the spring interview was the childrsquos biological mother or the fall 2006 respondent Ninety-two percent of the spring interviews were completed by the same respondent who had been interviewed in the fall (and 89 percent were the childrsquos biological mother) For 3 percent of the children the first parent interview was completed in the spring 97 percent completed the first parent interview in the fall
33
12 See Hulsey et al 2010 for the statistics found in this report
13 Weights are used to compensate for the differential probabilities of selection at the sampling stage (for example 3-year-olds were sampled at a higher rate than 4-year-olds) and to adjust for the effects of nonresponse
14 Information on the characteristics of children and their families in fall 2006 can be found in Beginning Head Start Children Families and Programs in Fall 2006 (Tarullo et al 2008)
15 The percentages presented in this section apply only to children whose mothers andor fathers live with them
16 The federal poverty threshold for a family of four was $20000 in 2006
17 Includes both biological and adoptive parents
18 FACES uses the term dual language learners or DLLs to describe these children
19 Croninger and Lee 2001 Pallas Natriello and McDill 1989 Rathbun and West 2004 Zill and West 2001
20 Downey von Hippel and Broh 2004 Rathbun and West 2004 West Denton and Reaney 2001
21 These questions were not asked in the fall 22 These questions were not asked in the fall 23 See Hulsey et al 2010 for the mean spring
2007 scores for all children across measures regardless of language of assessment child performance or availability of valid scores in fall 2006
24 We are unable to provide information on changes in the skills of children who changed their language of assessment between the fall and spring as these children receive different assessment measures at each wave
25 All children regardless of home language or performance on the Pre-LAS received the English receptive vocabulary measure the PPVT-4 The TVIP is the Spanish language version of the PPVT-4 and was used with children whose primary home language was Spanish regardless of performance on the Pre-LAS Thus children whose parents spoke Spanish to them at home received the receptive
vocabulary component of the battery in English (PPVT-4) as well as in Spanish (TVIP)
26 The English assessment used the Woodcock-Johnson III subtests and the Spanish assessment used the Bateriacutea III Woodcock-Muntildeoz subtests
27 For the purposes of the direct assessment home language was based on information provided on parent consent forms
28 Some children were administered the cognitive assessments in Spanish (or not at all) in fall 2006 and then in English in spring 2007 Similarly some children were unable to achieve a basal on the PPVT-4 in the fall but were able to by the spring Data in this section reflect the performance of children assessed in English in both fall 2006 and spring 2007 In addition mean scores are only reported for those with valid scores at both occasions (for example those who established a basal on the PPVT-4 at both waves) See Hulsey et al 2010 for the mean scores for all children assessed in spring 2007 regardless of language of assessment child performance or availability of valid scores in the fall In this set of tables childrenrsquos mean spring 2007 scores are slightly lower (for example 1 to 2 standard score points lower) Variability in childrenrsquos scores is comparable for both sets of scores
29 Cross-cohort comparisons only include children in FACES 2003 and 2006 because in earlier cohorts 3-year-old children were not assessed in all areas In addition Woodcock-Johnson scores in FACES 2000 were drawn from the Woodcock-Johnson Psycho-Educational Battery-Revised edition (W-J R) Woodcock-Johnson scores in FACES 2003 were drawn from a hybrid version of the W-J R and the Woodcock-Johnson Psycho-Educational Battery-Third edition (W-J III) This allows for estimation of childrenrsquos scores based on either the norms for the W-J R or W-J III FACES 2006 used the W-J III
30 All analyses of the W-J III scores are based on original calculations using the FACES 2003 data
31 PPVT scores in FACES 2003 were drawn from the Peabody Picture Vocabulary Test-Third edition (PPVT-III) FACES 2006 used the PPVT4
32
-
Measures of criterion-referenced performance include raw and W- or IRT-based
34
scores W scores allow for measurement of change or growth in performance on the same scale over time Like raw scores W scores are an indicator of absolute rather than relative performance W scores are available for the WJ-III and PPVT-4 Story and Print Concepts scores are scaled to reflect the number of items answered correctly ECLS-B math items are also scaled to reflect the number of items answered correctly or the percentage of children demonstrating mastery of skills or skill sets
33 This score is a proficiency probability score and indicates the probability that a child would have passed the proficiency level It can be interpreted as the percentage of the population who have mastered this skill or skill set (for example 30 x 100 = 30 percent of Head Start children are able to demonstrate these skills at the start of the program year) These scores can take on any value from zero to one
34 The ECLS-B preschool wave was intended to assess children in the fall when most children would be about 48 through 57 months of age However the age at time of testing in the ECLS-B preschool wave ranged from approximately 3 years 8 months to 5 years 5 months (Chernoff et al 2007) On average the FACES children in the fall 2006 round were assessed earlier in the program year than the ECLS-B sample and their ages ranged from approximately 2 years 7 months to 5 years 8 months Conversely FACES children in the spring 2007 round were assessed later with ages ranging from 3 years 3 months to 6 years 3 months
35 Number of family risks is based on three family characteristics whether the child resides in a single parent household whether the household income is below the poverty threshold and whether the mother has less than a high school diploma
36 See Hulsey et al 2010 for tables that provide comparative scores for children assessed in English at both waves Spanish at both waves and who moved from fall to spring from a Spanish assessment to an English assessment
37 Although scores on the W-M III subtests were scaled to be comparable with the W-J III early items on the Letter-Word Identification subtests suggest differences in the demands required of children Specifically children who are administered the W-M III are required to provide verbal responses earlier in the
assessment than those administered the W-J III suggesting less ―warm up time and greater demands of these children
38 Similar declines in hyperactive behavior were not found in FACES 2003
39 Reported problem behavior and hyperactive scores in FACES 2006 were constructed using different items from those reported in prior cohorts
40 Significant fall-spring declines were found in teacher-rated withdrawn behavior in FACES 2003
41 Body Mass Index (BMI) is the ratio of an individualrsquos weight to height and can be used as an indicator of overweight and obese status Calculation of BMI is specific to gender and age
42 The Centers for Disease Control and Prevention (CDC) sets the criterion of overweight as being when the childrsquos BMI score is from the 85th to 94th percentile for their age and gender and of obese as being when the childrsquos BMI is at or above the 95th percentile In previous FACES reports the two categories have been labeled as at risk of overweight and overweight respectively
43 Classrooms observations were completed by trained observers Observers were trained and certified after meeting reliability standards showing proficiency to administer each instrument Reliability was defined as being within 1 point of the gold standard on the scale or dimension score at least 80 percent of the time Observers not meeting 80 percent reliability were given a provisional pass and the opportunity to test their reliability in the field with a gold standard group leader Thirty-six of the 37 interviewergold standard pairs were in agreement at least 80 percent of the time on the ECERS-R and 89 percent of the interviewergold standard scores were within one point of each other on the on the CLASS To minimize observer drift up to two quality assurance visits (that is paired observations) were conducted during the field period If there was a discrepancy between observer and gold standard we used the gold standard score
44 Concept Development refers to teachersrsquo use of instructional discussions and activities to promote higher-order thinking in contrast to rote instruction Quality of Feedback refers to the degree to which the teacher provides feedback that expands learning and understanding and encourages participation Language Modeling
35
refers to the quality and amount of teachersrsquo use of language-stimulating and language-facilitation techniques
45 ECERS-R subscale scores reported in this section reflect the specification of subscales that have been reported in earlier cohorts of FACES In some instances these specifications do not match those of the publishers
46 Although an alternative specification for classroom quality these scores allow us to compare with other recent studies of classroom quality that have reported scores for the short form of the ECERS-R (for example the National Center for Early Development and Learning [NCEDL] Study of Prekindergarten)
47 Reported scores for FACES 2000 and 2003 are unweighted while those for FACES 2006 are weighted All analyses are based on original calculations using the FACES 2000 2003 and 2006 data
48 Although the CLASS Instructional Support domain was piloted in FACES 2003 it was used as part of the observation protocol for the first time in FACES 2006 The measure was added to provide information on the quality of the instructional environment Comparative data with earlier cohorts is not available
49 In spring 2008 the classroom observation protocol was changed in order to study the feasibility of training certification field administration and quality assurance procedures on the full CLASS in a large sample of programs All three domains from the CLASS were assessed while the ECERS-R and Arnett were not used A sample of 147 classes attended by FACES 2006 children (4-year-olds attending a second year of Head Start) was observed The spring observation sample was not designed to support national estimates of Head Start classrooms Instead the goal was to learn as much as possible about what is required to prepare for and conduct the full CLASS in Head Start classrooms Preliminary analyses of these data suggest higher average scores on the CLASS Instructional Support domain when used with the full scale in spring 2008 as compared to when used in isolation in spring 2007
50 Correlation coefficients (b) and effect sizes (ES) are presented for significant findings The effect size reported in this section shows the standardized mean difference in the dependent variable between two groups for a binary
independent variable or the standardized association between a continuous independent variable and the dependent variable (that is one standard deviation change in the independent variable is related to some percentage of a standard deviation change in the dependent variable)
51 The analyses are weighted at the child classroom and program levels in the HLM models The child-level data are weighted to represent all children entering Head Start for the first time in fall 2006 and who were still enrolled in the program in spring 2007 The classroom-level data are weighted to represent all classrooms that were serving these children in spring 2007 The program-level data are weighted to represent all programs that were providing direct services to these children in spring 2007 excluding MSHS programs AIAN programs and other exclusions listed in note 1
52 Children whose teachers had a BA were not significantly different in progress than those whose teachers had high school or less education
36
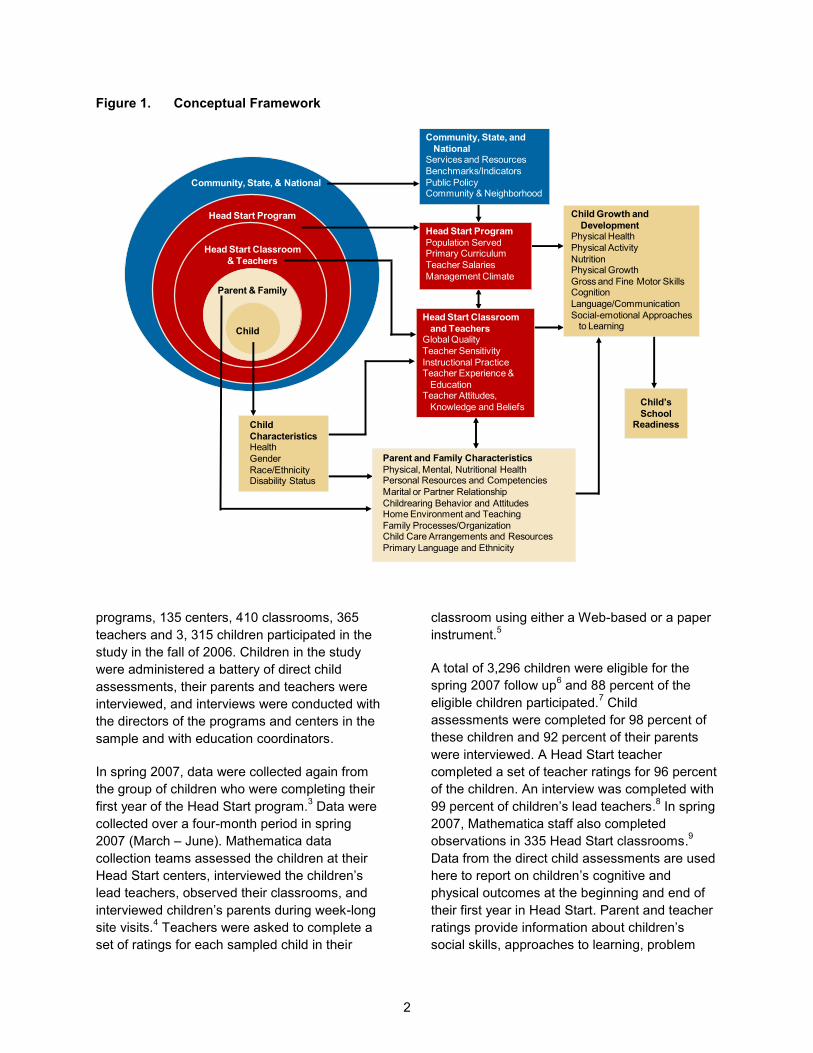
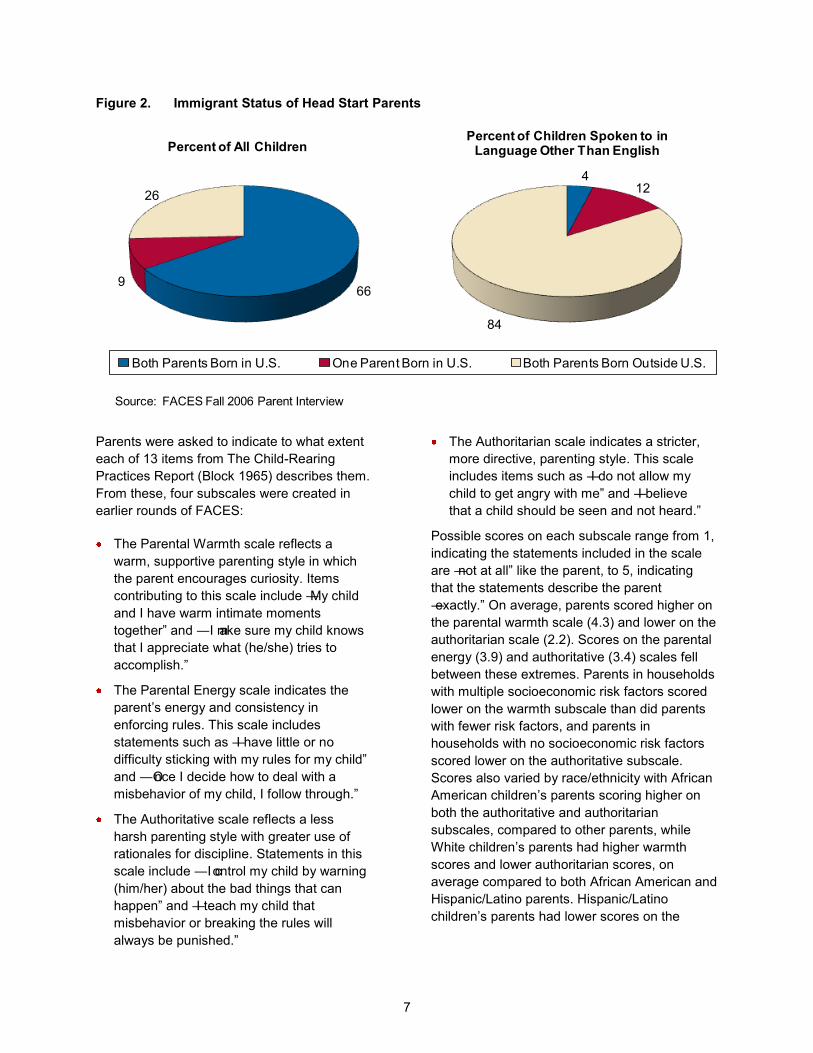
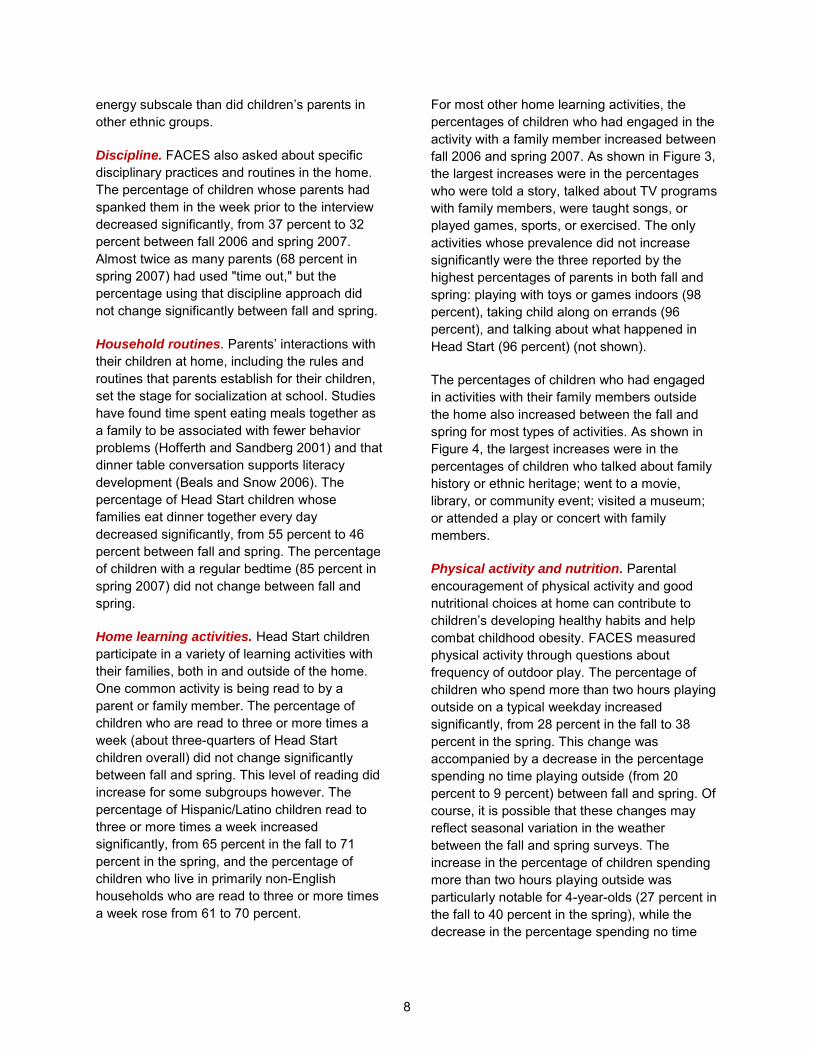
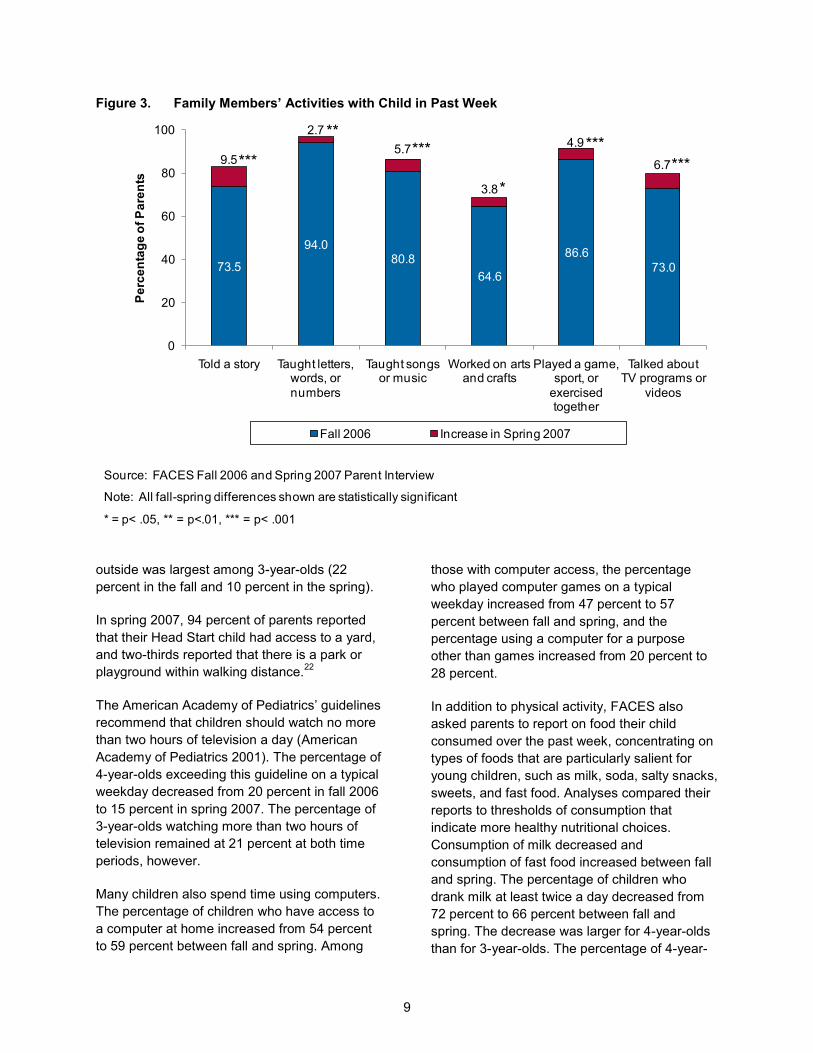
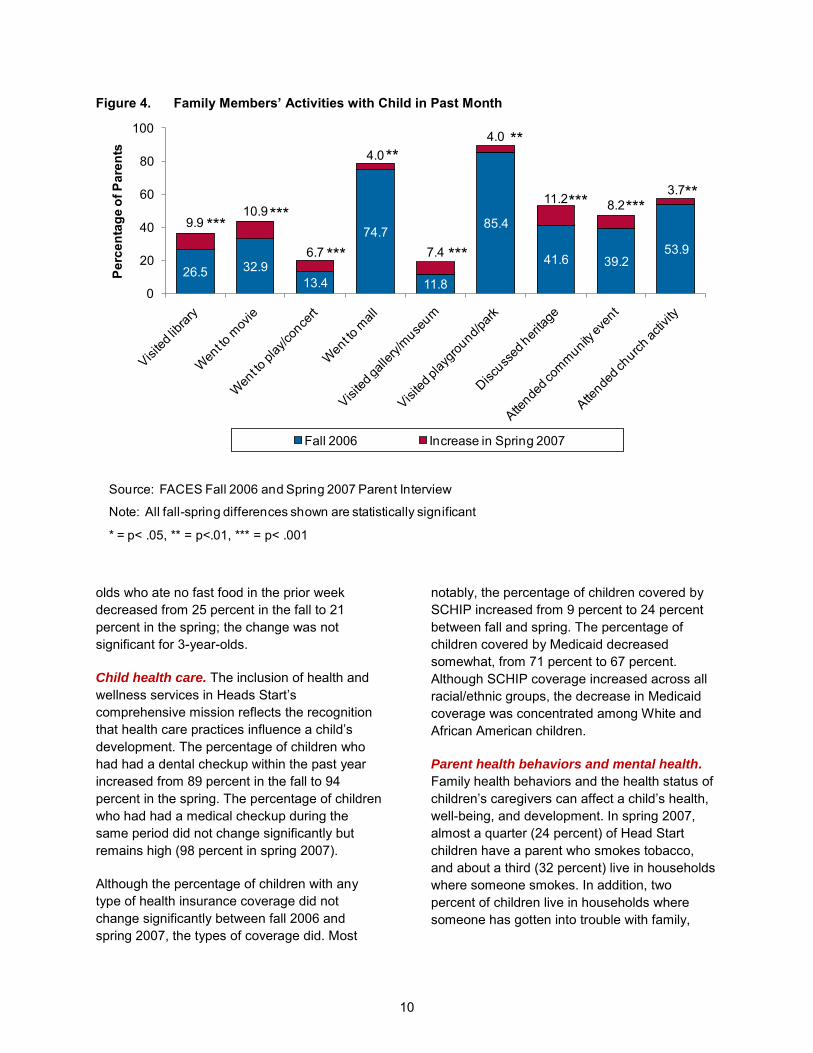
13
844 824 857 832765
843
641 591
0
20
40
60
80
100Pe
rcen
tage
Ver
y Sa
tisfie
d
Source FACES Spring 2007 Parent Interview
Figure 6 Parent Satisfaction with Head Start
Figure 7 Positive Experiences with Head Start
866
554
841 834887
833790
869 894
0
20
40
60
80
100
Child feels safe
Lots of individual attention
Child happy
Teacher warm
Child respected
Discipline handled
easily
Teacher open to
new info
Teacher supports parent
Parent feels
welcomed
Perc
enta
ge R
epor
ting
Alw
ays
Expe
rienc
e
Source FACES Spring 2007 Parent Interview
453
682639
699
598
742
0
20
40
60
80
100
Watch child briefly
Take child to doctor
Help if child sick Talk to about Head Start
Loan emergency
cash
Give advice
Source FACES Spring 2007 Parent Interview
Perc
enta
ge R
epor
ting
Alw
ays
Hav
e Su
ppor
t to
Figure 8 Social Support Parents Receive
among those in care) did not change significantly between the fall and spring however The average child spends about 30 hours per week in the care of someone other than his or her parents including Head Start
The changes in child care usage between the fall and spring differed depending on the type of primary care arrangement parents used for their children The largest increase was in the percentage in relative care which increased from 23 to 27 percent from fall to spring The percentage of children receiving care in a nonrelativersquos home decreased from 5 to 3 percent The changes in the primary types of care were particularly notable for 3-year-olds
-
HispanicLatino children remain less likely to be in child care than children of other racialethnic backgrounds but their participation patterns changed the most The percentage of HispanicLatino children in any type of child care before or after Head Start increased from 29 percent to 34 percent between fall and spring The primary care arrangement used by parents of HispanicLatino children also changed over
the program year A larger percentage of HispanicLatino children were in relative care and center-based care in the spring than in the fall while the percentage in non-relative home care decreased
CHILD OUTCOMES
In this section we describe the cognitive social-emotional and health and physical development of children who were newly entering the Head Start program in fall 2006 and were still enrolled in spring 200723 In the area of childrenrsquos cognitive development we first describe the skills of children who were assessed in English in the fall and spring followed by those of children assessed in Spanish at both waves24
Throughout this section we first describe the outcomes for all children and then provide descriptive information by important subgroups including age gender raceethnicity and family risk status
Child Cognitive Development
Instruments used To assess childrenrsquos skills and knowledge norm- and criterion-referenced
14
measures of language writing and math development were directly administered to the children To measure childrenrsquos receptive vocabulary in English and Spanish the battery included the Peabody Picture Vocabulary Test Fourth Edition (PPVT-4) (Dunn and Dunn 2006) and the Test de Vocabulario Imagenes Peabody
25 (TVIP) (Dunn Lugo Padilla and Dunn 1986) The battery measured childrenrsquos letter-word knowledge and skills in applied problems and writing using the Letter-Word Identification Applied Problems and DictationSpelling subtests from the Woodcock-Johnson Psycho-Educational Battery Third Edition (Woodcock McGrew and Mather 2001) and the Bateriacutea III
26 Woodcock-Muntildeoz (Woodcock et al 2004) To assess math skills it included a supplemental set of math items from the Early Childhood Longitudinal Study Birth Cohort math assessment Items were also included to tap childrenrsquos story and print concepts Parents and teachers also reported on childrenrsquos acquisition of skills and knowledge in the areas of language writing and math
Language screening In the fall the direct child assessment began with a screening to determine whether children who primarily spoke a language other than English at home should be assessed in English assessed in Spanish or not assessed at all Two subtests from the Pre-LAS 2000 Simon Says and Art Show were used as screening tools Children whose home language27 was English were administered the cognitive assessment battery in English regardless of their scores on the language screener If a child made five consecutive errors on both the Simon Says and the Art Show and primarily spoke Spanish at home he or she was administered the PPVT-4 and then routed to the Spanish-language cognitive assessment A child who made five consecutive errors on both the Simon Says and the Art Show and did not primarily speak English or Spanish was administered only the PPVT-4 and was then routed out of the cognitive assessment and was just weighed and measured Children who passed the screener and whose primary home
language was not English received the cognitive assessment battery in English In the spring an adapted version of the screening procedure was used All children were administered the Simon Says task of the Pre-LAS 2000 Following this task those who primarily spoke English at home and those who had passed the language screener in the fall were routed to the English version of the assessment All other children were administered both Simon Says and Art Show and as in the fall performance on both tasks was used to determine whether these children should be assessed in English assessed in Spanish or administered only the PPVT-4 and weighed and measured
Children assessed in English28 Children
score below national norms on most measures of language literacy and math development in both the fall and spring of their first year of Head Start (see Table 1) However children make statistically significant progress towards norms during the year in the areas of English receptive vocabulary (+22 standard score points) letter-word knowledge (+56 standard score points) and applied problems (+19 standard score points) In fact childrenrsquos gains in the area of letter-word knowledge during this period place their scores at the national average by the spring Standard scores have a mean of 100 and a standard deviation of 15 These scores allow for comparisons of an individuals performance to others of the same age (or grade) Thus relative to same-age peers childrenrsquos letter-word knowledge increased by more than one-third of a standard deviation However in all other areas children remain below norms at the end of the program year
Cross-cohort comparisons show that gains across areas during the first Head Start year are similar across the FACES 2003 and 2006 cohorts29 Children made significant progress towards norms in early literacy skills in FACES 200330 (+49 points) and in FACES 2006 (+56 points) In fact in FACES 2006 by the end of the first program year children have strong letter-word skills Across subgroups most children are near if not at or above the national
15
Table 1 Mean Standard Scores for FACES Child Assessment Measures for Children Taking the Assessment in English at Both Waves Fall 2006 Spring 2007 Fall-Spring Change
Fall-Spring Change Mean
Fall 2006 Mean
Spring 2007 Mean Scales (standard scores) Number of cases
PPVT-4 2266 853 875 22 TVIPa 212 866 837 -29 WJ3 Letter Word Identification 2101 944 1000 56 WJ3 Spelling 2223 951 964 13 WJ3 Applied Problems 2018 897 916 19
plt05 plt01 plt001 a These scores are for children primarily spoken to in Spanish at home who passed the language screener threshold and took the remainder of the assessment in English at both waves
Note Lower Nrsquos for standardized score data on the WJ Applied Problems measure is the result of fewer cases having valid scores on these assessments at both waves
mean (see Figure 9) Head Start has emphasized the importance of early literacy skills such as letter knowledge in recent years Gains towards norms in childrenrsquos vocabulary
31 skills and applied problems were also similar across the two cohorts The gap between Head Start childrenrsquos scores and national norms in early writing did not narrow significantly in FACES 2003 or FACES 2006
On criterion-referenced measures without norms 32 children make progress across developmental areas For example children score on average in the low range on the Story and Print Concepts task in both the fall (37 out of 14) and spring (49 out of 14) but they can answer about one more question correctly in this area by the end of the program year regardless of age gender raceethnicity and number of family risks Both teachers and parents report that children demonstrate one to two more writing language or math skills by the end of the program year regardless of subgroup
On the ECLS-B math items children also make progress during the program year and can correctly answer more items For example while fewer than 30 percent of children in Head Start are able to demonstrate number and shape skills33 at the start of the program year by the spring about half are able to For comparison in the ECLS-B national sample 63 percent of preschool children demonstrated these skills34
Diversity in skills Although children on average score below norms in the fall and spring children demonstrate considerable diversity in their skills For example children in the bottom quartile score on average at least one standard deviation below national norms in many areas in both the fall and spring while children in the top quartile score at or above the national average across areas In the area of receptive vocabulary children in the bottom quartile score more than two standard deviations below norms in the fall (650) and more than one standard deviation below norms in the spring (745) while those in the top quartile score at the national average in the fall (1035) and spring (1004) Across areas children who begin with fewer skills relative to peers make more gains than those who begin with greater skills However these children still have below average skills at the end of the program year
Age Both 3- and 4-year-old children make significant progress towards norms in receptive vocabulary (+10 points versus +41 points respectively) and letter-word knowledge (+67 points versus +39 points respectively) Only 4-year-olds make significant progress towards norms in early writing (+58 points) and applied problems (+38 points) Thus 4-year-olds assessed in English make more progress relative to peers than 3-year-olds across areas except letter-word knowledge where 3-year-olds
16
Figure 9 Childrenrsquos Mean WJ III Letter-Word Scores Comparing Subgroups Assessed in English Spring 2007
97
101
103
101
97
103
99
98
102
97
103
100
85 90 95 100 105
2 to 3 Risks
1 Risk
0 Risk
Other Race
HispanicLatino
Black
White
Boys
Girls
4-year-olds
3-year-olds
Overall
Source FACES Spring 2007 Direct Child Assessment
Note All fall-spring differences shown are statistically significant
= plt05 =plt01 = plt001
Source FACES Spring 2007 Direct Child Assessment
Note Within each category (age gender raceethnicity risk) asterisks indicate subgroups that are significantly different from other subgroups in the category
=plt05 =plt01 =plt 001
make more progress towards norms Notably 3-year-olds who took the assessment in English generally perform closer to their same-age peers nationally than 4-year-olds across measures
On criterion-referenced measures without norms both 3- and 4-year-old children make progress across developmental areas On the ECLS-B math items both 3- and 4-year-old children make progress during the program year and can correctly answer more items For example while less than 20 percent of 3-year-olds are able to demonstrate number and shape skills at the start of the program year by the spring about 40 percent are able to The percentage increases from 41 percent to 67 percent among 4-year-olds Across areas 4-year-olds demonstrate more advanced skills in absolute terms
Gender With the exception of letter-word knowledge and early writing skills girls assessed in English score below national norms across measures of language and math development in both the fall and spring of their first year of Head Start However in the areas of English receptive vocabulary letter-word knowledge early writing and applied problems girls make progress toward these norms during the program year In fact girls assessed in English gain 6 standard score points in the area of letter-word knowledge during this period and score above the national average in this area by the spring (1020 Figure 9) They also score at the national mean in early writing by the spring (994) In contrast boys make progress towards norms in the areas of English receptive vocabulary (+24 points) and letter-word knowledge (+50 points) only Unlike girls they score below norms across measures at both the beginning and end of the year
17
On criterion-referenced measures without norms both boys and girls make progress across developmental areas On the ECLS-B math items both girls and boys can correctly answer more items by the spring For example while less than 30 percent of girls are able to demonstrate number and shape skills at the start of the program year by the spring 51 percent are able to The percentage increases from 24 percent to 46 percent among boys
Raceethnicity With the exception of letter-word knowledge children from all racialethnic backgrounds score below national norms across measures of language literacy and math development in both the fall and spring of their first year of Head Start All children make progress toward norms in the areas of English receptive vocabulary and letter-word knowledge during the year regardless of raceethnicity In fact children from all racialethnic groups score at or near norms in letter word knowledge by the end of the program year (see Figure 9) with African American children making the greatest gains (+74 points) and scoring above norms by spring (1025) Only White and African American children make progress towards norms in applied problems during the program year
On criterion-referenced measures without norms children from all racialethnic backgrounds make progress across developmental areas On the ECLS-B math items all children can correctly answer more items For example while 35 percent of White children are able to demonstrate number and shape skills at the start of the program year by the spring 59 percent are able to The percentage increases from 21 percent to 41 percent among African American children from 23 percent to 48 percent among HispanicLatino children and from 30 percent to 52 percent among Other race children
35 Family risk With the exception of letter-word knowledge regardless of number of family risks children score below national norms across measures of language literacy and math development in both the fall and spring of their first year of Head Start In fact children with no
(+ 44 points) 1 (+ 60 points) and 2 or more risks (+58 points) make statistically significant progress towards norms in the area of letter-word knowledge However by the end of the program year children with no (1029) and 1 family risk (1012) score above norms in this area Children with 2 or more family risks remain below norms in letter-word knowledge in the spring (974) Regardless of number of family risks children also make progress toward norms during the year in the area of English receptive vocabulary During the program year children with no 1 and 2 or more family risks gain 21 26 and 26 standard score points respectively However all groups remain below norms at the end of the program year in this area Only children with 1 family risk make progress towards norms in early writing (+30 points) during the program year Only children with no family risks make progress towards norms in the area of applied problems during the year (+4 points)
On criterion-referenced measures without norms children from all backgrounds make progress across developmental areas On the ECLS-B math items all children can correctly answer more items by the spring While 29 percent of children with no family risks are able to demonstrate number and shape skills at the start of the program year by the spring about 53 percent are able to The percentage increases from 28 percent to 50 percent among children with 1 risk and from 23 percent to 44 percent among children with 2 or more risks
36 Children assessed in Spanish Children who take the assessment in Spanish at the beginning and end of their first Head Start year score below norms across measures of language literacy and math development in both the fall and spring (Table 2) Mean scores are only reported for those with valid scores at both occasions (for example those who established a basal on the PPVT-4 at both waves) Across measures the scores for these children are lower than those who passed the screener and are assessed in English at both waves as well as those who changed assessment language from Spanish in the fall to English in the spring
18
Table 2 Mean Standard Scores for FACES Child Assessment Measures for Children Taking the Assessment in Spanish at Both Waves Fall 2006 Spring 2007 Fall-Spring Change
Fall-Spring Change Mean
Fall 2006 Mean
Spring 2007 Mean Scales (standard scores) Number of cases
PPVT-4 25 616 633 17 TVIP a 132 848 815 -33 WM3 Letter Word Identification 49 765 867 102 WM3 Spelling 131 882 883 01 WM3 Applied Problems 95 825 828 03
plt05 plt01 plt001
Note Lower Nrsquos for standardized score data on the WM Letter Word Identification and PPVT-4 measures are the result of fewer cases having valid scores on these assessments at both waves
a These scores are for children who did not pass the language screener threshold and took the remainder of the assessment in Spanish at both waves
Children assessed in Spanish at both time points make statistically significant progress toward norms only in the area of letter-word knowledge during the year In fact children gain more than 10 standard score points in this area during the year or about two-thirds of a standard deviation However despite these gains and unlike children assessed in English these children still score below norms in letter-
37 word knowledge in the spring Thus it is important to recognize the diversity in childrenrsquos skills in English and their home language and to consider the contextual factors in both home and program settings that may contribute to childrenrsquos learning
Child Social-Emotional Development
FACES 2006 provides multiple perspectives on childrenrsquos positive and challenging behaviors that may affect their ability to learn and interact with peers and adults Teachers reported on childrenrsquos social skills such as making friends easily and waiting hisher turn in games or other activities as well as their problem behaviors in the classroom such as being very restless and unable to sit still or disrupting ongoing activities They also assessed childrenrsquos approaches to learning such as their attitudes toward learning new things motivation to perform well and attentionpersistence on learning activities The approaches to learning measure was the
Preschool Learning Behaviors Scale (PLBS McDermott et al 2000 McDermott et al 2002)
Parents also reported on childrenrsquos social skills and problem behaviors in the home environment Finally using the Leiter-Revised Examiner Rating Scale (Roid and Miller 1997) assessors rated childrenrsquos behaviors during the assessment situation in such areas as attention organization and impulse control activity level and sociability Assessor ratings are the only social-emotional rating data that can be compared with normative data
Both teachers and parents report that children show growth in their social skills during their first Head Start year Consistent with prior FACES cohorts (Zill et al 2006) teachers report that children demonstrate statistically significant gains in social skills and cooperative classroom behavior by the end of the program year They also rate children as having fewer problem behaviors by the spring (see Figure 10) as well as more attention and persistence with tasks
38 (not shown) As in FACES 1997 and 2000 teachers rate children as showing statistically
39 significant declines in hyperactive behaviors by the spring They do not report changes in childrenrsquos aggressive and withdrawn behaviors over the course of the program year This is similar to patterns found in FACES 1997 and
402000
19
156 173
2
4
6
8
10
12
14
16
18
20
69 65
31 28
0 Social Skills Problem Behaviors Hyperactive Behavior
(range = 0 to 24) (range = 0 to 36) (range = 0 to 12)
Fall 2006 Spring 2007
Figure 10 Childrenrsquos Teacher-Reported Social-Emotional Development Scores Fall-Spring Change
Source FACES Fall 2006 and Spring 2007 Teacher Child Report
Note All fall-spring differences shown are statistically significant
= plt05 =plt01 = plt001
Parents report that children demonstrate more social skills and positive approaches to learning and fewer problem behaviors on average in the spring Assessors do not report any statistically significant changes in childrenrsquos behavior during the assessment situation including the childrsquos attention organization and impulse control activity level and sociability
Age Teachers and parents report few differences by age in changes in social-emotional development over the program year They report that both 3- and 4-year-old children demonstrate more social skills cooperative classroom behaviors and positive approaches to learning on average by the end of the program year However although parents report that both groups demonstrate declines in problem behaviors teachers only report that 3-year-old children demonstrate declines in
problem behaviors and gains in attention and persistence with tasks by the spring Teachers report that both age cohorts demonstrate declines in hyperactive behaviors during the program year
Gender Teachers and parents do not report differences in gains or declines in social-emotional development by gender
Raceethnicity Teachers report that all children regardless of raceethnicity demonstrate more social skills on average by the end of the program year However they report differences in changes in other areas of childrenrsquos social-emotional development by raceethnicity For example they report that only HispanicLatino children have significantly fewer problem behaviors overall fewer aggressive behaviors more positive approaches to learning
20
and more positive attitudes toward learning in the spring They also report that both African American and HispanicLatino children demonstrate significantly fewer hyperactive behaviors and greater attention and persistence with tasks in the spring
Family risk Regardless of number of family risks teachers report that children demonstrate more social skills and fewer problem behaviors on average by the end of the program year They also report that children demonstrate fewer hyperactive behaviors in the spring Teachers report that only children with one risk or two or more risks have greater attention and persistence with tasks by spring
Parents report that children with no and 2 or more risks demonstrate more social skills and positive approaches to learning on average in the spring For all risk groups they report fewer problem behaviors by the end of the program year
Subgroup differences in problem behaviors
Looking only at levels of problem behaviors in the spring teachers report marked differences across subgroups in childrenrsquos problem behaviors by the spring For example there are expected developmental differences with 4-year-olds displaying fewer problem behaviors than 3-year-olds (mean = 54 versus 71) Teachers also report that girls have fewer problem behaviors than boys (mean = 52 versus 77) and that HispanicLatino children (mean = 54) have fewer problem behaviors than children from other racialethnic backgrounds including White (mean = 73) African American (mean = 68) and Other race (mean = 73) children Finally they report that children with two or more family risks (mean = 68) have more problem behaviors than children with one (mean = 60) or no family risks (mean = 58)
Child Health and Physical Development
As in the fall approximately three-quarters of children are rated as having ―excellent or ―very good health by their parents in the spring (see Figure 11) Only a small percentage of children
are reported as having ―fair or ―poor general health at the end of the program year This finding is consistent with prior FACES cohorts Parents report differences in general health status by gender raceethnicity and family risk More parents of girls (81 percent) report that their child is in excellent or very good health than do parents of boys (75 percent) Similarly more parents of White children (86 percent) report their child is in excellent or very good health than do parents of African American (80 percent) HispanicHispanicLatino (70 percent) and Other race children (81 percent) Fewer parents of children with no family risks report their child to be in fair or poor health than do parents of children with one or more risks
Approximately 15 percent of children are reported by their teacher as having a disability in the spring Among Head Start children identified by teachers as having a disability speech and language impairments (79 percent) and cognitive impairments (22 percent) are the most common disabilities About a quarter of those identified as having a disability are reported by teachers to have more than one impairment About two-thirds of Head Start children with an identified disability have an Individual Education Plan (IEP) or Individualized Family Service Plan (IFSP) in the spring
Head Start children have an average Body Mass Index (BMI) 41 that is above average for their age range In fact about 19 percent of children are overweight and 17 percent are obese42 A similar percentage (18 percent) of preschoolers in the Early Childhood Longitudinal Study-Birth Cohort (ECLS-B) was obese (Anderson and Whitaker 2009) HispanicLatino children (20 percent) are more likely to be obese than White (15 percent) and African American children (15 percent)
HEAD START TEACHERS AND CLASSROOMS
The FACES conceptual framework envisions a relationship between the provision of quality early care and educational services and childrenrsquos developmental outcomes
21
Figure 11 Child Health Status Spring 2007
77
17
6
Excellent or Very GoodFairPoor
Source FACES Spring 2007 Parent Interview
Accordingly FACES collected information on the characteristics credentials beliefs and reported classroom activities of lead teachers in the classrooms where sample children were enrolled in spring 2007 Statistics are weighted to represent all teachers serving children who entered Head Start for the first time in fall 2006 and who were still enrolled in their classrooms in spring 2007
Teacher Characteristics
Most Head Start teachers are female (98 percent) and more than half are between the ages of 30 and 49 The percentage of teachers who identify themselves as HispanicLatino has increased over time In spring 2007 20 percent of teachers were HispanicLatino compared with 16 percent in FACES 2000 and 17 percent in FACES 2003 (ACF 2008) More than 80 percent of Head Start teachers have an Associatersquos (AA) or Bachelorrsquos (BA) degree (see Figure 12) Compared to FACES 2000 and 2003 a larger percentage of teachers have an AA or higher (82 percent versus 57 and 72 percent respectively) This is consistent with Head Startrsquos mandate to increase the educational levels of its teachers to an AA or higher The percentage of teachers with a BA or higher in spring 2007 (41 percent) is similar to the percentage in FACES 2000 (40 percent) and 2003 (38 percent) In addition to these degrees
many teachers have specific training in child development and teaching more than half of Head Start teachers report having a Child Development Associate (CDA) certificate and about a third have a state-awarded certificate teaching certificate or license or are currently enrolled in teacher training The average Head Start teacher has been in the classroom for nearly 9 years and the average annual salary is just below $23000
Head Start teachers are generally positive about their profession FACES measured teacher beliefs and attitudes towards developmentally appropriate practice (Burts et al 1990) yielding higher scores on child-initiated practice (45 out of 5) than on didactic strictly teacher-initiated practice (25 out of 5) Teachers scoring higher on developmentally appropriate practice are likely to endorse such items as ―Head Start classroom activities should be responsive to individual differences in development and to disagree with such items as ―Children should work silently and alone on seatwork In addition on a measure of management climate (Lambert et al 1999 Lambert 2002) teachers rate their programs relatively positively (on average 36 on a 5-point scale) The scale asks teachers to rate the strength of their agreement with statements about the program such as ―Provides enough assistance to teachers in the
22
Figure 12 Associatersquos Degrees Show Increase Over Time While Bachelorrsquos Degree Percent is Stable
57
72
82
40 3841
0
10
20
30
40
50
60
70
80
90
2000 2003 2006
Perc
enta
ge o
f Tea
cher
s
AA or higherBA or higher
Source FACES Fall 2006 Teacher Interview (and published data)
classroom and ―Promotes teamwork among teachers Further teachers report high levels of satisfaction with their current positions Eighty-eight percent of lead teachers agree or strongly agree with the statement ―I really enjoy my present teaching job while 94 percent agree or strongly agree that ―I am certain I am making a difference in the lives of the children I teach
The average teacher satisfaction score is 45 out of 5 points
FACES measured teachersrsquo mental health status because of its potential effects on their interactions with children in their classrooms As shown in Figure 13 most Head Start teachers do not report elevated symptoms of depression in spring 2007 However six percent of teachers report symptoms of severe depression and nearly ten percent report symptoms of moderate depression In all slightly more than one-third of teachers report some depressive symptoms
Classroom Educational Environment
As a measure of the spring classroom environment FACES asked teachers to report on the types and frequency of learning activities in early literacy and mathematics in their classrooms Overall the majority of reading and language activities are reported to occur daily or almost daily The most common activities reported by at least 80 percent of teachers as occurring daily or almost daily are letter naming writing letters discussing new words listening to the teacher read stories where children can see the print learning about conventions of printed materials and writing their own names Less frequent activities include listening to the teacher read books without seeing the print learning about rhymes retelling stories and learning about prepositions Similarly teachers report frequent math-related activities in their classrooms (see Figure 14) At least 80 percent of teachers report daily or almost daily counting aloud using a calendar
23
Figure 13 One-Third of Head Start Teachers Report Some Depressive Symptoms
63
21
106
Not depressed Mildly depressedModerately depressed Severely depressed
Source FACES Spring 2007 Teacher Interview
and engaging with geometric and counting manipulatives A smaller percentage of teachers report having children frequently play math-related games using creative movement or drama to understand math telling time or working with measuring instruments The most frequent activities were the same as those reported in the fall
Close to two-thirds of Head Start teachers report their primary curriculum is Creative Curriculum whether they use only one or a combination of curricula Next most frequently used is the HighScope Curriculum (16 percent of teachers) with the remaining teachers using other curricula The assessment tools that teachers report using follow the same pattern although only 39 percent of teachers use the Creative Curriculum assessment tool and 9 percent use the HighScope Child Observation Record (COR) The Desired Results Developmental Profile (DRDP) is used by another 9 percent of teachers and the remaining nearly 43 percent use a variety of other tools Using curriculum and assessment tools that are aligned with each other and with program standards is considered advantageous to supporting childrenrsquos learning
(National Research Council 2008) Out of the Head Start teachers who report using Creative Curriculum about 60 percent use the Creative Curriculum assessment tool and about 40 percent use a different tool About 40 percent of teachers overall use both the Creative Curriculum and its assessment tool less than 2 percent of teachers use both the HighScope curriculum and the COR
Classroom Observations
To measure overall classroom quality in FACES 2006 FACES used the Instructional Support domain of the Classroom Assessment Scoring System (CLASS Pianta LaParo and Hamre 2008) in conjunction with the full Early Childhood Environment Rating Scale-Revised (ECERS-R Harms Clifford and Cryer 1998) in spring 2007 Classroom observations also included the Arnett Caregiver Interaction Scale (Arnett 1989) as well as observer counts of child-adult ratios and group sizes Observations were done in a representative sample of 350 classrooms attended by 3- and 4-year-old children in their first year of Head Start Observations lasted for 4 hours on average and were typically completed in the mornings43
24
Figure 14 Teachers Report Frequent Math Activities 98
86 84 82
66
56 54 52
0
10
20
30
40
50
60
70
80
90
100Pe
rcen
tage
of T
each
ers Count aloud
CalendarGeometric shapesCounting objectsMath gamesMovementTelling timeRuler
Percent DailyAlmost Daily
Source FACES Spring 2007 Teacher Interview
The ECERS-R is a global rating of classroom quality based on structural features of the classroom (Harms et al 1998) It has been used historically in FACES ( starting with the earlier version of the ECERS [Harms and Clifford 1980] in the 1997 cohort) and in many other large-scale studies The CLASS measures classroom quality in terms of both instructional and social-emotional aspects of the environment across three domains of interaction Emotional Support Classroom Organization and Instructional Support Instructional Support the domain used in FACES 2006 measures the quality of instructional practices used in the classroom on three dimensions (Concept Development
44 Quality of Feedback and Language Modeling) Both the CLASS and the ECERS-R items are scored from 1 to 7 with higher scores reflecting better quality care The Arnett assesses the quality and content of the teacherrsquos interactions with children The scale measures the emotional tone discipline style and responsiveness of the caregiver in the classroom Total scores range from 0 to 90 with higher scores reflecting greater
caregiver sensitivity and responsiveness and less detachment and punitiveness Together these measures provide information on the educational environment and quality of Head Start classrooms
The National Association for the Education of Young Children (NAEYC) offers professional standards for appropriate child-teacher ratios (9 children per adult in classrooms with 3-year-olds and 10 children per adult in classrooms with 4-year-olds) and group sizes (18 or fewer children in classes with 3-year-olds and 20 or fewer children in classes with 4-year-olds) Head Start Program Performance Standards provide similar guidelines (85 children per adult in classrooms with 3-year-olds and 10 children per adult in classrooms with 4-year-olds and a maximum group size of 17 or 20 respectively see NCCIC 2008) In spring 2007 the average Head Start classroom had 62 children to each adult and the average group size was 145 falling well within professional guidelines and Head Start Program Performance Standards Half of
25
classrooms (50 percent) had observed group sizes of fewer than 15 children and the majority (93 percent) had ratios of 9 to 1 or lower
Average classroom quality in Head Start was within acceptable levels The average ECERS-R total score was 358 and the majority of classrooms fell in the minimal to good range (82 percent see Figure 15)45 Compared with other studies of child care and prekindergarten programs the range of observed quality in Head Start is narrow Few classrooms (13 percent) scored below 3 (considered the threshold for minimal quality) and none scored above a 6 (considered excellent quality) Average total scores were lower than those found in earlier FACES cohorts continuing a decline in scores observed over time (51 in spring 1998 [ACF 2001] 491 in 2001 [ACF 2006] and 423 in spring 2004 [ACF 2008])
Researchers in other large scale studies have derived alternative dimensions of quality using the ECERS-R Two factors reported in the Multi-State Study of Prekindergarten represent the key dimensions of quality tapped by the full ECERS-R (Clifford et al 2005)46 The Provisions for Learning subscale focuses on materials available in the classroom and on the arrangement of the classroom space while the Teaching and Interactions subscale focuses on the quality of teacher-child interactions The two subscales reliably assess the areas of classroom quality most proximal to learning More than half scored between 3 and 4 out of a possible 7 on the Provisions for Learning subscale and an additional 20 percent scored below 3 On the Teaching and Interactions subscale close to half of observed classrooms scored between 4 and 5 These findings suggest that Head Start classrooms were more likely to score higher on emotional and educational aspects of teaching and interactions than on the provision of materials and furnishings for learning (see Figure 15)
While remaining in the minimal to good range across cohorts mean scores on these two subscales have declined over time In spring 2001 the mean Teaching and Interactions
subscale score was 541 (SD = 131) compared to 492 (SD = 123) in 2004 and 408 in 2007 On Provisions for Learning mean scores were 482 (SD = 107) in spring 2001 395 (SD = 098) in 2004 and 357 in 2007 Across cohorts classrooms scored higher on Teaching and Interactions than Provisions for Learning This pattern is similar to that reported in the NCEDL
47 Study of Prekindergarten (Clifford et al 2005)
Teachers scored highly on the measure of quality and content of their interactions with children The average Arnett score for lead teachers in Head Start classrooms was 664 (out of a possible 90) suggesting high levels of teacher sensitivity responsiveness and encouragement of childrenrsquos independence and self-help skills Scores ranged from 23 to 85 and average Arnett scores were close to those reported in earlier FACES cohorts although like the ECERS-R these have also declined over time (730 in spring 1998 [ACF 2001] 722 in spring 2001 [ACF 2006] and 704 in spring 2004 [ACF 2008])
On the Instructional Support domain of the CLASS classrooms scored at the low end of the 7-point scale Average quality was 19 with the majority of classrooms (96 percent) rated in the low range (1 or 2 points see Figure 16) Four percent of classrooms scored in the middle range on the domain (3 4 or 5 points) and none scored in the high range (6 or 7 points) On the dimensions (subscales) of the Instructional Support domain scores on Concept Development (18) were lower than those for Language Modeling (21) and Quality of Feedback (20) Most classrooms scored in the low range on Concept Development (95 percent) and Quality of Feedback (93 percent) although 14 percent of the classrooms had a middle rating on Language Modeling While the CLASS does not have normative data the CLASS Technical Appendix (Pianta et al 2008) reports mean scores from several large-scale studies that used the CLASS or its precursor the Classroom Observation System (COS) The mean scores in Head Start classrooms fall within or below ranges reported in these studies48
26
Figure 15 Percentage Distribution of ECERS-R Scores
0
13
64
20
30 02
9
26
50
11
300
20
56
17
3 30
0
10
20
30
40
50
60
70
10 - 19 Inadequate
20 - 29 30 - 39 Minimal
40 - 49 50 - 59 Good
60 - 69 70 Excellent
Perc
enta
ge o
f Cla
ssro
oms
Total Teaching amp Interactions Provisions for Learning
Source FACES Spring 2007 Classroom Observation
Figure 16 Percentage Distribution of Scores on CLASS Instructional Support Domain and Dimensions
53
44
4029 0 0 0
36
50
13
1 0 0 0
57
38
31 0 0 0
37
56
6
1 0 0 00
10
20
30
40
50
60
10 - 19 20 - 29 30 - 39 40 - 49 50 - 59 60 - 69 70
Perc
enta
ge o
f Cla
ssro
oms
Instructional Support Language Modeling Concept Development Quality of Feedback
Source FACES Spring 2007 Classroom Observation
Low (1 2) Mid (3 4 5) High (6 7)
27
Lower ratings (that is in the 1 to 2 range) on the Instructional Support domain relative to the other CLASS domains are consistent with findings reported in the CLASS appendix In spring 2008 FACES 2006 conducted a study designed to test the feasibility of conducting the full CLASS in a large number of classrooms For this pilot the Emotional Support and Classroom Organization domains were included in addition to Instructional Support In preliminary analyses Instructional Support scores were higher and more similar to those reported by the developer (Pianta et al 2008) when used as part of the full CLASS suggesting that use of the full CLASS may be a more accurate measure of classroom quality than the use of one domain alone49
CORRELATES OF CLASSROOM QUALITY AND TEACHER ATTITUDES
We used two-level hierarchical linear models (HLM) with classrooms nested within programs to examine the teacher and program characteristics associated with classroom quality and teacher attitudes The use of HLM recognizes that teachersclassrooms in the same program are not independent of each other because of shared resource levels policies and program practices
As measures of quality we used the CLASS Instructional Support domain and its subscale the Language Modeling dimension and the ECERS-R Teaching and Interactions and Provisions for Learning subscales We also examined correlates of teacher attitudes including the teacherrsquos level of satisfaction with teaching as a career and the teacherrsquos attitudes toward developmentally appropriate practice as these may be mediators that link education levels or professional development with quality of practice
Program-level covariates in each of these analyses included program SES percentage of English language learners percentage of teachers using a consistent curriculum and assessment package teacher turnover and adjusted program mean salary Covariates at the teacherclassroom level included teacher
education experience reported depressive symptoms frequency of mentoring and perceived management support The analyses of classroom quality also include DAP attitudes and teacher satisfaction with teaching as a career
Although neither teacher education nor experience is directly associated with observed classroom quality there may be an indirect association through teacher satisfaction and attitudes toward developmentally appropriate practice Teacher education at the AA level is related to higher satisfaction (b = 30 ES = 46) and in a separate model higher teacher satisfaction is related to ECERS-R Teaching and Interactions scores (b = 26 ES = 18)50
Similarly having more years of teaching experience is related to higher scores on attitudes toward developmentally appropriate practice (b = 91-148 ES =55-88) and in separate models endorsement of developmentally appropriate practice is related to ECERS-R Provisions for Learning (b = 07 ES = 15) and to CLASS Language Modeling (b = 06 ES = 15)
Teachers who perceived a more positive management climate also reported greater satisfaction with their work (b = 33 ES = 41) but management climate is not associated with observed quality measures Teachers who reported higher depressive symptoms had lower ratings on one measure of quality the Language Modeling dimension of the CLASS (b = -09 ES = -12) Thus teachers who reported more symptoms of depression were less likely to be observed supporting childrenrsquos language development through more and extended conversations open-ended questions and mapping actions with language and description Finally program socioeconomic status which represents the average household poverty ratio within a program is positively related to both ECERS-R Teaching and Interactions (b = 49 ES = 17) and Provisions for Learning subscales (b = 85 ES = 36) as well as to teacher endorsement of developmentally appropriate practice (b = 92 ES = 18)
28
ASSOCIATIONS BETWEEN OBSERVED QUALITY AND CHILDRENrsquoS DEVELOPMENTAL STATUS
We used three-level HLM to examine the relationships between classroom quality and childrenrsquos outcomes controlling for childfamily teacherclassroom and program characteristics These analyses account for the clustering of children within classrooms and classrooms within programs because children in the same classroom and program share a common set of preschool experiences and thus their outcomes
51 are not independent
We estimated models of childrenrsquos developmental status in the spring controlling for their initial status measured in the fall Outcomes include language and literacy (PPVT4 Woodcock-Johnson [WJ] Letter-Word Identification) mathematics (WJ Applied Problems ECLS-B mathematics) and social-emotional development (teacher ratings of childrenrsquos social skills and behavior problems) The language literacy and mathematics outcomes were measured using equal-interval W-scores to facilitate interpretation of variation across scores Then all outcomes were z-scored so that the coefficients may be interpreted as the change in the child outcome in standard deviation units for each 1 point increase in the respective variable
-
The childfamily level covariates included child age gender raceethnicity household language poverty ratio maternal education maternal depressive symptoms fall score and time interval between the fall and spring assessments The teacherclassroom level covariates included the quality measures discussed previously (Instructional Support Language Modeling Teaching and Interactions) teacher education full-day class mean peer abilities variation in peer abilities and teacher DAP attitudes The program level covariates included program socio-economic status (SES) percentage of English language learners percentage of teachers using a consistent
curriculum and assessment package teacher turnover and adjusted program mean salary
We estimated a series of models in the analysis In Model 1 we included childfamily characteristics in level 1 In Model 2 we added classroom quality and teacherclassroom characteristics In Model 3 we added program characteristics In order to test whether there is a non-linear relationship between classroom quality and childrenrsquos outcomes we included both a linear and a quadratic term in the model and dropped the quadratic term if it was not significant
Observed Quality and Childrenrsquos Cognitive Outcomes
As in the descriptive reporting only children with valid assessment scores are included in the analyses (for example children who do not establish a basal on the PPVT-4 are excluded from the appropriate models) The models used z-scored W-scores which are a marker of absolute rather than relative progress The PPVT and WJ W-scores are on different scales
Teacher and classroom level Peer abilities are related to childrenrsquos progress on several measures For example variation in peer abilities within classrooms is positively related to childrenrsquos progress on the PPVT-4 (b = 28 ES = 10) and Letter Word (b = 41 ES = 15) meaning that the more variation in the scores of other children in the classroom on these measures at baseline the greater the progress over the year In contrast on math measures greater progress is related to a higher baseline mean score among classmates (for Applied Problems b = 12 ES = 07 for ECLS-B Math b = 10 ES = 05) Teachersrsquo educational level is related to childrenrsquos progress on ECLS-B math but not on other cognitive measures (b = 11 ES = 11) such that teachers with an AA have children who make greater progress than
52 teachers with high school or less
Observed quality measures Childrenrsquos progress on the PPVT-4 is related to a number of quality measures The higher the ECERS-R
29
Teaching and Interactions score is the greater the progress on the PPVT (b = 05 ES = 05) controlling for other variables in the model However the association between the CLASS Instructional Support or Language Modeling scores and childrenrsquos PPVT-4 scores in the spring is non-linear (b = 05 ES =12 for Instructional Support quadratic term b =-31 ES= -19 and b = 08 ES = 22 for Language Modeling linear and quadratic terms respectively) In other words in the lower score range there is little association with quality but after a threshold of 20-25 spring PPVT-4 scores increase at an increasing rate with higher quality
Approximately 14 percent of classrooms score above 30 on the CLASS Language Modeling dimension Classrooms scoring below 30 on the CLASS Language Modeling dimension are characterized by such observed features as teachers engage in few conversations are more likely to use close-ended questions rarely repeat or extend the childrsquos responses rarely map their own or the childrenrsquos actions with language and do not use advanced language such as a variety of words and clarification of more difficult words in familiar terms
None of the classroom quality measures is significantly associated with childrenrsquos progress on the Letter Word subtest There is a negative relationship between Language Modeling and Applied Problems (b = -31 ES = -20) even after controlling for program characteristics
Observed Quality and Childrenrsquos Social-Emotional Outcomes
Teacher-reported social-emotional outcomes (social skills and behavior problems) were the basis for the dependent variables Since response rates for the teacher-child reports were high nearly all children are included in these analyses
Teacher and classroom level The models of childrenrsquos social-emotional outcomes included two measures of peer abilities (1) average and variance of peer social skills and (2) average
and variance of peer language achievement (PPVT) Both social skills and language ability of peers may influence classroom dynamics in ways that can affect a childrsquos behavior Looking first at childrenrsquos social skills controlling for other variables higher average peer social skills are associated with higher spring ratings on the individual childrsquos social skills (b = 17-18 ES = 10-11) but the variation in social skills in the classroom is not In addition the variation in peer language achievement is positively associated with the individual childrsquos social skills rating (b = 24-26 ES = 08-09) but average language ability in the classroom is not Behavior problem ratings are related only to average peer social skills higher levels of average peer social skills are associated with lower individual child behavior problem ratings (b = -14 to -15 ES = -09) behavior problem ratings are not associated with peer language achievement Teachers rate children as having fewer behavior problems in classrooms in which the average child is rated higher on social skills
Teacher education is associated with ratings of childrenrsquos social skills with more-educated teachers (with an AA or more) rating children lower on social skills than high school-educated teachers (b = -23 to -30 ES = -23 to -30) Teachersrsquo endorsement of developmentally appropriate practice is related to higher ratings of childrenrsquos social skills (b = 08 ES = 13-14)
Observed quality measures None of the classroom quality measures is significantly associated with teachersrsquo spring ratings of social skills or behavior problems
These analyses of classroom quality measures suggest that Head Start classrooms are more likely to score higher on aspects of Teaching and Interactions than on Instructional Support or provision of resources for learning Teacher credentials are improving over time and most teachers feel that they work in a supportive management climate Teacher education and experience may be indirectly related to observed quality through associations with teacher-reported satisfaction and endorsement of developmentally appropriate practice Finally
30
there is a non-linear relationship between scores on the CLASS Language Modeling dimension and childrenrsquos spring PPVT-4 scores such that scores increase more strongly above a threshold of 2 to 25 on the 7 point scale Further analyses of quality thresholds in relation to childrenrsquos outcomes are underway through related projects
REFERENCES
Administration for Children and Families ―About the Office of Head Start Available at [httpwwwacfhhsgovprogramsohsabout indexhtml] Accessed July 31 2009
Administration for Children and Families ―FACES 2003 Fifth Progress Report Technical Appendix Washington DC US Department of Health and Human Services 2008
Administration for Children and Families ―Head Start FACES 2000 A Whole-Child Perspective on Program Performance Fourth Progress Report Washington DC US Department of Health and Human Services 2003
Administration for Children and Families ―Head Start FACES Longitudinal Findings on Program Performance Third Progress Report Washington DC US Department of Health and Human Services 2001
Administration for Children and Families ―Head Start Performance Measures Center Family and Child Experiences Survey (FACES 2000) Technical Report Washington DC US Department of Health and Human Services 2006
American Academy of Pediatrics Committee on Public Education ―Children Adolescents and Television Pediatrics vol 107 no 2 February 2001 pp 423-426
Anderson S E and R C Whitaker ―Prevalence of Obesity Among US Preschool Children in Different Racial and Ethnic Groups Archives of Pediatric and Adolescent Medicine vol 163 no 4 2009 pp 344-348
Arnett Jeffrey ―Caregivers in Day-Care Centers Does Training Matter Journal of Applied Developmental Psychology vol 10 1989 pp 541-552
Beals D E and C E Snow ―Mealtime Talk That Supports Literacy Development New Directions for Child and Adolescent Development vol 111 2006 pp 51-66
Block J H ―The Child-Rearing Practices Report Berkeley CA Institute of Human Development University of California 1965
Burts DC CH Hart R Charlesworth and L Kirk ―A Comparison of the Frequencies of Stress Behaviors Observed in Kindergarten Children in Classrooms with Developmentally Appropriate vs Developmentally Inappropriate Practices Early Childhood Research Quarterly vol 5 1990 pp 407423
-
Chernoff J K Flanagan C McPhee and J Park ―Preschool First Findings from the Preschool Follow-up of the Early Childhood Longitudinal Study Birth Cohort (ECLS-B) Washington DC US Department of Education 2007
Clifford Richard Oscar Barbarin Florence Chang Diane M Early Donna Bryant Carollee Howes Margaret Burchinal and Robert Pianta ―What Is Pre-Kindergarten Characteristics of Public Pre-Kindergarten Programs Applied Developmental Science vol 9 no 3 2005 pp 126-143
Croninger RG and VE Lee ―Social Capital and Dropping Out of High School Benefits to At-Risk Students of Teachersrsquo Support and Guidance Teachers College Record vol 103 no 4 2001 pp 548-581
Downey DB PT von Hippel and B Broh ―Are Schools the Great Equalizer Cognitive Inequality During the Summer Months and the School Year American Sociological Review vol 69 no 5 2004 pp 613-635
Dunn Lloyd and Doug Dunn Peabody Picture Vocabulary Test Fourth Edition Circle Pines MS American Guidance Service 2006
Dunn LM DE Lugo ER Padilla and LM Dunn Test de Vocabulario en Imagenes Peabody Circle Pines MN American Guidance Service 1986
Harms T amp Clifford R M (1980) The Early Childhood Environment Rating Scale New York NY Teachers College Press
Harms Thelma Richard Clifford and Debby Cryer Early Childhood Environment Rating
31
ScalemdashRevised (ECERS-R) New York NY Teachers College Press 1998
Hofferth SL and JF Sandberg ―How American Children Spend Their Time Journal of Marriage and the Family vol 63 no 2 2001 pp 295-308
Hulsey L N Aikens L Tarullo and J West ―ACF-OPRE Report Data Tables for FACES 2006 A Year in Head Start Report Washington DC US Department of Health and Human Services Administration for Children and Families Office of Planning Research and Evaluation 2010
Lambert R ―Evaluating Management Climate in Head Start Programs The Measurement Properties of the Policy and Program Management Inventory NHSA Dialog A Research-to-Practice Journal for the Early Intervention Field vol 6 no 1 2002 pp 3752
-
Lambert RG M Abbott-Shim and C Oxford-Wright ―Policy and Program Management Inventory Teacher Version Charlotte NC The Center for Educational Evaluation and Measurement 1999
McDermott PA LF Green JM Francis and DH Stott ―Preschool Learning Behaviors Scale Philadelphia PA Edumetric and Clinical Science 2000
McDermott PA NM Leigh and MA Perry ―Development and Validation of the Preschool Learning Behaviors Scales Psychology in the Schools vol 39 2002 pp 353-365
National Child Care Information and Technical Assistance Center ―QRS Planning Tool Standards for Early Childhood Education Programs May 2008 Available at [httpnccicacfhhsgovpoptopicsqrs-ptecehtml] Accessed July 30 2009
-
National Research Council Early Childhood Assessment Why What and How edited by CE Snow and SB Van Hemel Washington DC The National Academies Press 2008
Pallas AM G Natriello and EL McDill ―The Changing Nature of the Disadvantaged Population Current Dimensions and Future Trends Educational Researcher vol 18 no 5 1989 pp 16-22
Pianta Robert K LaParo and B Hamre The Classroom Assessment Scoring System Pre-
K Manual Charlottesville VA University of Virginia 2008
Radloff LS ―The CES-D Scale A Self-Report Depression Scale for Research in the General Population Journal of Applied Psychological Measurement vol 1 no 3 1977 pp 385-401
Rathbun A and J West ―From Kindergarten Through Third Grade Childrenrsquos Beginning School Experiences NCES 2004-007 Washington DC National Center for Education Statistics 2004
Roid G H and Miller L J Examiners manual Leiter International Performance Scale-Revised Chicago Stoelting Co 1997
Tarullo L J West N Aikens and L Hulsey ―Beginning Head Start Children Families and Programs in Fall 2006 Washington DC US Department of Health and Human Services 2008
West J K Denton and L Reaney ―The Kindergarten Year NCES 2001-023 Washington DC National Center for Education Statistics 2001
West J LTarullo N Aikens S Sprachman CRoss and B Carlson ―FACES 2006 Study DesignWashington DC US Department of Health and Human Services 2007
West J L Tarullo N Aikens and L Hulsey ―Study Design and Data Tables for FACES 2006 Baseline Report Washington DC US Department of Health and Human Services 2008
Woodcock RW AF Muntildeoz-Sandoval K McGrew N Mather and F Schrank Bateria III Woodcock-Munoz Itasca IL Riverside Publishing 2004
Woodcock RW K McGrew and N Mather Woodcock-Johnson III Tests of Achievement Itasca IL Riverside Publishing 2001
Zill N A Sorongon K Kim C Clark and M Woolverton ―FACES 2003 Research Brief Childrenrsquos Outcomes and Program Quality in Head Start Washington DC US Department of Health and Human Services 2006
Zill N and J West ―Findings from the Condition of Education 2000 Entering Kindergarten Children NCES 2001-035
32
Washington DC National Center for Education Statistics 2001
NOTES
1 Migrant and Seasonal Worker programs (MSHS) American Indian and Alaska Native (AIAN) programs programs in Puerto Rico and other US territories and programs not directly providing services to 3- 4- and 5-year-olds (such as Early Head Start) were excluded from the frame The Office of Head Start provided information about any defunded (or soon-to-be defunded) programs before sampling and these programs were then deleted from the sample frame Thirteen programs affected by Hurricanes Katrina and Rita in August 2005 were unable to provide information for the 2004ndash2005 PIR data and thus were not eligible for sample selection
2 Children who were 3 years old and attending their first year of Head Start were sampled at a higher rate to ensure comparable sample sizes between 3-year-olds and 4-year-olds at the end of the kindergarten year given the longer follow-up time for this younger group
3 Children who were no longer enrolled in the program where they were sampled in fall 2006 and who were not enrolled in one of the other FACES 2006 programs were not included in the spring 2007 data collection
4 Parents who were not interviewed in person during the week-long visit were interviewed by phone either before or after site visits About 44 percent of the parent interviews were conducted in person
5 About 80 percent of the teacher rating forms were completed using the Web instrument
6 This total represents 88 percent of the children who were sampled and eligible for the fall 2006 baseline data collection
7 These are all weighted marginal response rates not accounting for prior stages of sampling and participation The cumulative weighted response rates which take into account the response rate for prior stages of the sample (such as program center and child response rates) as well as fall 2006 consent rates are by definition lower The cumulative child response rate through spring 2007 is 81 percent The corresponding response rates associated with completing the child assessments parent interviews and teacher
ratings in spring 2007 are 78 percent 79 percent and 78 percent respectively At the teacher level among participating classes the marginal weighted response rate for the teacher interview was 98 percent At the child level among children whose parents gave consent the rate for child assessments was 96 percent the rate for parent interviews was 96 percent and the rate for teacher-child reports was 95 percent
8 The cumulative teacher interview response rate is 92 percent
9 This represents 100 percent of the classrooms that were selected for observation The cumulative response rate for the observations which takes into account nonresponse at the program level was 92 percent Due to the smaller-than-expected classroom sizes encountered when selecting the FACES 2006 sample in the fall we selected more classrooms than anticipated and decided to subsample classrooms for observation When two of a teacherrsquos classes were in our sample we randomly subsampled either the morning or afternoon session for observation Analysis weights that include classroom observations were adjusted to account for the subsampling of classrooms The classroom observation sample included 350 of the 390 eligible classrooms (90 percent) To be eligible for observation the classroom must meet three criteria (1) it must be a classroom in a center-based program (home-based services were not observed) (2) it must be one of the originally sampled classrooms (classrooms that children moved to in the spring were not eligible) and (3) it must have at least two sampled eligible children whose parents gave consent
10 The screening process and cognitive assessment measures are described in the section of this brief that describes childrenrsquos cognitive outcomes
11 The preferred respondent for the spring interview was the childrsquos biological mother or the fall 2006 respondent Ninety-two percent of the spring interviews were completed by the same respondent who had been interviewed in the fall (and 89 percent were the childrsquos biological mother) For 3 percent of the children the first parent interview was completed in the spring 97 percent completed the first parent interview in the fall
33
12 See Hulsey et al 2010 for the statistics found in this report
13 Weights are used to compensate for the differential probabilities of selection at the sampling stage (for example 3-year-olds were sampled at a higher rate than 4-year-olds) and to adjust for the effects of nonresponse
14 Information on the characteristics of children and their families in fall 2006 can be found in Beginning Head Start Children Families and Programs in Fall 2006 (Tarullo et al 2008)
15 The percentages presented in this section apply only to children whose mothers andor fathers live with them
16 The federal poverty threshold for a family of four was $20000 in 2006
17 Includes both biological and adoptive parents
18 FACES uses the term dual language learners or DLLs to describe these children
19 Croninger and Lee 2001 Pallas Natriello and McDill 1989 Rathbun and West 2004 Zill and West 2001
20 Downey von Hippel and Broh 2004 Rathbun and West 2004 West Denton and Reaney 2001
21 These questions were not asked in the fall 22 These questions were not asked in the fall 23 See Hulsey et al 2010 for the mean spring
2007 scores for all children across measures regardless of language of assessment child performance or availability of valid scores in fall 2006
24 We are unable to provide information on changes in the skills of children who changed their language of assessment between the fall and spring as these children receive different assessment measures at each wave
25 All children regardless of home language or performance on the Pre-LAS received the English receptive vocabulary measure the PPVT-4 The TVIP is the Spanish language version of the PPVT-4 and was used with children whose primary home language was Spanish regardless of performance on the Pre-LAS Thus children whose parents spoke Spanish to them at home received the receptive
vocabulary component of the battery in English (PPVT-4) as well as in Spanish (TVIP)
26 The English assessment used the Woodcock-Johnson III subtests and the Spanish assessment used the Bateriacutea III Woodcock-Muntildeoz subtests
27 For the purposes of the direct assessment home language was based on information provided on parent consent forms
28 Some children were administered the cognitive assessments in Spanish (or not at all) in fall 2006 and then in English in spring 2007 Similarly some children were unable to achieve a basal on the PPVT-4 in the fall but were able to by the spring Data in this section reflect the performance of children assessed in English in both fall 2006 and spring 2007 In addition mean scores are only reported for those with valid scores at both occasions (for example those who established a basal on the PPVT-4 at both waves) See Hulsey et al 2010 for the mean scores for all children assessed in spring 2007 regardless of language of assessment child performance or availability of valid scores in the fall In this set of tables childrenrsquos mean spring 2007 scores are slightly lower (for example 1 to 2 standard score points lower) Variability in childrenrsquos scores is comparable for both sets of scores
29 Cross-cohort comparisons only include children in FACES 2003 and 2006 because in earlier cohorts 3-year-old children were not assessed in all areas In addition Woodcock-Johnson scores in FACES 2000 were drawn from the Woodcock-Johnson Psycho-Educational Battery-Revised edition (W-J R) Woodcock-Johnson scores in FACES 2003 were drawn from a hybrid version of the W-J R and the Woodcock-Johnson Psycho-Educational Battery-Third edition (W-J III) This allows for estimation of childrenrsquos scores based on either the norms for the W-J R or W-J III FACES 2006 used the W-J III
30 All analyses of the W-J III scores are based on original calculations using the FACES 2003 data
31 PPVT scores in FACES 2003 were drawn from the Peabody Picture Vocabulary Test-Third edition (PPVT-III) FACES 2006 used the PPVT4
32
-
Measures of criterion-referenced performance include raw and W- or IRT-based
34
scores W scores allow for measurement of change or growth in performance on the same scale over time Like raw scores W scores are an indicator of absolute rather than relative performance W scores are available for the WJ-III and PPVT-4 Story and Print Concepts scores are scaled to reflect the number of items answered correctly ECLS-B math items are also scaled to reflect the number of items answered correctly or the percentage of children demonstrating mastery of skills or skill sets
33 This score is a proficiency probability score and indicates the probability that a child would have passed the proficiency level It can be interpreted as the percentage of the population who have mastered this skill or skill set (for example 30 x 100 = 30 percent of Head Start children are able to demonstrate these skills at the start of the program year) These scores can take on any value from zero to one
34 The ECLS-B preschool wave was intended to assess children in the fall when most children would be about 48 through 57 months of age However the age at time of testing in the ECLS-B preschool wave ranged from approximately 3 years 8 months to 5 years 5 months (Chernoff et al 2007) On average the FACES children in the fall 2006 round were assessed earlier in the program year than the ECLS-B sample and their ages ranged from approximately 2 years 7 months to 5 years 8 months Conversely FACES children in the spring 2007 round were assessed later with ages ranging from 3 years 3 months to 6 years 3 months
35 Number of family risks is based on three family characteristics whether the child resides in a single parent household whether the household income is below the poverty threshold and whether the mother has less than a high school diploma
36 See Hulsey et al 2010 for tables that provide comparative scores for children assessed in English at both waves Spanish at both waves and who moved from fall to spring from a Spanish assessment to an English assessment
37 Although scores on the W-M III subtests were scaled to be comparable with the W-J III early items on the Letter-Word Identification subtests suggest differences in the demands required of children Specifically children who are administered the W-M III are required to provide verbal responses earlier in the
assessment than those administered the W-J III suggesting less ―warm up time and greater demands of these children
38 Similar declines in hyperactive behavior were not found in FACES 2003
39 Reported problem behavior and hyperactive scores in FACES 2006 were constructed using different items from those reported in prior cohorts
40 Significant fall-spring declines were found in teacher-rated withdrawn behavior in FACES 2003
41 Body Mass Index (BMI) is the ratio of an individualrsquos weight to height and can be used as an indicator of overweight and obese status Calculation of BMI is specific to gender and age
42 The Centers for Disease Control and Prevention (CDC) sets the criterion of overweight as being when the childrsquos BMI score is from the 85th to 94th percentile for their age and gender and of obese as being when the childrsquos BMI is at or above the 95th percentile In previous FACES reports the two categories have been labeled as at risk of overweight and overweight respectively
43 Classrooms observations were completed by trained observers Observers were trained and certified after meeting reliability standards showing proficiency to administer each instrument Reliability was defined as being within 1 point of the gold standard on the scale or dimension score at least 80 percent of the time Observers not meeting 80 percent reliability were given a provisional pass and the opportunity to test their reliability in the field with a gold standard group leader Thirty-six of the 37 interviewergold standard pairs were in agreement at least 80 percent of the time on the ECERS-R and 89 percent of the interviewergold standard scores were within one point of each other on the on the CLASS To minimize observer drift up to two quality assurance visits (that is paired observations) were conducted during the field period If there was a discrepancy between observer and gold standard we used the gold standard score
44 Concept Development refers to teachersrsquo use of instructional discussions and activities to promote higher-order thinking in contrast to rote instruction Quality of Feedback refers to the degree to which the teacher provides feedback that expands learning and understanding and encourages participation Language Modeling
35
refers to the quality and amount of teachersrsquo use of language-stimulating and language-facilitation techniques
45 ECERS-R subscale scores reported in this section reflect the specification of subscales that have been reported in earlier cohorts of FACES In some instances these specifications do not match those of the publishers
46 Although an alternative specification for classroom quality these scores allow us to compare with other recent studies of classroom quality that have reported scores for the short form of the ECERS-R (for example the National Center for Early Development and Learning [NCEDL] Study of Prekindergarten)
47 Reported scores for FACES 2000 and 2003 are unweighted while those for FACES 2006 are weighted All analyses are based on original calculations using the FACES 2000 2003 and 2006 data
48 Although the CLASS Instructional Support domain was piloted in FACES 2003 it was used as part of the observation protocol for the first time in FACES 2006 The measure was added to provide information on the quality of the instructional environment Comparative data with earlier cohorts is not available
49 In spring 2008 the classroom observation protocol was changed in order to study the feasibility of training certification field administration and quality assurance procedures on the full CLASS in a large sample of programs All three domains from the CLASS were assessed while the ECERS-R and Arnett were not used A sample of 147 classes attended by FACES 2006 children (4-year-olds attending a second year of Head Start) was observed The spring observation sample was not designed to support national estimates of Head Start classrooms Instead the goal was to learn as much as possible about what is required to prepare for and conduct the full CLASS in Head Start classrooms Preliminary analyses of these data suggest higher average scores on the CLASS Instructional Support domain when used with the full scale in spring 2008 as compared to when used in isolation in spring 2007
50 Correlation coefficients (b) and effect sizes (ES) are presented for significant findings The effect size reported in this section shows the standardized mean difference in the dependent variable between two groups for a binary
independent variable or the standardized association between a continuous independent variable and the dependent variable (that is one standard deviation change in the independent variable is related to some percentage of a standard deviation change in the dependent variable)
51 The analyses are weighted at the child classroom and program levels in the HLM models The child-level data are weighted to represent all children entering Head Start for the first time in fall 2006 and who were still enrolled in the program in spring 2007 The classroom-level data are weighted to represent all classrooms that were serving these children in spring 2007 The program-level data are weighted to represent all programs that were providing direct services to these children in spring 2007 excluding MSHS programs AIAN programs and other exclusions listed in note 1
52 Children whose teachers had a BA were not significantly different in progress than those whose teachers had high school or less education
36
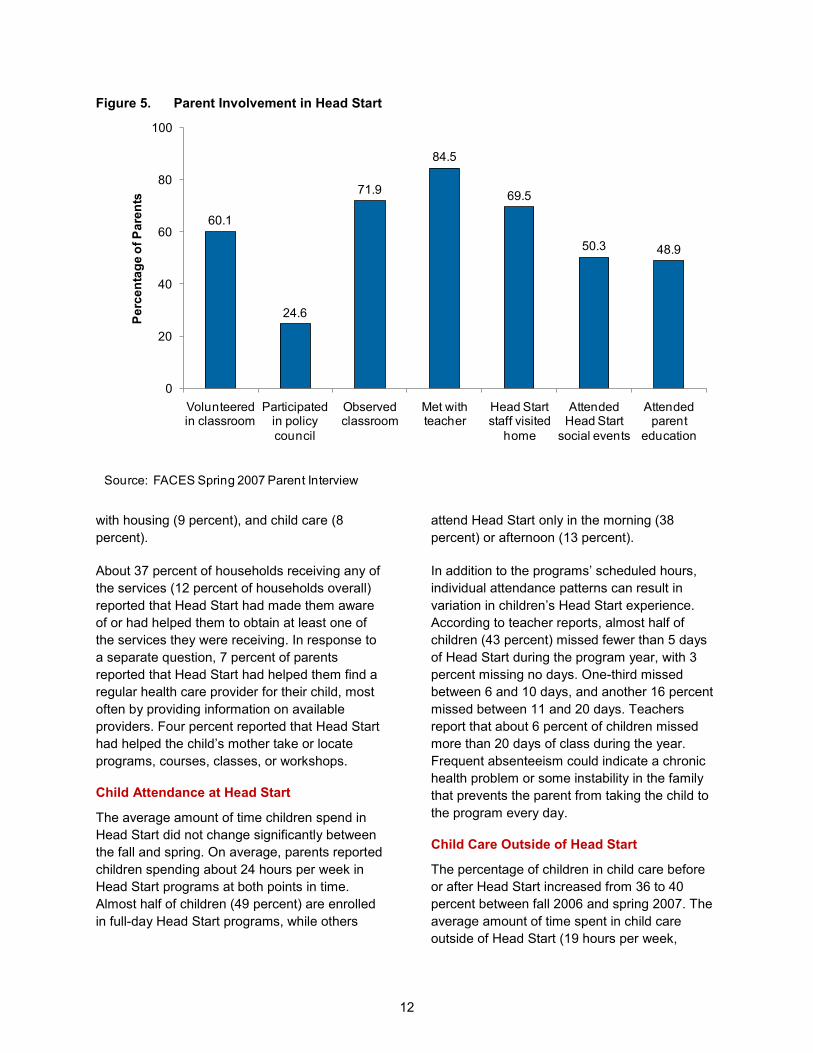
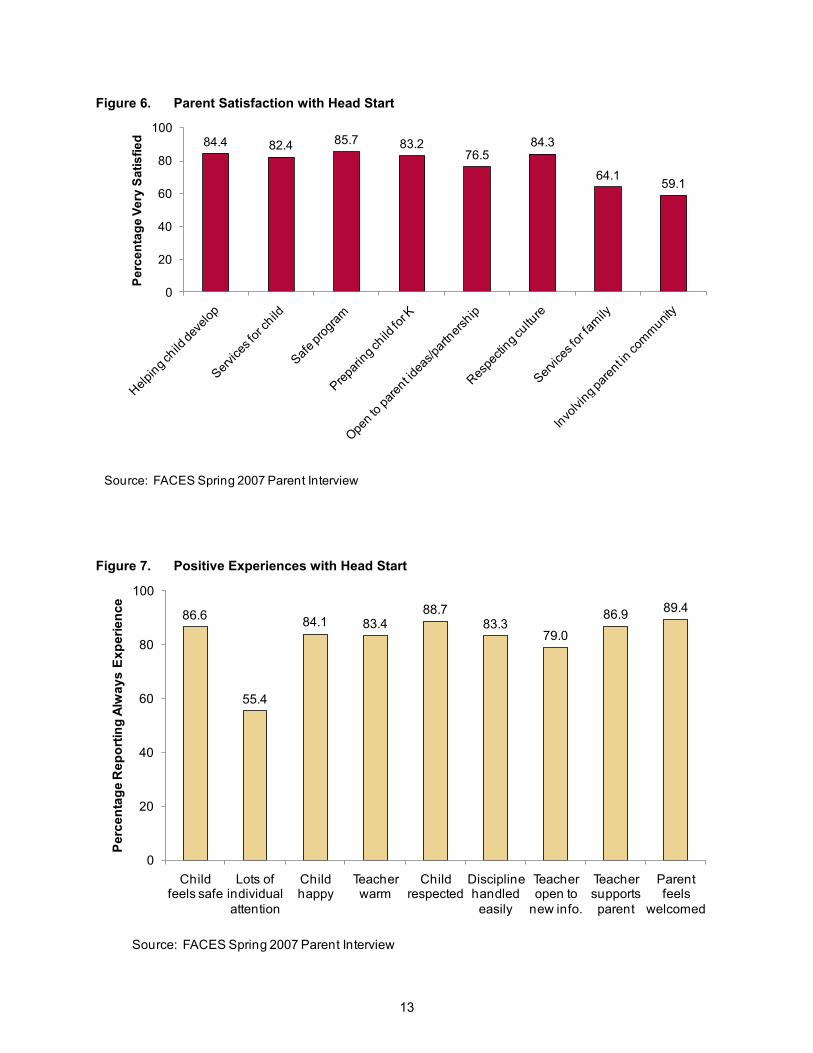
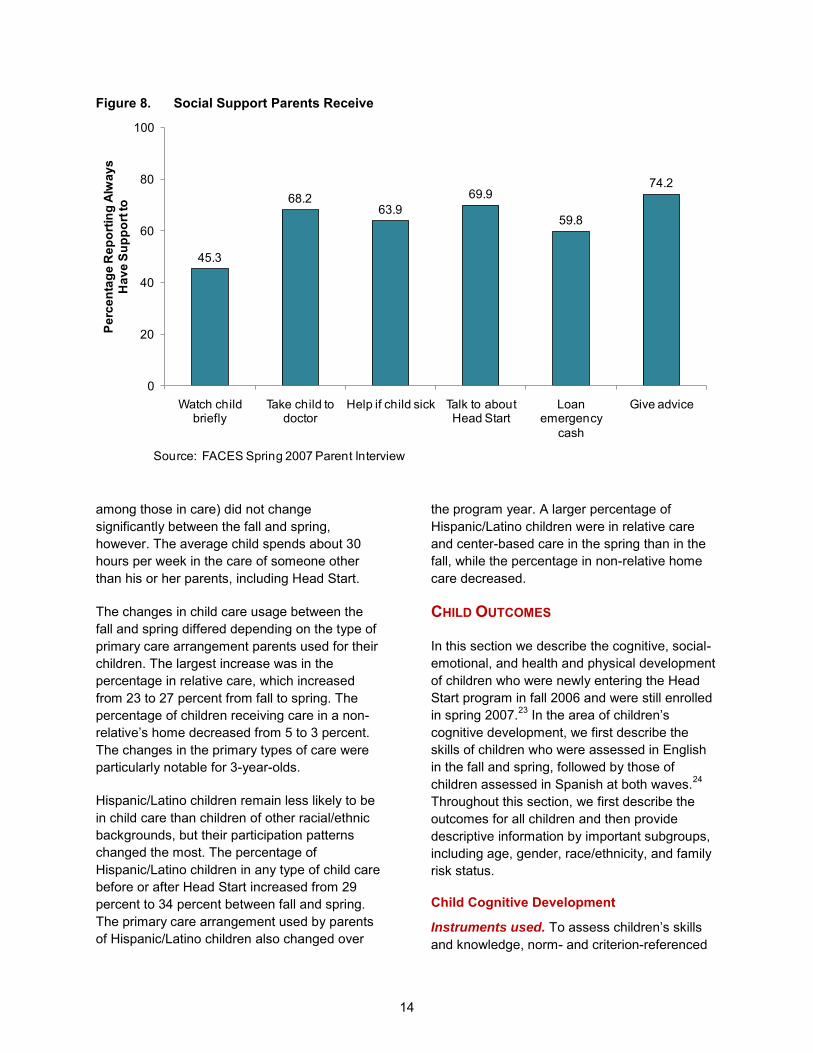
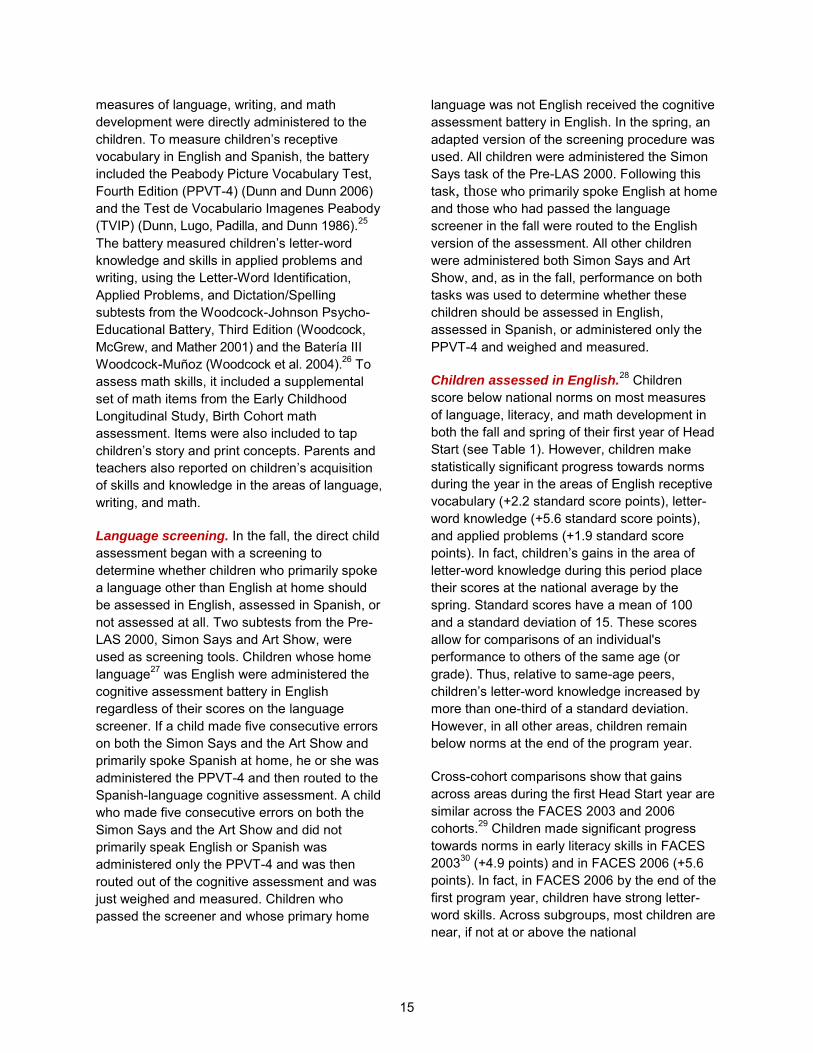
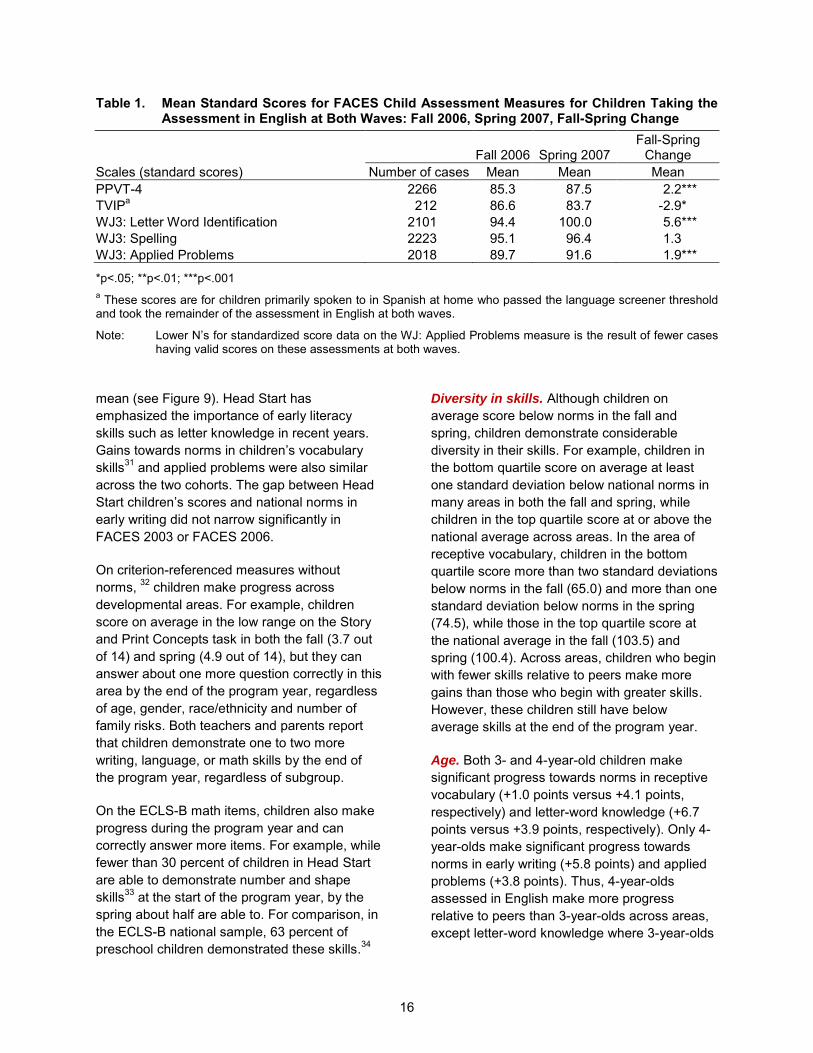
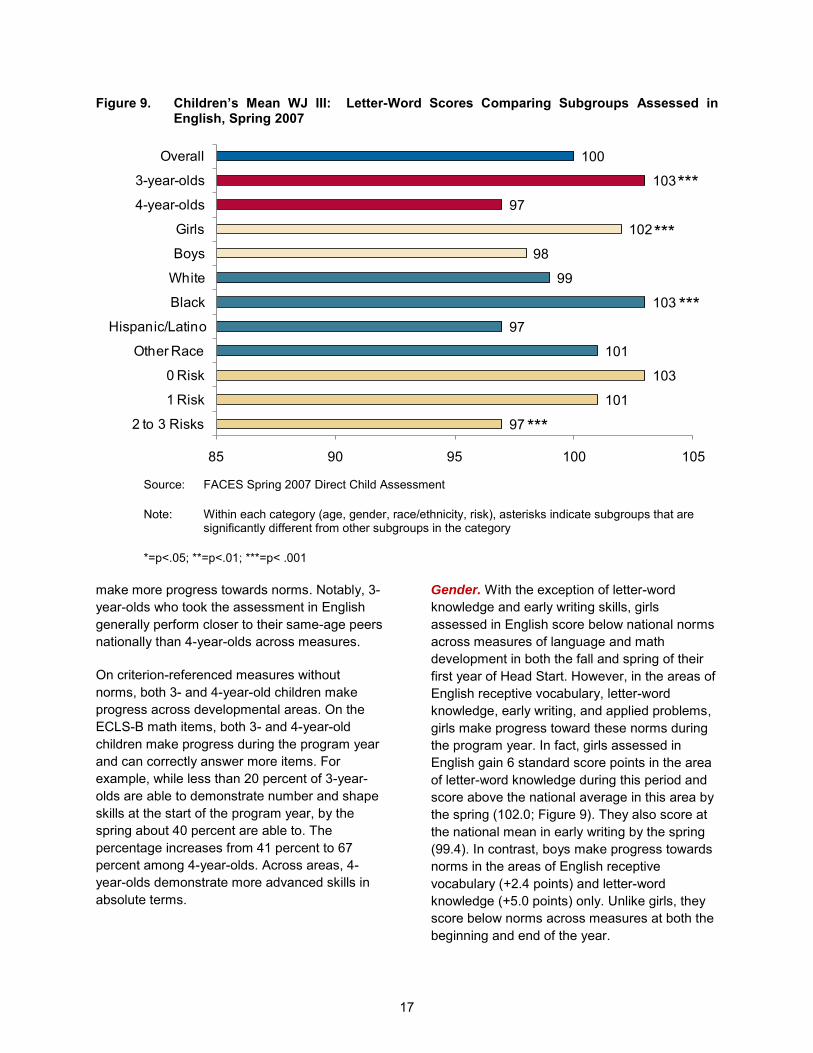
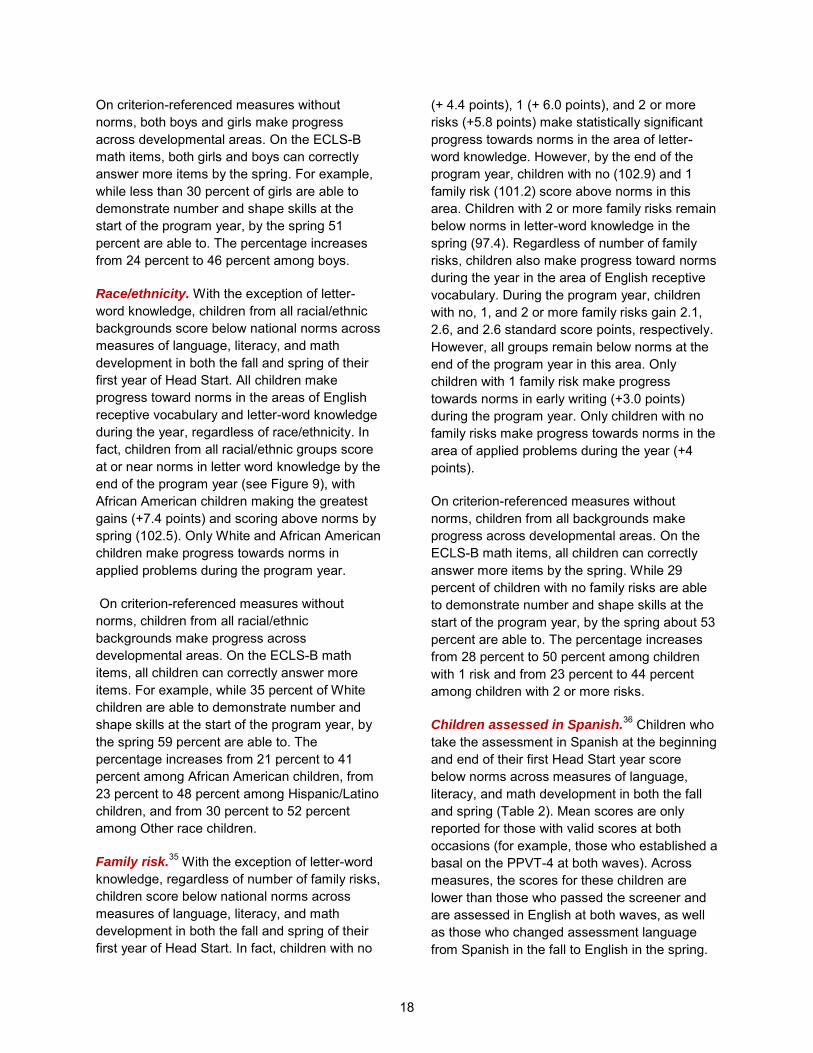
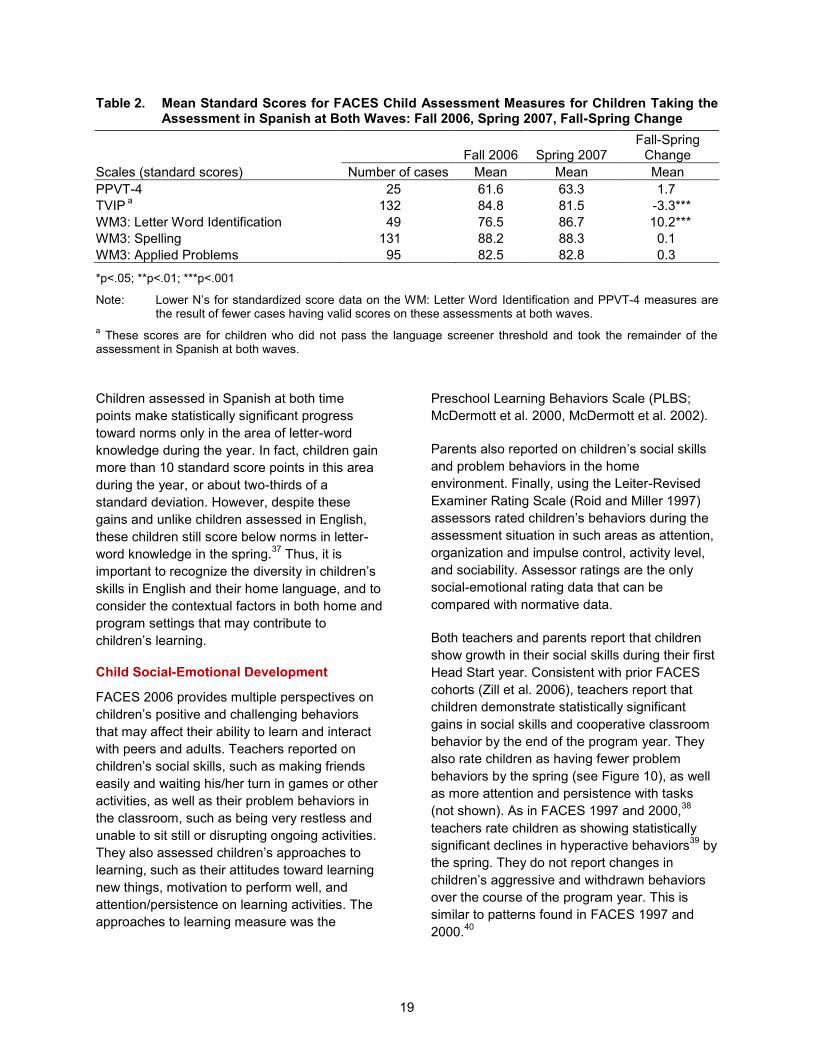
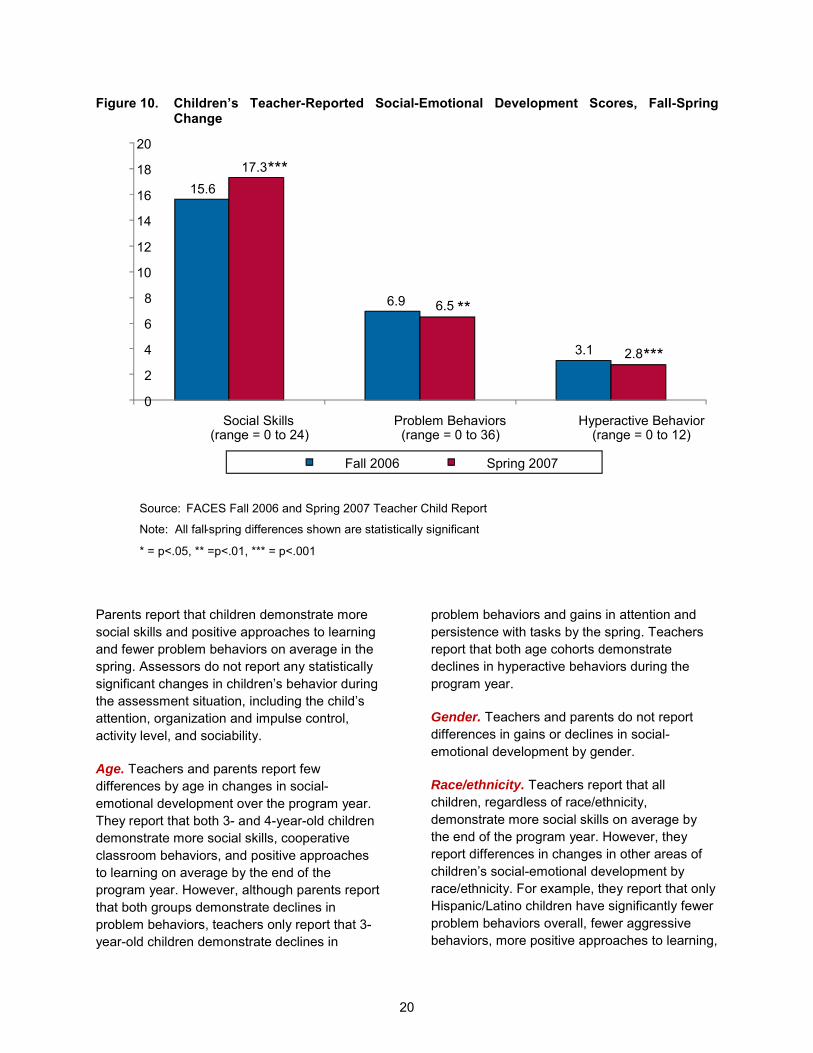
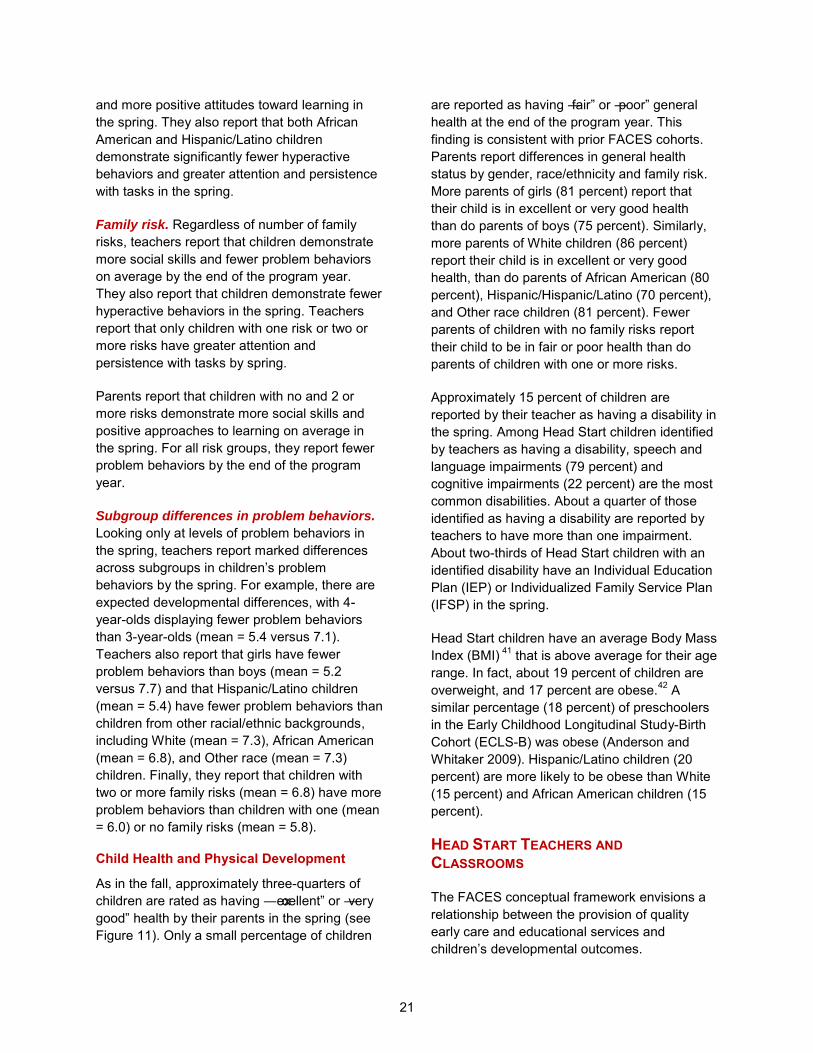
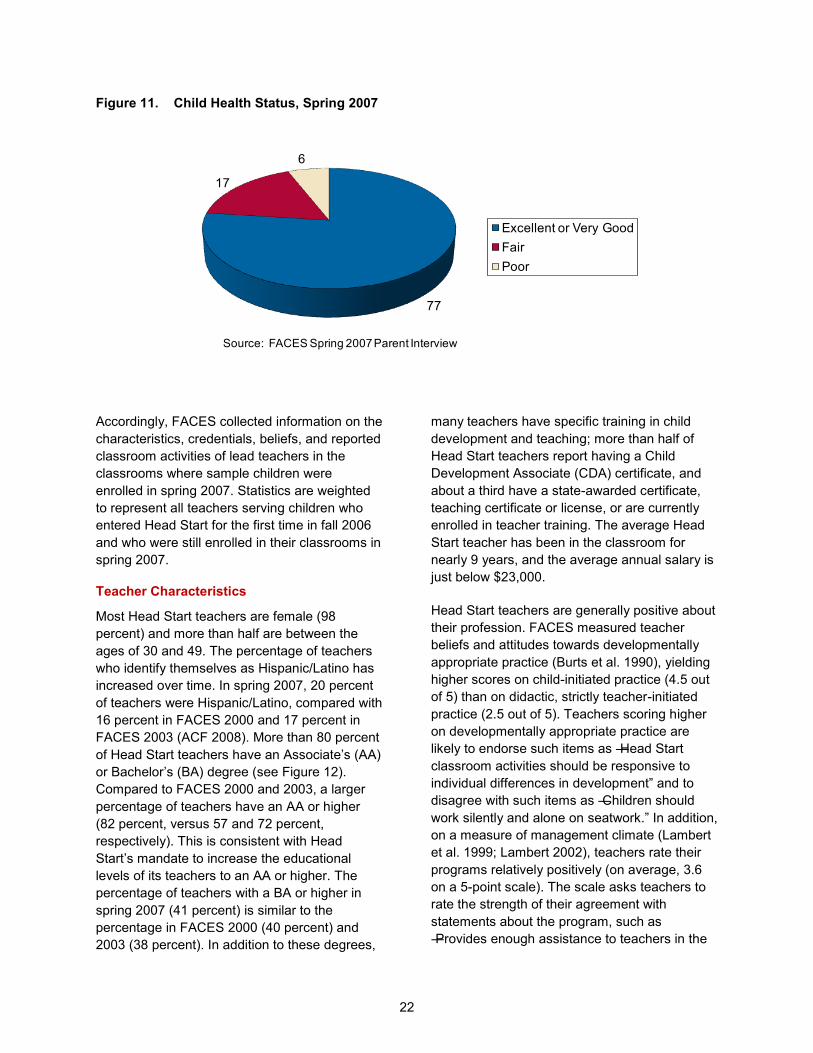
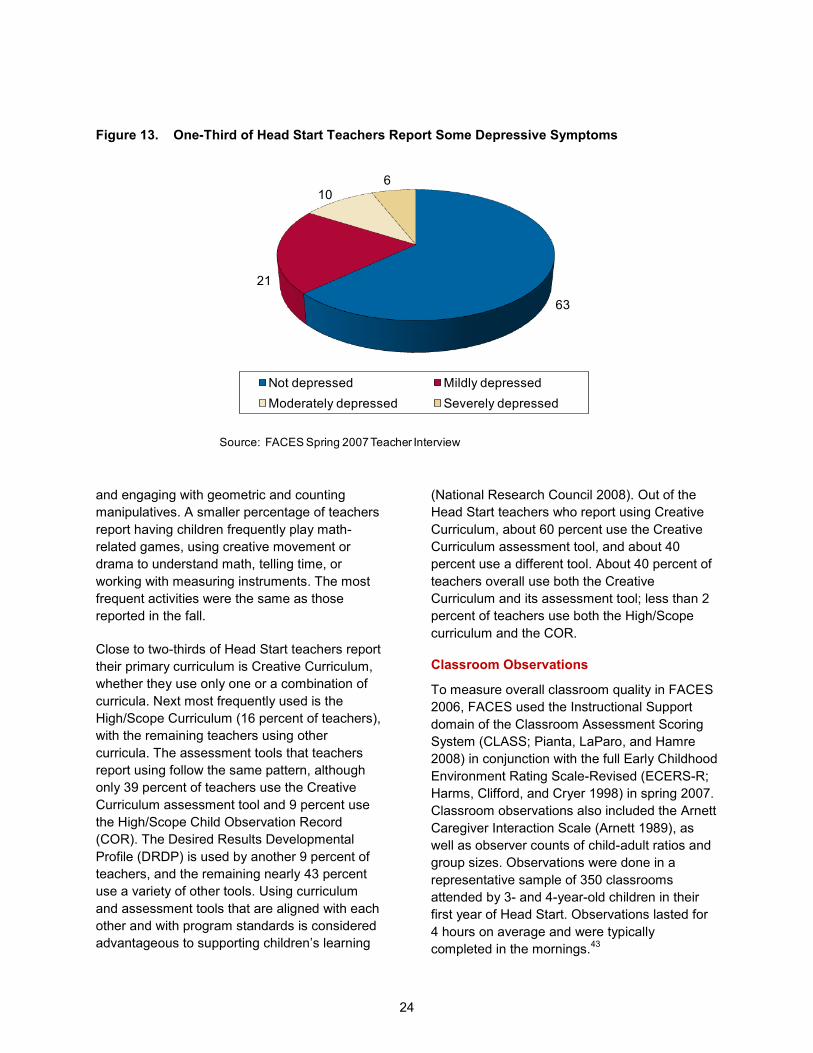
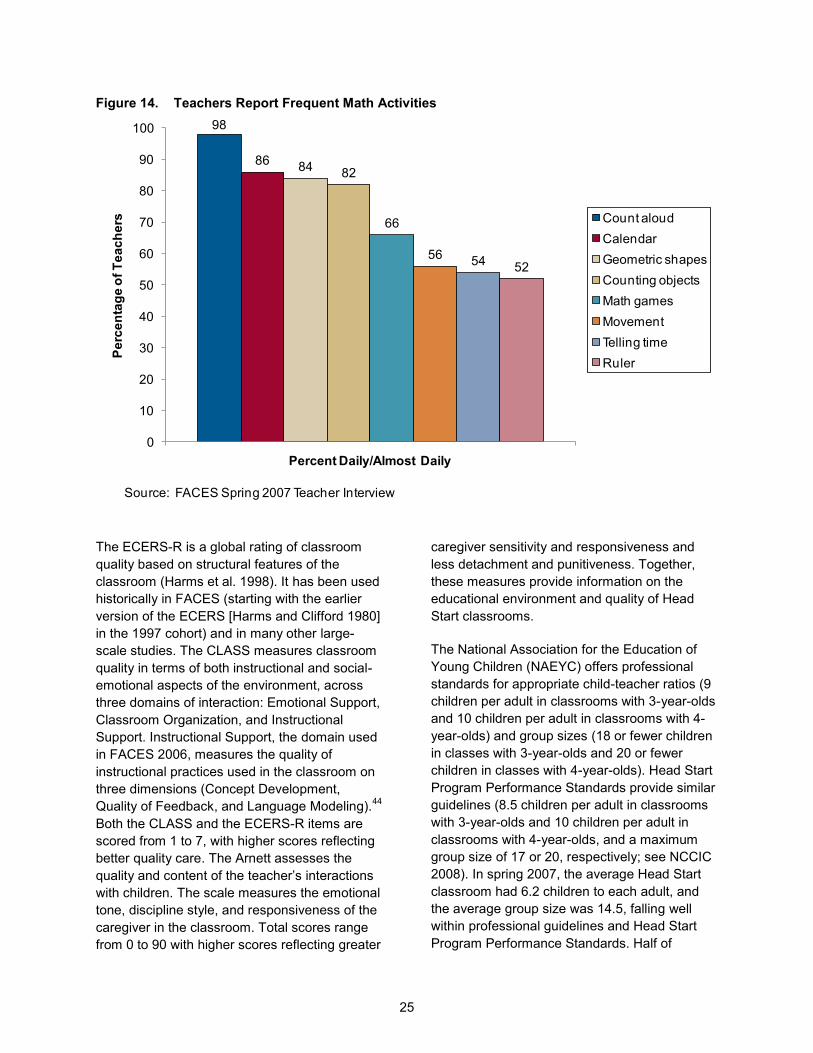
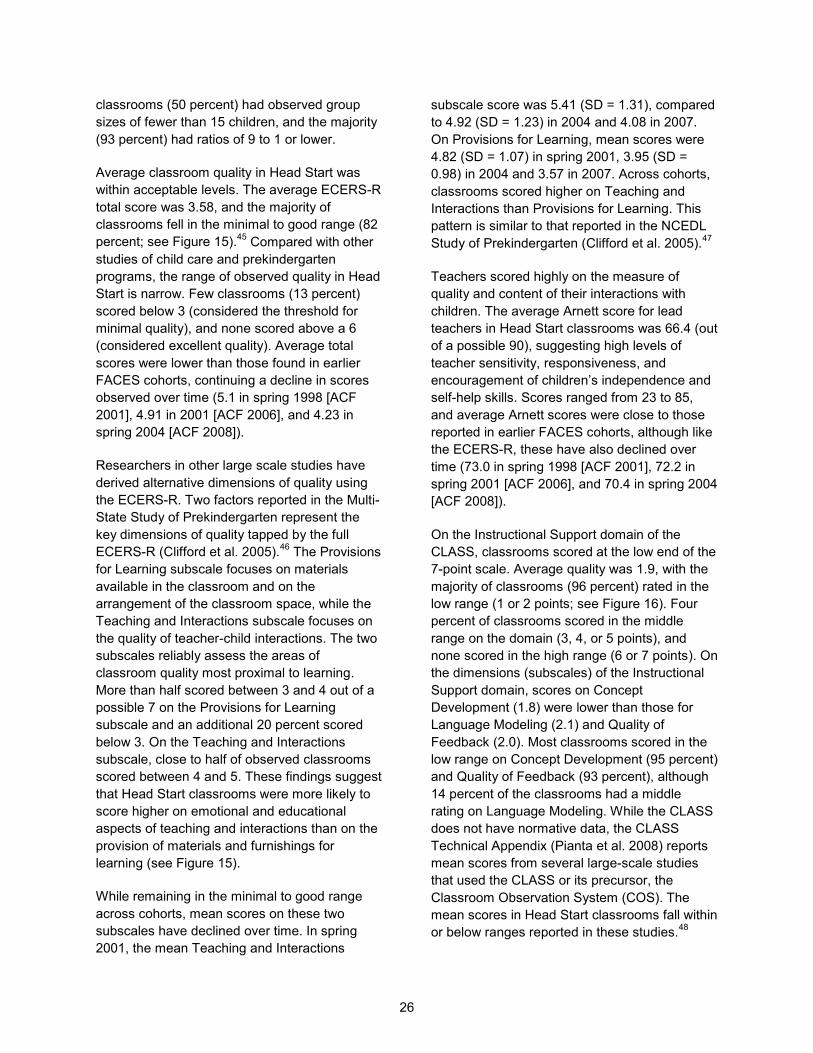
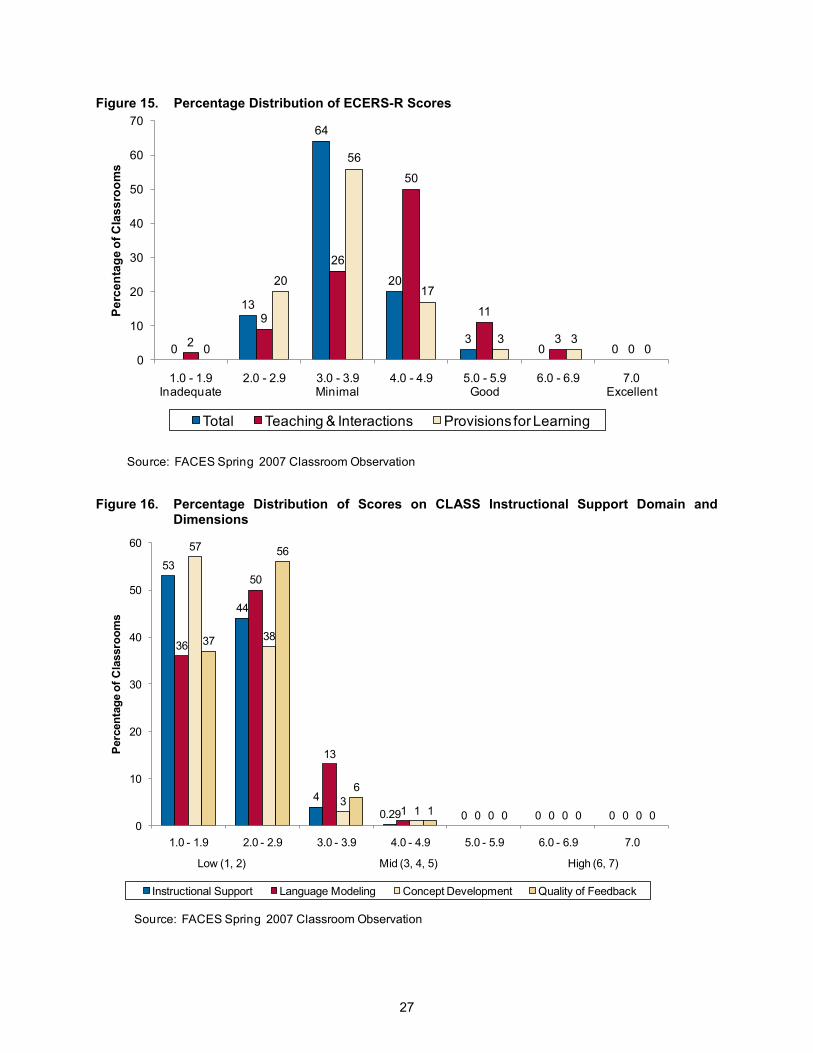
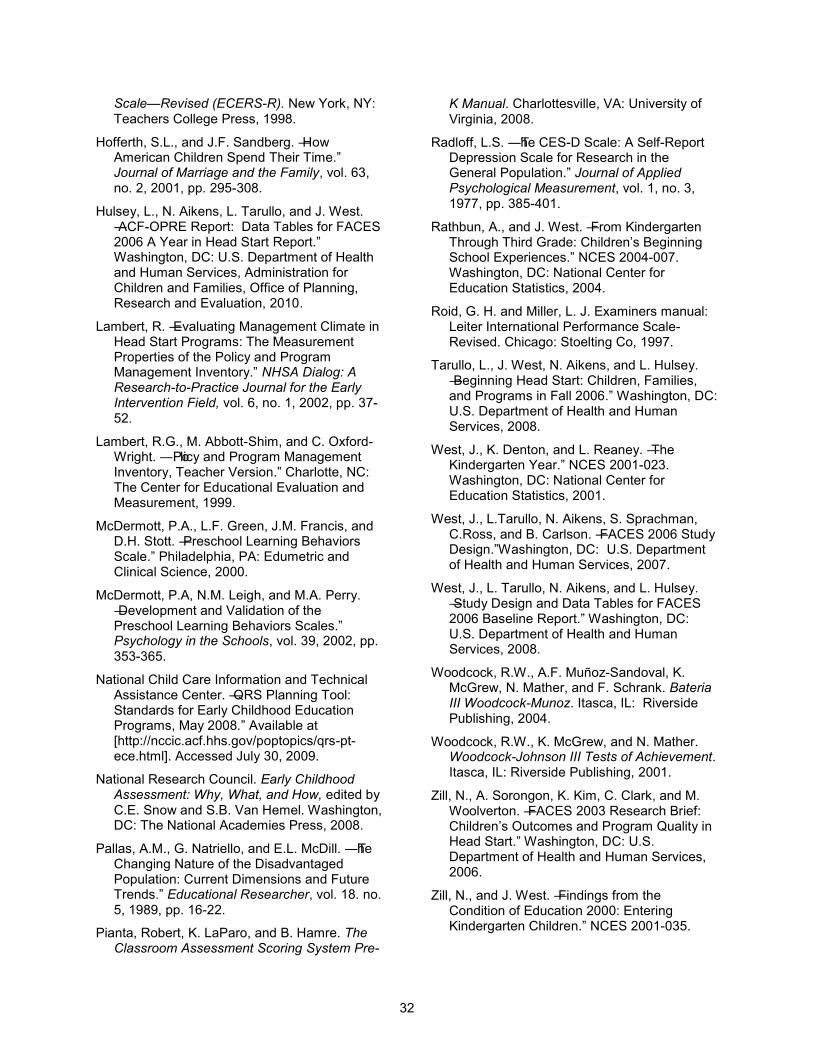
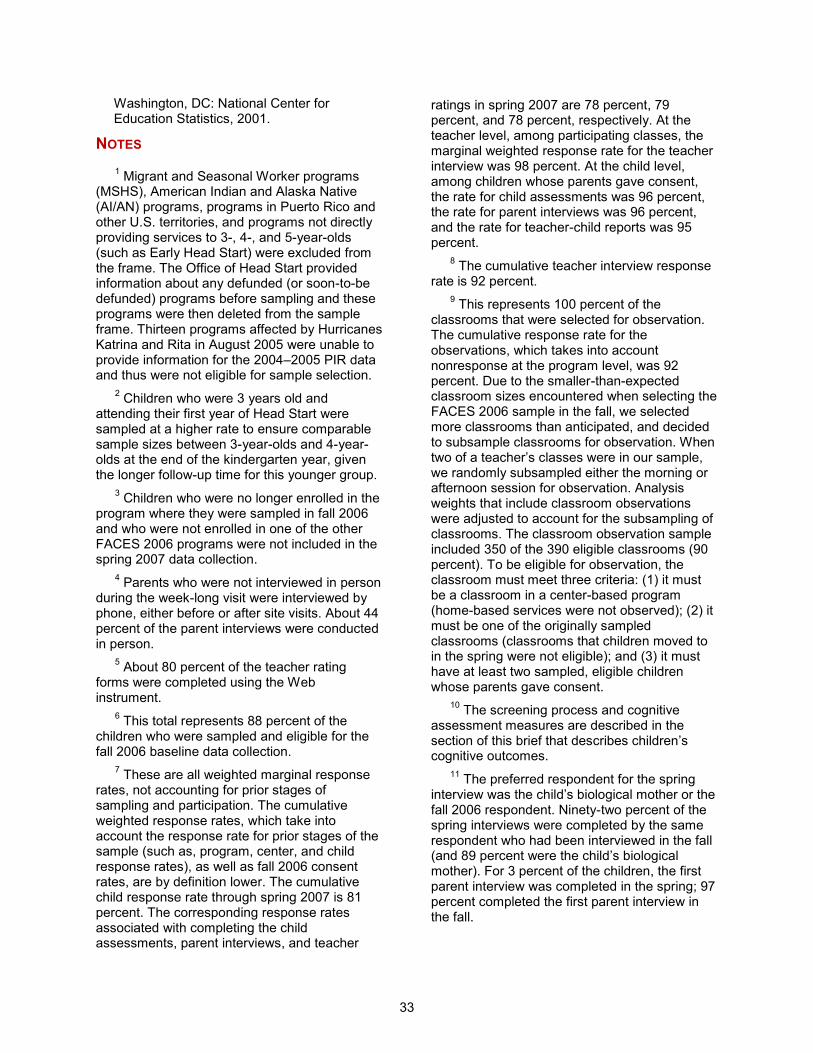
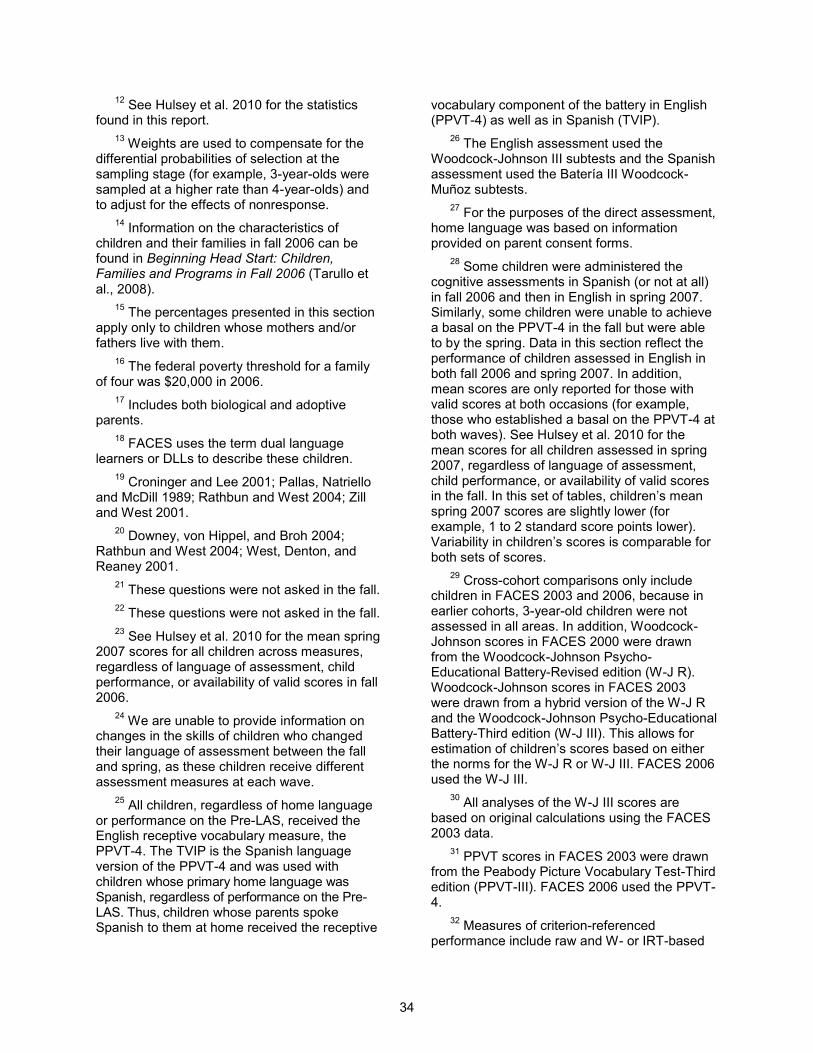