Embed Size (px)
Citation preview

Journal of Physics Conference Series
OPEN ACCESS
Accurate determination of electronic transportproperties of semiconductor wafers with spatiallyresolved photo-carrier techniquesTo cite this article Bincheng Li et al 2010 J Phys Conf Ser 214 012013
View the article online for updates and enhancements
You may also likePhotoconduction in PolyethyleneTerephthalate Mechanism of Photo-Carrier TransportYoshiaki Takai Toshifumi OsawaTeruyoshi Mizutani et al
-
Theory of electrical resistivity in aninteracting two-carrier system applicationto (SN)X and (SNBry)XA Oshiyama
-
Carrier dynamical VLSI device simulationC C McAndrew E L Heasell and K Singhal
-
This content was downloaded from IP address 2231749107 on 29012022 at 0007
Accurate determination of electronic transport properties of semiconductor wafers with spatially resolved photo-carrier techniques
Bincheng Li Xianming Liu Wei Li Qiuping Huang and Xiren Zhang Institute of Optics and Electronics Chinese Academy of Sciences P O Box 350 Shuangliu Chengdu Sichuan 610209 China
Corresponding authorrsquos email address bcliioeaccn
Abstract Spatially resolved photo-carrier techniques in which a modulated and tightly focused laser beam with photon energy larger than the band gap of the semiconductor material under investigation is employed to generate free carriers are applied to the simultaneous determination of the electronic transport properties of semiconductor wafers that is the carrier lifetime the carrier diffusivity and the front surface recombination velocity The simultaneous determination is fulfilled by measuring and multi-parameter fitting the modulation-frequency-dependent three-dimensional distribution of photo-generated free carriers in a semiconductor wafer to a rigorous three-dimensional theoretical model The uncertainties of the fitted parameter values are analyzed by investigating the dependence of a mean square variance including both amplitude and phase errors on the corresponding transport parameters and compared to that obtained by the conventional frequency-scan approach in which only the frequency dependence of the amplitude and phase of the photo-carrier signals are recorded at the excitation spot Both theoretical simulations and experimental results show that the accuracy of the simultaneous multi-parameter determination is greatly improved by the spatially resolved information of the photo-generated free-carrier diffusion in the semiconductor wafers
1 Introduction In order to control the quality performance and reliability of silicon-based micro-electronic devices the electronic transport properties ie the carrier lifetime ( ) the carrier diffusivity (D) and the front surface recombination velocity (FSRV) (S1) of silicon wafers have to be determined accurately In the past various photo-excitation based methods such as modulated free carrier absorption (MFCA) [1] photo-modulated thermoreflectance (PMR) [2] infrared photothermal radiometry (PTR) [3] and photo-carrier radiometry (PCR) [4] have been developed to determine the transport properties of silicon wafers In these approaches the transport properties of semiconductor wafers are determined simultaneously by multi-parameter fitting the modulation frequency dependence of the signal amplitude and phase measured at the excitation spot to a rigorous theoretical model However careful investigations have shown that only when the carrier diffusivity D is known in prior with high precision the carrier lifetime and FSRV values determined by the simultaneous multi-parameter fitting are acceptable [5 6] In practice the carrier diffusivities of most wafers vary in a wide range depending on the injection level and process parameters [7] An inaccurate D value could cause
15th International Conference on Photoacoustic and Photothermal Phenomena (ICPPP15) IOP PublishingJournal of Physics Conference Series 214 (2010) 012013 doi1010881742-65962141012013
ccopy 2010 IOP Publishing Ltd 1
considerable deviations of fitted and FSRV from the real values of measured wafers It is therefore essential to develop sensitive and non-destructive approaches to determine accurately not only the carrier lifetime and FRSV but also the carrier diffusivity simultaneously
Recently the laterally resolved MFCA technique (LR-MFCA) [8] in which the MFCA amplitude and phase are measured as functions of the pump-probe-beam separation at several modulation frequencies covering an appropriate range has been employed to extract the transport properties of silicon wafers by multi-parameter fitting the LR-MFCA data to a rigorous three-dimensional model In this paper we report on the theoretical and experimental aspects of the laterally resolved photo-carrier techniques (either MFCA or PCR or their combination) for the simultaneous determination of the transport parameters of semiconductor wafers
2 Theoretical models and simulations Consider a homogeneous semiconductor wafer with a thickness L The photo-carrier signal from a semiconductor wafer subject to photo-excitation from an intensity-modulated laser source (pump beam) with a photon energy larger than energy gap is directly proportional to the number of free carriers within the detection volume For MFCA the signal can be expressed as follows [9]
00( ) ( ) ( )I r const N q J qr dq
(1) while for PCR the signal is [4]
00 0( ) ( ) ( ) 2drS const N q J qr dq rdr (2)
with
1 2
1 exp 1 exp( ) exp
L LN q E C C L
Where
2 2 1 jqD
2 2
2 2
exp 412
q wP RE
hvD 1 2
1 1 22 1
exp ( )exp( 2 )
b b LC A A
A A L 1 1 2 2
22 1
exp ( )exp( 2 )
b A b A LC
A A L 1
11
D SAD S
22
2
D SAD S
11
1
D SbD S
22
2
D SbD S
Here and R are the absorption coefficient and surface reflectivity of the semiconductor wafer at the excitation wavelength respectively w P and h are the radius power and photon energy of the pump beam is the quantum yield S2 is the rear surface recombination velocity (RSRV) rd is the radius of the detector in PCR and =2 f with f the modulation frequency
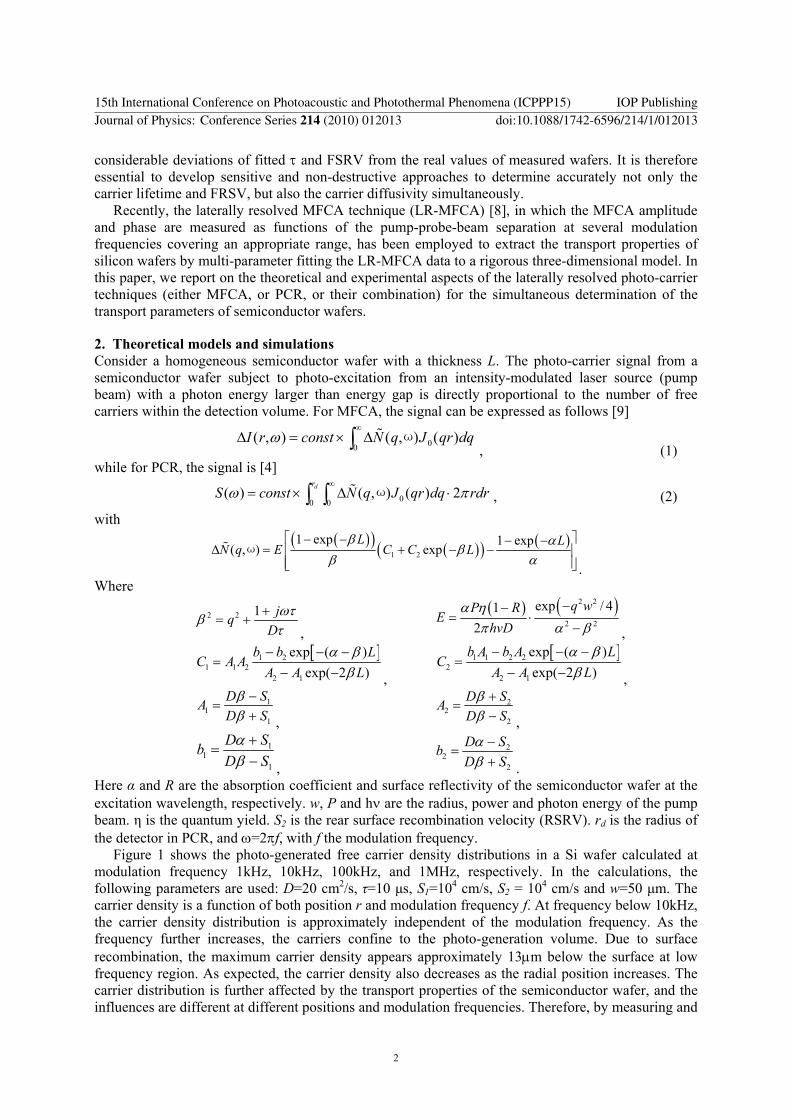
Figure 1 shows the photo-generated free carrier density distributions in a Si wafer calculated at modulation frequency 1kHz 10kHz 100kHz and 1MHz respectively In the calculations the following parameters are used D=20 cm2s =10 s S1=104 cms S2 = 104 cms and w=50 m The carrier density is a function of both position r and modulation frequency f At frequency below 10kHz the carrier density distribution is approximately independent of the modulation frequency As the frequency further increases the carriers confine to the photo-generation volume Due to surface recombination the maximum carrier density appears approximately 13 m below the surface at low frequency region As expected the carrier density also decreases as the radial position increases The carrier distribution is further affected by the transport properties of the semiconductor wafer and the influences are different at different positions and modulation frequencies Therefore by measuring and
15th International Conference on Photoacoustic and Photothermal Phenomena (ICPPP15) IOP PublishingJournal of Physics Conference Series 214 (2010) 012013 doi1010881742-65962141012013
2
multi-parameter fitting the modulation-frequency-dependent carrier distributions to the rigorous theoretical model the transport properties can be simultaneously determined
Figure 1 Photo-generated free carrier density distributions calculated at modulation frequency 1kHz 10kHz 100kHz and 1MHz respectively
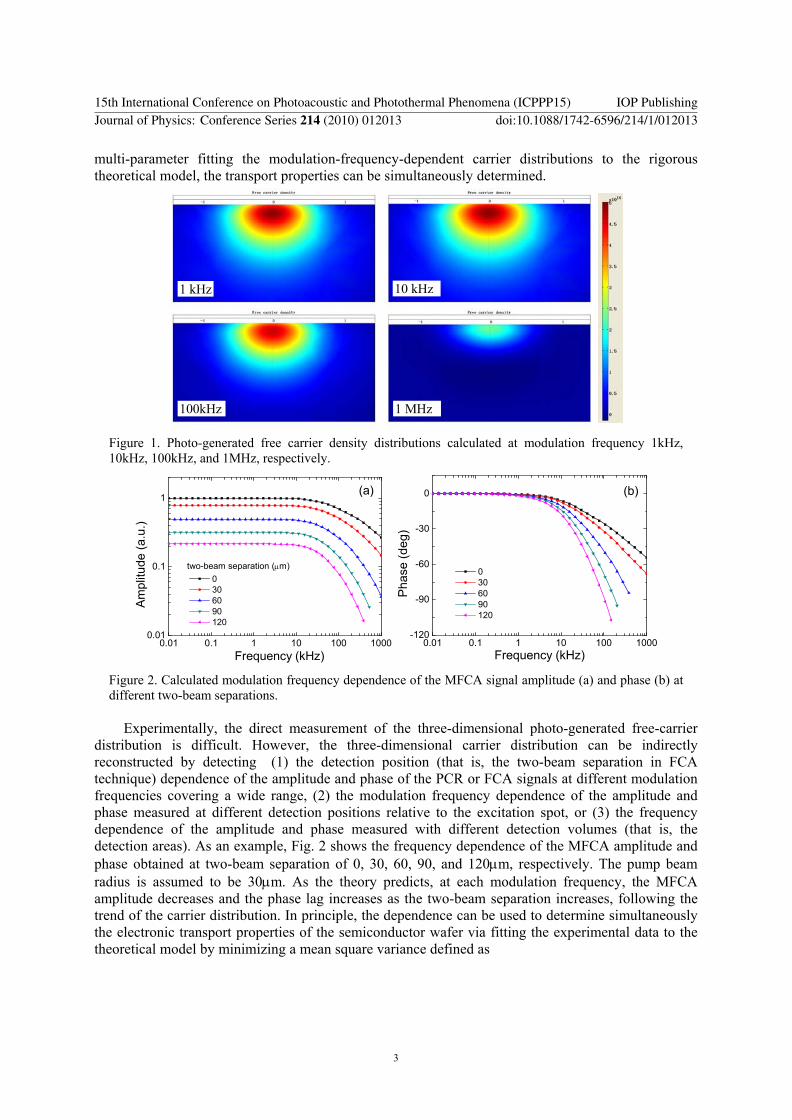
Figure 2 Calculated modulation frequency dependence of the MFCA signal amplitude (a) and phase (b) at different two-beam separations
Experimentally the direct measurement of the three-dimensional photo-generated free-carrier distribution is difficult However the three-dimensional carrier distribution can be indirectly reconstructed by detecting (1) the detection position (that is the two-beam separation in FCA technique) dependence of the amplitude and phase of the PCR or FCA signals at different modulation frequencies covering a wide range (2) the modulation frequency dependence of the amplitude and phase measured at different detection positions relative to the excitation spot or (3) the frequency dependence of the amplitude and phase measured with different detection volumes (that is the detection areas) As an example Fig 2 shows the frequency dependence of the MFCA amplitude and phase obtained at two-beam separation of 0 30 60 90 and 120 m respectively The pump beam radius is assumed to be 30 m As the theory predicts at each modulation frequency the MFCA amplitude decreases and the phase lag increases as the two-beam separation increases following the trend of the carrier distribution In principle the dependence can be used to determine simultaneously the electronic transport properties of the semiconductor wafer via fitting the experimental data to the theoretical model by minimizing a mean square variance defined as
001 01 1 10 100 1000001
01
1
two-beam separation ( m)
Am
plitu
de (a
u)
Frequency (kHz)
0 30 60 90 120
(a)
001 01 1 10 100 1000-120
-90
-60
-30
0
Pha
se (d
eg)
Frequency (kHz)
0 30 60 90 120
(b)
10 kHz1 kHz
100kHz 1 MHz
15th International Conference on Photoacoustic and Photothermal Phenomena (ICPPP15) IOP PublishingJournal of Physics Conference Series 214 (2010) 012013 doi1010881742-65962141012013
3
2
2
11
21
1
1 1var
jj
j
NNT j i
T j i E j im i E j i iN
j jE j i
i
A f rf r f rA f r
m Nf r
(3)
Here AT(fj ri) T(fj ri) and AE(fj ri) E(fj ri) are the theoretical and experimental amplitude and phase at modulation frequency fj and two-beam separation ri respectively Nj is the total number of data points at modulation frequency fj and m is the number of different modulation frequencies covering an appropriate range Normally three transport parameters ie the carrier lifetime the carrier diffusivity and FSRV are simultaneously determined by multi-parameter fitting The RSRV is fixed to a typical value during the fitting procedure
Figure 3 Simulated sensitivities of the square variance to the transport parameters for (a) combined MFCA and PCR data and (b) MFCA data measured at 3 two-beam separations of 30 60 90 m The uniqueness and uncertainty range of the multi-parameter fitted results are determined by the
sensitivities of the square variance to individual transport parameter The sensitivities can be investigated by calculating the dependence of the variance on each transport parameter In the calculations the simulated MFCA or PCR data are fitted by changing one transport parameter and keeping the other two as free parameters to minimize the square variance in a multi-parameter fitting procedure Figure 3 shows the variance versus the deviations of the transport parameters for fitting the frequency dependence of (a) combined MFCA and PCR signals and (b) MFCA signals measured at 3 two-beam separations In (a) both MFCA and PCR signals are measured at the excitation spot The MFCA signals are detected with a probe beam with 25 m-diameter and the PCR signals are detected with a detector with 1mm-diameter while the pump beam radius is assumed to be 15 m In (b) the pump beam radius is assumed to be 30 m and the frequency dependence are measured with two-beam separation of 30 60 and 90 m respectively If we assume the acceptable variance levels are 1 10-4 and 2 10-4 respectively taking into consideration the fact that the signal amplitude decreases with increasing two-beam separation the uncertainty ranges are D 79 62 and S1 119 for case (a) and D 29 253 and S1 427 for case (b) respectively These uncertainty ranges are significantly better than that obtained with a single frequency scan in conventional photo-carrier techniques which normally are in the ranges of 30 for D and and over 50 for S1 respectively In addition the accurate determination of the carrier diffusivity could significantly improve the uncertainty ranges of the lifetime and FSRV which are sensitive to the error of the diffusivity value due to the inter-correlations among the three transport parameters in the conventional photo-carrier techniques
-50 -25 0 25 5010-8
10-7
10-6
10-5
10-4
10-3
10-2
10-1
Mea
n S
quar
e V
aria
nce
Deviation ()
lifetime Diffusion Coefficient FSRV
(a)
-50 -25 0 25 5010-8
10-7
10-6
10-5
10-4
10-3
10-2
10-1
Mea
n sq
uare
var
ianc
e
Deviation ()
D
s1
(b)
15th International Conference on Photoacoustic and Photothermal Phenomena (ICPPP15) IOP PublishingJournal of Physics Conference Series 214 (2010) 012013 doi1010881742-65962141012013
4
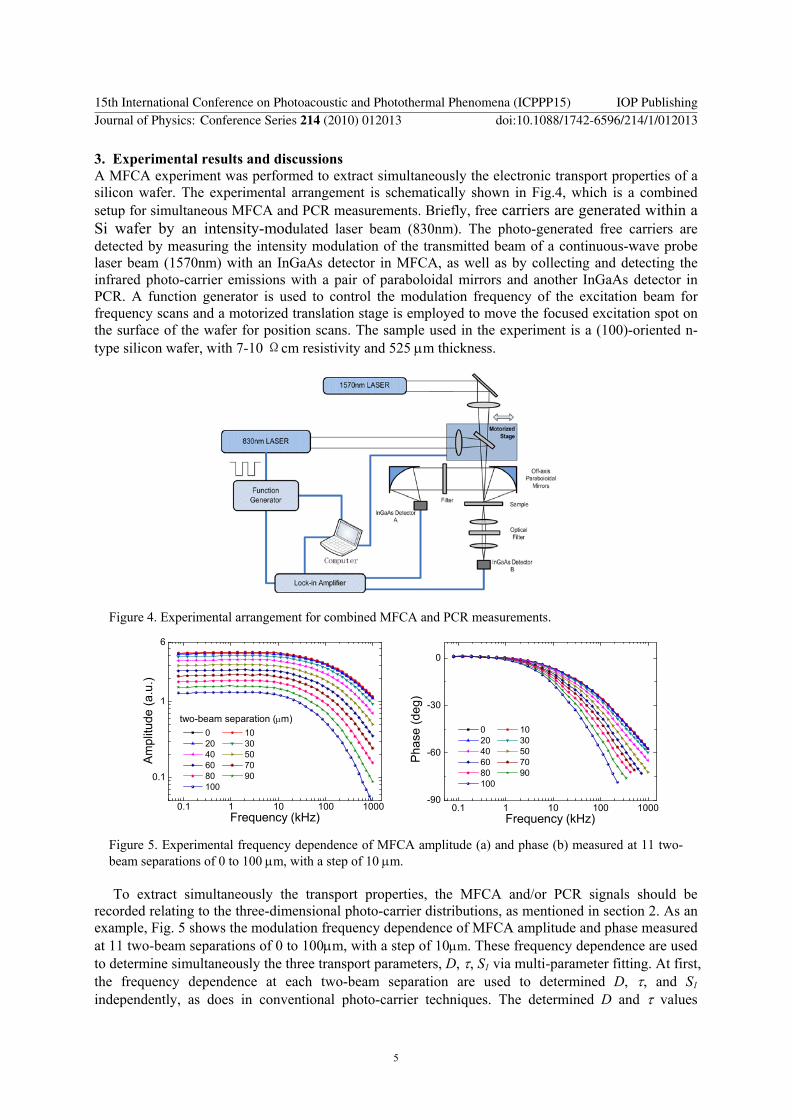
3 Experimental results and discussions A MFCA experiment was performed to extract simultaneously the electronic transport properties of a silicon wafer The experimental arrangement is schematically shown in Fig4 which is a combined setup for simultaneous MFCA and PCR measurements Briefly free carriers are generated within a Si wafer by an intensity-modulated laser beam (830nm) The photo-generated free carriers are detected by measuring the intensity modulation of the transmitted beam of a continuous-wave probe laser beam (1570nm) with an InGaAs detector in MFCA as well as by collecting and detecting the infrared photo-carrier emissions with a pair of paraboloidal mirrors and another InGaAs detector in PCR A function generator is used to control the modulation frequency of the excitation beam for frequency scans and a motorized translation stage is employed to move the focused excitation spot on the surface of the wafer for position scans The sample used in the experiment is a (100)-oriented n-type silicon wafer with 7-10 cm resistivity and 525 m thickness
Figure 4 Experimental arrangement for combined MFCA and PCR measurements
Figure 5 Experimental frequency dependence of MFCA amplitude (a) and phase (b) measured at 11 two-beam separations of 0 to 100 m with a step of 10 m To extract simultaneously the transport properties the MFCA andor PCR signals should be
recorded relating to the three-dimensional photo-carrier distributions as mentioned in section 2 As an example Fig 5 shows the modulation frequency dependence of MFCA amplitude and phase measured at 11 two-beam separations of 0 to 100 m with a step of 10 m These frequency dependence are used to determine simultaneously the three transport parameters D S1 via multi-parameter fitting At first the frequency dependence at each two-beam separation are used to determined D and S1 independently as does in conventional photo-carrier techniques The determined D and values
01 1 10 100 1000
01
1
6
Am
plitu
de (a
u)
Frequency (kHz)
0 10 20 30 40 50 60 70 80 90 100
two-beam separation ( m)
01 1 10 100 1000-90
-60
-30
0
Pha
se (d
eg)
Frequency (kHz)
0 10 20 30 40 50 60 70 80 90 100
15th International Conference on Photoacoustic and Photothermal Phenomena (ICPPP15) IOP PublishingJournal of Physics Conference Series 214 (2010) 012013 doi1010881742-65962141012013
5
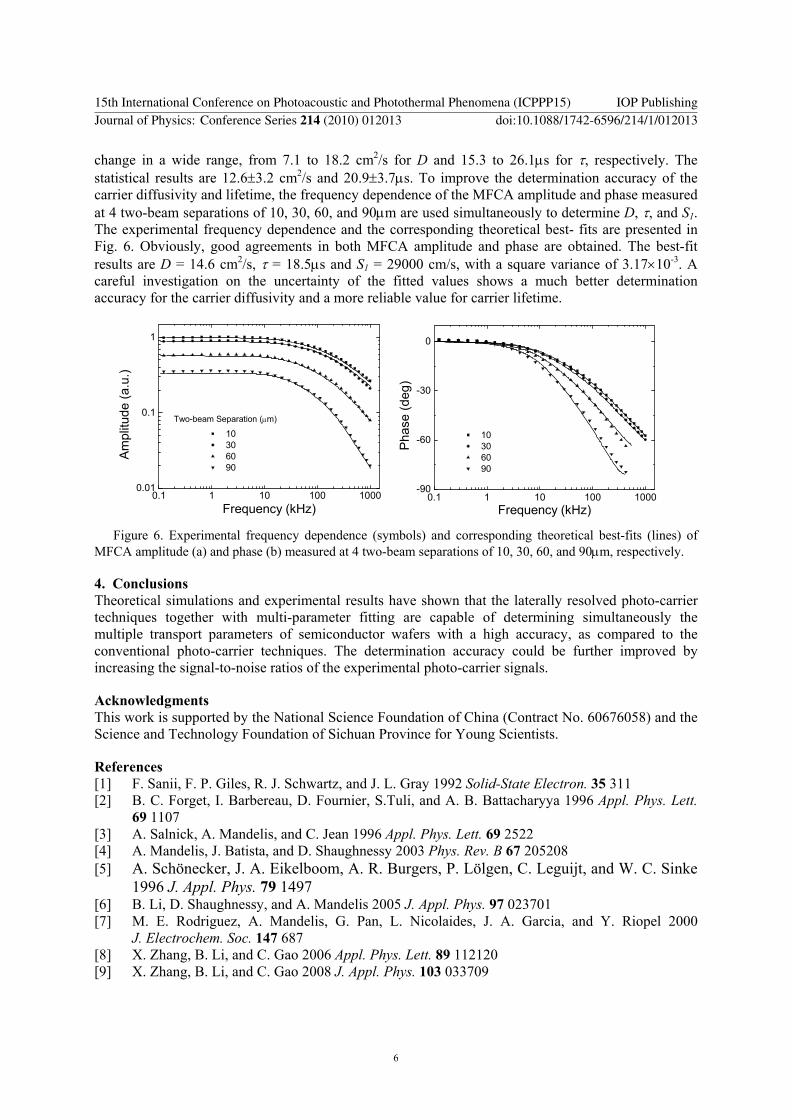
change in a wide range from 71 to 182 cm2s for D and 153 to 261 s for respectively The statistical results are 126 32 cm2s and 209 37 s To improve the determination accuracy of the carrier diffusivity and lifetime the frequency dependence of the MFCA amplitude and phase measured at 4 two-beam separations of 10 30 60 and 90 m are used simultaneously to determine D and S1 The experimental frequency dependence and the corresponding theoretical best- fits are presented in Fig 6 Obviously good agreements in both MFCA amplitude and phase are obtained The best-fit results are D = 146 cm2s = 185 s and S1 = 29000 cms with a square variance of 317 10-3 A careful investigation on the uncertainty of the fitted values shows a much better determination accuracy for the carrier diffusivity and a more reliable value for carrier lifetime
Figure 6 Experimental frequency dependence (symbols) and corresponding theoretical best-fits (lines) of MFCA amplitude (a) and phase (b) measured at 4 two-beam separations of 10 30 60 and 90 m respectively
4 Conclusions Theoretical simulations and experimental results have shown that the laterally resolved photo-carrier techniques together with multi-parameter fitting are capable of determining simultaneously the multiple transport parameters of semiconductor wafers with a high accuracy as compared to the conventional photo-carrier techniques The determination accuracy could be further improved by increasing the signal-to-noise ratios of the experimental photo-carrier signals
Acknowledgments This work is supported by the National Science Foundation of China (Contract No 60676058) and the Science and Technology Foundation of Sichuan Province for Young Scientists
References [1] F Sanii F P Giles R J Schwartz and J L Gray 1992 Solid-State Electron 35 311 [2] B C Forget I Barbereau D Fournier STuli and A B Battacharyya 1996 Appl Phys Lett
69 1107 [3] A Salnick A Mandelis and C Jean 1996 Appl Phys Lett 69 2522 [4] A Mandelis J Batista and D Shaughnessy 2003 Phys Rev B 67 205208 [5] A Schoumlnecker J A Eikelboom A R Burgers P Loumllgen C Leguijt and W C Sinke
1996 J Appl Phys 79 1497 [6] B Li D Shaughnessy and A Mandelis 2005 J Appl Phys 97 023701 [7] M E Rodriguez A Mandelis G Pan L Nicolaides J A Garcia and Y Riopel 2000
J Electrochem Soc 147 687 [8] X Zhang B Li and C Gao 2006 Appl Phys Lett 89 112120 [9] X Zhang B Li and C Gao 2008 J Appl Phys 103 033709
01 1 10 100 1000001
01
1
10 30 60 90
Am
plitu
de (a
u)
Frequency (kHz)
Two-beam Separation ( m)
01 1 10 100 1000-90
-60
-30
0
10 30 60 90
Pha
se (d
eg)
Frequency (kHz)
15th International Conference on Photoacoustic and Photothermal Phenomena (ICPPP15) IOP PublishingJournal of Physics Conference Series 214 (2010) 012013 doi1010881742-65962141012013
6

Accurate determination of electronic transport properties of semiconductor wafers with spatially resolved photo-carrier techniques
Bincheng Li Xianming Liu Wei Li Qiuping Huang and Xiren Zhang Institute of Optics and Electronics Chinese Academy of Sciences P O Box 350 Shuangliu Chengdu Sichuan 610209 China
Corresponding authorrsquos email address bcliioeaccn
Abstract Spatially resolved photo-carrier techniques in which a modulated and tightly focused laser beam with photon energy larger than the band gap of the semiconductor material under investigation is employed to generate free carriers are applied to the simultaneous determination of the electronic transport properties of semiconductor wafers that is the carrier lifetime the carrier diffusivity and the front surface recombination velocity The simultaneous determination is fulfilled by measuring and multi-parameter fitting the modulation-frequency-dependent three-dimensional distribution of photo-generated free carriers in a semiconductor wafer to a rigorous three-dimensional theoretical model The uncertainties of the fitted parameter values are analyzed by investigating the dependence of a mean square variance including both amplitude and phase errors on the corresponding transport parameters and compared to that obtained by the conventional frequency-scan approach in which only the frequency dependence of the amplitude and phase of the photo-carrier signals are recorded at the excitation spot Both theoretical simulations and experimental results show that the accuracy of the simultaneous multi-parameter determination is greatly improved by the spatially resolved information of the photo-generated free-carrier diffusion in the semiconductor wafers
1 Introduction In order to control the quality performance and reliability of silicon-based micro-electronic devices the electronic transport properties ie the carrier lifetime ( ) the carrier diffusivity (D) and the front surface recombination velocity (FSRV) (S1) of silicon wafers have to be determined accurately In the past various photo-excitation based methods such as modulated free carrier absorption (MFCA) [1] photo-modulated thermoreflectance (PMR) [2] infrared photothermal radiometry (PTR) [3] and photo-carrier radiometry (PCR) [4] have been developed to determine the transport properties of silicon wafers In these approaches the transport properties of semiconductor wafers are determined simultaneously by multi-parameter fitting the modulation frequency dependence of the signal amplitude and phase measured at the excitation spot to a rigorous theoretical model However careful investigations have shown that only when the carrier diffusivity D is known in prior with high precision the carrier lifetime and FSRV values determined by the simultaneous multi-parameter fitting are acceptable [5 6] In practice the carrier diffusivities of most wafers vary in a wide range depending on the injection level and process parameters [7] An inaccurate D value could cause
15th International Conference on Photoacoustic and Photothermal Phenomena (ICPPP15) IOP PublishingJournal of Physics Conference Series 214 (2010) 012013 doi1010881742-65962141012013
ccopy 2010 IOP Publishing Ltd 1
considerable deviations of fitted and FSRV from the real values of measured wafers It is therefore essential to develop sensitive and non-destructive approaches to determine accurately not only the carrier lifetime and FRSV but also the carrier diffusivity simultaneously
Recently the laterally resolved MFCA technique (LR-MFCA) [8] in which the MFCA amplitude and phase are measured as functions of the pump-probe-beam separation at several modulation frequencies covering an appropriate range has been employed to extract the transport properties of silicon wafers by multi-parameter fitting the LR-MFCA data to a rigorous three-dimensional model In this paper we report on the theoretical and experimental aspects of the laterally resolved photo-carrier techniques (either MFCA or PCR or their combination) for the simultaneous determination of the transport parameters of semiconductor wafers
2 Theoretical models and simulations Consider a homogeneous semiconductor wafer with a thickness L The photo-carrier signal from a semiconductor wafer subject to photo-excitation from an intensity-modulated laser source (pump beam) with a photon energy larger than energy gap is directly proportional to the number of free carriers within the detection volume For MFCA the signal can be expressed as follows [9]
00( ) ( ) ( )I r const N q J qr dq
(1) while for PCR the signal is [4]
00 0( ) ( ) ( ) 2drS const N q J qr dq rdr (2)
with
1 2
1 exp 1 exp( ) exp
L LN q E C C L
Where
2 2 1 jqD
2 2
2 2
exp 412
q wP RE
hvD 1 2
1 1 22 1
exp ( )exp( 2 )
b b LC A A
A A L 1 1 2 2
22 1
exp ( )exp( 2 )
b A b A LC
A A L 1
11
D SAD S
22
2
D SAD S
11
1
D SbD S
22
2
D SbD S
Here and R are the absorption coefficient and surface reflectivity of the semiconductor wafer at the excitation wavelength respectively w P and h are the radius power and photon energy of the pump beam is the quantum yield S2 is the rear surface recombination velocity (RSRV) rd is the radius of the detector in PCR and =2 f with f the modulation frequency
Figure 1 shows the photo-generated free carrier density distributions in a Si wafer calculated at modulation frequency 1kHz 10kHz 100kHz and 1MHz respectively In the calculations the following parameters are used D=20 cm2s =10 s S1=104 cms S2 = 104 cms and w=50 m The carrier density is a function of both position r and modulation frequency f At frequency below 10kHz the carrier density distribution is approximately independent of the modulation frequency As the frequency further increases the carriers confine to the photo-generation volume Due to surface recombination the maximum carrier density appears approximately 13 m below the surface at low frequency region As expected the carrier density also decreases as the radial position increases The carrier distribution is further affected by the transport properties of the semiconductor wafer and the influences are different at different positions and modulation frequencies Therefore by measuring and
15th International Conference on Photoacoustic and Photothermal Phenomena (ICPPP15) IOP PublishingJournal of Physics Conference Series 214 (2010) 012013 doi1010881742-65962141012013
2
multi-parameter fitting the modulation-frequency-dependent carrier distributions to the rigorous theoretical model the transport properties can be simultaneously determined
Figure 1 Photo-generated free carrier density distributions calculated at modulation frequency 1kHz 10kHz 100kHz and 1MHz respectively
Figure 2 Calculated modulation frequency dependence of the MFCA signal amplitude (a) and phase (b) at different two-beam separations
Experimentally the direct measurement of the three-dimensional photo-generated free-carrier distribution is difficult However the three-dimensional carrier distribution can be indirectly reconstructed by detecting (1) the detection position (that is the two-beam separation in FCA technique) dependence of the amplitude and phase of the PCR or FCA signals at different modulation frequencies covering a wide range (2) the modulation frequency dependence of the amplitude and phase measured at different detection positions relative to the excitation spot or (3) the frequency dependence of the amplitude and phase measured with different detection volumes (that is the detection areas) As an example Fig 2 shows the frequency dependence of the MFCA amplitude and phase obtained at two-beam separation of 0 30 60 90 and 120 m respectively The pump beam radius is assumed to be 30 m As the theory predicts at each modulation frequency the MFCA amplitude decreases and the phase lag increases as the two-beam separation increases following the trend of the carrier distribution In principle the dependence can be used to determine simultaneously the electronic transport properties of the semiconductor wafer via fitting the experimental data to the theoretical model by minimizing a mean square variance defined as
001 01 1 10 100 1000001
01
1
two-beam separation ( m)
Am
plitu
de (a
u)
Frequency (kHz)
0 30 60 90 120
(a)
001 01 1 10 100 1000-120
-90
-60
-30
0
Pha
se (d
eg)
Frequency (kHz)
0 30 60 90 120
(b)
10 kHz1 kHz
100kHz 1 MHz
15th International Conference on Photoacoustic and Photothermal Phenomena (ICPPP15) IOP PublishingJournal of Physics Conference Series 214 (2010) 012013 doi1010881742-65962141012013
3
2
2
11
21
1
1 1var
jj
j
NNT j i
T j i E j im i E j i iN
j jE j i
i
A f rf r f rA f r
m Nf r
(3)
Here AT(fj ri) T(fj ri) and AE(fj ri) E(fj ri) are the theoretical and experimental amplitude and phase at modulation frequency fj and two-beam separation ri respectively Nj is the total number of data points at modulation frequency fj and m is the number of different modulation frequencies covering an appropriate range Normally three transport parameters ie the carrier lifetime the carrier diffusivity and FSRV are simultaneously determined by multi-parameter fitting The RSRV is fixed to a typical value during the fitting procedure
Figure 3 Simulated sensitivities of the square variance to the transport parameters for (a) combined MFCA and PCR data and (b) MFCA data measured at 3 two-beam separations of 30 60 90 m The uniqueness and uncertainty range of the multi-parameter fitted results are determined by the
sensitivities of the square variance to individual transport parameter The sensitivities can be investigated by calculating the dependence of the variance on each transport parameter In the calculations the simulated MFCA or PCR data are fitted by changing one transport parameter and keeping the other two as free parameters to minimize the square variance in a multi-parameter fitting procedure Figure 3 shows the variance versus the deviations of the transport parameters for fitting the frequency dependence of (a) combined MFCA and PCR signals and (b) MFCA signals measured at 3 two-beam separations In (a) both MFCA and PCR signals are measured at the excitation spot The MFCA signals are detected with a probe beam with 25 m-diameter and the PCR signals are detected with a detector with 1mm-diameter while the pump beam radius is assumed to be 15 m In (b) the pump beam radius is assumed to be 30 m and the frequency dependence are measured with two-beam separation of 30 60 and 90 m respectively If we assume the acceptable variance levels are 1 10-4 and 2 10-4 respectively taking into consideration the fact that the signal amplitude decreases with increasing two-beam separation the uncertainty ranges are D 79 62 and S1 119 for case (a) and D 29 253 and S1 427 for case (b) respectively These uncertainty ranges are significantly better than that obtained with a single frequency scan in conventional photo-carrier techniques which normally are in the ranges of 30 for D and and over 50 for S1 respectively In addition the accurate determination of the carrier diffusivity could significantly improve the uncertainty ranges of the lifetime and FSRV which are sensitive to the error of the diffusivity value due to the inter-correlations among the three transport parameters in the conventional photo-carrier techniques
-50 -25 0 25 5010-8
10-7
10-6
10-5
10-4
10-3
10-2
10-1
Mea
n S
quar
e V
aria
nce
Deviation ()
lifetime Diffusion Coefficient FSRV
(a)
-50 -25 0 25 5010-8
10-7
10-6
10-5
10-4
10-3
10-2
10-1
Mea
n sq
uare
var
ianc
e
Deviation ()
D
s1
(b)
15th International Conference on Photoacoustic and Photothermal Phenomena (ICPPP15) IOP PublishingJournal of Physics Conference Series 214 (2010) 012013 doi1010881742-65962141012013
4
3 Experimental results and discussions A MFCA experiment was performed to extract simultaneously the electronic transport properties of a silicon wafer The experimental arrangement is schematically shown in Fig4 which is a combined setup for simultaneous MFCA and PCR measurements Briefly free carriers are generated within a Si wafer by an intensity-modulated laser beam (830nm) The photo-generated free carriers are detected by measuring the intensity modulation of the transmitted beam of a continuous-wave probe laser beam (1570nm) with an InGaAs detector in MFCA as well as by collecting and detecting the infrared photo-carrier emissions with a pair of paraboloidal mirrors and another InGaAs detector in PCR A function generator is used to control the modulation frequency of the excitation beam for frequency scans and a motorized translation stage is employed to move the focused excitation spot on the surface of the wafer for position scans The sample used in the experiment is a (100)-oriented n-type silicon wafer with 7-10 cm resistivity and 525 m thickness
Figure 4 Experimental arrangement for combined MFCA and PCR measurements
Figure 5 Experimental frequency dependence of MFCA amplitude (a) and phase (b) measured at 11 two-beam separations of 0 to 100 m with a step of 10 m To extract simultaneously the transport properties the MFCA andor PCR signals should be
recorded relating to the three-dimensional photo-carrier distributions as mentioned in section 2 As an example Fig 5 shows the modulation frequency dependence of MFCA amplitude and phase measured at 11 two-beam separations of 0 to 100 m with a step of 10 m These frequency dependence are used to determine simultaneously the three transport parameters D S1 via multi-parameter fitting At first the frequency dependence at each two-beam separation are used to determined D and S1 independently as does in conventional photo-carrier techniques The determined D and values
01 1 10 100 1000
01
1
6
Am
plitu
de (a
u)
Frequency (kHz)
0 10 20 30 40 50 60 70 80 90 100
two-beam separation ( m)
01 1 10 100 1000-90
-60
-30
0
Pha
se (d
eg)
Frequency (kHz)
0 10 20 30 40 50 60 70 80 90 100
15th International Conference on Photoacoustic and Photothermal Phenomena (ICPPP15) IOP PublishingJournal of Physics Conference Series 214 (2010) 012013 doi1010881742-65962141012013
5
change in a wide range from 71 to 182 cm2s for D and 153 to 261 s for respectively The statistical results are 126 32 cm2s and 209 37 s To improve the determination accuracy of the carrier diffusivity and lifetime the frequency dependence of the MFCA amplitude and phase measured at 4 two-beam separations of 10 30 60 and 90 m are used simultaneously to determine D and S1 The experimental frequency dependence and the corresponding theoretical best- fits are presented in Fig 6 Obviously good agreements in both MFCA amplitude and phase are obtained The best-fit results are D = 146 cm2s = 185 s and S1 = 29000 cms with a square variance of 317 10-3 A careful investigation on the uncertainty of the fitted values shows a much better determination accuracy for the carrier diffusivity and a more reliable value for carrier lifetime
Figure 6 Experimental frequency dependence (symbols) and corresponding theoretical best-fits (lines) of MFCA amplitude (a) and phase (b) measured at 4 two-beam separations of 10 30 60 and 90 m respectively
4 Conclusions Theoretical simulations and experimental results have shown that the laterally resolved photo-carrier techniques together with multi-parameter fitting are capable of determining simultaneously the multiple transport parameters of semiconductor wafers with a high accuracy as compared to the conventional photo-carrier techniques The determination accuracy could be further improved by increasing the signal-to-noise ratios of the experimental photo-carrier signals
Acknowledgments This work is supported by the National Science Foundation of China (Contract No 60676058) and the Science and Technology Foundation of Sichuan Province for Young Scientists
References [1] F Sanii F P Giles R J Schwartz and J L Gray 1992 Solid-State Electron 35 311 [2] B C Forget I Barbereau D Fournier STuli and A B Battacharyya 1996 Appl Phys Lett
69 1107 [3] A Salnick A Mandelis and C Jean 1996 Appl Phys Lett 69 2522 [4] A Mandelis J Batista and D Shaughnessy 2003 Phys Rev B 67 205208 [5] A Schoumlnecker J A Eikelboom A R Burgers P Loumllgen C Leguijt and W C Sinke
1996 J Appl Phys 79 1497 [6] B Li D Shaughnessy and A Mandelis 2005 J Appl Phys 97 023701 [7] M E Rodriguez A Mandelis G Pan L Nicolaides J A Garcia and Y Riopel 2000
J Electrochem Soc 147 687 [8] X Zhang B Li and C Gao 2006 Appl Phys Lett 89 112120 [9] X Zhang B Li and C Gao 2008 J Appl Phys 103 033709
01 1 10 100 1000001
01
1
10 30 60 90
Am
plitu
de (a
u)
Frequency (kHz)
Two-beam Separation ( m)
01 1 10 100 1000-90
-60
-30
0
10 30 60 90
Pha
se (d
eg)
Frequency (kHz)
15th International Conference on Photoacoustic and Photothermal Phenomena (ICPPP15) IOP PublishingJournal of Physics Conference Series 214 (2010) 012013 doi1010881742-65962141012013
6

2
2
11
21
1
1 1var
jj
j
NNT j i
T j i E j im i E j i iN
j jE j i
i
A f rf r f rA f r
m Nf r
(3)
Here AT(fj ri) T(fj ri) and AE(fj ri) E(fj ri) are the theoretical and experimental amplitude and phase at modulation frequency fj and two-beam separation ri respectively Nj is the total number of data points at modulation frequency fj and m is the number of different modulation frequencies covering an appropriate range Normally three transport parameters ie the carrier lifetime the carrier diffusivity and FSRV are simultaneously determined by multi-parameter fitting The RSRV is fixed to a typical value during the fitting procedure
Figure 3 Simulated sensitivities of the square variance to the transport parameters for (a) combined MFCA and PCR data and (b) MFCA data measured at 3 two-beam separations of 30 60 90 m The uniqueness and uncertainty range of the multi-parameter fitted results are determined by the
sensitivities of the square variance to individual transport parameter The sensitivities can be investigated by calculating the dependence of the variance on each transport parameter In the calculations the simulated MFCA or PCR data are fitted by changing one transport parameter and keeping the other two as free parameters to minimize the square variance in a multi-parameter fitting procedure Figure 3 shows the variance versus the deviations of the transport parameters for fitting the frequency dependence of (a) combined MFCA and PCR signals and (b) MFCA signals measured at 3 two-beam separations In (a) both MFCA and PCR signals are measured at the excitation spot The MFCA signals are detected with a probe beam with 25 m-diameter and the PCR signals are detected with a detector with 1mm-diameter while the pump beam radius is assumed to be 15 m In (b) the pump beam radius is assumed to be 30 m and the frequency dependence are measured with two-beam separation of 30 60 and 90 m respectively If we assume the acceptable variance levels are 1 10-4 and 2 10-4 respectively taking into consideration the fact that the signal amplitude decreases with increasing two-beam separation the uncertainty ranges are D 79 62 and S1 119 for case (a) and D 29 253 and S1 427 for case (b) respectively These uncertainty ranges are significantly better than that obtained with a single frequency scan in conventional photo-carrier techniques which normally are in the ranges of 30 for D and and over 50 for S1 respectively In addition the accurate determination of the carrier diffusivity could significantly improve the uncertainty ranges of the lifetime and FSRV which are sensitive to the error of the diffusivity value due to the inter-correlations among the three transport parameters in the conventional photo-carrier techniques
-50 -25 0 25 5010-8
10-7
10-6
10-5
10-4
10-3
10-2
10-1
Mea
n S
quar
e V
aria
nce
Deviation ()
lifetime Diffusion Coefficient FSRV
(a)
-50 -25 0 25 5010-8
10-7
10-6
10-5
10-4
10-3
10-2
10-1
Mea
n sq
uare
var
ianc
e
Deviation ()
D
s1
(b)
15th International Conference on Photoacoustic and Photothermal Phenomena (ICPPP15) IOP PublishingJournal of Physics Conference Series 214 (2010) 012013 doi1010881742-65962141012013
4
3 Experimental results and discussions A MFCA experiment was performed to extract simultaneously the electronic transport properties of a silicon wafer The experimental arrangement is schematically shown in Fig4 which is a combined setup for simultaneous MFCA and PCR measurements Briefly free carriers are generated within a Si wafer by an intensity-modulated laser beam (830nm) The photo-generated free carriers are detected by measuring the intensity modulation of the transmitted beam of a continuous-wave probe laser beam (1570nm) with an InGaAs detector in MFCA as well as by collecting and detecting the infrared photo-carrier emissions with a pair of paraboloidal mirrors and another InGaAs detector in PCR A function generator is used to control the modulation frequency of the excitation beam for frequency scans and a motorized translation stage is employed to move the focused excitation spot on the surface of the wafer for position scans The sample used in the experiment is a (100)-oriented n-type silicon wafer with 7-10 cm resistivity and 525 m thickness
Figure 4 Experimental arrangement for combined MFCA and PCR measurements
Figure 5 Experimental frequency dependence of MFCA amplitude (a) and phase (b) measured at 11 two-beam separations of 0 to 100 m with a step of 10 m To extract simultaneously the transport properties the MFCA andor PCR signals should be
recorded relating to the three-dimensional photo-carrier distributions as mentioned in section 2 As an example Fig 5 shows the modulation frequency dependence of MFCA amplitude and phase measured at 11 two-beam separations of 0 to 100 m with a step of 10 m These frequency dependence are used to determine simultaneously the three transport parameters D S1 via multi-parameter fitting At first the frequency dependence at each two-beam separation are used to determined D and S1 independently as does in conventional photo-carrier techniques The determined D and values
01 1 10 100 1000
01
1
6
Am
plitu
de (a
u)
Frequency (kHz)
0 10 20 30 40 50 60 70 80 90 100
two-beam separation ( m)
01 1 10 100 1000-90
-60
-30
0
Pha
se (d
eg)
Frequency (kHz)
0 10 20 30 40 50 60 70 80 90 100
15th International Conference on Photoacoustic and Photothermal Phenomena (ICPPP15) IOP PublishingJournal of Physics Conference Series 214 (2010) 012013 doi1010881742-65962141012013
5
change in a wide range from 71 to 182 cm2s for D and 153 to 261 s for respectively The statistical results are 126 32 cm2s and 209 37 s To improve the determination accuracy of the carrier diffusivity and lifetime the frequency dependence of the MFCA amplitude and phase measured at 4 two-beam separations of 10 30 60 and 90 m are used simultaneously to determine D and S1 The experimental frequency dependence and the corresponding theoretical best- fits are presented in Fig 6 Obviously good agreements in both MFCA amplitude and phase are obtained The best-fit results are D = 146 cm2s = 185 s and S1 = 29000 cms with a square variance of 317 10-3 A careful investigation on the uncertainty of the fitted values shows a much better determination accuracy for the carrier diffusivity and a more reliable value for carrier lifetime
Figure 6 Experimental frequency dependence (symbols) and corresponding theoretical best-fits (lines) of MFCA amplitude (a) and phase (b) measured at 4 two-beam separations of 10 30 60 and 90 m respectively
4 Conclusions Theoretical simulations and experimental results have shown that the laterally resolved photo-carrier techniques together with multi-parameter fitting are capable of determining simultaneously the multiple transport parameters of semiconductor wafers with a high accuracy as compared to the conventional photo-carrier techniques The determination accuracy could be further improved by increasing the signal-to-noise ratios of the experimental photo-carrier signals
Acknowledgments This work is supported by the National Science Foundation of China (Contract No 60676058) and the Science and Technology Foundation of Sichuan Province for Young Scientists
References [1] F Sanii F P Giles R J Schwartz and J L Gray 1992 Solid-State Electron 35 311 [2] B C Forget I Barbereau D Fournier STuli and A B Battacharyya 1996 Appl Phys Lett
69 1107 [3] A Salnick A Mandelis and C Jean 1996 Appl Phys Lett 69 2522 [4] A Mandelis J Batista and D Shaughnessy 2003 Phys Rev B 67 205208 [5] A Schoumlnecker J A Eikelboom A R Burgers P Loumllgen C Leguijt and W C Sinke
1996 J Appl Phys 79 1497 [6] B Li D Shaughnessy and A Mandelis 2005 J Appl Phys 97 023701 [7] M E Rodriguez A Mandelis G Pan L Nicolaides J A Garcia and Y Riopel 2000
J Electrochem Soc 147 687 [8] X Zhang B Li and C Gao 2006 Appl Phys Lett 89 112120 [9] X Zhang B Li and C Gao 2008 J Appl Phys 103 033709
01 1 10 100 1000001
01
1
10 30 60 90
Am
plitu
de (a
u)
Frequency (kHz)
Two-beam Separation ( m)
01 1 10 100 1000-90
-60
-30
0
10 30 60 90
Pha
se (d
eg)
Frequency (kHz)
15th International Conference on Photoacoustic and Photothermal Phenomena (ICPPP15) IOP PublishingJournal of Physics Conference Series 214 (2010) 012013 doi1010881742-65962141012013
6


![Determination and control of longshore sediment transport ......Ocean Engineering ] (]]]]) ]]]–]]] Determination and control of longshore sediment transport: A case study H. Anıl](https://img.pdfslide.us/doc/110x75/5f82634ad60b4d1ba13f8f56/determination-and-control-of-longshore-sediment-transport-ocean-engineering.jpg)