Embed Size (px)
Citation preview
JO URNA L O F RESEARCH of the Notional Bureau of Standards - C. Engi nee ring a nd Instrumentation Vol. 75C, Nos. 3 and 4, July-December 1971
I A Burnett Apparatus for the .Accurate Determination of Gas Compressibility Factors and Second Virial Coefficients, and an Evaluation of Its Capability Based on Some
Results for Argon and Carbon Dioxide
Meyer Waxman and John R. Hastings
Institute for Basic Standards, National Bureau of Standards, Washington, D.C. 20234
(June 2, 1971)
A Burn e tt a ppa ratu s has been deve lu pe d for th e de te rmina ti un uf th e cumpress ibilit y fac tu r uf gases, includin g corrus ive ha loge ni c gases, to a n accurac y of 0.1 pe rce nt to 0.01 pe rcent at te mpera tures fro m 0 to 225 °C and for pressures up to 250 ba rs. T he a ppa l'a tus has bee n used throughout thi s te mpe ra ture and press ure range and a t te mpe ratures within 15 °C of the c riti ca l te mpe ra ture of the sa mpl e gas. T he a ppa ra tu s fea lures a rugged ye t highl y sens iti ve and re prod ucibl e null-Iype press ure transdu ce r to isula te the sa mple gas witho ut inlrud uc in g a pressure uncert a int y grea te r tha n th e prec ision of the press ure measureme nts, whic h is be tt e r th an 1 pa rt in 50 ,000. The press ure measure ment s a re acc ura te to at leas t I pa rt in 20 ,000. Th e reduction of the da ta is di scussed ex tens ive ly. Th e ca pa bility of th e a ppa ra tu s ha s been evalua ted in te rm s of the compress ibilit y fac tor represented by a finit e pressure or densit y vi rial expans ion a nd de rived from a rgo n da ta a t 25 °C a nd press ures up to 250 ba rs and in te r ms of the secund vi ri a l cue ffi cie nt of ca rbon diox ide based on data at 50 °C a nd pressures be low 35 ba rs. Th e va lu e ubt ain ed fur thi s secund viria l c~e fli c i e nl. - 102 .2 ± O.2 cm"/ mol. com pa res fa vora bl y with th e va lue uf - 102.5 c m"/ mol ob ta in ed fro m a rece nt correla ti on a nd is in s ubstanti a l di sagree ment with th e va lu e of - 100.7 ± O.4 c m "/ mol de te rmin ed by Dad so n a nd cu· wo rk e rs fro m th e Burn e ll me thod and the pie zo me te r me thod .
Key words : Adsorption, gas on meta l; a rgon, co mpressibility fac tor of; Burnell data reduc tion ; carbon dioxide, seco nd viria l coe ffi c ient of: co mpress ibility fac to r; gas, compress ibility fac to r of; gas , PVT pru pe rti es ot ; meas urement s . gas : second vi ri a l coc Hic ie nl.
1. Introduction
Th e acc urate determination of the equation of s tate of a gas ove r a wide range of te mperature and pressure provides importa nt information about the gas both from a fundame ntal and an applied point of view. For example , the thermodynamic properties of a gas can be reliabl y extended beyond its ideal gas properties if its equation of s tate is known with sufficie nt accuracy. Equation of state data are convenie ntly represented by means of the co mpressibility fac tor. The compressibility factor Z is de fin ed in terms of the gas cons tant R a nd the meas urable gas variables pressure P, volume V, absolute temperature T, and quantity, expressed as the numbe r of moles n, by th e relationship
me nt of one (n) or both (n a nd V) of the difficult variables can be eliminated by the use of the viri al expansions of Z as a fun ction of P or of the de nsity p and the fact that the depende nce of Z on P is dominantly linear at suffic ie ntly low pressures and approaches the ideal gas law
Z = PV/ nRT. (1)
The accuracy of Z obtained from a s trai ghtforward measure me nt of each variable is limited by the accuracy with which the diffic ult measure ments · of n and V can be made. The direct or indirect measure-
Z = PV/nRT = 1 (2)
in the limit as P goes to zero [1,2]'1 The Burne tt PVT method [3-7] is an experimentally simplified me thod in which neither n nor Vis measured ; instead, accurate isoth ermal pressure measure me nts are made before and after ste pwise expansions betwee n two volum es. The decrease in the overall meas ure ment error achie ved by the elimination of n and V measure ments can in princ iple lead to more acc urate values of Z than can be obtained from a method requiring the measure ment of each variable in eq (1). For this reason we have developed a Burnett apparatus for the accurate dete rmination of the compressibility factor of gases,
I Figures in brac kets indicate the literature references at I-he end of this paper.
165
including corrosive halogenic gases [8] , at temperatures from 0 to 225 °C and for pressures up to 250 bars (1 bar = 105 N - m -2)_ The apparatus has been used by us throughout this temperature and pressure range including temperatures within 15 °C of the critical temperature of the sample gas_ The apparatus is equally well-suited and has been used for the accurate determination of second virial cOf'fficient~.
This paper is concerned with both the apparatus for obtaining Burnett data and the methods for reducing the data. These subjects are described briefly in the re mainder of this section. In the next section the apparatus is discussed in more detail, and its distinctive features are emphasized. Since the reduction of the data obtained with the apparatus is an essential element in the evaluation of its capability, the data reduction is discussed extensively in the following section. The discussion is illustrated with results for the compressibility factor of argon at 25 °C and pressures up to 250 bars and for the second virial coefficient of carbon dioxide at 50°C.
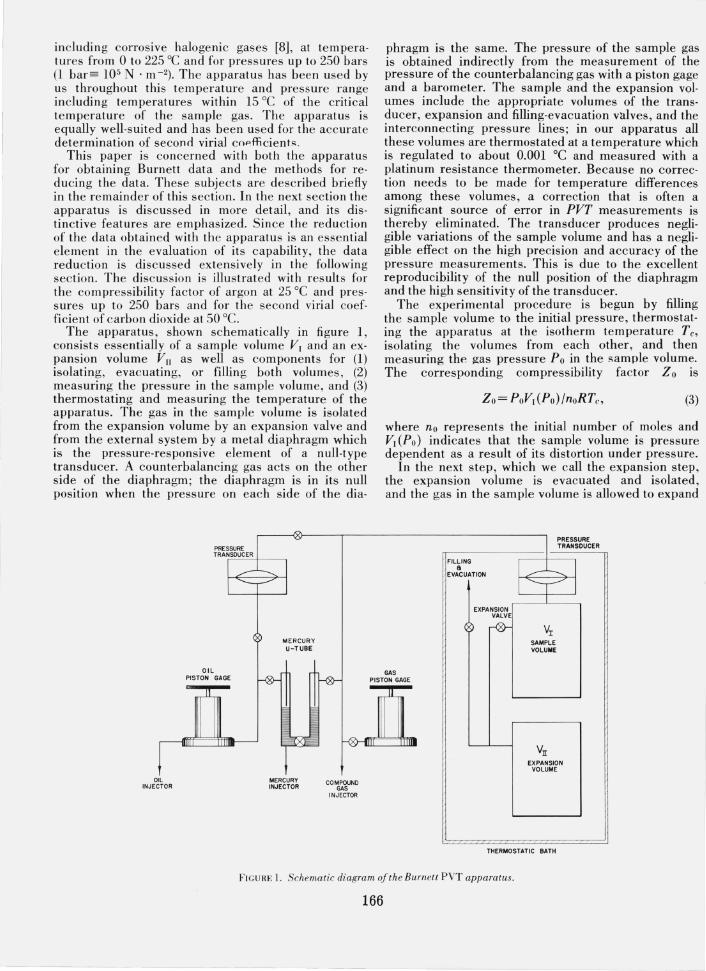
The apparatus, shown schematically in figure 1, consists essentially of a sample volume VI and an expansion volume VII as well as components for (1) isolating, evacuating, or filling both volumes, (2) measuring the pressure in the sample volume, and (3) thermostating and measuring the temperature of the apparatus. The gas in the sample volume is isolated from the expansion volume by an expansion valve and from the external system by a metal diaphragm which is the pressure-responsive element of a null-type transducer. A counterbalancing gas acts on the other side of the diaphragm; the diaphragm is in its null position when the pressure on each side of the dia-
[ o
INJEC TOR
n, <.Y
PRESSURE TRANSDUCER
I~ 1----.-----
C MERCURY u-rUBE
OIL PISTON GAGE -0--
.lL
I ~ f;, -
MERCURY INJECTOR
~
-0-
COMPOUND GAS
INJECTOR
phragm is the same. The pressure of the sample gas is obtained indirectly from the measurement of the pressure of the counterbalancing gas with a piston gage and a barometer. The sample and the expansion volumes include the appropriate volumes of the transducer, expansion and filling-evacuation valves, and the interconnecting pressure lines; in our apparatus all these volumes are thermostated at a temperature which is regulated to about 0.00l °C and measured with a platinum resistance thermometer. Because no correction needs to be made for temperature differences among these volumes, a correction that is often a significant source of error in PVT measurements is thereby eliminated. The transducer produces negligible variations of the sample volume and has a negligible effect on the high precision and accuracy of the pressure measurements. This is due to the excellent reproducibility of the null position of the diaphragm and the high sensitivity of the transducer.
The experimental procedure is begun by filling the sample volume to the initial pressure, thermostating the apparatus at the isotherm temperature Te,
isolating the volumes from each other, and then measuring thp- gas pressure Po in the sample volume. The corresponding compressibility factor Z 0 IS
(3)
where no represents the initial number of moles and VI (Po) indicates that the sample volume is pressure dependent as a result of its distortion under pressure.
In the next step, which we call the expansion step, the expansion volume is evacuated and isolated, and the gas in the sample volume is allowed to expand
I PRESSURE TRANSDUCER
FILLING
I ~I a EVACUATION
I ~I I
EXPANSION VALVE
@ -0-- VI SAMPLE VOLUME
GAS PISTON GAGE
JL
VJl EXPANSION
VOLUME
THERMOSTATIC BATH
FIGURE L Schematic diagram of the Burnell PVT apparatus.
166
into it. After tempe rature and pressure equilibration has occurred, the press ure P, of the gas that now occupies both volum es is measured. For this first expansion s tep th e compressibility factor Z I is
where no and T c are the same as in eq (3). By taking the ratio of eqs (3) and (4) and defining N, as the ratio of the combined sample and expansion volumes to the sample volume, i. e. , N, = [VI(P,) + VII(PdJ/VI(PO),
one obtains
(5)
In which N, depends slightly on both Po and PI . The ratio of the volumes can be written as N, = N[l + MY, (Po, P,) J, where N, known as th e cell constant, is the value of the volume ratio in the limit as the pressure goes to zero and MY, (Po, P,) is a cell constant correction for the dependence of the cell volumes on pressure.
Generally th e sample volume is isolated again and the expansion step is repeated for the reduced quantity of gas nl that is now in the sample volume. Thi s leads to a new press ure ratio, correspo nding to eq (5),
(6)
where N2 =N[1+MY2 (P" P2 )]. This procedure is usually repeated to successively lower pressures with the successively smaller quantities of gas that re main in the sample volume after each expansion until the lowest pressures that can be meas ured both accurately and precisely are reached. The generalized form of eqs (5) and (6) for the rth expansion is
Pr- ,/Pr= NrZr- ,/Z, .. (7)
The combination of eq (7) and the relationship P = pZRT, obtained from eq (1), leads to a correspond- . ing Burnett equation in terms of the density
(8)
Equations (7) and (8) are basic equations in the reduction of Burnett data and may be transformed into different relationships in which the compressibility factor is represented by a finite virial expansion in either pressure or density. Anyone of the relationships may be applied to Burne ll data to form an overdetermined set of equations for evaluating the virial coefficients and generally the cell cons tant by means of nonlinear
I statistics [9]. Regardless of the relationship used, the cell constant is not determined from volume measurements. In the data reduction the pressure corrections MY" !lN2, ... are not considered as unknown quantities but are estimated from theoretical and empirical distortion equations for pressure vessels or are deter-
2. Apparatus and Experimental Procedure
2.1. Burnett Vessel and Gas Manifold System
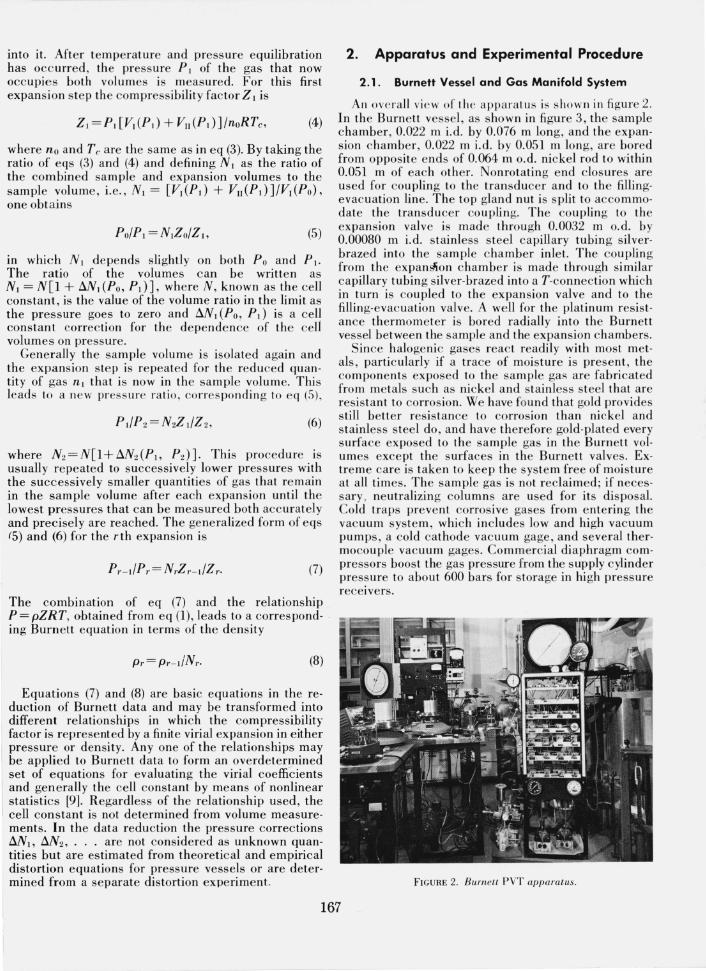
An overall vi e w of t he appa ra tu s is s how n in figure 2. In the Burnett vessel, as shown in fi gure 3, the sample chamber, 0.022 m i.d. by 0.076 m long, and the expansion chamber, 0.022 m i.d. by 0.051 m long, are bored from opposite ends of 0.064 m o.d. nickel rod to within 0.051 m of each other. Nonrotating e nd closures are used for coupling to the transducer and to th e fillingevacuation line. The top gland nut is split to accommodate the transdu cer coupling. The co upling to the expansion valve is made through 0.0032 m o.d. by 0.00080 m i.d. stainless s teel capillary tubing silverbrazed into the sample chamber inlet. The coupling from the expan~on chamber is made through similar capillary tubing silver-brazed into a T-connection which in turn is coupled to the expansion valve and to the fillin g-evacuation valve. A well for th e platinum resistance thermometer is bored radially into the Burnett vessel between the sample and the expansion chambers.
Since halogenic gases react readily with most metals, particularly if a trace of moisture is present, the components exposed to the sample gas are fabricated from metals such as nickel and stainless steel that are resistant to corros ion. We have found that gold provides s till better resistance to corrosion than ni ckel and stainless s teel do, and have therefore gold-plated every surface exposed to the sample gas in the Burnett volumes except the surfaces in the Burnett valves. Extreme care is tak en to keep the system free of moisture at all times. The sample gas is not reclaimed; if necessary , neutralizing columns are used for its di sposal. Cold traps prevent corrosive gases from e ntering the vacuum system, which includes low and high vacuum pumps, a cold cathode vacuum gage, and several thermocouple vacuum gages_ Commercial diaphragm compressors boost the gas pressure from the supply cylinder pressure to about 600 bars for s torage in high pressure receivers_
FIGU RE 2. Burnett PVT apparatus. I
mined from a separate distortion experime nt.
167
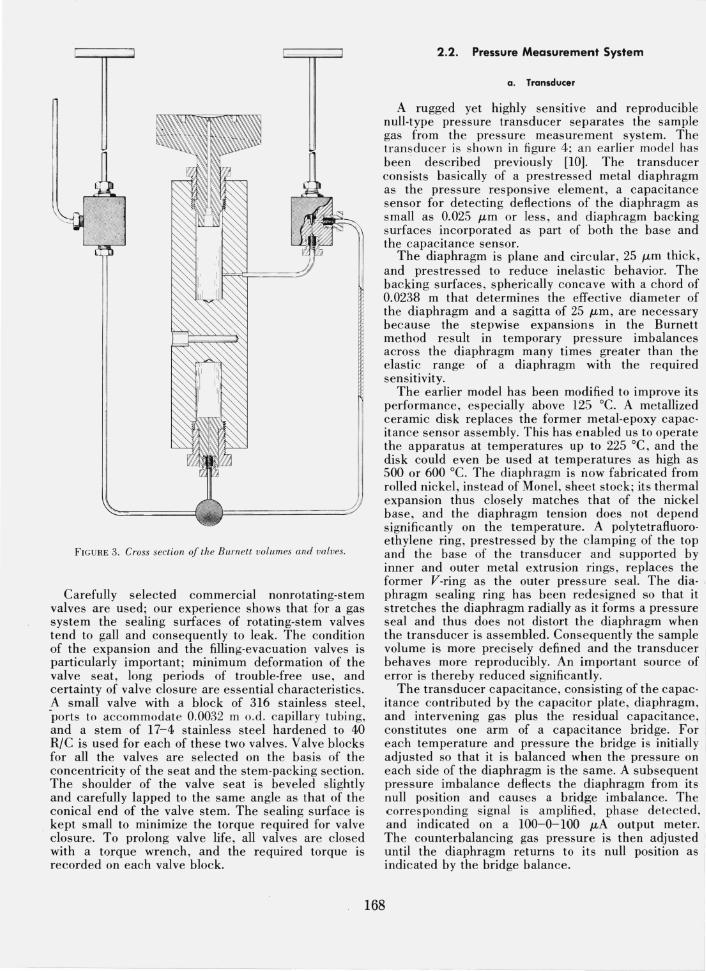
FIG URE 3. Cross section of the Burnett vo lumes and valves.
Carefully selected commercial nonrotating-stem valves are used; our experience shows that for a gas system the sealing surfaces of rotating-stem valves tend to gall and consequently to leak. The condition of the expansion and the filling-evacuation valves is particularly important; minimum deformation of the valve seat, long periods of trouble-free use, and certainty of valve closure are essential characteristics. A small valve with a block of 316 stainless steel, -ports to accommodate 0.0032 m o.d. capillary tubing, and a stem of 17-4 stainless steel hardened to 40 RIC is used for each of these two valves. Valve blocks for all the valves are selected on the basis of the concentricity of the seat and the stem-packing section. The shoulder of the valve seat is beveled slightly and carefully lapped to the same angle as that of the conical end of the valve stem. The sealing surface is kept small to minimize the torque required for valve closure. To prolong valve life, all valves are closed with a torque wrench, and the required torque is recorded on each valve block.
2.2. Pressure Measurement System
a. Transducer
A rugged yet highly sensitive and reproducible null-type pressure transducer separates the sample gas from the pressure measurement system. The transducer is shown in figure 4; an earlier model has been described previously [10]. The transducer consists basically of a prestressed metal diaphragm as the pressure responsive element, a capacitance sensor for detecting deflections of the diaphragm as small as 0.025 J-tm or less, and diaphragm backing surfaces incorporated as part of both the base and the capacitance sensor.
The diaphragm is plane and circ ular, 25 J-tm thick, I
and prest~essed to reduce inelastic behavior. The backing surfaces, spherically concave with a chord of 0.0238 m that determines the effective diameter of the diaphragm and a sagitta of 25 J-tm, are necessary because the stepwise expansions in the Burnett method result in temporary pressure imbalances across the diaphragm maI}y times greater than the elastic range of a diaphragm with the required sensitivity.
The earlier model has been modified to improve its performance, especially above 125°C. A metallized ceramic disk replaces the former metal-epoxy capacitance sensor assembly. This has enabled us to operate the apparatus at temperatures up to 225 °C, and the disk could even be used at temperatures as high as 500 or 600°C. The diaphragm is now fabricated from rolled nickel, instead of Monel, sheet stock; its thermal expansion thus closely matches that of the nickel base, and the diaphragm tension does not depend significantly on the temperature. A polytetrafluoroethylene ring, prestressed by the clamping of the top and the base of the transducer and supported by inner and outer metal extrusion rings, replaces the former V-ring as the outer pressure seal. The diaphragm sealing ring has been redesigned so that it stretches the diaphragm radially as it forms a pressure seal and thus does not distort the diaphragm when the transducer is assembled. Consequently the sample volume is more precisely defined and the transducer behaves more reproducibly. An important source of error is thereby reduced significantly.
The transducer capacitance, consisting of the capac· itance contributed by the capacitor plate, diaphragm, and intervening gas plus the residual capacitance, constitutes one arm of a capacitance bridge. For each temperature and pressure the bridge is initially adjusted so that it is balanced when the pressure on each side of the diaphragm is the same. A subsequent pressure imbalance deflects the diaphragm from its null position and causes a bridge imbalance. The corresponding signal is amplified, phase detected, and indicated on a 100-0-100 J-tA output meter. The counterbalancing gas pressure is then adjusted until the diaphragm returns to its null position as indicated by the bridge balance.
168
K A-A
6-6 M C-C
D-D
N
~----- E-E
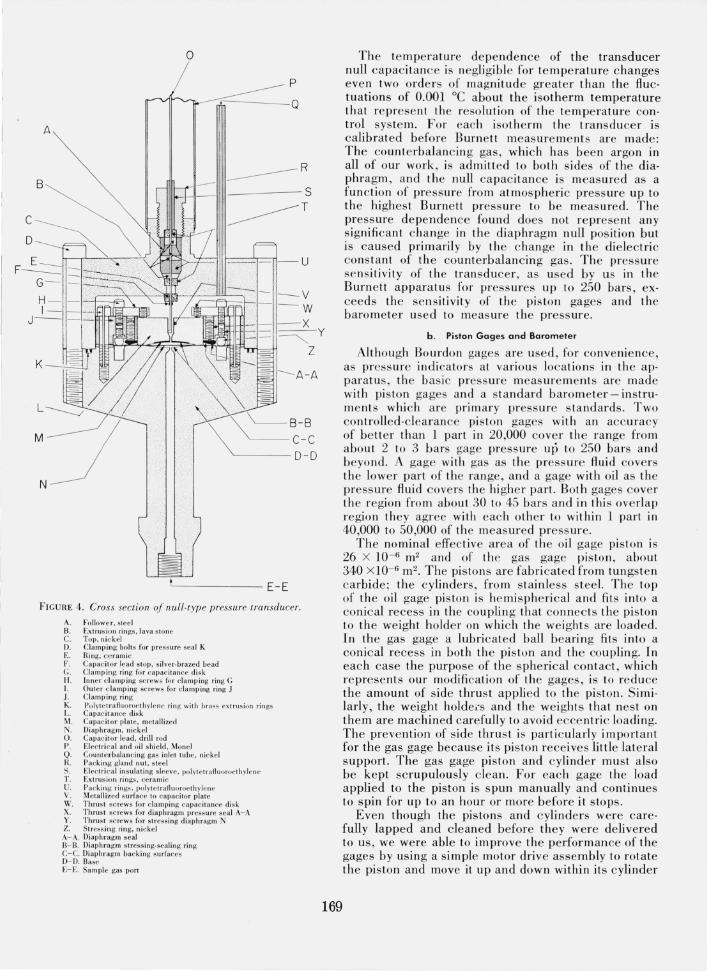
F IGURE 4 . Cross section oj nul/·type pressure tra.nsducer.
A. Followe r, steel B. Extrus io n ri ngs, lava Sl one C. Top, nic kel D. Clamping bolts for pressure seal K E. Ring, ceramic F. Capacitor lead stop, s ilvcl'- brazed bead C. Clamp ing ring for capac itance di s k H. Inne r clamping sc rews for clamping ring G I. O ut e r c lamping sc re ws for clamp ing ring J J. Ciam l)ing ring K. Puiyle lrafiuoroe lhyiene rin g wilh brass eXl rus ion rin gs L. Capacitance di s k M. Capac it or plat e, metalli zed N. Diaphragm, ni c kel O. Capac itor lead, drill rod P. Electri cal and oi l shie ld , Monel Q. Count erbalanc ing gas inle t tube, nic kel H. Packing gland nut, s tee l S. Elec tri cal insu lat ing s leeve , polyl clraflulH'oelh ylcnc T. Extrus io n ri ngs, ce ramic U. Packing rings . . poI Yle lrafluoroe th ylcnc V. Metall ized s urface to capac itor plat e W. Thrust screws for clampi ng capac it ance di s k X. Thrust screws for diaphragm pressure sea l A- A Y. Thrust screws for stressi ng diaphragm N Z. Stress ing ring , nickel A- A. Diaphragm seal B- B. Diaphragm s tressing-seali ng ring C- C. Diaphragm backing s urfaces D- D. Base £- E. Sam ple gas port
169
The temperature dependence of the transducer null capacita nce is negligible for te mperature changes even two orders of magnitude greater than the fluctuations of 0.001 °C abo ut the isotherm te mperature that represent the resolution of th e temperature control system . For each isotherm the transducer is calibra ted before Burn ett meas ureme nts are made: The counterbalancing gas, which has been argon in all of our work, is admitted to both sides of the diaphragm, and the null capacitance is measured as a function of pressure from atmospheric pre sure up to the highest Burnett pressure to be measured. The pressure dependence found does not re pre e nt any sign ificant c ha nge in the diaphragm null position but is caused primarily by th e c han ge in the dielectric constant of th e counterbala ncin g gas. The pressure se ns itivity of the transd uce r, as used by us in th e Burnett apparatus for pressures up to 250 bars, exceeds th e sensitivity of the piston gages and the barometer used to meas ure the pressure.
b . Piston Gages and Barometer
Although Bourdon gages are used , for co nvenie nce, as press ure in dicators at various locations in the apparatus, the bas ic press ure measure ments a re made with piston gages and a s tand ard barome ter-instruments which are prim ary pressure s tand ards. Two co ntrolled-clearance piston gages with an accu racy of be tter than 1 part in 20,000 cover the range from abo ut 2 to 3 bars gage pressure up to 250 bars and beyond. A gage with gas as the pressure fluid covers the lower part of the range, and a gage with oil as the pressu re fluid covers the hi gher part- Both gages cover th e region from about 30 to 45 bars and in this ove rl ap region they agree with each other to within 1 part in 40,000 to 50,000 of the measured pressure.
The nominal effective area of the oil gage piston is 26 X 10- 6 m2 a nd of the gas gage piston, about 340 x lO- 6 m2. The pistons are fabricated from tungsten carbide; the cylinders, from s tainless stee l. The top of the oil gage piston is he mis pherical a nd fits into a conical recess in the couplin g th at connects the piston to the weight holder on whi ch the weights are loaded. In the gas gage a lubricated ball bearing fits into a co nical recess in both the piston and the couplin g. In each case the purpose of the sphe ri cal contac t, which represents our modification of th e gages, is to redu ce the amount of side thrus t applied to the piston. Similarly , the weight holdei's and the weights that nest on them are machined carefully to avoid ecce ntri c loading. The prevention of side thrus t is parti cularly important for the gas gage because its pis ton recei ves ]jttle lateral support- The gas gage pi sto n and cylinder must also be kept scrupulously clean. For each gage the load applied to the piston is spun manually and continues to spin for up to an hour or more before it s tops.
Even though the pistons and cylinders were carefully lapped and cleaned before they were delivered to us, we were able to improve the performance of the gages by using a simple motor drive assembly to rotate th e piston and move it up a nd down within its cylinder
for several hours while the piston and cylinder were flooded with mineral spirits. The resultant burnishing increased the spin time, and the flooding helped to remove any fine particles that might have been present. The burnishing procedure can be used to improve performance at any time, particularly if the cylinder has become slightly scratched.
A simple piston gage without the controlled·clear· ance capability is used to make less accurate meas· urements over the range from 2 to 3 bars gage pressure down to 0.2 bars absolute pressure or less; the abso· lute measurements are made under an evacuated bell jar. The gage has three stainless steel piston and cylinder assemblies with nominal effective areas of 800 X 10-6 m2 , 80 X 10- 6 m2 , and 8 X 10 - 6 m 2, and uses gas as the pressure fluid.
The atmospheric pressure is measured with a standard barometer of modified U-tube design consisting of a column and a cistern. The level of the mercury in thp column is detected photoelectrically and is measured with a 31 in (0.79 m) scale and a vernier graduated to 0.001 in (25 I.on); the level of the mercury in the cistern is detected electrically and is measured with a micrometer graduated to 0.0001 in (2.5 /-tm). The back pressure above the mercury in the column is measured with a McLeod gage and is generally about 4 X 10- 6 bars or less. The accuracy of the barometer scale is easily checked with gage blocks. Repeated tests have shown that the barometric pressure measurements are accurate to 33 X 10-6 bars.
c. Other Components
Small adjustments in the counterbalancing gas pressure are made with a compound gas injector whose
OIL I N LET CDr=.= = :Lng;
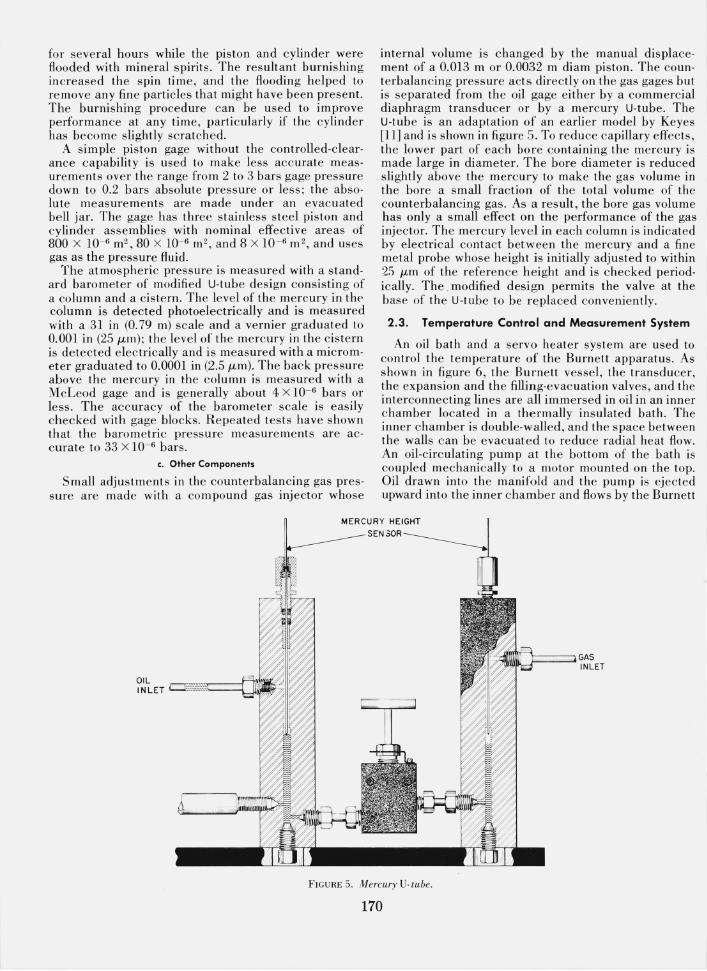
internal volume is changed by the manual displace· ment of a 0.013 m or 0.0032 m diam piston. The counterbalancing pressure acts directly on the gas gages but is separated from the oil gage either by a commercial diaphragm transducer or by a mercury U-tube. The U-tube is an adaptation of an earlier model by Keyes [11] and is shown in figure 5. To reduce capillary effects, the lower part of each bore containing the mercury is made large in diameter. The bore diameter is reduced slightly above the mercury to make the gas volume in the bore a small fraction of the total volume of the counterbalancing gas. As a result, the bore gas volume has only a small effect on the performance of the gas injector. The mercury level in each column is indicated by electrical contact between the mercury and a fine metal probe whose height is initially adjusted to within 2.'1 /-tm of the reference height and is checked periodically. The _ modified design permits the valve at the base of the U-tube to be replaced conveniently.
2.3. Temperature Control and Measurement System
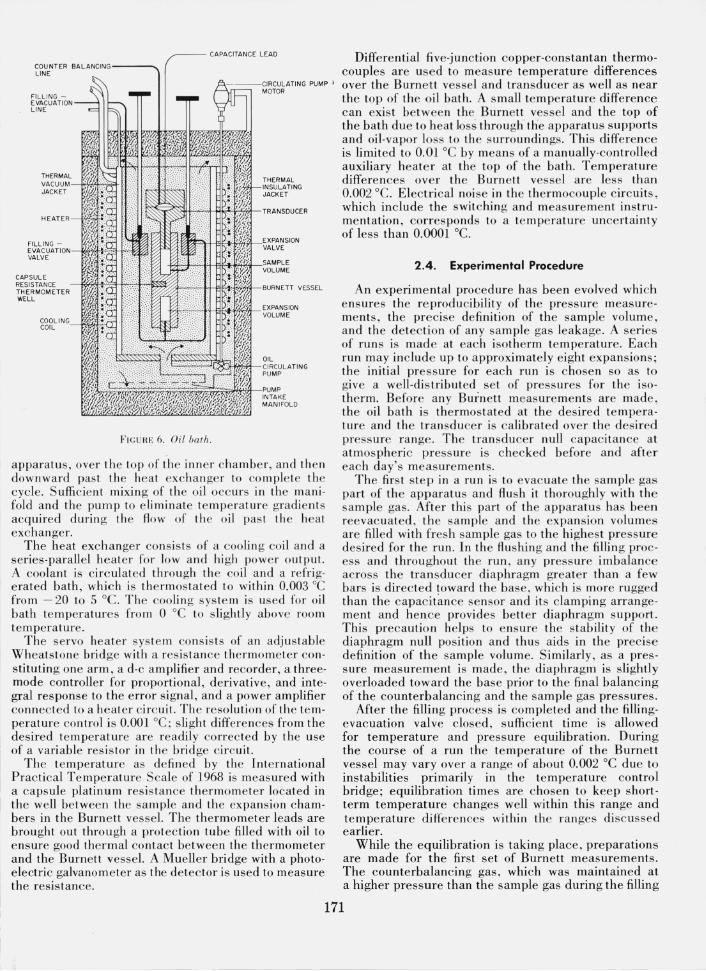
An oil bath and a servo heater system are used to control the temperature of the Burnett apparatus. As shown in figure 6, the Burnett vessel, the transducer, the expansion and the filling-evacuation valves, and the interconnecting lines are all immersed in oil in an inner chamber located in a thermally insulated bath. The inner chamber is double-walled, and the space between the walls can be evacuated to reduce radial heat flow. An oil-circulating pump at the bottom of the bath is coupled mechanically to a motor mounted on the top. Oil drawn into the manifold and the pump is ejected upward into the inner chamber and flows by the Burnett
~~,\IL~~=;JGAS INLET
FIGURE 5. Mercury V-tube.
170
Differential five-junction copper-constantan thermo-couples are used to measure temperature differences
CAPACITAN CE LEAD
COUNTER BALANCING·------.. LINE
A -----'MCIOI'TQCURI-AlING PUMP' over the Burnett vessel and transducer as well as near the top of the o il bath. A small temperature difference can exist between the Burnett vessel and th e top of the bath due to h eat loss through the apparatus supports and oil-vapor loss to th e surroundin gs. Thi s difference is limited to 0.01 °C by means of a manually-controlled auxiliary heate r at the top of th e bath. Temperature differences over the Burnett vessel are less than 0.002 °C. Electri cal noi se in the thermocouple circ uits, which include the switching and meas ureme nt instrumentation , corresponds to a te mpe rature unce rtainty of less than 0.0001 0c.
FILLING -EVACUATION LINE
THERMAL VACUUM--J>'l.\(4+~ JACKET
H E AT ER---w.~
FILLING -EVA CUATION~~lSl_+'" VALVE
FI GURE 6. Oil bath.
VOLUME
apparatus, over th e top of the inn er chambe r, and th en downward past th e heat exchange r to co mple te the cycle. Sufficient mixing of the oil occurs in the mani fold and the pump to elimin ate te mperature gradi ents acquired during the Aow of the oil past th e heat exchanger.
The heat exchanger consists of a coolin g coil and a series-parallel heater for low and high power output. A coolant is circulated through the co il and a refri gerated bath, which is thermostated to within 0.003 °C from - 20 to 5 0c. Th e coolin g sys te m is used for oil bath te mperatures from 0 °C to slightly above room temperature.
The servo heater sys tem consis ts of an adjustable Wheatstone bridge with a resistan ce thermometer COIl
stituting one arm, a d-c amplifier and recorder, a threemode controller for proportional, derivative , and integral response to the error signal, and a power amplifier connected to a heater circuit. Th e reso lution of th e te mperature co ntrol is 0.001 °C; sli ght differences from the desired temperature are readily corrected by the use of a variable resis tor in the bridge circuit.
The temperature as de fin ed by the International Prac tical Temperature Scale of 1968 is meas ured with a capsule platinum resis tance thermometer located in the well betwee n the sample and the expansion chambers in the Burne tt vessel. The th ermometer leads are brought out throu gh a protec tion tube filled with oil to ensure good thermal contact between the thermometer and the BurneLL vessel. A Mueller bridge with a photoelectric galvanometer as the de tector is used to measure the resistance.
2.4. Experimental Procedure
An experimental procedure has been evolved which ensures the re produ cibility of the pressure measureme nts, the precise definition of the sample volume, and the detection of any sample gas leakage. A series of run s is mad e at each isoth erm te mperature. Each run may include up to approximately eight expansions ; the initial pressure for each run is chosen so as to give a well-di s tributed set of pressures for the isotherm. Before any Burnett measure ments are made, the oil bath is thermostated at th e desired te mperature and the transducer is calibrated over the desired pressure range. The tra nsdu cer null capacitance at atmospheric pressure is checked before and after each day's measurements.
The firs t s te p in a run is to evac uate the sample gas part of th e apparatus and Aush it thoroughly with the sample gas. After thi s part of the apparatus has been reevacuated , the sample and the expan sion volumes are filled with fresh sample gas to the highes t press ure desired for the run . In the Au shing a nd the filljn g process and throu ghout th e run , any press ure imbalance across the transducer diaphragm greater than a fe w bars is directed toward the base, which is more rugged than the capacitance sensor and its clamping arran geme nt and hence provides better diaphragm support. This precaution helps to ensure the stability of the diaphragm null position and thus aids in the precise definition of the sample volume. Similarly, as a pressure measurement is made, the diaphragm is slightly overloaded toward the base prior to the final balancing of the counterbalancing and the sample gas press ures.
After the fillin g process is comple ted and the fillingevacuation valve closed , suffi cient time is allowed for temperature and pressure equilibration. During the course of a run the temperature of the Burnett vessel may vary over a range of about 0.002 °C due to instabilities primarily in the temperature control bridge; equilibration times are chosen to keep shortterm temperature changes well within thi s range and temperature ditlere nces within the ran ges di sc ussed earlier.
While the equilibration is taking place, preparations are made for the first set of Burnett measurements. The counterbalancing gas, which was maintained at a higher pressure than the sample gas during the filling
171
process, is gradually vented until the transducer null indicator returns to its zero position. The approximate counterbalancing gas pressure is then read from a Bourdon gage, and a variable capacitor in the capacitance bridge is adjusted in accordance with the transducer calibration so that the bridge balance will truly correspond to the diaphragm null position. The piston gage to be used for the precise pressure measurement is loaded with approximately the right combination of weights that will be needed.
When the resistance thermometer and the differential thermocouple readings show that the equilibration is essentially complete, the expansion valve is closed to isolate the sample and the expansion volumes. While the valve is slowly closed, the diaphragm is maintained in its null position by adjustment of the counterbalancing gas pressure with the compound gas injector. An amplifier and supplementary null indicator about ten times as sensitive as the transducer output meter are used in this process, partly because of their greater sensitivity and also because the location of the supplementary null indicator is more convenient to the person closing the valve and operating the compound gas injector.
After the expansion valve is closed, the first set of Burnett measurements can be made. In the operation of the piston gage a precise zeroing of the transducer output meter would require an unnecessarily long time to be achieved. Instead the gage operator calibrates the output meter over its central range by noting the difference in the scale readings that correspond to two nearly equal loads on the gage. The slight difference in the diaphragm position represented by the different scale readings changes the sample volume, which is bounded by the diaphragm, by a negligible amountless than 2 ppm. The scale readings are made when the piston is at its reference height as shown by an electronic proximity sensor mounted underneath the weights loaded on the gage. The height of a gas gage piston is adjusted by means of the compound gas injector; the height of the oil gage piston is adjusted by means of a separate oil injector. For either type of gage the piston is raised above its reference height by means of the appropriate injector and is then allowed to fall slowly down to its reference height while the piston and its load are spinning steadily. The gage pressure and barometric pressure measurements are made almost simultaneously, and the resistance thermometer and differential thermocouple measurements are made immediately afterward. These measurements constitute the first set of Burnett measurements.
Next the expansion valve is opened and after about a minute is closed as before . A second set of Burnett measurements is made. Since the expansion step has not been performed, this second set of measurements should be in close agreement with the first set. If the second set, in fact, does not differ significantly from the first, the filling-evacuation valve is opened and the expansion volume is evacuated. After isothermal conditions are reestablished and a thermocouple vacuum gage, located as close to the expansion volume as is convenient, shows a pressure of about 4 X 10- 6 bars , a
third set of measurements is made. If this set does not differ significantly from the first two, the fillingevacuation valve is closed and the expansion valve is opened. The gas initially in the sample volume expands to fill the expansion volume as well. After this first expansion the measurement procedure is repeated to successively lower pressures.
To be considered satisfactory, the three sets of measurements corresponding to the initial filling or a subsequent expansion must show a pressure reproducibility of 1 part in 50,000 or better. Occasionally a set of measurements will be repeated if some temporary disturbance, such as a temperature or barometric fluctuation , has caused a poorer reproducibility. If a serious experimental failure, such as sample gas leakage, were to occur, the measurements for that run would not be used in the data reduction.
3. Data Reduction and Discussion of Results
3.1. Background
In contrast to the simplicity of the experimental measurements, the reduction of Burnett data involves rather formidable nonlinear statistical analysis of relationships containing the compressibility factor, defined by a pressure or a density virial expansion, and optional constants. The authors have previously presented a general discussion of the analysis of different Burnett relationships using two nonlinear statistical methods, due to Gauss and to Deming [9]. Related papers have also been published by others [12, 13].
Our experience indicates that compressibility factors and second virial coefficients calculated from Burnett data of high precision and accuracy are as accurate as those calculated from the best data obtained with any other PVT method. Various treatments of relationships, that is, various models, based on eqs (7) and (8) have been used in our analysis. In these models the cell constant, where it appears, is regarded as a single parameter common to all the experimental runs, as a separate parameter for each run, or as a constant to be determined from Burnett measurements for a nearly ideal gas. Meaningful comparisons of the results are difficult for at least two reasons: (1) the same systematic errors may propagate differently in each model and (2) the number of parameters to be evaluated varies from one model to another. The effect of the latter is subtle; it may introduce an analytical bias, as the magnitude of the correlation between the parameters, which is basically high, increases significantly with an increase in the number of parameters. It is not surprising, therefore, that slight discrepancies exist among the results of different models, even when applied to the same data. For example, a comparison of the compressibility factors derived from argon data taken with our Burnett apparatus shows discrepancies among the values of approximately 0.01 percent to 0.04 percent, which,
172
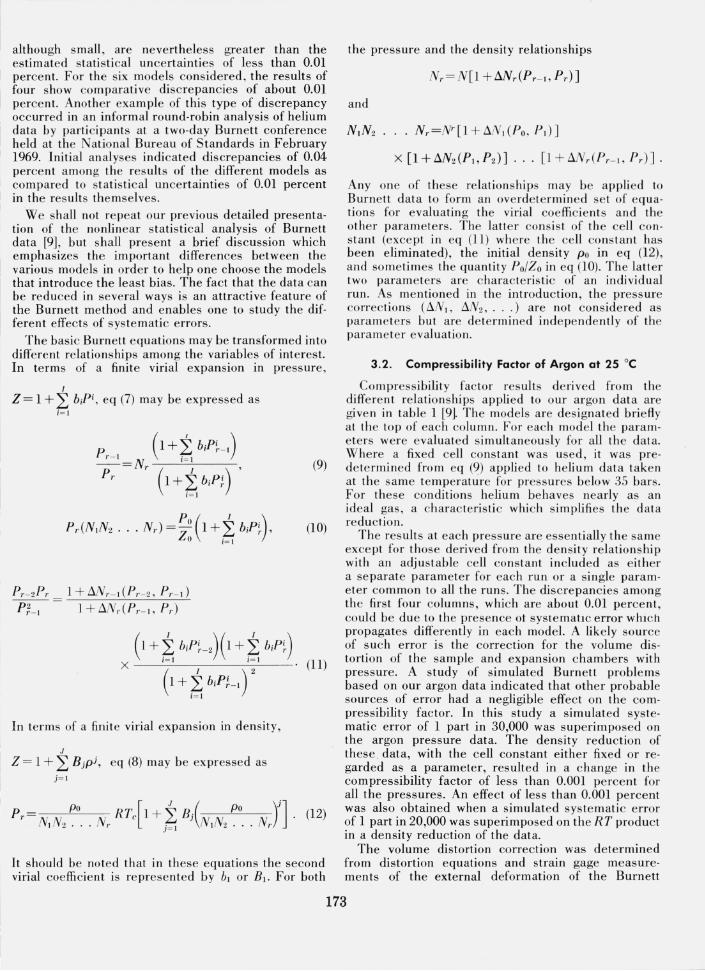
although small, are nevertheless greater than the estimated stati stical uncertainties of less than 0.01 perce nt. For th e s ix models conside red , the results of four show comparative discre pancies of about 0.01 perce nt. Another exa mpl e of thi s type of discrepancy occurred in an inform al round-robin analysis of helium data by parti cipants a t a two-day Burnett conference held at the National Bureau of Standards in February 1969. Initial an alyses indicated di screpancies of 0.04 percent a mong the res ults of the different models as compared to stati sti cal uncertainties of 0.01 percent
I in the res ults the mselves. We shall not re peat our previous detailed presenta
tion of the nonlinear s tati stical analysis of Burnett data [9], but shall present a brief discussion which emphasizes the important differences between the various models in order to help one choose the models that introduce the least bias. The fact that the data can be reduced in several ways is an attractive feature of the Burnett method and enables one to study the different effects of sys te matic errors.
The basic Burnett equ ations may be transformed into different relations hips among the variables of interes t. In te rms of a finit e virial expansion in pressure,
I
Z = 1 + L biPi, eq (7) may be expressed as i= 1
Po ( I .) P,.(NIN2 ... NT) =Z 1 + L b;P:. , o /= 1
PI'-2PI' 1 + f:.N ,._ 1 (PI'- 2, PI'- I ) P;'_I = 1 + ~NI' ( Pl' - J, PI')
In terms of a finite virial expansion in density,
J
Z = 1 + L Bjpj, eq (8) may be expressed as j = L
(9)
(10)
It should be noted that in these equation s the second virial coeffi cient is represented by hL or B1 • For both
the pressure and the density relationships
and
Any one of these relationships may be a pplied to Burne tt data to form a n ove rdetermined se t of equ ation s for e valuatin g th e viri al coeffi cients and the other para meters. The la tte r consist of th e cell co nstant (exce pt in eq (11) wh ere the cell co nstant has been eliminated) , the initial de nsity po in eq (12), and so me times the quantity Po/Zo in eq (10). The latt er two param eters are characte ri stic of an individual run. As me ntioned in the introduc tion, the press ure corrections (tlN I ' ~N2, . .. ) are not considered as para mete rs but are de termined inde pendently of the pa ra meter evaluation.
3.2. Compressibility Factor of Argon at 25 °C
Co mpressibility factor res ults derived from the diffe re nt relationships appli ed to our argon data are give n in table 1 [9]. The models are des ignated brie fl y at the top of each column . For each model the parameters were evaluated s i m ultaneously for all the data. Where a fixed cell constant was used , it was prede termined from eq (9) applied to heliu m data take n at the same temperature for pressures below 35 ba rs. For these conditions helium behaves nearly as a n ideal gas, a characteri sti c whi c h s implifies th e d ata reduction.
The results a t each pressure are essentially th e sa me exce pt for those de rived from the de nsity relati onship with an adjustable cell co nstant included as either a se para te para meter for each run or a single parameter co mmon to all the runs. The discrepancies among the first four columns, which are about 0.01 percent , could be due to the presence ot syste matIc error whjc h propagates differe ntly in each model. A likely source of s uch error is the correction for the volume di stortion of the sample and expansion chambers with pressure. A study of simulated Burnett problems based on our argon data indicated that other probable sources of error had a negligible e ffect on the co mpressibility factor. In this study a simulated systematic error of 1 part in 30,000 was superimposed on the argon pressure data_ The density reduction of these . data, with the cell constant either fixed or regarded as a parameter, resulted in a c hange in the compressibility factor of less than 0.001 percent for all the pressures. An effect of less than 0.001 percent was also obtained when a simulated sys te matic error of 1 part in 20,000 was superimposed on the RT product in a density reduction of the data.
The volume distortion correction was de termined from distortion equations and strain gage measureme nts of the external deformation of the Burnett
173
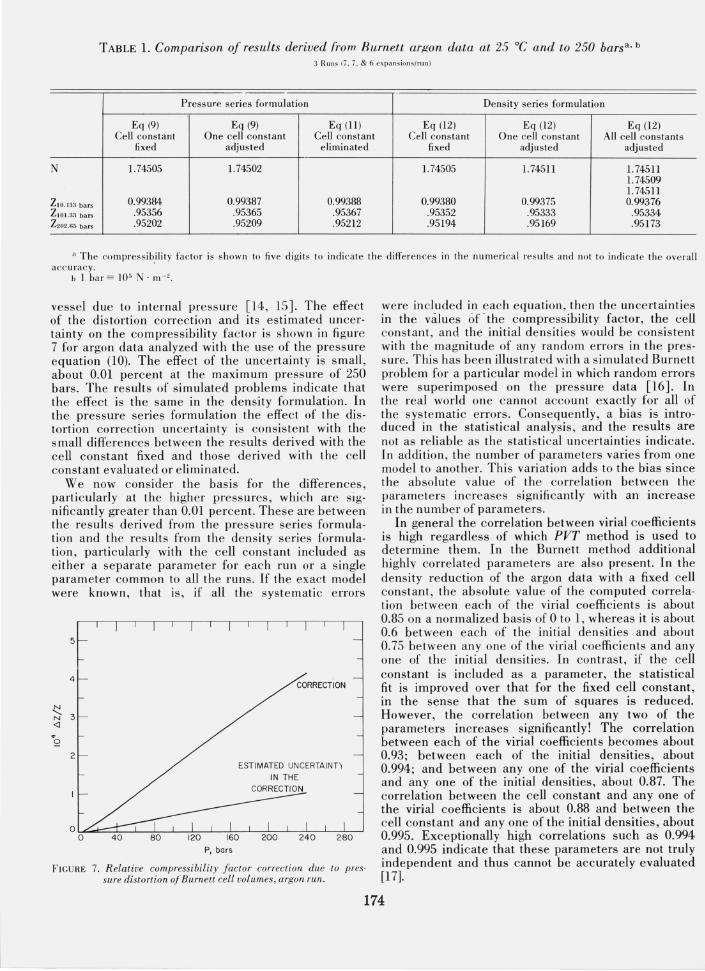
TABLE 1. Comparison of results derived from Burnett arf{on data at 25°C and to 250 barsa , b
3 Runs (7. 7. & 6 expans ions/ run)
Pressune series formulation Density series formulation
Eq (9) Eq (9) Eq (1) Eq (12) Eq (2) Eq (12) Cell constant One cell constant Cell constant Cell constant One cell constant All cell constants
fixed adjusted eliminated fixed adjusted adjusted
N 1.74505 1.74502 1.74505 1.74511 1.74511 1.74509 1.74511
Z10.133 bars 0.99384 0.99387 0.99388 0.99380 0.99375 0.99376 Z.01.33 bars .95356 .95365 .95367 .95352 .95333 .95334 Z202.65 bars .95202 .95209 .95212 .95194 .95169 .95173
a The compress ibility factor is shown to five digits to indicate the differences in th e numerical results and not to indicate the overall acc uracy. .
b 1 bar = 10' N· m-'.
vessel due to internal pressure [14, 15]. The effect of the distortion correction and its estimated uncertainty on the compressibility factor is shown in figure 7 for argon data analyzed with the use of the pressure equation (10). The effect of the uncertainty is small, about 0.01 percent at the maximum pressure of 250 bars. The results of simulated problems indicate that the effect is the same in the density formulation. In the pressure series formulation the effect of the distortion correction uncertainty is consistent with the small differences between the results derived with the cell constant fixed and those derived with the cell constant evaluated or eliminated.
We now consider the basis for the differences, particularly at the higher pressures , which are sig;nificantly greater than 0.01 percent. These are between the results derived from the pressure series formulation and the results from the density series formulation, particularly with the cell constant included as either a separate parameter for each run or a single parameter common to all the runs. If the exact model were known, that is, if all the systematic errors
5
4
N
;:, 3 <l
2
CORRECTION
ESTIMATED UNCERTAINn
P, bars
FIGURE 7. Relative compressibiLity Jactor correction due to pres· sure distortion o/Burnett cell voLumes, argun run.
were included in each equation, then the uncertainties in the values of ' the compressibility factor, the cell constant, and the initial densities would be consistent with the magnitude of any random errors in the pressure. This has been illustrated with a simulated Burnett problem for a particular model in which random errors were superimposed on the pressure data [16]. In the real world one cannot account exactly for all of the systematic errors. Consequently, a bias is introduced in the statistical analysis, and the results are not as reliable as the statistical uncertainties indicate. In addition, the number of parameters varies from one model to another. This variation adds to the bias since the absolute value of the correlation between the parameters increases significantly with an increase in the number of parameters.
In general the correlation between virial coefficients is high regardless of which PVT method is used to determine them. In the Burnett method additional highly correlated parameters are also present. In the density reduction of the argon data with a fixed cell constant, the absolute value of the computed correlation between each of the virial coefficients is about 0.85 on a normalized basis of 0 to 1, whereas it is about 0.6 between each of the initial densities and about 0.75 between anyone of the virial coefficients and any one of the initial densities. In contrast, if the cell constant is included as a parameter, the statistical fit is improved over that for the fixed cell constant, in the sense that the sum of squares is reduced, However, the correlation between any two of the parameters increases significantly! The correlation between each of the virial coefficients becomes about 0.93; between each of the initial densities, about 0.994; and between anyone of the virial coefficients and anyone of the initial densities, about 0.87. The correlation between the cell constant and anyone of the virial coefficients is about 0.88 and between the cell constant and anyone of the initial densities, about 0.995. Exceptionally high correlations such as 0.994 and 0.995 indicate that these parameters are not truly independent and thus cannot be accurately evaluated [17].
174
Additional data, not hi ghly corre la ted to the data already in th e analysis, wo uld red uce th e high parameter correla tion. As a r esult , the evaluation of the parame te rs would be e nh anced a nd any a nalytical bias in the res ults would be reduced. In one approach the a na lysis would consist of data fro m th e same apparatus fo r two or more sample gases with different compressibili ty c harac teri s ti cs. The data would be taken at th e same te mperature, a nd a si ngle cell con stant pa rameter, co mm on to all the data, would be evaluated. Another ap proach would be to use a fi xed cell co nsta nt obtained fro m helium data. This approach is less des irable because the cell co ns tant would be entered without a ny s ta ti s ti cal uncertainty, that is, as an exact qua ntity, a nd hence th e co mputed s tati s tical uncertainti es would be too s mall. The significance of high para meter corre lation should be considered care full y in es tim a tin g the re li ability of results obtained from the de nsity reducti on me thods. Fo r the press ure reduc tion me thods the s ituation is s imila r, although th e param e te r corre la tion is not as hi gh.
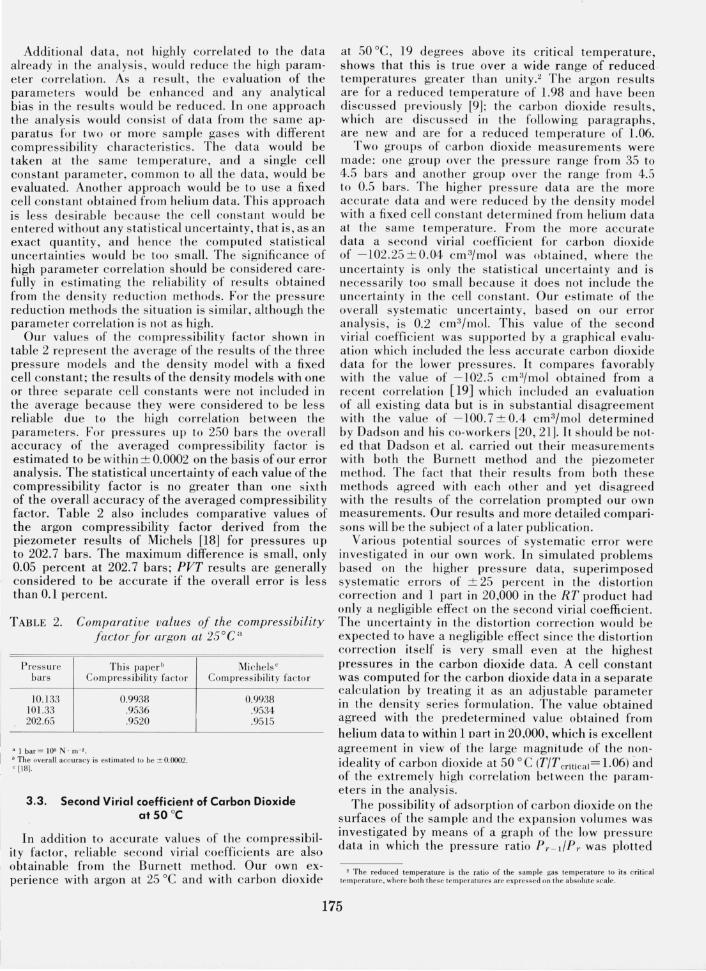
Our values of the compressi bility fac tor shown in table 2 re prese nt th e ave rage of th e results of the three press ure models a nd the de nsit y model with a fixed cell consta nt ; the res ults of the density models with one or three se parate cell co ns ta nts were not incl uded in the ave rage because they we re considered to be less reliable due to the hi gh co rrelati on betwee n the paramete rs. For press ures up to 250 bars th e overall accuracy of the averaged co mpress ibility fac tor is estimated to be within ± 0.0002 on the basis of our error analysis. The s tati s tical uncertainty of each value of the compressibility factor is no greater tha n one sixth of the overall accuracy of the averaged compressibility factor. T able 2 also includes comparative values of the argon compress ibility factor derived from the piezometer res ults of Mic hels [18] for pressures up to 202.7 bars. The maximum difference is s mall, only 0.05 percent at 202.7 bars; PVT results are generally considered to be accurate if the overall error is less than 0.1 pe rcent.
T ABLE 2. Comparative values of the compressibility facto r fo r argo n at 25 0 ca
P ress u re ba rs
10.133 101.33 202.65
This paper " Co mpress ibili ty fac to r
0.9938 .9536 .9520
a ) bar = lo-" N · m- 2 •
b The overa ll accuracy is es tim ated 10 be ± 0.0002. , [18\.
Mic he ls " Compress ibili ty fac tor
0.9938 .9534 .9515
3.3. Second Virial coefficient of Carbon Dioxide at 50 °C
In additi on to accurate values of the compressibility fac tor, relia ble seco nd viri al coeffic ie nts are also obtaina ble fro m th e Burnett method. Our own experie nce with a rgo n at 25 °C and with carbon dioxide
a t 50 °C, 19 degrees above its cri tical te mperature, shows that thi s is true over a wide range of reduced . te mperatures greater th an unit y.2 The argo n res ults are fo r a reduced temperature of 1.98 and have bee n di sc ussed previous ly [9]; th e ca rbon dioxide results, whic h are discussed in the following paragra phs, are new a nd a re fo r a reduced te mpe ra ture of 1.06.
Two groups of ca rbon dioxide meas ure me nts were made : one gro up over th e press ure ra nge from 35 to 4.5 bars and a nother group over the ra nge from 4.5 to 0.5 bars. The hi gher press ure da ta are th e more acc urate data a nd were reduced by the density model with a fi xed cell co ns ta nt dete rmined from helium data a t th e sam e te mperature. Fro m th e more acc urate data a seco nd viri al coeffi cie nt for carbon di oxide of - 102.25 ± 0.04 cm 3/ mol was ob tain ed , wh ere th e un certainty is only the s ta ti s ti ca l un certaint y a nd is necessaril y too s mall because it does not in clude the unce rtainty in th e ce lJ constant. Our es tim ate of th e overall sys te matic un certaint y, based on our error a nalysis, is 0.2 c m3/ mol. Thi s value of the second viri al coefficient was supported by a gra phical e valuation whi c h included the less acc urate carbon dioxide data for th e lower pressures. It co mpares fa vorably with the value of - 102.5 c m3/ mol obtained from a recent correlatio n [19] which included a n evaluation of all exis ting data but is in subs ta nti al di sagree me nt with the value of -100.7 ± 0. 4 cm3/mol determined by Dadson and hi s co-worke rs [20,21]. It should be noted th at Dadson et al. carried out the ir measure me nts with both the Burnett method and th e piezo me ter method. The fact th at their res ults f rom both these methods agreed with each other and yet di sagreed with the results of the correla tion prompted our ow n measurements. Our results and more detailed compariso ns will be th e subiec t of a la ter publi cation.
Various pote nt ia l sources of sys tematic error were in ves ti gated in our own wo rk. In simulated proble ms based on the higher press ure data , superimposed sys te mati c e rrors of ± 25 percent in the di s tortion co rrec tion and 1 part in 20,000 in the RT produ ct had only a negligible effect on the second viri al coeffi cie nt. Th e uncertainty in the di s tortion co rrection would be expected to have a negligible effec t s ince the di s tortion correction itself is ver y small even at th e hi ghes t pressures in the carbon dioxide data. A cell consta nt was computed for the carbon dioxide data in a separate calculation by treating it as an adjus ta ble pa ra me ter in the de nsity series fo rmulatio n. T he value obtained agreed with the predetermined value obtained from helium data to within 1 Dart in 20 ,000, which is excelle nt agreement in view of the large magnitude of the nonideality of carbon dioxide at 50 ° C (T/Tcriti ca l= 1.06) and of the extremely hi gh corre la tioll between the pa ra mete rs in the analysis.
The possibility of adsorption of carbon dioxide on th e surfaces of the sample and the ex pa nsion volum es was inves tigated by means of a gra ph of the low press ure data in which the press ure r atio P r - t! P r was plotted
2 The reduced tempera ture is the ratio of the sample gas tempe ratu re 10 its c riti cal te mpe rat ure. where bo th these te mperatures a re ex pressed on the absolut e scale.
175
as a function of the pressure P,.- t. The significance of the graph is based on the equation
(13)
which is the low pressure form of eq (9).3 The extrapolation of the curve drawn through the points to the vertical axis yielded an intercept whose value, the cell constant, was essentially the same as the predetermined value obtained from the helium data. This agreement would not be expected if adsorption were present. For a nonpolar gas such as carbon dioxide and for our range of pressures, adsorption is expected to be saturated [22]; that is, above a relatively low pressure very little more adsorption occurs as the pressure is increased further. In the sample volume the adsorbed gas would remain essentially unchanged upon an expansion, whereas in the expansion volume gas would be desorbed in the evacuation process and adsorbed in the expansion process . As a res ult , the number of free molecules would be reduced upon an expansion, and the ratio Pr- tfPr would therefore increase rapidly at low pressures. The extrapolation to zero pressure would yield a value for the cell constant that is greater than the value predetermined from helium data for which adsorption is not significant. Furthermore, the graph of this ratio versus pressure would show increasing nonlinearity at low pressures instead of the decreasing nonlinearity characteristic of real gases as the effect of the third and higher order virial coefficients not shown in eq (13) becomes insignificant. Neither of these signs of adsorption is present in our data. Hence we feel confident that any
. adsorption in our apparatus is so slight as to have an insignificant effect on our results.
We gratefully acknowledge the benefit we have received from general discussions with M. Klein and from comments regarding adsorption made by P. T. Eubank.
4. References
[1] Mason, E. A. , and Spurling, T. H., The Virial Equation of State (Pergamon Press, Oxford, 1969).
[2] Levelt Sengers, J. M. H., The experimental determination of the equation-of-state of gases and liquids at low temperatures, Physics of High Pressures and the Condensed Phase, Ed. A. van Itterbeek , pp. 60-97 (North-Holland Publishing Co., Amsterdam, 1965):
3 Equation (13), together with the equation 8 1 = RT~ . was used in the graphical evaluation of the second vi rial coefficien t.
[3] Burnett , E. S. , Co mpress ibilit y determinations without vo lume measurements, J. App!. Mech. 3, A136-A140 (1936).
r4] Pfeffer le. W. c., Jr. , Goff, J. A., and Miller , J. G., Compressibility of gases. I. The Burnett method. An improved method of treatment of the data. Extension of the method to gas mixtures, J. Chem. Phys . 23,509- 513 (1955).
[5] Liley, P. E., Thermodynami c Properties of Steam/Carbon Dioxide Mixtures at High Te mpe rature and Press ure, Thesis, University of London (1957).
[6] Silberberg, 1. H. , Kobe, K. A., and McKetta, J. J. , Gas compress ibilities with the Burnett apparatus, J. Chem. Eng. Data 4, 314-330 (1959).
[7] Hoover, A. E. , Canfield, F. B. , Kobayashi, R. , and Leland , T. W. , Jr. , Determination of virial coe ffi cie nts by the Burnet t method, J. Chem. Eng. Data 9,568-573 (1964).
[8] Waxman, M., Hilsenrath , J., and Chen, W. T. , The co mpress ibility fac tor a nd th e second virial coeffi cient of boron trifluoride from 0 to 225 °C and for pressures up to 250 bars, (to be published).
[9] Waxman, M., Hastings, J. R .. and Chen, W. T .. Nonlinear s tati sti ca l analysis of Burnett PVT data , Proceedings of the Fifth Symposium on Thermoph ysical Properti es , Ed. C. F. Bonilla , pp. 248-261 (ASME, New York, 1970).
[10] Waxman, M. , and Che n, W. T. , A rugged null-type pressure transducer of high reproducibility for accurate gas phase PVT measureme nts. J. Res. Na!. Bw·. Stand. (U.S.). 69C (E ng. and lnstr. ), No.1, 27-33 (1965).
[11] Keyes, F. G. , Methods and procedures used in the Massachusett s Institut e of T echnology program of inves tigation of the pressures and vo lum es of water to 460°C. Part I. Proc. Am. Acad. Arts Sci. 68, 505-564 (1933).
[12] Barieau, R. E., and Dalton , B. J .. A method for treating PVT data from a Burnett co mpressibility apparatus, Bureau of Mines Report of Inves tigations 7020 (1967).
[13J Hall , K. R., and Canfield, F. 8. , A leas t- squares method for red uction of Burnett data to compressibility factors and virial coe ffi cien ts, Physica 47,99- 108 (1970).
[14] Roark , R. J. , Formulas for Stress and S train (McGraw-Hill Book Co mpany, Inc., New York, 1954).
[1 5] Kadkowski, P. P., Bluhm , J. I. , and Bowie, O. L. , Watertown Arsenal Laboratory. Thick-Walled Cylinder Ha ndbook .
[16] Briggs, T. c., Dalto'n, B. J. , and Ba,:ieau, R. E. , Compressi· bilit y data for helium at O°C and pressures to 800 atmospheres, Bureau of Mines Report ofInv es ti gations 7287 (1969).
[17] Marquardt, D. W., An algorithm for leas t-squares estimation of nonlinear parameters, J. Soc. Indus!. App!. Math. 11,431- 441 (1963).
[18] Michels , A. , Wijker, Hub. , and Wijker, Hk ., Isothe rms of argon between 0 0 C and 150 °C and press ures up to 2900 atmospheres, Physica 15,627- 633 (1949).
[19] Levelt Sengers, J. M. H. , Klein , M., and Gallagher, J. S. , Pressure·Volume-Temperature relationships of gases. Virial coeffi cients, American Institute of Phys ics Handbook, (to be publi shed).
[20] Butcher, E. G. , and Dadson, R. S. , The vi rial coeffi cients of the carbon dioxide-ethylene system I. Pure gases, Proc·. Roy. Soc. (London) A277, 448-467 (1964).
[21] Dadson, R. S. , Evans, E. J. , and King, J. H. , The second virial I
coeffi cient of carbon dioxide, Proc. Phys. Soc. 92, 1115- 1121 (1967).
[22] Brunauer, S., The Adsorption of Gases and Vapors. Volume I Physical Adsorption (Prince ton Univers ity Press, Prince ton, 1943).
(Paper 75C3&4-323)
176


![Welcome [] · The 2012 Burnett Family Reunion Burnett Family History (A Synopsis) The Burnett family history, as we know it, starts with George Burnett, who was born in Brunswick](https://img.pdfslide.us/doc/110x75/5c70aa0709d3f2944a8bc561/welcome-the-2012-burnett-family-reunion-burnett-family-history-a-synopsis.jpg)