Embed Size (px)
Citation preview

Accuracy of the FreeStyle Navigator™ Continuous Glucose Monitor
Diabetes Research in Children NetworkLarry Fox,1 Roy Beck,2 Stuart Weinzimer,3 Katrina Ruedy,2 Craig Kollman,2 Dongyuan Xing,2 William Tamborlane,3 Darrell Wilson,4 Peter Chase,5 Michael Tansey,6 and the Diabetes Research in Children Network (DirecNet) Study Group. 1Jacksonville, FL; 2Tampa, FL; 3New Haven, CT;
4Stanford, CA; 5Denver, CO; 6Iowa City, IA
Supported by NIH/NICHD Grants HD041919,HD041915,HD041890,HD041918,HD041908, HD041906; GCRC Grants RR00069,RR00059,RR06022,RR00070. The FreeStyle Navigator™ is an investigational device only.

AbstractThe Freestyle Navigator™ Continuous Glucose Monitoring System ("Navigator"; Abbott Diabetes Care, Alameda, CA) is a small, subcutaneous glucose sensor with wireless transmission to a monitor designed for continuous use. We evaluated the accuracy of the Navigator in 30 children (mean age 11 years) with T1DM in inpatient/outpatient settings. During a 24h CRC admission, subjects used 2 Navigators and prior to and after the admission used a single Navigator at home. Inpatient sensor values (N=1811) were paired with reference values (analyzed at a central laboratory) obtained every 30 minutes. Outpatient sensor values (N=6819) were paired with noncalibration glucose values obtained with a Freestyle® Flash™ (Abbott Diabetes Care, Alameda, CA). For inpatient use, the median absolute difference during hypoglycemia (≤70 mg/dL) was 14 mg/dL and the median relative absolute difference [RAD] was 13% during euglycemia (71-180 mg/dL) and 10% during hyperglycemia (>180 mg/dL). Corresponding values for outpatient use were 15 mg/dL, 14% and 12%.In the inpatient setting, the median RAD was 15% in daytime versus 11% in nighttime, 11% during the first day versus 11% during the fifth day, and 11% with an arm insertion versus 12% with a hip and 13% with abdomen insertion. The median RAD comparing the two simultaneous sensors was 13%.
In conclusion, these data indicate that Navigator sensor accuracy and precision are sustained for up to 5 days, are not degraded overnight and are similar in different insertion locations. Randomized controlled studies are needed to evaluate the clinical usefulness of this promising device in the management of children with T1DM.

Background
• The need for frequent blood glucose monitoring remains a barrier to achieving excellent diabetes control.
• An accurate, real-time continuous glucose sensor would provide valuable information in assessing postprandial excursions and changes in blood sugars during exercise.
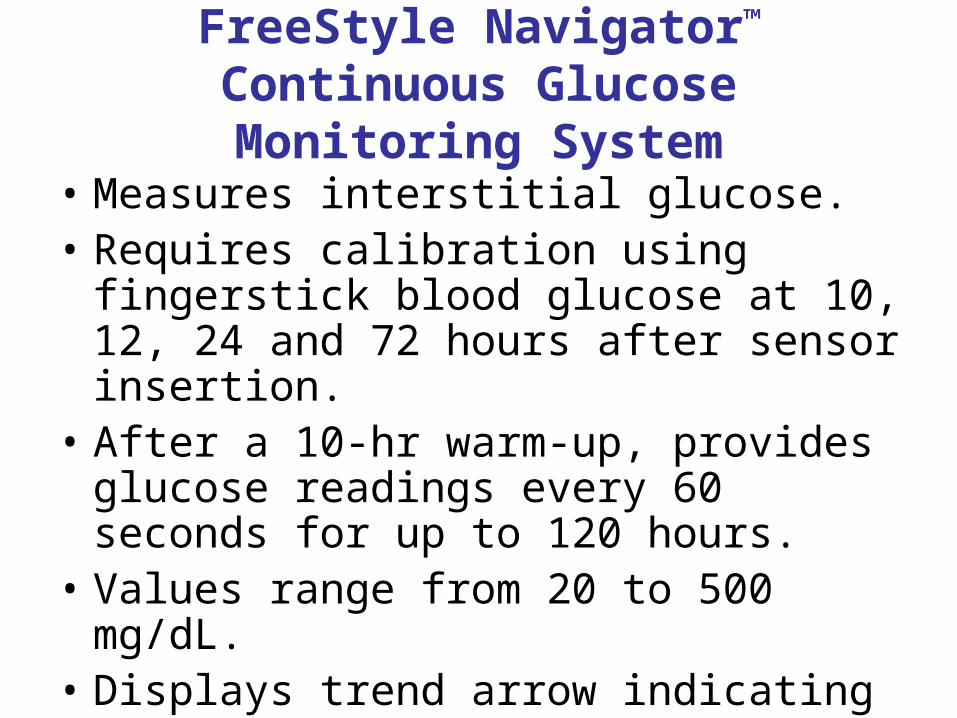
FreeStyle Navigator™ Continuous Glucose Monitoring System
• Measures interstitial glucose.• Requires calibration using fingerstick blood
glucose at 10, 12, 24 and 72 hours after sensor insertion.
• After a 10-hr warm-up, provides glucose readings every 60 seconds for up to 120 hours.
• Values range from 20 to 500 mg/dL.• Displays trend arrow indicating glucose rate
of change.

Study Aim
This pilot study was designed to…
• Assess the accuracy of the FreeStyle Navigator™ Continuous Glucose Monitoring System (Abbott Diabetes Care, Alameda, CA) in inpatient and outpatient settings.
• Assess Navigator accuracy during exercise and during a missed bolus meal test.

Methods• 30 children with T1D (4-17 yr old) were admitted to
one of the 5 DirecNet clinical research centers (CRC).
• Outpatient accuracy was assessed before and after CRC admission.
• Two simultaneous devices were placed during the inpatient stay for assessment of precision; one device was inserted for subsequent outpatient data collection.
• Venous blood was obtained every 30 minutes during the CRC stay for sensor-reference comparisons.

Methods (cont’d)• For some subjects, inpatient sensor glucose
values were also compared with reference values obtained for ~2 hours during and following an exercise session and every 10 minutes for 1 hour following missed bolus breakfast test.
• Inpatient sensor glucose values were compared with reference values performed at the DirecNet central laboratory, using a hexokinase enzymatic method.
• Outpatient sensor data were paired with noncalibration glucose values obtained with the FreeStyle glucose meter built into the Navigator.

Methods (cont’d)• The following differences between sensor and
reference values were calculated:– median absolute difference (MAD)– median relative absolute differences (MRAD)
• The frequency of sensor values meeting ISO criteria was also assessed:– with reference glucose ≤75 mg/dL, sensor
value within ±15 mg/dL– with reference glucose value >75 mg/dL,
sensor value within ±20%

Results• No effect of gender or BMI on inpatient or
outpatient sensor accuracy (tables 2 & 3).
• Sensor accuracy was better for adolescents during home use (table 3) but was not affected by age during inpatient analysis (table 2).
• Inpatient and outpatient accuracy measures improved using a 10-minute sensor lag (tables 2 & 3).

Results (cont’d)• No effect of sensor location or sensor age
(up to 5th day of use) on sensor accuracy during inpatient analysis (tables 4 & 5).
• Inpatient and outpatient sensor accuracy decreased with lower reference glucose values (tables 4 & 5).
• Sensor accuracy was better at night than during the day during inpatient and outpatient analyses (tables 4 & 5).
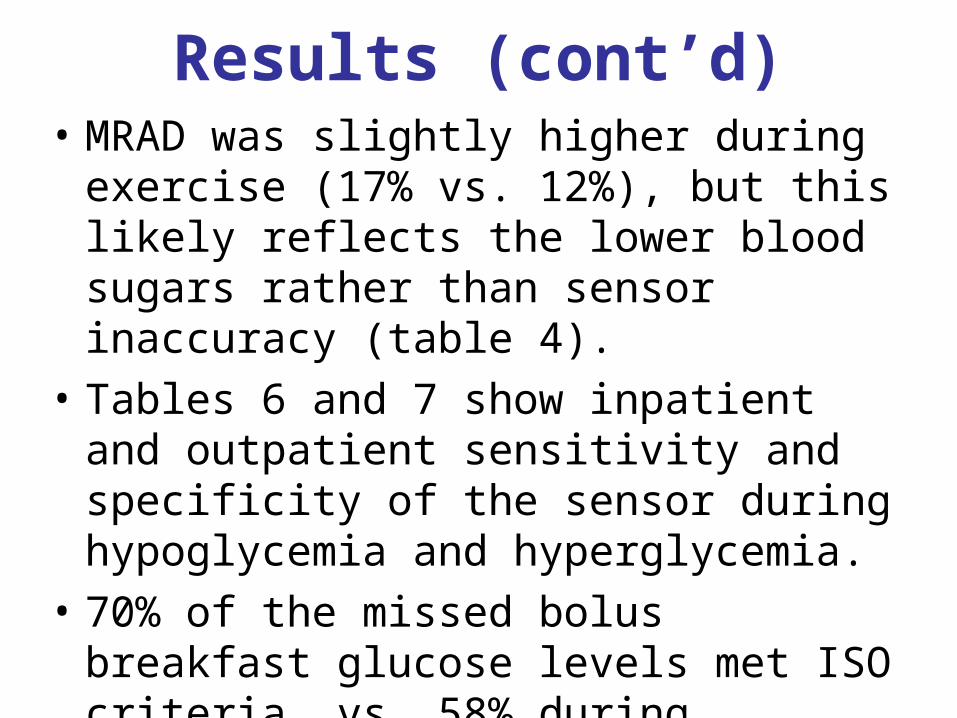
Results (cont’d)• MRAD was slightly higher during exercise
(17% vs. 12%), but this likely reflects the lower blood sugars rather than sensor inaccuracy (table 4).
• Tables 6 and 7 show inpatient and outpatient sensitivity and specificity of the sensor during hypoglycemia and hyperglycemia.
• 70% of the missed bolus breakfast glucose levels met ISO criteria, vs. 58% during exercise and 74% at other times.

Table 1. Demographics of study subjects*
N 30
Age 11.2 ± 4.1 yr
Female 12 (40%)
Caucasian 28 (93%)
HbA1c 7.1 ± 0.6%
T1D duration 5.8 ± 3.0 yr*Age, HbA1c and T1D duration are mean ± S.D.

Table 2. Inpatient sensor accuracy: effect of age, gender, BMI, and lead/lag times.
N Median Diff. Median RAD P value (RAD) % ISO P value (ISO)
Overall 1,811 −2 12% 74%
Age 0.28 0.16
4-<11 574 −9 12% 74%
11-<14 558 +1 12% 73%
14-<18 679 −1 12% 74%
Gender 0.07 0.08
Female 671 −7 11% 80%
Male 1,140 +2 13% 70%
BMI Percentile 0.08 0.07
<50th percentile 119 −2 9% 92%
50th -<75th 451 0 13% 71%
≥75th percentile 1,241 −3 12% 73%
Lead/Lag Times <0.001* <0.001*
20 min lead 1,880 0 16% 61%
10 min lead 1,853 −1 14% 67%
No lead/lag 1,811 −2 12% 74%
10 min lag 1,861 −3 11% 78%
20 min lag 1,874 −4 11% 77%
30 min lag 1,915 −4 13% 71%* No lag vs. 10 min lag comparison

Table 3. Outpatient sensor accuracy: effect of age, gender, BMI, and lead/lag times.
N Median Diff. Median RAD P value (RAD) % ISO P value (ISO)
Overall 8639 -1 14% 66%
Age 0.005 0.01
4-<11 3093 -3 15% 65%
11-<14 2833 -1 16% 62%
14-<18 2713 +1 13% 70%
Gender 0.61 0.53
Female 3043 -2 14% 67%
Male 5596 0 15% 65%
BMI Percentile 0.18 0.29
<50th 557 0 14% 69%
50th -<75th 2806 0 14% 67%
≥75th 5276 -2 15% 65%
Lead/Lag Times <0.001* <0.001*
20 min lead 8625 0 19% 54%
10 min lead 8624 -1 17% 59%
No lead/lag 8639 -1 14% 66%
10 min lag 8660 -1 13% 70%
20 min lag 8609 0 14% 67%
30 min lag 8606 +3 17% 58%* No lag vs. 10 min lag comparison

Table 4. Inpatient sensor accuracy: effect of reference glucose, sensor age, time of day and sensor location. Exercise test and meal challenge results are also shown.
NMedian
Diff.Median
RADP value (RAD) % ISO
P value (ISO)
Reference Glucose 0.03 0.02
≤70 mg/dL 83 +13 21% 55%
71-180 mg/dL 1,143 +2 13% 72%
>180 mg/dL 585 −19 10% 81%
Sensor Age 0.08 0.35
<24 hours 750 0 11% 78%
24-<48 hours 395 −8 12% 77%
48-<72 hours 326 −8 17% 61%
72-<96 hours 184 +17 15% 68%
≥96 hours 156 −2 11% 81%
Time of Day <0.001 0.002
daytime 599 0 14% 67%
nighttime 1,212 −2 11% 77%
Sensor Location 0.08 0.07
Arm 587 +1 11% 77%
Hip 653 −3 12% 74%
Abdomen 571 −4 13% 72%
Exercise Test 106 +16 17% 58%
Meal Challenge 293 −29 15% 70%

Table 5. Outpatient sensor accuracy: effect of reference glucose, sensor age and time of day.
NMedian
Diff.Median
RADP value (RAD) % ISO
P value (ISO)
Reference Glucose <0.001 <0.001
≤70 mg/dL 1094 +13 26% 51%
71-180 mg/dL 4535 +2 15% 64%
>180 mg/dL 3010 -21 12% 74%
Sensor Age 0.24 0.04
<24 hours 1503 -3 15% 62%
24-<48 hours 2413 0 14% 67%
48-<72 hours 2010 +1 14% 66%
72-<96 hours 1591 -1 15% 66%
≥96 hours 1122 -2 14% 67%
Time of Day <0.001 <0.001
daytime 5051 +1 15% 64%
nighttime 3588 -3 14% 68%

Table 6. Inpatient analysis of sensitivity and specificity of sensor during hypoglycemia and hyperglycemia.
Sensitivitya False Positive Rateb
Reference Events # Evaluable Reference Value
Hypoglycemia ≤70N=47
≤60 N=22
≤50 N=1 >70 >80 >90
60 mg/dL 35% 41% NA 23 35% 22% 13%
70 mg/dL 49% 55% NA 35 37% 21% 15%
Hyperglycemia >200N=145
>250N=100
>300N=55 <200 <180 <150
180 mg/dL 97% 100% 100% 91 25% 16% 5%
200 mg/dL 83% 100% 100% 88 18% 9% 4%a Percentage of hypo- or hyperglycemic events defined by the reference glucose for which sensor alarmed within ±30 minutes.
b Percentage of hypo- or hyperglycemic events defined by the Navigator with reference value within ±30 minutes above or below the threshold level denoted in column heading and >10 mg/dL discrepant from the concurrent Navigator reading.

Table 7. Outpatient analysis of sensitivity and specificity of sensor during hypoglycemia and hyperglycemia.
Sensitivitya False Positive Rateb
Reference Events # Evaluable Reference Value
Hypoglycemia ≤70N=911
≤60 N=452
≤50N=148 >70 >80 >90
60 mg/dL 39% 45% 51% 375 27% 17% 12%
70 mg/dL 62% 70% 81% 642 28% 17% 11%
Hyperglycemia >200N=2,279
>250N=1,317
>300N=674 <200 <180 <150
180 mg/dL 93% 96% 97% 525 18% 11% 2%
200 mg/dL 87% 93% 96% 571 12% 4% 1%a Percentage of hypo- or hyperglycemic events defined by the reference glucose for which sensor alarmed within ±30 minutes.
b Percentage of hypo- or hyperglycemic events defined by the Navigator with reference value within ±30 minutes above or below the threshold level denoted in column heading and >10 mg/dL discrepant from the concurrent Navigator reading.

Navigator Reference MAD
Baseline glucose 161 (118, 220) 172 (122, 239) 23 (17, 36)
Glucose nadir 82 (41, 101) 86 (51, 113) 17 (8, 28)
Minutes to nadir 100 (70, 110) 75 (55, 78) 22 (13, 42)
Rate of change 0.8 (0.5, 1.1) 1.4 (0.7, 1.8) 0.4 (0.2, 0.8)
* Values are median (25th, 75th percentile). Rate of change is mg/dL/min; MAD = Median Absolute Difference (Navigator – reference value).
Table 8. Blood glucose levels during exercise* (N=19)

Figure 1. Navigator vs. laboratory measured drops in glucose (mg/dL) during exercise.
Reference
Nav
igat
or

Figure 2. Navigator vs. laboratory rate of change in glucose (mg/dL/min) during exercise.
Reference
Nav
igat
or

Conclusion• Navigator accuracy is similar during inpatient
use and when used at home.• The Navigator sensor is accurate during
exercise and during a missed bolus postprandial state.
• Navigator sensor accuracy is sustained for up to 5 days, and is similar in different insertion locations.
• Randomized controlled studies are needed to evaluate the clinical usefulness of this promising device in the management of children with T1DM.

• Barbara Davis Center
– H. Peter Chase– Rosanna Fiallo-Scharer– Laurel Messer– Barbara Tallant
• University of Iowa– Eva Tsalikian– Michael Tansey– Linda Larson– Julie Coffey– Joanne Cabbage
• Nemours Children’s Clinic– Tim Wysocki– Nelly Mauras– Larry Fox– Keisha Bird– Kim Englert
• Stanford University– Bruce Buckingham– Darrell Wilson– Jennifer Block– Paula Clinton
• Yale University– William Tamborlane– Stuart Weinzimer– Elizabeth Doyle– Heather Mokotoff– Melody Martin– Amy Steffen
• Jaeb Center for Health Research– Roy Beck– Katrina Ruedy– Craig Kollman– Dongyuan Xing– Cynthia Stockdale