Embed Size (px)
Citation preview
SYMPOSIUM SERIES NO 159 HAZARDS 24 © Crown Copyright
1
Accumulation of Hydrogen Released into an Enclosure Fitted With Passive
Vents – Experimental Results and Simple Models
Hooker, P., Hoyes, J.R., Hall, J., Health and Safety Laboratory, Buxton, UK
The use of hydrogen handling equipment within rooms and enclosures is becoming more commonplace with the
increased usage of stationary fuel cell applications, hydrogen powered forklift trucks in warehouses and hydrogen refuelling stations for hydrogen powered road vehicles. In such situations an accidental leak from, for example, a
ruptured pipe could result in hydrogen accumulating to flammable concentrations. A number of knowledge gaps exist
relating to the fire and explosion hazards associated with the use of hydrogen in such indoor environments and so further experimental and analytical work is required. This paper reports results from a series of experiments and model
calculations that were carried out to investigate the accumulation / dispersion of gaseous hydrogen released into an
enclosure fitted with passive vents. The work is relevant to scenarios where forced ventilation is either absent or fails. The experiments involved releasing hydrogen from a single point into an enclosure and monitoring the variation of the
hydrogen concentration at a number of positions with time. The enclosure was located in the open air and therefore
subject to wind conditions that were also recorded. The hydrogen release rate and the passive vent arrangements were varied; single vent and multiple vent arrangements were investigated, including the use of vents in the walls as well as a
vent in the ceiling. Comparisons were also made between sonic flow releases and sub-sonic releases at nominally the
same flow rate and wind conditions. Simple analytical models, buoyancy-based and wind-driven, that can be used to predict hydrogen accumulation in naturally ventilated enclosures are described. The models were used to help interpret
the experimental results described in this paper. The conditions under which each model gave the best agreement with
the experimental measurements, and possible reasons for disagreement, are discussed. The work reported was carried
out as part of the EU Fuel Cells and Hydrogen Joint Undertaking “Hyindoor” Project.
Introduction
Hydrogen energy systems are often located indoors or in enclosures (e.g. fork lift trucks in a warehouse, fuel cells located in a room,
or hydrogen stored and distributed from a gas cabinet). An unintentional release of hydrogen in such a facility can potentially lead to
its accumulation, the formation of a flammable hydrogen-air mixture and subsequent ignition. Knowledge gaps exist in the behaviour
of indoor hydrogen releases and these are the subject of the three year HyIndoor project1, which is funded by the Fuel Cells and
Hydrogen Joint Undertaking. There are three aspects of indoor hydrogen behaviour that are being considered in the project; unignited
accumulation and dispersion, deflagrations of accumulated hydrogen and hydrogen jet-fires.
This paper describes a combined experimental and modelling investigation into the accumulation and dispersion of hydrogen
released into an enclosure fitted with passive ventilation. A series of experiments were carried out with a range of hydrogen release
rates (including sonic and sub-sonic releases), vent configurations and wind conditions. The objective of the experiments was to
generate hydrogen concentration data that can be used to develop and validate analytical and numerical models, including CFD codes
(Chernyavsky et al., 2014).
Modelling of the experiments was carried out using two analytical models. These were the buoyancy-based model of Linden et al.
(1990) and a wind-driven ventilation rate model that is available in Quadvent (Santon et al., 2012). Both models have limitations: the
model of Linden et al. (1990) ignores wind whilst the wind-driven ventilation rate calculations neglect buoyancy. The main objective
of the modelling was to help interpret the experimental results. In addition, the modelling provides some insight into the suitability of
simple models for predicting hydrogen accumulation in naturally ventilated enclosures.
Experimental Arrangement
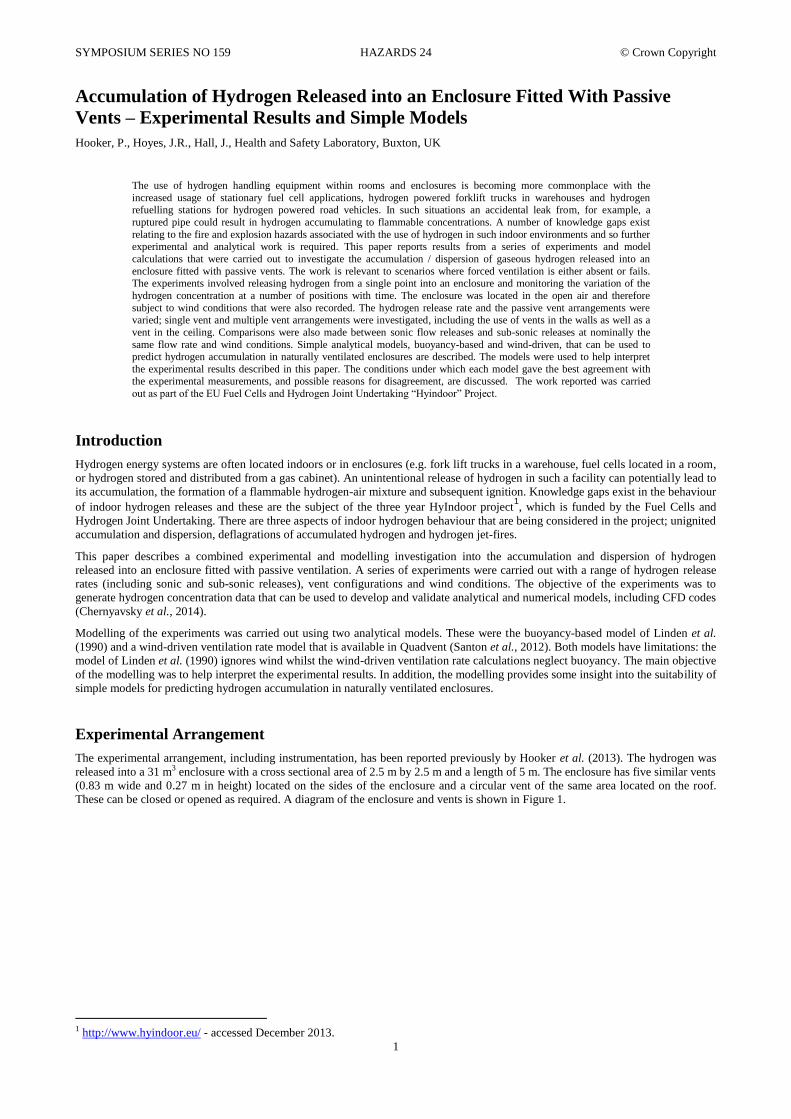
The experimental arrangement, including instrumentation, has been reported previously by Hooker et al. (2013). The hydrogen was
released into a 31 m3 enclosure with a cross sectional area of 2.5 m by 2.5 m and a length of 5 m. The enclosure has five similar vents
(0.83 m wide and 0.27 m in height) located on the sides of the enclosure and a circular vent of the same area located on the roof.
These can be closed or opened as required. A diagram of the enclosure and vents is shown in Figure 1.
1 http://www.hyindoor.eu/ - accessed December 2013.
SYMPOSIUM SERIES NO 159 HAZARDS 24 © Crown Copyright
2
Figure 1. The 31 m3 enclosure used at HSL.
Hydrogen was released through a pipe that was located in the centre of the enclosure and directed vertically upwards. The release
point was 0.5 m above the floor. Sub-sonic releases were made at a low pressure via mass flow controllers and a 10 mm internal
diameter outlet pipe. Sonic flow releases were made at higher pressures (> 10 barg) through smaller nozzles (< 1 mm diameter).
The hydrogen concentration was measured using 27 oxygen sensors mounted in “layers” at heights of 1 m, 1.75 m and 2.25 m. For
tests 21 to 28, additional oxygen sensors were positioned at heights of 0.15 m and 0.6 m. The wind speed and direction were
measured at a height of 4.2 m above the ground (3.4 m above the floor of the enclosure, which in turn was 0.8 m above the ground).
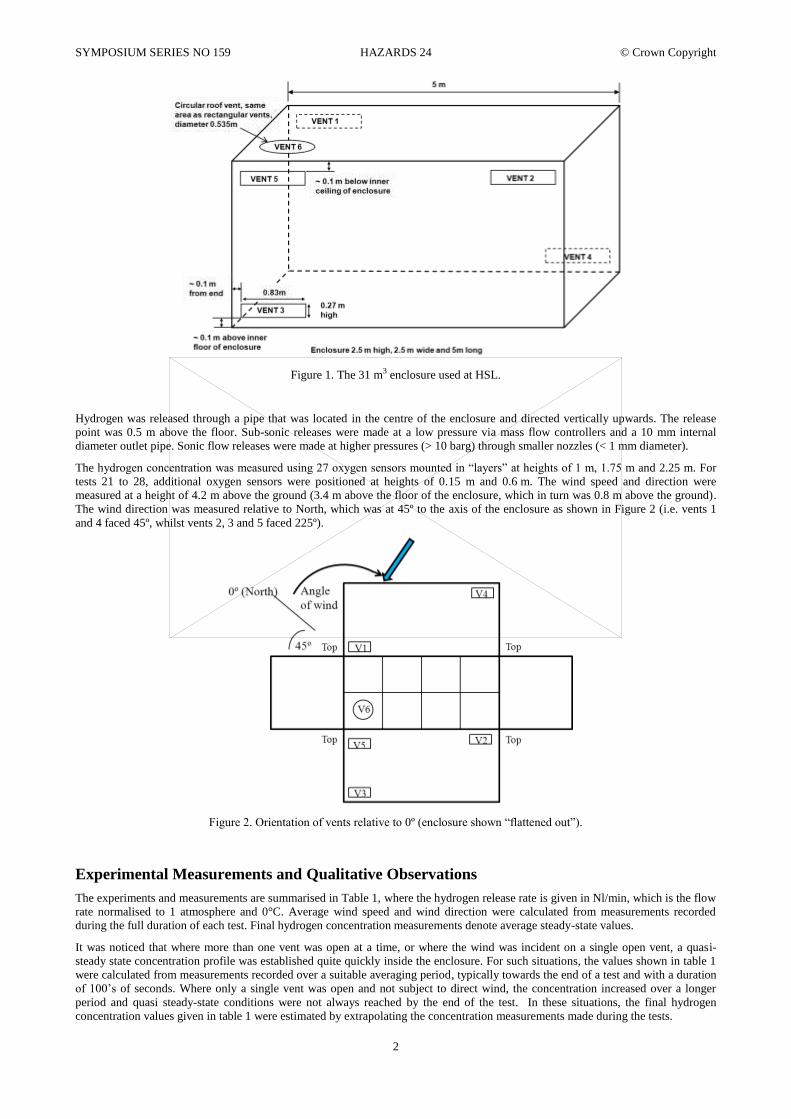
The wind direction was measured relative to North, which was at 45º to the axis of the enclosure as shown in Figure 2 (i.e. vents 1
and 4 faced 45º, whilst vents 2, 3 and 5 faced 225º).
Figure 2. Orientation of vents relative to 0º (enclosure shown “flattened out”).
Experimental Measurements and Qualitative Observations
The experiments and measurements are summarised in Table 1, where the hydrogen release rate is given in Nl/min, which is the flow
rate normalised to 1 atmosphere and 0°C. Average wind speed and wind direction were calculated from measurements recorded
during the full duration of each test. Final hydrogen concentration measurements denote average steady-state values.
It was noticed that where more than one vent was open at a time, or where the wind was incident on a single open vent, a quasi-
steady state concentration profile was established quite quickly inside the enclosure. For such situations, the values shown in table 1
were calculated from measurements recorded over a suitable averaging period, typically towards the end of a test and with a duration
of 100’s of seconds. Where only a single vent was open and not subject to direct wind, the concentration increased over a longer
period and quasi steady-state conditions were not always reached by the end of the test. In these situations, the final hydrogen
concentration values given in table 1 were estimated by extrapolating the concentration measurements made during the tests.
SYMPOSIUM SERIES NO 159 HAZARDS 24 © Crown Copyright
3
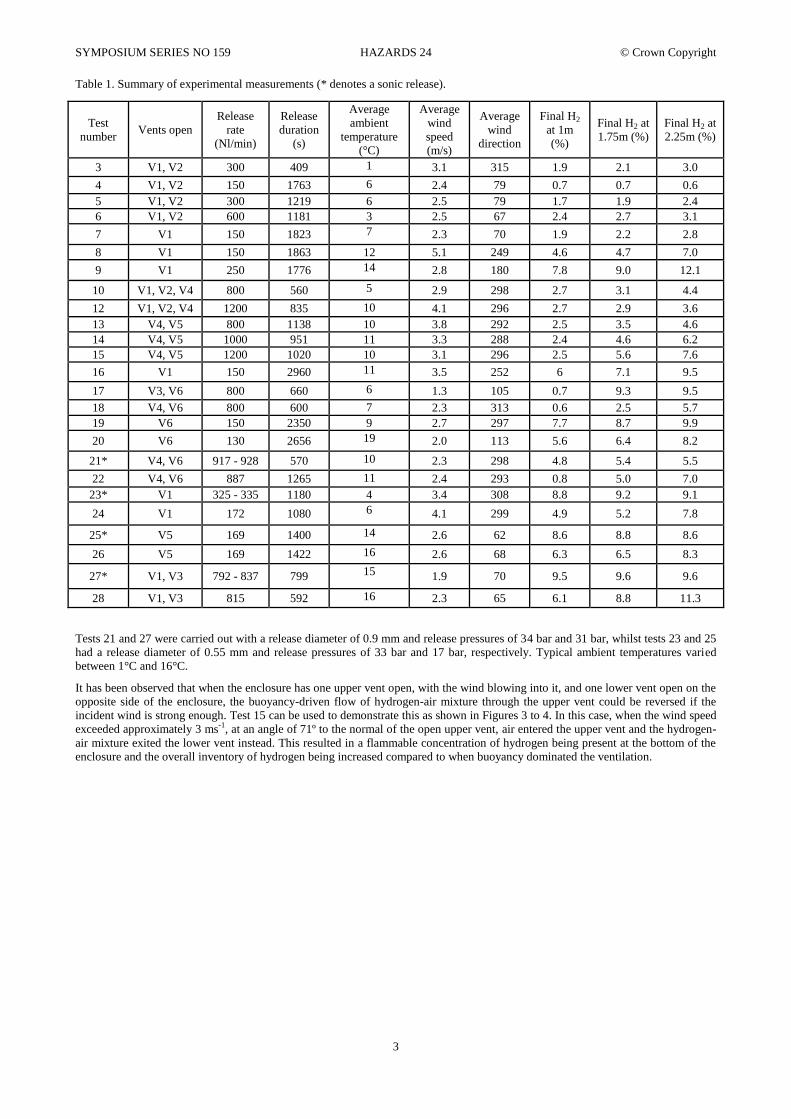
Table 1. Summary of experimental measurements (* denotes a sonic release).
Test
number Vents open
Release
rate
(Nl/min)
Release
duration
(s)
Average
ambient
temperature
(°C)
Average
wind
speed
(m/s)
Average
wind
direction
Final H2
at 1m
(%)
Final H2 at
1.75m (%)
Final H2 at
2.25m (%)
3 V1, V2 300 409 1 3.1 315 1.9 2.1 3.0
4 V1, V2 150 1763 6 2.4 79 0.7 0.7 0.6
5 V1, V2 300 1219 6 2.5 79 1.7 1.9 2.4
6 V1, V2 600 1181 3 2.5 67 2.4 2.7 3.1
7 V1 150 1823 7 2.3 70 1.9 2.2 2.8
8 V1 150 1863 12 5.1 249 4.6 4.7 7.0
9 V1 250 1776 14 2.8 180 7.8 9.0 12.1
10 V1, V2, V4 800 560 5 2.9 298 2.7 3.1 4.4
12 V1, V2, V4 1200 835 10 4.1 296 2.7 2.9 3.6
13 V4, V5 800 1138 10 3.8 292 2.5 3.5 4.6
14 V4, V5 1000 951 11 3.3 288 2.4 4.6 6.2
15 V4, V5 1200 1020 10 3.1 296 2.5 5.6 7.6
16 V1 150 2960 11 3.5 252 6 7.1 9.5
17 V3, V6 800 660 6 1.3 105 0.7 9.3 9.5
18 V4, V6 800 600 7 2.3 313 0.6 2.5 5.7
19 V6 150 2350 9 2.7 297 7.7 8.7 9.9
20 V6 130 2656 19 2.0 113 5.6 6.4 8.2
21* V4, V6 917 - 928 570 10 2.3 298 4.8 5.4 5.5
22 V4, V6 887 1265 11 2.4 293 0.8 5.0 7.0
23* V1 325 - 335 1180 4 3.4 308 8.8 9.2 9.1
24 V1 172 1080 6 4.1 299 4.9 5.2 7.8
25* V5 169 1400 14 2.6 62 8.6 8.8 8.6
26 V5 169 1422 16 2.6 68 6.3 6.5 8.3
27* V1, V3 792 - 837 799 15 1.9 70 9.5 9.6 9.6
28 V1, V3 815 592 16 2.3 65 6.1 8.8 11.3
Tests 21 and 27 were carried out with a release diameter of 0.9 mm and release pressures of 34 bar and 31 bar, whilst tests 23 and 25
had a release diameter of 0.55 mm and release pressures of 33 bar and 17 bar, respectively. Typical ambient temperatures varied
between 1°C and 16°C.
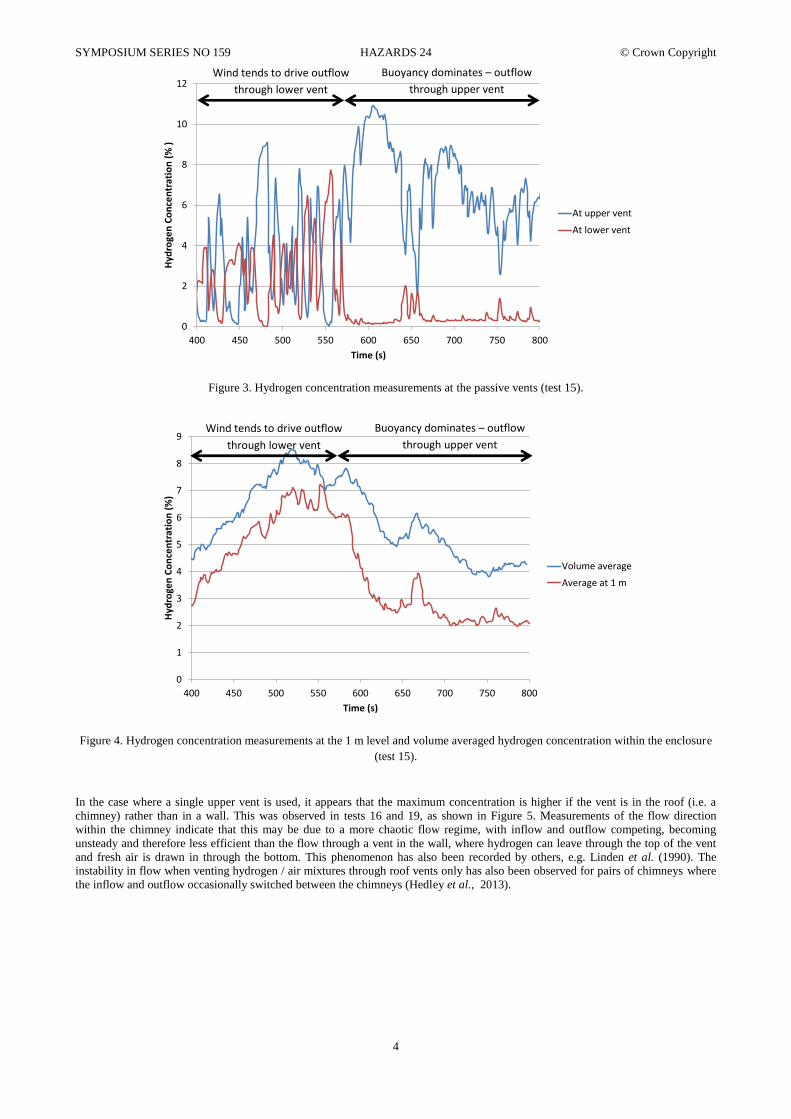
It has been observed that when the enclosure has one upper vent open, with the wind blowing into it, and one lower vent open on the
opposite side of the enclosure, the buoyancy-driven flow of hydrogen-air mixture through the upper vent could be reversed if the
incident wind is strong enough. Test 15 can be used to demonstrate this as shown in Figures 3 to 4. In this case, when the wind speed
exceeded approximately 3 ms-1, at an angle of 71º to the normal of the open upper vent, air entered the upper vent and the hydrogen-
air mixture exited the lower vent instead. This resulted in a flammable concentration of hydrogen being present at the bottom of the
enclosure and the overall inventory of hydrogen being increased compared to when buoyancy dominated the ventilation.
SYMPOSIUM SERIES NO 159 HAZARDS 24 © Crown Copyright
4
Figure 3. Hydrogen concentration measurements at the passive vents (test 15).
Figure 4. Hydrogen concentration measurements at the 1 m level and volume averaged hydrogen concentration within the enclosure
(test 15).
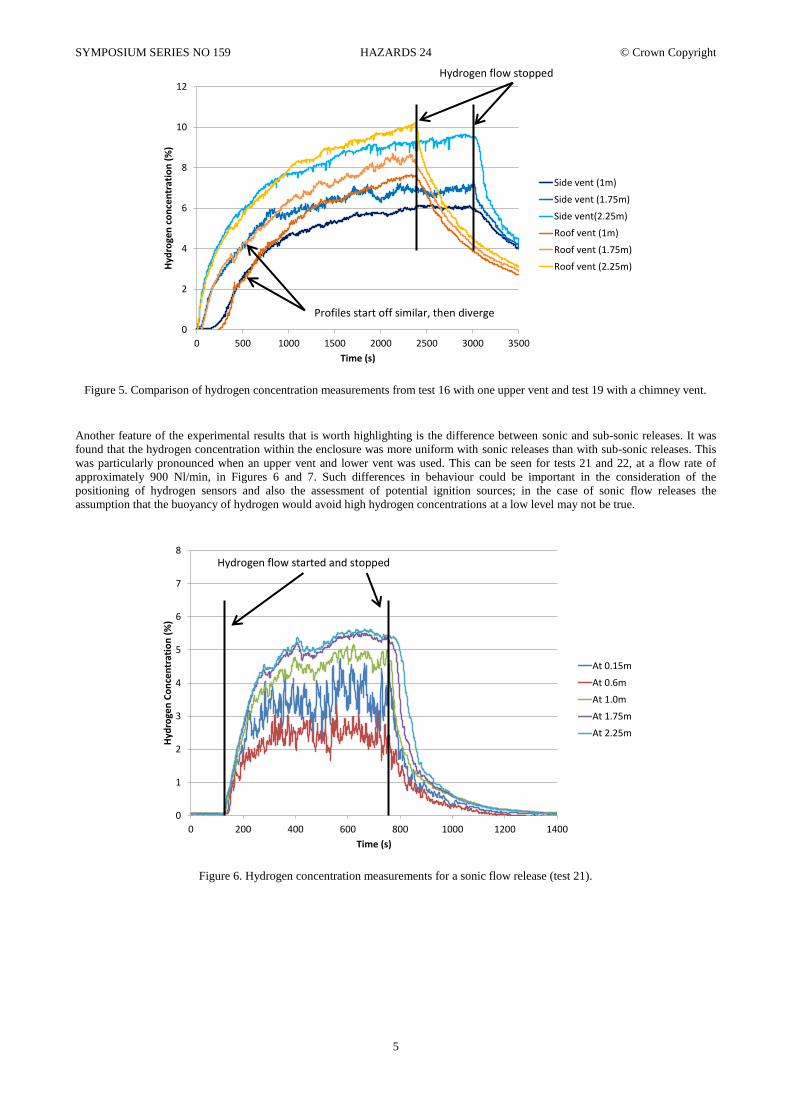
In the case where a single upper vent is used, it appears that the maximum concentration is higher if the vent is in the roof (i.e. a
chimney) rather than in a wall. This was observed in tests 16 and 19, as shown in Figure 5. Measurements of the flow direction
within the chimney indicate that this may be due to a more chaotic flow regime, with inflow and outflow competing, becoming
unsteady and therefore less efficient than the flow through a vent in the wall, where hydrogen can leave through the top of the vent
and fresh air is drawn in through the bottom. This phenomenon has also been recorded by others, e.g. Linden et al. (1990). The
instability in flow when venting hydrogen / air mixtures through roof vents only has also been observed for pairs of chimneys where
the inflow and outflow occasionally switched between the chimneys (Hedley et al., 2013).
0
2
4
6
8
10
12
400 450 500 550 600 650 700 750 800
Hyd
roge
n C
on
cen
trat
ion
(%
)
Time (s)
Hydrogen Concentration at Passive Vents
At upper vent
At lower vent
0
1
2
3
4
5
6
7
8
9
400 450 500 550 600 650 700 750 800
Hyd
roge
n C
on
cen
trat
ion
(%
)
Time (s)
Hydrogen Concentration in Enclosure
Volume average
Average at 1 m
Wind tends to drive outflow
through lower vent
Buoyancy dominates – outflow
through upper vent
Wind tends to drive outflow
through lower vent
Buoyancy dominates – outflow
through upper vent
SYMPOSIUM SERIES NO 159 HAZARDS 24 © Crown Copyright
5
Figure 5. Comparison of hydrogen concentration measurements from test 16 with one upper vent and test 19 with a chimney vent.
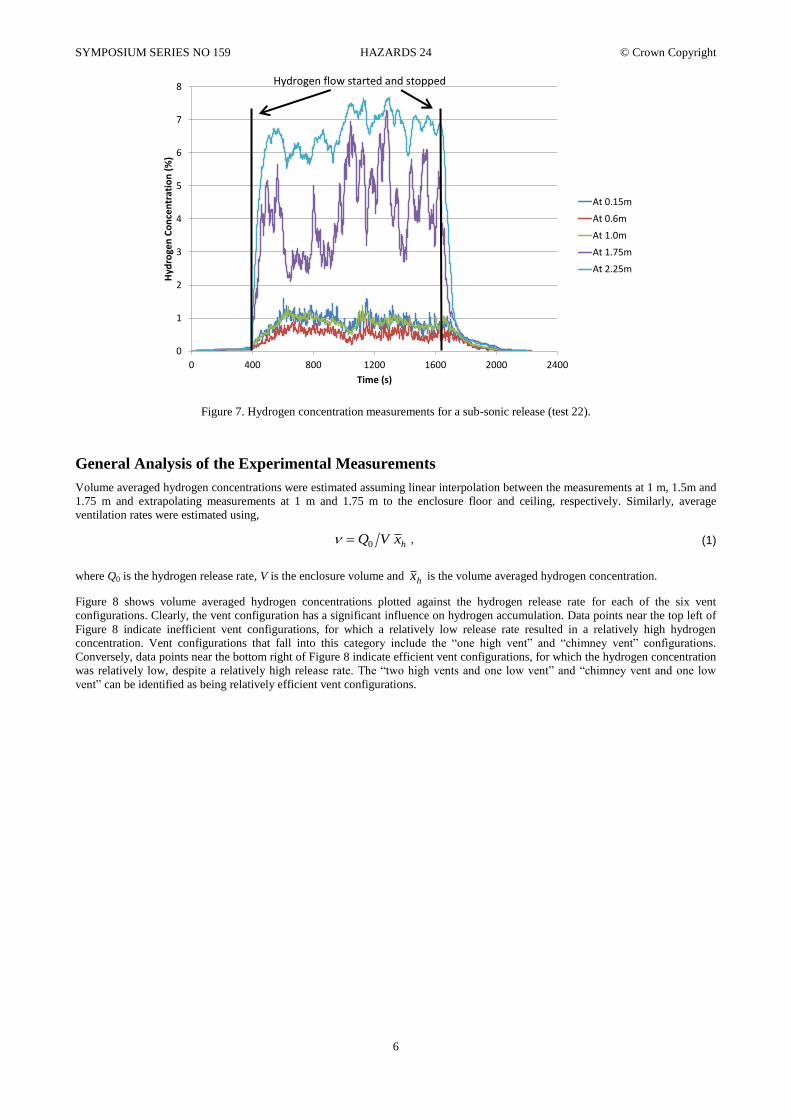
Another feature of the experimental results that is worth highlighting is the difference between sonic and sub-sonic releases. It was
found that the hydrogen concentration within the enclosure was more uniform with sonic releases than with sub-sonic releases. This
was particularly pronounced when an upper vent and lower vent was used. This can be seen for tests 21 and 22, at a flow rate of
approximately 900 Nl/min, in Figures 6 and 7. Such differences in behaviour could be important in the consideration of the
positioning of hydrogen sensors and also the assessment of potential ignition sources; in the case of sonic flow releases the
assumption that the buoyancy of hydrogen would avoid high hydrogen concentrations at a low level may not be true.
Figure 6. Hydrogen concentration measurements for a sonic flow release (test 21).
0
2
4
6
8
10
12
0 500 1000 1500 2000 2500 3000 3500
Hyd
roge
n c
on
cen
trat
ion
(%
)
Time (s)
Hydrogen Concentration vs Time - Roof vent versus Side vent
Side vent (1m)
Side vent (1.75m)
Side vent(2.25m)
Roof vent (1m)
Roof vent (1.75m)
Roof vent (2.25m)
0
1
2
3
4
5
6
7
8
0 200 400 600 800 1000 1200 1400
Hyd
roge
n C
on
cen
trat
ion
(%
)
Time (s)
At 0.15m
At 0.6m
At 1.0m
At 1.75m
At 2.25m
Profiles start off similar, then diverge
Hydrogen flow stopped
Hydrogen flow started and stopped
SYMPOSIUM SERIES NO 159 HAZARDS 24 © Crown Copyright
6
Figure 7. Hydrogen concentration measurements for a sub-sonic release (test 22).
General Analysis of the Experimental Measurements
Volume averaged hydrogen concentrations were estimated assuming linear interpolation between the measurements at 1 m, 1.5m and
1.75 m and extrapolating measurements at 1 m and 1.75 m to the enclosure floor and ceiling, respectively. Similarly, average
ventilation rates were estimated using,
hxVQ 0 , (1)
where Q0 is the hydrogen release rate, V is the enclosure volume and hx is the volume averaged hydrogen concentration.
Figure 8 shows volume averaged hydrogen concentrations plotted against the hydrogen release rate for each of the six vent
configurations. Clearly, the vent configuration has a significant influence on hydrogen accumulation. Data points near the top left of
Figure 8 indicate inefficient vent configurations, for which a relatively low release rate resulted in a relatively high hydrogen
concentration. Vent configurations that fall into this category include the “one high vent” and “chimney vent” configurations.
Conversely, data points near the bottom right of Figure 8 indicate efficient vent configurations, for which the hydrogen concentration
was relatively low, despite a relatively high release rate. The “two high vents and one low vent” and “chimney vent and one low
vent” can be identified as being relatively efficient vent configurations.
0
1
2
3
4
5
6
7
8
0 400 800 1200 1600 2000 2400
Hyd
roge
n C
on
cen
trat
ion
(%
)
Time (s)
At 0.15m
At 0.6m
At 1.0m
At 1.75m
At 2.25m
Hydrogen flow started and stopped
SYMPOSIUM SERIES NO 159 HAZARDS 24 © Crown Copyright
7
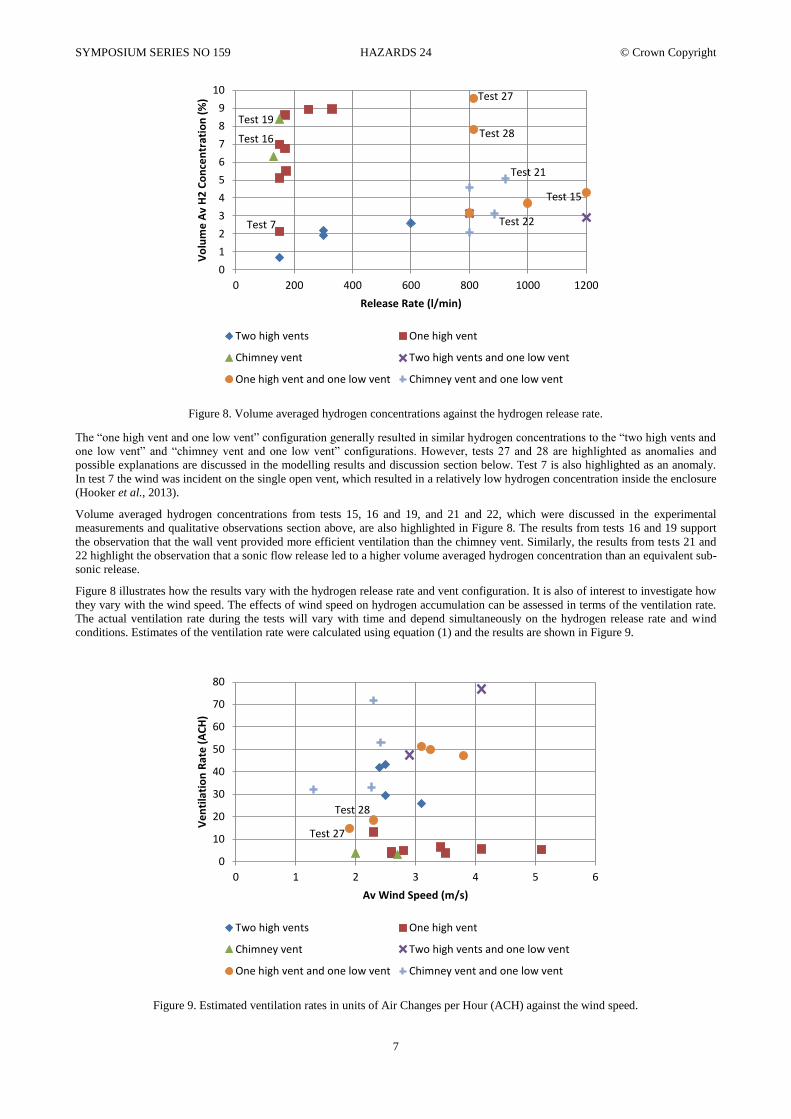
Figure 8. Volume averaged hydrogen concentrations against the hydrogen release rate.
The “one high vent and one low vent” configuration generally resulted in similar hydrogen concentrations to the “two high vents and
one low vent” and “chimney vent and one low vent” configurations. However, tests 27 and 28 are highlighted as anomalies and
possible explanations are discussed in the modelling results and discussion section below. Test 7 is also highlighted as an anomaly.
In test 7 the wind was incident on the single open vent, which resulted in a relatively low hydrogen concentration inside the enclosure
(Hooker et al., 2013).
Volume averaged hydrogen concentrations from tests 15, 16 and 19, and 21 and 22, which were discussed in the experimental
measurements and qualitative observations section above, are also highlighted in Figure 8. The results from tests 16 and 19 support
the observation that the wall vent provided more efficient ventilation than the chimney vent. Similarly, the results from tests 21 and
22 highlight the observation that a sonic flow release led to a higher volume averaged hydrogen concentration than an equivalent sub-
sonic release.
Figure 8 illustrates how the results vary with the hydrogen release rate and vent configuration. It is also of interest to investigate how
they vary with the wind speed. The effects of wind speed on hydrogen accumulation can be assessed in terms of the ventilation rate.
The actual ventilation rate during the tests will vary with time and depend simultaneously on the hydrogen release rate and wind
conditions. Estimates of the ventilation rate were calculated using equation (1) and the results are shown in Figure 9.
Figure 9. Estimated ventilation rates in units of Air Changes per Hour (ACH) against the wind speed.
Test 7
Test 16
Test 19
Test 15
Test 27
Test 28
Test 21
Test 22
0
1
2
3
4
5
6
7
8
9
10
0 200 400 600 800 1000 1200
Vo
lum
e A
v H
2 C
on
cen
trat
ion
(%
)
Release Rate (l/min)
Two high vents One high vent
Chimney vent Two high vents and one low vent
One high vent and one low vent Chimney vent and one low vent
Test 27
Test 28
0
10
20
30
40
50
60
70
80
0 1 2 3 4 5 6
Ve
nti
lati
on
Rat
e (
AC
H)
Av Wind Speed (m/s)
Two high vents One high vent
Chimney vent Two high vents and one low vent
One high vent and one low vent Chimney vent and one low vent
SYMPOSIUM SERIES NO 159 HAZARDS 24 © Crown Copyright
8
Overall, Figure 9 shows that the ventilation rate was as sensitive to the vent configuration as the wind speed. In particular, ventilation
rates associated with multi-vent configurations were typically an order of magnitude larger than ventilation rates associated with
single-vent configurations. Some of the results for multi-vent configurations appear to show a weak correlation with the wind speed.
For example, ventilation rates from experiments with one high vent and one low vent, and two high vents and one low vent increase
with increasing wind speed. Conversely, ventilation rates from experiments with single vents show little dependence on the wind
speed.
Engineering Models
The Linden Model
Linden et al. (1990) developed a model for buoyancy-driven ventilation, which ignores the effects of an external wind. Their work
was aimed at thermal sources of buoyancy, but it can be applied to releases of buoyant gases, such as hydrogen (Cariteau and
Tkatschenko, 2011). Linden et al. (1990) separated buoyancy-driven ventilation into displacement and mixing regimes. In mixing
ventilation incoming air mixes with fluid in the enclosure leading to a homogeneous environment. Conversely, displacement
ventilation is characterised by a stratified environment in which incoming and outgoing fluids do not mix.
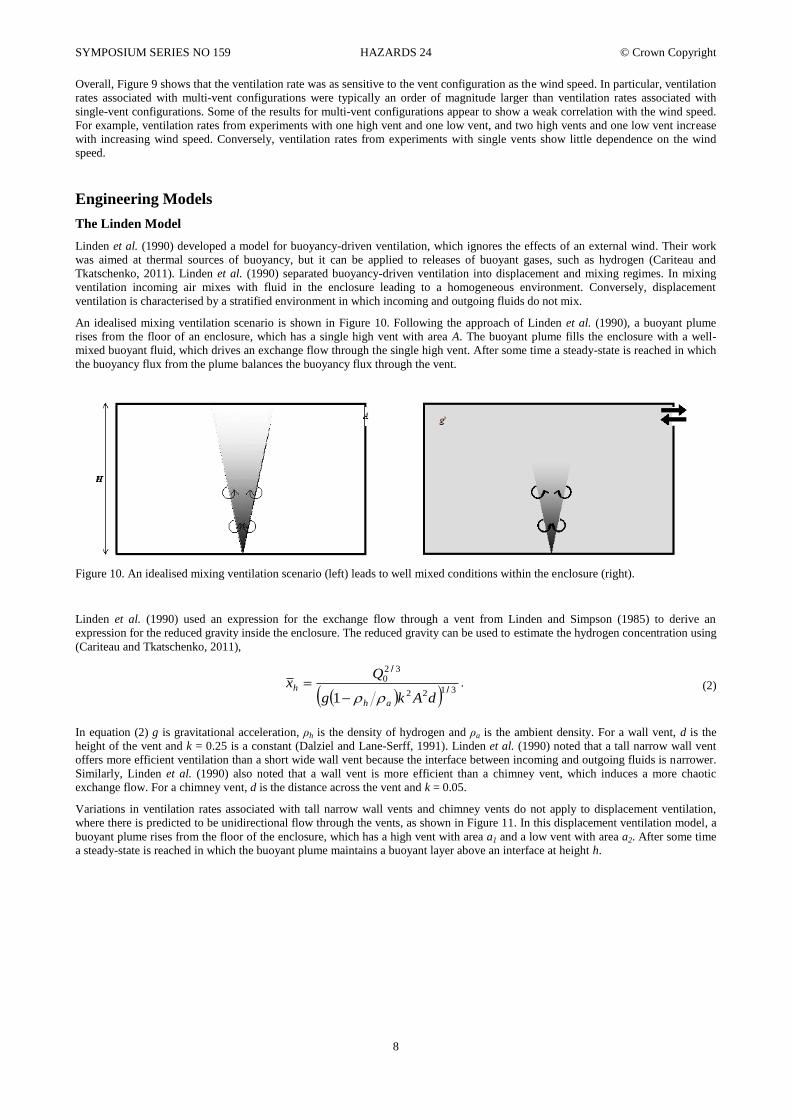
An idealised mixing ventilation scenario is shown in Figure 10. Following the approach of Linden et al. (1990), a buoyant plume
rises from the floor of an enclosure, which has a single high vent with area A. The buoyant plume fills the enclosure with a well-
mixed buoyant fluid, which drives an exchange flow through the single high vent. After some time a steady-state is reached in which
the buoyancy flux from the plume balances the buoyancy flux through the vent.
Figure 10. An idealised mixing ventilation scenario (left) leads to well mixed conditions within the enclosure (right).
Linden et al. (1990) used an expression for the exchange flow through a vent from Linden and Simpson (1985) to derive an
expression for the reduced gravity inside the enclosure. The reduced gravity can be used to estimate the hydrogen concentration using
(Cariteau and Tkatschenko, 2011),
3122
320
1/
/
dAkg
Qx
ah
h
. (2)
In equation (2) g is gravitational acceleration, ρh is the density of hydrogen and ρa is the ambient density. For a wall vent, d is the
height of the vent and k = 0.25 is a constant (Dalziel and Lane-Serff, 1991). Linden et al. (1990) noted that a tall narrow wall vent
offers more efficient ventilation than a short wide wall vent because the interface between incoming and outgoing fluids is narrower.
Similarly, Linden et al. (1990) also noted that a wall vent is more efficient than a chimney vent, which induces a more chaotic
exchange flow. For a chimney vent, d is the distance across the vent and k = 0.05.
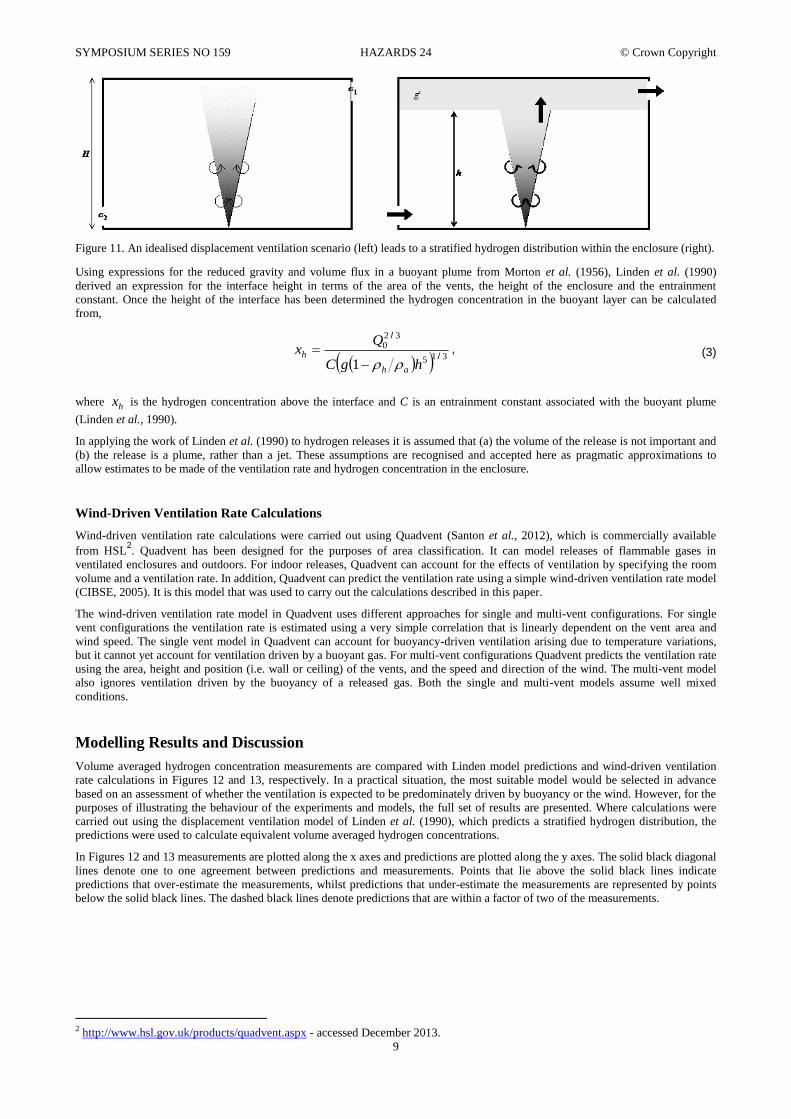
Variations in ventilation rates associated with tall narrow wall vents and chimney vents do not apply to displacement ventilation,
where there is predicted to be unidirectional flow through the vents, as shown in Figure 11. In this displacement ventilation model, a
buoyant plume rises from the floor of the enclosure, which has a high vent with area a1 and a low vent with area a2. After some time
a steady-state is reached in which the buoyant plume maintains a buoyant layer above an interface at height h.
SYMPOSIUM SERIES NO 159 HAZARDS 24 © Crown Copyright
9
Figure 11. An idealised displacement ventilation scenario (left) leads to a stratified hydrogen distribution within the enclosure (right).
Using expressions for the reduced gravity and volume flux in a buoyant plume from Morton et al. (1956), Linden et al. (1990)
derived an expression for the interface height in terms of the area of the vents, the height of the enclosure and the entrainment
constant. Once the height of the interface has been determined the hydrogen concentration in the buoyant layer can be calculated
from,
315
320
1/
/
hgC
Qx
ah
h
, (3)
where hx is the hydrogen concentration above the interface and C is an entrainment constant associated with the buoyant plume
(Linden et al., 1990).
In applying the work of Linden et al. (1990) to hydrogen releases it is assumed that (a) the volume of the release is not important and
(b) the release is a plume, rather than a jet. These assumptions are recognised and accepted here as pragmatic approximations to
allow estimates to be made of the ventilation rate and hydrogen concentration in the enclosure.
Wind-Driven Ventilation Rate Calculations
Wind-driven ventilation rate calculations were carried out using Quadvent (Santon et al., 2012), which is commercially available
from HSL2. Quadvent has been designed for the purposes of area classification. It can model releases of flammable gases in
ventilated enclosures and outdoors. For indoor releases, Quadvent can account for the effects of ventilation by specifying the room
volume and a ventilation rate. In addition, Quadvent can predict the ventilation rate using a simple wind-driven ventilation rate model
(CIBSE, 2005). It is this model that was used to carry out the calculations described in this paper.
The wind-driven ventilation rate model in Quadvent uses different approaches for single and multi-vent configurations. For single
vent configurations the ventilation rate is estimated using a very simple correlation that is linearly dependent on the vent area and
wind speed. The single vent model in Quadvent can account for buoyancy-driven ventilation arising due to temperature variations,
but it cannot yet account for ventilation driven by a buoyant gas. For multi-vent configurations Quadvent predicts the ventilation rate
using the area, height and position (i.e. wall or ceiling) of the vents, and the speed and direction of the wind. The multi-vent model
also ignores ventilation driven by the buoyancy of a released gas. Both the single and multi-vent models assume well mixed
conditions.
Modelling Results and Discussion
Volume averaged hydrogen concentration measurements are compared with Linden model predictions and wind-driven ventilation
rate calculations in Figures 12 and 13, respectively. In a practical situation, the most suitable model would be selected in advance
based on an assessment of whether the ventilation is expected to be predominately driven by buoyancy or the wind. However, for the
purposes of illustrating the behaviour of the experiments and models, the full set of results are presented. Where calculations were
carried out using the displacement ventilation model of Linden et al. (1990), which predicts a stratified hydrogen distribution, the
predictions were used to calculate equivalent volume averaged hydrogen concentrations.
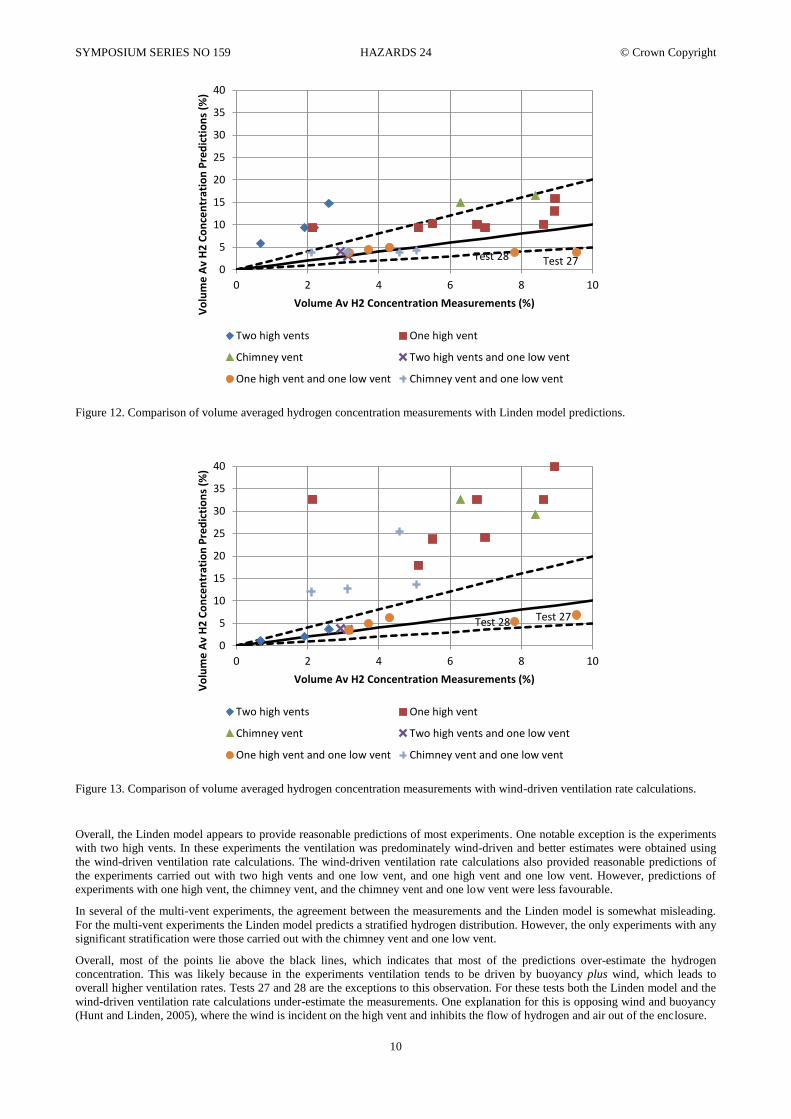
In Figures 12 and 13 measurements are plotted along the x axes and predictions are plotted along the y axes. The solid black diagonal
lines denote one to one agreement between predictions and measurements. Points that lie above the solid black lines indicate
predictions that over-estimate the measurements, whilst predictions that under-estimate the measurements are represented by points
below the solid black lines. The dashed black lines denote predictions that are within a factor of two of the measurements.
2 http://www.hsl.gov.uk/products/quadvent.aspx - accessed December 2013.
SYMPOSIUM SERIES NO 159 HAZARDS 24 © Crown Copyright
10
Figure 12. Comparison of volume averaged hydrogen concentration measurements with Linden model predictions.
Figure 13. Comparison of volume averaged hydrogen concentration measurements with wind-driven ventilation rate calculations.
Overall, the Linden model appears to provide reasonable predictions of most experiments. One notable exception is the experiments
with two high vents. In these experiments the ventilation was predominately wind-driven and better estimates were obtained using
the wind-driven ventilation rate calculations. The wind-driven ventilation rate calculations also provided reasonable predictions of
the experiments carried out with two high vents and one low vent, and one high vent and one low vent. However, predictions of
experiments with one high vent, the chimney vent, and the chimney vent and one low vent were less favourable.
In several of the multi-vent experiments, the agreement between the measurements and the Linden model is somewhat misleading.
For the multi-vent experiments the Linden model predicts a stratified hydrogen distribution. However, the only experiments with any
significant stratification were those carried out with the chimney vent and one low vent.
Overall, most of the points lie above the black lines, which indicates that most of the predictions over-estimate the hydrogen
concentration. This was likely because in the experiments ventilation tends to be driven by buoyancy plus wind, which leads to
overall higher ventilation rates. Tests 27 and 28 are the exceptions to this observation. For these tests both the Linden model and the
wind-driven ventilation rate calculations under-estimate the measurements. One explanation for this is opposing wind and buoyancy
(Hunt and Linden, 2005), where the wind is incident on the high vent and inhibits the flow of hydrogen and air out of the enclosure.
Test 27Test 280
5
10
15
20
25
30
35
40
0 2 4 6 8 10
Vo
lum
e A
v H
2 C
on
cen
trat
ion
Pre
dic
tio
ns
(%)
Volume Av H2 Concentration Measurements (%)
Two high vents One high vent
Chimney vent Two high vents and one low vent
One high vent and one low vent Chimney vent and one low vent
Test 27Test 28
0
5
10
15
20
25
30
35
40
0 2 4 6 8 10
Vo
lum
e A
v H
2 C
on
cen
trat
ion
Pre
dic
tio
ns
(%)
Volume Av H2 Concentration Measurements (%)
Two high vents One high vent
Chimney vent Two high vents and one low vent
One high vent and one low vent Chimney vent and one low vent
SYMPOSIUM SERIES NO 159 HAZARDS 24 © Crown Copyright
11
In each of the five experiments with one high vent and one low vent there was opposing wind and buoyancy. The effects of an
opposing wind will depend on the wind speed, if the wind is sufficiently strong it will over-whelm buoyancy and drive hydrogen and
air out of the low vent. Referring back to Figure 9, it can be seen that the average wind speed during tests 27 and 28 was lower than
the average wind speed during the other three tests, which had wind speeds in excess of 3 ms-1. Preliminary calculations carried out
using the model of Hunt and Linden (2005) indicate that (for the given release conditions and vent configuration) a wind speed of 3
ms-1 could over-whelm buoyancy, whilst the lower wind speeds that were present during tests 27 and 28 might inhibit buoyancy.
Conclusion
A series of experiments have been carried out to investigate the accumulation and dispersion of hydrogen released within a large-
scale enclosure that was fitted with passive vents and, being situated in the open, was subject to atmospheric wind conditions. Tests
were carried out for a range of hydrogen release rates (including sonic and sub-sonic releases), vent configurations and wind
conditions, and a significant amount of measurement data were recorded for the purposes of model evaluation.
A number of interesting phenomena have been observed. For multi-vent configurations, there was evidence of ventilation oscillating
between wind and buoyancy-driven regimes, with hydrogen alternately flowing out of high and low vents. For single vent
configurations, there was evidence to support previous observations that a wall vent can provide more efficient ventilation than a
chimney vent of equal area. The release conditions were also seen to be important, with sonic flow releases leading to relatively
uniform hydrogen distributions compared with sub-sonic releases at similar flow rates.
Overall, the results suggest that multi-vent configurations provide much more efficient ventilation than single-vent configurations.
For multi-vent configurations ventilation tended to be wind dominated and often led to ventilation rates that were an order of
magnitude higher than ventilation rates for single-vent configurations.
Given the vent configuration, release rate and aspect ratio of the enclosure, an appropriate choice of a simple model can give
reasonable predictions of the hydrogen concentration in most cases considered in this paper. For multi-vent configurations the wind-
driven model generally gives good predictions of the average hydrogen concentration. The Linden model is applicable to a wider
range of vent configurations. Both models tend to provide conservative predictions of the hydrogen concentration. However, there
were two notable exceptions where volume averaged hydrogen concentration measurements were higher than both the Linden model
predictions and the wind-driven ventilation rate calculations.
One potential explanation for the higher volume averaged hydrogen concentration measurements in some experiments compared to
model predictions is opposing wind and buoyancy. Opposing wind and buoyancy could mean that neither the Linden model or wind-
driven ventilation rate calculations can be relied upon to provide conservative predictions of hydrogen accumulation in naturally
ventilated enclosures. Further work using CFD modelling is being carried out to investigate this potentially important case.
References
Cariteau, B. and Tkatschenko I. (2011). Experimental study of the effects of vent geometry on the dispersion of a buoyant gas in a
small enclosure. International Conference on Hydrogen Safety, San Francisco. September, 2011.
Chernyavsky, B., Makarov, D., Hooker, P. and Molkov, V. (2014). Submitted to European Hydrogen Energy Conference, Seville,
Spain. March 2014.
CIBSE (2005). Natural ventilation in non-domestic buildings. CIBSE applications manual AM10. The Chartered Institute of
Building Services Engineers, London.
Dalziel, S.B. and Lane-Serff, G.F. (1991). The Hydraulics of Doorway Exchange Flows. Building and Environment, 26, 121-135.
Hedley, D., Hawksworth, S.J., Brentnall, R., Rattigan, W. and Allen, J. (2013), Large scale passive ventilation trials of hydrogen.
International Conference on Hydrogen Safety, Brussels. September, 2013.
Hooker, P., Willoughby, D., Hall, J. and Hoyes, J. (2013). Accumulation of hydrogen released into a vented enclosure - experimental
results. International Conference on Hydrogen Safety, Brussels. September, 2013.
Hunt, G.R. and Linden, P.F. (2005). Displacement and mixing ventilation driven by opposing wind and buoyancy. J. Fluid Mech.,
527, 27-55.
Linden, P.F., Lane-Serff, G.F. and Smeed, D.A. (1990). Emptying filling boxes: the fluid mechanics of natural ventilation. J. Fluid
Mech., 212, 309-335.
Linden, P.F. and Simpson, J.E. (1985). Buoyancy driven flows through an open door. Air Infiltration Review. 6, 4-5.
Morton, B.R., Taylor, G.I. and Turner, J.S. (1956). Turbulent gravitational convection from maintained and instantaneous sources.
Proc. R. Soc. Lond. A234, 1-23.
Santon, R., Ivings, M.J., Webber, D.W. and Kelsey, A. (2012). New Methods for Hazardous Area Classification for explosive gas
atmospheres. Hazards XXIII, November 2012.

SYMPOSIUM SERIES NO 159 HAZARDS 24 © Crown Copyright
12
Acknowledgments
The HSL project team wish to acknowledge the EC Fuel Cells and Hydrogen Joint Undertaking, the other Hyindoor project partners
and HSE.
© British Crown copyright 2014. This publication and the work it describes were funded by the Health and Safety Executive (HSE).
Its contents, including any opinions and/or conclusions expressed, are those of the authors alone and do not necessarily reflect HSE
policy.