Embed Size (px)
Citation preview
Ple
ase
note
that
this
is a
n au
thor
-pro
duce
d P
DF
of a
n ar
ticle
acc
ept
ed fo
r pu
blic
atio
n fo
llow
ing
peer
rev
iew
. The
def
initi
ve p
ub
lish
er-a
uthe
ntic
ated
ve
rsio
n is
ava
ilab
le o
n th
e pu
blis
her
Web
site
1
Philisophical Transactions of the Royal Society B Biological Sciences July 2009 ; Volume 364 (1526) : Pages 1985-1998 http://dx.doi.org/10.1098/rstb.2008.0205 © 2009 The Royal Society
Archimer Archive Institutionnelle de l’Ifremer
http://www.ifremer.fr/docelec/
Accumulation and fragmentation of plastic debris in global environments
David K. A. Barnes1, * François Galgani2, Richard C. Thompson3 and Morton Barlaz4 1 British Antarctic Survey, NERC, High Cross, Madingley Road, Cambridge CB3 OET, UK 2 IFREMER, Laboratoire Environnement Ressources, Provence Azur Corse (LER/PAC), Ifremer Centre de Méditerranée, ZP de Bregaillon, BP no. 330, 83507 La Seyne sur Mer, France 3 Marine Biology and Ecology Research Centre, Marine Institute, University of Plymouth, Drake Circus, Plymouth PL4 8AA, UK
4 Department of Civil, Construction and Environmental Engineering, North Carolina State University, PO Box 7908, Raleigh, NC 27695-7908, USA *: Corresponding author : David K. A. Barnes, email address : [email protected]
Abstract: One of the most ubiquitous and long-lasting recent changes to the surface of our planet is the accumulation and fragmentation of plastics. Within just a few decades since mass production of plastic products commenced in the 1950s, plastic debris has accumulated in terrestrial environments, in the open ocean, on shorelines of even the most remote islands and in the deep sea. Annual clean-up operations, costing millions of pounds sterling, are now organized in many countries and on every continent. Here we document global plastics production and the accumulation of plastic waste. While plastics typically constitute approximately 10 per cent of discarded waste, they represent a much greater proportion of the debris accumulating on shorelines. Mega- and macro-plastics have accumulated in the highest densities in the Northern Hemisphere, adjacent to urban centres, in enclosed seas and at water convergences (fronts). We report lower densities on remote island shores, on the continental shelf seabed and the lowest densities (but still a documented presence) in the deep sea and Southern Ocean. The longevity of plastic is estimated to be hundreds to thousands of years, but is likely to be far longer in deep sea and non-surface polar environments. Plastic debris poses considerable threat by choking and starving wildlife, distributing non-native and potentially harmful organisms, absorbing toxic chemicals and degrading to micro-plastics that may subsequently be ingested. Well-established annual surveys on coasts and at sea have shown that trends in mega- and macro-plastic accumulation rates are no longer uniformly increasing: rather stable, increasing and decreasing trends have all been reported. The average size of plastic particles in the environment seems to be decreasing, and the abundance and global distribution of micro-plastic fragments have increased over the last few decades. However, the environmental consequences of such microscopic debris are still poorly understood. Keywords: persistent organic pollutants, marine debris, plastic production, landfill, microplastic
For Review O
nly
1. INTRODUCTION
In the last half century there have been many drastic changes on the surface of the planet, but
one of the most instantly observable is the ubiquity and abundance of plastic debris. Like many
anthropogenic impacts on natural systems, it is one that, despite widespread recognition of the
problem, is still growing and even if stopped immediately will persist for centuries. From what
started as a perceived aesthetic problem of plastics littering towns, countryside, shores and even
far out into the ocean soon emerged as causing the choking and entanglement of wildlife. The
number of potentially harmful implications of plastic debris that have been identified has
escalated and it is now realised that these items may also transport persistent organic pollutants
(POPs – Mato et al. 2001), non-indigenous species to new locations (Barnes 2002) and
distribute algae associated with red tides (Maso et al. 2003). Reports of accumulation of plastics
spread rapidly in terms of the taxa influenced, geography and bathymetry of affected sites, and
countries beginning monitoring and beach clean-up operations. Schools and voluntary
organisations have made annual coastal collections of stranded plastics an important educational
issue even on many of the planet’s most remote islands. In some areas though, notably on the
sea-bed, assessment of plastic accumulation has been relatively neglected (Goldberg 1994).
Since 1990, the dumping of rubbish at sea from ships has been prohibited under the international
shipping regulation MARPOL annex V. A reduction of ship derived plastic debris should
therefore be expected, even if global use of plastics continues to increase. To gain an accurate
and meaningful assessment of plastics and their influence, large scale and long-term monitoring
is needed across debris sizes (here termed mega [>1 cm diameter], macro [1-10 mm] and micro
[>1 mm]), countries and environments, including the sea floor (see Ryan et al. this volume).
Natural marine debris of some type (e.g. pumice) has floated on the surface of the global
ocean for longer than life itself, but life greatly increased this through floating algae, shells,
seeds, fruits and wood. Human activities and travel by water must have further greatly
increased flotsam (e.g. by timber) but by far the biggest change in the potential for transport by
debris came with the mass production of plastics. The accumulation of both macro- and
microplastics, has consistently increased on shores and in sediments for the last four decades
(see Barnes 2005 and Thompson et al. 2004, respectively). Their inexpensive, lightweight and
durable properties have made plastic much more single use and ‘throw-away’ than previous
synthetic artefacts. Such compounds do deteriorate in Ultra Violet (UV) light but haline
environments and the cooling effect of the sea mean degradation requires very long exposure
times (Gregory 1999). Because plastics become fouled by marine organisms relatively quickly,
the debris may also become shielded to some extent from UV and the persistence of this debris
Page 2 of 37
http://mc.manuscriptcentral.com/issue-ptrsb
Submitted to Phil. Trans. R. Soc. B - Issue
123456789101112131415161718192021222324252627282930313233343536373839404142434445464748495051525354555657585960
For Review O
nly
was recently illustrated by accounts that plastic swallowed by an albatross had originated from a
plane shot down 60 years previously some 9600 km away (Weiss et al. 2006).
Mega-debris at sea was highlighted by tens of thousands of each of basketball shoes,
hockey gloves and bath-toys released from containers washed off of ships (Weiss et al. 2006).
There are many sources for plastics accumulating in the environment from direct dropping and
dumping of litter on land or at sea to blowing from landfill sites, losses in transport and
accidents. Typically 40-80% of mega- and macro-marine debris items are plastic, much of it
packaging, carrier bags, footwear, cigarette lighters and other domestic items (Derraik 2002;
Barnes 2005). A recent study by Ivar do Sul & Costa (2007) across Central and South America
also found marine debris dominated by land-based plastic (though sometimes fishery gear can
be abundant along continental shores as well). At more remote islands, fishing related sources
of debris are often more prevalent. Following establishment of ‘long term’ monitoring surveys
of stranded debris in the 1990s, there are now sufficient data to explore seasonal, annual and
longer-term patterns (see e.g. Morishige et al. 2007).
Most waste plastics, including the large proportion used in single-use applications such
as packaging, are disposed of in landfill sites. However plastic persists in landfill sites and if not
properly buried may later surface to become ‘debris’. Durability of plastic ensures that
wherever it is, it does not ‘go-away’; that is by placing plastics in landfill we may simply be
storing a problem for the future. Although accumulation of plastics on land is important, little
information is available on the amounts, rates, fate or impacts whereas there has been a major
effort to quantify impacts on shorelines and at sea. In this paper, we examine waste generation
and disposal, together with the abundance, composition and fragmentation of plastic. We then
consider temporal and spatial trends in accumulation of plastics on strandlines, the sea surface
and at depth on the sea-bed. We assess published data and present new surveys and
observations of spatial and temporal patterns to evaluate whether persistent marine debris, such
as plastics, are still increasing and whether it varies geographically?
2. ANTHROPOGENIC WASTE AND PLASTIC ACCUMULATION IN LANDFILL
Plastics are present in most waste and before trends in accumulation of plastic can be explained
it is important to first consider waste generation and disposal. Global production of plastics is
estimated at 225 m.t.year-1 (APME 2006). Waste composition data are useful to identify the
relative quantity and types of plastic. As discussed in the contribution by Takada et al. (this
volume), different plastics and resins have widely varying properties with respect to
contaminant sorption and desorption.
Page 3 of 37
http://mc.manuscriptcentral.com/issue-ptrsb
Submitted to Phil. Trans. R. Soc. B - Issue
123456789101112131415161718192021222324252627282930313233343536373839404142434445464748495051525354555657585960
For Review O
nly
(a) waste generation
Waste is typically categorized based on its point of generation. Categories include municipal,
commercial, industrial, agricultural, and construction and demolition (C&D). However, there is
ambiguity within these categories. For example, in the U.S., municipal solid waste (MSW)
includes that generated in residential, commercial and institutional (e.g. schools, government
offices) sectors, while in other countries MSW may include anything from residential waste
only to all waste managed in the municipal system (e.g. C&D, non-hazardous industrial). This
complexity is exacerbated by the fact that some municipal systems manage residual materials
from the treatment of water and wastewater. This relatively heavy waste will distort the
composition of dry wastes such as plastics.
Considering these multiple categories, it is difficult to compare waste composition between
countries. Waste is typically classified by the agency in need of the information and surveys are
typically designed with specific goals. For example, a waste sort conducted to support planning
of a recycling programme would identify commonly recycled plastics including pigmented and
translucent high density polyethylene (HDPE) containers, clear and pigmented polyethylene
terephthalate (PET), and classify the remaining plastics as “other.” These categories are useful
in this (recycling) context but are less complete for a study of plastics in the environment.
Another confounding issue is that the types of plastics present vary between municipal,
agricultural and C&D waste. Municipal waste is dominated by containers (e.g. drink bottles)
and films (e.g. carrier bags, packaging sheets), agricultural waste may contain large quantities of
a single film, and C&D waste may contain polyvinyl chloride (PVC) pipe and large plastic
containers. Thus, a municipal stream that contains 10% (by mass) plastics is not equivalent to a
C&D stream containing the same percentage.
Waste composition may also be presented on either an “as generated” or “as discarded”
basis. The former includes all the waste generated in a particular sector, prior to separation for
recycling, composting, or other treatment. In contrast, “as discarded” indicates the waste
remaining for disposal after the aforementioned separation. In areas with significant recycling
programmes, the difference between waste generation and waste disposal could be 20 to 40%,
and waste composition will change as recyclables are removed. If properly managed at the end
of its useful life, plastic waste may be recycled, burned in combustion facilities to generate
energy, or buried in landfill. In each of these alternatives, the waste should be destroyed or
contained, so that plastic is not released to the environment. The major release of plastics to the
environment is the result of inappropriate waste management and improper human behaviour
Page 4 of 37
http://mc.manuscriptcentral.com/issue-ptrsb
Submitted to Phil. Trans. R. Soc. B - Issue
123456789101112131415161718192021222324252627282930313233343536373839404142434445464748495051525354555657585960
For Review O
nly
e.g. littering (deliberately abandoning waste away from collection points). For example, plastic
films can be released to the environment when not transported properly, and as a result of wind
blown litter at the point of burial in a landfill. Well-operated landfills include a daily cover over
the waste consisting of soil or a synthetic material, and fences surrounding the landfill to contain
wind blown debris.
(b) Plastics production and recycling
Annual global consumption of the major plastic resins is considerable (see Andrady & Neal, this
volume). Films (e.g. carrier bags, plastic sheets) are easiest to escape containment as wind-
blown debris and are likely the major component of terrestrial plastic litter but plastic litter also
includes discarded fishing equipment, food and beverage packaging, and many other items that
are present in the marine environment (Koutsodendris et al., 2008). Films are dominated by
LDPE/LLDPE. We present information on plastics in MSW in the U.S. and their management
(Table 1). The quantities recovered (i.e. for recycling) as a fraction of total discards shows that
recycling rates are relatively low. In the U.S., plastic recycling is largely limited to drink
containers though local authorities continue to expand the types of plastics collected for
recycling. In general, citizen participation rather than industrial capacity limits the quantities of
plastics recycled. Efforts to provide incentives for recycling can increase the fraction recycled
(Loughlin & Barlaz 2006).
In the US durable goods, products that last on average for more than three years and include
items such as furniture and appliances, were the most important use for new plastics (Figure 1).
Non-durable goods, products that are consumed in less than three years such as trash bags and
eating utensils were the next biggest use category. In Europe, data on various packaging
applications are typically combined rather than considered separately and hence disposable
packaging represents the principal use of plastics (37%, Plastics Europe, 2008).
(c) The fraction of plastic in household waste
Plastics in the waste from various countries is estimated at about 10% (of mass). Such estimates
can only be used as an indication of plastics composition for several reasons. First, the data are
not all from the same year. Second, where possible, data are on an “as discarded” basis to
reflect the composition of waste after diversion for recycling. However, it is not always clear
whether the data were reported “as generated” or “as discarded.” Third, the waste components
included in national surveys vary within and between countries. For example, the U.S. data are
for wastes defined as MSW. Finally, country-specific data compiled for Europe (Eurostat 2007)
Page 5 of 37
http://mc.manuscriptcentral.com/issue-ptrsb
Submitted to Phil. Trans. R. Soc. B - Issue
123456789101112131415161718192021222324252627282930313233343536373839404142434445464748495051525354555657585960
For Review O
nly
are self-reported at the national level and are unlikely to have been generated using a consistent
methodology. In the U.S., plastics are estimated to comprise 11.8 and 16.3% of MSW as
generated and as discarded mass, respectively. The composition of discarded plastics is given in
Table 1 (U.S. EPA 2006). In Europe, plastics are estimated to comprise 7% of waste mass as
generated. Similarly, plastics were estimated to represent 5.8, 7.3, 8 to 10, and 10% of waste
mass in Singapore, Australia, the UK, and Finland, respectively (Barlaz 2006; Burnley 2007;
Sokka et al. 2007). Finally, plastics were estimated to comprise 4 and 13% of waste in regions
of China that use coal and natural gas, respectively, and the country-wide average for urban
areas is projected to be 14% plastics in 2030 (World Bank 2005). Despite the uncertainty,
estimates from around the world are reasonably consistent in estimating plastics to comprise
about 10% of municipal waste mass. In contrast, plastics comprise 50-80% of the waste
stranded on beaches, floating on the ocean surface and on the seabed (Gregory & Ryan 1997;
Derraik 2002; Barnes 2005; Morishige et al. 2007).
3. TEMPORAL AND SPATIAL TRENDS IN ACCUMULATION
(a) Ocean surface and beaches
Many plastics are buoyant (46% US EPA 2006) and remain so until they become waterlogged or
amass too much epibiota to float. Plastic items are commonly found at the sea surface or
washed up on the shoreline. Mass production of plastics began in the 1950s, so less than a
century ago we estimate the amount of anthropogenic debris at sea would have been three to
four orders of magnitude lower and restricted to much more degradable items. Some of the
earliest accounts of plastic debris in the marine environment are of fragments and pellets
ingested by seabirds in the 1960’s (e.g. Kenyon & Kridler 1969, Harper & Fowler 1987), but
now plastic mega- and macro-debris is routinely observed from boats everywhere on the planet.
There has been a rapid and substantial increase in anthropogenic debris on the ocean surface and
beaches over recent decades (e.g. Dixon & Dixon 1981, Derraik 2002, Barnes 2005), but of
more pertinence now are the current spatial trends. Surveys of anthropogenic debris and clean-
up operations have generally focussed on the larger items along strandlines, and there is a wide
geographic variability in the type of data available to examine potential trends. However in the
last three of decades it has become apparent that the raw material for making plastics, tiny
pellets, and microplastics have become more numerous (as marine debris) and, like larger
pieces, these can travel considerable distances. Volunteer observations and collections in a
Page 6 of 37
http://mc.manuscriptcentral.com/issue-ptrsb
Submitted to Phil. Trans. R. Soc. B - Issue
123456789101112131415161718192021222324252627282930313233343536373839404142434445464748495051525354555657585960
For Review O
nly
growing number of nations are aiding our understanding of the scale and pattern of distribution
of macro- and megaplastics in the marine environment but specialist examination is generally
needed to investigate accumulation of microplastic, e.g., in sediments (see Thompson et al.
2005). Beaches are the most easily accessible areas for studying marine debris (although such
studies have some confounding factors), yet despite the establishment of many study sites,
irregularity of sampling, differing protocol and observers have led to very few data sets
spanning more than a decade (see Barnes & Milner 2005).
The distribution of plastic debris is very patchy at sea for a variety of reasons, including
local wind and current conditions, coastline geography and the points of entry into the system
such as urban areas and trade routes. For example, stranding of macro- and megaplastics is
between one and two orders of magnitude less per length of coastline on remote shores and at
large spatial scales abundance correlates very strongly (Pearson’s correlation = 0.971, P<0.001)
with human population (per 10 degree latitude, see Barnes 2005). Enclosed seas and semi-
enclosed seas such as the Caribbean (Coe et al. 1997), typically have high densities of plastic
debris but also considerable variability. High densities and variability can also be a feature of
open ocean coastlines e.g., Brasil (Santos et al. 2005) and Hawaii (Dameron et al. 2007). One
of the key sources of interannual variability seems to be changes in oceanic circulation driven by
El Niňo events (Matsumura & Nasu 1997; Morishige et al. 2007). Typically about 2000 and
500 items of anthropogenic debris strand on north and south Atlantic Ocean shores
(respectively) per linear km per year of which more than half is plastic (scaled up from surveys
of items >1cm in size along 200 m long beach sections, see Barnes & Milner 2005). More than
six times as much plastic strands in the Mediterranean Sea and less than six times as much
strands in the Southern Ocean shores (see Barnes & Milner 2005, Table 2). Despite
considerable variability in observation and accumulation rates of plastic debris, some temporal
trends do emerge. Studies initiated in the 1980s and 1990s indicated that the rate of plastic
stranding from oceanic sources showed a sustained and considerable increase over time (e.g.,
Ryan & Moloney 1993; Ribic et al. 1997; Torres & Jorquera 1999). Similarly the occurrence of
macro-plastics associated with wildlife (e.g., in bird nests and stomachs, entangling seals,
strangling a wide variety of vertebrates or even used by hermit crabs instead of shells, see
Barnes 2005) also drastically increased. For example, between 1992 and 2005 the frequency of
plastic garbage items in Kittiwake nests increased from 39.3% to 57.2% in Northwest Denmark
(Hartwig et al. 2007). Monitoring of strandings and effects on megafauna (such as birds) has
now commenced on at least a few remote island shores in every ocean and these, with negligible
local sources of plastics, have revealed the scale at which anthropogenic debris is accumulating.
Page 7 of 37
http://mc.manuscriptcentral.com/issue-ptrsb
Submitted to Phil. Trans. R. Soc. B - Issue
123456789101112131415161718192021222324252627282930313233343536373839404142434445464748495051525354555657585960
For Review O
nly
Barnes (2005) found high levels but no consistent temporal trends in the abundance of
anthropogenic debris on northern hemisphere shores compared to much lower levels but
increased densities through the 1980s, 1990s and early 2000s were reported in the Southern
hemisphere. The highest increases were at high southern latitudes (see Barnes 2005). However
new data (reported here) show that patterns of stranding on islands is no longer clearly
increasing and may be stabilising, though often with a ‘noisy’ signal of annual variability
(Figure 2, see also Ryan et al. this volume). A similar lack of clear temporal trend in stranding
densities of plastics is apparent in data collected intermittently at Ascension I., in the tropical
Atlantic Ocean, and in the Falkland Is., south Atlantic Ocean (Barnes unpublished data). About
27% of macro-debris items stranding at Ascension I. was fishery related, similar to remote Tern
I. in the Hawaiian Is. (Morishige et al. 2007). This is much less than on shores adjacent to
important fisheries e.g. in Brazil (Oigman-Pszczol & Creed 2007) or even sub-Antarctic Bird I.
(Walker et al. 1997). Bird I. and Signy I. in the Southern Ocean (Figure 2) have stranding
densities of plastics an order of magnitude lower than remote localities at low latitudes, which in
turn have at least an order of magnitude fewer plastics per km than urban sites. Further south in
the Southern Ocean, debris washes ashore much more rarely at Adelaide Island (west Antarctic
Peninsula). The relatively consistent level of abundance for macro and mega-debris at sea at
high southern latitudes is supported by recent resurveys around the Drake Passage, Scotia arc
and northern Antarctic Peninsula (Figure 3). Fifteen years after the first (see Barnes & Milner
2005), the most recent survey of this area took place early in 2008 and will involve the first
marine debris surveys of the south Bellingshausen and Amundsen seas. Visual surveys such as
these are weaker as a source of data than surface towed trawls but much more common and thus
arguably comparable with data collected elsewhere, despite being semi quantitative. Gregory et
al. (1984) reported similarly low (on a global scale) levels of floating anthropogenic debris in
the Ross Sea (Pacific sector) of the Southern Ocean. Observers from the University of Essex in
conjunction with Greenpeace are currently undertaking repeat survey of plastics at sea in this
area. As on surrounding strandlines, the North Atlantic and Pacific oceans have high densities
of floating plastic debris, especially at 20-40º N within a few hundred km of the coast and in the
gyre centres, e.g. between the tropical and subarctic waters (see Matsumura & Nasu 1997). A
recent (2005) survey of the subtropical convergence zone in this area showed plastic debris to be
concentrating there remotely using satellite imagery (Pichel et al. 2007).
We know much less about the use by and distribution of organisms that hitch-hike on
plastics and other anthropogenic debris than about the debris itself. Macro- and megaplastics
have the potential to carry a wide range of species and support the growth of many to
Page 8 of 37
http://mc.manuscriptcentral.com/issue-ptrsb
Submitted to Phil. Trans. R. Soc. B - Issue
123456789101112131415161718192021222324252627282930313233343536373839404142434445464748495051525354555657585960
For Review O
nly
reproductive viability. The high abundance, lengthy durability and travel of plastics to even the
most remote coasts, makes them a major potential vector for the dispersal of organisms (see
Gregory this volume). New data from surveys of marine debris stranding in the Seychelles in
2005 and 2006 showed that on some beaches more than 60% of items carried fouling organisms,
the highest reported anywhere (D. Barnes unpublished data). This is of significance because the
prevailing currents travel from N. Australia and S. Indonesia during summer (South Equatorial)
and from Somalia, India and N. Indonesia during winter (Indian Monsoon) could potentially
transport a very wide range of species to less biodiverse, mid-ocean islands. Recent surveys of
marine debris at Ascension I. (reported here for the first time) found 38, 40 and 41% of debris
colonised by fauna in 2002, 2003 and 2005 respectively. Much of this had probably also
travelled considerable distances given the prevailing currents come from the cape of South
Africa. The likely response of many species to rapid regional warming is to move pole-ward to
stay within their normal thermal envelope but in previous phases of warming (interglacial
periods) there were few vectors to travel on. Now plastic debris, ship hulls and other vectors
make transport more rapid and frequent and unprecedented warming at high latitudes also means
that establishment success of potential invaders is likely to be higher.
(b) Seabeds from shallows to abyss
As at the surface, both in the open ocean and on strandlines it is clear that the abundance and
distribution of anthropogenic debris shows considerable spatial variability. The geographical
distribution of plastic debris is strongly influenced by hydrodynamics, geomorphology and
human factors. Moreover, there is notable temporal, particularly seasonal, variation with a
tendency for accumulation and concentration along coastal and particular geographic areas.
Under the weight of fouling by a wide variety of bacteria, algae, animals and
accumulated sediment, plastics can sink to the seabed (RCT unpublished data). Change in the
nature, presence or abundance of anthropogenic debris on the sea floor is much less widely
investigated than surface patterns. Studies that investigate seabed debris typically focus on
continental shelves and research into the deeper seabed, which forms about half the planet’s
surface, is restricted by sampling difficulties and cost. Patterns in even the shallow subtidal can
differ substantially from the adjacent strandlines. Oigman-Pszczol & Creed (2007) found plastic
to constitute a much greater proportion of debris on the nearshore Brazilian seabed than on the
shore. While sonar does not enable discrimination of different types of debris, trawling (e.g.
using Agassiz) is probably the most adequate method to date, particularly when mesh size and
opening width can be manipulated (Goldberg 1994, 1995; Galgani & Andral 1998). Such nets
Page 9 of 37
http://mc.manuscriptcentral.com/issue-ptrsb
Submitted to Phil. Trans. R. Soc. B - Issue
123456789101112131415161718192021222324252627282930313233343536373839404142434445464748495051525354555657585960
For Review O
nly
are only semi-quantitative and because of their design for collecting epibenthos, probably
underestimate the quantities of debris present. Therefore pole trawling, with a constant mouth
width, which works deeper in sediments, is considered the best approach. This is also the only
trawling method with off-shelf data from submersibles. General strategies to investigate sea-bed
debris are similar to methodology for benthic ecology and place more emphasis on the
abundance and nature (e.g. bags, bottles, pieces of plastics) of items rather than their mass.
Interpretation of trends is made difficult because the ageing of plastics at depth is not well
researched and the fall of plastics to the sea-bed began long before specific scientific
investigations started in the 1990s. Plastics have been found on the seabed of all seas and
oceans across the planet but macro-debris is still very rare in the Southern Ocean, particularly in
deep water. For example a recent series of 32 Agassiz trawls and 29 Epibenthic sledge tows (at
200-1500 m depth, BAS unpublished data) around the most (human) visited area, the northern
Antarctic Peninsula and Scotia arc, found just one plastic piece and one metal shot. Large-scale
evaluations of sea-bed debris distribution and densities anywhere are scarce (but see Galgani et
al. 2000; Lee et al. 2006; Koutsodendris et al. 2008). However, there are a large number of
smaller scale studies that have investigated anthropogenic debris in coastal areas such as bays,
estuaries and sounds (see table 2 and references therein).
The abundance of plastic debris is very dependent upon location with values ranging
from 0-7290 items per hectare (Ha) (although an extreme find of 10110 anthropogenic items
per Ha was found in 1998 at one position, 43º42.84’N, 7º22.98’E using a pole trawl).
Assessments of abundance clearly demonstrate the domination of this debris by plastics, as at
more than half the study sites plastics constituted >50% of debris (Table 2). Of the areas
investigated to date, Mediterranean sites tend to show the greatest densities due to the
combination of a densely populated coastline and shipping in coastal waters, and a lack of
dispersion of plastics by little tidal flow or water circulation. In general, bottom debris tends to
become trapped in areas of low circulation and high sediment accumulation in contrast to
floating debris, which accumulates in frontal areas. Debris that reaches the sea-bed may already
have been transported considerable distance, only sinking when weighed down by fouling. The
consequence is an accumulation of plastics debris in bays rather than the open sea (Hess et al.
1999; Stefatos et al. 1999). Some accumulation zones in the Atlantic and the Mediterranean
Seas have very high debris densities despite being far from coasts. These densities relate to the
consequence of large-scale residual ocean circulation patterns. There are higher densities in
particular areas such as around rocks and wrecks or in depressions or channels (Galgani et al.
1996). In the North Sea (Figure 4), accumulation of plastics 320 km offshore from Denmark
Page 10 of 37
http://mc.manuscriptcentral.com/issue-ptrsb
Submitted to Phil. Trans. R. Soc. B - Issue
123456789101112131415161718192021222324252627282930313233343536373839404142434445464748495051525354555657585960
For Review O
nly
(Galgani et al. 2000) is a consequence of several factors. These include the eddying circulation
in the central north sea (Delhez & Martin 1992) and long-term circulation of water from the gulf
stream transporting plastics northwards (Breton & Salomon 1995) and to the convergence zone
of seabed sediment movements, due to local decreases of turbidity and turbulence (Tappin et al.
1997).
Large rivers are responsible for substantial inputs of debris to the sea bed (Williams &
Simmons 1997). They can transport waste out to sea because of their high flow rate and the
strength of bottom currents. In smaller rivers the displacement is slight, and waste can be found
in zones adjacent to or in the estuaries and is often coincident with fronts (Acha et al. 2003).
Patterns of debris transport should therefore be linked to river flow strength and may follow
similar patterns to deposition of sediment load (often depositing only small amounts of material
immediately along the coast).
Deep submarine extensions of coastal rivers also influence the distribution of sea bed
debris. In some areas local water movements transport plastics away from the coast to
accumulate in zones of high sedimentation. In these conditions, the distal deltas of rivers can fan
out in deeper waters, creating areas of high accumulation (Galgani et al. 1996). Continental
shelves often have lower concentrations of debris since most of the anthropogenic debris in the
outer shelf originates from coasts to shelves that are washed offshore by currents associated with
river plumes. Data from the shelf areas off the River Rhone (Galgani et al. 1995b) and
California (Moore & Allen 2000) show circulation can be strongly, locally influenced by storm
water events. The accumulation of plastics in coastal canyons may also be related to strong
currents occurring in the upper part of canyons, which decrease rapidly in deeper areas resulting
from increased confinement. Accordingly, debris distribution seems to be more temporally
stable. An inevitable effect of this is the presence of greater amounts of debris in deeper shelf
waters than in coastal waters (Galgani et al. 1996, 2000).
A wide variety of human activities contribute to these patterns of sea-bed debris
distribution, including proximity to fishing activities, urban development and tourism. Also
with plastic as a main component, debris from the fishing industry is prevalent in fishing areas
(Kanehiro et al.1995; Galgani et al. 2000). This type of material accounts for a high percentage
of debris, for example up to 72 % in eastern China Sea (Lee et al. 2006) and 65% in the Celtic
sea (Galgani et al. 2000). Of sea-bed marine debris in California fishing gear also occupied
more space than plastic, metal, and miscellaneous debris (Moore & Allen 2000).
Investigations using submersibles at depths beyond the continental shelf usually consider
the number of items per linear km because of variability in transect width. They have revealed
Page 11 of 37
http://mc.manuscriptcentral.com/issue-ptrsb
Submitted to Phil. Trans. R. Soc. B - Issue
123456789101112131415161718192021222324252627282930313233343536373839404142434445464748495051525354555657585960
For Review O
nly
substantial quantities of debris (Fig 5). Besides the high densities found in coastal canyons (up
to 112 items km-1 and 70 % plastics), plastics and other anthropogenic debris were found widely
dispersed at slope and abyssal depths (Galgani et al. 2000). Deployment of a Remotely
Operated Vehicle submarine in the Fram Strait (Arctic) (Galgani & Lecornu 2004) revealed 0.2-
0.9 pieces of plastic per linear km at Hausgarten (2500 m). On dives between 5500 and 6770 m,
15 items of debris were observed, of which 13 were plastic, probably carried there by the
Norwegian current in the North Atlantic. At such latitude and bathymetry there is negligible
human activity, suggesting long distance transport of debris. Even more than on the sea surface
or strandlines of remote locations, such as in the Southern Ocean, accumulation trends in the
deep sea are of special concern. Most polymers are highly persistent in the marine environment
and only degrade slowly via photocatalysis when exposed to ultra-violet radiation (Andrady
2003). Estimates for the longevity of plastics are variable but are believed to be in the range of
hundreds or even thousands of years depending on the physical and chemical properties of the
polymer, but this is likely to be greatly increased at depth where oxygen concentrations are low
and light is absent. We know little about trends in accumulation of debris in the deep sea as
studies are rare but the data we have indicate considerable variability. For example in some
areas, such as the bay of Tokyo, debris densities decreased from 1996 to 2003 (Kanehiro et al.
1995; Kuriyama et al. 2003). In contrast, abundance remained stable in the gulf of Lion, France
during a similar period (Fig 6). Furthermore in some areas around Greece the abundance of
debris at depth has increased over the last 8 years (Stefatos et al. 1999; Koutsodendris et al.
2008). Interpretation of temporal trends is also complicated by annual variations in debris
transport, such as seasonal changes in flow rate of rivers. Other seasonal factors include
variation in the position of water fronts, the intensity of currents, swell, winds and upwelling
which influence both the distribution and densities. Nevertheless if we extrapolate from existing
data, it would appear that in the Mediterranean Sea as a whole there are about 3 x 10⁹ debris
items (floating or sunk) of which 70-80% are plastic. New initiatives to minimise littering and
to reduce, re-use and recycle plastic should ultimately reduce plastic input into the at sea,
although usage is still very high. However, fragmentation of macro- and megaplastics to
microplastic pieces will also contribute to future trends in the abundance of visible plastics.
4. FRAGMENTATION OF PLASTICS IN THE ENVIRONMENT
The longevity of plastics is a matter for some debate, and estimates range from hundreds to
thousands of years. It is considered that (with the exception of materials that have been
Page 12 of 37
http://mc.manuscriptcentral.com/issue-ptrsb
Submitted to Phil. Trans. R. Soc. B - Issue
123456789101112131415161718192021222324252627282930313233343536373839404142434445464748495051525354555657585960
For Review O
nly
incinerated) all of the conventional plastic that has ever been introduced into the environment
still remains to date unmineralised either as whole items or as fragments (Thompson et al.
2005). However, since we have only been mass-producing conventional plastics for around 60
years it is too early to say exactly how long these materials will persist. Despite the durability of
these polymers, plastic items are fragmenting in the environment as a consequence of prolonged
exposure to ultraviolet light and physical abrasion (Colton et al. 1974; Gregory 1978; Andrady
2003; Thompson et al. 2004). This is particularly evident on shorelines where photo-degradation
and abrasion through wave action makes plastic items brittle increasing their fragmentation.
Some of the first evidence of accumulation of plastic fragments in the environment came
indirectly from examination of the gut contents of sea birds in the 1960’s (e.g. Kenyon &
Kridler 1969). Later, in the early 1970’s, small fragments of plastic were observed in seawater
collected with plankton samples from the North Sea (Buchanan 1971) and were subsequently
reported on much broader scales in the north-western Atlantic (Colton et al. 1974). There have
since been numerous reports of fragments in the oceans, on the seabed and on shorelines
worldwide (Figure 7) and there is clear evidence that the abundance of these fragments is
increasing (Figure 8). The UK Marine Conservation Society, which organises annual voluntary
beach cleaning on shores all around the UK, reports a 30% increase in the abundance of large
fragments (1-50cm in size) and a 20% increase in the abundance of smaller fragments (<1cm)
between 1998 and 2006 (MCS 2007). On shorelines close to Plymouth one of us (RCT) recently
recorded strandline material with more than 10% (10.89 ± 0.67, mean ± standard deviation) by
weight of plastic fragments and pieces (including some plastic spherules, the raw materials for
manufacture). In 2004, Thompson et al. (2004) reported on the abundance of even smaller
fragments of plastic, some just 20µm, in diameter, which had accumulated on shorelines around
the UK. Using plankton samples archived by the Sir Alistair Hardy Foundation for Ocean
Science it was evident that the abundance of this microscopic debris had increased significantly
in recent years (Figure 8). Similar fragments have since been identified from shorelines
worldwide (Figure 7) and in terms of numerical abundance microplastic can constitute over 80%
of intertidal plastic debris at some locations (Browne et al. 2007).
Fragments of plastic can be identified using Fourier Transform Infrared (FT-IR)
Spectroscopy to match spectra obtained from unknown debris items to those of known
polymers. Using this approach a range of common polymers including polypropylene,
polyethylene and polyester have been identified as fragments and microscopic fragments. These
materials have a wide range of domestic and industrial uses from rope and packaging to clothing
and it seems likely that the fragments are forming from the breakdown of a wide range of
Page 13 of 37
http://mc.manuscriptcentral.com/issue-ptrsb
Submitted to Phil. Trans. R. Soc. B - Issue
123456789101112131415161718192021222324252627282930313233343536373839404142434445464748495051525354555657585960
For Review O
nly
everyday plastic products (Thompson et al. 2004). In addition to this ‘natural’ deterioration, it
has been suggested that plastic items are also deliberately being shredded on board some ships
in order that plastic waste can be concealed in food waste discharged at sea (van Franeker et al.
2005). The abundance of small items of plastic is further increased by the use plastic particles as
scrubbers and abrasives in commercial cleaning applications (Gregory 1996) and by spillage of
pre-production plastic pellets (~ 5mm in diameter) and powders such as those used for
rotomoulding (~ 300µm in diameter) (e.g. Carpenter et al. 1972; Colton et al. 1974; Gregory
1978). Hence it is apparent that small items of plastic are entering the environment directly and
that larger items of debris are fragmenting.
The accumulation of plastic fragments is of particular concern because they are difficult
to remove from the environment and because they have the potential to be ingested by a much
wider range of organisms than larger items of debris. Marine mammals, turtles and numerous
other organisms are known to ingest large items of plastic including bags and bottles (Laist
1997; Derraik 2002). Smaller fragments can be ingested by birds, fish and even invertebrates
(Thompson et al. 2004; Van Franeker et al. 2005). Upon ingestion it is possible that these small
fragments may present a physical hazard in a similar way to larger items of debris by clogging
feeding appendages or the digestive system (Laist 1997; Derraik 2002). Microscopic fragments
are also be taken up from the gut into other body tissues (Browne et al. 2008). In addition to
concerns about the physical hazards presented by this debris it has also been suggested that
plastics could transfer harmful chemicals to living organisms (e.g. Oehlmann et al., Talsness et
al. and Kock et al. all in this volume). A range of chemicals are used as additives in the
manufacture of plastics. These increase the functionality of the plastics, but some such as
phthalate plasticisers and brominated flame retardants are potentially harmful and have been
associated with carcinogenic and endocrine disrupting effects (see Takada et al. this volume). In
seawater, plastics are also known to sorb and concentrate contaminants, which have arisen in the
environment from other sources. These contaminants include persistent organic “pollutants”
such as PCBs DDE, nonylphenol and phenanthrene can become several orders of magnitude
more concentrated on the surface of plastic debris than in the surrounding seawater (Mato et al.
2001). It has been widely suggested that these sorbed contaminants and the chemicals additives
that are used in manufacture could subsequently be released if the plastics are ingested (see
Takada et al. this volume). Small and microscopic plastic fragments present a likely route for
the transfer of these chemicals because they have a much greater surface area to volume ratio
than larger items of debris from which they have originated and because of their size they are
available to a wide range of organisms, including deposit feeders like the lug worm, Arenicola
Page 14 of 37
http://mc.manuscriptcentral.com/issue-ptrsb
Submitted to Phil. Trans. R. Soc. B - Issue
123456789101112131415161718192021222324252627282930313233343536373839404142434445464748495051525354555657585960
For Review O
nly
marina, that feed by stripping organic matter from particulates (Mayer et al. 1997; Voparil et al.
2004). Recent in-vitro modelling studies predict that even very small quantities of microplastic
have the potential to significantly increase the transport of phenanthrene to A. marina (Teuten et
al. 2007) and work in this volume has examined uptake of contaminants from plastics by birds
(Takada et al this volume).
Given current levels of production and the quantities of plastic that are already present in
the environment it seems inevitable that the abundance of plastic fragments will continue to
increase for the foreseeable future. More work is therefore needed to model the environmental
consequences of this debris and to produce environmental risk assessment models to predict the
transport of a range of contaminants by fragments of common polymers (Thompson et al. 2005;
Thompson 2006; Teuten et al. 2007).
5. SUMMARY AND CONCLUSIONS
Less than 60 years ago, the mass production of plastics started and now most items that people
use, virtually anywhere on the planet are partly or wholly made of this inexpensive, durable
material. Plastics have transformed the surface of the planet far beyond areas of human
population density – fragments of all sizes are ubiquitous in soils to lake beds, from remote
Antarctic island shores to tropical sea-beds. Plastics turn up in bird nests, are worn by hermit
crabs instead of shells and are present in turtle stomachs. Human populations generate
considerable amounts of waste and the quantities are increasing as standards of living and
population also increase. Although quantities vary between countries, about 10% of solid waste
is plastic. Up to 80% or sometimes more of the waste that accumulates on land, shorelines, the
ocean surface or seabed is plastic. The most common items are plastic films, such as carrier
bags, which are easily wind blown as well as discarded fishing equipment and food and
beverage packaging. Strandline surveys (beach cleaning operations) are now organised in many
countries and provide information about temporal and spatial trends. However, these surveys
typically only provide data on coarse trends and larger items. There is considerable variation in
methodology between regions and between investigators and more valuable and comparable
data could be obtained by standardising monitoring approaches (Ryan et al. this volume).
Accumulation rates vary widely with many factors such as proximity of urban settlements, shore
use, prevailing wind and ocean currents, and region. There were dramatic increases in quantities
of mega and macro-plastic debris in the northern hemisphere up to the 1990s. Quantities of
debris in the oceans appear to have stabilised in the oceans over the last decade but have
increased on shorelines. However this could indicate quantities of debris entering the sea are
Page 15 of 37
http://mc.manuscriptcentral.com/issue-ptrsb
Submitted to Phil. Trans. R. Soc. B - Issue
123456789101112131415161718192021222324252627282930313233343536373839404142434445464748495051525354555657585960
For Review O
nly
declining, but the material already in the sea is progressively being deposited on the shore or
sinking to the deep. . Accumulation rates are much lower in the southern hemisphere but are
still increasing significantly, although repeat surveys on remote Antarctic islands and ocean
areas suggest stabilisation over the last decade. Fouled by organisms and sediment, plastics can
sink and form an even higher proportion of human waste reaching the seabed and quantities in
excess of tens of thousands of items per km2 have been reported. As on beaches and the ocean
surface, enclosed seas such as the Mediterranean have the highest densities, but investigations in
deeper waters have shown high accumulation rates can stretch far (hundreds of km) from the
coast, particularly adjacent to large river mouths or in canyons. As on surface environments,
trends of debris accumulation on the seabed increase at some locations, but are stable or
decreasing at other sites. Quantities of debris in the oceans appear to have stabilised in the
oceans over the last decade but have increased on shorelines. The problem of plastic fragments
has taken on increased importance in the last few decades. From the first reports in the 1970s,
it was only a few years before the widespread finding of plastic including reports of microscopic
fragments (20µm in diameter). The abundance of microscopic fragments was greater in the
1980s and 1990s was than in previous decades. It has also been suggested that plastic waste is
deliberately being shredded into fragments to conceal and discarded at sea. Plastics of all sizes
are now reaching the most remote and deepest parts of the planet and although we have much
better knowledge of their sources, quantities, and distribution, we still understand little about
their longevity, and affects on organisms. Further, we have made little progress in reducing the
release of plastic to the environment. Temporal trends of macroplastics on remote islands
suggest regulations to reduce dumping at sea have been successful to some extent. However our
sustained demand for plastic means that contamination of the environment by microplastic
pieces seems set to increase. In addition, future sampling may reveal increasing quantities of
debris in the planet’s least known habitat, the deep sea.
Acknowledgements: The authors would like to thank past marine debris observers on beaches and ships who have
generously given up their time and effort to recording items. The authors would also like to thank Alison Cook for
help in preparation of Figure 7; also Mark Brown and Stuart Niven for analysis of microplastic data in Figure 7.
Page 16 of 37
http://mc.manuscriptcentral.com/issue-ptrsb
Submitted to Phil. Trans. R. Soc. B - Issue
123456789101112131415161718192021222324252627282930313233343536373839404142434445464748495051525354555657585960
For Review O
nly
REFERENCES
Acha, E., Hermes, W., Mianzan, A., Iribarne, C., Domingo, A., Gagliardini, C., Carlos Lasta, A.
& Pedro Daleo, D. 2003 The role of the Rıo de la Plata bottom salinity front in
accumulating debris. Mar. Poll. Bull. 46, 197-202
Andrady, A.L. 2003 Plastics in the Environment. In: Andrady AL (ed) Plastics in the
Environment. John Wiley & Sons, New Jersey, pp 762
Andrady, A.L. & Neal, Phil. Trans. Roy. Soc. Lond. B In press
APME 2006 An analysis of plastics production, demand and recovery in Europe. Association of
Plastics Manufacturers Brussels
Barlaz, M.A. 2006 “Forest Products Decomposition in Municipal Solid Waste Landfills,” Waste
Manage. 26, 321–333.
Barnes, D.K.A. 2002 Invasions by marine life on plastic debris. Nature 416, 808-809
Barnes, D.K.A. 2005 Remote islands reveal rapid rise of Southern Hemisphere sea debris.
Directions Sci. 5, 915-921
Barnes, D.K.A. & Milner, P. (2005) Drifting plastic and its consequences for sessile organism
dispersal in the Atlantic Ocean. Mar. Biol. 146, 815-825
Breton, M. & Salomon, J. C. 1995 A long term advection- dispersion model for the channel and
southern North Sea. J. Mar. Syst. 6, 495-513
Browne, M.A., Galloway, T. & Thompson, R. (2007) Microplastic – an emerging contaminant
of potential concern. Integr. Envir. Assess. Manage. 3, 559-566
Browne, M.A., Dissanayake, A., Galloway, T.S., Lowe, D.M. & Thompson R.C. (2008)
Ingested microscopic plastic translocates to the circulatory system of the mussel, Mytilus
edulis (L.) Environmental Sci. & Technol. 42, 5026-5031
Buchanan, J.B. 1971 Pollution by synthetic fibres. Mar. Poll. Bull. 2, 23
Burnley S.J. 2007 A Review of Municipal Solid Waste Composition in the United Kingdom.
Waste Manage. 27, 1274 - 85
Cannizarro, L., Garofalo,G., Giusto, G., Rizzo, P. & Levi, D. 1995 Qualitative and quantitative
estimate of solid waste in the Channel of Sicily. In Proceedings of the second
International, ed. E. Ozhan, Conference on the Mediterranean. Coastal Environment.
MED- COAST 95, 24±27 Oct, Tarragona, Spain.
Carpenter, E.J., Anderson, S.J., Harvey, G.R., Miklas, H.P. & Bradford, B.P. 1972 Polystyrene
spherules in coastal waters. Science 178, 749-750
Page 17 of 37
http://mc.manuscriptcentral.com/issue-ptrsb
Submitted to Phil. Trans. R. Soc. B - Issue
123456789101112131415161718192021222324252627282930313233343536373839404142434445464748495051525354555657585960
For Review O
nly
Coe, J.M., Andersson, S. & Rogers, D.B. 1997 Marine debris in the Caribbean region, p. 25-34,
In J. M. Coe and D. B. Rogers (eds), Marine debris: Sources, impact and solutions,
Springer Verlag, New York.
Colton, J.B., Knapp, F.D. & Burns, B.R. 1974 Plastic particles in surface waters of the
Northwestern Atlantic. Science 185, 491 - 497
Convey, P., Barnes, D.K.A. & Morton, A. 2002 Debris accumulation on oceanic island shores of
the Scotia Arc, Antarctica. Polar Biol. 25, 612-617
Dameron, O. J., Parke, M., Albins, M.A., & Brainard, R.E. 2007 Marine debris accumulation in
the Northwestern Hawaiian Islands: An examination of rates and processes. Mar. Poll.
Bull. 53 423-433
Delhez, E. & Martin, G. 1992 Preliminary results on 3-D baroclinic models of the mesoscale
and macroscale circulations on the North-western European continental shelf. J. Mar.
Syst. 3, 423-440
Derraik, J.G.B. 2002 The pollution of the marine environment by plastic debris : a review.
Mar. Poll. Bull. 44, 842-852
Dixon, T.R. & Dixon, T.J., 1981 Marine litter surveillance. Mar. Poll. Bull. 12, 289–295.
Endo, S., Takizawa, R., Okuda, K., Takada, H., Chiba, K., Kanehiro, H., Ogi, H., Yamashita, R.
& Date, T. 2005 Concentration of polychlorinated biphenyls (PCBs) in beached resin
pellets: Variability among individual particles and regional differences. Mar. Poll. Bull.
50, 1103-1114
Eriksson, C. & Burton, H. 2003 Origins and biological accumulation of small plastic particles in
fur seals from Macquarie Island. Ambio 32, 380-384
Eurostat, 2007 Waste generated and treated in Europe 1995-2003,
http://epp.eurostat.cec.eu.int/cache/ITY_OFFPUB/KS-55-03-471/EN/KS-55-03-471-
EN.PDF, accessed Dec. 4, 2007
Galgani, F. & Andral, B. 1998 Methods for evaluating debris on the deep sea floor.
OCEANS’98/IEEE/OEC Conference, Nice 28/09-01/10/98, 3, 1512-1521.
Galgani, F., Burgeot, T., Bocquene, G., Vincent, F. & Leaute, J. P. 1995a Abundance of debris
on the continental shelf of the Bay of Biscaye and in the Seine Bay. Mar. Poll. Bull. 30,
58-62.
Galgani, F., Jaunet, S., Campillo, A., Guenegan, X. & His, E. 1995b. Distribution and
abundance of debris on the continental shelf of the North-western Mediterranean Sea.
Mar. Poll. Bull. 30, 713-717.
Page 18 of 37
http://mc.manuscriptcentral.com/issue-ptrsb
Submitted to Phil. Trans. R. Soc. B - Issue
123456789101112131415161718192021222324252627282930313233343536373839404142434445464748495051525354555657585960
For Review O
nly
Galgani, F., Leaute, J.P., Moguedet, P., Souplet, A., Verin, Y., Carpentier, A., Goraguer, H.,
Latrouite, D., Andral, B., Cadiou, Y., Mahe, J.C., Poulard, J.C. & Nerisson, P. 2000
Litter on the sea floor along European coasts. Mar. Poll. Bull. 40, 516-527
Galgani, F. & Lecornu, F. 2004 Debris on the sea floor. at “Hausgarten”: in The expedition
ARKTIS XIX/3 of the research vessel POLARSTERN in 2003. Berichte Polar
Meeresforsch., 488, 260-262.
Galgani, F., Souplet, A. & Cadiou, Y. 1996 Accumulation of debris on the deep sea floor of the
French Mediterranean coast. Mar. Ecol. Progr. Ser. 142, 225-234
Galil, B. S., Golik, A. & Tuerkay, M., 1995 Litter at the bottom of the sea. A sea-bed survey in
the eastern Mediterranean sea. Mar. Poll. Bull. 30, 22-24.
Goldberg, E. 1994 Diamonds and plastics are forever? Editorial. Mar. Poll. Bull. 28, 466
Goldberg, E. 1995 Emerging Problems in the Coastal Zone for the Twenty-First Century. Mar.
Poll. Bull., 31, 152-158.
Gregory, M.R. 1978 Accumulation and distribution of virgin plastic granules on New Zealand
beaches. New Zealand J. Mar. Freshwat. Res. 12, 339-414
Gregory, M.R. 1996 Plastic 'scrubbers' in hand cleansers: A further (and minor) source for
marine pollution identified. Mar. Poll. Bull. 32, 867-871
Gregory, M.R. 1999 Plastics and South Pacific Island shores: environmental implications.
Ocean Coastal Manag. 42, 603-615
Gregory, M.R. This issue. Environmental implications of plastic debris in marine settings –
entanglement, ingestion, smothering, hangers-on, hitch-hiking, and alien invasions. Phil.
Trans. Roy. Soc. Lond. B In press
Gregory, M.R., Kirk, R.M.. & Mabin, M.C.G. 1984 Pelagic tar, oil, plastics and other litter in
surface waters of the New Zealand sector of the Southern Ocean and on Ross
Dependency shores. N.Z. Antarct. Record 6, 12-28
Page 19 of 37
http://mc.manuscriptcentral.com/issue-ptrsb
Submitted to Phil. Trans. R. Soc. B - Issue
123456789101112131415161718192021222324252627282930313233343536373839404142434445464748495051525354555657585960
For Review O
nly
Gregory, M.R. & Ryan, P. 1997 Pelagic plastics and other seaborne persistent synthetic debris:
a review of Southern Hemisphere perspectives. In Coe, J. & Rogers, D. (eds.) Marine
debris: sources, impacts and solutions. Springer & Verlag, New York, 49-66
Habib, B., Locke, D.C. & Cannone, L.J. 1996 Synthetic fibers as indicators of municipal sewage
sludge, sludge products and sewage treatment plant effluents. Water Air Soil Poll. 103,
1-8.
Harper, P. C. & Fowler, J. A. 1987. Plastic pellets in New Zealand storm-killed prions
(Pachyptila spp.), 1958-1977. Notornis 34, 65-70.
Hartwig, E., Clemens, T. & Heckroth, M. 2007 Plastic debris as nesting material in a Kittiwake-
(Rissa tridactyla)-colony at the Jammerbugt, Northwest Denmark. Mar. Poll. Bull. 54,
595-597
Hess, N., Ribic, C., & Vining, Y., 1999 Benthic Marine Debris, with an Emphasis on Fishery-
Related Items,Surrounding Kodiak Island, Alaska,1994-1996. Mar. Poll. Bull., 38, 885-
890
Ivar do Sul, J.A. & Costa, M.A. 2007 Marine debris review for Latin America and the Wider
Caribbean Region: From the 1970s until now, and where do we go from here? Mar.
Poll. Bull., 54, 1087-1104
June, J. A. 1990 Type, source, and abundance of trawl-caught debris of. Oregon, in the Eastern
Bering Sea, and in Norton Sound in 1988. In Proceedings of the Second International
Conference on Marine Debris, eds. R. S. Shomura and M. L. Godfrey, pp. 279-301. US
Department of Commerce, NOAA Technical Memo. NMFS-SWF-SC-154.
Kanehiro, H., Tokai, T. & Matuda, K., 1995 Marine litter composition and distribution on the
sea-bed of Tokyo Bay. Fisheries Engineering 31, 195-199.
Katsanevakis, S. & Katsarou, A. 2004 Influences on the distribution of marine debris on the
seafloor of shallow coastal areas in Greece (Eastern Mediterranean), Water, Air Soil
Poll. 159, 325–337.
Page 20 of 37
http://mc.manuscriptcentral.com/issue-ptrsb
Submitted to Phil. Trans. R. Soc. B - Issue
123456789101112131415161718192021222324252627282930313233343536373839404142434445464748495051525354555657585960
For Review O
nly
Kenyon, K. W. & Kridler, E. 1969. Laysan Albatross swallow indigestible matter. Auk 86, 339-
343.
Koch, H.M. and Calafat, A.M. . Human body burdens of chemicals used in plastic manufacture.
Phil. Trans. Roy. Soc. Lond. B in press - this volume.
Koutsodendris, A., Papatheodorou, A., Kougiourouki, O. & Georgiadis, M., 2008 Benthic
marine litter in four Gulfs in Greece, Eastern Mediterranean; abundance, composition
and source identification. Est. Coast. Shelf Sci., 77, 501-12.
Kuriyama, Y., Tokai, T., Tabata, K. & Kanehiro, H., 2003 Distribution and composition of litter
on seabed of Tokyo Gulf and its age analysis. Nippon Suisan Gakkaishi 69, 770-781.
Kusui, T. & Noda, M. 2003 International survey on the distribution of stranded and buried litter
on beaches along the Sea of Japan. Mar. Poll. Bull. 47, 175-179
Laist DW (1997) Impacts of marine debris: entanglement of marine life in marine debris
including a comprehensive list of species with entanglement and ingestion records. In:
Coe JM, Rogers BD (eds) Marine Debris: sources, impacts and solutions. Springer,
Berlin, pp 99-141
Lee D., Hyeon-Seo, C. & Sun-Beom, J. 2006 Distribution characteristics of marine litter on the
sea bed of the East China Sea and the South Sea of Korea Est. Coast. Shelf Sci., 70,
187-194.
Loughlin, D. H. & Barlaz, M. A. 2006 Policies for Strengthening Markets for Recyclables: A
Worldwide Perspective. Env. Sci. Technol., 36, 287 – 326.
Masó, M., Garcés, J., Pagès, F. & Camp, J. 2003 Drifting plastic debris as a potential vector for
dispersing Harmful Algal Blooms (HAB) species. Sci. Mar. 67, 107-111
Mato, Y., Isobe, T., Takada, H., Kanehiro, H., Ohtake, C. & Kaminuma, T. 2001 Plastic resin
pellets as a transport medium for toxic chemicals in the marine environment. Enviro Sci
Technol 35, 318-324
Page 21 of 37
http://mc.manuscriptcentral.com/issue-ptrsb
Submitted to Phil. Trans. R. Soc. B - Issue
123456789101112131415161718192021222324252627282930313233343536373839404142434445464748495051525354555657585960
For Review O
nly
Matsumura, S. & Nasu, K. 1997 Distribution of floating debris in the North pacific Ocean:
sighting surveys 1986-1991, p. 15-24. In J. M. Coe and D. B. Rogers [eds], Marine
debris: Sources, impact and solutions, Springer verlag, New York.
Mayer, L.M., Schick, L.L., Self, R.F.L., Jumars, P.A., Findlay, R.H., Chen, Z. & Sampson, S.
1997 Digestive environments of benthic macroinvertebrate guts: Enzymes, surfactants
and dissolved organic matter. J. Mar. Res. 55, 785-812
MCS 2007 Beachwatch 2006 - The 14th Annual Beach Litter Survey Report. Marine
Conservation Society, Ross on Wye
Moore C.J., Moore, S. L., Leecaster, M.K. & Weisberg, S. B. 2001a A Comparison of Plastic
and Plankton in the North Pacific Central Gyre. Mar. Poll. Bull. 42, 1297-1300
Moore, S.L. & Allen, M.J. 2000 Distribution of anthropogenic and natural litter on the mainland
shelf of the Southern California Bight. Mar. Poll. Bull. 40, 83-88.
Moore, S.L., Gregorio, D., Carreon, M., Weisberg, S. B. & Leecaster, M. K. 2001b Composition
and distribution of beach debris in Orange County, California. Mar. Poll. Bull. 42, 241-
245
Morishige, C., Donohue, M.J., Flint, E., Swenson, C. & Woolaway, C. 2007 Factors affecting
marine debris deposition at French Frigate Shoals, Northwestern Hawaiian Islands
Marine National Monument, 1900-2006. Mar. Poll. Bull. 54, 1162-1169
Ng, K.L. & Obbard, J.P. 2006 Prevalence of microplastics in Singapore's coastal marine
environment. Mar. Poll. Bull. 52, 761-767
Oehlmann, J., Schulte-Oehlmann, U., Kloas, W., Jagnytsch, O., Lutz, I., Kusk, K.O.,
Wollenberger, L., Santos, E.M., Paull, G.C., Van Look, K.J.W. and Tyler, C.R. in press
A critical analysis of the biological impacts of plasticizers on wildlife Phil. Trans. Roy.
Soc. Lond. B in press - this volume.
Page 22 of 37
http://mc.manuscriptcentral.com/issue-ptrsb
Submitted to Phil. Trans. R. Soc. B - Issue
123456789101112131415161718192021222324252627282930313233343536373839404142434445464748495051525354555657585960
For Review O
nly
Oigman-Pszczol, S.S. & Creed, J.C. 2007 Quantification and Classification of Marine Litter on
Beaches along Armação dos Búzios, Rio de Janeiro, Brazil. J. Coastal Res. 23, 421–428
Pichel, W.G., Churnside, J.N., Veenstra, T., Foley, D.G., Friedman, K., Wilson, J., Brainard,
R.E., Nicoll, J., Zheng, X.& Clemente-Colón, P. 2007 Detection of Marine Debris in the
North Pacific Subtropical Convergence Zone. Mar. Poll. Bull. 54, 1207-1211
Plastics Europe (2008), Annual Report 2007, 36pp. Association of Plastics Manufacturers,
Brussels, Belgium.
Reddy, M.S., Basha, S., Adimurthy, S. & Ramachandraiah, G. 2006 Description of the small
plastics fragments in marine sediments along the Alang-Sosiya ship-breaking yard,
India. Est. Coast. Shelf Sci. 68, 656-660
Ribic, C.A., Johnson, S.W., Cole, C.A. 1997 Distribution, type, accumulation, and source of
marine debris in the United States, 1989-1993, p. 35-48. In J. M. Coe and D. B. Rogers
[eds], Marine debris: Sources, impact and solutions, Springer verlag, New York.
Ryan, P.G. & Moloney, C.L. 1993 Marine litter keeps increasing. Nature 361, 23
Ryan, P.G., Moore, C.J., van Franeker, J.A. & Moloney, C.L. This volume. Monitoring the
abundance of plastic debris in the environment. Phil. Trans. Roy. Soc. Lond. B In press
Santos I.R., Friedrich, A.C. & Baretto, F.P. 2005 Overseas garbage pollution on beaches of
northeast Brazil. Mar. Poll. Bull. 50, 783-786
Shaw, D.G. & Day, R.H. 1994 Color and form-dependent loss of plastic micro-debris from the
North Pacific-Ocean. Mar. Poll. Bull. 28, 39-43
Sokka L., Antikainen R. & Kauppi, P.E. 2007 Municipal solid waste production and
composition in Finland - Changes in the period 1960-2002 and prospects until 2020
Resources Conserv. Recycling 50, 475 - 88.
Stefatos, M., Charalampakis, M., Papatheodorou, G. & Ferentinos, G. 1999 Marine Debris on
the Sea-floor of the Mediterranean Sea: Examples from Two Enclosed Gulfs in Western
Greece. Mar. Poll. Bull. 36, 389-393.
Page 23 of 37
http://mc.manuscriptcentral.com/issue-ptrsb
Submitted to Phil. Trans. R. Soc. B - Issue
123456789101112131415161718192021222324252627282930313233343536373839404142434445464748495051525354555657585960
For Review O
nly
Teuten, E.L., Saquing, J.M., Knappe, D.R.U., Barlaz, M.A., Jonsson, S., Björn, A., Rowland,
S.J., Thompson, R.C., Galloway, T.S., Yamashita, R.,, Ochi, R., Watanuki, Mohamad,
P.Z., Ogata, Y., Hirai, H., Iwasa, S., Mizukawa, K., Hagino, Y., Imamura, A., Saha, M.,
Takada, H. (in press) Transport and release of chemicals from plastics to the
environment and to wildlife Phil. Trans. Roy. Soc. Lond. B in press - this volume.
Talsness, C.E. Andrade, A.J.M. and vom Saal F.S. (in press) Components of plastic:
experimental studies in animals and relevance for human health . Trans. Roy. Soc. Lond.
B in press - this volume.
Tappin, A., Burton, J. D., Millward, G. E. & Statham, P. J. 1997 A numerical transport model
for predicting the distributions of Cd, Cu, Ni, Pb an Zn in the southern North Sea: The
sensitivity of model results to uncertainties in the magnitudes of metal inputs. J. Mar.
Syst. 13, 173- 204.
Teuten, E.L., Rowland, S.J., Galloway, T.S. & Thompson, R.C. 2007 Potential for plastics to
transport hydrophobic contaminants. Environment. Sci. Technol 41, 7759-7764
Thompson, R., Moore, C., Andrady, A., Gregory, M., Takada, H. & Weisberg, S. 2005 New
directions in plastic debris. Science 310, 1117
Thompson, R.C. 2006 Plastic debris in the marine environment: consequences and solutions. In:
Krause JC, von Nordheim H, Brager S (eds) Marine Nature Conservation in Europe.
Federal Agency for Nature Conservation, Stralsund, Germany, pp 107-116
Thompson, R.C., Olsen, Y., Mitchell, R.P., Davis, A., Rowland, S.J., John, A.W.G., McGonigle,
D. & Russell A.E. 2004 Lost at sea: Where is all the plastic? Science 304, 838
Torres, D. & Jorquera, D. 1999 Synthesis of marine debris survey at Cape Shirreff, Livingston
Island, during the Antarctic season 1998/99. CCAMLR-XVIII/BG/39. CCAMLR,
Hobart, Australia.
Page 24 of 37
http://mc.manuscriptcentral.com/issue-ptrsb
Submitted to Phil. Trans. R. Soc. B - Issue
123456789101112131415161718192021222324252627282930313233343536373839404142434445464748495051525354555657585960
For Review O
nly
US EPA 2006 Municipal Solid Waste in the United States; 2005 Facts and Figures. United
States Environmental Protection Agency, Office of Solid Waste, EPA530-R-06-011,
Washington, D.C.
van Franeker, J.A. & Bell, P.J. 1988 Plastic ingestion by petrels breeding in Antarctica. Mar.
Poll. Bull. 19, 672-674
van Franeker, J.A., Meijboom, A. & de Jong, M.L. 2004 Marine litter monitoring by Northern
Fulmars in the Netherlands 1982-2003. Alterra, 1093, Wageningen
Van Franeker, J. A., Heubeck, M., Fairclough, K., Turner, D. M., Grantham, M., Stienen, E. W.
M., Guse, N., Pedersen, J., Olsen, K. O., Andersson, P. J. & Olsen, B. 2005. 'Save the
North Sea' Fulmar Study 2002-2004: a regional pilot project for the Fulmar-Litter-
EcoQO in the OSPAR area. Alterra-rapport 1162. Wageningen: Alterra (available at
www.zeevogelgroep.nl)
Voparil, I.M., Burgess, R.M., Mayer, L.M., Tien, R., Cantwell, M.G. & Ryba, S.A. 2004
Digestive bioavailability to a deposit feeder (Arenicola marina) of polycyclic aromatic
hydrocarbons associated with anthropogenic particles. Environment. Toxicol. Chem. 23,
2618-2626
Walker, T.R., Reid, K., Arnould, J.P.Y. & Croxall, J. (1997) Marine debris surveys at Bird
Island, South Georgia 1990-1995. Mar. Poll. Bull. 34, 61-65
Weiss, K.R., McFarling, U.L. & Loomis, R. (2006) Plague of plastic chokes the seas. Los
Angeles Times, August 2.
Williams, A. & Simmons, S. 1997 Estuarine litter at the estuarine/ beach interface in the Bristol
Channel. J. Coast. Res., 13, 1159-1165.
World Bank 2005 Waste Management in China: Issues and recommendations. Urban
Development Working Papers, East Asia Infrastructure Development, Working Paper
No. 9.
Page 25 of 37
http://mc.manuscriptcentral.com/issue-ptrsb
Submitted to Phil. Trans. R. Soc. B - Issue
123456789101112131415161718192021222324252627282930313233343536373839404142434445464748495051525354555657585960
For Review O
nly
Figure and table legends
Figure 1 Production of Plastic Products in the U.S. in 2005 (adopted from US EPA, 2006)
Figure 2 Annual accumulation of marine debris on shores of selected islands with year. Data for Bird I. and Signy I. are from Walker et al. (1997), Convey et al. (2002) and CCAMLR. Data for Tern I. are from Morishige et al.(2007) and for the UK from Beachwatch 2006 (MCS 2007).
Figure 3 Densities of marine debris at sea in the South-West Atlantic and Atlantic sector of the Southern Ocean by 10 degree latitude and longitude areas. Shades of light to dark blue code for densities 0-1, 2-10, 11-100, 101-1000 and 1001+ items per km2 respectively. The survey years are April 1993 (a), April 2002 (b) and April 2006 (c). Data from Barnes & Milner (2005) and present study.
Figure 4 Plastic debris on the sea-bed from the southern North Sea (North Atlantic) in 1999. Plastics were counted after 30 minutes trawl time (16 m mouth, 20 mm mesh) at 64 stations (●) on the continental shelf. Results are given as items per Ha (10,000 m2).
Figure 5 Accumulation of debris in deep sea environments. Submersible observations in Mediterranean canyons (A & B: plastic bottles at 1000 m depth at two different locations in the Marseille canyon, 43°03”.00N 05°00”.00 E) and above the polar circle, under ice floe (C & D: individual plastic bags, 2200-2600 m depth at Hausgarten, Fram strait, 79°03”.80 N 04°11”.60 E ).
Figure 6 Plastic debris on the sea floor from the Gulf of Lion (Mediterranean Sea , France) between 1994 and 2004. Plastics were counted after 60 minutes trawl time (net = 16 m mouth, 10 mm mesh) at 65 stations (●) located on the continental shelf and adjacent canyons (down to 800m) from the gulf. Results are given as items per Ha (10,000 m2).
Figure 7 Reports of plastic fragments in the marine environment presented in chronological order: 1, Harper & Fowler (1987) report on plastic (mainly pre-production pellets) ingested by seabirds since 1960; 2, (Kenyon & Kridler 1969) plastic fragments found in body cavity of dead laysan Albatrosses during 1966 survey; 3, (Buchanan 1971) synthetic fibres in medium plankton net hauls (size not specified); 4, (Carpenter et al. 1972) polystyrene spherules (average 500 µm) in coastal waters; 5, (Colton et al. 1974) particles, spheres and discs (1-5mm) in surface waters; 6, (Gregory 1978) resin pellets (~5mm) on shoreline; 7 (Ryan and Moloney 1990) temporal trends in abundance and composition of plastic on beaches 1984 to 1989; 8, (van Franeker & Bell 1988) plastic particles (~ 3mm) in gut of Storm Petrels; 9, (Shaw & Day 1994) fragments (≥ 500µm) at sea surface; 10, (Habib et al. 1996) Microplastic fibres ( ≥ 20µm) in sewage sludge; 11, (Galgani et al. 2000) Fragments in deep sea (size not specified); 12, (Moore et al. 2001a) fragments (≥ 350µm) at sea surface; 13, (Moore et al. 2001b) fragments and resin pellets on shoreline (size not specified); 14, (Eriksson & Burton 2003) fragments (≥1mm) in scats of fur seals; 15, (Kusui & Noda 2003) fragments (≥1mm) on beaches; 16, (Thompson et al. 2004)Microplastics (≥ 20µm) in surface waters and on beaches; 17, (Endo et al. 2005) resin pellets (~5mm) on beaches; 18, (Reddy et al. 2006) microplastics (≥10µm) on shorelines near ship breaking yards; 19, (Ng & Obbard 2006) Microplastics in surface waters and sediments (≥1.6µm). Red squares show distribution of microplastics (≥ 20µm) in intertidal sediments (Thompson et al unpublished data). White dots show mega and macroplastic strandline surveys (Barnes 2002, 2005).
Comment [r1]: Will need to modify if published in Black & White
Page 26 of 37
http://mc.manuscriptcentral.com/issue-ptrsb
Submitted to Phil. Trans. R. Soc. B - Issue
123456789101112131415161718192021222324252627282930313233343536373839404142434445464748495051525354555657585960
For Review O
nly
Figure 8 Microscopic plastic in surface waters, collected with Continuous Plankton Recorder, revealed a significant increase in abundance when samples from the 1960s and 1970s were compared with the 1980s and 1990s (* = F 3,3 = 14.42, P < 0.05). Global production of plastic overlain for comparison (APME 2006). Adapted from Thompson et al. (2004).
Page 27 of 37
http://mc.manuscriptcentral.com/issue-ptrsb
Submitted to Phil. Trans. R. Soc. B - Issue
123456789101112131415161718192021222324252627282930313233343536373839404142434445464748495051525354555657585960
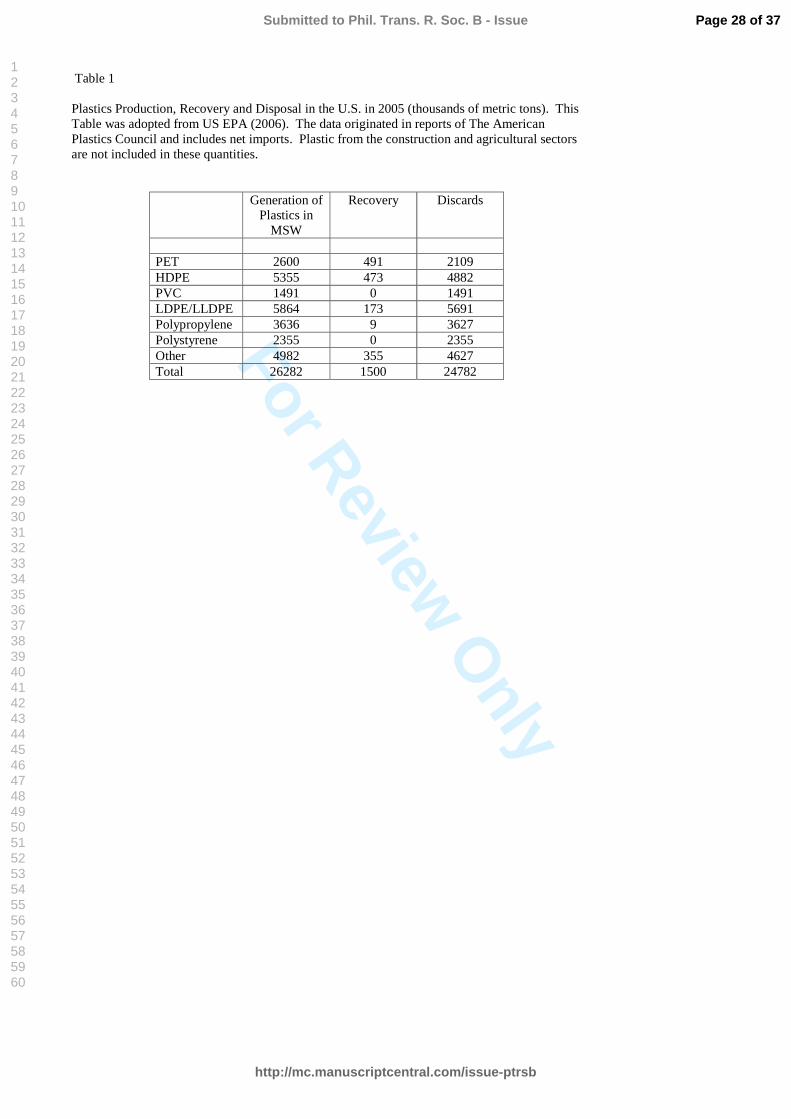
For Review O
nly
Table 1
Plastics Production, Recovery and Disposal in the U.S. in 2005 (thousands of metric tons). This Table was adopted from US EPA (2006). The data originated in reports of The American Plastics Council and includes net imports. Plastic from the construction and agricultural sectors are not included in these quantities.
Generation of Plastics in
MSW
Recovery Discards
PET 2600 491 2109HDPE 5355 473 4882PVC 1491 0 1491LDPE/LLDPE 5864 173 5691Polypropylene 3636 9 3627Polystyrene 2355 0 2355Other 4982 355 4627Total 26282 1500 24782
Page 28 of 37
http://mc.manuscriptcentral.com/issue-ptrsb
Submitted to Phil. Trans. R. Soc. B - Issue
123456789101112131415161718192021222324252627282930313233343536373839404142434445464748495051525354555657585960
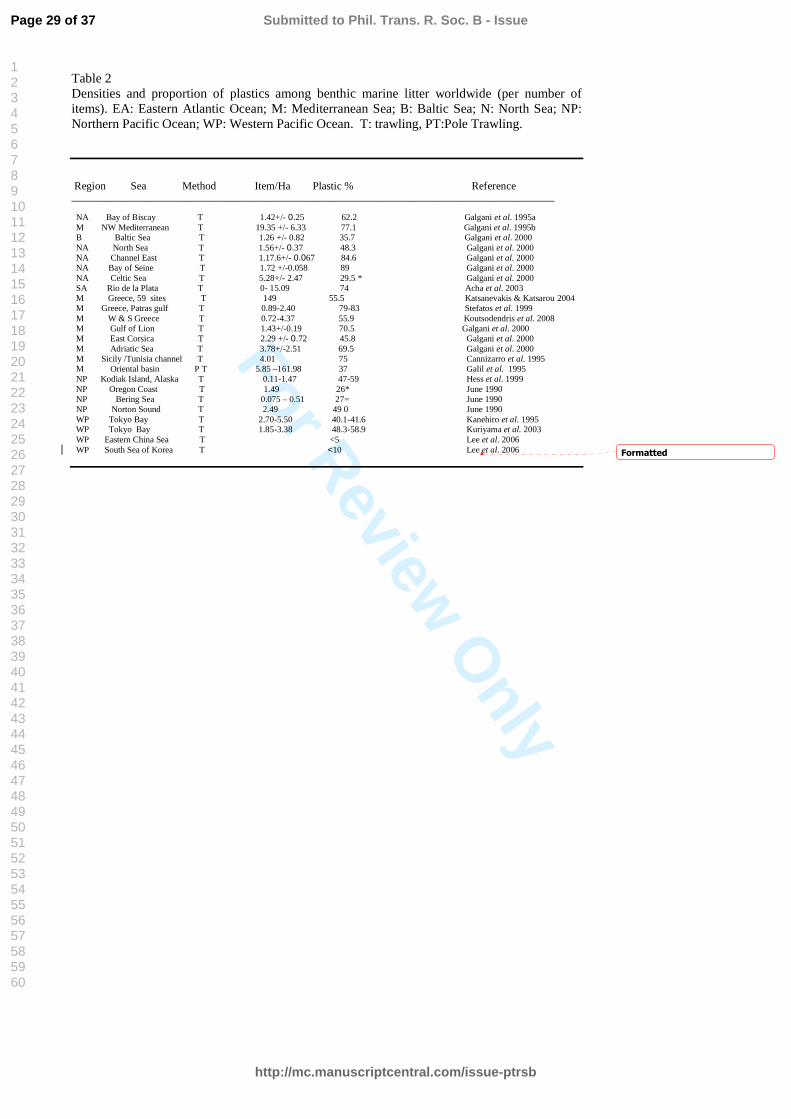
For Review O
nly
Table 2Densities and proportion of plastics among benthic marine litter worldwide (per number of items). EA: Eastern Atlantic Ocean; M: Mediterranean Sea; B: Baltic Sea; N: North Sea; NP: Northern Pacific Ocean; WP: Western Pacific Ocean. T: trawling, PT:Pole Trawling.
Region Sea Method Item/Ha Plastic % Reference______________________________________________________________________________________________________________
NA Bay of Biscay T 1.42+/- 0.25 62.2 Galgani et al. 1995a M NW Mediterranean T 19.35 +/- 6.33 77.1 Galgani et al. 1995b B Baltic Sea T 1.26 +/- 0.82 35.7 Galgani et al. 2000 NA North Sea T 1.56+/- 0.37 48.3 Galgani et al. 2000 NA Channel East T 1.17.6+/- 0.067 84.6 Galgani et al. 2000 NA Bay of Seine T 1.72 +/-0.058 89 Galgani et al. 2000
NA Celtic Sea T 5.28+/- 2.47 29.5 * Galgani et al. 2000 SA Rio de la Plata T 0- 15.09 74 Acha et al. 2003
M Greece, 59 sites T 149 55.5 Katsanevakis & Katsarou 2004M Greece, Patras gulf T 0.89-2.40 79-83 Stefatos et al. 1999M W & S Greece T 0.72-4.37 55.9 Koutsodendris et al. 2008
M Gulf of Lion T 1.43+/-0.19 70.5 Galgani et al. 2000 M East Corsica T 2.29 +/- 0.72 45.8 Galgani et al. 2000 M Adriatic Sea T 3.78+/-2.51 69.5 Galgani et al. 2000
M Sicily /Tunisia channel T 4.01 75 Cannizarro et al. 1995 M Oriental basin P T 5.85 –161.98 37 Galil et al. 1995 NP Kodiak Island, Alaska T 0.11-1.47 47-59 Hess et al. 1999
NP Oregon Coast T 1.49 26* June 1990NP Bering Sea T 0.075 – 0.51 27= June 1990
NP Norton Sound T 2.49 49 0 June 1990 WP Tokyo Bay T 2.70-5.50 40.1-41.6 Kanehiro et al. 1995 WP Tokyo Bay T 1.85-3.38 48.3-58.9 Kuriyama et al. 2003 WP Eastern China Sea T <5 Lee et al. 2006 WP South Sea of Korea T <10 Lee et al. 2006
_proof _
Formatted
Page 29 of 37
http://mc.manuscriptcentral.com/issue-ptrsb
Submitted to Phil. Trans. R. Soc. B - Issue
123456789101112131415161718192021222324252627282930313233343536373839404142434445464748495051525354555657585960
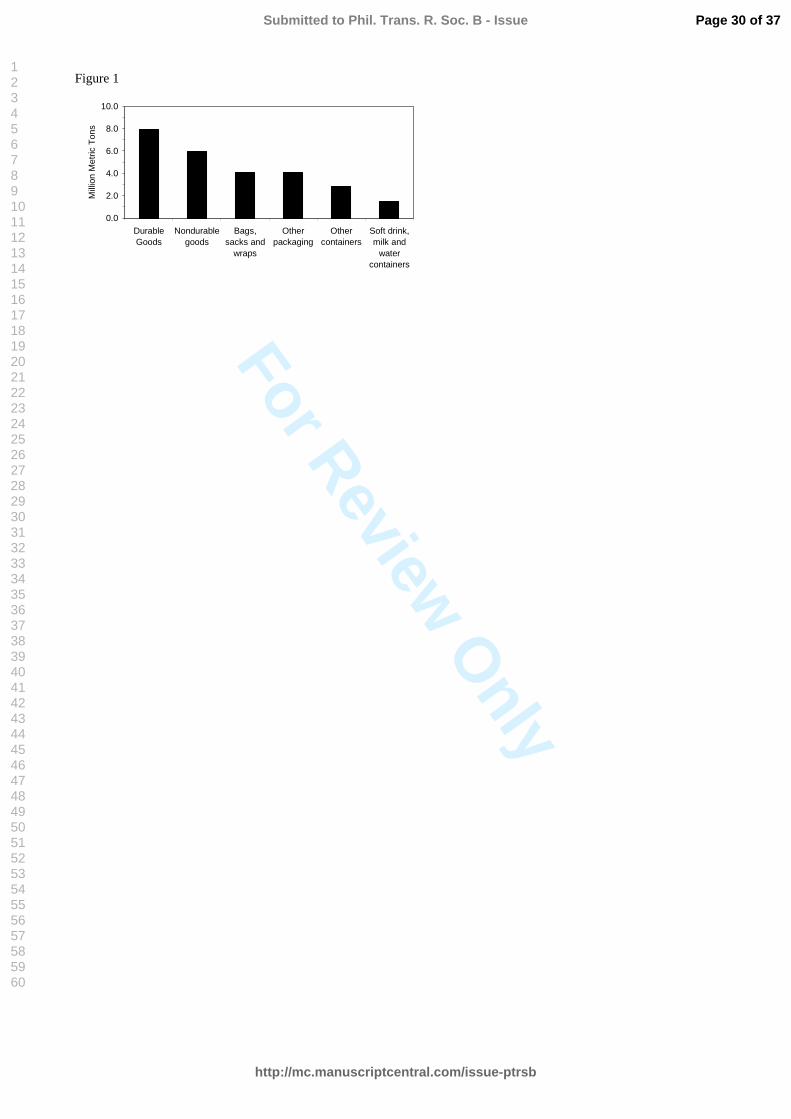
For Review O
nly
Figure 1
0.0
2.0
4.0
6.0
8.0
10.0
DurableGoods
Nondurablegoods
Bags,sacks and
wraps
Otherpackaging
Othercontainers
Soft drink,milk and
watercontainers
Mill
ion
Met
ric T
ons
Page 30 of 37
http://mc.manuscriptcentral.com/issue-ptrsb
Submitted to Phil. Trans. R. Soc. B - Issue
123456789101112131415161718192021222324252627282930313233343536373839404142434445464748495051525354555657585960
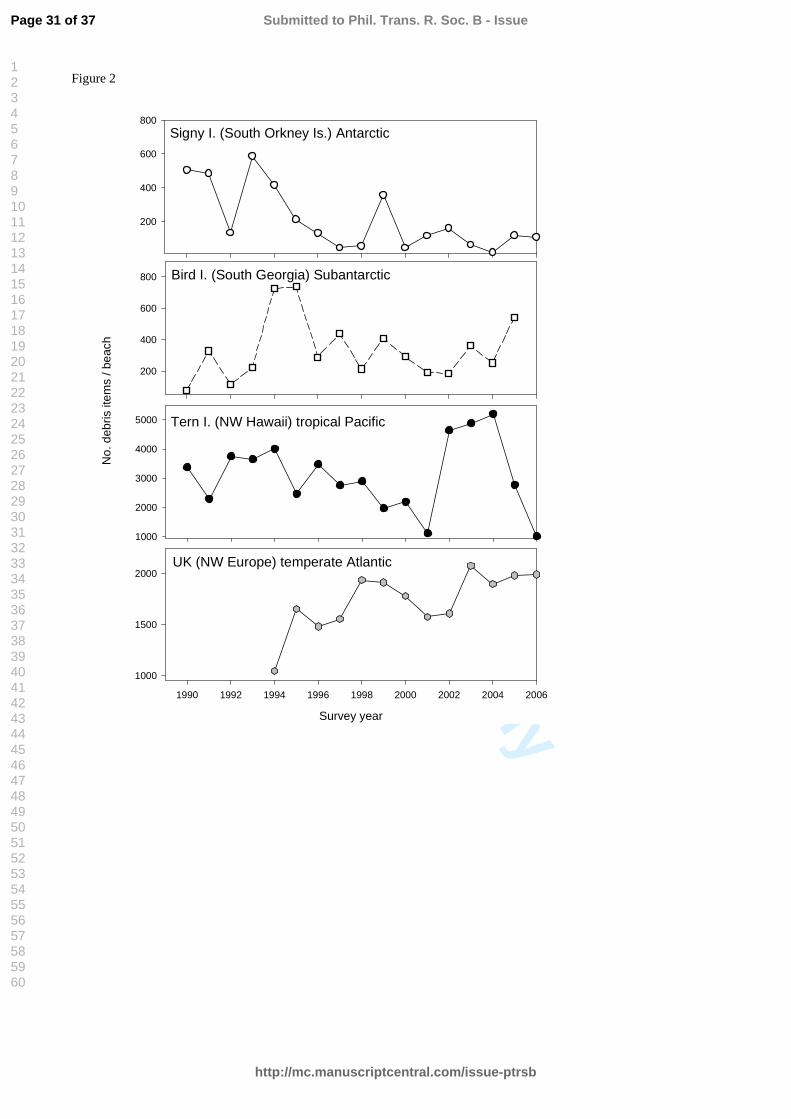
For Review O
nly
Figure 25 November 2007 _ 8/12
200
400
600
800
1000
2000
3000
4000
5000
Signy I. (South Orkney Is.) Antarctic
Tern I. (NW Hawaii) tropical Pacific
Survey year
1990 1992 1994 1996 1998 2000 2002 2004 2006
1000
1500
2000UK (NW Europe) temperate Atlantic
No.
deb
ris it
ems
/ bea
ch
200
400
600
800 Bird I. (South Georgia) Subantarctic
Page 31 of 37
http://mc.manuscriptcentral.com/issue-ptrsb
Submitted to Phil. Trans. R. Soc. B - Issue
123456789101112131415161718192021222324252627282930313233343536373839404142434445464748495051525354555657585960
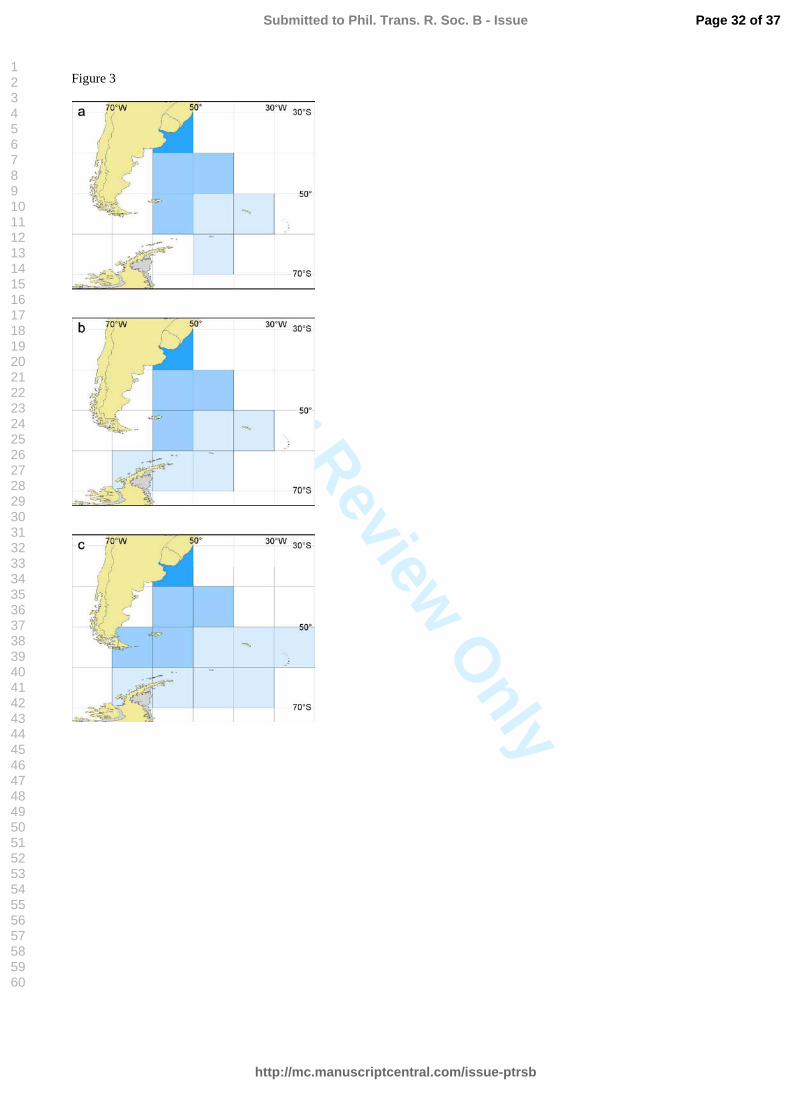
For Review O
nly
Figure 3
Page 32 of 37
http://mc.manuscriptcentral.com/issue-ptrsb
Submitted to Phil. Trans. R. Soc. B - Issue
123456789101112131415161718192021222324252627282930313233343536373839404142434445464748495051525354555657585960
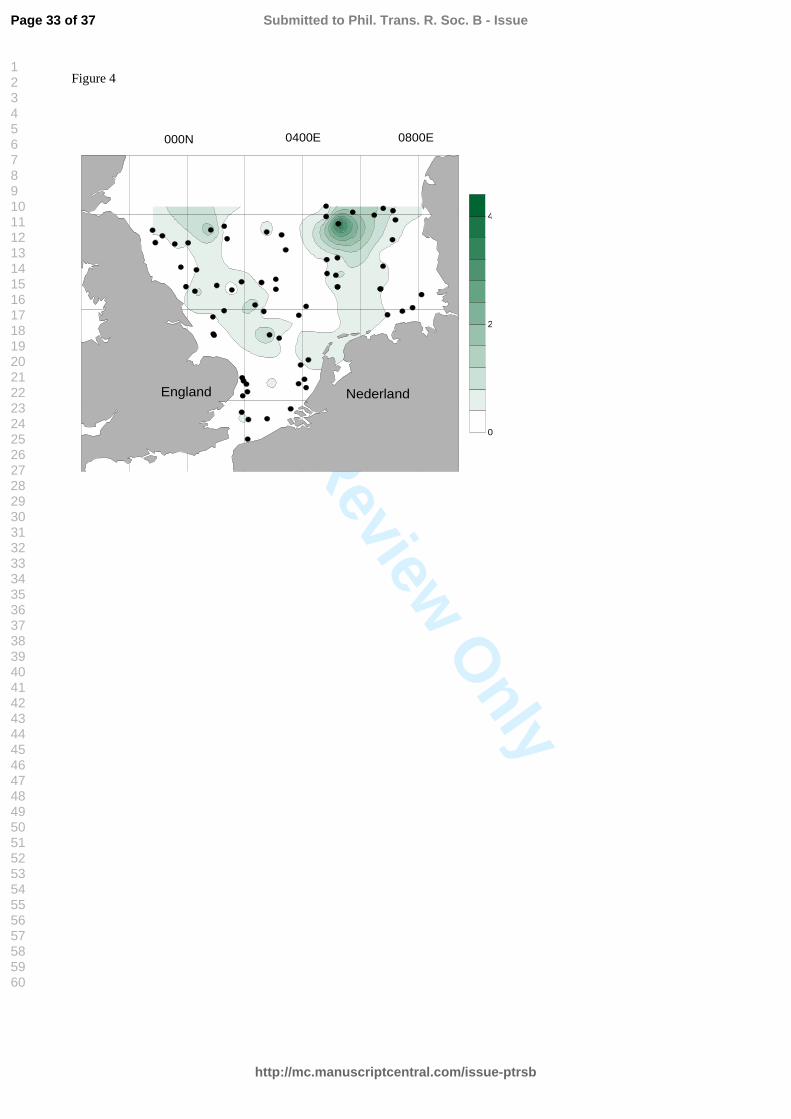
For Review O
nly
Figure 4
IGURF
000N 0400E 0800E
0
20
40
England Nederland
5 November 2007 _ 8/12
Page 33 of 37
http://mc.manuscriptcentral.com/issue-ptrsb
Submitted to Phil. Trans. R. Soc. B - Issue
123456789101112131415161718192021222324252627282930313233343536373839404142434445464748495051525354555657585960
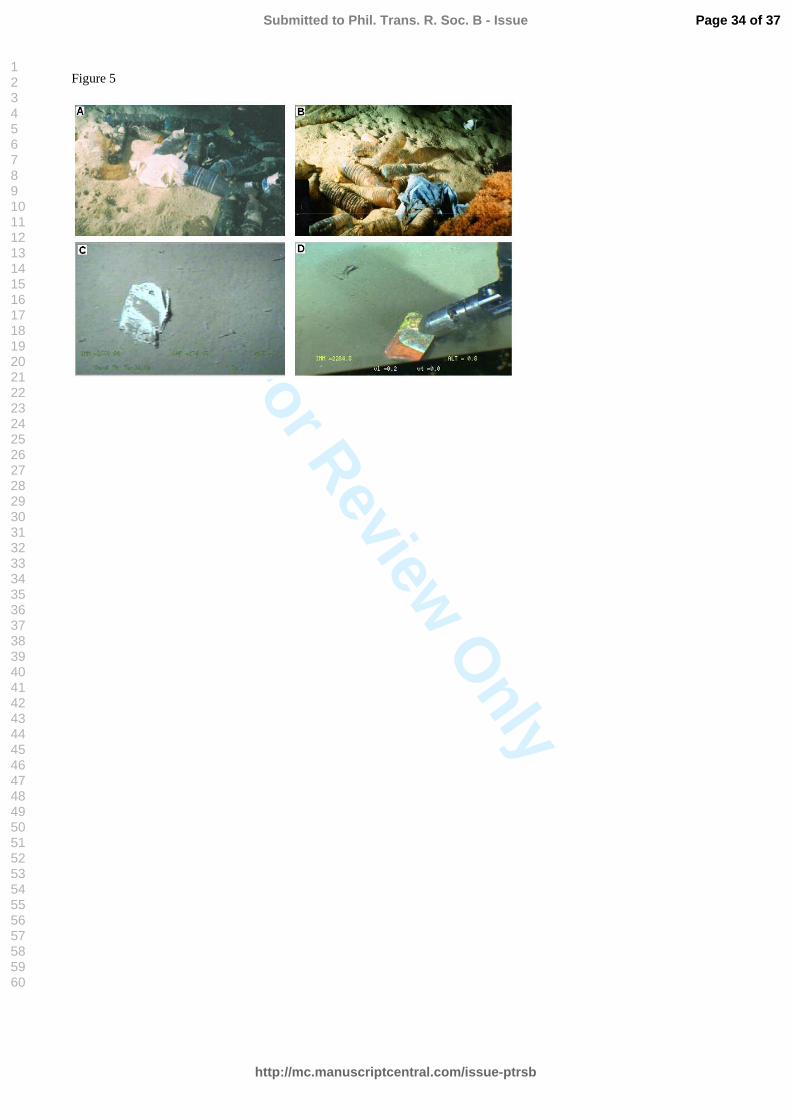
For Review O
nly
Figure 5
Page 34 of 37
http://mc.manuscriptcentral.com/issue-ptrsb
Submitted to Phil. Trans. R. Soc. B - Issue
123456789101112131415161718192021222324252627282930313233343536373839404142434445464748495051525354555657585960
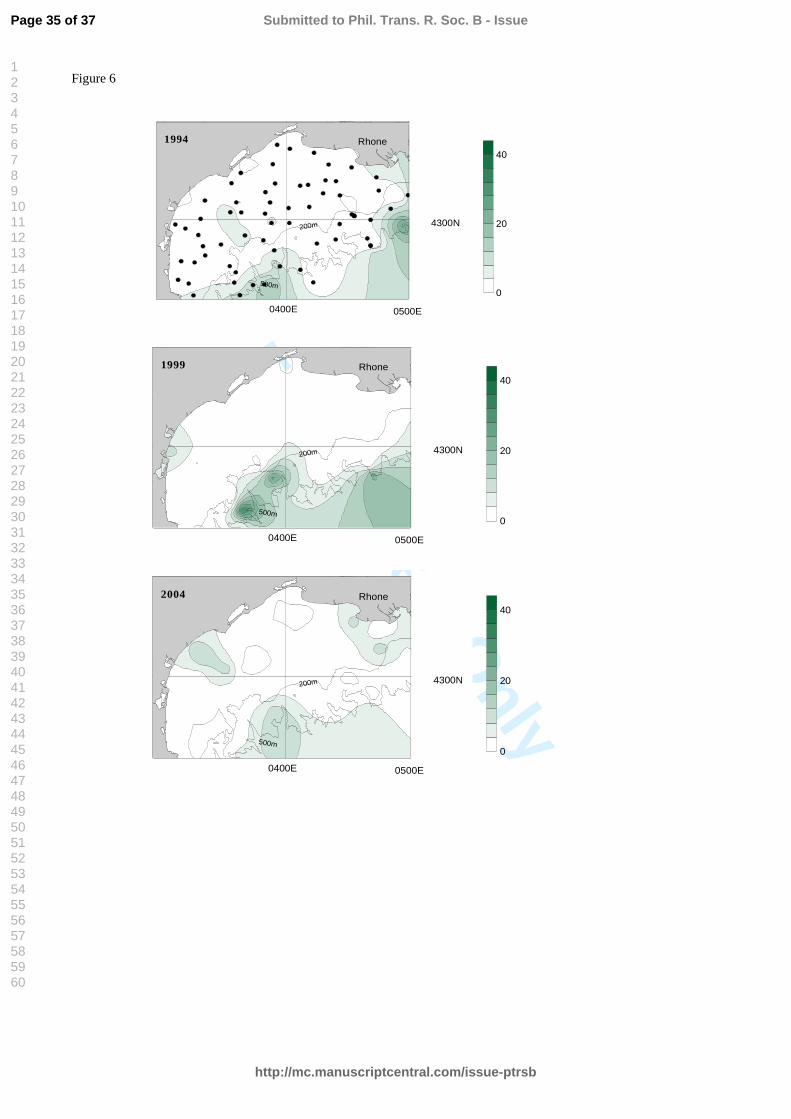
For Review O
nly
Figure 6F
0400E 0500E
4300N
1994
200m
500m0
20
40Rhone
0400E 0500E
4300N
1999
200m
500m0
20
40Rhone
0400E 0500E
4300N
2004
200m
500m0
20
40Rhone
Page 35 of 37
http://mc.manuscriptcentral.com/issue-ptrsb
Submitted to Phil. Trans. R. Soc. B - Issue
123456789101112131415161718192021222324252627282930313233343536373839404142434445464748495051525354555657585960
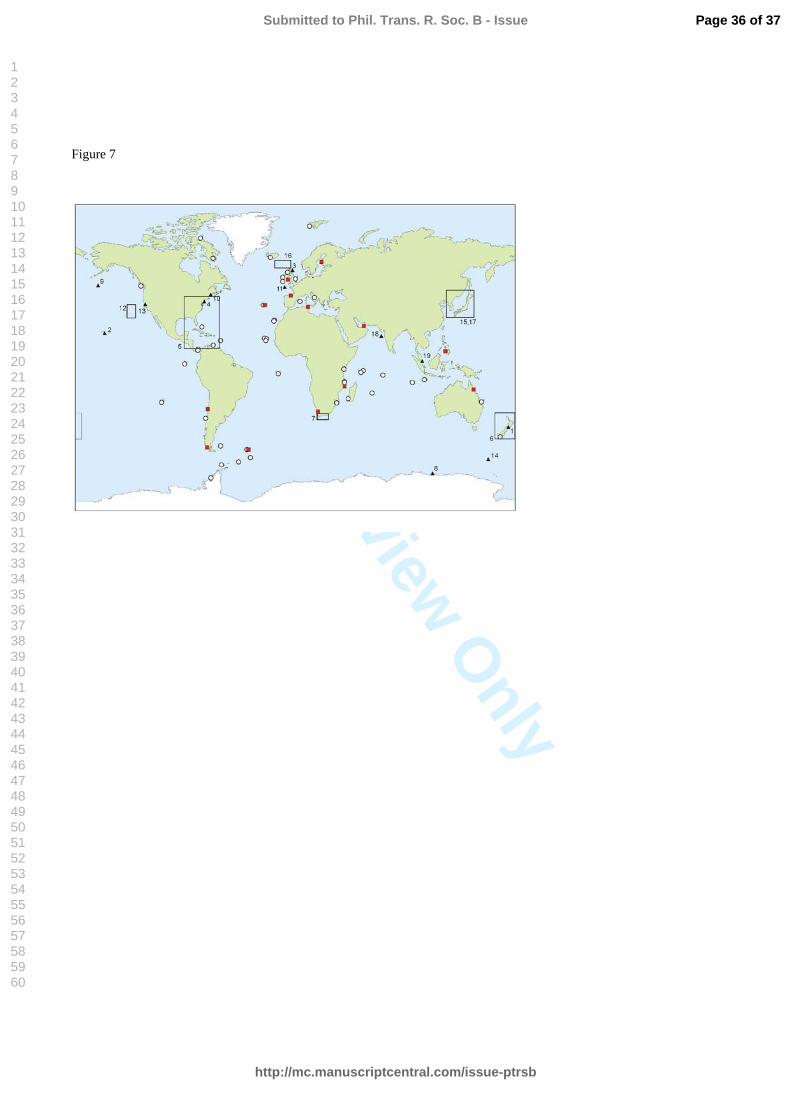
For Review O
nly
FFigure 7
Page 36 of 37
http://mc.manuscriptcentral.com/issue-ptrsb
Submitted to Phil. Trans. R. Soc. B - Issue
123456789101112131415161718192021222324252627282930313233343536373839404142434445464748495051525354555657585960
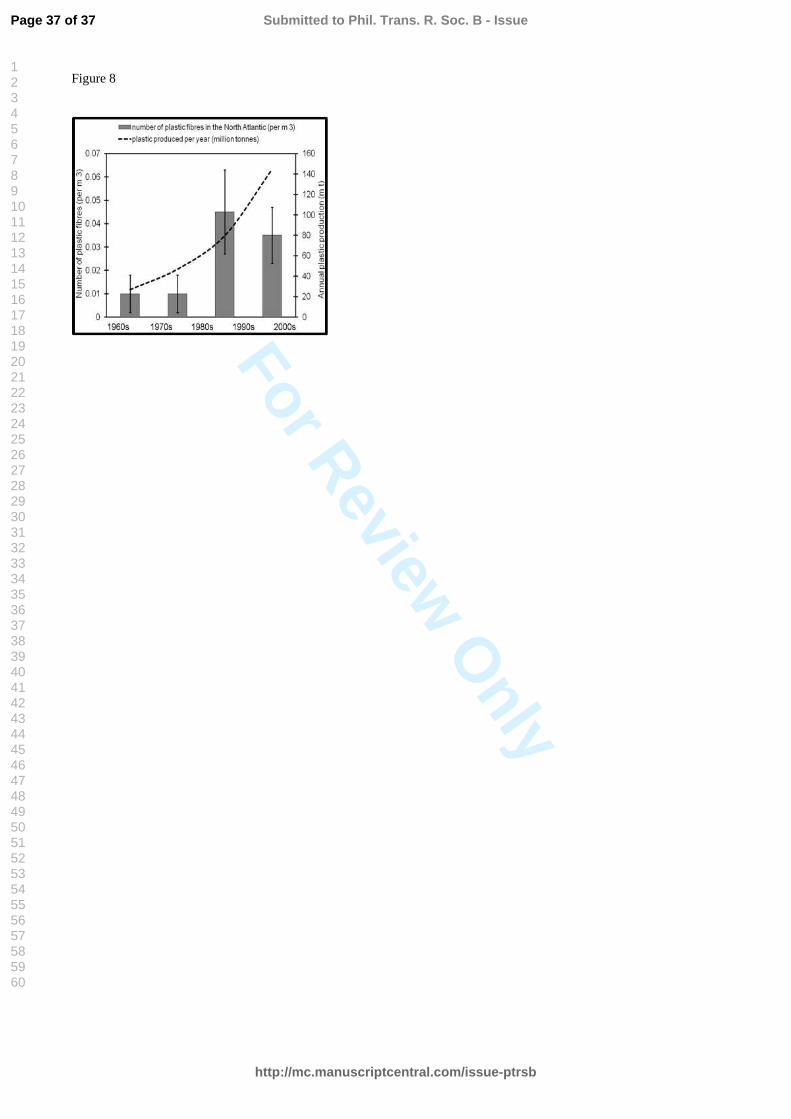
For Review O
nly
Figure 8
Page 37 of 37
http://mc.manuscriptcentral.com/issue-ptrsb
Submitted to Phil. Trans. R. Soc. B - Issue
123456789101112131415161718192021222324252627282930313233343536373839404142434445464748495051525354555657585960